am-demodulation of analog/rf signals using digital tester
TRANSCRIPT

HAL Id: lirmm-00494546https://hal-lirmm.ccsd.cnrs.fr/lirmm-00494546
Submitted on 23 Jun 2010
HAL is a multi-disciplinary open accessarchive for the deposit and dissemination of sci-entific research documents, whether they are pub-lished or not. The documents may come fromteaching and research institutions in France orabroad, or from public or private research centers.
L’archive ouverte pluridisciplinaire HAL, estdestinée au dépôt et à la diffusion de documentsscientifiques de niveau recherche, publiés ou non,émanant des établissements d’enseignement et derecherche français ou étrangers, des laboratoirespublics ou privés.
AM-Demodulation of Analog/RF Signals Using DigitalTester Channels
Nicolas Pous, Florence Azaïs, Laurent Latorre, Jochen Rivoir
To cite this version:Nicolas Pous, Florence Azaïs, Laurent Latorre, Jochen Rivoir. AM-Demodulation of Analog/RFSignals Using Digital Tester Channels. IMS3TW’10: 16th IEEE International Mixed-Signals, Sensorsand Systems Test Workshop, La Grande Motte, Montpellier, France. pp.N/A. �lirmm-00494546�

AM-demodulation of analog/RF signals using digital tester channels
N. Pous LIRMM & Verigy
Montpellier, France
F. Azaïs, L. Latorre LIRMM, CNRS/U. Montpellier 2
161 rue Ada, 34392 Montpellier, France
Jochen Rivoir Verigy Germany GmbH
Herrenberger Str. 130, 71034 Boeblingen, Germany
Abstract — This paper investigates a signal acquisition protocol based on level-crossings that permits the demodulation of AM analog/RF signals using only standard digital ATE. The fundamental concept is to capture the signal through the 1-bit comparator available in digital tester channels and to process the resulting bit stream to retrieve the analog/RF signal characteristics. The proposed solution is evaluated through both simulation and hardware experiments.
Keywords: test, digital ATE, analog/RF circuits, level-crossing, coherent under-sampling, AM demodulation
I. INTRODUCTION
The production test of analog and RF circuits traditionally involves dedicated instruments to perform the acquisition or generation of analog signals. This instrumentation is found in ATE platforms in the form of specific boards that are typically characterized by their sampling frequency and resolution (number of bits). Compared to traditional digital resources, these equipments are extremely expensive.
The requirements regarding instrumentation performance are obvious in the context of a final test, where the quality of the product has definitively to be guaranteed. Wafer-level test is less demanding, in particular if we consider that it must only be good enough to avoid throwing away too many packages. In this context, simpler tests with less capable equipment may be developed.
Our idea is to use standard digital ATE channels to perform some level of RF testing without increasing the cost of the ATE. More precisely, we investigate the opportunity of using the 1-bit digitizer available on low-cost digital channels boards to analyze analog/RF signals. This approach is motivated by the fact that devices operate at ever lower supply voltage while speed is ever increasing. Our idea is to exploit this trend and to convert the analysis of analog/RF signals from the voltage domain to the time domain [1]. In addition, it is worth noting that because digital channels are widely available on most ATE platforms, multi-site testing can be actually considered with almost no additional cost.
More specifically, our work investigates the reconstruction of analog/RF modulated signals to address wafer-level testing of telecommunication devices. Standard modulation schemes
commonly involve phase/frequency or amplitude-shift keying, or a combination of both. In this paper, we focus on amplitude-modulated signals.
The paper is organized as follows. Section II summarizes our previous work on the reconstruction of phase/frequency-modulated signals based on zero-crossings. Using a similar approach, section III introduces the AM-demodulation concepts and examines the effects of acquisition parameters such as the sampling frequency or the crossing-level in the reconstruction properties. Simulation and experimental results are then discussed in sections IV and V respectively. Finally section VI concludes the paper.
II. PREVIOUS WORK
Our strategy to reduce the cost of testing analog/RF functions is to develop test solutions applicable with standard low-cost test equipment in order to provide wafer-level test coverage; the final product will be then tested at package-level using traditional solutions. This approach slightly differs from the main strategies presented in the literature, which consist in either inserting BIST features within the circuit in order to reduce the requirements of the test equipment [2-5], or applying shorter alternative tests instead of classical specification-based tests [6-7]. Our strategy consists in complementing standard low-cost test equipment with signal processing techniques to enable the analysis of analog/RF signals. In particular, the approach is based on the concept of level-crossing detection, which has been widely used in many different application domains such as image and speech processing, wireless communications… but more sparingly in the context of analog/RF testing [8-9].
As illustrated in figure 1, the proposed approach relies on the use of the comparator of a standard digital test channel as a 1-bit digitizer in order to convert the analog/RF signal into a bit stream whose transition time information represents the analog/RF signal characteristics. Signal processing algorithms can then be developed to extract the analog/RF signal characteristics. This approach has been introduced in [10] and a dedicated algorithm based on zero-crossing detection has been developed for the analysis of FM-modulated signals. Furthermore, coherent under-sampling has been exploited in

[11] to extend the capabilities of test equipment with limited sampling frequency for the analysis of high-frequency signals. In this section, we briefly recall the procedure for FM-demodulation of high-frequency signals.
Figure 1. Primary idea
The procedure is based on the precise determination of the signal zero-crossing times. To illustrate the approach, let us consider an analog sine-wave sampled by a 1-bit comparator with a zero reference level. The resulting signal at the comparator output is a digital signal that switches from logical “0” to logical “1” and Time Stamps (TS) can be associated to the rising/falling transitions. Then for each pair of rising/falling transitions, the signal frequency can be computed as f=1/2∆TS, where ∆TS corresponds to the time delay between a pair of successive rising and falling transitions.
Figure 2. Time Stamp determination from running average
In the ideal case, zero-crossings of the analog sine-wave result in unique transitions at the output of the comparator. However in practice, the analog signal is not a perfect but a noisy signal. As a consequence, multiple transitions at the vicinity of zero-crossings may be present in the digital signal delivered by the comparator (see figure 2). To filter these multiple transitions and associate a single Time Stamp to each zero-crossing, we have proposed a simple and robust algorithm based on a running average, i.e. counting the ratio between the numbers of “0” and “1” on a given number of samples. A Time Stamp TS is then associated to a transition when the ratio reaches 50%.
The FM-demodulation principle is directly based on the zero-crossing TS determination. More precisely, the principle consists in estimating the deviation of the signal frequency from the carrier frequency, for each period of the FM-modulated signal. Practically, the FM-modulated signal is sampled by the ATE comparator with zero reference level. To handle high-frequency signals, coherent under-sampling can be implemented. In this case, the signal is repeated an integer number of times (M), while an integer number of samples (N) is captured at a sampling rate fsample. To ensure coherency, the sampling frequency fsample, the message frequency fm, the number of samples N and the number of repetitions of the message signal M must fulfill the following relationship:
msample f
M
f
N = (1)
where N and M are whole positive integer values. Moreover, N and M must be chosen as co-prime integers to guarantee that samples will differ from one message signal period to another.
The first step of the post-processing algorithm is then to
perform sample reordering on the digital bit stream stored in the ATE memory, also called the zero-crossing vector. The second step corresponds to running average computation and associated TS determination. Finally for each pair of successive rising and falling transitions (TSR,i /TSF,i), i.e. for each period of the carrier signal, the deviation of the signal frequency from the carrier frequency fc is estimated by:
2timeat
)(2
1)(
,,
,,
iFiRi
ciFiR
i
TSTSt
fTSTS
tf
+=
−−
=∆ (2)
This reconstructed signal is a discrete signal that corresponds to the modulating signal and that can be further analyzed using FFT for instance.
III. AM-DEMODULATION
In this section, we introduce the principle of AM-demodulation based on level-crossing. The concept is similar to FM-demodulation but this time, the idea is to convert the amplitude information contained in an analog/RF signal into timing information contained in the digital bit stream. The comparator should therefore be set with a reference level different than zero.
A. Basics of amplitude estimation
First to illustrate the approach, we consider an ideal analog sine-wave expressed by:
)2sin()( ϕπ +∗∗∗= tfAts (3)
Signal
Processing
Algorithm
Signal
Processing
Algorithm
«0011»
comparator level
analog/RF signalATE
Memory
ATE
Memory
Pass/Fail
Regular Digital Pin Electronics
DUT/ATE Synchronisation
ATE ClockATE Clock
Signal
Processing
Algorithm
Signal
Processing
Algorithm
«0011»
comparator level
analog/RF signalATE
Memory
ATE
Memory
Pass/Fail
Regular Digital Pin Electronics
DUT/ATE Synchronisation
ATE ClockATE Clock
-1,5
-1
-0,5
0
0,5
1
1,5
0 0,1 0,2 0,3 0,4 0,5 0,6 0,7 0,8
Am
pli
tud
e
Time (µs)
Noisy Signal
Comparator
Output
Running Avg
TSR,i TSF,i
∆∆∆∆TSi
50%
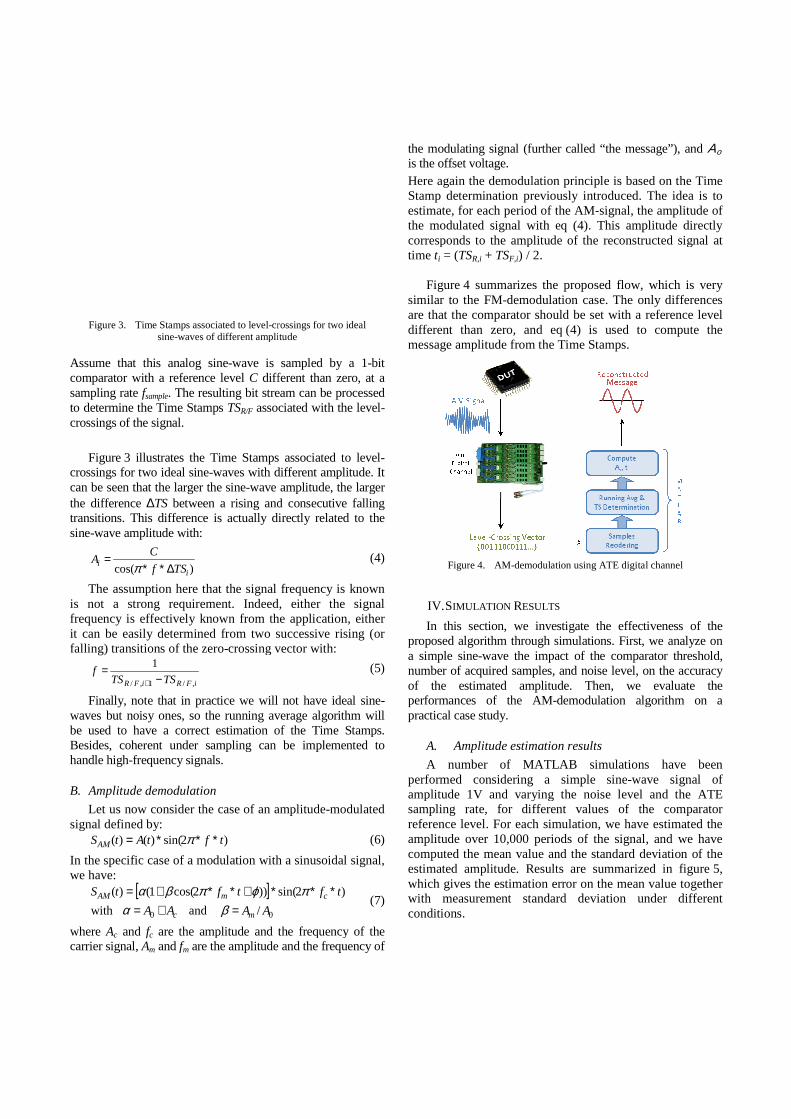
Figure 3. Time Stamps associated to level-crossingssine-waves of different amplitude
Assume that this analog sine-wave is sampled by a 1comparator with a reference level C different than zerosampling rate fsample. The resulting bit stream can be processed to determine the Time Stamps TSR/F associated with the levelcrossings of the signal.
Figure 3 illustrates the Time Stamps associated to level
crossings for two ideal sine-waves with different amplitude. It can be seen that the larger the sine-wave amplitude, the larger the difference ∆TS between a rising andtransitions. This difference is actually directly related to the sine-wave amplitude with:
)cos( ii TSf
CA
∆∗∗=
π
The assumption here that the signal frequency is known is not a strong requirement. Indeed, either the frequency is effectively known from the application, either it can be easily determined from two successive rising (or falling) transitions of the zero-crossing vector with:
1
,/1,/ iFRiFR TSTSf
−=
+
Finally, note that in practice we will not have ideal sinewaves but noisy ones, so the running average algorithm will be used to have a correct estimation of the Time Stamps. Besides, coherent under sampling can be implemented to handle high-frequency signals.
B. Amplitude demodulation
Let us now consider the case of an amplitudesignal defined by:
)2sin()()( tftAtSAM ∗∗∗= π
In the specific case of a modulation with we have:
[ ]00 /andwith
sin())2cos(1()(
AAAA
tftS
mc
mAM
=+=∗+∗∗+=
βαϕπβα
where Ac and fc are the amplitude and the frequency of the carrier signal, Am and fm are the amplitude and
crossings for two ideal waves of different amplitude
wave is sampled by a 1-bit different than zero, at a
. The resulting bit stream can be processed associated with the level-
illustrates the Time Stamps associated to level-with different amplitude. It wave amplitude, the larger
between a rising and consecutive falling transitions. This difference is actually directly related to the
(4)
that the signal frequency is known is not a strong requirement. Indeed, either the signal frequency is effectively known from the application, either
from two successive rising (or crossing vector with:
(5)
Finally, note that in practice we will not have ideal sine-waves but noisy ones, so the running average algorithm will be used to have a correct estimation of the Time Stamps. Besides, coherent under sampling can be implemented to
Let us now consider the case of an amplitude-modulated
(6)
modulation with a sinusoidal signal,
)2sin( tfc ∗∗π (7)
are the amplitude and the frequency of the are the amplitude and the frequency of
the modulating signal (further called “the message”), and is the offset voltage. Here again the demodulation principle is based on the Time Stamp determination previously introduced. The idea is to estimate, for each period of the AMthe modulated signal with ecorresponds to the amplitude of the reconstructed signal at time ti = (TSR,i + TSF,i) / 2.
Figure 4 summarizes the proposed flow, which is very similar to the FM-demodulation case. The only differences are that the comparator should be set with a reference level different than zero, and eqmessage amplitude from the Time Stamps.
Figure 4. AM-demodulation
IV. SIMULATION RESULTS
In this section, we investigate the effectiveness of the proposed algorithm through simulations. First, we analyze on a simple sine-wave the impact of the comparator threshold, number of acquired samples, and noise level, on the accuracy of the estimated amplitude. Then, we evaluate the performances of the AM-demodulation algorithm on a practical case study.
A. Amplitude estimation results
A number of MATLAB simulations have been performed considering a simple sineamplitude 1V and varying the sampling rate, for different values of the comparator reference level. For each simulation, we have estimated the amplitude over 10,000 periods of the signal, and we have computed the mean value and the standard deviation of the estimated amplitude. Results are summarized in figurewhich gives the estimation error on the mean value together with measurement standard deviation under different conditions.
the modulating signal (further called “the message”), and Αο
Here again the demodulation principle is based on the Time Stamp determination previously introduced. The idea is to estimate, for each period of the AM-signal, the amplitude of
eq (4). This amplitude directly corresponds to the amplitude of the reconstructed signal at
summarizes the proposed flow, which is very demodulation case. The only differences
uld be set with a reference level different than zero, and eq (4) is used to compute the message amplitude from the Time Stamps.
demodulation using ATE digital channel
ESULTS
In this section, we investigate the effectiveness of the proposed algorithm through simulations. First, we analyze on
wave the impact of the comparator threshold, number of acquired samples, and noise level, on the accuracy
mplitude. Then, we evaluate the demodulation algorithm on a
Amplitude estimation results
A number of MATLAB simulations have been performed considering a simple sine-wave signal of amplitude 1V and varying the noise level and the ATE sampling rate, for different values of the comparator reference level. For each simulation, we have estimated the amplitude over 10,000 periods of the signal, and we have computed the mean value and the standard deviation of the
imated amplitude. Results are summarized in figure 5, which gives the estimation error on the mean value together with measurement standard deviation under different
a) Influence of the comparator reference level for different numbers of samples per signal period with a noise level of 5%
b) Influence of the noise level for different values of the comparator reference level with 380 samples per signal
Figure 5. Amplitude estimation error: mean value and standard deviation
Figure 5.a analyzes the influence of the comparator reference level for different numbers of samples per period in case of a sine-wave with 5% noise. A first comment is that better results are obtained when the comparator reference level is higher than 50% of the signal amplitude. Indeed for all values of the comparator reference level above 0.5V, the estimation error on the mean amplitude value remains below ±1%; the estimation error increases with aoverestimation of the signal amplitude for lower values of the comparator reference level.
These results show that the amplitude can be with a good accuracy whatever the comparator reference level, provided that enough samples are collected. Indeed, the estimation error on the amplitude mean value can5% when using only 60 samples per period with a comparator reference level at 0.2V whereas this error remains below ±1% when 220 samples or more are collected whatever the comparator reference level. So a first recommendation to achieve good accuracy in amplitude estimation is to collect at least 200 samples per signal period. Nevertheless, measurements show a relative dispersion, with a standard deviation that goes from 10% down to 1% when the comparator reference level increases from 20% to 80% of the signal amplitude range, for 220 or more samples per period. So a second recommendation is to set the comparator reference level as high as high as possible with respect to the signal amplitude.
To further validate these results, we have performed experiments varying the level of noise injected in the signal from 1% up to 10%. As illustrated by figure samples collected per period, the noise level has an impact on the accuracy of prediction but even in presence of 10% noise in the signal, the estimation error on the mean
a) Influence of the comparator reference level for different numbers of samples
period with a noise level of 5%
b) Influence of the noise level for different values of the comparator
signal period
de estimation error: mean value and standard deviation
.a analyzes the influence of the comparator reference level for different numbers of samples per period in
with 5% noise. A first comment is that ed when the comparator reference level
is higher than 50% of the signal amplitude. Indeed for all values of the comparator reference level above 0.5V, the estimation error on the mean amplitude value remains below ±1%; the estimation error increases with a systematic overestimation of the signal amplitude for lower values of the
hese results show that the amplitude can be estimated with a good accuracy whatever the comparator reference level, provided that enough samples are collected. Indeed, the estimation error on the amplitude mean value can be as high as 5% when using only 60 samples per period with a comparator
nce level at 0.2V whereas this error remains below ±1% when 220 samples or more are collected whatever the comparator reference level. So a first recommendation to achieve good accuracy in amplitude estimation is to collect at
period. Nevertheless, measurements show a relative dispersion, with a standard deviation that goes from 10% down to 1% when the comparator reference level increases from 20% to 80% of the signal amplitude range, for 220 or more samples per period.
ond recommendation is to set the comparator reference level as high as high as possible with respect to the
To further validate these results, we have performed experiments varying the level of noise injected in the signal
10%. As illustrated by figure 5.b for 380 samples collected per period, the noise level has an impact on the accuracy of prediction but even in presence of 10% noise in the signal, the estimation error on the mean
amplitude value remains in the range of ±1comparator reference level. However dispersion on the measurements can be relatively important depending on the comparator reference level.
B. AM-demodulation results
To validate the AM-consider an AM-signal with a carrier frequency and a modulating frequency study. The ratio between the maximum amplitude and minimum amplitude of the AMA0=2V and Ac=Am=1V. Moreover, to be able to perform an FFT with an acceptable resolution on the reconstructed message, the signal to be analyzed is made of 32 message periods.
The AM-demodulation algorithm has been simulated for different values of the comparator reference level from 20% up to 80% of the minimum AMcorresponds to about 6% up to signal amplitude. A clock-jitter,random time-shift of the sampling event with been included in all simulations in order to consider realistic practical conditions.
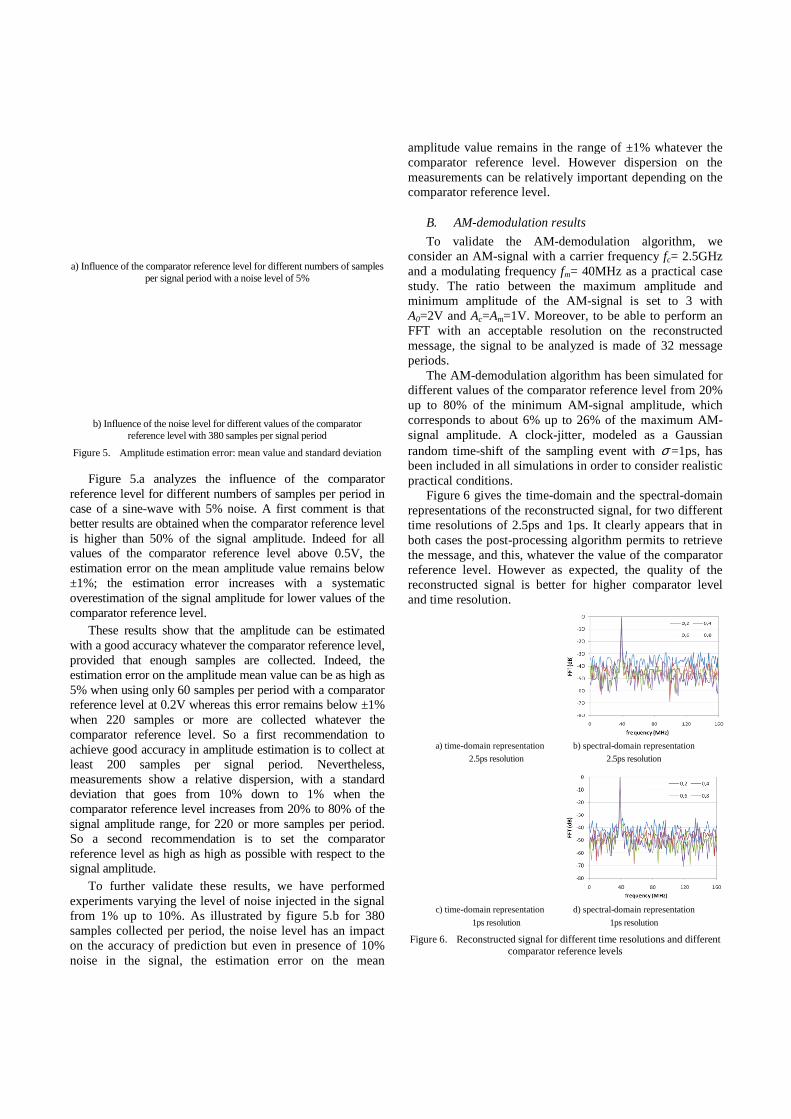
Figure 6 gives the time-domain andrepresentations of the reconstructed signal, for two different time resolutions of 2.5ps and 1psboth cases the post-processing algorithm permits the message, and this, whatever the value of the comparator reference level. However as expected, the quality of the reconstructed signal is better for higher comparator level and time resolution.
a) time-domain representation
2.5ps resolution
c) time-domain representation
1ps resolution
Figure 6. Reconstructed signal for different time resolutions comparator reference levels
amplitude value remains in the range of ±1% whatever the comparator reference level. However dispersion on the measurements can be relatively important depending on the
demodulation results
-demodulation algorithm, we signal with a carrier frequency fc= 2.5GHz
quency fm= 40MHz as a practical case study. The ratio between the maximum amplitude and minimum amplitude of the AM-signal is set to 3 with
=1V. Moreover, to be able to perform an FFT with an acceptable resolution on the reconstructed
e, the signal to be analyzed is made of 32 message
demodulation algorithm has been simulated for different values of the comparator reference level from 20% up to 80% of the minimum AM-signal amplitude, which
about 6% up to 26% of the maximum AM--jitter, modeled as a Gaussian
shift of the sampling event with σ =1ps, has been included in all simulations in order to consider realistic
domain and the spectral-domain the reconstructed signal, for two different
time resolutions of 2.5ps and 1ps. It clearly appears that in processing algorithm permits to retrieve
the message, and this, whatever the value of the comparator reference level. However as expected, the quality of the
is better for higher comparator level
b) spectral-domain representation
2.5ps resolution
d) spectral-domain representation
1ps resolution
Reconstructed signal for different time resolutions and different comparator reference levels

These first results demonstrate the capability of the technique to perform AM-demodulation. In order to further validate the technique, we have performed similar simulations including noise in the signal. Results asummarized in Table I, which reports the SNR values measured over 160MHz bandwidth on the reconstructed signal with 2.5ps and 1ps resolution, for different levels of noise injected in the AM-signal.
TABLE I. SNR VALUES MEASURED ON THE RECONSTRUCTED SIGFOR DIFFERENT TIME RESOLUTIONS AND DIFFERENT
INJECTED IN THE AM-SIGNAL
Comparator reference level
0.2 0.4
2.5ps time
resolution
without noise 15dB 22dB
SNRIN=34dB 15dB 21dB
SNRIN=26dB 12dB 20dB
SNRIN=20dB 9dB 17dB
1ps time
resolution
without noise 20dB 26dB
SNRIN=34dB 19dB 26dB
SNRIN=26dB 17dB 24dB
SNRIN=20dB 14dB 22dB
Results are in agreement with the preliminary study performed in the previous section. We observe a smooth degradation of the quality of the reconstructed signal when the level of noise increases, with an SNR value that reduces by about 5dB when the noise level increases from 0 to 10%. In addition, we clearly observe the imquality of the reconstructed signal when increasing the number of acquired samples and for higher values of the comparator reference level. Note that even a comparator reference level at 80% of the minimum Aamplitude is not the most favorable case for accurate amplitude estimation, as it only corresponds to 26% of the maximum AM-signal amplitude. To further improve the accuracy, a potential solution may consist in combining multiple level-crossings.
V. HARDWARE EXPERIMENTS
Hardware measurements have been performed to support these results. Hardware measurements have been carried out using the test setup depicted in figure analyzed is generated by an RF source (Agilent N9310A) directly connected to a PS3600 digital channel 93K ATE. The 10MHz output signal of the RF source is used to synchronize the tester. Indeed, the sample reordering process associated with the under-sampling method requires a very precise synchronization between the analog signal to be captured and the ATE sampling clock.
These first results demonstrate the capability of the demodulation. In order to further
validate the technique, we have performed similar simulations including noise in the signal. Results are summarized in Table I, which reports the SNR values
on the reconstructed signal with 2.5ps and 1ps resolution, for different levels of
HE RECONSTRUCTED SIGNAL TIONS AND DIFFERENT LEVELS OF NOISE
SIGNAL
Comparator reference level
0.4 0.6 0.8
25dB 24dB
25dB 23dB
23dB 20dB
21dB 18dB
29dB 31dB
29dB 30dB
26dB 30dB
25dB 28dB
Results are in agreement with the preliminary study previous section. We observe a smooth
degradation of the quality of the reconstructed signal when the level of noise increases, with an SNR value that reduces by about 5dB when the noise level increases from 0 to 10%. In addition, we clearly observe the improvement in the quality of the reconstructed signal when increasing the number of acquired samples and for higher values of the
. Note that even a comparator reference level at 80% of the minimum AM-signal amplitude is not the most favorable case for accurate amplitude estimation, as it only corresponds to 26% of the
signal amplitude. To further improve the accuracy, a potential solution may consist in combining
measurements have been performed to support these results. Hardware measurements have been carried out
7. The signal to be analyzed is generated by an RF source (Agilent N9310A)
ly connected to a PS3600 digital channel of the Verigy 93K ATE. The 10MHz output signal of the RF source is used to synchronize the tester. Indeed, the sample reordering
sampling method requires a ion between the analog signal to be
Figure 7. AM-demodulation
We have considered the case study used in simulation to experimentally validate the AMHowever due to the limited capabilities of our RF source, hardware measurements are performed with a downscaling of 1,000 with respect to simulation, i.e. tto output an AM-modulatedfrequency, 40kHz modulation frequencydepth of 50%. To maintain the same number of samples as in the simulation experiments, the downscaling of 1,000 is also applied on the ATE sampling frequency, which results in a time resolution of 2.5ns and 1ns for 320,000 and 800,000 captured samples respectively. resolution can be achieved with a direct acquisition of the samples without reordering, but that coherent undersampling and reordering is mandatory to achieve the 1nresolution (ATE sampling frequency
a) time-domain representation
0.3V reference level
c) time-domain representation
0.8V reference level
Figure 8. Reconstructed signal for 2.5ns resolution and different values of the comparator reference level
demodulation setup using digital ATE
e have considered the case study used in simulation to the AM-demodulation algorithm.
However due to the limited capabilities of our RF source, hardware measurements are performed with a downscaling of 1,000 with respect to simulation, i.e. the RF source is set
modulated signal with 2.5MHz carrier 40kHz modulation frequency and a modulation
maintain the same number of samples as in the simulation experiments, the downscaling of 1,000 is also applied on the ATE sampling frequency, which results
2.5ns and 1ns for 320,000 and 800,000 captured samples respectively. Note that the 2.5ns resolution can be achieved with a direct acquisition of the samples without reordering, but that coherent under-sampling and reordering is mandatory to achieve the 1ns
ATE sampling frequency limited to 400MHz).
b) spectral-domain represenation
0.3V reference level
d) spectral-domain represenation
0.8V reference level
Reconstructed signal for 2.5ns resolution and different values the comparator reference level

Figure 8 gives the time-domain and the spectralrepresentations of the reconstructed signal for the 2.5ns resolution and two different values of comparator reference level set at 30% and 80% of the minimum AMamplitude. Analyzing these results, it can be clearly observed that a better reconstruction of the message is achieved when increasing the comparaThe quantization in the time-domain reconstructed signal is visibly reduced, the overestimation is lessened; and the SNR improves from 15dB up to 25dB. Thesegood agreement with simulation results.
Figure 9. Reconstructed signal for 1ns resolution and 0.8V comparator reference level
Figure 9 gives the time-domain and the spectralrepresentations of the reconstructed signal when using a 1ns resolution and a comparator reference level at 80% of the minimum amplitude. A good accuracy on the message reconstruction is achieved with a clean timerepresentation, an estimated signal well1V and 3V minimum and maximum amplitudes,SNR that improves up to 34dB. Here again, these results are in accordance with simulation results.
More generally, these hardware experiments validate the proposed technique since they actually show that the message of an AM- signal can be reconstructed from the sampling of the signal through a digital tester channel. reconstruction depends on both the time resolution and the comparator reference level. Considering the practical case study investigated in this paper, an SNR obtained when using only 160 samples per carrier period and around 21dB when using 400 samples per carrier period, for a comparator reference level at 30% of the AMamplitude. When the comparator reference level is set to 80% of the AM-signal minimum amplitude, the SNR improves up to 25dB when using 160 samples per carrier when using 400 samples per carrier period.
VI. CONCLUSION
This paper investigates a signal acquisition protocol based on level-crossing and dedicated post-processing reconstruction algorithm in order to develop low-cost
domain and the spectral-domain representations of the reconstructed signal for the 2.5ns resolution and two different values of comparator reference level set at 30% and 80% of the minimum AM-signal
these results, it can be clearly observed that a better reconstruction of the message is achieved when increasing the comparator reference level.
domain reconstructed signal is visibly reduced, the overestimation is lessened; and the SNR
from 15dB up to 25dB. These values are in rather
signal for 1ns resolution and 0.8V comparator reference level
domain and the spectral-domain representations of the reconstructed signal when using a 1ns resolution and a comparator reference level at 80% of the
A good accuracy on the message reconstruction is achieved with a clean time-domain
, an estimated signal well-centered between 1V and 3V minimum and maximum amplitudes, and an SNR that improves up to 34dB. Here again, these results are
experiments validate the proposed technique since they actually show that the message
signal can be reconstructed from the sampling of the signal through a digital tester channel. The accuracy of the reconstruction depends on both the time resolution and the comparator reference level. Considering the practical case study investigated in this paper, an SNR around 15dB is obtained when using only 160 samples per carrier period and
when using 400 samples per carrier period, for a comparator reference level at 30% of the AM-signal minimum amplitude. When the comparator reference level is set to 80%
signal minimum amplitude, the SNR improves up 0 samples per carrier period and 34dB
when using 400 samples per carrier period.
This paper investigates a signal acquisition protocol based processing reconstruction
cost test strategies for
analog/RF devices. The idea is to use the comparator available in ATE digital channels to perform the signal capture and conversion in the digital domain; the resulting bit stream is then processed to retrieve the analog/RF signal charaIn this paper, we have focused on the analysis of amplitudemodulated signal. First, we have investigated the impact of acquisition parameters on the reconstruction quality, leading to basic rules for the determination of the sampling frequencyand the comparator threshold. Then, we have investigated through simulation the performance of the AMalgorithm on a case study. Finally, hardware experiments have been presented demonstrating the viability of the proposed technique.
ACKNOWLEDGMENTS
The authors would like to acknowledge Dr. Beatrice Pradarelli for technical support during hardware validation. Hardware experiments have been performed using the equipment of the CNFM Test Resource Center in Montpellier sponsored by Verigy® and Région Languedoc Roussillon.
REFERENCES [1] Rivoir, J; (Verigy), “Analog to digital signal conversion method and
apparatus”, Patent No. US 6,462,693 B1, Oct. 2002
[2] Khaled, S.; Kaminska, B.; Courtois, B.; Lubaszewski, M.;, “Frequency-based BIST for analog circuitTest Symposium, pp. 54-59, 1995.
[3] Hao-Chiao Hong; Jiun-Lang Huang; KwangWen Wu;, “On-chip analog response extraction with 1modulators”, Proc. IEEE Asian Test Symposium, pp. 49
[4] Negreiros, M.; Carro, L.; Susin, A.A., “Low cost analogue testing of RF signal paths”, Proc. Design, Automation and Test in Europe Conference and Exhibition, pp. 292
[5] Staszewski, R.B.; Bashir, I.; Eliezer, O.;, “RF BuiltWireless Transmitter”, IEEE Transactions on Circuits and Systems II: Express Briefs, Volume 54, Issue 2, pp. 186
[6] Variyam, P.N.; Chatterjee, A.;, “Enhancing test effectiveness for analog circuits using synthesized measurements”, Proc. IEEE VLSI Test Symposium, pp. 132-137, 1998.
[7] Haider, A.; Chatterjee, A.;, “Lowreceiver systems”, Proc. IEEE VLSI Test Sym2005.
[8] Brosa, A.M.; Figueras, J.;, “Digitmixed-signal circuits”, Proc. IEEE Inpp. 1041-1050, 2000.
[9] Su, C.C.; Chang, C.S.; Huang, H.W.; Tu, D.S.; Lee, C.L.; Lin, J.C.H.;, “Dynamic analog testing via ATE digital test channelsProc. IEEE Asian Test Symposium, pp. 308
[10] Pous, N.; Azaïs, F.; Latorre, L.; Nouet, P.; Rivoir, J., “ Exploiting zero-crossing for the analysis of FM modulated analog/RF signals using digital ATE”, Proc. IEEE Asian Test Symposium, 2009.
[11] Pous, N.; Azaïs, F.; Latorre, L.; Nouet, P.; Rivoir, on the analysis of phse/frequencytester channels”, Proc. IEEE
analog/RF devices. The idea is to use the comparator available in ATE digital channels to perform the signal capture and conversion in the digital domain; the resulting bit stream is then processed to retrieve the analog/RF signal characteristics. In this paper, we have focused on the analysis of amplitude-modulated signal. First, we have investigated the impact of acquisition parameters on the reconstruction quality, leading to basic rules for the determination of the sampling frequency and the comparator threshold. Then, we have investigated through simulation the performance of the AM-demodulation algorithm on a case study. Finally, hardware experiments have been presented demonstrating the viability of the proposed
The authors would like to acknowledge Dr. Beatrice Pradarelli for technical support during hardware validation. Hardware experiments have been performed using the equipment of the CNFM Test Resource Center in Montpellier
égion Languedoc Roussillon.
Rivoir, J; (Verigy), “Analog to digital signal conversion method and apparatus”, Patent No. US 6,462,693 B1, Oct. 2002
Khaled, S.; Kaminska, B.; Courtois, B.; Lubaszewski, M.;, based BIST for analog circuit testing”, Proc. IEEE VLSI
59, 1995. Lang Huang; Kwang-Ting Cheng; Cheng-
chip analog response extraction with 1-bit Σ-∆ modulators”, Proc. IEEE Asian Test Symposium, pp. 49-54, 2002.
arro, L.; Susin, A.A., “Low cost analogue testing of RF signal paths”, Proc. Design, Automation and Test in Europe Conference and Exhibition, pp. 292-297, 2004.
Staszewski, R.B.; Bashir, I.; Eliezer, O.;, “RF Built-in Self Test of a IEEE Transactions on Circuits and Systems II:
Express Briefs, Volume 54, Issue 2, pp. 186-190, Feb. 2007. Variyam, P.N.; Chatterjee, A.;, “Enhancing test effectiveness for analog circuits using synthesized measurements”, Proc. IEEE VLSI
137, 1998. Haider, A.; Chatterjee, A.;, “Low-cost alternate EVM test for wireless receiver systems”, Proc. IEEE VLSI Test Symposium, pp. 255-260,
Brosa, A.M.; Figueras, J.;, “Digital signature proposal for ignal circuits”, Proc. IEEE International Test Conference,
Su, C.C.; Chang, C.S.; Huang, H.W.; Tu, D.S.; Lee, C.L.; Lin, J.C.H.;, “Dynamic analog testing via ATE digital test channels”,
IEEE Asian Test Symposium, pp. 308-312, 2004. re, L.; Nouet, P.; Rivoir, J., “ Exploiting
crossing for the analysis of FM modulated analog/RF signals using digital ATE”, Proc. IEEE Asian Test Symposium, pp.308-321,
Pous, N.; Azaïs, F.; Latorre, L.; Nouet, P.; Rivoir, J., “ Experiments on the analysis of phse/frequency-modulated RF signals using digital
”, Proc. IEEE Latin-American Test Workshop, 2010.