a.m. best’s updated credit rating methodology and capital ......a.m. best’s updated credit...
TRANSCRIPT

2016 NAIC/NIPR Insurance Summit
A.M. Best’s Updated Credit Rating Methodology and Capital
Model
May 16, 2016NAIC: Insurance Summit
Anthony Diodato, Group Vice President,
A.M. Best Company
1
Rating Methodology 2017
• Impetus for Change• Timeline• Building Block Approach• Rating Implications• Questions
May 16, 2016NAIC: Insurance Summit 2
2016 NAIC/NIPR Insurance Summit
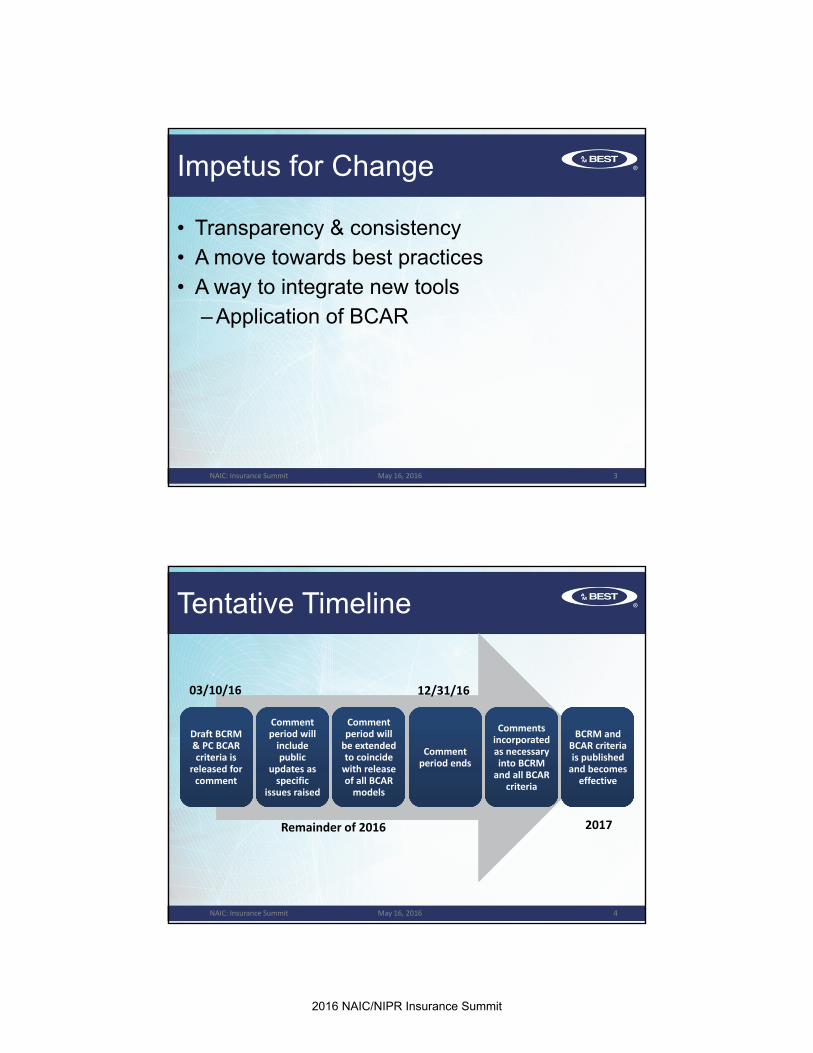
Impetus for Change
• Transparency & consistency• A move towards best practices• A way to integrate new tools
– Application of BCAR
May 16, 2016NAIC: Insurance Summit 3
Tentative Timeline
Draft BCRM & PC BCAR criteria is
released for comment
Draft BCRM & PC BCAR criteria is
released for comment
Comment period will
include public
updates as specific
issues raised
Comment period will
include public
updates as specific
issues raised
Comment period will
be extended to coincide
with release of all BCAR
models
Comment period will
be extended to coincide
with release of all BCAR
models
Comment period endsComment
period ends
Comments incorporated as necessary into BCRM
and all BCAR criteria
Comments incorporated as necessary into BCRM
and all BCAR criteria
BCRM and BCAR criteria is published
and becomes effective
BCRM and BCAR criteria is published
and becomes effective
03/10/16
Remainder of 2016
12/31/16
2017
May 16, 2016NAIC: Insurance Summit 4

2016 NAIC/NIPR Insurance Summit
An Updated BCRM
The BCRM will be the key source document for deriving ratings
• Issuer Credit Ratings• Financial Strength Ratings• Issue Ratings
May 16, 2016NAIC: Insurance Summit 5
An Updated BCRM
Not a fundamental change to rating analysis
May 16, 2016NAIC: Insurance Summit 6

2016 NAIC/NIPR Insurance Summit
An Updated BCRM
The BCRM is being updated but the fundamental rating drivers will remain the same
• Balance sheet strength• Operating performance• Business profile• Enterprise risk management
May 16, 2016NAIC: Insurance Summit 7
NAIC: Insurance Summit
The Building Block Approach
May 16, 2016
Country Risk
Balance Sheet
Strength
Baseline(e.g., bbb+)
Operating Performance
(+2/-3)
Business Profile
(+/-2)
Enterprise Risk Management
(+1/-4)
Comprehensive Adjustment
(+/-1)
Rating Enhancement
Published IssuerCredit Rating
A.M. Best’s Rating Process
8

2016 NAIC/NIPR Insurance Summit
Balance Sheet Strength
Balance sheet strength is now broken down into several parts
– Rating unit balance sheet strength assessment– BCAR
– Internal Capital Models
– Other qualitative and quantitative factors
– Holding company impact assessment
– Country risk impactCountry Risk
Rating Unit Balance
Sheet Strength
Assessment
Holding Company
Impact Assessment
Balance Sheet
Strength
Baseline (e.g., bbb+)
May 16, 2016NAIC: Insurance Summit 9
NAIC: Insurance Summit
Additional Balance Sheet Factors
May 16, 2016
Country Risk
Holding Company Impact
Assessment
Balance Sheet Strength
Baseline
Rating Unit Balance Sheet
Strength Assessment
BCARStress Tests
LiquidityALM
Quality of CapitalQuality of Reinsurance
Reinsurance DependenceAppropriateness of Reinsurance Program
Fungibility of CapitalInternal Capital Models
10

2016 NAIC/NIPR Insurance Summit
Stochastic Based BCAR
Best’s Capital Adequacy Ratio (BCAR) is a
comprehensive quantitative tool that evaluates many of the
risks to the balance sheet simultaneously and generates an
overall estimate of the required level of capital to support
those risks and compares it with available capital
BCAR is a key tool in the assessment of balance sheet
strength• Not the sole determinant of Balance Sheet Strength
• Not the sole determinant of the rating
11NAIC: Insurance Summit 11May 16, 2016
Summary of Changes
• Do not intend to change underlying view of the risks
• Do not intend to change the main risk categories of the models
Goals are to:
– Generate risk factors using stochastic simulations from probability curves & ESG
– Incorporate company specific detailed data from SRQ & statutory financial statements
NAIC: Insurance Summit May 16, 2016 1212

2016 NAIC/NIPR Insurance Summit
Summary of Changes
More sophisticated and faster software available now– Simulations / probability curves
– Correlations / diversification
– Company specific detail
– Economic scenario generators (ESGs)• A computer model that randomly simulates thousands of possible
values for a variety of economic and financial variables over a series of selected timeframes
• An ESG does not predict a path the economy will follow but instead produces a collection of possible paths including some that have not yet been observed
May 16, 2016 1313NAIC: Insurance Summit
• New Metric – VaR (Value at Risk)
Summary of Changes
UW (Profit)/Loss as Percent of NPW
0%
100%
-50% -40% -30% -20% -10% 0 10% 20% 30% 40%
(Profit)/Loss as % of NPW
5% in tail
Breakeven
VaR 95UW Loss = 23% of NPW
Pro
babili
ty of
Pote
ntial
Scenari
o
95% of potential scenarios
VaR does not tell us about what’s in the tail so we need to look at more than one VaR
VaR99.0 VaR
99.5
May 16, 2016 1414NAIC: Insurance Summit

2016 NAIC/NIPR Insurance Summit
Summary of Changes
• 5 scores calculated and published – instead of 1• 95%, 99%, 99.5%, 99.8%, and 99.9% confidence
levels
• New Calculation of BCAR
– Formula change
– Difference between Available Capital and Required Capital, as a ratio to Available Capital
– Better alignment with risk appetite/tolerance statements
May 16, 2016 1515NAIC: Insurance Summit
New Structure – PC BCAR
Available Capital (AC)
Reported Capital (PHS)
Equity Adjustments:
Unearned Premiums (DAC)
Equalization/Contingency Reserves
Loss Reserves
Assets
Debt Adjustments:
Surplus Notes
Debt Service Requirements
Other Adjustments:
Future Operating Losses
Potential Loss
Future Dividends
Goodwill & Other Intangible Assets
Minority Interests, etc.
Net Required Capital
Gross Required Capital (GRC):
(B1) Fixed Income Securities
(B2) Equity Securities
(B3) Interest Rate
(B4) Credit
(B5) Loss and LAE Reserves
(B6) Net Premiums Written
(B7) Business Risk
(B8) Potential Catastrophe Loss
Covariance Adjustment
Net Required Capital (NRC)*
BCAR Ratio = (Available Capital – Net Required Capital) / Available Capital
*NRC= SQRT [ (B1)²+(B2)²+(B3)²+(0.5*B4)² +[(0.5*B4)+(B5)]²+(B6)² ] + B7 + B8
May 16, 2016 16NAIC: Insurance Summit

2016 NAIC/NIPR Insurance Summit
Example of Impact to PC Score
Current PC BCAR Calculation (ratio to NRC)APHS (ex Potential Cat Losses) = $150MPotential Cat Losses = $30MNRC (ex Potential Cat Losses) = $80MBCAR = (150 – 30 ) / 80 = 120/80 = 150.0
Planned PC BCAR Calculation (ratio to Available Capital)Available Capital (ex Potential Cat Losses) = $150MPotential cat Losses = $30MNRC (ex Potential Cat Losses) = $80MNRC (incl Potential Cat Losses) = $110MBCAR = (150 – 110 ) / 150 = 40/150 = 26.7
May 16, 2016 1717NAIC: Insurance Summit
Example of Impact to PC Model
Current PC BCAR Calculation (ratio to NRC)
Potential Scores:Low of 0.0 to Max of 999.9Wanted BCAR > 100.0
New PC BCAR Calculation (ratio to Available Capital)
Potential Scores:Low of -999.9 to Max of 100.0Want BCAR > 0.0
May 16, 2016 1818NAIC: Insurance Summit

2016 NAIC/NIPR Insurance Summit
Display of BCAR Scores
36.7
26.7
16.7
6.7
-3.3-10
0
10
20
30
40
50
VaR 95 VaR 99 VaR 99.5 VaR 99.8 VaR 99.9
BCAR
May 16, 2016 1919NAIC: Insurance Summit
Summary of Changes
• Bond Defaults (PC&LH)
• Publicly Traded Common Stocks (PC&LH)
• Other Asset Classes (PC&LH)
• Interest Rate Risk (PC&LH)
• Credit Risk – Reinsurance Recoverables (PC&LH)
• Premium Risk (PC)
• Reserve Risk (PC)
May 16, 2016 2020NAIC: Insurance Summit

2016 NAIC/NIPR Insurance Summit
Investment Risk (PC & LH)
• Fixed Income Securities – Default Risk
– Bonds
– Mortgage Loans
– Preferred Stocks• Equities – Market Value Volatility
– Publicly Traded Common Stocks
– Real Estate
– Schedule BA assets• Affiliated and Private investments receive 100% risk charge
NAIC: Insurance Summit May 16, 2016 21
Interest Rate Risk (PC)
• Interest Rate Risk
– Risk of having to sell fixed income assets when market values are lower
– Exposure to a rise in interest rates over next one year
– Liquidity risk during the upcoming year
– Risk is driven by sudden shock event
• PC - Usually natural catastrophe, or man-made, could be economic
NAIC: Insurance Summit May 16, 2016 22

2016 NAIC/NIPR Insurance Summit
Credit Risk (PC & LH)
• Credit Risk
– Risk of default on:
• Reinsurance recoverables (recov on pd & unpd, ceded UPR)
– Reinsurance Recoverable Charge:
• Credit risk charge (ability to pay)
– Reinsurer AMB issuer credit rating
– Duration of recoverables
– Uses stochastic simulation software and impairment table
• Credit Risk Charges reduced for:
– Recovery on default (50%)
– Funds Held (100%)
– Acceptable LOCs & Trusts (up to 90%)
– Discounted to present value
– Dispute Risk calculation remains
NAIC: Insurance Summit May 16, 2016 23
Reserve Risk (PC)
• Risk of unanticipated adverse development on net loss & loss-adjustment expense (LAE) reserves
• Reserve Risk Factors
– Uses stochastic simulation software
• probability distributions
• correlation matrix
• Further adjustment to required capital for Excessive Growth
NAIC: Insurance Summit May 16, 2016 24

2016 NAIC/NIPR Insurance Summit
Premium Risk (PC)
• Risk that pricing of business written next year will be inadequate– Potential for Underwriting Loss on one more year’s worth of business
– This is the one-year look forward in terms of adding additional exposure
– Current year’s NWP used as proxy for next year
• Premium Risk Factors– Uses stochastic simulation software
• probability distributions
• correlation matrix
• Further adjustment to required capital for Excessive Growth
NAIC: Insurance Summit May 16, 2016 25
Business Risk (PC & LH)
• Risks not reflected in balance sheet that may affect surplus– Contingent Liabilities
– Non-controlled assets
– Unfunded Pension & other post employment/ retirement benefits
– Separate Account Assets
– Etc.
• Risk factors determined by analyst
• Use same required capital at all VaRs
NAIC: Insurance Summit May 16, 2016 26

2016 NAIC/NIPR Insurance Summit
Potential Catastrophe Loss (PC)
• Natural Catastrophe– Update natural catastrophe approach –
• Per Occurrence
• Total all perils
• Measured at various VaR levels
• Risk added to Net Required Capital
• Will continue stress test approach
• Reinstatement premium and Tax adjustments remain
• Terrorism and other stress tests remain
NAIC: Insurance Summit May 16, 2016 27
• Using the 5 BCARs below, find the highest confidence level where the BCAR is still Greater than Zero
• Then, use that confidence level in BCAR guidance table to determine initial Balance Sheet Strength assessment
71.2
50.3
28.7
-18.7
-69.7-80
-60
-40
-20
0
20
40
60
80
VaR 95 VaR 99 VaR 99.5 VaR 99.8 VaR 99.9
Published BCARs
Applying BCAR Scores
Increasing confidence levels
Highest Confidence Level where BCAR is still positive = 99.5
28May 16, 2016NAIC: Insurance Summit 28

2016 NAIC/NIPR Insurance Summit
• Key for rating unit evaluation
• BCAR run at the rating unit
• Confidence level results tie in to assessment
Metric Confidence Level (%) BCAR Implied Consolidated
Balance Sheet Strength
VaR 99.9 Greater than zero Strongest
VaR 99.8 Greater than zero Very Strong
VaR 99.5 Greater than zero Strong
VaR 99 Greater than zero Adequate
VaR 95 Greater than zero Weak
VaR 95 Less than zero Very Weak
Applying BCAR Scores
= Initial Indication
29May 16, 2016NAIC: Insurance Summit 29
NAIC: Insurance Summit
Applying BCAR Scores
May 16, 2016 30

2016 NAIC/NIPR Insurance Summit
Catastrophe Stress Test
If a cat loss occurs, what would the BCAR scores look like?
1. Reduce Available Capital• 1-in-100 year Net PML from Per occurrence, Total all perils
• Reinstatement premium and tax adjustments remain
2. Increase Recoverables by 40% of ceded loss• From 1-in-100 year PML from Per occurrence, Total all perils
• Adjust credit risk factors if needed
3. Increase Net loss reserves by 40% of pretax net PML• From 1-in-100 year PML from Per occurrence, Total all perils
4. See how far BCAR scores drop at all confidence levels
31May 16, 2016NAIC: Insurance Summit 31
60.1
44.735.5
22.9
8.740.1
22.710.5
-7.1
-31.3-40
-20
0
20
40
60
80
VaR 95 VaR 99 VaR 99.5 VaR 99.8 VaR 99.9
BCAR
Published BCAR Stressed BCAR
Catastrophe Stress Test
Need to assess Financial Flexibility to determine impact.
How far did the curve shift down, is this a material drop, and how do you manage this drop?
32May 16, 2016NAIC: Insurance Summit 32

2016 NAIC/NIPR Insurance Summit
NAIC: Insurance Summit
Applying BCAR Scores
May 16, 2016 33
NAIC: Insurance Summit
Holding Company Impact Assessment
May 16, 2016
Country Risk
Balance Sheet
Strength
Baseline
Rating Unit Balance Sheet
Strength Assessment
Consolidated BCARFinancial Leverage
Operating LeverageCoverageFinancial
Flexibility/LiquidityIntangible Assets
Holding Company Impact
Assessment
34

2016 NAIC/NIPR Insurance Summit
Holding Company Impact Assessment
• Financial Leverage
– Unadjusted / Adjusted
• Operating Leverage
• Coverage
– Interest & Fixed-Charge Coverage
• Financial Flexibility / Liquidity
– Analysis of Sources and Uses
– Access to Capital
– Asset Allocation/Investment Risk
• Intangible Assets
• Non-Rated and/or Non-Regulated Affiliates
May 16, 2016NAIC: Insurance Summit 35
Balance Sheet Strength Assessment
May 16, 2016
Combined Balance Sheet Strength Assessment (Lead Rating Unit & Holding Company)
Holding Company
Lead
Rat
ing
Uni
t
Positive Neutral Negative Very Negative
Strongest Strongest Strongest Very Strong AdequateVery Strong Strongest Very Strong Strong Weak
Strong Very Strong Strong Adequate Very WeakAdequate Strong Adequate Weak Very Weak
Weak Adequate Weak Very Weak Very WeakVery Weak Weak Very Weak Very Weak Very Weak
NAIC: Insurance Summit 36

2016 NAIC/NIPR Insurance Summit
The Baseline Assessment
May 16, 2016NAIC: Insurance Summit
Overall Balance Sheet Strength Assessment
Com
bine
d Ba
lanc
e Sh
eet A
sses
smen
t (R
atin
g U
nit/
Hol
ding
Com
pany
)
Country Risk TierCRT-1 CRT-2 CRT-3 CRT-4 CRT-5
Strongest a+/a a+/a a/a- a-/bbb+ bbb+/bbb
Very Strong a/a- a/a- a-/bbb+ bbb+/bbb bbb/bbb-
Strong a-/bbb+ a-/bbb+ bbb+/bbb/bbb- bbb/bbb-/bb+ bbb-/bb+/bb
Adequate bbb+/bbb/bbb- bbb+/bbb/bbb- bbb-/bb+/bb bb+/bb/bb- bb-/b+/b
Weak bb+/bb/bb- bb+/bb/bb- bb-/b+/b b+/b/b- b/b-/ccc+
Very Weak b+ and below b+ and below b- and below ccc+ and below ccc and below
37
NAIC: Insurance Summit
The Building Block Approach
May 16, 2016 38
Country Risk
Balance Sheet
Strength
Baselinebbb+
Operating Performance
(+2/-3)
Business Profile
(+/-2)
Enterprise Risk Management
(+1/-4)
Comprehensive Adjustment
(+/-1)
Rating Enhancement
Published IssuerCredit Rating
A.M. Best’s Rating Process
2016 NAIC/NIPR Insurance Summit
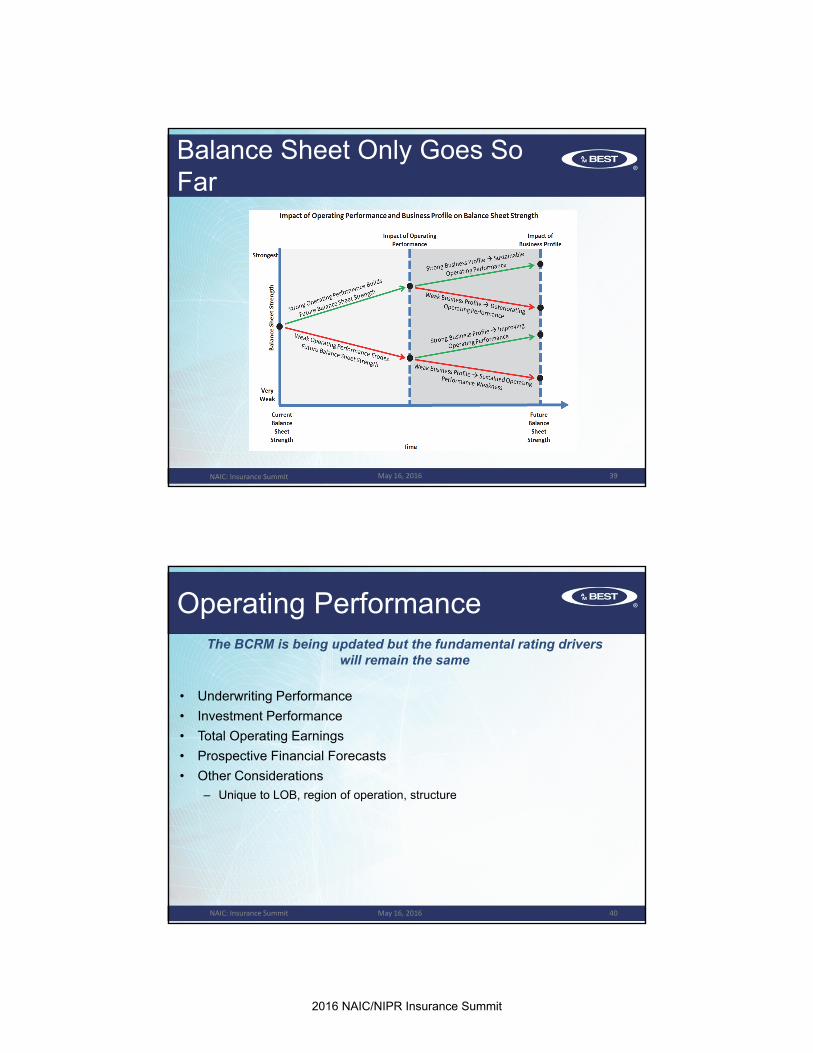
Balance Sheet Only Goes So Far
May 16, 2016NAIC: Insurance Summit 39
Operating PerformanceThe BCRM is being updated but the fundamental rating drivers
will remain the same
• Underwriting Performance
• Investment Performance
• Total Operating Earnings
• Prospective Financial Forecasts
• Other Considerations
– Unique to LOB, region of operation, structure
May 16, 2016NAIC: Insurance Summit 40

2016 NAIC/NIPR Insurance Summit
Operating Performance Benchmarks
• Benchmarks ensure operating performance metrics for each insurer are being evaluated in proper framework
• Can be created using:
– Industry composites/sub-composites
– ICR composites
– Other customized parameters
• May be appropriate to compare a rating against >1 benchmark• Rating Committee has flexibility in determining the appropriate
benchmark(s) for each rating unit• Various insurance organizational types will have differing benchmarking
metrics
May 16, 2016NAIC: Insurance Summit 41
AssessmentAdjustment (Notches) Key Operating Performance Characteristics
Very Strong +2Historical operating performance is exceptionally strong and consistent. Trends are positive and prospective operating performance is expected to be exceptionally strong. Volatility of key metrics is low.
Strong +1Historical operating performance is strong and consistent. Trends are neutral/slightly positive and prospective operating performance is expected to be strong. Volatility of key metrics is low to moderate.
Adequate 0 Historical operating performance and trends are neutral. Prospective operating performance is expected to be neutral. Volatility of key metrics is moderate.
Weak -1Historical operating performance is poor. Trends are neutral/slightly negative and prospective operating performance is expected to be poor. Volatility of key metrics is high.
Very Weak -2/3 Historical operating performance is very poor. Trends are negative and prospective operating performance is expected to be very poor. Volatility of key metrics is high.
Depending on a company’s operating performance, the baseline can be adjusted up or down
– Using appropriate benchmark
– Looking at level, trend and volatility
Baseline Adjusted for Performance
May 16, 2016NAIC: Insurance Summit 42

2016 NAIC/NIPR Insurance Summit
NAIC: Insurance Summit
The Building Block Approach
May 16, 2016 43
Country Risk
Balance Sheet
Strength
Baselinebbb+
Operating Performance
“Strong” (+1)a-
Business Profile
(+/-2)
Enterprise Risk Management
(+1/-4)
Comprehensive Adjustment
(+/-1)
Rating Enhancement
Published IssuerCredit Rating
A.M. Best’s Rating Process
Business ProfileThe BCRM is being updated but the fundamental rating drivers will remain
the sameSub-Assessment Positive Neutral Negative
Product/GeographicConcentration
Significant diversification of product line /geographies
Moderate diversification of product lines / geographies
Insufficient diversification of product lines / geographies
Market Position Increase profitable market share at a sustainable rate Sustain profitable market share Unable to sustain profitable
market share
Pricing Sophistication & Data Quality Provides Competitive Advantage No Competitive
Advantage/Disadv.Lack of sophistication creates
disadvantage
Product Risk Low Risk Offerings Average Risk Offerings High Risk Offerings
Degree of Competition Low Competition Average Competition High Competition
Management Quality Consistently achieves forecasts & targets
Occasionally falls short of forecasts & targets
Provides unreliable forecasts & targets
Regulatory, Event & Market Risks Very Low or Significantly Reduced Moderate and Stable Very High or Significantly
Increased
Distribution ChannelsCreated a significant competitive
advantage thru distribution channels
Has not created a significant competitive advantage thru
distribution channels
Faces a significant competitive disadvantage with regards to
distribution
May 16, 2016NAIC: Insurance Summit 44

2016 NAIC/NIPR Insurance Summit
Business Profile Assessment
Adjustment (Notches) Key Characteristics of Business Profile
Very Favorable +2
The company's market leadership position is unquestionable, demonstrated, and defensible with high brand recognition. Distribution is seen as a competitive advantage; business lines are non-correlated and generally lower risk. Its management capabilities and data management are very strong.
Favorable +1
The company is a market leader with strong business trends and good control over distribution. It has diversified operations in key markets that have high to moderate barriers to entry with low competition. It has a strong management team that is able to meet projections and utilize data effectively.
Neutral 0The company is not a market leader, but is viewed as competitive in chosen markets. It has some concentration and/or limited control of distribution. It has moderate product risk but limited severity and frequency of loss. Its use of technology is evolving and its business spread of risk is adequate.
Limited -1
The company has a lack of diversification in geographic and/or product lines; its control over distribution is limited and undifferentiated. It faces high/increasing competition with low barriers to entry and elevated product risk. Management is unable to utilize data effectively or consistently in business decisions.
Very Limited -2The company faces high competition and low barriers to entry. It has high concentration in commodity or higher-risk products with very limited geographic diversity. It has weak data management. Country risk may factor into its elevated business profile risks.
Baseline Adjusted for Profile• Sub-assessments are qualitatively combined by analyst into a single business profile
assessment
• Ultimate “weights” of each sub-assessment will vary depending on which metrics will have biggest impact on future financial strength
May 16, 2016NAIC: Insurance Summit 45
NAIC: Insurance Summit
The Building Block Approach
May 16, 2016 46
Country Risk
Balance Sheet
Strength
Baselinebbb+
Operating Performance
“Strong” (+1)a-
Business Profile
“Favorable” (+1)a
Enterprise Risk Management
(+1/-4)
Comprehensive Adjustment
(+/-1)
Rating Enhancement
Published IssuerCredit Rating
A.M. Best’s Rating Process

2016 NAIC/NIPR Insurance Summit
ERMThe BCRM is being updated but the fundamental rating drivers will remain the same
• Product & Underwriting Risk
• Reserving Risk
• Concentration Risk
• Reinsurance Risk
• Financial Flexibility Risk
• Investment Risk
• Legislative/Regulatory/Judicial/Economic Risk
• Management Risk
• Operational Risk
• Risk Appetite/Stress Testing
May 16, 2016NAIC: Insurance Summit 47
Baseline Adjusted for ERM• Very strong risk management capability with a matching profile or strong risk
management with a lower profile earns positive adjustment
• Risk management capability lower than the risk profile earns negative adjustment
• Downside spread reflects A.M. Best’s concern that truly weak ERM can disproportionately impact financial strength
May 16, 2016NAIC: Insurance Summit 48
ERM Assessment
Adjustment (Notches) Key Characteristics of ERM
Very Strong +1 Risk management capabilities are excellent and are more than adequate for the risk profile of the company.
Adequate 0 Risk management capabilities are good and are adequate for the risk profile of the company.
Weak -1/2 Risk management capabilities are insufficient given the risk profile of the company.
Very Weak -3/4 Risk management capabilities contain severe deficiencies relative to the risk profile of the company.

2016 NAIC/NIPR Insurance Summit
NAIC: Insurance Summit
The Building Block Approach
May 16, 2016 49
Country Risk
Balance Sheet
Strength
Baselinebbb+
Operating Performance
“Strong” (+1)a-
Business Profile
“Favorable” (+1)a
Enterprise Risk Management
“Adequate” (+0)a
Comprehensive Adjustment
(+/-1)
Rating Enhancement
Published IssuerCredit Rating
A.M. Best’s Rating Process
Comprehensive Adjustment• Evaluation of key rating factors includes parameters which place limits on
any one factor
• Recognizes a truly uncommon strength/weakness that is not captured through the rating process
May 16, 2016NAIC: Insurance Summit 50
Comprehensive Adjustment
Adjustment (Notches) Key Characteristics
Positive +1 The company has uncommon strengths that exceed what has been captured throughout the rating process.
None 0 The company's strengths and weaknesses have been accurately captured throughout the rating process.
Negative -1 The company has uncommon weaknesses that exceed what has been captured throughout the rating process.

2016 NAIC/NIPR Insurance Summit
NAIC: Insurance Summit
The Building Block Approach
May 16, 2016 51
Country Risk
Balance Sheet
Strength
Baselinebbb+
Operating Performance
“Strong” (+1)a-
Business Profile
“Favorable” (+1)a
Enterprise Risk Management
“Adequate” (+0)a
Comprehensive Adjustment
“None” (+0)a
Rating Enhancement
Published IssuerCredit Rating
A.M. Best’s Rating Process
Rating Enhancement• Non-lead rating units may be eligible for partial rating enhancement
based on benefits it receives from being affiliated with the lead rating unit.
• Rating drag can also occur from negative impact of the lead rating unit on the non-lead unit.
May 16, 2016NAIC: Insurance Summit 52
Rating Enhancement/Drag
Adjustment (Notches) Key Characteristics of Rating Enhancement/Drag
Typical Lift + 1 to + 4The non-lead rating unit either receives explicit support from the broader organization or is deemed materially important within the broader organization as demonstrated by its level of integration.
Neutral 0 The non-lead rating unit does not have explicit support from the broader organization and is not considered materially important within the organization.
Typical Drag - 1 to - 4 The non-lead rating unit is negatively impacted by its association with the weaker affiliates of the broader organization.

2016 NAIC/NIPR Insurance Summit
NAIC: Insurance Summit
The Building Block Approach
May 16, 2016 53
Country Risk
Balance Sheet
Strength
Baselinebbb+
Operating Performance
“Strong” (+1)a-
Business Profile
“Favorable” (+1)a
Enterprise Risk Management
“Adequate” (+0)a
Comprehensive Adjustment
“None” (+0)a
Rating Enhancement
“N/A” (+0)a
Published IssuerCredit Rating
A.M. Best’s Rating Process
Rating recommendation of “a”
Rating Implications
• BCRM is NOT a means to change ratings although some ratings may change
• Analyst will communicate any potential rating issues as they become apparent during comment period
• Ratings impacted will be placed under review at end of comment period
– Need to be resolved within 6 months after under review
May 16, 2016NAIC: Insurance Summit 54

2016 NAIC/NIPR Insurance Summit
Questions
Email comments to:
May 16, 2016NAIC: Insurance Summit 55
NAIC: Insurance Summit May 16, 2016 56
© AM Best Company, Inc. (AMB) and/or its licensors and affiliates. All rights reserved. ALL INFORMATION CONTAINED HEREIN IS PROTECTEDBY COPYRIGHT LAW AND NONE OF SUCH INFORMATION MAY BE COPIED OR OTHERWISE REPRODUCED, REPACKAGED, FURTHERTRANSMITTED, TRANSFERRED, DISSEMINATED, REDISTRIBUTED OR RESOLD, OR STORED FOR SUBSEQUENT USE FOR ANY SUCH PURPOSE, INWHOLE OR IN PART, IN ANY FORM OR MANNER OR BY ANY MEANS WHATSOEVER, BY ANY PERSON WITHOUT AMB’s PRIOR WRITTENCONSENT. All information contained herein is obtained by AMB from sources believed by it to be accurate and reliable. AMB does not audit orotherwise independently verify the accuracy or reliability of information received or otherwise used and therefore all information containedherein is provided “AS IS” without warranty of any kind. Under no circumstances shall AMB have any liability to any person or entity for (a)any loss or damage in whole or in part caused by, resulting from, or relating to, any error (negligent or otherwise) or other circumstance orcontingency within or outside the control of AMB or any of its directors, officers, employees or agents in connection with the procurement,collection, compilation, analysis, interpretation, communication, publication or delivery of any such information, or (b) any direct, indirect,special, consequential, compensatory or incidental damages whatsoever (including without limitation, lost profits), even if AMB is advised inadvance of the possibility of such damages, resulting from the use of or inability to use, any such information. The credit ratings, financialreporting analysis, projections, and other observations, if any, constituting part of the information contained herein are, and must beconstrued solely as, statements of opinion and not statements of fact or recommendations to purchase, sell or hold any securities, insurancepolicies, contracts or any other financial obligations, nor does it address the suitability of any particular financial obligation for a specificpurpose or purchaser. Credit risk is the risk that an entity may not meet its contractual, financial obligations as they come due. Credit ratingsdo not address any other risk, including but not limited to, liquidity risk, market value risk or price volatility of rated securities. AMB is not aninvestment advisor and does not offer consulting or advisory services, nor does the company or its rating analysts offer any form ofstructuring or financial advice. NO WARRANTY, EXPRESS OR IMPLIED, AS TO THE ACCURACY, TIMELINESS, COMPLETENESS,MERCHANTABILITY OR FITNESS FOR ANY PARTICULAR PURPOSE OF ANY SUCH RATING OR OTHER OPINION OR INFORMATION IS GIVEN ORMADE BY AMB IN ANY FORM OR MANNER WHATSOEVER. Each credit rating or other opinion must be weighed solely as one factor in anyinvestment or purchasing decision made by or on behalf of any user of the information contained herein, and each such user mustaccordingly make its own study and evaluation of each security or other financial obligation and of each issuer and guarantor of, and eachprovider of credit support for, each security or other financial obligation that it may consider purchasing, holding or selling.