aluminum papebehavior and design of aluminum flexural members with tapered thicknessr2a
DESCRIPTION
Structural shapes with tapered thickness flanges are common in aluminum construction. The behavior of a component element with tapered thickness has been investigated by several researchers. However, it has not been fully incorporated in the specifications approaches. Instead, the thickness variation is averaged so that the tapered thickness plate is treated as the uniform one. In this study, stiffness matrices appropriate for such tapered thickness plates are derived in the framework of an available finite strip analysis program. Using the program, parametric studies are conducted to find a plate buckling coefficient depending on the thickness variation ratio. The obtained plate buckling coefficient is introduced into the current specification approach for aluminum structures to compute a more precise limit state stress. Parametric studies for a great variety of tapered I-shaped sections validate the approach compared to non-linear inelastic finite element analyses. Physical tests further support the developed approach. The allowable stress design equations are suggested for the application to the AA Specification based on the developed limit state stress equations. The framework for uniform thickness sections is maintained in the proposed approaches for tapered thickness sections.TRANSCRIPT

Rev. A (Progress Report 15) 5/6/2003
Paper 2 - 1
Paper 2
Behavior and Design of Aluminum Flexural Members with Tapered Thickness
Yongwook Kim and Teoman Peköz
Abstract Structural shapes with tapered thickness flanges are common in aluminum
construction. The behavior of a component element with tapered thickness has been investigated by several researchers. However, it has not been fully incorporated in the specifications approaches. Instead, the thickness variation is averaged so that the tapered thickness plate is treated as the uniform one.
In this study, stiffness matrices appropriate for such tapered thickness plates are derived in the framework of an available finite strip analysis program. Using the program, parametric studies are conducted to find a plate buckling coefficient depending on the thickness variation ratio. The obtained plate buckling coefficient is introduced into the current specification approach for aluminum structures to compute a more precise limit state stress.
Parametric studies for a great variety of tapered I-shaped sections validate the approach compared to non-linear inelastic finite element analyses. Physical tests further support the developed approach.
The allowable stress design equations are suggested for the application to the AA Specification based on the developed limit state stress equations. The framework for uniform thickness sections is maintained in the proposed approaches for tapered thickness sections.
Rev. A (Progress Report 15) 5/6/2003
Paper 2 - 2
Introduction Sections with tapered plate thickness are one of typical sections made of steel or
aluminum. However, the design equations for the behavior of such tapered plate elements have not been fully developed in the specification approaches. In the both the Manual of Steel Construction by American Institute of Steel Construction (1998) and the Aluminum Association Specification for Aluminum Structures (2000a, abbreviated to the AA Specification), it is implicit to treat a tapered component element as a uniform one with average thickness.
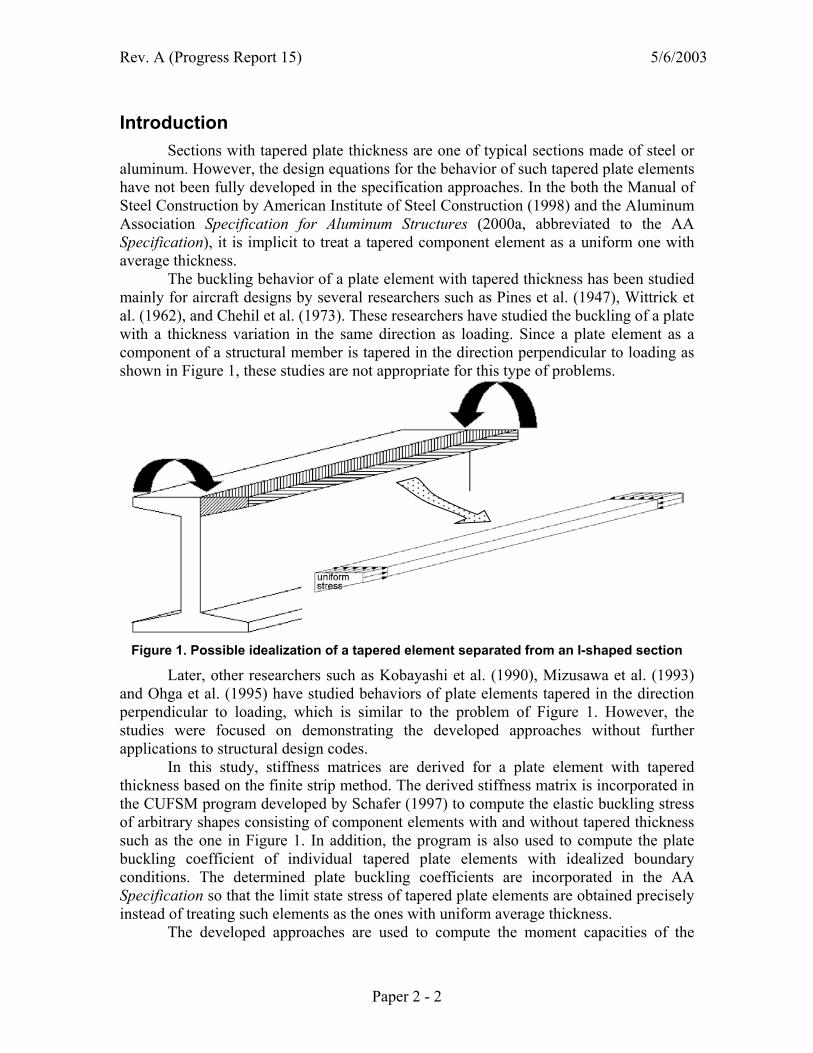
The buckling behavior of a plate element with tapered thickness has been studied mainly for aircraft designs by several researchers such as Pines et al. (1947), Wittrick et al. (1962), and Chehil et al. (1973). These researchers have studied the buckling of a plate with a thickness variation in the same direction as loading. Since a plate element as a component of a structural member is tapered in the direction perpendicular to loading as shown in Figure 1, these studies are not appropriate for this type of problems.
Figure 1. Possible idealization of a tapered element separated from an I-shaped section
Later, other researchers such as Kobayashi et al. (1990), Mizusawa et al. (1993) and Ohga et al. (1995) have studied behaviors of plate elements tapered in the direction perpendicular to loading, which is similar to the problem of Figure 1. However, the studies were focused on demonstrating the developed approaches without further applications to structural design codes.
In this study, stiffness matrices are derived for a plate element with tapered thickness based on the finite strip method. The derived stiffness matrix is incorporated in the CUFSM program developed by Schafer (1997) to compute the elastic buckling stress of arbitrary shapes consisting of component elements with and without tapered thickness such as the one in Figure 1. In addition, the program is also used to compute the plate buckling coefficient of individual tapered plate elements with idealized boundary conditions. The determined plate buckling coefficients are incorporated in the AA Specification so that the limit state stress of tapered plate elements are obtained precisely instead of treating such elements as the ones with uniform average thickness.
The developed approaches are used to compute the moment capacities of the

Rev. A (Progress Report 15) 5/6/2003
Paper 2 - 3
doubly symmetric I-shaped sections with tapered thickness. The moment capacities obtained from the approaches are compared to those from the finite element analyses. The flexural tests are also conducted to validate both the approaches and the finite element analyses.
Stiffness Matrix for a Tapered Finite Strip Element CUFSM program computes the elastic buckling load factor and corresponding
mode shapes using the finite strip method. Since CUSFM is based on the uniform plate theory, a thickness variation cannot be considered directly. In this study, stiffness matrices for tapered finite strip elements are derived.
The shape function used in CUFSM is based on Cheung (1976), which is the multiplication of a width-direction shape function X(x) and a longitudinal-direction shape function Y(y).
N(x,y) = X(x)Y(y) (1) For the plane stress part of the stiffness matrix, the width-direction shape function X(x) is linear, which is the same as the one for a truss element. For the plate bending part of the matrix, the width-direction shape function X(x) is cubic, which is the same as the one for a beam element. On the other hand, the longitudinal-direction shape function Y(y) is a sine function, since the boundary condition at the loaded edges of the program is limited to the simply supported case. The width-direction shape functions are only modified, since the thickness varies only in that direction. The idea for the exact shape functions for tapered truss and beam elements is based on McGuire et al (2000).
Figure 2. A tapered truss or beam element with unit width or a cross section of a tapered
plate element
Figure 3. Degrees of freedom for a finite strip
For an axially loaded linearly tapered truss element shown in Figure 2, the
t1 t2 x
z dx
b
w1
u1
v1
w2
u2
v2
a
b
x
z
θ1 θ2
y

Rev. A (Progress Report 15) 5/6/2003
Paper 2 - 4
equilibrium of an infinitesimal segment in the x-direction yields the following displacement field:
1 2( ) ( ) Ttu x N x u u= (2)
1 1( ) 1 ( ) ( )tN x f x f x= − = the shape function for a tapered truss element (3)
where ( )( )1
ln 1( )
ln 1
xbf x
δ
δ
+≡
+ and 2 1
1
t tt
δ −=
Using Equation (3), the shape function for the plane stress is expressed in the form of Equation (1) within the displacement field:
[ ]1 1 1 2 2( , ) ( , ) ( , )T Tu x y v x y N x y u v u v= (4)
[ ]( )
( )1 1
11 1
1 ( ) ( ) 0 ( ) ( ) 0( , ) ( ) ( )0 1 ( ) 0 ( )
m m
m m
m m
f x Y y f x Y yN x y Y y Y yf x f x
k k
− = ′ ′ −
(5)
where Ym(y) = sin(kmy), km = mπ /a, m = number of half-waviness, and a = longitudinal length of the strip element (y-direction in Figure 3). The degrees of freedom in Equation (4) are defined in Figure 3.
The strain field is derived from the displacement field:
[ ]1 1 1 2 2( , )T
T Tx y xy
u v u v B x y u v u vx y y x
ε ε γ ∂ ∂ ∂ ∂ = + = ∂ ∂ ∂ ∂
(6)
[ ] ( )
( )
1 1
1 1 1
1 1 1 1
( ) ( ) 0 ( ) ( ) 0( ) ( )( , ) 0 1 ( ) 0 ( )
( ) ( )1 ( ) ( ) ( ) ( ) ( ) ( )
m m
m m
m m
m mm m
m m
f x Y y f x Y yY y Y yB x y f x f x
k kY y Y yf x Y y f x f x Y y f x
k k
′ ′− ′′ ′′
= − ′ ′
′ ′ ′ ′− −
(7)
The initial stiffness matrix of plane stress part is derived from the minimum potential energy:
[kplane-stress] = 1 10 0
( )[ ] [ ][ ]b a
Tpt x B E B dydx∫ ∫ (8)
where [Ep] =1 2
2 2
00
0 0
x
x
E EE E
G
νν
, 1 1x
x y
EEν ν
=−
, 2 1y
x y
EE
ν ν=
−, and ( ) 1 1 xt x t
bδ = +
For a linearly tapered beam element shown in Figure 2, the force equilibrium of an infinitesimal segment in the vertical direction (z) and the moment equilibrium with respect to the axis perpendicular the cross section (y) yield the following displacement field:
1 1 2 2( ) ( ) Tbw x N x w wθ θ= (9)
where ( )bN x = the shape function for a tapered beam element

Rev. A (Progress Report 15) 5/6/2003
Paper 2 - 5
( )
( ) ( )
( )
( )
2 22
2 2
2
22
22 2
2
22
2 22
( ) ( )( ) 2 ln( ) ( )
ln(1 ) ln ( )( )1( )
( )( ) 2 ln ( )( )
ln(1 )( ) ( ) ln ( )( ) 2
b
f b f bf xf x f x
b x xC b f xf x b b
N xC f bf x f x
f x
Cbf b x x bf b f xf x b b
δ δ
δ δ δ
δ δ
δ δδ
− + + −
− + + + − =
− − + + +
+ + + −
T
(10)
where ( ) ( )2 2 ln 1C δ δ δ= − + + + , and 2 ( ) 1 xf xb
δ= +
Using Equation (10), the shape function for plate bending is expressed in the form of Equation (1) within the displacement field for a finite strip element:
2 1 1 2 2( , ) ( , ) Tw x y N x y w wθ θ= (11)
2 ( , ) ( ) ( )b mN x y N x Y y= (12) The degrees of freedom in Equation (11) are defined in Figure 3.
Using the displacement field in Equation (11), the strain field is computed: 2 2 2
2 1 1 2 22 2 2 [ ( , )]T
T Tx y xy
w w w B x y u v u vx y x y
ε ε γ ∂ ∂ ∂ = − − = ∂ ∂ ∂ ∂
(13)
where
[ ] 22 ( , ) [ ( )] ( ) [ ( )] ( ) 2[ ( )] ( )
T
b m b m m b mB x y N x Y y N x k Y y N x Y y′′ ′ ′ = − The initial stiffness matrix of plate bending part is derived from the same
minimum potential energy;
[kplate-bending] = 2 20 0
[ ] [ ][ ]b a
TbB E B dydx∫ ∫ (14)
where [Eb] =3( )12 p
t x E
The complete initial stiffness matrix is the combination of Equations (8) and (14): ( )
( )4 4
[ ]4 4
plane stress
e
plate bending
k zerosk
zeros k
−
−
× = ×
(15)
Derivation of geometric stiffness matrix refers to Schafer (1997). The thickness variation is incorporated in the geometric stiffness matrix. For a linearly varying applied stress,
( ) [ ] [ ]1 1 20 0
( )a b
Tg
xk f f f t x G G dxdyb
= − − ∫ ∫ (16)
where [ ]{ } ( , ) ( , ) ( , )T
u x y v x y w x yG dy y y
∂ ∂ ∂= ∂ ∂ ∂
, f1 and f2 = stresses at the nodes of an

Rev. A (Progress Report 15) 5/6/2003
Paper 2 - 6
element, {d}= u1 v1 u2 v2 w1 θ1 w2 θ2T, u(x,y) v(x,y)T= Equation (4), and w(x,y) = Equation (11).
After the initial stiffness matrix of Equation (15) is computed for each element, each stiffness matrix is transformed into a global coordinate system. The transformed stiffness matrices from all elements are assembled according to global degrees of freedom. The same procedure is repeated for the geometric stiffness matrix of Equation (16). By solving an eigen-value problem of Equation (17), elastic buckling load factors (β) and corresponding mode shapes {∆} are obtained for a given geometry:
{ } { }0e gK Kβ + ∆ = (17) where Ke = the assembled initial stiffness matrix in a global coordinate system, Kg = the assembled geometric stiffness matrix in a global coordinate system.
Due to a singularity manner of the shape functions in Equations (5) and (10) as the thickness variation ratio (δ) approaches to zero, the stiffness matrices for a plate with tapered thickness are used only when thickness variation ratio is larger than or equal to 4%. For smaller thickness variation ratio than 4%, stiffness matrices for a plate with uniform thickness are used after the thickness is averaged.
Plate Buckling Coefficient for a Tapered Plate Element and Application to the AA Specification
In the AA Specification (2000a), compressive limit state stress equations for a component element refer to yielding, inelastic buckling, and elastic buckling ranges as shown in Figure 4.
Fig. 4. Limit state stress for a component element in the AA Specification
The limit state stress equations in this figure are expressed in terms of the equivalent slenderness ratio (λp) as defined in Equation (18), originating from Equation (19).
3.266p
p
b bt tk
λ κ = =
for ν = 1/3 (18)
( )
2 2
2 2212(1 ) /cr p
p
E EF kb t
π πλν
= ≡−
(19)
By idealizing junctions between component elements as simply-supported boundaries, each component element is considered as an individual plate element. Thus, the equivalent slenderness ratio of each component element depends on the plate buckling

Rev. A (Progress Report 15) 5/6/2003
Paper 2 - 7
coefficient kp. However, for a plate element with tapered thickness, the equivalent slenderness is
not provided in the current AA Specification. Sections with tapered thickness are shown in Table 1. The shaded flange area in Table 1 is considered as an individual plate element under uniform compression with idealized boundary conditions.
Table 1. Possible idealization of sections with tapered elements Flexural member – idealized
tapered element under uniform compression is shaded
idealized boundary condition (IBC) IBC designation
SSSS
SSFS
SSSF
Since the thickness varies at the loaded edges, the distributed force per unit length
shown in this table, which is the multiplication of the stress by the thickness, is not uniform. Using the CUFSM program for a plate with tapered thickness, a plate buckling coefficient is computed for each idealized boundary condition and geometry in Table 1 corresponding to a given thickness variation ratio (δ). The thickness variation ratio is the additional variable for a plate with tapered thickness:
( )2 1 1t t tδ = − (20) where t1 = the smallest thickness, and t2 = the largest thickness (Figure 2). The plate buckling coefficient is computed based on the smallest thickness (t1) as defined in Equation (21).
( ) ( )2211
2
12(1 ) / crp
b t Fk
Eν
δπ
−= (21)
The plate in the analysis is discretized into eight equally spaced elements. The computed plate buckling coefficients are plotted in Figure 5 in terms of the thickness variation ratio (δ). In this figure, CUFSM-tap denotes the version of the CUFSM program modified for the tapered element based on the theory developed in this study. The results are compared to the ones from Mizusawa (1993). Since the available data from Mizusawa (1993) are limited to the case that the width (b) is the same as the length (a), plate buckling coefficients are compared in such case. However, since the plate buckling coefficient keeps decreasing as the length-to-width ratio increases in SSFS and SSSF boundary conditions, the results for a large length-to-width ratio of 200 are also given. The plate buckling coefficient obtained from CUFSM using this aspect ratio for a plate with uniform thickness is 0.405. This number is rather smaller than the widely used ones in other specification approaches; 0.425 or 0.43. However, 0.405 is more consistent with the current AA Specification, since the equivalent slenderness of a uniform thickness

Rev. A (Progress Report 15) 5/6/2003
Paper 2 - 8
plate with SSFS (or SSSF) boundary condition is 5.13(b/t) according to Aluminum Company of America (1960), from which the basis of the AA Specification is obtained.
0 0.2 0.4 0.6 0.8 1 1.2 1.4 1.6 1.8 20
5
10
15pl
ate
buck
ling
coef
ficie
nt (k
p)[SSSS]CUFSM-tap (a=b)
Mizusawa (a=b)
δ
(a)
0 0.2 0.4 0.6 0.8 1 1.2 1.4 1.6 1.8 20
1
2
3
4
5
plat
e bu
cklin
g co
effic
ient
(kp)
[SSFS]CUFSM-tap (a=b)Mizusawa (a=b)CUFSM-tap (a=200b)
δ
(b)
0 0.2 0.4 0.6 0.8 1 1.2 1.4 1.6 1.8 20
2
4
6
8
plat
e bu
cklin
g co
effic
ient
(kp)
[SSSF]CUFSM-tap (a=b)Mizusawa (a=b)CUFSM-tap (a=200b)
δ
(c) Figure 5. Plate buckling coefficient of plates with tapered thickness for boundary condition
(a) SSSS (b) SSFS (c) SSSF. Width-to-thickness ratio = 1000 in Mizusawa (1993).
As the thickness variation ratio increases the plate buckling coefficient also increases monotonically as seen in Figure 5. For this reason, quadratic equations are used for curve-fitting the relationship between the plate buckling coefficient and the thickness variation ratio. The average of errors between the computed and curve-fitted data is less than 0.1% with standard deviation less than 0.5% in all cases.
The curve-fitted plate buckling coefficients in Figure 5 are based on the minimum
1 2curve-fit
0.335 0.480 0.405pk δ δ= + +
1 2curve-fit
0.146 0.317 0.405pk δ δ= + +
1 2curve-fit
0.739 4 4pk δ δ= + +

Rev. A (Progress Report 15) 5/6/2003
Paper 2 - 9
thickness (t1) as shown in Equation (21). However, it would be more useful for practical design purposes, if the plate buckling coefficients are expressed in terms of the average thickness. This is because the current AA Specification is based on the average thickness. The relationship between the plate buckling coefficients based on the minimum and average thickness is obtained as follows:
( )1
24
2p pk k
δ=
+ (22)
resulting from
( )( ) ( )( )
2 1 2
2 222112 112 1
p pcr
avg
k E k EF
b tb t
π π
νν= =
−− and 1 2 2 1
1 1
1 22 2 2
avgt t t t tt t
δ+ + += = = .
It would be interesting to compare the plate buckling coefficient of a uniform thickness plate with the one of a tapered thickness plate using Equation (22) as shown in Figure 6.
0 0.2 0.4 0.6 0.8 1 1.2 1.4 1.6 1.8 23.6
3.8
4
4.2
4.4
4.6
(a)
0 0.2 0.4 0.6 0.8 1 1.2 1.4 1.6 1.8 20.2
0.3
0.4
0.5
0.6
0.7
0.8
(b)
Figure 6. Plate buckling coefficient comparisons between tapered and uniform thickness plates for (a) SSSS (b) SSFS and SSSF boundary conditions based on average thickness
SSSS tapered thickness
pk
uniform thickness (AA) kp
= 4.00( )
( )
2
2
4 0.739 4 4
2pk
δ δ
δ
+ +=
+
SSSF tapered thickness
SSFS tapered thickness
pk uniform thickness (AA) kp
= 0.405
( )( )
2
2
4 0.335 0.480 0.405
2pk
δ δ
δ
+ +=
+
( )( )
2
2
4 0.146 0.317 0.405
2pk
δ δ
δ
+ +=
+
δ
δ

Rev. A (Progress Report 15) 5/6/2003
Paper 2 - 10
The rigorous plate buckling coefficient keeps increasing as the thickness variation
ratio (δ) increases in SSFS boundary condition case, which implies that the current AA Specification is conservative for this case. However, in other cases, the current AA Specification is not conservative.
The equivalent slenderness ratios of tapered plate elements are obtained from introducing the rigorous plate buckling coefficients into Equation (18) as shown in Table 2. The rigorous equivalent slenderness ratios are linear-approximated in this table for practical design purposes. The errors due to linear approximations of the rigorous equivalent slenderness ratios are maintained within ±2%.
It is noted that the range of the thickness variation ratio (δ) is limited, since the curve-fitted equations are based on that range. The thickness variation ratios of all standard I-shaped sections with tapered thickness in the Aluminum Design Manual (2000b) fall into this range.
Table 2. Linear approximation of the equivalent slenderness ratio (λp) for component elements with linearly tapered thickness under uniform compression (0 < δ ≤ 2.0)
types of member
rigorous expression ( )pλ linear approx. ( )Lpλ AA Spec. ( )AA
pλ
[SSSS]
( )( )2
1.633 2
0.739 4 1 avg
bt
δ
δ δ
+ + +
( )1.63 0.03avg
bt
δ
+
1.6avg
bt
[SSFS]
( )2
1.633 2
0.335 0.480 0.405 avg
bt
δ
δ δ
+ + +
( )5.1 0.6avg
bt
δ
−
5.1avg
bt
[SSSF]
( )2
1.633 2
0.146 0.317 0.405 avg
bt
δ
δ δ
+ + +
5.2avg
bt
5.1avg
bt
The limit state stress for a linearly tapered flange element is determined from
introducing the equivalent slenderness ratios in Table 2 into the equations in Table 3. In Table 4, the shape factors under the limit states of the yield and ultimate stresses are provided.
Table 3. Limit state stress equations for a tapered flange element
approaches limit state stress
1avg
b St
≤ limit S1
limit state stress
1 2avg
bS St
< ≤ limit
S2
limit state stress
2avg
bSt
<
AA Specification
AAp cyF Fα= cy
AA
B FD
ακ− AA AA
p pF B Dλ= − 1AA
k BDκ
2AAp AA
p
k BEFλ
=
proposed linear approximation
Lp cyF Fα= cy
L
B FD
ακ− L L
p pF B Dλ= − 1L
k BDκ
2Lp L
p
k BEFλ
=
Note: ( )AA AAp avgb tκ λ= and ( )L L
p avgb tκ λ=
Rev. A (Progress Report 15) 5/6/2003
Paper 2 - 11
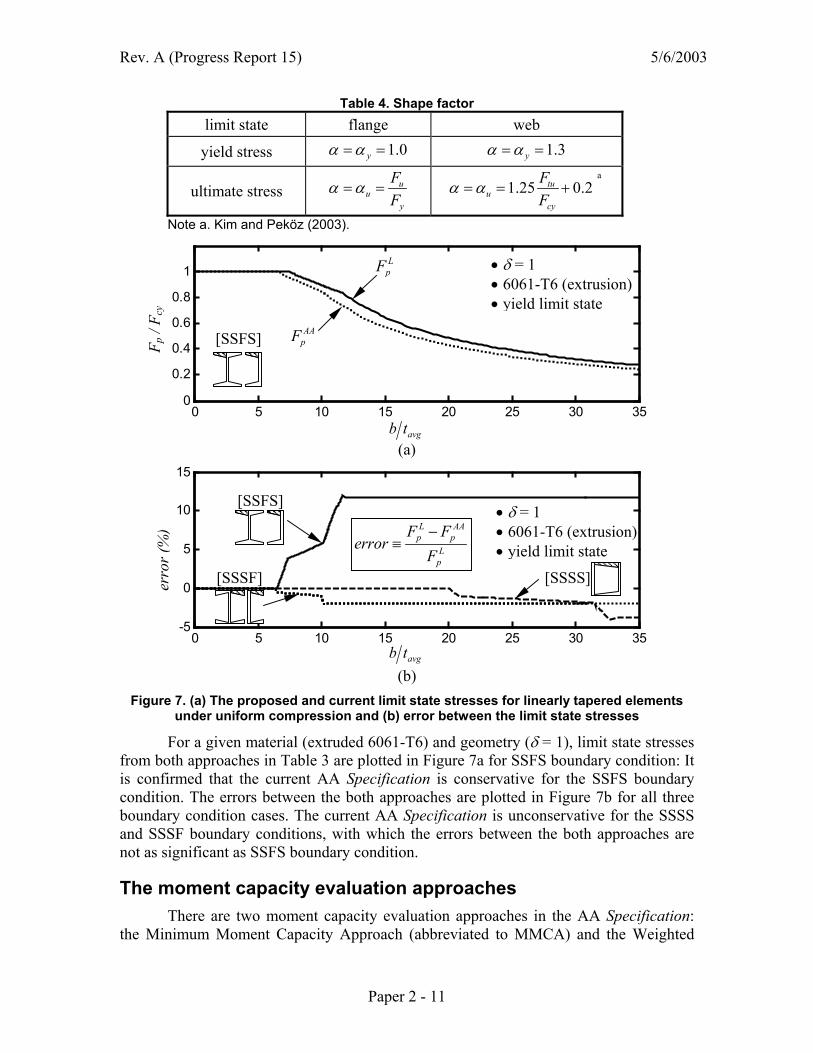
Table 4. Shape factor limit state flange web
yield stress 1.0yα α= = 1.3yα α= =
ultimate stress uu
y
FF
α α= = a
1.25 0.2tuu
cy
FF
α α= = +
Note a. Kim and Peköz (2003).
0 5 10 15 20 25 30 350
0.2
0.4
0.6
0.8
1
(a)
0 5 10 15 20 25 30 35-5
0
5
10
15
(b) Figure 7. (a) The proposed and current limit state stresses for linearly tapered elements
under uniform compression and (b) error between the limit state stresses
For a given material (extruded 6061-T6) and geometry (δ = 1), limit state stresses from both approaches in Table 3 are plotted in Figure 7a for SSFS boundary condition: It is confirmed that the current AA Specification is conservative for the SSFS boundary condition. The errors between the both approaches are plotted in Figure 7b for all three boundary condition cases. The current AA Specification is unconservative for the SSSS and SSSF boundary conditions, with which the errors between the both approaches are not as significant as SSFS boundary condition.
The moment capacity evaluation approaches There are two moment capacity evaluation approaches in the AA Specification:
the Minimum Moment Capacity Approach (abbreviated to MMCA) and the Weighted
L AAp p
Lp
F Ferror
F−
≡
erro
r (%
) F p
/ F c
y
LpF
AApF
• δ = 1 • 6061-T6 (extrusion) • yield limit state
[SSFS]
[SSFS]
avgb t
avgb t
[SSSF] [SSSS]
• δ = 1 • 6061-T6 (extrusion) • yield limit state

Rev. A (Progress Report 15) 5/6/2003
Paper 2 - 12
Average Stress Approach (abbreviated to WASA). The MMCA determine the minimum moment capacity amongst those obtained by multiplying the limit state stress of each component element by the elastic section modulus of an entire cross section. On the other hand, the WASA takes the average of limit state stresses of component elements based on the contributory area of each element. The averaged stress is multiplied by the section modulus to compute the moment capacity.
However, as shown by Kim and Peköz (2003), the weighted average stress equation is an approximatly linearized bending stress mesured at the mid-thickness of the flange. Thus, the correction in Table 5 was recommended. The similar correction is employed for sections with tapered thickness with slightly modified definition of hc, which is the depth of a section measured between the centroids of compression and tension flanges.
Table 5. Correction in the WASA
current WASA (WASA) proposed WASA (WASA2)
16
16
f f w wu
f w
F A F AM S
A A+
=+
16
16
f f w wu
f w c
F A F A hM SA A h
+ = +
where Ff = limit state stress for the flange, Fw = limit state stress for the web, Af = entire compression side flange area, Aw = entire web area, S = section modulus = I /(h/2), and h = entire depth of a section. See Figure 8 for further details.
As an alternative to the proposed WASA, the Total Moment Capacity Approach (abbreviated to TMCA) was also introduced in the study. In the TMCA, the limit state stress from each component element is multiplied by the contributory section modulus to compute the contributory moment capacity. Afterwards, all moment capacities from component elements are added to obtain a member moment capacity. For example, the moment capacity of an I-shaped section shown in Figure 8 can be expressed as Equation (23) based on the TMCA.
16u f f c w w oM F A h F A h= + (23)
The modified WASA and TMCA are expected to be more accurate than MMCA. Fig. 8. Contributions made by component elements to a moment capacity of an Ι- section
Parametric Study of I-Shaped Sections with Tapered Thickness The moment capacities are computed for all the 36 standard I-shaped sections
with tapered thickness listed in the Aluminum Design Manual (2000b), abbreviated to
Ff Af
Ff Af Fw
Fw
23 oh
2oh
Af
Af
Aw hc h ho
t1 t2
w

Rev. A (Progress Report 15) 5/6/2003
Paper 2 - 13
ADM, using the approaches developed for tapered thickness element. Afterwards, the same sections are analyzed using the finite element method. These sections are noted as Series 1 of the parametric study. Since the slenderness factors ( )y crF Fλ = of all
Series 1 sections are in stocky range (λ < 0.673) based on the American Iron and Steel Institute Specification for the Cold-Formed Steel Structural Members (1996), additional series sections are created through reducing the thickness of the standard sections by 60%. These sections are noted as Series 2.
The finite element program, ABAQUS developed by Hibbitt, Karlsson and Sorensen, Inc. is used for the analyses. The boundary conditions are determined as shown in Figure 9. To avoid singularity of the stiffness matrix, one longitudinal degree of freedom is restrained at the span center. Equal and opposite moments are applied at member ends, at which rigid beam elements are attached to maintain the stability of analyses during bending. Each member length is set to more than or equal to four times the member depth so that the complication at member ends disappear at the member middle. Simultaneously, the length of is set to multiple (3 to 8) times the critical local buckling length, which induces minimum buckling load.
Twenty noded quadratic hexahedral solid elements with reduced integration are used to fully take account of tapered thickness. The parametric study sections are extrusions of 6061-T6 with minimum material properties in the ADM (2000b). Since the moment capacity variation resulting from the ultimate strain variation is not significant as shown in Kim and Peköz (2003), the ultimate strain is set to 8%, which is the same as the minimum percent elongation in the Aluminum Standards and Data (2000c).
Fig. 9. Model geometry of an I-shaped section for a parametric study
For material model, isotropic hardening is used, since this study deals with monotonic loading. Due to uncertainty after reaching the ultimate stress, it is assumed that the whole member reaches the failure when the von-Mises stress at a single point of a member reaches the ultimate stress. This occurs when the member is too compact to buckle. On the other hand, the failure of the member can also be initiated by buckling when the member is less compact. In this case, the peak load of the member is obtained before any point of the member reaches the ultimate stress. In this study, these two possibilities of failure are considered simultaneously to find an ultimate load factor.

Rev. A (Progress Report 15) 5/6/2003
Paper 2 - 14
Prior to the non-linear analyses, elastic eigen-value analyses are conducted to generate initial geometric imperfections. The maximum amplitude of imperfections is determined based on the industrial production limitation provided by the Aluminum Standards and Data (2000c).
0.4 0.6 0.8 1 1.2 1.4 1.6
0.6
0.8
1
1.2
1.4
1.6
1.8M
FEM
/ M
appr
oach
es
MFEM / MAA-Y-MMCA-UNIMFEM / MAA-Y-MMCA-TAP
MFEM / Mapproaches mean c.o.v
1.35 0.092
1.266 0.073
(a) y crλ = F F
0.25 0.3 0.35 0.4 0.45 0.5 0.55 0.6
0.7
0.8
0.9
1
1.1
MFE
M /
Map
proa
ches
MFEM / MAA-U-WASA2-UNIMFEM / MAA-U-WASA2-TAP
MFEM / Mapproaches mean c.o.v1.024 0.0211.019 0.018
(b) y crλ = F F
0.7 0.8 0.9 1 1.1 1.2 1.3 1.4 1.5 1.60.6
0.8
1
1.2
1.4
MFE
M /
Map
proa
ches
MFEM / MAA-U-WASA2-UNIMFEM / MAA-U-WASA2-TAP
MFEM / Mapproaches mean c.o.v1.197 0.0461.101 0.053
(c) y crλ = F F
Fig. 10. Influence of employing the plate buckling coefficient for a tapered thickness plate (a) Figure 7 of Paper 2 (Rev. O) (b) Series 1 (Rev. A) (c) Series 2 (Rev. A)
As a first step, the influence of considering the rigorous plate buckling coefficient
[Series 1] 36 AA standard
tapered I-sections
[Series 2] 36 tapered I-sections with 60% thickness
reduction
Series 1 Series 2
72 tapered I - sections

Rev. A (Progress Report 15) 5/6/2003
Paper 2 - 15
for a tapered thickness plate in the AA Specification is investigated as shown in Figure 10. The approach abbreviations used in Figure 10 are denoted as follows: For example, MAA-U-WASA2-UNI is the moment capacity evaluated by the AA Specification based on the limit state of the Ultimate stress using the modified Weighted Average Stress Approach. Limit state stress of this approach is computed based on the Uniform thickness ( AA
pF in Table 3), while the other approach in this figure is based on the Tapered thickness ( L
pF in Table 3) developed in this study. The horizontal axis is the slenderness factor ( y crF Fλ = ). In the vertical axis, the moment capacities obtained from the finite element analyses are normalized by those based on the approaches specified in the figure.
0.25 0.3 0.35 0.4 0.45 0.5 0.55 0.60.4
0.6
0.8
1
1.2
1.4
MFE
M /
Map
proa
ches
MFEM / MAA-Y-MMCA-UNIMFEM / MAA-Y-WASA-UNIMFEM / MAA-U-WASA2-TAPMFEM / MAA-U-TMCA-TAP
MFEM / Mapproaches mean c.o.v1.27 0.0391.211 0.0321.026 0.021.018 0.019
y crλ = F F
(a)
0.7 0.8 0.9 1 1.1 1.2 1.3 1.4 1.5 1.6
0.2
0.4
0.6
0.8
1
1.2
1.4
1.6
1.8
MFE
M /
Map
proa
ches
MFEM / MAA-Y-MMCA-UNIMFEM / MAA-Y-WASA-UNIMFEM / MAA-U-WASA2-TAPMFEM / MAA-U-TMCA-TAP
MFEM / Mapproaches mean c.o.v1.43 0.0881.257 0.0411.102 0.0521.099 0.055
y crλ = F F
(b) Fig. 11. Comparison between current and proposed approaches (a) Series 1 (b) Series 2
[Series 1] 36 AA standard
tapered I-sections
[Series 2] 36 tapered I-sections with
60% reduced thickness

Rev. A (Progress Report 15) 5/6/2003
Paper 2 - 16
As seen in Figure 10, the approach considering tapered thickness plate buckling coefficient improves significantly the member capacity for rather slender range sections (Series 2 sections). This is because most Series 2 sections fall into the inelastic or post buckling range, in which the limit state stress is considerably affected by the equivalent slenderness ratio. In Figure 11, the currently available two approaches in the AA Specification (the first two approaches) are compared to the proposed two approaches (the last two approaches). The similar rule to the last figure is applied to denote the abbreviations. As seen in Figure 11, a significant improvement is made in the proposed approaches for a wide range of slenderness. In addition, virtually no difference is observed between two proposed approaches. The moment capacities obtained from all four approaches and the finite element analyses normalized by the yield moment capacities are listed in Table 10 at the Appendix.
Experiments and FEM Simulation Flexural tests for three AA standard I-shaped sections with tapered thickness (I-
3x1.96) are conducted to further support the approaches developed in this study. The dimensions of the section are shown in Table 10 in the Appendix.
Fig. 12. Schematic test setup side view: All dimensions are in millimeters and not to scale
Before the tests are conducted, the test setup is simulated using the finite element method. All modeling issues are similar to those for the Series 1 and 2 parametric studies except for the followings: First, the applied load is not pure bending but two-point bending as shown in Figure 12. Second, the lateral supports spacing is determined from an additional parametric study to find an optimum spacing, which is practically large enough for an experimental setup as well as small enough to simulate the continuous lateral support spacing. The determined spacing is also employed in the physical tests. Third, spreader plates are added, which are connected to the specimen using bi-linear spring elements. The bi-linear spring element is to simulate the actual contacting behavior transferring not tension but compression at the interface between the spreader plate and the specimen. This is reasonable, because no moment connection is used in the actual tests. Fourth, the median of six tensile coupon test results obtained from one of the specimens is introduced into the finite element analyses instead of using the minimum in the ADM (2000b) as compared in Table 6.
Far from uniform flange cases of Kim and Peköz (2003), nearly no ripple is formed during tests. Thus, the beam does not seem to be sensitive to such local deformations. The first beam is not successful due to lack of stiffness at the lateral supports; large lateral S-shaped deformations occur. For this reason, the first beam reaches the peak too early as seen in Figure 13. After the test setup is reinforced against

Rev. A (Progress Report 15) 5/6/2003
Paper 2 - 17
lateral movements, there are no such problems in the remaining two flexural tests. However, the last two tests are discontinued at a vertical displacement approximately between 150mm and 170mm at the span center due to the limitation of the test setup. Up to this stage, load factor-displacement graphs keep increasing as observed in Figure 13.
Table 6. Comparison of material properties of 6061-T6
description Fty (MPa)1 Ftu (MPa) εu E (MPa)
median of tests 281.18 297.37 0.068 69458
average of tests 281.87 299.03 0.070 69679
6061-T6 average2 275.60 310.05 N.A. 68900
6061-T6 minimum2 241.15 261.82 N.A. 69589 Note 1. Obtained based on the 2% offset method
2. The ADM (2000b)
0 20 40 60 80 100 120 140 160 1800
0.2
0.4
0.6
0.8
1
1.2
1.4
DESCRIPTION MAX-LF DISP-XL TEST 1 1.123 50.56TEST 2 1.173 168.5TEST 3 1.174 147.2 FEM 1.197 167.4
DISP-XL = Displacement at max LF
SCVD (Span Center Vertical Displacement, mm)
LF = M
u /M
y
Fig. 13. Load factor-displacement result comparison for Ι-3x1.96
The load factor-displacement curves obtained from the last two physical tests are closely simulated by the finite element analysis. In the analysis, before the Von-Mises stress at a single point reaches the ultimate stress failure criteria, there was no stability problem. For this reason, the load factor keeps increasing and the peak load factor is determined at the time reaching the ultimate stress failure criteria.
The maximum load factors from the last two physical tests are averaged and compared to the current AA approaches (MMCA and WASA) and those developed in this study (WASA2 and TMCA) in Table 7. The proposed approaches are much closer to the test results than the current ones. Thus, in addition to the parametric study, the test results further validate the proposed approaches in this study. The moment ratios in Table 7 are slightly smaller than the ones in Figure 11 for the same section, which should be due to mainly discontinuity of tests resulting from the limitation of the test setup. The

Rev. A (Progress Report 15) 5/6/2003
Paper 2 - 18
moment capacities based on the available approaches in the table are recalculated, since the material properties used for computations are not from the minimum ones in the ADM (2000b) but from tensile coupon tests.
Table 7. Comparison of test results to the available approaches
current approaches proposed approaches
TESTS
Y-MMCA-UNI
MM
TESTS
Y-WASA-UNI
MM
TESTS
U-WASA2-TAP
MM
TESTS
U-TMCA-TAP
MM
1.174 1.141 0.967 0.964
Application to the AA Specification The allowable stress equations based on the limit states of the yield and ultimate
stresses are summarized for tapered thickness elements in Table 8. The final allowable stress equations for tapered thickness elements should be determined by either Procedure I or II as shown in Table 9. The equations given in these tables are consistent with those proposed in Kim and Peköz (2003) for uniform thickness elements. Table 8. Proposed limit state stress expressions for linearly tapered component elements
under uniform compression (0 < δ ≤ 2.0)
BC
allowable stress
1avg
b St
≤ limit
S1
allowable stress
1 2avg
bS St
< ≤ limit S2
allowable stress
2avg
bSt
<
y cyay
y
FF
nα
= ( )1.63 0.03
y cyB FD
αδ
−
+
SSSS u cy
auu
FF
nα
= ( )1.63 0.03
nyu cynu
B F
D
α
δ
−
+
( )1 1.63 0.03
ay au
y avg
F F
bB Dn t
δ
= =
− +
( )1
1.63 0.03k B
Dδ+
( )2
1.63 0.03
ay au
y avg
F F
k BEn b tδ
= =
+
y cyay
y
FF
nα
= ( )5.1 0.6
y cyB FD
αδ
−
−
SSFS u cy
auu
FF
nα
= ( )5.1 0.6
nyu cynu
B F
D
α
δ
−
−
( )1 5.1 0.6
ay au
y avg
F F
bB Dn t
δ
= =
− −
( )1
5.1 0.6k B
Dδ−( )
2
5.1 0.6
ay au
y avg
F F
k BEn b tδ
= =
−
y cyay
y
FF
nα
= 5.2
y cyB FD
α−
SSSF u cy
auu
FF
nα
= 5.2
nyu cynu
B F
D
α−
1 5.2ay auy avg
bF F B Dn t
= = −
1
5.2k B
D 2
5.2ay auavg
k BEF Fb t
= =
Note. See Table 4 for the shape factors (αy, αu)
Table 9. allowable stress for compression component element
Procedure I ( )min ,a ay auF F F= (24)
Procedure II ( ) ( )0.25 min 1.25 ,a ay au ay ay auF F F F F F= + − ≤ (25)
Rev. A (Progress Report 15) 5/6/2003
Paper 2 - 19
Conclusions Initial and geometric stiffness matrices for a plate with tapered thickness are
derived for the finite strip analysis program, CUFSM. Using the CUFSM program with the derived stiffness matrices, parametric studies are conducted to find a relationship between the plate buckling coefficient (kp) and thickness variation ratio (δ).
Using the obtained relationship, equivalent slenderness equations are proposed for the limit state stress computation of component elements with tapered thickness, while the frame of the AA Specification (2000a) is maintained.
Developed equivalent slenderness equations are employed to compute the moment capacities of I-shaped sections with tapered thickness for a parametric study. The modified AA Specification considering the plastic-ultimate capacity as well as the previously developed precise moment capacity evaluation approaches, such as the modified WASA and the TMCA, are also used to compute the moment capacities of the parametric study sections.
It is found that the proposed approaches work much better for a wide range of slenderness than the current specification approaches, compared to the finite element analyses. Experimental study for the same type of sections additionally supports the proposed approaches.
The proposed approaches could also be used to develop more slender sections with tapered thickness than the current standard ones mostly falling into the stocky range. The allowable stress equations are summarized for the application to the AA Specification (2000a).
Acknowledgements This study is sponsored by the U.S. Department of Energy and the Aluminum Association. Their sponsorship is gratefully acknowledged.
References The Aluminum Association (2000a). The Specification for Aluminum Structures. The Aluminum Association (2000b). The Aluminum Design Manual. The Aluminum Association (2000c). Aluminum Standards and Data. Aluminum Company of America (1960). Alcoa Structural Handbook, A Design Manual
for Aluminum. American Institute of Steel Construction (1998). Manual of Steel Construction. Vol.1. American Iron and Steel Institute (1996). Specification for the Cold-Formed Steel
Structural Members. Chehil, D.S. and Dua, S.S. (1973). “Bucking of rectangular plates with general variation
in thickness.” Journal of Applied Mechanics Transaction, ASME, 40(3), 745-751 Cheung, Y.K., (1976). Finite strip method in structural analysis. Pergamon Press, New
York Kim, Y. and Peköz, T. (2003) “Laterally supported aluminum flexural members with
symmetric cross sections” Under Preparation For Publication – Paper 1 for AA EDTF meeting Jan. 21. 2003 Pittsburgh.
Kobayashi, H., Sonoda, K. , (1990) "Buckling of rectangular plates with tapered thickness." Journal of Structural Engineering, ASCE, 116(5), 1278-1289

Rev. A (Progress Report 15) 5/6/2003
Paper 2 - 20
McGuire, W., Gallagher, R.H., Ziemian, R.D. (2000) Matrix Structural Analsis. 2nd Ed. John Wiley & Sons, Inc. New York
Mizusawa, T., (1993), “Buckling of rectangular Mindlin plates with tapered thickness by the spline strip method”. International J. of Solids Structures 30(12), 1663-1677
Ohga, M., Shigematsu, T., Kawaguchi, K., (1995) “Buckling analysis of thin-walled members with variable thickness”. J. of Struct. Engineering, ASCE, 121(6), 919-924
Pines, S., and Gerard, G. (1947). “Instability analysis and design of an efficiently tapered plate under compressive loading.” J. of the Aeronautical Sciences, 14(10), 594-599
Schafer, B.W. (1997), Cold-Formed Steel Behavior and Design: Analytical and Numerical Modeling of Elements and Members with Longitudinal Stiffeners. PhD. Thesis, Cornell University, Ithaca, NY
Wittrick, W.H., and Ellen, C.H. (1962). “Buckling of tapered rectangular plates in compression.” The Aeronautics Quarterly, 13(4), 308-326
Appendix Table 10. Dimensions and moment capacities (a) Series 1 (b) Series 2
(a)
Designation Depth (h)
Width (w)
Flange thk (tf)
Web thk (tw)
Slope (t2-t1)/b0
Y-MMCA-UNI
y
MM
Y-WASA-UNI
y
MM
U-WASA2-TAP
y
MM
U-TMCA-TAP
y
MM
FEM
y
MM
y
cr
Fλ =
F
WF2x1.43 50.8 50.8 5.893 4.775 1/11.4 1.000 1.027 1.280 1.281 1.286 0.293 WF2.5x1.80 63.5 50.8 6.274 6.350 1/7.00 1.000 1.040 1.282 1.291 1.323 0.259 WF4x4.76 101.6 101.6 9.398 7.950 1/11.3 1.000 1.029 1.249 1.253 1.249 0.364 WF5x6.49 127.0 127.0 10.541 7.950 1/13.6 1.000 1.027 1.203 1.206 1.217 0.422 WF6x7.85 152.4 150.6 11.455 6.350 1/15.6 1.000 1.021 1.153 1.155 1.176 0.496 WF6x8.30 152.4 152.4 11.455 7.950 1/15.6 1.000 1.026 1.162 1.164 1.184 0.478 WF6x9.18 152.4 155.7 11.455 11.125 1/15.6 1.000 1.034 1.178 1.183 1.208 0.446 WF8x11.2 203.2 201.7 11.633 7.950 1/18.9 0.922 0.956 1.063 1.065 1.121 0.629 WF8x11.8 203.2 203.2 11.633 9.525 1/18.9 0.922 0.961 1.073 1.075 1.131 0.606 WF8x13.0 203.2 206.5 11.633 12.700 1/18.9 0.922 0.972 1.091 1.095 1.143 0.567
I3x1.96 76.2 59.2 6.528 4.318 1/18.9 1.000 1.029 1.245 1.250 1.268 0.315 I3x2.25 76.2 61.2 6.528 6.375 1/6.00 1.000 1.039 1.265 1.273 1.303 0.297 I3x2.59 76.2 63.8 6.528 8.865 1/6.00 1.000 1.050 1.284 1.297 1.333 0.284 I4x2.64 101.6 67.6 7.341 4.826 1/6.00 1.000 1.034 1.235 1.242 1.271 0.325 I4x3.28 101.6 71.1 7.341 8.280 1/6.00 1.000 1.052 1.266 1.279 1.322 0.298 I5x3.43 127.0 76.2 8.204 5.334 1/6.00 1.000 1.038 1.231 1.238 1.250 0.333 I5x4.23 127.0 79.8 8.204 8.814 1/6.00 1.000 1.055 1.261 1.274 1.314 0.305 I5x5.10 127.0 83.3 8.204 12.548 1/6.00 1.000 1.070 1.287 1.306 1.344 0.290 I6x4.30 152.4 84.6 9.017 5.842 1/6.00 1.000 1.041 1.229 1.236 1.243 0.339 I6x5.10 152.4 112.8 9.017 8.712 1/6.00 1.000 1.044 1.237 1.247 1.250 0.386 I6x5.96 152.4 90.7 9.017 11.811 1/6.00 1.000 1.068 1.276 1.292 1.331 0.299 I7x5.27 177.8 93.0 9.881 6.350 1/6.00 1.000 1.044 1.227 1.236 1.235 0.344 I7x6.05 177.8 95.5 9.881 8.763 1/6.00 1.000 1.055 1.248 1.259 1.289 0.325 I7x6.92 177.8 98.0 9.881 11.430 1/6.00 1.000 1.066 1.267 1.282 1.332 0.306 I8x6.35 203.2 101.6 10.693 6.858 1/6.00 1.000 1.045 1.227 1.235 1.235 0.351 I8x7.96 203.2 105.9 10.693 11.201 1/6.00 1.000 1.065 1.260 1.274 1.326 0.316 I8x8.81 203.2 108.2 10.693 13.513 1/6.00 1.000 1.073 1.275 1.291 1.328 0.305 I9x7.51 228.6 110.0 11.506 7.366 1/6.00 1.000 1.047 1.226 1.235 1.211 0.356
I10x8.76 254.0 118.4 12.370 7.874 1/6.00 1.000 1.048 1.225 1.234 1.228 0.360 I10x10.4 254.0 121.9 12.370 11.354 1/6.00 1.000 1.063 1.251 1.264 1.293 0.332 I10x12.1 254.0 125.5 12.370 15.088 1/6.00 1.000 1.076 1.274 1.290 1.328 0.309 I12x11.0 304.8 127.0 13.665 8.890 1/6.00 1.000 1.055 1.225 1.235 1.217 0.364 I12x12.1 304.8 129.0 13.665 10.871 1/6.00 1.000 1.063 1.245 1.257 1.236 0.345 I12x14.1 304.8 133.4 16.586 11.684 1/6.00 1.000 1.055 1.244 1.255 1.243 0.306 I12x15.6 304.8 136.1 16.586 14.351 1/6.00 1.000 1.064 1.259 1.272 1.301 0.291 I12x17.3 304.8 139.2 16.586 17.450 1/6.00 1.000 1.072 1.274 1.290 1.349 0.275

Rev. A (Progress Report 15) 5/6/2003
Paper 2 - 21
(b) Designation Depth
(h) Width
(w) Flange thk
(tf) Web thk
(tw) Slope
(t2-t1)/b0 Y-MMCA-UNI
y
MM
Y-WASA-UNI
y
MM
U-WASA2-TAP
y
MM
U-TMCA-TAP
y
MM
FEM
y
MM
y
cr
Fλ =
F
60%thin_WF2x1.43 50.8 50.8 2.357 1.910 1/28.50 0.827 0.878 0.977 0.978 1.066 0.761 60%thin_WF2.5x1.8 63.5 50.8 2.510 2.540 1/17.50 0.865 0.934 1.049 1.053 1.122 0.666 60%thin_WF4x4.76 101.6 101.6 3.759 3.180 1/28.25 0.655 0.728 0.831 0.831 0.958 0.937 60%thin_WF5x6.49 127.0 127.0 4.216 3.180 1/34.00 0.584 0.658 0.734 0.733 0.869 1.083 60%thin_WF6x7.85 152.4 150.6 4.582 2.540 1/39.00 0.531 0.584 0.635 0.635 0.765 1.269 60%thin_WF6x8.30 152.4 152.4 4.582 3.180 1/39.00 0.527 0.601 0.657 0.656 0.788 1.225 60%thin_WF6x9.18 152.4 155.7 4.582 4.450 1/39.00 0.520 0.619 0.697 0.696 0.842 1.142 60%thin_WF8x11.2 203.2 201.7 4.653 3.180 1/47.25 0.402 0.474 0.513 0.512 0.636 1.601 60%thin_WF8x11.8 203.2 203.2 4.653 3.810 1/47.25 0.400 0.499 0.538 0.537 0.665 1.542 60%thin_WF8x13.0 203.2 206.5 4.653 5.080 1/47.25 0.396 0.526 0.584 0.582 0.699 1.441
60%thin_I3x1.96 76.2 59.2 2.611 1.727 1/15.00 0.780 0.838 0.965 0.967 1.036 0.807 60%thin_I3x2.25 76.2 61.2 2.611 2.550 1/15.00 0.764 0.846 1.007 1.009 1.070 0.759 60%thin_I3x2.59 76.2 63.8 2.611 3.546 1/15.00 0.744 0.852 1.029 1.033 1.086 0.721 60%thin_I4x2.64 101.6 67.6 2.936 1.930 1/15.00 0.767 0.836 0.950 0.953 1.025 0.830 60%thin_I4x3.28 101.6 71.1 2.936 3.312 1/15.00 0.743 0.852 1.022 1.026 1.075 0.756 60%thin_I5x3.43 127.0 76.2 3.282 2.134 1/15.00 0.760 0.823 0.937 0.940 1.018 0.848 60%thin_I5x4.23 127.0 79.8 3.282 3.526 1/15.00 0.739 0.854 1.011 1.015 1.068 0.773 60%thin_I5x5.10 127.0 83.3 3.282 5.019 1/15.00 0.719 0.870 1.060 1.066 1.104 0.730 60%thin_I6x4.30 152.4 84.6 3.607 2.337 1/15.00 0.752 0.810 0.924 0.928 1.004 0.865 60%thin_I6x5.10 152.4 112.8 3.607 3.485 1/15.00 0.566 0.688 0.875 0.877 0.941 0.975 60%thin_I6x5.96 152.4 90.7 3.607 4.724 1/15.00 0.720 0.866 1.043 1.048 1.088 0.754 60%thin_I7x5.27 177.8 93.0 3.952 2.540 1/15.00 0.750 0.801 0.914 0.918 0.987 0.878 60%thin_I7x6.05 177.8 95.5 3.952 3.505 1/15.00 0.737 0.851 0.967 0.971 1.038 0.825 60%thin_I7x6.92 177.8 98.0 3.952 4.572 1/15.00 0.725 0.865 1.017 1.022 1.075 0.774 60%thin_I8x6.35 203.2 101.6 4.277 2.743 1/15.00 0.742 0.788 0.903 0.907 0.988 0.895 60%thin_I8x7.96 203.2 105.9 4.277 4.481 1/15.00 0.723 0.860 0.992 0.997 1.059 0.801 60%thin_I8x8.81 203.2 108.2 4.277 5.405 1/15.00 0.714 0.871 1.031 1.036 1.088 0.768 60%thin_I9x7.51 228.6 110.0 4.602 2.946 1/15.00 0.738 0.778 0.893 0.898 0.975 0.910
60%thin_I10x8.76 254.0 118.4 4.948 3.150 1/15.00 0.737 0.772 0.886 0.890 0.965 0.921 60%thin_I10x10.4 254.0 121.9 4.948 4.542 1/15.00 0.723 0.840 0.956 0.960 1.032 0.843 60%thin_I10x12.1 254.0 125.5 4.948 6.035 1/15.00 0.711 0.873 1.018 1.023 1.080 0.780 60%thin_I12x11.0 304.8 127.0 5.466 3.556 1/15.00 0.760 0.783 0.882 0.887 0.963 0.935 60%thin_I12x12.1 304.8 129.0 5.466 4.348 1/15.00 0.752 0.822 0.922 0.927 1.007 0.881 60%thin_I12x14.1 304.8 133.4 6.634 4.674 1/15.00 0.862 0.915 0.975 0.980 1.063 0.786 60%thin_I12x15.6 304.8 136.1 6.634 5.740 1/15.00 0.856 0.952 1.013 1.019 1.102 0.743 60%thin_I12x17.3 304.8 139.2 6.634 6.980 1/15.00 0.850 0.968 1.052 1.058 1.140 0.700
Note. All dimensions are in millimeters.
Nomenclature αf = the ultimate shape factor for flange αu = the ultimate shape factor αw = the ultimate shape factor for web αy = the yield shape factor δ = the thickness variation ratio = (t2-t1)/t1 εu = strain at the ultimate stress = the ultimate strain κ = constant for equivalent slenderness ratio depending on the plate buckling coefficient λ = slenderness factor = (Fy/Fcr)0.5 λp = equivalent slenderness ratio
AApλ = equivalent slenderness ratio based on the AA Specification using uniform average
thickness Lpλ = equivalent slenderness ratio based on the rigorous tapered plate buckling coefficient
and linearly approximated for practical design purposes. ν = Poisson’s ratio Af = entire compression or tension side flange area

Rev. A (Progress Report 15) 5/6/2003
Paper 2 - 22
Aw = entire web area a = length of a plate element B = buckling formula constant intersecting vertical axis for zero width-to-thickness ratio b = width of a plate element or a flange element D = buckling formula constant for slope of the inelastic buckling range E = Young’s modulus F = limit state stress for the flange or web Fa = the (final) allowable stress Fau = the allowable stress based on the ultimate limit state Fay = the allowable stress based on the yield limit state Fcr = minimum buckling stress Ff = limit state stress for the flange Fp = limit state stress of a component plate element Fp
AA = limit state stress of a component plate element based on the AA Specification using uniform average thickness
FpL = limit state stress of a component plate element based on the rigorous tapered plate
buckling coefficient. The equivalent slenderness ratio based on the plate buckling coefficient is linearly approximated for practical design purposes.
Ftu = tensile ultimate stress Fty = tensile yield stress Fu = the ultimate stress Fw = limit state stress for the web Fy = the yield stress h = depth of the web element or the entire depth of an I-shaped section hc = depth of an I-shaped section between centroids of flanges ho = depth of the purely unsupported portion of web I = total moment of inertia k1 = a coefficient to determine slenderness limit S2 k2 = a coefficient to determine limit state stress when width-to-thickness is larger than S2 kp = plate buckling coefficient based on the average or uniform thickness
1pk = plate buckling coefficient based on the minimum thickness
LF = load factor = Mu/My or Pu/Py Mu = total moment capacity or moment capacity from FEM or test n = an exponent used for Ramberg-Osgood equation nu = factor of safety on ultimate stress ny = factor of safety on yield S = section modulus S1 = width-to-thickness distinguishing yielding and inelastic buckling range S2 = width-to-thickness distinguishing inelastic and elastic buckling range t = thickness of a plate element tavg = average thickness of a plate with linearly tapering thickness tf = uniform flange thickness t1 = smallest flange thickness of a plate with tapered thickness t2 = largest flange thickness of a plate with tapered thickness tw = web thickness w = width of an entire flange of an I-shaped section