altria report
TRANSCRIPT

Altria Inc.
The Fund @ Sprott Equity Research
Sell, Current: $52.50, Price Target: $44.64 March 11, 2015
Spyridoula Maria Karasavva BIBCandidate 2017 Global Financial Management and Systems Equity Analyst [email protected] http://fund.ssb.carleton.ca
Kyle Stolys BCom Candidate 2016 Finance Sector Manager [email protected]
Updated Investment Thesis
5-Year Performance
Source: Bloomberg
Decline in cigarette volume
The cigarette industry has been experiencing a long term 3-4% annual decline. Despite a rising market share in Marlboro, Altria’s cigarette shipment volume has been following industry’s lead and has been declining around 3% yoy.
Well-run low maintenance business with very skilled Management
Strengthening Taxes and Litigation pressure
Dividend yield
Altria’s CAPEX on average equals around 3-4% of the company’s Cash from Operations.
Altria also manages to operate efficiently using negative working capital while increases its
profitability.
New government proposals for excise tax increases focusing on cigarettes but also including machine made large cigars, pipe tobacco and chewable tobacco-derived nicotine
products as well as the so far unregulated e-cigarettes.
Altria has a long history of paying substantial dividends and increasing them at a high rate.
Current yield is 3.70%, which is actually quite low compared the historical yield for the
stock. However, high levels of debt and stagnant forecasted EPS growth creates concerns
as to whether the impressive growth rate in dividends can be sustained.
Stronger U.S. consumer
Increases in employment gains result in higher consumer spending and a potential shift
from discount to more premium products.
Page 1

The Fund @ Sprott | Equity Research
Page 2
Company Overview Altria Inc (MO) is a holding company which is currently the largest tobacco and
smokeless tobacco manufacturer in the United States. The company currently has 49.8%
of the US tobacco market through its subsidiary Philip Morris USA. Philip Morris USA
sells Marlboro, Virginia Slims, and discount brands such as Basic. Philip Morris
International (NYSE:PM) used to be also an Altria subsidiary until it was spun off in
2008. Apart from tobacco, other subsidiaries of the company include US Smokeless
Tobacco Co. (various smokeless tobacco products such as chewing tobacco), NuMark (e-
cigarettes), Michelle Wine Estates (Wine) and Philip Morris Capital Corporation
(Financial, primarily leasing). In addition, the company has a minority stake (27%) in
SABMiller Plc., a multinational brewing and beverage company based in UK with $91
billion in market cap. SABMiller was formed in 2002 when MO announced an agreement
with SAB to merge Miller Brewing Company into South African Breweries. MO received
430,000,000 shares or 36% of economic interest in SABMiller.
Industry Dynamics Declining Cigarette Sales Volume
USA faces significant governmental and private sector actions, including efforts aimed at
reducing the incidence of tobacco use and efforts seeking to hold PM USA responsible for
the adverse health effects associated with both smoking and exposure to environmental
tobacco smoke. These actions, combined with the diminishing social acceptance of
smoking, have resulted in a 3 to 4% average annual decrease in cigarette industry volume,
and we expect that these factors will continue to reduce cigarette consumption levels.
Consolidation and Restructuring
Tobacco companies have been able to overcome the industry decline and produce strong
cash flows by constantly consolidating operations and restructuring themselves to
eliminate unnecessary costs. As an industry who is limited to a small marketing and
promotion footprint by law, much of their business model tends to be cost driven. This
focus of restructuring operations and maximizing efficiencies has led to solid margins and
consistent cash flow.
Source: Bloomberg, Student Estimates Source: Bloomberg
20,000
21,000
22,000
23,000
24,000
25,000
26,000
20
11
20
12
20
13
20
14
20
15
E
20
16
E
20
17
E
20
18
E
20
19
E
Smokeable products Non Smokeable products Wine all other
Figure 1: Revenue Breakdown by Product Figure 2: Market Share Breakdown
Marlboro, 44%
Other Premium,
3%
Discount, 4%
Non-Altria, 50%

Growth/Regulation in E-cigarettes
E-cigs have exploded in growth in part due to minimal regulation as well as being an
affordable alternative to traditional tobacco products. While they are not a tobacco product
specifically, they are a nicotine delivery device and many of the major players in the
tobacco industry have taken investment in to the substitute product. Some estimations
believe that e-cigs could pass traditional cigarettes in usage by 2023. While this seems
certainly possible at the current pace, there is a great likelihood of future regulation that
could slow down e-cigarettes’ growth.
Ban on Menthols
When legislation passed in 2009 to eliminate flavored cigarettes from the US marketplace,
one flavor was permitted to stay, menthol. Menthol cigarettes are a more palatable
alternative to traditional cigarettes and have been gaining sizable market share during the
cigarette consumption decline of the last half century. As of 2014 menthol cigarettes
amounted for 28% to 30% of the US cigarette market share. The EU has already
committed to banning the sale of menthols but the FDA has delayed making a judgment
upon them. The concern many hold is that menthol cigarettes are what younger
generations get hooked on first due to their milder nature. A ban on menthols would be
extremely detrimental to tobacco sales if there was no alternative readily available for
adoption.
Taxes and Litigation
Federal, state and local excise taxes have increased substantially over the past decade, far
outpacing the rate of inflation. The President’s 2015 Budget proposes significant tax
increases for all tobacco products, including machine made large cigars, pipe tobacco and
chewable tobacco-derived nicotine products and the so far unregulated e-cigs. The
proposed budget would increase the FET by $0.94 per pack raising the total FET to $1.95
per pack. On a brighter side, as of October 2015 the fed government along with 22 states
adopted a weight-based tax methodology for smokeless tobacco. This will result in lower
excise tax expenses for Altria as the ad valorem method which was being used until now
resulted in more tax being paid on premium products than was paid on lower-priced
products of equal weight.
The Fund @ Sprott | Equity Research
Source: Bloomberg Industries U.S. E-Cigarette Model
Page 3
Figure 3: Projected Cigarette/E-Cigarette Growth

Growth & Risk Analysis Growth Outlook
Employment rates are continuing to increase. In 2015 we expect employment gains to
average 260,000 per month — about 3.1 million for the year. These gains will fuel
consumer and business confidence and lead to rising wages and consumer spending. Altria
could take advantage of the strengthening US economy by applying further cigarette pack
price increases. In addition, US adult consumers could shift towards more premium
brands. This would be very beneficial for Altria, as the company has very strong premium
brand portfolios in all of its segments. However, as the unemployment rate nears its full
employment level of around 5%, this consumer shift from discount to premium products
becomes less frequent and less substantial.
Major Risks
The biggest issue is the market decline of their most significant product line, cigarettes.
Furthermore, there is the concern that further government action, such as excise tax hikes
or more widespread and stringent smoking bans, could exacerbate the erosion of volume
of cigarettes sold by Altria. According to Bloomberg, the price elasticity of demand for
cigarettes appear to have risen from historical 0.4 to 0.7 in recent years, which means a
price hike due to taxes will have a more adverse impact.
Market dynamics could shift during 2015 upon completion of Reynolds American Inc.'s
acquisition of Lorillard Inc. In Fitch's estimation, Reynolds American's share of the U.S.
market will climb to one-third overall, from around 27% currently; gaining ground on
Altria that controls one-half of the marketplace. Imperial Tobacco's cigarette share will
jump to approximately 10% (from 3% presently) with acquired value brands Salem,
Winston, Maverick, and Kool.
Litigation is another area of concern, as the company has a disclosure note in its financial
statements that refers to contingent liabilities which may arise as a result of adverse results
on lawsuits against Altria. Other risk factors include rise in tobacco leaf prices,
competitive pressures and shifting consumer preferences .
The Fund @ Sprott | Equity Research
Source: Gallup Source: Gallup
Page 4
Figure 4: Consumer Spending by Annual
Household Income, Dec 2013 to Dec 2014
Figure 5: Self-Reported US Daily Consumer
Spending

Income statement.
The most significant source of revenue is the cigarette segment. As mentioned before, as
the market is shrinking, the segment’s revenue’s stream is solely growing due to price in-
creases and a growing Marlboro market share. For 2015 and 2016 we forecasted slightly
larger revenue growth (0.5%) to reflect a stronger US adult consumer and a shift from dis-
count to premium cigarette brands. After 2017 though, we expect the benefits of the
stronger US consumer trend to wear off and we maintained a cigarette revenue growth rate
of 0.3% throughout the rest of the forecast, with 0.2% as CV growth. With respect to the
wine segment, we forecasted a growth rate of 5%, assuming an expanded domestic distri-
bution of the wines (restaurants, wholesale clubs, supermarkets, wine shops and mass mer-
chandisers), and an improving product mix to higher-priced, premium products. For the
smokeless tobacco segment, we forecasted a growth rate of 3% maintaining the growth
rate of the last two quarters of 2014. As for “other” (E-cigs and PMCC revenue) we fore-
casted an initial growth rate of 20% followed by 15% in later years, assuming a tightening
in e-cig regulation and lower PMCC revenue, as we expect that Altria will slow down the
pace in the sell-off of its financial assets.
We expect a slight widening of margins with COGS moving $500 million lower in the
future since the company will not have FETRA related charges in its COGS. FETRA was
signed into law in 2004 and it required big tobacco companies to pay $9.5 Billion over 10
years, at a cap of $500 million per year. Payments under FETRA and by the FDA were
determined by factors such as volume and market share.
In addition, in the last 3-5 years, taking advantage of the low interest rate environment, the
company went through a large debt restructuring program, exchanging a big portion of it’s
senior high-interest rate unsecured notes with new lower-interest rate notes reducing its
interest rate expense by 20%.
As such, we see EPS growing, but very slowly as there is limited potential for growth. E-
cigarettes and the wine segment look promising, but gains there are likely to be offset by
decline of the main product segment, tobacco.
Financial Statement Analysis
Source: Bloomberg, Student Estimates
The Fund @ Sprott | Equity Research
Page 5
2012 2013 2014 2015E 2016E 2017E 2018E 2019E CV
Total Revenue 24,618 24,466 24,522 24,744 24,976 25,163 25,359 25,564 25,733
Operating Margin 29.46% 33.04% 31.07% 31.53% 32.13% 32.13% 32.13% 32.13% 31.13%
Net Income 4,180 4,535 5,070 5,197 5,320 5,355 5,399 5,437 5,270
Profit Margin 16.98% 18.54% 20.68% 21.00% 21.30% 21.28% 21.29% 21.27% 20.48%
EPS $2.07 $2.27 $2.56 $2.64 $2.72 $2.75 $2.78 $2.80 $2.72
Figure 6: Income Statement Forecasts

Source: Bloomberg, Student Estimates
Balance Sheet
Altria has an average five-year debt ratio of 0.90 and a BBB+ Credit Rating. As men-
tioned previously in the Income Statement section, the company has made serious efforts
in exchanging its high interest rate senior unsecured notes with newer low interest rate
notes. As a result, we assume that Altria’s future debt ratio will remain the same into the
future as they continue to optimize operations and maximize shareholder value. With re-
spect to the interest coverage ratio, it has been increasing by 24% on average for the last 3
years, reflecting Altria’s lower interest expenses due to the debt restructuring. We assume
the interest coverage ratio to remain stable in future years.
The company has been operating and increasing EPS while having negative working capi-
tal for the last 2 years. It covers its working capital needs mainly through its cash from
operations and/or short term borrowings under its commercial paper program.
With respect to Current Assets, we expect them to amount for a larger percent of the com-
pany’s revenues in the future, mainly driven by higher cash balances.
Source: Bloomberg, Student Estimates Source: Bloomberg, Student Estimates
The Fund @ Sprott | Equity Research
2012 2013 2014 2015E 2016E 2017E 2018E 2019E CV
Current Assets 6,221 6,510 6,778 7,162 7,907 7,954 7,904 7,436 8,436
Current Liabilities 8,259 7,058 7,673 6,805 6,868 8,576 8,118 8,030 7,077
Pension Liabilities 6,652 6,854 6,088 6,186 5,994 5,788 5,579 5,368 5,147
Long-Term Debt 12,419 13,992 13,693 14,660 15,079 13,536 14,166 14,434 15,052
Total Equity 3,202 4,154 3,049 3,129 3,596 3,960 3,968 3,549 4,921
0.0
0.2
0.4
0.6
0.8
1.0
1.2
1.4
20
10
20
11
20
12
20
13
20
14
20
15
E
20
16
E
20
17
E
20
18
E
20
19
E
CV
Current Ratio Quick Ratio Cash Ratio
82%
83%
84%
85%
86%
87%
88%
89%
90%
91%
92%
20
10
20
11
20
12
20
13
20
14
20
15
E
20
16
E
20
17
E
20
18
E
20
19
E
CV
Debt Ratio (%)
Figure 7: Balance Sheet Forecasts
Figure 8: Current Ratio, Quick Ratio, Cash Ratio Figure 9: Debt Ratio
Page 6

Cash Flow Statement.
In our cash flow forecast we assumed depreciation to increase by 6.5% in 2015 due to the
new USSTC manufacturing facility. For the rest of our forecast we assumed a 5% annual
decline in depreciation as the company uses a straight line depreciation method and is in
decline. However, depreciation is not very relevant to our forecast as Altria is not capital
intensive.
CAPEX on average equals 3-4% of Altria’s Cash from Operations. For 2015 we forecast-
ed a $60 million increase in CAPEX due to USSTC’s new manufacturing facility. For the
rest of the forecast, after examining Altria’s CAPEX for each business segment, we as-
sumed that CAPEX will average at $130 mill. Specifically, CAPEX related to the smokea-
bles segment will remain flat, while CAPEX related to the wine and e-cigarette segments
will grow. With respect to the non-smokeables segment we expect CAPEX to decrease in
the future, upon the completion of USSTC’s 2015 large investment in a non-smokeables’
manufacturing facility.
In April 2014, Nu Mark acquired the e-vapor business of Green Smoke, Inc. and its affili-
ates (“Green Smoke”) for a total purchase price of up to approximately $130 million. The
acquisition enhances Nu Mark’s competitive position by adding e-vapor experience,
broadening product offerings and strengthening supply chain capabilities. We do not fore-
cast any further acquisitions in the future.
In 2015 Altria will conclude its current $1 billion share buyback program. For the follow-
ing years we forecasted additional share buybacks as we assume that the company will use
its lower COGS to further reward its shareholders. In order to forecast issuance of new
debt, we used a 4 year average of Altria’s Total Debt/EBIT ratio. We assumed the total
debt to EBIT ratio to remain at 1.88 and forecasted new debt additions as a result. Divi-
dends paid is expected to grow steadily, albeit at a lower rate and we believe that the com-
pany in long term will maintain a 80% OCFS Payout Ratio - as forecasted.
The Fund @ Sprott | Equity Research
Source: Bloomberg, Student Estimates
Page 7
Cash Flow: Sources and Uses Breakdown
Source: Bloomberg, Student Estimates
2012 2013 2014 2015E 2016E 2017E 2018E 2019E CV
Cash from Operations 3,865 4,355 4,643 5,133 5,229 5,258 5,280 5,307 5,449
Cash from Investing 920 602 177 75 150 70 20 (30) (120)
Cash from Financing (5,209) (4,668) (4,694) (4,731) (4,667) (5,307) (5,376) (5,774) (4,352)
Net Change in Cash (424) 289 126 477 712 20 (77) (497) 977
Ending Cash Balance 2,806 3,095 3,221 3,698 4,410 4,431 4,354 3,857 4,834
Figure 10: Cash Flow Statement Forecast

The Fund @ Sprott | Equity Research
Page 8
Valuation Altria has approximately 27% of the economic and voting interest of SABMiller plc
(“SABMiller”), which Altria accounts for under the equity method of accounting as
Altria's stake in SABMiller is less than 50%, and the company does not exercise control
over SABMiller. Altria is not allowed to fully consolidate SABMiller onto its balance
sheet, or to mark the stake up to its current value and can only record the book value of its
SABMiller holding on its balance sheet. Altria’s holding in SABMiller is currently
booked at $6.2 billion on the balance sheet. However, the current market value of the
holding is $25B. Altria has held SAB Miller stock for over a decade and would owe
massive capital gains taxes if sold today. Management has said they do not plan on selling
the stock for this reason and will continue to collect dividends from SAB Miller over the
long term.
In order to capture this value we have done two valuations, a DDM since many investors
are attracted to the high yield Altria offers as well as a modified DCF model. We have
altered our DCF to include the dividends Altria receives from their SAB Miller
investment. We have done this since these dividends are a recurring income for the
company and we do not expect Altria to sell the holding. Dividends have grown at a rate
of 8.5% over the last 5 years and we do not believe a material decrease in this growth rate
will occur. We forecast 7% growth in dividend income over the next 5 years.
2 stage DCF Model Assumptions recap: When discounting the company’s cash flows we used Bloomberg’s WACC of 7.1% to be more conservative as our self-calculated WACC of 6.06% was significantly lower. For a terminal growth rate we used 1%. With respect to debt issuances, we expect Altria to issue further debt in the future so as to cover its needs in cash. In addition, we expect Management to use its future COGS savings to continue rewarding shareholders through share-buybacks. As for CAPEX, we forecasted higher CAPEX for 2015 due to the manufacturing of the new USSTC facility. For the rest of the forecasted period we assumed lower CAPEX related to the smokeables and the non-smokeables segments and higher CAPEX related to the wine and the e-cigarettes segments. According to our 2-stage DCF Model Altria is 26.1% overvalued.
Figure 11: DCF Valuation
Source: Bloomberg, Student Estimates
2015E 2016E 2017E 2018E 2019E CV
EBIT (1 - Tax Rate) 5,071 5,216 5,255 5,296 5,339 5,207
Add: Depreciation Expense 200 220 209 199 189 179
Add: Div's from SAB Miller 488 522 559 598 640 684
Less: Capital Expenditures -225 -100 -130 -130 -130 -120
Less: Change in Non-Cash WC -139 -21 -17 -18 -18 0
FCFF per Year 5,395 5,837 5,876 5,945 6,018 5,950
FCFF Discounted 4,496 5,450 5,123 4,839 4,574 74,139
PV - Future Cash Flows 98,620 Assumptions: WACC 7.10%
Excess Cash 3,186 Ke 7.90%
MV of Debt 13,950 Kd 1.80%
Shares Outstanding 1,968 CV Growth Rate 1.00%
DCF Value Per Share $44.64

Figure 12: DDM Valuation
2015E 2016E 2017E 2018E 2019E CV
Ops Cash Flow per Share $2.35 $2.43 $2.47 $2.51 $2.55 $2.72
YoY Growth 0.02% 3.38% 1.88% 1.51% 1.65% 6.53%
Dividends per Share $2.13 $2.30 $2.48 $2.68 $2.89 $2.12
YoY Growth 8.00% 8.00% 8.00% 8.00% 8.00% -26.73%
PV of Cash Flow $2.13 $2.13 $2.13 $2.13 $2.13 $31.89
Total PV per Share $42.54 Assumptions: Ke 7.90%
CV Dividend Growth 3.00%
DDM Model
Assumptions Recap: We used Bloomberg’s cost of equity of 7.9% instead of our self-calculated
cost of equity of 6.72% for the same reasons as in the DCF Model. We assumed terminal dividend
growth to be 3%. In addition, we assume that the company will grow at a rate of 1% and that
through share buybacks it will manage to grow its dividends by 3%.
Our DDM Model found Altria 12.7% overvalued.
Source: Bloomberg, Student Estimates
The Fund @ Sprott | Equity Research
Page 9

Investment Positives
Altria has a leading market share in an industry with inelastic product demand.
Strong growth in the e-cigarette and wine segments.
The company has a long history of paying large dividends and increasing them at a
high rate. Current dividend yield is 3.70%
A strengthening US economy and a decreasing unemployment rate could have a
positive impact on Altria as they could lead consumers to shift from discount to
premium products while also creating price increase opportunities for the company.
Due to its experienced management, Altria manages to operate efficiently and
increase its EPS even while having negative working capital.
As a mature business with a leading market share in two out of the four segments it
operates in, Altria has no need for high levels of CAPEX.
As a result of substantial debt restructurings the company’s interest rate has lowered
dramatically but is still high at a weighted average of 5.43%.
Investment Negatives
Minimal yoy growth in Altria’s key segment, cigarettes.
New pressures from the US government for FET tax increases related to all tobacco
products, even e-cigarettes.
Altria is overleveraged compared to its peers which could lead to future problems.
Dividend yield has been declining since 2003 reflecting the company’s high levels
of debt and poor growth prospects.
Upon completion of Lorillard's acquisition, Reynolds is expected to gain around 5%
market share on Altria.
Conclusion
Investment Recommendation
Sell, Target Price $44.64
In conclusion, Altria’s growth prospects are grim as the cigarette industry is declining,
the regulatory environment is tightening and competition is strengthening. We are confi-
dent in the future operations of Altria but at today’s current stock price ($52.50) Altria
is significantly overvalued using multiple valuation methods. Therefore we recommend
selling our position in Altria.
The Fund @ Sprott | Equity Research
Disclaimer This report was written by a student currently enrolled in a program at the Sprott School of Business. The purpose of this report is to demonstrate the investment analysis
skills of Sprott students. The analyst is not a registered investment advisor, broker or an officially licensed financial professional. The investment opinion contained in
this report does not represent an offer or solicitation to buy or sell any securities. This report is written solely for the consideration of this student managed investment
fund and should not be used by individuals to make personal investment decisions. Unless otherwise noted, facts and figures included in this report are from publicly
available sources. We cannot guarantee that the information in this report is 100 percent accurate, although we believe it to be from reliable sources. Information
contained in this report is only believed to be accurate as of the day it was published, and it is subject to change without notice. It cannot be guaranteed that the faculty or
students do not have an investment position in the securities mentioned in this report.
Page 10

The Fund @ Sprott | Equity Research
Page 11
Appendix A Pro-forma Financial Statements
2012 2013 2014 2015E 2016E 2017E 2018E 2019E CV
Revenues 24,618 24,466 24,522 24,744 24,976 25,163 25,359 25,564 25,733
Expenses:
Cost of Goods Sold/Production 7,937 7,206 7,785 7,441 7,510 7,567 7,626 7,687 7,738
Excise Taxes 7,118 6,803 6,577 6,928 6,993 7,046 7,101 7,158 7,463
Marketing, administration and research costs 2,301 2,340 2,539 2,573 2,448 2,466 2,485 2,505 2,522
Other operating expense -52 22 2 0 0 0 0 0 0
other 0 0 0 0 0 0 0 0 0
EBITDA 7,253 8,084 7,620 7,802 8,024 8,085 8,148 8,213 8,010
Depreciation Expense 0 0 0 0 0 0 0 0 0
EBIT 7,253 8,084 7,620 7,802 8,024 8,085 8,148 8,213 8,010
Interest Expense (Income) 1,126 1,049 808 796 829 836 842 849 903
EBT (Before Other Items) 6,127 7,035 6,812 7,006 7,195 7,249 7,306 7,364 7,107
Non-Operating Items
0 0 0 0 0 0 0 0 0 0
loss on early extinguishment of debt -874 -1,084 -44 -10 -10 -10 0 0 0
Equity In Earnings of Affiliate/Joint Ventures (SABMiller)1,224 991 1,006 1,000 1,000 1,000 1,000 1,000 1,000
EBT (After Other Items) 6,477 6,942 7,774 7,996 8,185 8,239 8,306 8,364 8,107
Income Tax Expense 2,294 2,407 2,704 2,798 2,865 2,884 2,907 2,928 2,838
Non-Controlling Interest 2 3 3 0 0 0 0 0 0
Net Income 4,180 4,535 5,070 5,197 5,320 5,355 5,399 5,437 5,270
Common Shares Outstanding 2,024 1,999 1,978 1,968 1,958 1,948 1,943 1,939 1,939
Exercisable/Convertible Shares 0 0 0 0 0 0 0 0 0
Basic Earnings Per Share $2.07 $2.27 $2.56 $2.64 $2.72 $2.75 $2.78 $2.80 $2.72
Diluted Earnings Per Share $2.07 $2.27 $2.56 $2.64 $2.72 $2.75 $2.78 $2.80 $2.72
AltriaIncome Statement - USD Millions
Figure A1: Income Statement

The Fund @ Sprott | Equity Research
Page 12
2012 2013 2014 2015E 2016E 2017E 2018E 2019E CV
Revenues 100% 100% 100% 100% 100% 100% 100% 100% 100%
Expenses:
Cost of Goods Sold/Production 32% 29% 32% 30% 30% 30% 30% 30% 30%
Excise Taxes 29% 28% 27% 28% 28% 28% 28% 28% 29%
Marketing, administration and research costs 9% 10% 10% 10% 10% 10% 10% 10% 10%
Other operating expense 0% 0% 0% 0% 0% 0% 0% 0% 0%
other 0% 0% 0% 0% 0% 0% 0% 0% 0%
EBITDA 29% 33% 31% 32% 32% 32% 32% 32% 31%
Depreciation Expense 0% 0% 0% 0% 0% 0% 0% 0% 0%
EBIT 29% 33% 31% 32% 32% 32% 32% 32% 31%
Interest Expense (Income) 5% 4% 3% 3% 3% 3% 3% 3% 4%
EBT (Before Other Items) 25% 29% 28% 28% 29% 29% 29% 29% 28%
Non-Operating Items
0 0% 0% 0% 0% 0% 0% 0% 0% 0%
loss on early extinguishment of debt -4% -4% 0% 0% 0% 0% 0% 0% 0%
Equity In Earnings of Affiliate/Joint Ventures (SABMiller)5% 4% 4% 4% 4% 4% 4% 4% 4%
EBT (After Other Items) 26% 28% 32% 32% 33% 33% 33% 33% 32%
Income Tax Expense 9% 10% 11% 11% 11% 11% 11% 11% 11%
Non-Controlling Interest 0% 0% 0% 0% 0% 0% 0% 0% 0%
Net Income 17% 19% 21% 21% 21% 21% 21% 21% 20%
AltriaCommon Size Income Statement
Figure A2: Common Size Income Statement
The Fund @ Sprott | Equity Research
Page 13
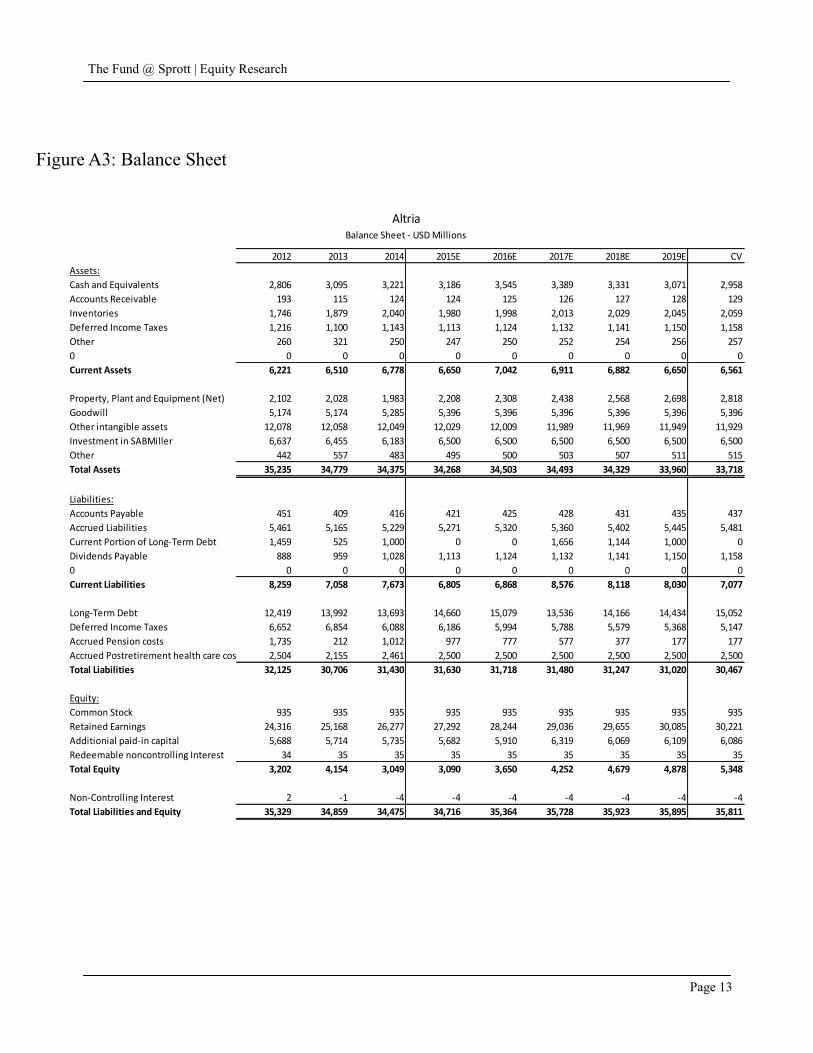
2012 2013 2014 2015E 2016E 2017E 2018E 2019E CV
Assets:
Cash and Equivalents 2,806 3,095 3,221 3,186 3,545 3,389 3,331 3,071 2,958
Accounts Receivable 193 115 124 124 125 126 127 128 129
Inventories 1,746 1,879 2,040 1,980 1,998 2,013 2,029 2,045 2,059
Deferred Income Taxes 1,216 1,100 1,143 1,113 1,124 1,132 1,141 1,150 1,158
Other 260 321 250 247 250 252 254 256 257
0 0 0 0 0 0 0 0 0 0
Current Assets 6,221 6,510 6,778 6,650 7,042 6,911 6,882 6,650 6,561
Property, Plant and Equipment (Net) 2,102 2,028 1,983 2,208 2,308 2,438 2,568 2,698 2,818
Goodwill 5,174 5,174 5,285 5,396 5,396 5,396 5,396 5,396 5,396
Other intangible assets 12,078 12,058 12,049 12,029 12,009 11,989 11,969 11,949 11,929
Investment in SABMiller 6,637 6,455 6,183 6,500 6,500 6,500 6,500 6,500 6,500
Other 442 557 483 495 500 503 507 511 515
Total Assets 35,235 34,779 34,375 34,268 34,503 34,493 34,329 33,960 33,718
Liabilities:
Accounts Payable 451 409 416 421 425 428 431 435 437
Accrued Liabilities 5,461 5,165 5,229 5,271 5,320 5,360 5,402 5,445 5,481
Current Portion of Long-Term Debt 1,459 525 1,000 0 0 1,656 1,144 1,000 0
Dividends Payable 888 959 1,028 1,113 1,124 1,132 1,141 1,150 1,158
0 0 0 0 0 0 0 0 0 0
Current Liabilities 8,259 7,058 7,673 6,805 6,868 8,576 8,118 8,030 7,077
Long-Term Debt 12,419 13,992 13,693 14,660 15,079 13,536 14,166 14,434 15,052
Deferred Income Taxes 6,652 6,854 6,088 6,186 5,994 5,788 5,579 5,368 5,147
Accrued Pension costs 1,735 212 1,012 977 777 577 377 177 177
Accrued Postretirement health care costs 2,504 2,155 2,461 2,500 2,500 2,500 2,500 2,500 2,500
Total Liabilities 32,125 30,706 31,430 31,630 31,718 31,480 31,247 31,020 30,467
Equity:
Common Stock 935 935 935 935 935 935 935 935 935
Retained Earnings 24,316 25,168 26,277 27,292 28,244 29,036 29,655 30,085 30,221
Additionial paid-in capital 5,688 5,714 5,735 5,682 5,910 6,319 6,069 6,109 6,086
Redeemable noncontrolling Interest 34 35 35 35 35 35 35 35 35
Total Equity 3,202 4,154 3,049 3,090 3,650 4,252 4,679 4,878 5,348
Non-Controlling Interest 2 -1 -4 -4 -4 -4 -4 -4 -4
Total Liabilities and Equity 35,329 34,859 34,475 34,716 35,364 35,728 35,923 35,895 35,811
Balance Sheet - USD Millions
Altria
Figure A3: Balance Sheet
The Fund @ Sprott | Equity Research
Page 14
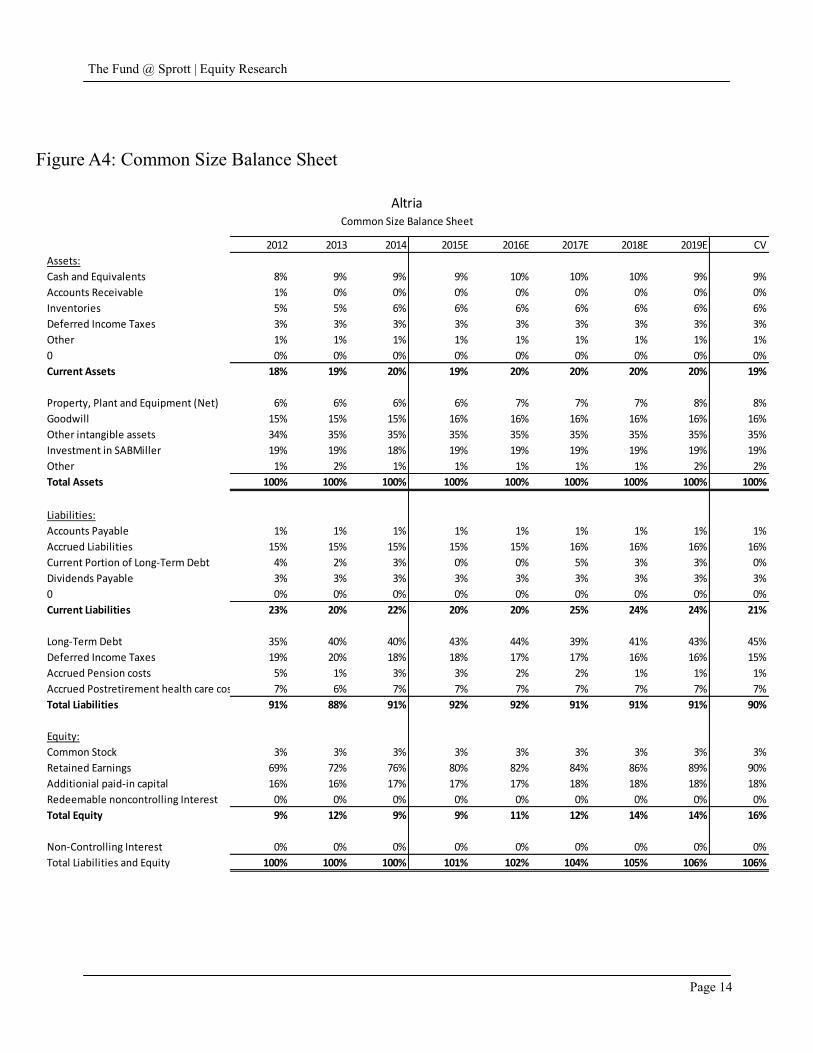
2012 2013 2014 2015E 2016E 2017E 2018E 2019E CV
Assets:
Cash and Equivalents 8% 9% 9% 9% 10% 10% 10% 9% 9%
Accounts Receivable 1% 0% 0% 0% 0% 0% 0% 0% 0%
Inventories 5% 5% 6% 6% 6% 6% 6% 6% 6%
Deferred Income Taxes 3% 3% 3% 3% 3% 3% 3% 3% 3%
Other 1% 1% 1% 1% 1% 1% 1% 1% 1%
0 0% 0% 0% 0% 0% 0% 0% 0% 0%
Current Assets 18% 19% 20% 19% 20% 20% 20% 20% 19%
Property, Plant and Equipment (Net) 6% 6% 6% 6% 7% 7% 7% 8% 8%
Goodwill 15% 15% 15% 16% 16% 16% 16% 16% 16%
Other intangible assets 34% 35% 35% 35% 35% 35% 35% 35% 35%
Investment in SABMiller 19% 19% 18% 19% 19% 19% 19% 19% 19%
Other 1% 2% 1% 1% 1% 1% 1% 2% 2%
Total Assets 100% 100% 100% 100% 100% 100% 100% 100% 100%
Liabilities:
Accounts Payable 1% 1% 1% 1% 1% 1% 1% 1% 1%
Accrued Liabilities 15% 15% 15% 15% 15% 16% 16% 16% 16%
Current Portion of Long-Term Debt 4% 2% 3% 0% 0% 5% 3% 3% 0%
Dividends Payable 3% 3% 3% 3% 3% 3% 3% 3% 3%
0 0% 0% 0% 0% 0% 0% 0% 0% 0%
Current Liabilities 23% 20% 22% 20% 20% 25% 24% 24% 21%
Long-Term Debt 35% 40% 40% 43% 44% 39% 41% 43% 45%
Deferred Income Taxes 19% 20% 18% 18% 17% 17% 16% 16% 15%
Accrued Pension costs 5% 1% 3% 3% 2% 2% 1% 1% 1%
Accrued Postretirement health care costs 7% 6% 7% 7% 7% 7% 7% 7% 7%
Total Liabilities 91% 88% 91% 92% 92% 91% 91% 91% 90%
Equity:
Common Stock 3% 3% 3% 3% 3% 3% 3% 3% 3%
Retained Earnings 69% 72% 76% 80% 82% 84% 86% 89% 90%
Additionial paid-in capital 16% 16% 17% 17% 17% 18% 18% 18% 18%
Redeemable noncontrolling Interest 0% 0% 0% 0% 0% 0% 0% 0% 0%
Total Equity 9% 12% 9% 9% 11% 12% 14% 14% 16%
Non-Controlling Interest 0% 0% 0% 0% 0% 0% 0% 0% 0%
Total Liabilities and Equity 100% 100% 100% 101% 102% 104% 105% 106% 106%
Common Size Balance Sheet
Altria
Figure A4: Common Size Balance Sheet

2012 2013 2014 2015E 2016E 2017E 2018E 2019E CV
Cash From Operating ActivitiesNet Income 4,183 4,535 5,070 5,197 5,320 5,355 5,399 5,437 5,270
Add (Deduct) Non-Cash Items:
Add: Depreciation Expense 205 192 188 200 220 209 199 189 179
Change in Non Cash Working Capital 1,194 -558 -194 -139 -21 -17 -18 -18 0
Deferred income tax benefit -929 -86 -129 -100 -100 -100 -100 -100 0
earnings from equity investment in venture joints (SABMiller)-1,224 -991 -1,006 -1,000 -1,000 -1,000 -1,000 -1,000 -1,000
dividends from SABMiller 402 439 456 488 522 559 598 640 684
Loss on early extinguishment of debt 874 1,084 44 10 10 10 0 0 0
Cash From Operations 3,865 4,355 4,643 4,621 4,752 4,816 4,877 4,947 5,133
Cash From Investing ActivitiesCapital Expenditures / Acquisitions -124 -131 -163 -225 -100 -130 -130 -130 -120
Asset Sales 0 0 0 0 0 0 0 0 00 0 0 0 0 0 0 0 0 0
0 0 0 0 0 0 0 0 0 0
Investments in finance assets 0 0 0 0 0 0 0 0 0
Proceeds from finance assets 1,049 716 369 300 250 200 150 100 0
other -5 17 73 0 0 0 0 0 0
Cash From Investing 920 602 177 75 150 70 20 -30 -120
Cash From Financing ActivitiesAdditions of Long-Term Debt 2,787 4,179 999 967 419 113 1,774 1,267 0
Reductions of Long-Term Debt -2,600 -3,559 -825 -1,000 0 0 -1,656 -1,144 0
Additions of Short-Term Debt 0 0 0 0 0 0 0 0 0
Reductions of Short-Term Debt 0 0 0 0 0 0 0 0 0
Net Debt Additions (Reductions) 187 620 174 -33 419 113 118 123 0
Issuance of Common Shares 0 0 0 0 0 0 0 0 0
Redemption of Common Shares -1,116 -600 -939 -518 -600 -600 -300 -300 0
Cash Dividends Paid -3,400 -3,612 -3,892 -4,182 -4,368 -4,563 -4,780 -5,007 -5,133
other 6 17 14 14 14 14 14 14 14
finance fees and debt issuance costs -22 -39 -7 -7 -7 -7 -7 -7 -7
Cash From Financing -5,209 -4,668 -4,694 -4,731 -4,542 -5,043 -4,955 -5,177 -5,126
Foreign Exchange Rate Gain (Loss) 0 0 0 0 0 0 0 0 0
Net Change in Cash -424 289 126 -35 359 -156 -57 -260 -113
Cash Balance, Beginning 3,230 2,806 3,095 3,221 3,186 3,545 3,389 3,331 3,071
Cash Balance, Ending 2,806 3,095 3,221 3,186 3,545 3,389 3,331 3,071 2,958
AltriaCash Flow Statement - USD Millions
The Fund @ Sprott | Equity Research
Page 15
Figure A5: Cash Flow Statement

The Fund @ Sprott | Equity Research
-6,000
-4,000
-2,000
0
2,000
4,000
6,000
8,000
20
10
20
11
20
12
20
13
20
14
20
15
E
20
16
E
20
17
E
20
18
E
20
19
E
CV
Operating CF Investing CF Net Debt Issued Dividends Paid Change in Cash
0%
5%
10%
15%
20%
25%
30%
35%
0
1,000
2,000
3,000
4,000
5,000
6,000
20
10
20
11
20
12
20
13
20
14
20
15
E
20
16
E
20
17
E
20
18
E
20
19
E
CV
Net Income EBITDA Margin Operating Margin Profit Margin
0%
20%
40%
60%
80%
100%
120%
140%
160%
20
10
20
11
20
12
20
13
20
14
20
15
E
20
16
E
20
17
E
20
18
E
20
19
E
CV
Dividend Payout Ratio (to OCF) Net Income to OCF
Page 16
Appendix B Valuation Charts
Figure B1: Cash Flow: Sources and Uses Breakdown Figure B2: Profitability Forecast
Figure B3: Dividend Payout Ratio, Net Income to OCF
Source: Bloomberg, Student Estimates
Source: Bloomberg, Student Estimates Source: Bloomberg, Student Estimates