alternative pension strategies (part 1) - ifebp · alice and the cheshire cat from lewis...
TRANSCRIPT

The opinions expressed in this presentation are those of the speaker. The International Foundationdisclaims responsibility for views expressed and statements made by the program speakers.
Alternative Pension Strategies (Part 1)
Mark Olleman EA, FSA, MAAAConsulting Actuary and PrincipalMilliman, Inc.Seattle, Washington
P06-1

Outline
• Values• Risk• Adequacy• Alternative Strategies
P06-2

The Journey of Plan Design
GoalsValues
Perceived NeedEducation
FocusCosts
DecisionsImplementation
AdequacyCompetitiveness
P06-3

ValuesAlice and the Cheshire Cat from Lewis Carroll’s Alice’s Adventure in Wonderland
“Would you tell me, please, which way I ought to go from here?”
“That depends a good deal on where you want to get to.” said the Cat.
“I don’t much care where.” said Alice“Then it doesn’t matter which way you go.” said the Cat.
• If you don’t know where you are going, any road will take you there.
• Values should direct your journey.
P06-4

Cost Related Values
• Cost Level– Any plan design can be cheap or expensive.
• Efficiency– What is important is the value provided for
each dollar of contribution.– Efficiency = the cost of adequacy
• Contribution Stability– Do you want predictable costs or predictable
benefits?
P06-5

Benefit Related Values
• Adequacy• Guaranteed benefits• Lifelong income• Inflation protection• Portability• Flexibility (e.g. Lump sums, loans)
• Inheritance for beneficiaries• Simplicity of design (understandable)
P06-6

Employer Values
• Employee appreciation (exchange for wages)
• Attraction• Retention• Workforce management (influence retirement age)
• Balance of value to: young vs. old, short service vs. career employees, etc.
• Paternalistic desire to provide secure retirement• Desire to provide education and communication
vs. desire for plan to work without participant understanding
P06-7

Responsibility and Individuality Values
• Cost and risk sharing: employers and employees
• Employee responsibility• Employee freedom to craft individual
retirement• Equity between employees
P06-8

What Is Equity?
• Isabel is 45, Jack is 65• Does equity mean that this year:
– Isabel and Jack both earn a benefit worth $8,000?
– Or that Isabel and Jack both earn a benefit of $100 per month starting at age 65?
P06-9

Risks
How solid is your plan?• Investment risk• Longevity risk• Inflation risk• Portability risk• Interest rate risk
P06-10

Investment Risk
• Invest $10,000 per year,60% in stocks, 40% in bonds
• 1940-1959 $ 670,000• 1960-1979 $ 360,000• 1980-1999 $1,150,000
• Currently: “Low Return Environment”
P06-11

Longevity Risk
• 65 year old man:– 50% chance of living to 86– 5% chance of living to 99
• 65 year old husband and wife– 50% chance one will live to 93– 5% chance one will live to 103
P06-12

Inflation Risk
% of Original Purchasing Power2 % Inflation 3% Inflation
10 years 82% 74%20 years 67% 55%30 years 55% 41%40 years 45% 31%
Inflation has averaged 2.2% over the last 20 years and 2.9% over the last 90 years.
P06-13

Portability Risk
• Portability risk is the risk that retirement benefits will be smaller due to changes in employment.
• Defined Benefit: inflation, eligibility• Defined Contribution: “leakage”• Non vested participants can lose employer
provided benefits in any retirement plan
P06-14

Interest Rate Risk
• Risk of low interest rates– Strategies that remove risk from retiree
payments by investing in bonds or insurance contracts
• Will be expensive when interest rates are low• Interest rate changes create cost volatility
– All strategies are sensitive to the extent low interest rates may create a “low return environment.”
P06-15

Adequacy
• Why do you have a retirement plan?To provide retirement income.
P06-16

Adequacy—Replacement Ratio
How much is enough?• Replacement ratio: The percent of
pre-retirement income neededpost-retirement to sustain standard of living.
P06-17

Adequacy Replacement Ratio
How much is enough?• Studies suggest people need a
replacement ratio of approximately 78% at age 65.(much more before Medicare eligibility at 65)
P06-18

Sources of Adequacy
• Traditional concept:three-legged stool– Social Security– Pension– Personal savings
• Fourth leg? Income from working
P06-19

Funding of Adequacy
How do you fund retirement?Benefits + Expenses are funded by Contributions + Investment Earnings
investments$ $ $
$
$ $
$
$
$$
$ $ $$
$
$ $$
Assets$
$
$ $$
$
$
$
$ $
PENSIONFUND
$ $
benefits
expenses
employer contributions
employee contributions
C + I = B + E
P06-20

There Are Two Funding Stages:
1. Accumulation (C + I)2. Distribution (B + E)
investments$ $ $
$
$ $
$
$
$$
$ $ $$
$
$ $$
Assets$
$
$ $$
$
$
$
$ $
PENSIONFUND
$ $
benefits
expenses
employer contributions
employee contributions
C + I = B + E
P06-21

Planning for Adequacy—Accumulation
When an individual plans for their own adequacy they need to decide:• Pre-retirement (accumulation)
– How much money will I need every month when I retire?
– How much does that mean I need to have accumulated at retirement?
– How much do I need to save to accumulate that amount?
– How should I invest those savings?
P06-22

Planning for Adequacy—Distribution
When an individual plans for their own adequacy they need to decide:• Post-retirement (distribution)
– How much can I spend in retirement?– How do I invest in retirement?
• Risk—How do I plan for risk?
P06-23

Adequacy Cost Factors “Efficiency”
Many things influence the cost of providing an adequate benefit:• Investment return• Longevity• Longevity pooling• Retirement age• Risk tolerance• Risk
P06-24

Cost of Adequacy (Value = Efficiency) Investment Earnings
Let’s say, Kris is hired at 25, retires at 65, dies at 86• Contribute for 40 years (e.g. 25 to 65)• Annual contribution and benefit growth: 3%• Contribution in year before age 65: $10,000
6% Earnings 7% EarningsContributions $238,000 $238,000Investment Earnings 523,000 718,000Age 65 Accumulation $761,000 $956,000
Age 65 Monthly Benefit $ 4,080 $ 5,600Age 86 Account Balance $ 0 0
$5,600 = 137% of $4,080
P06-25

Cost of Adequacy (Value = Efficiency) Longevity Pooling
Let’s say, Kris is hired at 25, retires at 65, then• Dies at 86 (50% chance of living longer), or• Dies at 99 (5% chance of living longer)
6% Earnings 7% EarningsAge 65 Accumulation $761,000 $956,000
Age 65 Monthly Benefit $ 4,080 $ 5,600Age 86 Account Balance $ 0 0
Age 65 Monthly Benefit $ 2,970 $ 4,240Age 99 Account Balance $ 0 0
$5,600 = 137% of $4,080 -OR- 132% of 4,240 -OR- 189% of 2,970
P06-26

Retirement Strategies
What matches your values?
P06-27

Traditional Defined Benefit
• DB defines a specific benefit at retirement. Many options, examples:– 1% of contributions made for participant– $50 per month for each year of service– 1% of final pay for each year of service
• Contributions vary• Guaranteed monthly benefit is paid for the
rest of the member’s life
P06-28

Traditional DB Values
Yes Maybe No
Guaranteed Benefits Equity* Contribution Stability
Lifelong Income Cost/Risk Sharing
Efficiency Inflation Protection
Workforce Mgmt. Portability
Attraction / Retention Inheritance
Works without Participant EE Responsibility
Understanding EE Freedom
Simple to Communicate Flexibility (e.g. Lump sums, loans)
*Tend to benefit older participants.
P06-29

Defined Contribution Plans
• Define a specific contribution• Benefits vary = Contributions +
Investment Earnings – Expenses• Benefit usually paid as a single lump sum
P06-30

Defined Contribution Values
Yes Maybe NoContribution Stability (+) Equity* Guaranteed Benefits (-)
Portability (+) Attract. / Retain.(-) Lifelong Income (-)
Simple to Communicate Inflation Protect. (+) Efficiency (-)
Inheritance (+) Cost Sharing (+) Workforce Mgmt. (-)
EE Responsibility (+) Works without Participant
EE Freedom (+) Understanding (-)
Flexibility (+) (e.g. Lump sums, loans) Risk Sharing
*Tend to benefit younger participants.(+)/(-) shaded cells are the changes from DB
P06-31

Hybrid Plans/Alternative Strategies
Wide variety:1. Defined Benefit + Defined Contribution2. Spillover plans3. Annuity plans4. Cash balance plans5. Composite plans6. Variable annuity plans
P06-32

1.“Combined” or “DB + DC” Hybrid
• Combines reduced Defined Benefit with a Defined Contribution plan
• When discussing public plans some people will assume this is what you mean when you say “hybrid plan.”
• Proportionately reflects values of DB and DC – Smaller defined benefit means more contribution
stability and less guaranteed benefit
P06-33

2. “Spillover” Plans
• Special type of “combined” or “DB + DC” hybrid• Contributions not needed for traditional DB plan
“spillover” into DC.– DC contributions vary– Total contributions are stable (value)– DB accruals are stable (value)– Relies on strong active contribution base
• Again, proportionately reflects DB and DC values
P06-34

3. Annuity Plans
• Defined Contribution Plan• Accumulation phase
– Trustees manage the assets. Like a DB trust there is no participant investment selection.
– Generally only employer contributions
• Distribution phase– May purchase insurance company annuities at
retirement to pay monthly benefits– May pay lump sums
P06-35

Annuity Plan (All Lump Sum) Values
Yes Maybe No
Contribution Stability Equity* Guaranteed Benefits
Portability Attract. / Retain. Lifelong Income
Simple to Communicate Inflation Protect. Workforce Mgmt.
Inheritance Efficiency (+) Cost/Risk Sharing
Flexibility (e.g. Lump sums, loans) EE Responsibility (-) Works w/o Participant
EE Freedom (-) Understanding
*Tend to benefit younger participants.(+)/(-) shaded cells are the only changes from DC
P06-36
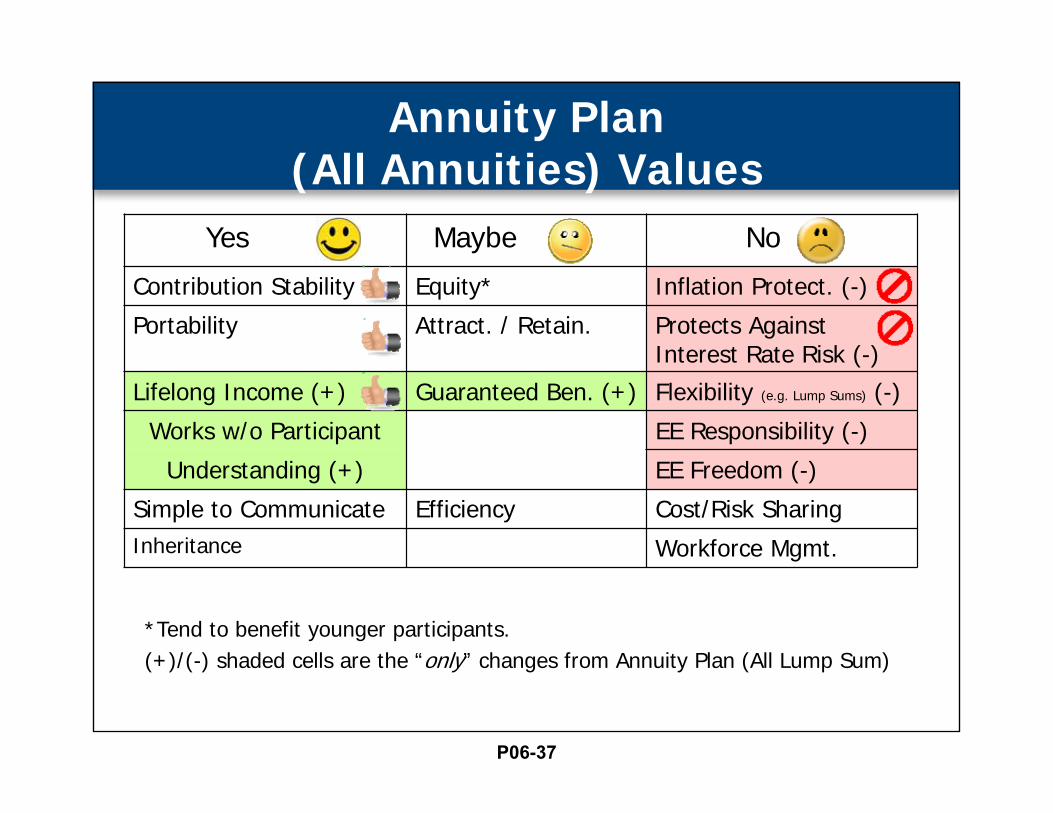
Annuity Plan (All Annuities) Values
Yes Maybe No
Contribution Stability Equity* Inflation Protect. (-)
Portability Attract. / Retain. Protects Against Interest Rate Risk (-)
Lifelong Income (+) Guaranteed Ben. (+) Flexibility (e.g. Lump Sums) (-)
Works w/o Participant EE Responsibility (-)
Understanding (+) EE Freedom (-)
Simple to Communicate Efficiency Cost/Risk SharingInheritance Workforce Mgmt.
*Tend to benefit younger participants.(+)/(-) shaded cells are the “only” changes from Annuity Plan (All Lump Sum)
P06-37

4. Cash Balance (Hybrid)
• A DB plan that looks like a DC plan• Unlike a DC plan:
– “Balance” is guaranteed (will not decrease)– There are no individual accounts
(accounts are hypothetical)
P06-38

• “Balances” increase 2 ways:– Pay Credits
• Some % of pay is added each year(or could be flat dollar amount or based on contributions)
– Interest Credits• Prior year balance is increased with some amount of interest
each year• Usually a fixed rate such as 6% or based on an outside index
• At termination or retirement the employee gets the cash balance.
• May be received as a lump sum or converted to an annuity (varies by plan)
Cash Balance (Hybrid)
P06-39

Cash Balance (All Lump Sum) Values
Yes Maybe NoPortability (+) Equity(1) Lifelong Income (-)
Guaranteed Benefits Efficiency (-) Cost Sharing
Inheritance (+) EE Responsibility (+) Works w/o Participant
Flexibility (Lump Sums) (+) EE Freedom (+) Understanding (-)
Contrib. Stability(2) (+)
Simple to Communicate (-)
Workforce Mgmt. (-)
Attraction / Retention (-)
Risk Sharing (+)
Inflation Protection (+)
(1) Tend to benefit younger participants.
(2) Depends on relationship between interest credit and investments.(+)/(-) shaded cells are changes from Traditional DB
P06-40

Yes Maybe NoGuaranteed Benefits Equity(1) Inflation Protection
Lifelong Income Contribution Stability(2)(+) Cost Sharing
Efficiency Simple to Communicate (-) Inheritance
Workforce Mgmt. Risk Sharing(2) (+)
Works without Participant EE Responsibility
Understanding EE Freedom
Attraction / Retention Flexibility (e.g. Lump sums, loans)
Portability (+)
Cash Balance(All Annuities) Values
(1) Tend to benefit younger participants.
(2) Depends on relationship between interest credit and investments.(+)/(-) shaded cells are changes from Traditional DB
P06-41

5. Composite Plans
• Can pay benefits in same form as a “Traditional Defined Benefit Plan.”
• No withdrawal liability• No PBGC premiums or PBGC protection• Must maintain 15 year projection of 120% funded• Recent events
– 9/9/2016: Rep. John Kline unveiled “discussion draft” of legislation
– 9/22/2016: Health, Education, Labor and Pensions subcommittee held hearing to collect feedback on the discussion draft.
P06-42

Composite Plans—Discussion Draft
• If 15 year projection of funded ratio is less than 120% trustees are required to adopt a “realignment program” with the following hierarchy:
• Tier 1– Contribution increases by bargaining parties– Reductions in future benefit accruals by trustees, but not below
1% of contributions.– “Adjustable benefits” such as early retirement provisions can be
reduced for participants not in pay status.
P06-43

Composite Plans—Discussion Draft
• Tier 2– Reductions in accrued benefits for participants not yet in pay
status. – Reductions in post-retirement benefit increases for retirees.
• Tier 3– Future benefit accruals may be reduced below 1%.– Core benefits for retirees in pay status may be reduced.– Until either:
• Plan’s projected funded ratio is 120%.• Plan’s projected funded ratio is at least 100% and plan’s current
funded ratio is at least 90%.
P06-44

Composite Plans—Early Intervention
• Early intervention and responsible funding will:– Minimize required adjustments, and– Reduce the likelihood of reductions in benefits earned
in the past. Note that if other plan’s go to the PBGC, earned benefits including retiree benefits are reduced.
P06-45

Composite Plans—Observations
• The remedies are similar in substance and order to those already available under PPA and MPRA: – Contribution increases, future accrual decreases, adjustable
benefit decreases, and if a plan is critical and declining then core benefit decreases.
– However, the remedies are made sooner.– Not really a new plan design, stricter funding rules with
increased ability to adjust earned benefits
• The remedies start by protecting benefits earned in the past using the sacrifice of current members and employers.
• The adjustments are not automatic. The trustees and bargaining parties must decide.
P06-46

Composite Plan Values
Yes Maybe No
Guaranteed Benefits Equity* Inflation Protection
Lifelong Income Simple to Communicate (-) Contribution Stability(+)
Efficiency Portability
Workforce Mgmt. Inheritance
Attraction / Retention EE Responsibility
Works w/o Participant EE Freedom
Understanding Flexibility (e.g. Lump sums, loans)
Cost/Risk Sharing (+)
*Tend to benefit older participants.(+)/(-) shaded cells are changes from Traditional DB
P06-47

6. Variable Annuity Plans (VAPs)
Established in 1953:Revenue Ruling 185, 1953-2 says a plan “which provides benefits that vary with the increase or decrease in the market value of assets from which such benefits are payable” satisfies the Internal Revenue Code requirement for “definitely determinable benefits.”
P06-48

Variable Annuity Plans
• Monthly benefits are earned like traditional DB, but go up or down by the % plan returns are larger or smaller than a “hurdle rate.”
• Shifts investment risk from employers and active participants to all participants including retirees.– All participants share in gains and losses– Sustainable, robust funding in all markets
• Employers keep longevity risk (diversifiable)• Reduces inflation risk
P06-49

Variable Annuity Plan —Example
• Jack is retired in a “pure” VAP with a 4% “hurdle rate.” His benefit is $1,000/month
• Year 1: Investment return = 1%– Jack’s benefit changes to
$1,000 x 1.01 ÷ 1.04 = $971
• Year 2: Investment return = 11%– Jack’s benefit changes to
$971 x 1.11 ÷ 1.04 = $1,036
• Investment return averaged 6% and benefit went up 3.6% over two years.
P06-50

Variable Annuity Plansthe Promise Is Changed
Fundamental shift in paradigm • When assets supporting benefits earned in the past go down:
– Traditional DBs charge future generations of members and employers with contribution increases and reductions to benefits earned in the future.
– VAPs charge participants who earned those benefits in the past by adjusting those benefits to be consistent with the current value of the contributions made for those benefits.
– Someone has to pay. Who will it be? What is fair?What is your value?
• VAP provides “lifelong” benefit with some expected inflation protection over the long term instead of a “guaranteed” dollar benefit.
P06-51

Variable Annuity Plan ValuesYes Maybe No
Lifelong Income Equity* Inheritance
Efficiency EE Responsibility
Contribution Stability(+) EE Freedom
Inflation Protection (+) Flexibility (e.g. Lump sums, loans)
Cost/Risk Sharing (+) Guaranteed Benefits (-)
Portability (+)
Workforce Mgmt. (-)
Attraction / Retention
Works without Participant
Understanding
Simple to Communicate
*Tend to benefit long service participants. Asset losses paid for by past generations instead of future generations.
(+)/(-) shaded cells are changes from Traditional DB
P06-52

“Pure” Variable Annuity Plans
• Why?1. Lifelong income like a DB plan for employees2. Stable contributions like a DC plan for
employers3. While expecting some amount of inflation
protection over the long term
• Why not?– Retiree benefits can go down.– Is there something we can do about that?
P06-53

Risk of Growing Liabilities
• What is maturity?– Generally, more retirees than actives– Means more liability without current contributions
• Why is maturity a problem?– As liabilities grow, assets should grow.– As assets grow compared to the contribution base, so
do gains and losses on those assets.
• If you had a plan that was all retirees with no contributions how would you solve a funding problem?
P06-54

It’s Hard to “Guarantee” Retirees
• Increased maturity = Increased funding difficulties(data from Milliman’s Multiemployer Pension Funding Study)
P06-55

Every situation is different, but in some cases:• Mature plan’s asset losses have made it
difficult to pay promises.– Retirees get stable and perhaps large benefits,
but:– Employers have difficulty competing.– Active participants get smaller paychecks.– Young participants get small retirement benefits.
• Is this working?
Impact of Maturity
P06-56

Strategies to Manage Risk for the Whole Plan
• Conservative assumptions
• Conservative investments
• Build reserves• Adopt a spillover
strategy
• Vary your benefit accrual rates
• Vary contributions
P06-57

Strategies to Manage Retiree Risk (Distribution Phase)
1. Pay lump sums2. Match assets to liabilities
– Purchase annuities, matching dedicated bond portfolio, immunization
– Advantage: Very secure– Disadvantages:
• Low return => high cost or low benefits• No inflation protection• Interest rate risk
3. Match liabilities to assets– Variable benefits (Like a VAP) – But what about retiree benefits going down?
P06-58

Strategies to Avoid Retiree Benefits Going Down
in a Variable Annuity Plan
• Match assets to liabilities (see prior slide)• Floor benefit
– Doesn’t keep benefits from going down– Leaves some retiree risk in plan– If retiree risk is minimal so is floor’s value
• Cap and shore to maintain high-water mark– Reserve built by capping large benefit increases and/or
supplemental contributions– Reserve used to “shore-up” benefits to “high-water mark”– If reserve runs out, benefits are not shored-up. Goal is to make
this highly unlikely.– This strategy used in “Sustainable Income Plans”
P06-59

Legacy Liabilities It Takes a Long Time
• Reductions in cost volatility from a change to VAP, Composite or DC will emerge slowly as old promises are paid out.
• This highlights the need for action, but also highlights the need for carefully considered consequences.
P06-60

62nd Annual Employee Benefits ConferenceNovember 13-16, 2016Orlando, Florida
Session #P06
Alternative Pension Strategies (Part 1)
• Your strategy should reflect your values. If you don’t know where you are going, any road will take you there.
• When assets supporting benefits earned in the past go down, do you want to fund those benefits by:– Charging future generations with higher
contributions and lower benefit accruals?
– Charging the participants who earned those benefits by adjusting those benefits?
– Is there a win-win? What is your value?
• How will you manage the risk of growing liabilities and an increasing retiree population?
• How is adequacy reflected in your values?(Is your strategy “efficient?”)
P06-61

2017 Educational ProgramsPensions
63rd Annual Employee Benefits Conference October 22-25, 2017 Las Vegas, Nevadawww.ifebp.org/usannual
Trustees and Administrators InstitutesFebruary 20-22, 2017 Lake Buena Vista (Orlando), FloridaJune 26-28, 2017 San Diego, Californiawww.ifebp.org/trusteesadministrators
Certificate of Achievement in Public Plan Policy (CAPPP®)Part I and Part II, June 13-16, 2017 San Jose, CaliforniaPart II Only, October 21-22, 2017 Las Vegas, Nevadawww.ifebp.org/cappp
Related ReadingVisit one of the on-site Bookstore locations or see www.ifebp.org/bookstore for more books.
2016 Retirement Plans Facts Item #9060www.ifebp.org/books.asp?9060
816
P06-62