alternative investment social media strategy
TRANSCRIPT

Alternative Investment Firm Social Media Strategy

Reputation Management, Content Amplification & Money

Benefits of Social Media Engagement
1. Monitor & Leverage Industry News2. Build Brand Equity & Social Authority3. Introduce Firm to Potential Investors

Reputation Management
“Leveraging social media to listen, amplify,
and direct.
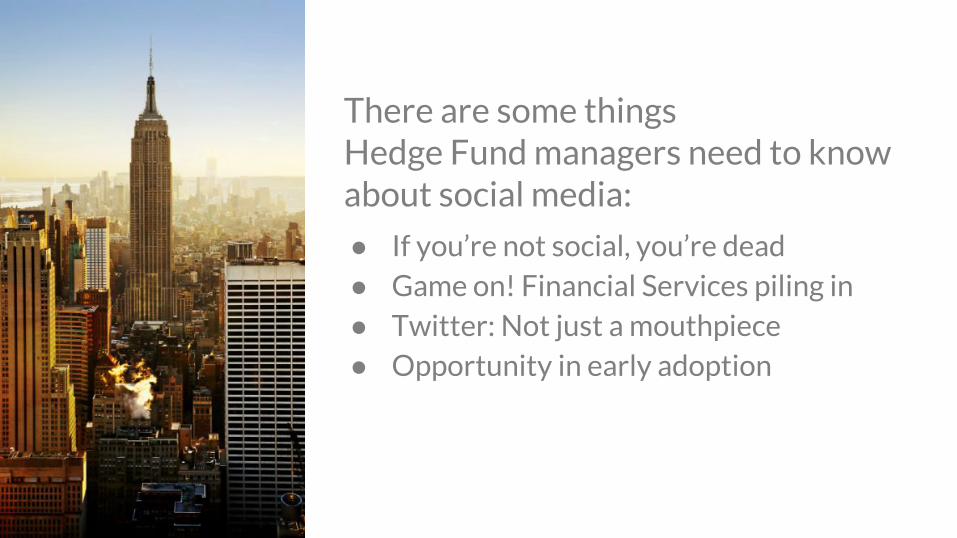
There are some things Hedge Fund managers need to know about social media:
● If you’re not social, you’re dead● Game on! Financial Services piling in● Twitter: Not just a mouthpiece● Opportunity in early adoption
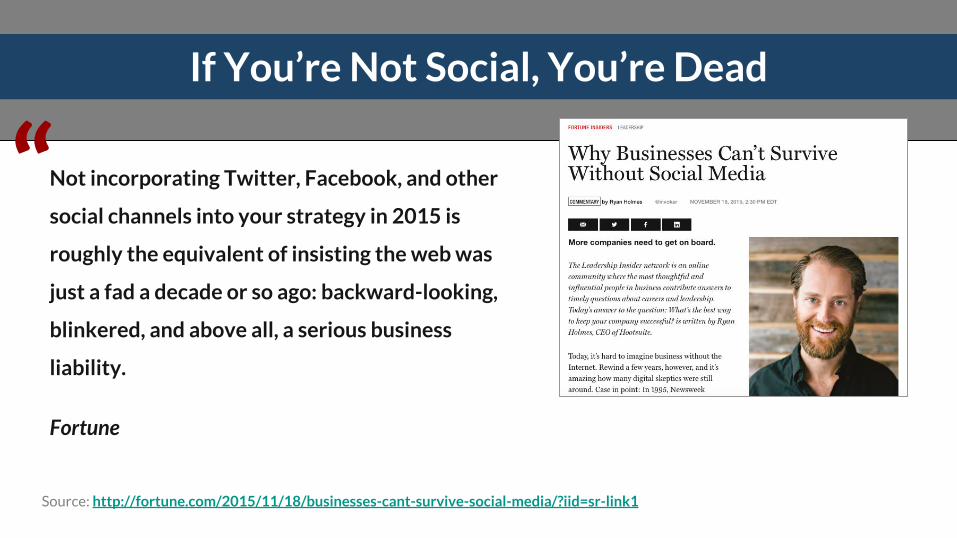
If You’re Not Social, You’re Dead
Source: http://fortune.com/2015/11/18/businesses-cant-survive-social-media/?iid=sr-link1
Not incorporating Twitter, Facebook, and other
social channels into your strategy in 2015 is
roughly the equivalent of insisting the web was
just a fad a decade or so ago: backward-looking,
blinkered, and above all, a serious business
liability.
Fortune
“

Game On! Financial Services Piling In
“
Source: http://insurance-journal.ca/article/financial-services-take-to-social-media/
The use of social media in the
financial services industry
increased by more than a third
last year.
The Insurance & Investing Journal

Twitter: Not Just a Mouthpiece
“
Source: http://www.forbes.com/sites/freddiedawson/2016/03/25/twitter-your-hedge-fund-better/#6fb645ca4801
Eagle Alpha is taking information and
large data sets from a variety of sources
ranging from posts on Twitter to
collections of satellite imagery and
photosynthesis levels to create its range
of products.
Forbes

Tapping Into Twitter
“The key problem with Twitter is separating useful data from the noise”
“...we found that there’s
real economic knowledge to be gathered.”
“The rise of social media allows us to
measure the sentiment of a large number of
individuals in real time.”
Source: Bloomberg Technology http://www.bloomberg.com/news/articles/2016-04-21/andrew-lo-study-says-twitter-can-help-you-trade-fed-meetings

Opportunity in Early Adoption
“
Source: http://www.pionline.com/article/20160307/PRINT/303079990/hedge-fund-managers-still-shy-about-social-media
Only 11.1% of the world's 300 largest hedge
funds had any sort of social media presence
apart from LinkedIn in 2015, up from 9.9%
the previous year.
Pensions & Investments
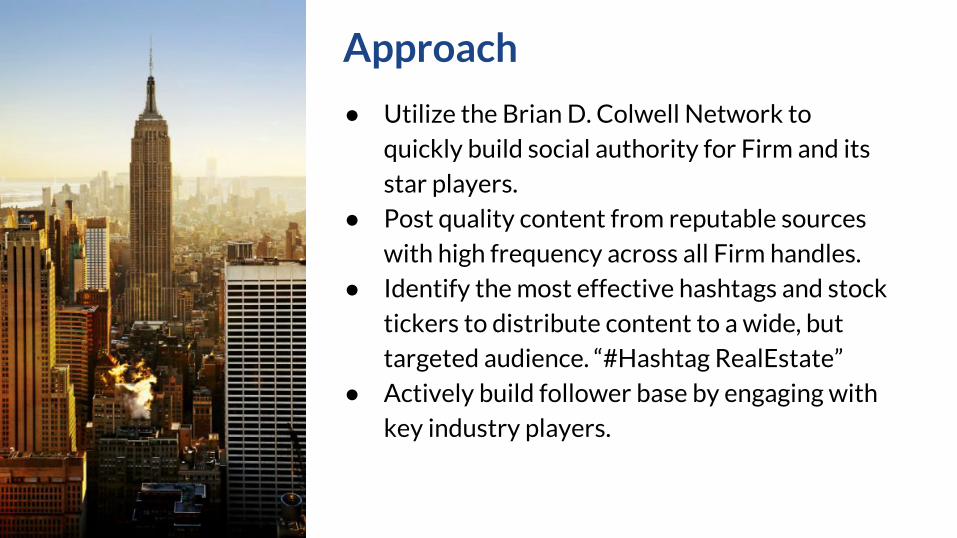
Approach
● Utilize the Brian D. Colwell Network to
quickly build social authority for Firm and its
star players.
● Post quality content from reputable sources
with high frequency across all Firm handles.
● Identify the most effective hashtags and stock
tickers to distribute content to a wide, but
targeted audience. “#Hashtag RealEstate”
● Actively build follower base by engaging with
key industry players.

Building theSocial Media
Empire

Content Amplification

Hello, My Name is...Social Media Activities
Boost Search Engine Performance

Become a Trusted Source:Search Engine Performance is
Critical to Website Success
Website

Social Media Traffic Drives Website Visits BUT, Your Website Drives Conversions
Branding & Conversion
Messages
Company Website
Contact Requests
& Subscriptions

Building the Firm’s Social Media Network
(Brand Content + Curated Content) x
(Social Media Channels)Engagement =High Search Engine Visibility Drives
Social Authority & Brand Awareness

Alternative Investment Firm Content
Brand Content● Philosophy● Process● Insights● What sets us apart?● Approach● Press Releases● Media & Videos● Community Service / Philanthropy● News from investment team● News from management team● Monthly views● Weekly round-up and blog?● Weekly live $twtr interviews?
Curated Content● #Economics:
○ @wef○ @elerianm
● #Geopolitics:○ @intlspectator○ @militarytimes
● #EmergingMarkets:○ @qzafrica○ @china
● #AlternativeInvestments:○ @techcrunch○ @preqin

Twitter Workflow
Curated News Feeds & Source Lists
Brian Colwell’s Twitter Network
Star Player Twitter Handles
Event Twitter Handles
Business Twitter Handles
Industry Events
Other Star Players
Firm Twitter Handle
Firm’s Branded Content

Twitter Workflow
Curated News Feeds & Source Lists
@bcolwell_econ @bcolwell_emgmkt
@bcolwell_alt @bcolwell_cta
@briandcolwell
@xxx_bob @xxx_bill @xxx_brenda @xxx_brent
@xxx_bobob @xxx_brit
@bcolwell_salt @firm_salt
@firm_sohn other?
@firm_news @firm_alts @firm_etc
Industry Events
@employee personal handles
@other?
@firm_xxx
Firm’s Branded Content

Twitter Workflow: @firm_news
Insights, community service/ philanthropy,
news from management, approach, process, what
sets us apart, press releases, media & videos,
monthly views, weekly round-up and blog
Firm Twitter Handle
Firm’s Branded Content
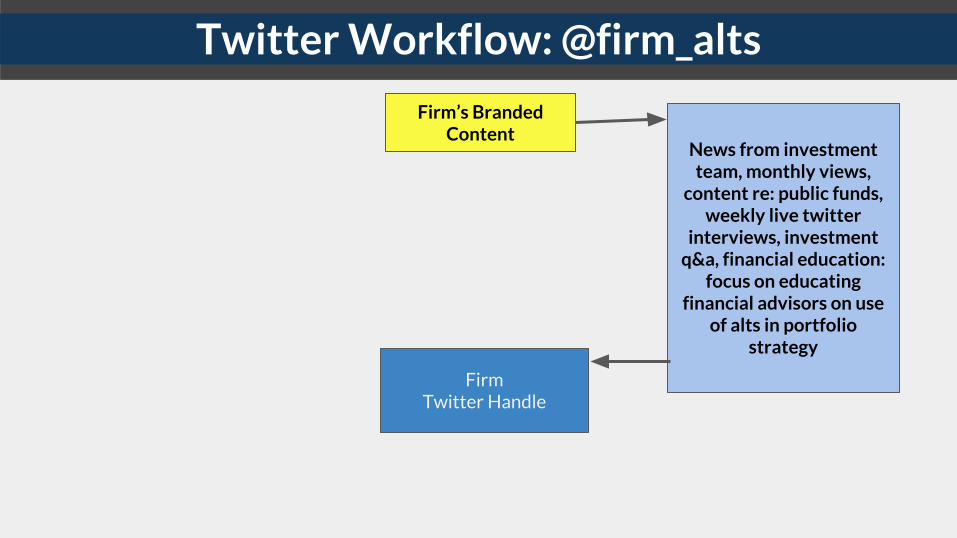
Twitter Workflow: @firm_alts
News from investment team, monthly views,
content re: public funds, weekly live twitter
interviews, investment q&a, financial education:
focus on educating financial advisors on use
of alts in portfolio strategy
Firm Twitter Handle
Firm’s Branded Content

Twitter Workflow: @firm_salt, @firm_sohn
Aggregating all event news,
improperly or untagged tweets, speaker tweets,
media tweets and content: “reporting
on the reporters”
Industry Events
Firm Twitter Handle
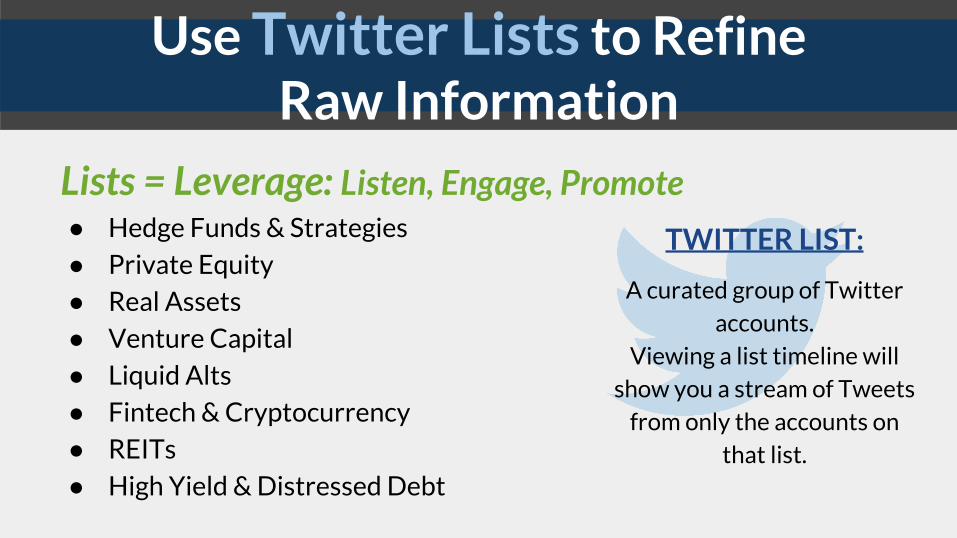
Use Twitter Lists to Refine Raw Information
Lists = Leverage: Listen, Engage, Promote● Hedge Funds & Strategies
● Private Equity
● Real Assets
● Venture Capital
● Liquid Alts
● Fintech & Cryptocurrency
● REITs
● High Yield & Distressed Debt
TWITTER LIST:
A curated group of Twitter accounts.
Viewing a list timeline will show you a stream of Tweets
from only the accounts on that list.

Not Just Talking About Twitter

Walsh Trading CTACase Study: 28 Day Findings

28-Day HighlightsTwitter● 0 to 1.5 Million Twitter Impressions ● +1,804 Twitter Followers ● Avg 822 Impressions Per Tweet● Top Tweet earned 29K Impressions● Top Mention earned 32 Engagements● Top Twitter News Stories on:
● #ManagedFutures● #GlobalMacro● $GLD
LinkedIn● 0 to 33,079 LinkedIn Impressions● +1,616 LinkedIn Connections

Hashtag Group: Agriculture
820,121 Impressions
746 Average Per Post
1,100Posts
2/27/16 - 3/26/16
4,406 Engagements
4 Average Per Post

Hashtag Group: Alt Investments
830,409 Impressions
709 Average Per Post
1,171Posts
2/27/16 - 3/26/16
3,736 Engagements
3 Average Per Post

Hashtag Group: Asset Management
1,764,492 Impressions
883 Average Per Post
1,999Posts
2/27/16 - 3/26/16
7,491 Engagements
4 Average Per Post

1,492 Average
Impressions Per Post
As of 3/26/16
#globalmacroTop News Story

1,153 Average
Impressions Per Post
As of 3/26/16
#managedfuturesTop News Story

Hashtag Group: Energy
727,956 Impressions
1,223 Average Per Post
595Posts
2/27/16 - 3/26/16
2,505 Engagements
4 Average Per Post

Hashtag Group: Metals
582,451 Impressions
868 Average Per Post
671Posts
2/27/16 - 3/26/16
3,089 Engagements
5 Average Per Post

870 Average
Impressions Per Post
As of 3/26/16
$GLDTop News Story

2,766 Average
Impressions Per Post
As of 3/26/16
#basemetals

Twitter Hashtag Ownership

Twitter Engagement
● Getting noticed by influencers in our niche

Twitter Engagement
1
2
3
Engagement
Furthering the Conversation
Boosting Impressions

Top Mentions

362 @walsh_trading
1,316 Walsh Trading
Star Players
2,469 Brian D Colwell
Network
4,146Followers
As of 3/26/16
Twitter Followers

ProducersTop Followers
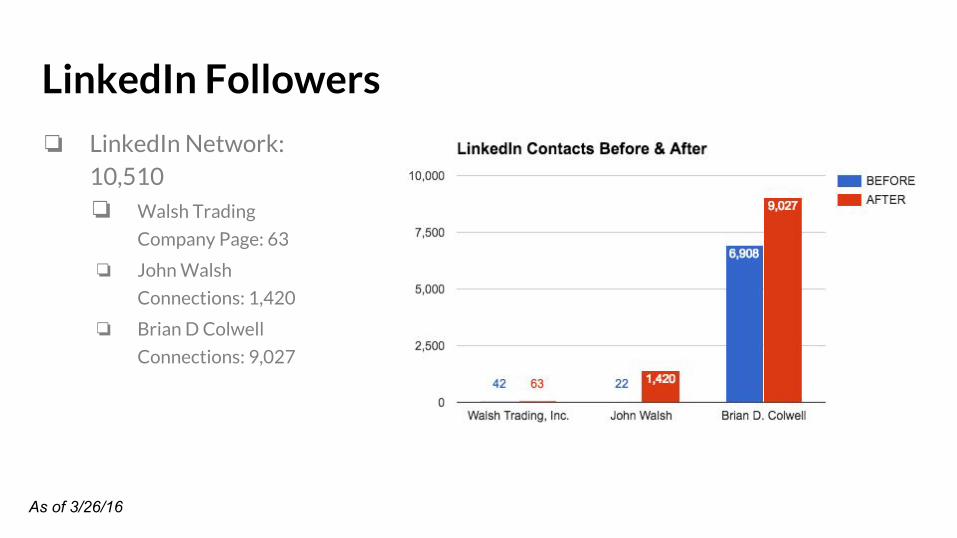
LinkedIn Followers
❏ LinkedIn Network: 10,510❏ Walsh Trading
Company Page: 63
❏ John Walsh
Connections: 1,420
❏ Brian D Colwell
Connections: 9,027
As of 3/26/16

Twitter Posts & Impressions

60 Average Posts Per Day
316@walsh_trading
1,763Walsh Trading
Star Players
1,985Brian D Colwell
Network
4,064Posts
2/27/16 - 3/26/16
Twitter Posts

Impression-Building Posts
Top Posts
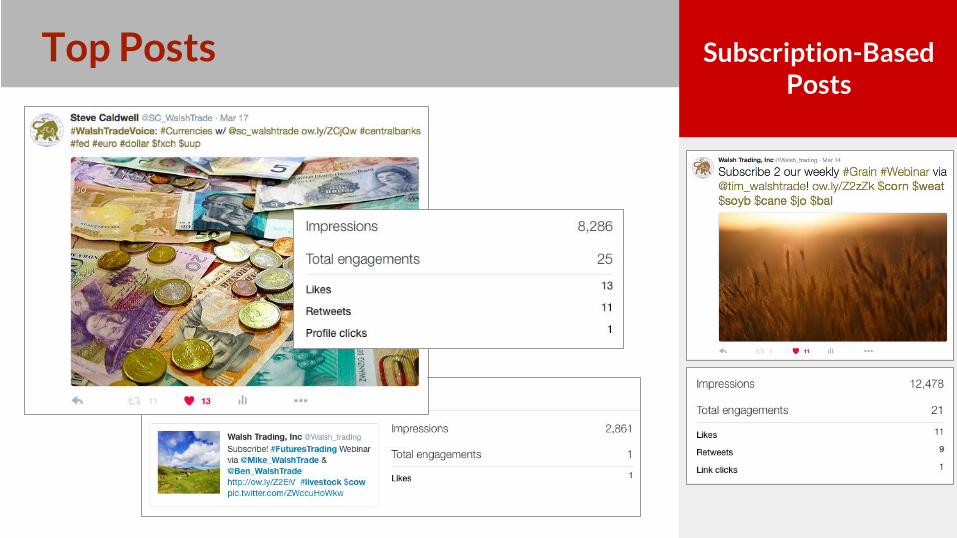
Subscription-Based Posts
Top Posts

822 Average Impressions Per Post
384,740 @walsh_trading
1,180,939Walsh Trading
Star Players
1,775,432 Brian D Colwell
Network
3,341,111Impressions
2/27/16 - 3/26/16
Twitter Impressions

5,331,10028-Day
Impression Count As of 3/26/16
28-Day Impression Count
389,000 @walsh_trading
1,164,100 Walsh Trading
Star Players
3,778,000 Brian D Colwell Network

LinkedIn Followers & Posts

LinkedIn Posts, Impressions, & Engagement
❏ 254 posts❏ 33,079 impressions❏ 130 impressions/post❏ 2 engagements/post
LinkedIn Post Activity: 3/2/16 - 3/26/16

Top Performing LinkedIn Posts

Defining & Measuring Social Media SuccessKPI Definition 2/27/16 3/26/16
Phase 1: Content Aggregation
Walsh Trading Content Promoted
Each piece of content (audio, webinar, blog, etc) 0 52
Phase 2: Authorship Profile Views Google+ views 15,421 17,026
Phase 3A: @walsh_trading Distribution
Main Page Post Impressions Number of times a tweet populated a twitter user’s feed: 28 Day Summary; @BColwell+++
9,928 384,740
Phase 3B: Star Player Distribution
Walsh Trading Players 0 1,180,939
BDC Network 3,362,000 3,778,000
Phase 4: Twitter Engagement
Followers Twitter users following @walsh_trading or Walsh Trading star players’ news feeds
44 1,848(3/31/16)
Phase 5: LinkedIn Presence
Update Impressions Number of times an update populated a LinkedIn user’s news feed
0 33,079
Phase 6: LinkedIn Engagement
Followers LinkedIn users following Walsh Trading’s company page and/or connected with John Walsh
42 1,658(3/31/16)

Month 1 Performance
2/27/16 Week 1 Week 2 Week 3Week 4
(as of 3/26)Month
End
Phase 1: Content Promoted
-- 11 21 20 0 52
Phase 3A: @walsh_trading Impressions *
9,928 44,800 198,000 319,000 384,740 384,740
Phase 3B: Star Player Impressions*
3,362,000 3,302,361 3,838,600 4,316,100 4,958,939 4,958,939
Phase 4: Twitter Followers (Company + Star Players)
44 347 979 1,3681,848
(3/31/16)1,848
(3/31/16)
Phase 5: LinkedIn Post Impressions*
0 4573 15,935 24,414 33,079 33,079
Phase 6: LinkedIn Followers (Company + John Walsh)
42 429 852 1,1231,658
(3/31/16)1,658
(3/31/16)
* Twitter impressions reported are 28-day running value

WalshTrading.com Analytics

502 Unique Users
64%New Visitors
2.9Pages Per Session
2:18Average Session Duration
704Sessions
2/27/16 - 3/26/16
WalshTrading.com Traffic
Traffic peaks during the week, generally between Tuesday and Thursday.

Top 5 Web Pages
Web Traffic: 2/27/16 - 3/26/16
PageviewsAverage
Time on PageBounce Rate Exit
All Traffic 2,012 2:18 Session Duration
48%Not Applicable
Home Page 693 1:26 44% 44%
Team 144 1:25 66% 43%
Walsh Trading Insights 133 3:32 50% 56%
Executive Team 95 1:12 40% 32%
Careers 79 0:51 84% 44%

User Behavior By Traffic Source
Web Traffic: 2/27/16 - 3/26/16
Sessions New UsersNew
SessionsPages Per
Session
Average Session
Duration
Bounce Rate
All Traffic 704 502 64% 2.9 2:18 48%
Organic 378 241 64% 3.3 3:07 44%
Direct 195 111 57% 2.2 1:11 52%
Referral 65 48 74% 2.5 1:45 62%
Social 57 49 86% 3.0 1:25 42%
Email 9 2 22% 1.4 0:49 67%

Top 5 Referral Sources
Web Traffic: 2/27/16 - 3/26/16
Share of Total Sessions
Bounce RatePages Per
Session
Average Session
Duration
All Referral Traffic (65 sessions) 100% 62% 2.5 1:45
Twitter (t.co) 30% 56% 1.8 0:59
insidefutures.com 16% 45% 3.0 1:56
LinkedIn 14% 6% 5.9 2:39
investing.com 12% 60% 3.5 1:55
Email (us3.campaignarchive1.com)
5% 0% 2.5 2:50

Walsh Trading was a great partner and made significant contributions to this project.
Special thanks to Bill Reavis, Head of Asset Management at Walsh Trading. @WGR101

Social Media Manager for HireBrian D. Colwell
[email protected]://briandcolwell.com
Build Your Social Authority
● Emerging & Frontier Markets
● Global Macro & Commodities
● Economics & GeoPolitics
● Alternative Investments
“Great answers aren’t found on paved roads and well-beaten paths.
Great answers live in the wild. I vow to venture deep into the digital jungle
in the hunt for knowledge.”