alternative energy outlook for growth remains strong · alternative energy – outlook for growth...
TRANSCRIPT

Alternative Energy – Outlook for Growth Remains Strong
Keith Adams, Moderator Principal
Deloitte Transactions and Business Analytics LLP
Tom Kimbis Interim President and Chief Executive Officer
Solar Energy Industries Association
Peter L. Kelley Vice President, Public Affairs
American Wind Energy Association

U.S. Solar Market Overview
2016 Deloitte Energy Conference
Tom Kimbis
Solar Energy Industries Association (SEIA)
July 6, 2016 © 2016 Solar Energy Industries Association® 2

About SEIA
• U.S. National Trade Association for Solar Energy
• Founded in 1974
• 1,000 member companies from all 50 states
• Our Mission: Build a strong solar industry to power America
• Our Goal: 100 gigawatts of solar capacity by 2020
July 6, 2016 © 2016 Solar Energy Industries Association® 3

Solar Growth with the ITC
July 6, 2016 © 2016 Solar Energy Industries Association® 4
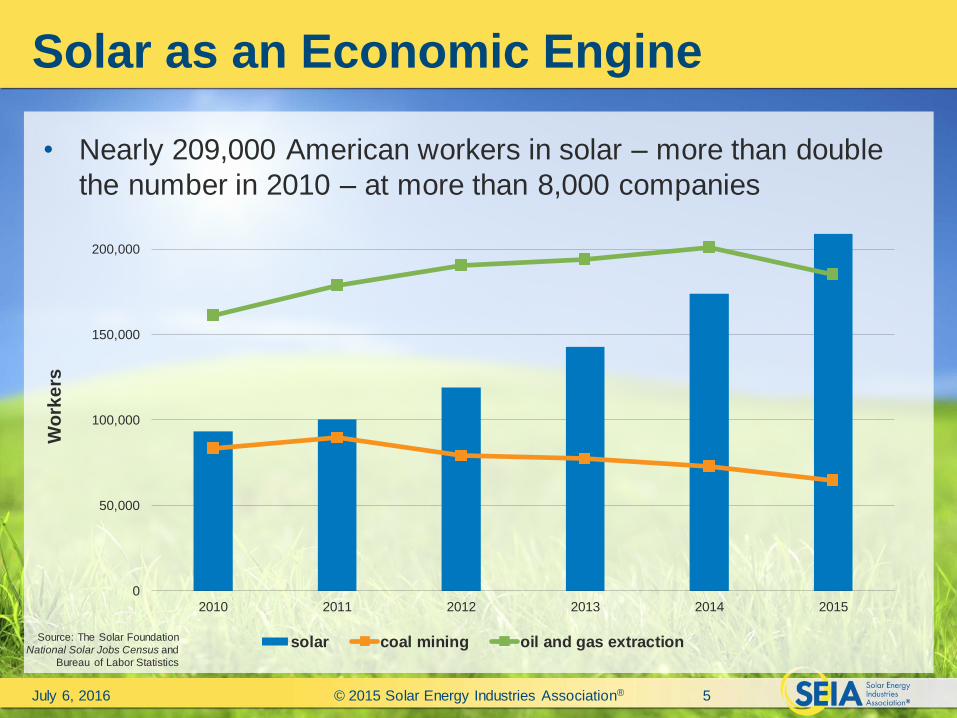
Solar as an Economic Engine
• Nearly 209,000 American workers in solar – more than double
the number in 2010 – at more than 8,000 companies
July 6, 2016 © 2015 Solar Energy Industries Association® 5
Source: The Solar Foundation
National Solar Jobs Census and
Bureau of Labor Statistics
0
50,000
100,000
150,000
200,000
2010 2011 2012 2013 2014 2015
Wo
rke
rs
solar coal mining oil and gas extraction
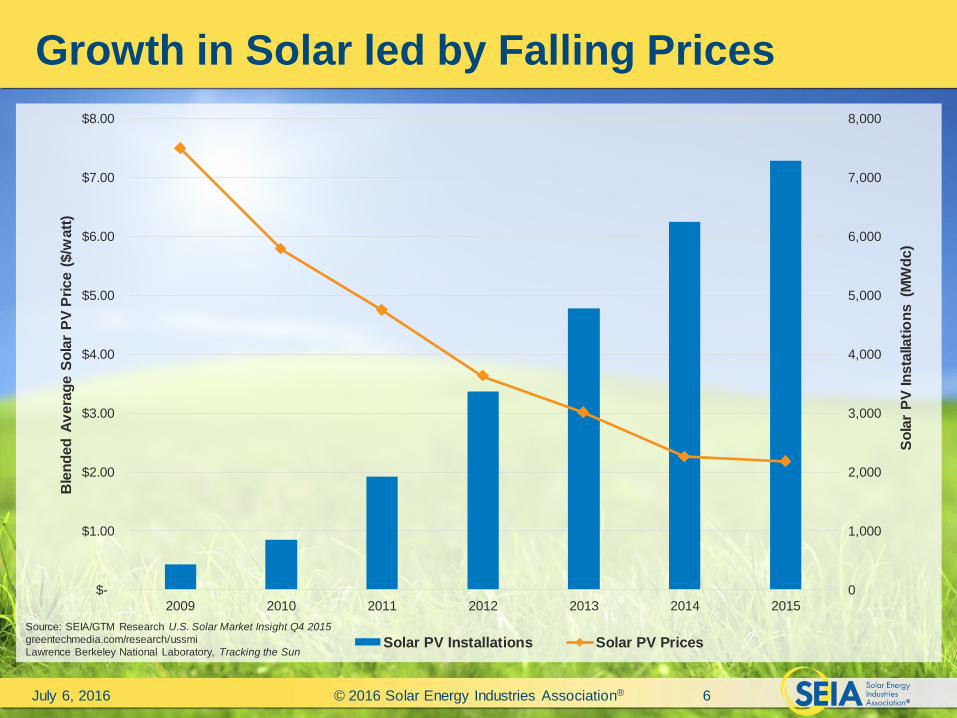
Growth in Solar led by Falling Prices
July 6, 2016 © 2016 Solar Energy Industries Association® 6
0
1,000
2,000
3,000
4,000
5,000
6,000
7,000
8,000
$-
$1.00
$2.00
$3.00
$4.00
$5.00
$6.00
$7.00
$8.00
2009 2010 2011 2012 2013 2014 2015
So
lar
PV
In
sta
llati
on
s (M
Wd
c)
Ble
nd
ed
Av
era
ge S
ola
r P
V P
rice (
$/w
att
)
Solar PV Installations Solar PV PricesSource: SEIA/GTM Research U.S. Solar Market Insight Q4 2015
greentechmedia.com/research/ussmi
Lawrence Berkeley National Laboratory, Tracking the Sun

U.S. Solar Market Through Q1 2016
• 7.5 GW of solar installed in 2015 – 19% growth in PV market over 2014
– Compound annual growth rate of 58% since 2010
• Over 29 GW of total solar capacity installed – Generates enough electricity to power 5.7 million homes
• Solar prices dropped 3% in 2015 from 2014 – Price drop accelerated in Q1 2016, down 12% y/y
– Prices have dropped over 70% since 2006
– Utility-Scale PPAs now signed for $0.03 - $0.05/kWh
• Solar has reached 1% of total US electric generation – Up from 0.1% just 5 years ago
– Expected to hit 3.5% by 2020
• In Q1 2016 reached 1 million solar installations – Will hit 2 million installs within just 2 years
July 6, 2016 © 2014 Solar Energy Industries Association® 7
Source: SEIA/GTM Research
U.S. Solar Market Insight

Solar PV Price Breakdown
July 6, 2016 © 2016 Solar Energy Industries Association® 8
$-
$0.50
$1.00
$1.50
$2.00
$2.50
$3.00
$3.50
Residential Commercial Utility-Scale
$/w
att
-dc
Q1 2016 Quoted PV Prices
PV Module Inverter Electrical BOS Structural BOS Direct Labor Engineering and PII Supply Chain, Overhead, Margin
Soft Costs
(63% of residential
installation cost)
Source: SEIA/GTM Research
U.S. Solar Market Insight

U.S is a 50 state market
July 6, 2016 © 2016 Solar Energy Industries Association® 9
California, 11,987
North Carolina, 2,087
Arizona, 2,020
New Jersey, 1,631
Nevada, 1,041
Massachusetts, 1,037
New York, 638
Hawaii, 557
Colorado, 542
Texas, 537
Others, 3,519
2015 Year-End Cumulative Solar PV Capacity (MW-dc)
Source: SEIA/GTM Research
U.S. Solar Market Insight

Residential & Commercial (Distributed)
July 6, 2016 © 2016 Solar Energy Industries Association® 10
0
500
1,000
1,500
2,000
2,500
3,000
2006 2007 2008 2009 2010 2011 2012 2013 2014 2015 2016E
Meg
aw
att
s
Yearly U.S. Solar Photovoltaic (PV) Installations
Residential (PV) Non-residential (PV) Source: SEIA/GTM Research
U.S. Solar Market Insight
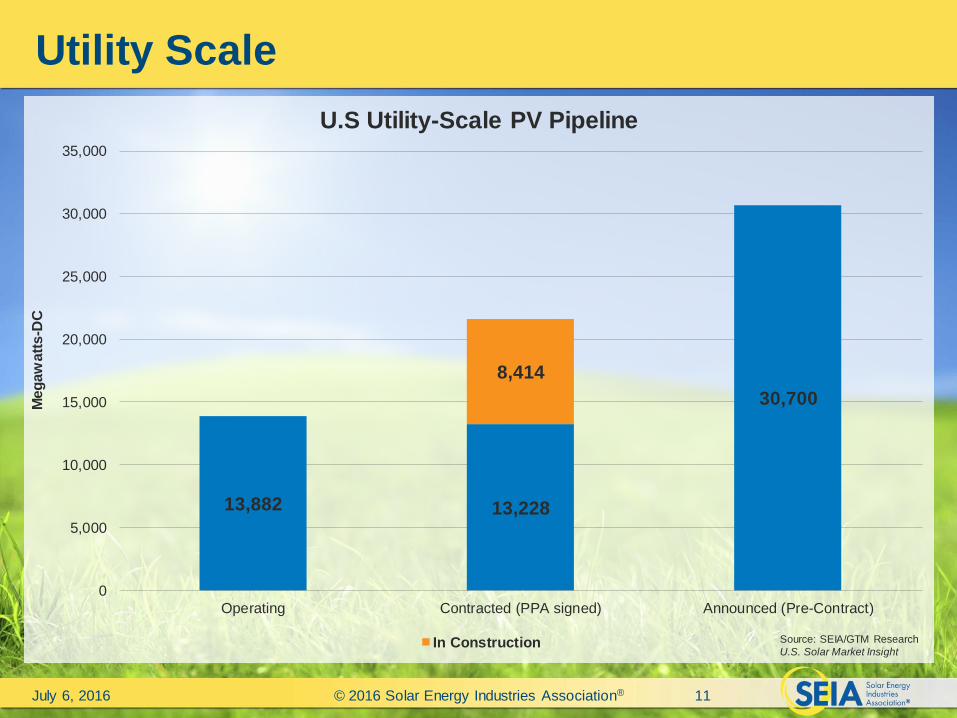
Utility Scale
July 6, 2016 © 2016 Solar Energy Industries Association® 11
13,882 13,228
30,700
8,414
0
5,000
10,000
15,000
20,000
25,000
30,000
35,000
Operating Contracted (PPA signed) Announced (Pre-Contract)
Meg
aw
att
s-D
C
U.S Utility-Scale PV Pipeline
In Construction Source: SEIA/GTM Research
U.S. Solar Market Insight

Extending the ITC
• Extended at 30% through the end of 2019
– Drops to 26% in 2020 and 22% in 2021
– After 2021, Commercial credit drops to 10%, Residential
credit expires
• Commence Construction language added
– Projects must be placed in service before the end of 2023
July 6, 2016 © 2016 Solar Energy Industries Association® 12

Industry At Risk
July 6, 2016 © 2016 Solar Energy Industries Association® 13
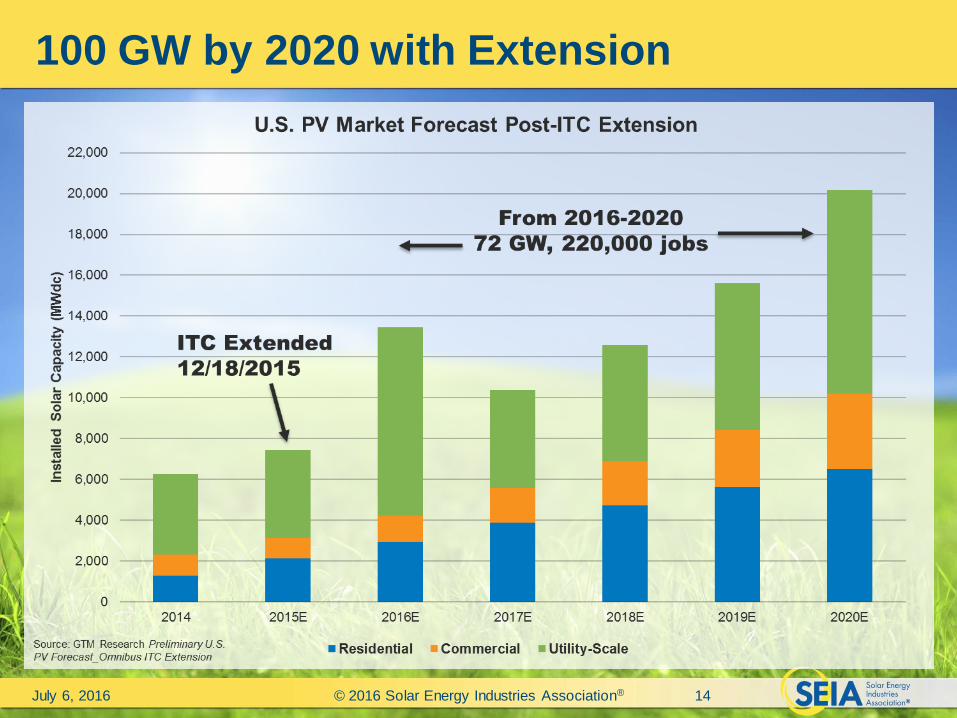
100 GW by 2020 with Extension
July 6, 2016 © 2016 Solar Energy Industries Association® 14

Net Metering
July 6, 2016 © 2016 Solar Energy Industries Association® 15

Net Metering
July 6, 2016 © 2016 Solar Energy Industries Association® 16
• Under current NEM rules, distributed generation solar
at grid parity in 20 states
Source: Shayle Kann, GTM Research
U.S. Solar Market Insight Conference
Keynote: The Future of Solar

Net Metering
July 6, 2016 © 2016 Solar Energy Industries Association® 17
• If export rate is cut in half, 0 states at grid parity
• Nevada outcome looms large, but not emblematic of
NEM policy nationally
Source: Shayle Kann, GTM Research U.S. Solar
Market Insight Conference Keynote: The Future of
Solar
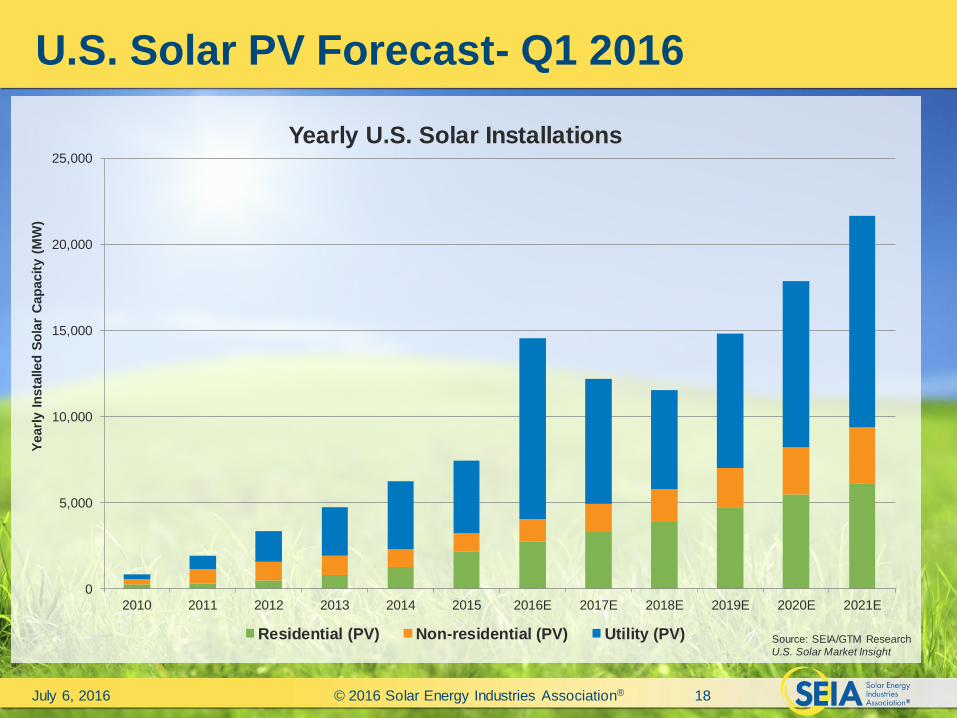
U.S. Solar PV Forecast- Q1 2016
July 6, 2016 © 2016 Solar Energy Industries Association® 18
0
5,000
10,000
15,000
20,000
25,000
2010 2011 2012 2013 2014 2015 2016E 2017E 2018E 2019E 2020E 2021E
Yearl
y I
nsta
lled
So
lar
Cap
acit
y (
MW
)
Yearly U.S. Solar Installations
Residential (PV) Non-residential (PV) Utility (PV) Source: SEIA/GTM Research
U.S. Solar Market Insight

2016 and Beyond
• 14.5 GW of solar expected in 2016
– Nearly double the 2015 total
– Equal to half of the solar capacity online today
– Continue to see shift of 2016 utility-scale projects to
2017, 2018
• Developers add to massive project pipeline
– Build-out pressure decreases with extension
– Nearly 19 GW contracted BEFORE extension of ITC
• New States enter the mix
– Continued price declines, ITC Extension, Clean Power
Plan bring formerly marginal states into play
July 6, 2016 © 2016 Solar Energy Industries Association® 19
Source: SEIA/GTM Research
U.S. Solar Market Insight

Solar Moving Beyond Traditional Markets:
Distributed Generation
July 6, 2016 © 2016 Solar Energy Industries Association® 20
State2011-15 DG
MW
2016-2020 DG
MWDG Growth
1 California 3,880 13,234 9,353
2 New York 510 2,711 2,201
3 Massachusetts 937 2,256 1,319
4 Maryland 306 1,111 805
5 Connecticut 185 912 727
6 New Jersey 1,132 1,683 551
7 Texas 113 598 486
8 Florida 106 574 468
9 Minnesota 28 472 444
10 Vermont 55 399 345
Top 10 DG States by Absolute Growth
State2011-15 DG
MW
2016-2020 DG
MWDG % Growth
1 South Carolina 8 172 2097%
2 Minnesota 28 472 1579%
3 Indiana 9 130 1348%
4 Virginia 19 208 1003%
5 Michigan 15 151 936%
6 New Hampshire 23 222 868%
7 District of Columbia 15 136 796%
8 Delaware 32 271 752%
9 Illinois 22 180 731%
10 Vermont 55 399 632%
Top 10 DG States by % Growth
Source: SEIA/GTM Research Source: SEIA/GTM Research
U.S. Solar Market Insight

Solar Moving Beyond Traditional Markets:
Utility-Scale
July 6, 2016 © 2016 Solar Energy Industries Association® 21
State
2011-15
Utility-Scale
MW
2016-2020
Utility-Scale
MW
Utility-Scale
Growth
1 Texas 394 4,233 3,840
2 California 7,179 10,407 3,229
3 Utah 194 1,466 1,272
4 Nevada 777 1,978 1,201
5 Florida 21 1,173 1,152
6 Georgia 339 1,392 1,054
7 New Mexico 250 1,287 1,037
8 Oregon 26 1,042 1,016
9 Colorado 162 956 794
10 Virginia 2 750 748
Top 10 Utility-Scale States by Absolute Growth
State
2011-15
Utility-Scale
MW
2016-2020
Utility-Scale
MW
Utility-Scale
% Growth
1 Washington 0.0 142.4 -
2 Iowa 0.0 68.0 -
3 Louisiana 0.0 33.7 -
4 New Hampshire 0.0 12.5 -
5 Virginia 2.1 750.4 36414%
6 Minnesota 2.3 682.6 29578%
7 Michigan 1.3 333.5 26372%
8 South Carolina 3.7 525.2 14095%
9 Florida 20.9 1,173.0 5511%
10 Oregon 26.3 1,041.8 3861%
Top 10 Utility-Scale States by % Growth
Source: SEIA/GTM Research
Source: SEIA/GTM Research
U.S. Solar Market Insight

Other Issues to Watch
• 2016 Elections
• Access to Capital
• Workforce Development – Industry will double number of employees over 5 years
– Committed to hiring 50,000 veterans by 2020
• Technology Advances – Storage, Electric Vehicles, Continued Price Declines
• Grid Integration
– What does the grid of the future look like?
• Post-Clean Power Plan? – More ambitious plan needed to meet climate goals
July 6, 2016 © 2016 Solar Energy Industries Association® 22

Thank You
Tom Kimbis
Interim President
Solar Energy Industries Association (SEIA)
202-682-0556
July 6, 2016 © 2016 Solar Energy Industries Association® 23
Wind power: Low-cost, scalable, reliable
Peter L. Kelley
Vice President, Public Affairs
AWEA
Low-cost solution

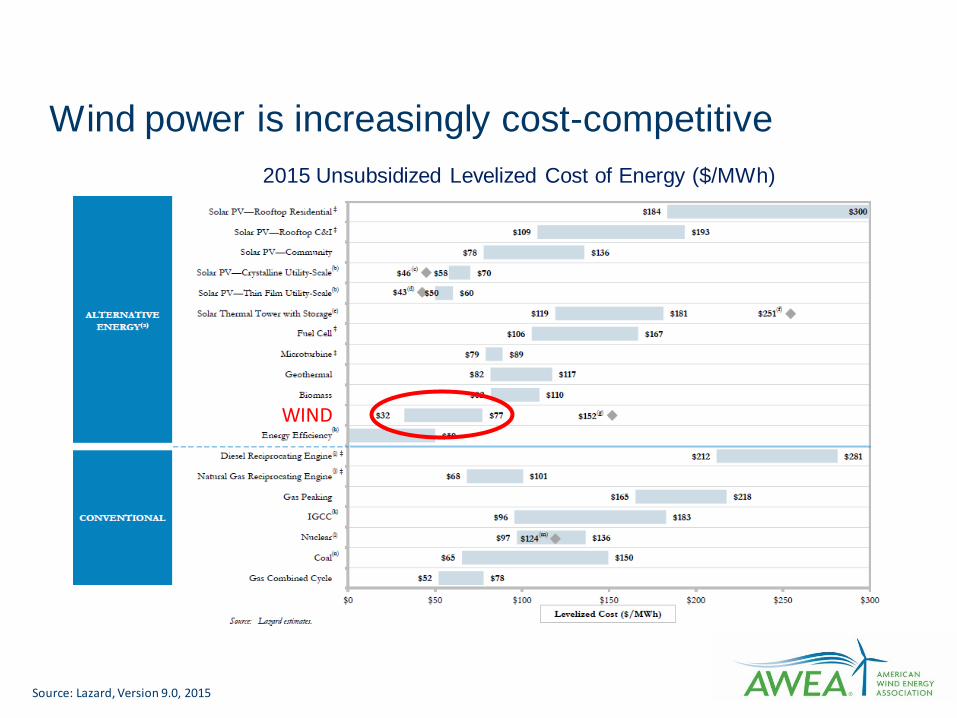
Wind power is increasingly cost-competitive
Source: Lazard, Version 9.0, 2015
2015 Unsubsidized Levelized Cost of Energy ($/MWh)
WIND
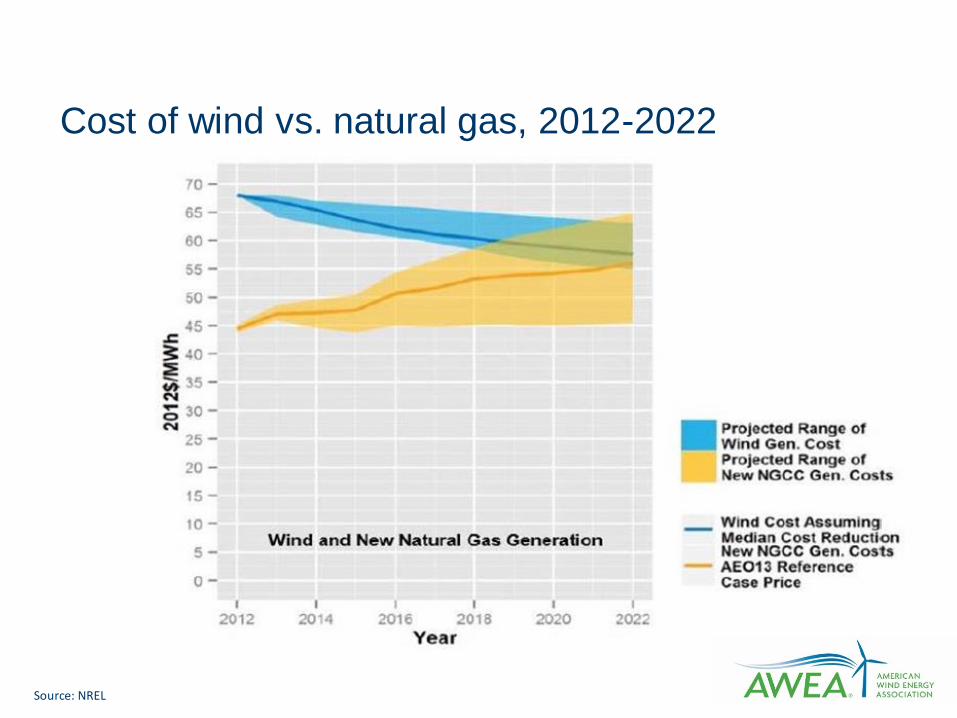
Cost of wind vs. natural gas, 2012-2022
Source: NREL
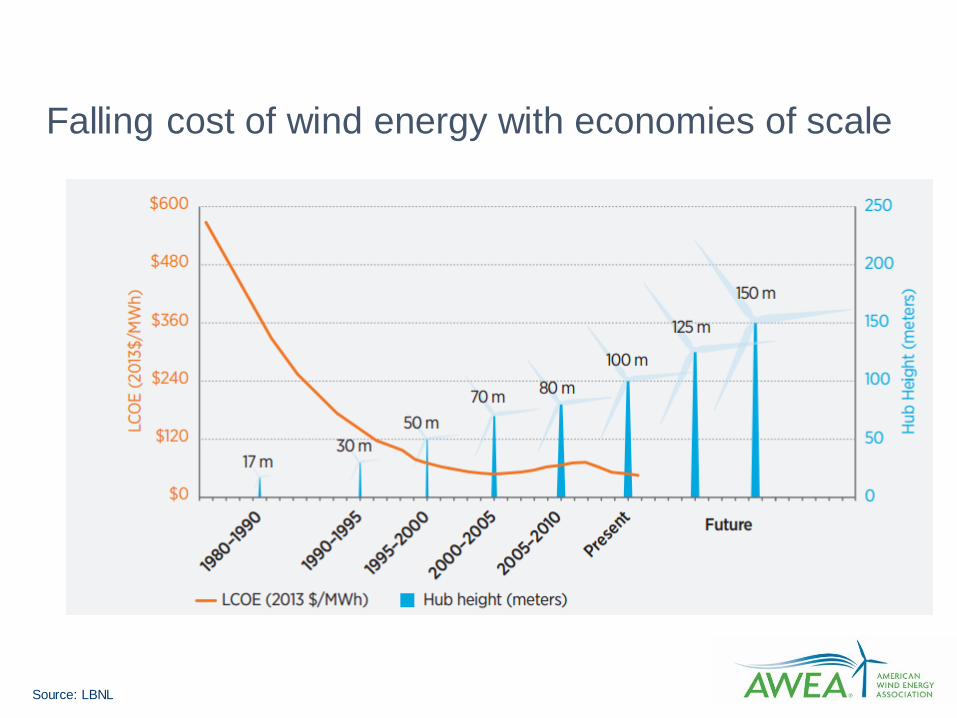
Source: LBNL
Falling cost of wind energy with economies of scale

More reasons for falling wind costs
• Policies now predictable
• Optimized siting
• Technology accessing higher winds
• More transmission to cities
• Data-driven O&M
• US manufacturing
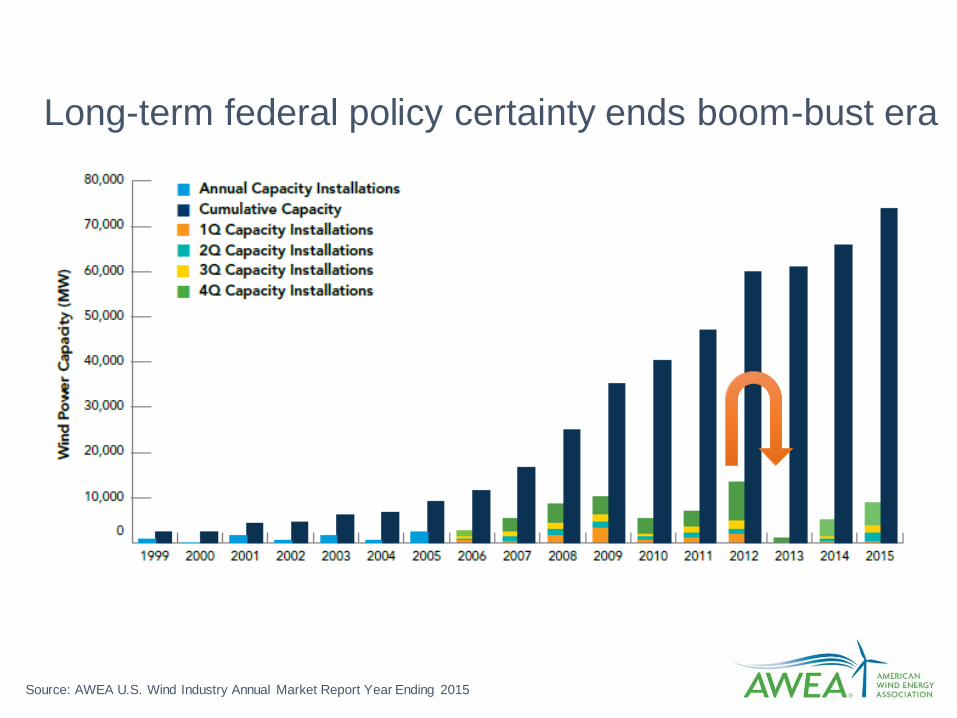
Long-term federal policy certainty ends boom-bust era
Source: AWEA U.S. Wind Industry Annual Market Report Year Ending 2015

New technology reaches higher winds in more regions
Wind resource potential at
110 meters
Wind resource potential at
turbine hub height of 80 meters
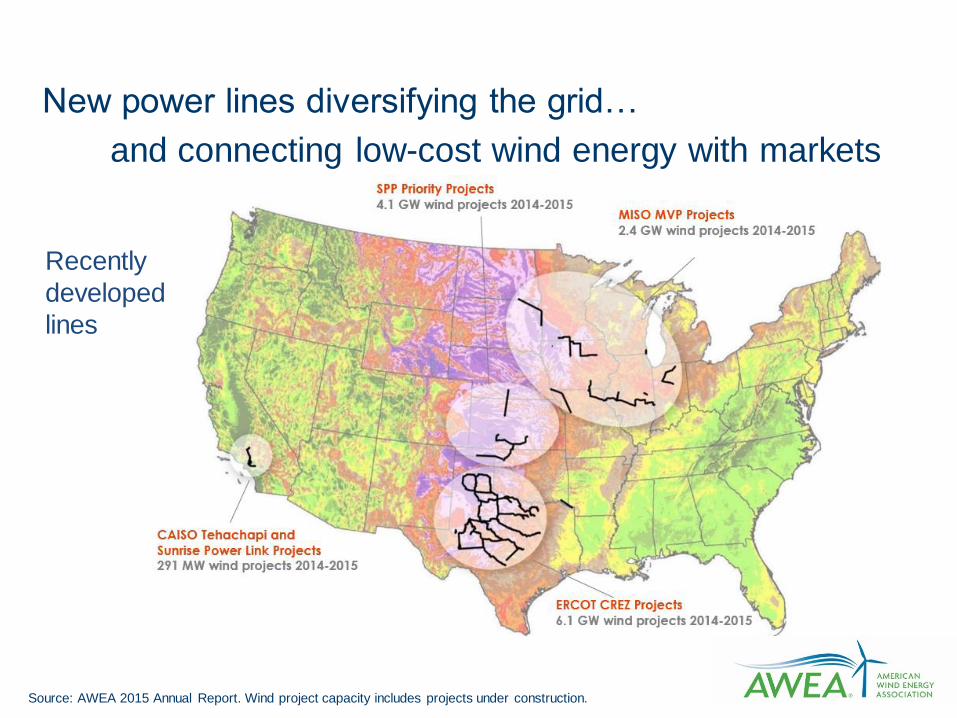
New power lines diversifying the grid…
and connecting low-cost wind energy with markets
Source: AWEA 2015 Annual Report. Wind project capacity includes projects under construction.
Recently
developed
lines


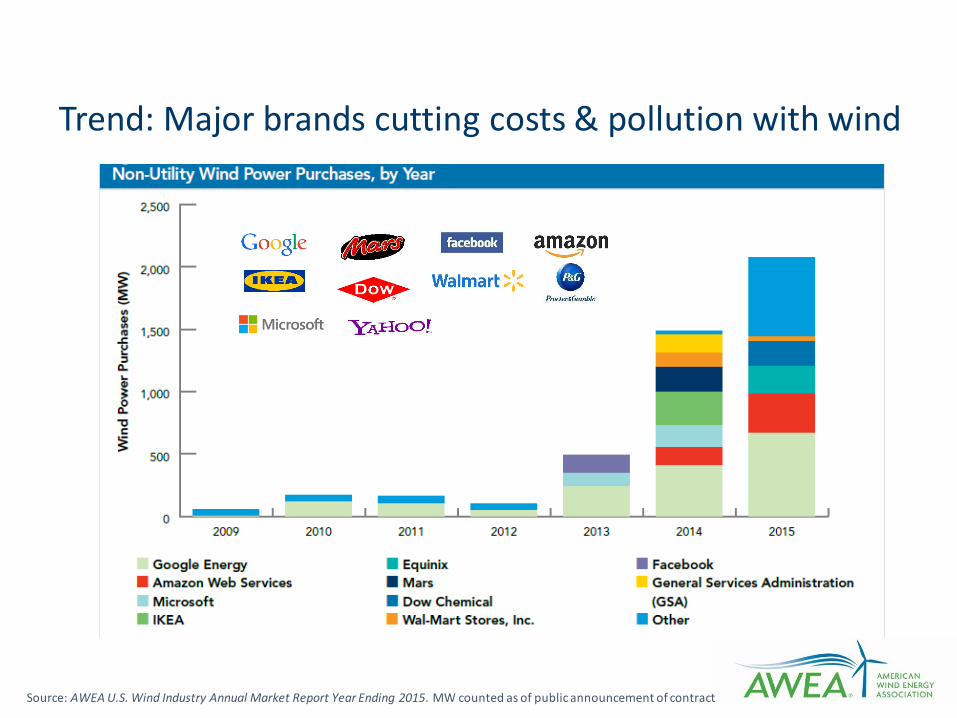
Trend: Major brands cutting costs & pollution with wind
Source: AWEA U.S. Wind Industry Annual Market Report Year Ending 2015. MW counted as of public announcement of contract

Scalable

Wind was biggest source of new electric power in 2015
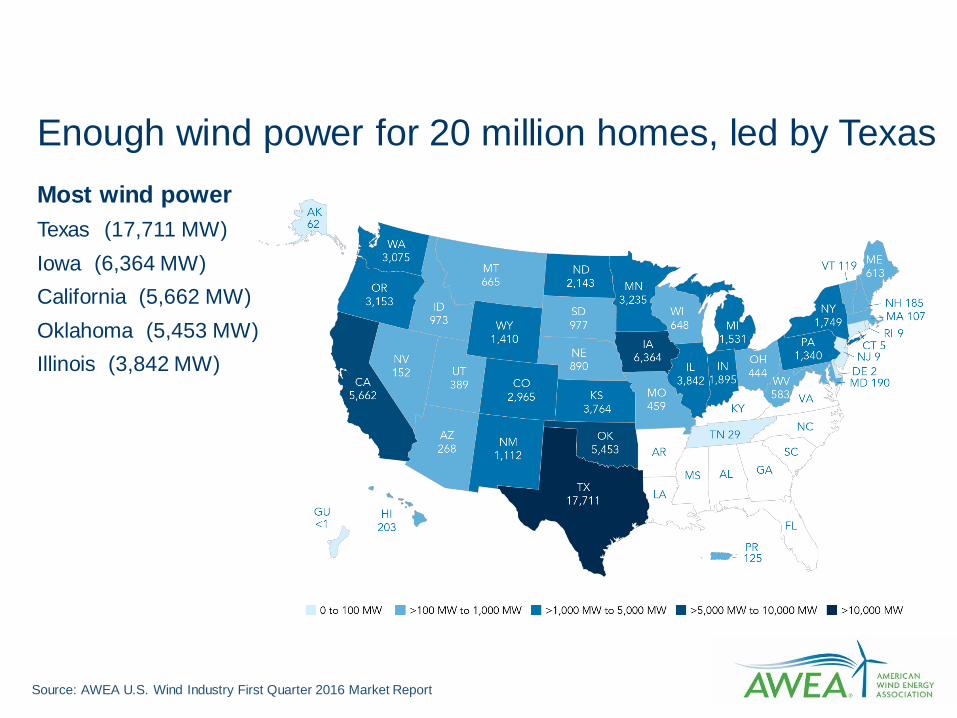
Enough wind power for 20 million homes, led by Texas
Most wind power
Texas (17,711 MW)
Iowa (6,364 MW)
California (5,662 MW)
Oklahoma (5,453 MW)
Illinois (3,842 MW)
Source: AWEA U.S. Wind Industry First Quarter 2016 Market Report

88,000 wind jobs today – growing to 360,000 in 2030
Source: AWEA U.S. Wind Industry Annual Market Report Year Ending 2015
Most wind jobs
Texas (24,001-25,000)
Oklahoma (7,001-8,000)
Iowa (6,001-7,000)
Colorado (6,001-7,000)
Kansas (5,001-6,000)


State RPS laws generate demand for wind energy
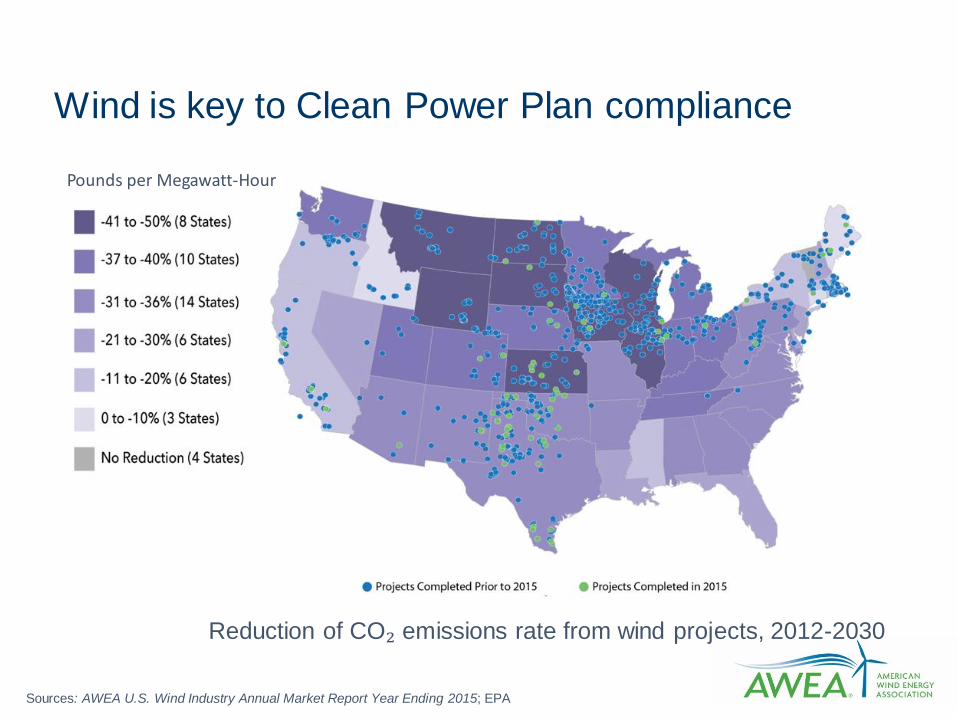
Wind is key to Clean Power Plan compliance
Reduction of CO₂ emissions rate from wind projects, 2012-2030
Pounds per Megawatt-Hour
Sources: AWEA U.S. Wind Industry Annual Market Report Year Ending 2015; EPA


Source: EIA; China Electricity Council, 2015

U.S. offshore wind energy: the new frontier

Grid reliability

Variability & uncertainty nothing new for grid operators
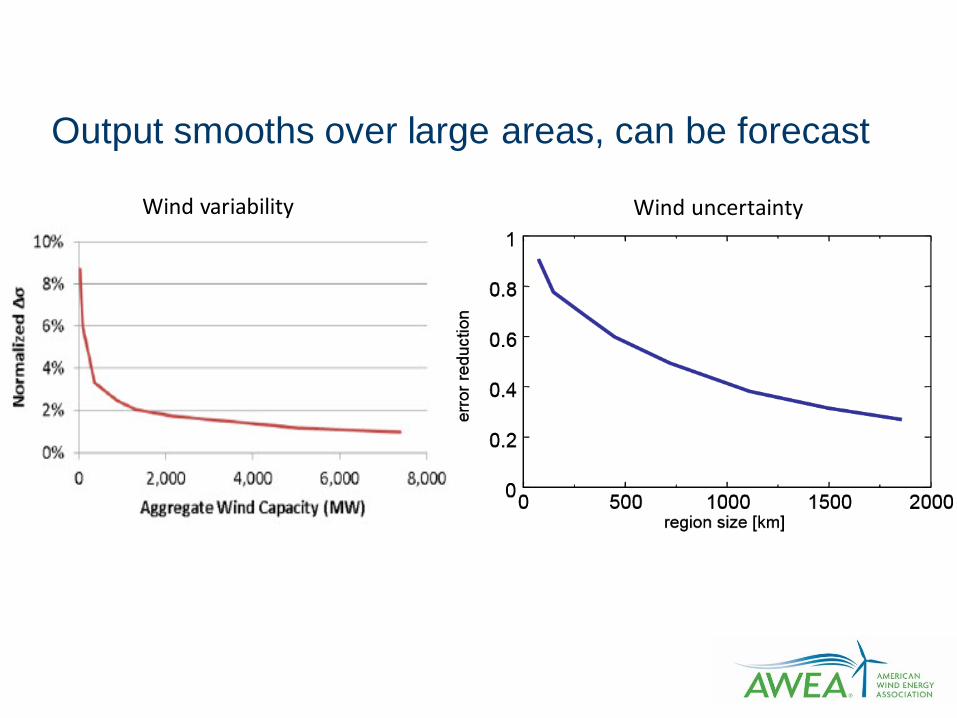
Wind variability Wind uncertainty
Output smooths over large areas, can be forecast

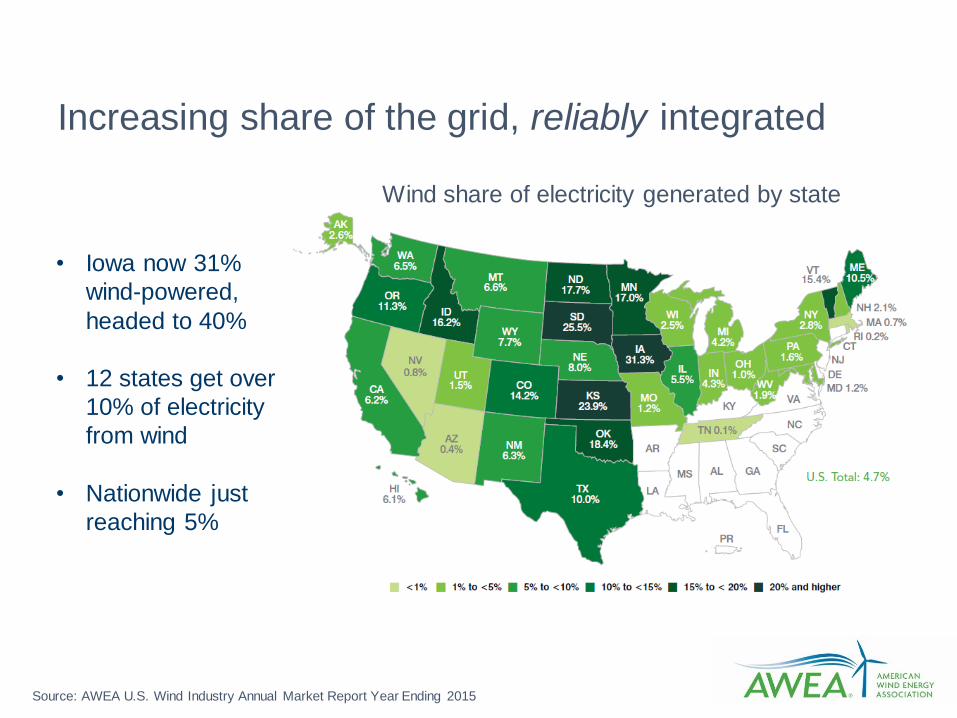
Increasing share of the grid, reliably integrated Wind share of electricity generated by state
Source: AWEA U.S. Wind Industry Annual Market Report Year Ending 2015
• Iowa now 31%
wind-powered,
headed to 40%
• 12 states get over
10% of electricity
from wind
• Nationwide just
reaching 5%
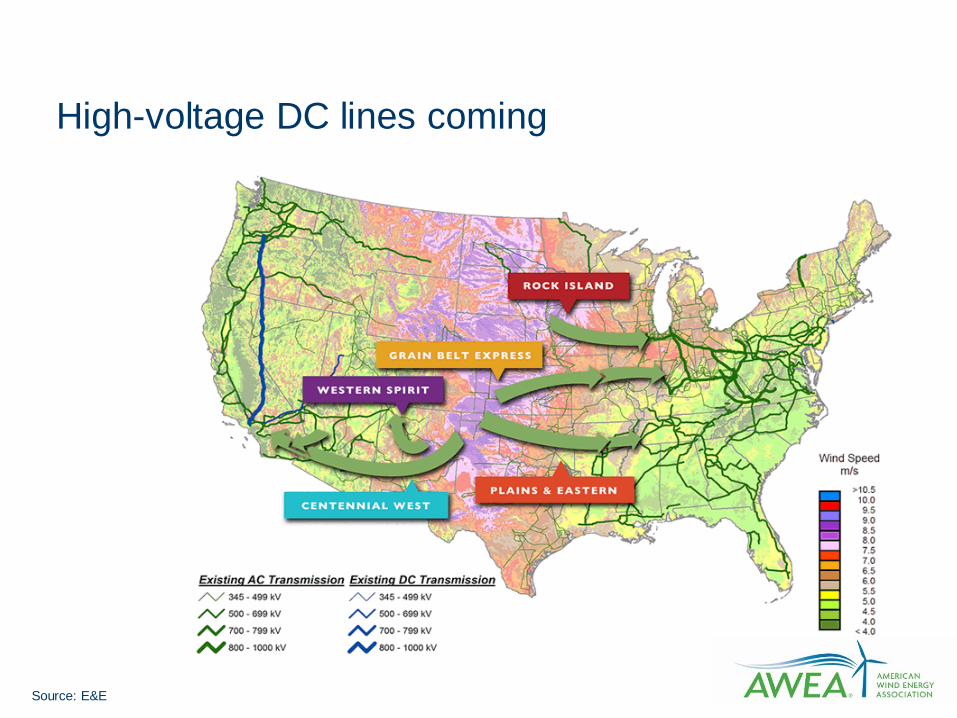
Source: E&E
High-voltage DC lines coming
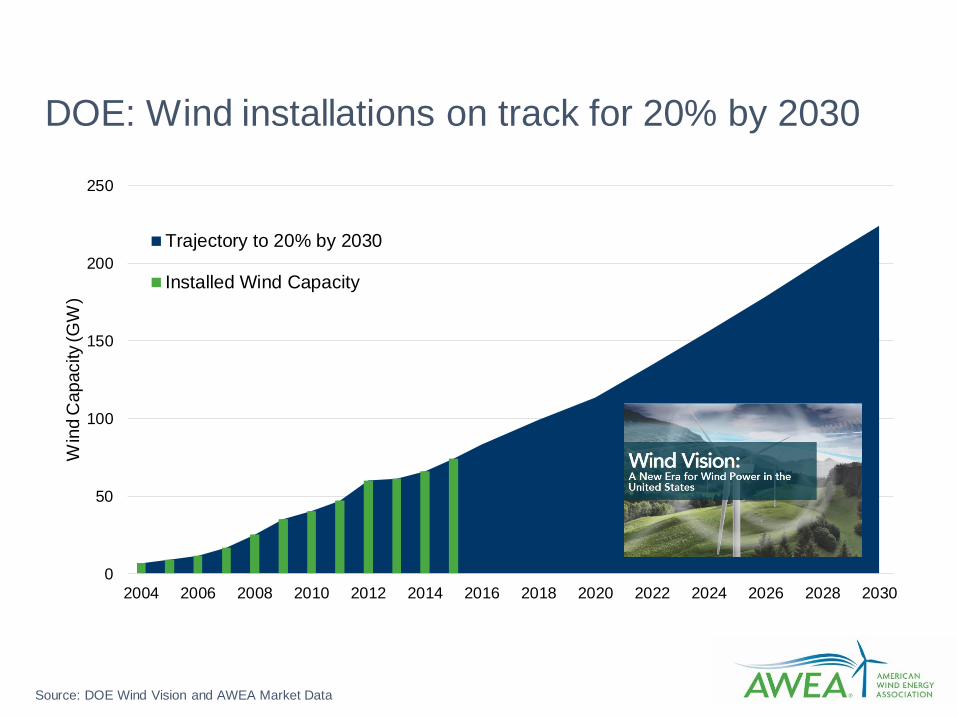
DOE: Wind installations on track for 20% by 2030
Source: DOE Wind Vision and AWEA Market Data
0
50
100
150
200
250
2004 2006 2008 2010 2012 2014 2016 2018 2020 2022 2024 2026 2028 2030
Win
d C
apacity (G
W)
Trajectory to 20% by 2030
Installed Wind Capacity


Questions?