alternative approaches to reinstating a taxable property
TRANSCRIPT
Alternative Approaches To ReinstatingA Taxable Property Values Survey
by Robert P. Strauss
1. Introduction
Although property taxes have always been impor-tant to the financing of U.S. local governments,those taxes and the underlying assessment of realestate have never been popular in the UnitedStates.1 For the past 20 years, property taxes haveconstituted about 30 percent of general state andlocal tax collections, and much higher proportions ofjust local finance. As of the close of June 2008,annual property tax collections were $404.5 billion— more than state and local sales and use taxcollections and more than state and local individualincome tax collections.2
Although the property tax has remained sizableand unpopular, we know far less today on a system-
atic basis through publicly funded statistical agen-cies about the details of it than we used to.3 In 1987the Governments Division of the U.S. Bureau of theCensus stopped collecting and publishing state-by-state descriptions of the legal and institutional en-vironment surrounding the collection of the propertytax, and in 1982 it stopped collecting and publishingstatistics on local taxable property values or salesprice ratios. The collection of the latter was beguninitially as a series of special studies in the 1940s,and later became an integral part of its quinquen-nial Census of Governments4 over 1957-1982.5
In 1999, 19 members of the Committee on PropertyTaxation of the National Tax Association wrote to theCensus Bureau6 requesting reinstatement of the tax-able property value studies. However, Census Bu-reau Director Ken Prewitt and later directors havedeclined to reinstate the taxable property valuesmeasurement and report. During its deliberations in2007, the National Research Council (NRC) panelwas told that reinstating the taxable property valuesreport would cost $26 million, or more than the Gov-ernments Division’s overall budget. Although thepanel was aware of the tight budgetary environment
1See, for example, Fisher (1996).2See U.S. Bureau of the Census, Quarterly Summary of
State and Local Government Tax Revenue, Table 1, availableat http://www.census.gov/govs/www/qtax.html.
3The void created by the Census Bureau has been widelynoted, and efforts have been made to keep track of aspects ofproperty tax administration and property tax statutes. SeeDornfest and Thompson (2004), and the ambitious work of theGeorge Washington Institute of Public Policy (2007) fundedby the Lincoln Land Institute. Also, the Nelson A. RockefellerInstitute of Government has long published GovernmentsDivision data in readily accessible formats and has collectedand published timely state revenue reports. See
http://www.rockinst.org/government_finance/.4See U.S. Department of Commerce, Bureau of the Census
(1941), ‘‘A Decade of Assessed Valuations: 1929-1938,’’ Stateand Local Government Special Study No. 14.
5See Title 13, section 161 of the U.S. Code, which directedthe Census Bureau to collect ‘‘data on taxes and tax valua-tions . . . of states, counties, cities and other governmentalunits.’’ A 1987 taxable property values and sales ratio volumewas prepared with the 1987 Census of Government, but wasnever publicly released.
6See National Research Council (2007), Appendix C.
Robert P. Strauss is a professor of economics and publicpolicy, Carnegie Mellon University.
This report is a revised version of a paper prepared for the101st Annual Conference of the National Tax Association,held November 21 in Philadelphia. It will be published inthe conference proceedings and is published here with theNTA’s permission.
The author benefited from conversations on this subjectwith Henry Wulf of the Rockefeller Institute of Govern-ment, Alan Dornfest of the Idaho State Tax Commission,Kurt Usowski of the U.S. Department of Housing andUrban Development, Lisa Blumerman of the U.S. Bureau ofthe Census, and Yolanda Kodrzycki of the Federal ReserveBank of Boston. The author also wants to thank Radar Logicof New York City and First American Real Estate forproviding information in electronic form, and Celeste M.Strauss for preparation of figures 1-6 . The author takes soleresponsibility for the report’s contents.
State Tax Notes, January 26, 2009 247
(C) T
ax Analysts 2009. A
ll rights reserved. Tax A
nalysts does not claim copyright in any public dom
ain or third party content.

facing the Census Bureau generally, and the Gov-ernments Division in the Economic Directorate,7 thepanel recommended that the division consider how toimplement ‘‘a program of research and testing to ex-plore conceptually sound and cost-effective means ofcollecting these data.’’8
The Census Bureau’s budget has become eventighter since the release of the panel report in thefall of 2007, largely because the cost of the decennialcensus has risen dramatically.9 It is beyond thescope of this report to do a cost-effectivenessanalysis of spending $11.3 billion in 2010 to countabout 305 million Americans compared with spend-ing $26 million to measure the taxable values ofperhaps 100 million taxable properties in thenation,10 but the difference between investingscarce statistical budgets at rates of $37 per personand 26 cents per taxable parcel — 142 to 1 — isstriking.11
My purpose is to investigate ways that taxableproperties, assessed values, and sales ratios could bemore efficiently measured and reported, and inparticular how one might take advantage of existingstate measurement efforts and third-party collec-
tions of local electronic property and deed transferrecords that have become increasingly availablethrough commercial sources. To frame this discus-sion, I first describe in section 2 the activities of theGovernments Division, what was captured by theGovernments Division in its last efforts to measuretaxable values, and the problems it encountered.Section 3 discusses strategies that would use exist-ing public measurement and administrative sys-tems and third-party electronic records to inexpen-sively characterize real estate underlyingassessments and their uniformity, and issues thatwould have to be resolved. Section 4 concludes.
2.0 Activities of the Governments DivisionRegarding Real Estate Taxation
The Governments Division collects a wide varietyof data on the federal government, the states, andtheir general, single-function local governments andauthorities. Revenue including property tax collec-tions, expenditures, and employment data are mea-sured annually; tax revenue and retirement systemsdata are measured quarterly. Every five years, enu-meration of spending and revenue of all state andlocal governments occurs through the Census ofGovernments. For its quarterly and annual collec-tion efforts, the division relies on a sampling ofmajor general governments and special districts,enumeration of finances of all independent anddependent school districts for the National Centerfor Educational Statistics. Data for its quarterlysurvey of property tax collections, Form F71, areobtained electronically through a controlled Web siteand through postal mailings.12 Table 1 displays therange of weighting used by type of annually sampledgovernmental entities in 2005-2006 and compares
7Over the past several years, the Governments Division’sshare of the Census Bureau’s Economic Directorate, which ischarged with measuring the U.S. economy, has been about 6.8percent, although it is responsible for measuring 11 percent ofpublic and private employment and about 11 percent of GDP.
8See Recommendation 3-4 in NRC(2007) at p. 7.9Government Accountability Office (2008) reports that the
accrued cost of the 2010 Census will now be $11.3 billion orabout $37 per person.
10See Table 7 of U.S. Department of Commerce, Bureau ofthe Census (1982), Table 7, p. 13, which reports 98.4 milliontaxable properties in 1982.
11Of course, performing the decennial census responds to aconstitutional obligation, while measuring taxable propertiesresponds to only a federal statutory obligation in the U.S.Code. 12See http://harvester.census.gov/sgf/f71/.
Table 1.Governments Division 2005-2006 and 1997 Data Collection Structures
Type2005-2006
Sample Count 2005-2006 %
2005-2006Sample Weight
Range
1997 Census ofGovernments
UniverseCount /
Universe0-State 50 0.2% 1 50 1
1-County 1,736 6.6% 1 to 50 3,043 57.0%
2-Municipal 2,895 11.1% 1 to 50 19,372 14.9%
3-Township 2,125 8.1% 1 to 50 16,629 12.8%
4-Special District 4,589 17.6% 1 to 50 34,683 13.2%
5-IndependentSchool Districts 14,718 56.4% Universe for NCES 13,726 107.2%
Total 2005-2006 26,113 100.0% 87,503 29.8%
Sampled Units 11,395
Special Report
248 State Tax Notes, January 26, 2009
(C) T
ax Analysts 2009. A
ll rights reserved. Tax A
nalysts does not claim copyright in any public dom
ain or third party content.

them with those in 1997. Note that the number ofenumerated independent school districts has grownand that about 11,400 other local units are sampledeach non-Census year.
Beginning in 1987, the sample design of theannual finance and annual employment surveys hasbeen focused on achieving reliable estimates of keyindicators at the state level, but not for every countyarea in the nation.13 National estimates of quarterlyproperty tax collections have been continuously col-lected and reported by the Governments Divisionsince 1962 and are used by the Bureau of EconomicAnalysis in the gross domestic product accounts.Also, national, state, and local estimates of propertytax collections are released annually.
2.1 The Framework of the GovernmentsDivision Taxable Property Values Studies in
1982The 1982 Taxable Property Values and Assess-
ment Sales Price Ratios (TPV) presented a widevariety of state, metropolitan, and local informationthat can be roughly divided into three categories andis summarized as follows:
• Legal framework: A detailed state-by-state re-view of state assessment statutes and assess-ment administration dealing with realty andtangible personal property, and a detailedstate-by-state review of mechanisms to providepreferential treatment through classification,exemption, exclusion, and preferential rates;14
• Property stock measurements: Measurement ofthe gross and net assessed value of realty at thestate, regional, and metropolitan area and locallevels; measurement of realty by type of useand tax status; measurement of property taxcollections;15 and
• Property flow and assessment uniformity: Meas-urement of real property sales activity during asix-month period in 1981; state, regional, andselected local area measurement of medianassessment to sales price ratios (A/V); develop-ment of estimated fair market values acrossstates; state, regional, and selected local areameasurement of the variability of A/V throughthe reporting of coefficients of dispersion ofsingle-family, nonfarm properties and price-related differentials; and tallying of variousfinancing schemes (fixed, variable rate mort-
gages, points to buyer, and so forth) associatedwith each transaction.16
Many of the resulting 28 tables could be comparedwith earlier taxable property value studies. So, forexample, we learned that total gross assessed valueof real and personal property grew from $280.2billion in 1956 to $2,958.2 billion in 1981 for thecontinental United States, while total net assessedvalue grew from $272.2 billion in 1956 to $2,837.5billion in 1981.17 The number of parcels grew from61 million in 1956 to 98.4 million in 1981. Acrossthat period, acreage and farms declined from 23.2percent of total parcels to 15 percent of total par-cels.18 Equally valuable to those interested in theevolution of assessment standards and practiceswas the historical commentary that informed onsuch topics as the growth of classification, assess-ment organization, and administration.
Unlike state and local individual income taxation,which largely relies on the Internal Revenue Codeand extensive information sharing between staterevenue agencies and the Internal Revenue Ser-vice,19 state real and personal property assessmentand taxation laws and practices are heterogeneousand do not benefit from a comparable federal tax.Thus, the development of meaningful interstate andinterarea comparisons of assessed values on a com-parable, fair market value basis requires muchoriginal research. TPV admirably documented itsdefinitions and classifications, its methods, and thestatistical reliability of its sample estimates.
Perhaps the most difficult, controversial, andimportant task performed by TPV has been thecomparison of assessed value to recent arm’s-lengthsales price of representative samples of all types20 oflocally assessed properties. Using a two-stage sam-pling procedure that ensured that sales price wascompared with an earlier assessment, the Govern-ments Division measured A/V for states, standardmetropolitan statistical areas, counties, and rela-tively populous minor civil divisions. In areas withno electronic records, Census field enumeratorswent into local county assessment and title officesand used sampling schemes to obtain samples of
13See U.S. Bureau of the Census (2003), ‘‘The History ofSample Design for the Annual Finance and EmploymentSurveys 1987-2003.’’
14See TPV appendices A through D as well as E and F,which contain standard definitions and survey forms, andTable E at page xvi.
15See TPV tables.
16Reported sales prices were not adjusted by reportedfinancing mechanisms.
17See Table A, TPV.18See Table D, TPV.19See Strauss (1997) for an extensive discussion of what
has evolved into coadministration of the state and localindividual income tax in the context of proposals to move thefederal tax system to some sort of consumption tax.
20Nonfarm residential property, single-family houses,acreage, vacant plotted lots, commercial and industrial prop-erty, and other and allocable. See Table 21 of TPV.
Special Report
State Tax Notes, January 26, 2009 249
(C) T
ax Analysts 2009. A
ll rights reserved. Tax A
nalysts does not claim copyright in any public dom
ain or third party content.
transactions that reliably reflected the size distribu-tion of values. However, no data were collected onresidential properties with sales prices over $3 mil-lion.
The measured variation in assessment uniformitywas remarkable and perhaps discomforting. Forexample, in Pennsylvania, one finds that in 1981 thecity of Philadelphia had 537,400 parcels with a grossassessed value of $5.855 billion, a median A/V of26.2 percent, and a coefficient of dispersion of 59.121
Allegheny County, Pa., with 483,467 parcels and agross assessed value of $5.634 billion, had a medianassessment ratio of 21.4 and a coefficient of disper-sion of 38.2 percent.22 Both dispersion coefficientswere well beyond 20.0, the best practice recommen-dation of the International Association of AssessingOfficers, and both independently measured assess-ment ratios were lower than those adopted statuto-rily.
Measurement of assessed value and sales price isdifficult because not all states and localities use asimple system in which a single county or townshipassessor assesses property for county, municipal,and school real estate tax purposes. In 1982 theDistrict of Columbia and 30 states fit into thatsimplified category; however, the other states’ sys-tems were more complex because either more thanone assessor performed assessments for a particulararea, or the assessed values reflected material ad-justments because of classification, exemption, ordifferential assessment or tax rates. TPV accom-plished comparable measurement by using the offi-cially determined assessed value before deductionsof any exemptions used for official tax determinationpurposes. However, consider Iowa:
In 19 among Iowa’s 99 counties, a city assessorprovides assessed values, for city and countypurposes, for properties within the respectivecities. Moreover, all assessed values in Iowaincorporate the effects of two types of factors.One implements whichever county equaliza-tion orders apply to affected use categories inthe particular county, the other effects ‘‘roll-back adjustments’’ prescribed by the State.23
Another set of complexities arose because of Cali-fornia’s Proposition 13, which froze assessments at abase year of 1975, but adjusted assessments on latersale as measured by the resulting cash price. TPVdeclined to report median assessment ratios anddispersion coefficients for California because of theobvious nonuniformity. Because of the growing num-ber of states and areas that use some form of thebase year approach to assessment or that limit the
growth in assessed values in their translation totaxable values, it’s important for public policy pur-poses to determine whether the calculation of as-sessed to sales ratios is informative. However, eventhough there may be compelling equity argumentsfor those limitations, there remain valid argumentsfor estimating and reporting the fair market value ofthe stock of realty in each state and locality and alsomeasuring the variability in assessment outcomesso that those who impose limits on the application ofthe local property tax can systematically calculatethe effect of those policies.
The presentation of reliable dataon sales ratios across states andmetropolitan areas conveyedimportant interjurisdictionalinformation to tax administrators.
Although consistent measurement of sales ratiosand their uniformity within and across the states isdifficult and time consuming, their independentmeasurement by Census, which has the statutoryauthority to request cooperation both from govern-mental units and parties transacting real property,24
has had several uses. First, it has made it possible toindependently check the efficacy of state efforts toequalize the burden of property taxation, to deter-mine the extent to which state-by-state assessmentstandards are being met, and to check on the accu-racy of mass appraisal reassessments. Those ratioscan also be material in the practical application oftaxpayer appeals, and they have standing in legalproceedings. Historically, the presentation of reli-able data on sales ratios across states and metro-politan areas conveyed important interjurisdictionalinformation to tax administrators and elected offi-cials who rely on the real estate tax to fund localservices.
The practical application of the TPV measure-ment method entailed use of local electronic recordson assessments from local assessing offices and ofelectronic records on arm’s-length transactions fromdeed transfer and transfer tax records. In somestates, the transfer of ownership triggers applicationof an excise tax on the value of the transaction, and
21See Table 21, pp. 178-9.22Id., pp. 182-3.23TPV xxvi.
24On creating a sample of transactions, the TPV measure-ment process then elicited from either the buyer or seller,through Form GP-31, confirmation of the description of theproperty transferred, the size of the parcel, the use of the landand improvements, the nature of the financing associatedwith the transaction, and the nature of the sale (ordinarysale, foreclosure, sale between relatives, etc.).
Special Report
250 State Tax Notes, January 26, 2009
(C) T
ax Analysts 2009. A
ll rights reserved. Tax A
nalysts does not claim copyright in any public dom
ain or third party content.
typically is subject to disclosure and often an affida-vit from the buyer as to what was paid.25
3.0 Strategies for Improving Our Knowledgeof Assessed Values, Sales Ratios, and
Their VariabilityGovernmental and Third-Party Electronic
Sources and Issues Estimating the value of realand personal property is of interest beyond thosepersons curious about federal statistics. Indeed, onecan argue that the financial crisis in world capitalmarkets is the result of unrealistic appraisals of realestate that were created to justify the lending ofmortgages and the development of fees for mortgageplacements. Private, for-profit lending institutions,institutions such as the Federal National MortgageAssociation and the Federal Home Loan MortgageCorp., which were supposed to assist low-incomehomeowners and increase the liquidity of the mort-gage market, and federal institutions such as theFederal Housing Authority, which were also sup-posed to assist low-income homeowners, have allbeen involved in devising models that predict theunderlying value of real estate on the basis of salesprices and physical characteristics. Such appraisalmodels have much in common with those used forcomputer-assisted mass appraisal typically used inreassessment. Of course, appraisal to support a loanapplication is different from appraisal for the crea-tion of an assessed value for tax administrationpurposes. The former serves the immediate interestof the loan originator, the buyer, or the owner, andthe latter is a subsequent disadvantage to the buyer,and the owner because it can raise the tax bill untilthe next reassessment. However, fairness in taxa-tion and the resulting confidence in government areimportant.
Independent ratio studies can analyze assess-ment performance, evaluate computer-assistedmass appraisal models, and identify shortcomingsand weaknesses in assessment practices. As is gen-erally understood, ratio studies that are not basedon representative areas, values, and types of prop-erties can yield misleading information and lead tomisdirected policy changes.
3.1 Using Existing State Sales Ratio StudiesDornfest and Thompson (2004) report that in
2003, 41 states and the District of Columbia re-ported performing annual sales ratio studies; thatwas the same number as in 1997. A central ingredi-ent in any sales ratio study is the comparison of adisclosed arm’s-length sales price to historical as-sessed value. Three forms of disclosure are reliable:
full mandatory sales price disclosure, transfer feesthat are based on the sales price, and mandatoryrecordation of any transfer instrument. As of 2003only Idaho, Missouri, and Texas required none ofthose three elements of disclosure. New Mexicoenacted disclosure legislation in 2003.26 Louisiana,Mississippi, and Utah continue to fail to require fulldisclosure of transfer fees. Forty-three states nowuse ratio studies to advise and assist in the assess-ment process, compared with only 35 states in 1994and 1997.27 Poor uniformity in assessment, as evi-denced by high coefficients of dispersion, can triggerstate action of some sort in 34 states, and in 23 it canresult in a state order of reappraisal.28 In 2003, 39states used the weighted mean A/V in 2003 todetermine the level of assessment, while 38 statesused the median A/V. Regarding trimming the dis-tribution of A/V before measuring the representativeA/V, 35 states say they test for outliers, and 10 stateshave set limitations on the number of outliers thatmay be tossed out.29
Forty-three states now use ratiostudies to advise and assist in theassessment process, comparedwith 35 states in 1994 and 1997.
Given that abundance of state sales ratio studies,perhaps the easiest and most inexpensive way tobegin to reinstate TPV would be to collect, classify,and report the results of those studies for a givenyear and attempt to put them on a comparable basis.Historically, that characterization and tabulation ofstate ratio study efforts had been done by theGovernments Division in conjunction with prepar-ing its TPV.30
3.2 Expanding the Partnership With theNational Center for Educational StatisticsIf Census prefers reviewing actual administrative
records of assessments, tax collections, and transac-tions to simply reinterpreting state sales ratio stud-ies, there are several approaches it could take inconnecting to existing flows of administrative infor-mation. All but a handful of independent schooldistricts use real property tax revenue, and all areinvolved in providing annual property tax informa-tion to the Governments Division, which collects iton behalf of the National Center for Education
25See Dornfest and Thompson (2004) for a state-by-statetabulation of state ratio study practices in 2003.
26Id., p. 34.27Id., p. 35.28Id., p. 37.29Id., p. 37.30See, for example, U.S. Department of Commerce, Bureau
of the Census (1972, 1980).
Special Report
State Tax Notes, January 26, 2009 251
(C) T
ax Analysts 2009. A
ll rights reserved. Tax A
nalysts does not claim copyright in any public dom
ain or third party content.
Statistics (NCES) of the U.S. Department of Educa-tion. In particular, Form F-33, Part 1, Section A,Line 1 specifies ‘‘Property taxes.’’ That is a long-timeand ongoing collection effort, and NCES is a large,well-funded statistical agency that routinely studiesschool finance. Because property tax collection isinherently based on the measurement of assess-ments and the application of exemption or tax for-giveness schemes to move from assessed to taxablevalues to tax collections, it follows that every schooldistrict in the nation knows its property tax baseand, either through its own, contracted, or delegatedagent, has a set of tax roll records that must includeunderlying assessment records.31
I propose adding to Form F-33, the annual surveyof school systems, two additional lines: ‘‘Gross As-sessed Value’’ and ‘‘Gross Assessed Value of TaxableProperties.’’ The instructions portion of the formwould require a few sentences to define those terms.
Nationwide data on the assessedand taxable values of real propertycould be collected annually at littleadded expense.
From a data collection perspective, that meansthat with some relatively minor adjustments tocurrent survey forms, nationwide data on the as-sessed and taxable values of real property could bereadily collected annually at little added expense. Itis likely that for most school districts, that datacould also indicate the totals by use of the property.
As those who study governmental accountingrules know, NCES is the standard setter for schooldistrict accounting. Heterogeneity in definitions ofproperty use, classification, and nomenclature sur-rounding types of property exemption schemes couldbe the subject of NCES consideration and pro-nouncements over time so that local assessed basemeasurement could be more systematic and compa-rable across states. It’s an open question whetherNCES could accomplish those changes in data col-lection and survey forms by adding to its measure-ment of school finances characteristics of the schoolfinance property tax base without statutory or regu-latory changes. It is likely that the change in surveyform and associated instructions would require the
approval of the Office of Management and Budget.Under this approach, most of the collection costwould be borne by respondent school districts ratherthan by Census field data collectors.
Using school districts as data collection sourcesdoes not directly address how sales and arm’s-lengthprice information could be obtained and transmit-ted. Because school districts do not maintain deedrecords and may not share in transfer tax proceeds,they may not have readily available sales and priceinformation on an individual, parcel-by-parcel basis.It may be feasible, however, for each school districtto report the aggregate value of new construction asreflected in the sales prices of land and improve-ments in a calendar year, and it may be feasible foreach school district to report the aggregate value ofall sales and the aggregate value of their grossassessments of taxable properties. From that aggre-gate information one could construct the ratio oftotal assessed value to total sales value and thusmeasure an overall average sales ratio.
3.3 Federal Administrative Records MeasureSales and Market Values
The federal government is involved in real estatetransactions in several different ways: through fed-eral taxation of income deriving from the sale orexchange of real estate, and through various kindsof regulatory roles in the settlement and mortgagefinancing process. Unfortunately, none of thosemechanisms now provide information that the Cen-sus Bureau could readily use to estimate gross or netassessed values, taxable values, or the variation inthe ratio of assessed value to sales prices.
Since the early 1970s the IRS has been statutorilyrequired to give its individual income tax masterdata file to the Census each year. Census uses thattax return information for the construction of popu-lation and income estimates for small areas and tomeasure migration. County-to-county migrationdata are available to researchers through the IRSStatistics of Income Division and have been used foryears by demographers and those who want to followpopulation and income movements.
Historically, sellers of real property have beenrequired for federal tax purposes to report grossproceeds from the sale or exchange of land, perma-nent structures, and condominium units, includingpermanent improvements or stock in a cooperativehousing corporation. But Census does not receivethe full 1099-S, and the full 1099-S does not requirethe reporting of the location of property, its use, orits assessed or taxable value. Transactions involvingthe sale or exchange of a principal residence for$250,000 or less ($500,000 or less for married filingjointly) need not be reported. Thus, even if the1099-S were revised to collect location and parcelidentification information, a statistical agencywould be unable to readily derive A/V for properties
31It is also reasonable to assume that each local schooldistrict knows its property tax collection rate that could becollected as additional information for publication; however,the first priority I suggest would be collecting data on grossassessed value and gross assessed value of taxable properties.Care must be exercised, of course, in accounting for overlap-ping school districts by grade level, such as in California, toavoid double counting.
Special Report
252 State Tax Notes, January 26, 2009
(C) T
ax Analysts 2009. A
ll rights reserved. Tax A
nalysts does not claim copyright in any public dom
ain or third party content.
sold state by state because the information does notreflect the assessed value or location.
The HUD-1 settlement statement that accompa-nies all residential real estate transactions wouldappear to be another administrative form of inter-est, because it contains the date, property descrip-tion, and details of what the buyer and seller trans-act in terms of cash and other considerations. Thedata have, however, several limitations. First,HUD-1 is not put into machine-readable form in its
entirety. Second, information about annual real es-tate gross and net assessment, and taxes due forcounty, municipal, and school purposes are not re-corded. Accordingly, for those forms to become usefulelectronic information, the Department of Housingand Urban Development would have to commit tofirst alter the form to contain the information thatwould then feed into TPV, and then it would have toinvest in putting all the information on the settle-ment form into a database. Even if those two steps
Table 2.Electronic Records Coverage
Fraction of Counties by State WithProperty Tax Roll Offices and Deed Transfer Offices
Whose Data Were Collected Electronically in 2004
Coverage of Tax RollsCoverage of Deed
Transfers Coverage of Tax RollsCoverage of Deed
Transfers
State
NotCovered
(%)Covered
(%)
NotCovered
(%)Covered
(%) State
NotCovered
(%)Covered
(%)
NotCovered
(%)Covered
(%)AK 88.9 11.1 88.9 11.1 NC 20.0 80.0 76.0 24.0
AL 14.9 85.1 92.5 7.5 ND 81.1 18.9 54.7 45.3
AR 22.7 77.3 73.3 26.7 NE 97.9 2.2 95.7 4.3
AZ 0.0 100.0 0.0 100.0 NH 100.0 0.0 0.0 100.0
CA 0.0 100.0 0.0 100.0 NJ 0.0 100.0 0.0 100.0
CO 59.4 40.6 57.8 42.2 NM 69.7 30.3 78.8 21.2
CT 0.0 100.0 0.0 100.0 NV 17.7 82.4 35.3 64.7
DC 0.0 100.0 0.0 100.0 NY 0.0 100.0 0.0 100.0
DE 33.3 66.7 33.3 66.7 OH 18.2 81.8 35.2 64.8
FL 0.0 100.0 0.0 100.0 OK 1.3 98.7 87.0 13.0
GA 55.4 44.7 81.1 18.9 OR 36.1 63.9 47.2 52.8
HI 0.0 100.0 0.0 100.0 PA 25.4 74.6 67.2 32.8
IA 6.1 93.9 88.9 11.1 RI 0.0 100.0 0.0 100.0
ID 88.6 11.4 81.8 18.2 SC 45.7 54.4 56.5 43.5
IL 68.6 31.4 80.4 19.6 SD 98.5 1.5 100.0 0.0
IN 92.4 7.6 92.4 7.6 TN 1.1 99.0 0.0 100.0
KS 1.9 98.1 93.3 6.7 TX 44.1 55.9 81.1 18.9
KY 70.0 30.0 95.8 4.2 UT 51.7 48.3 58.6 41.4
LA 26.6 73.4 95.3 4.7 VA 52.2 47.8 81.3 18.7
MA 0.0 100.0 0.0 100.0 VT 71.4 28.6 0.0 100.0
MD 0.0 100.0 0.0 100.0 WA 43.6 56.4 38.5 61.5
ME 81.3 18.8 100.0 0.0 WI 33.3 66.7 0.0 100.0
MI 14.5 85.5 83.1 16.9 WV 0.0 100.0 3.6 96.4
MN 74.7 25.3 79.3 20.7 WY 87.0 13.0 91.3 8.7
MO 91.3 8.7 91.3 8.7
MS 40.2 59.8 48.8 51.2TotalU.S. 1301 1835 2060 1076
MT 0.0 100.0 71.4 28.6U.S.
% 41.5% 58.5% 65.7% 34.3%
Source: Author’s tabulations of 2004 coverage report by First American Real Estate Inc.
Special Report
State Tax Notes, January 26, 2009 253
(C) T
ax Analysts 2009. A
ll rights reserved. Tax A
nalysts does not claim copyright in any public dom
ain or third party content.
were taken, there would still be no informationabout the nonresidential sectors of the real estatemarkets.
3.4 Third-Party Data Sources on Tax Rollsand Deed Transfers
As noted earlier, banks and other financial insti-tutions have an interest not only in the price atwhich a property they are financing transacts, butalso in the taxes being levied on the property and theassessed value. Carrying costs of residential prop-erty involve the sum of the mortgage, insurance, andtaxes, and they are considered when reviewing the
loan application in conjunction with the financialposition of the buyer or borrower. Assessed valuesare of interest not only for tax determination pur-poses but also as checks on the appraisals thattypically accompany the determination of the loanamount.
The private need for that information in reliableform has led to the emergence of real estate databrokers who buy, process, and sell the informationand related real estate services to lending institu-tions. Many of those data brokers are subsidiaries ofregional and national title companies that histori-cally have performed title searches along with the
Table 3.Electronic Records Coverage
Weighted by 2005-2006 Census County Area PopulationFraction of Counties by State With
Property Tax Roll Offices and Deed Transfer OfficesWhose Data Were Collected Electronically in 2004
Coverage of Tax RollsCoverage of Deed
Transfers Coverage ofTax RollsCoverage of Deed
Transfers
State
NotCovered
(%)Covered
(%)
NotCovered
(%)Covered
(%) State
NotCovered
(%)Covered
(%)
NotCovered
(%)Covered
(%)AK 41.1 58.9 41.1 58.9 NC 12.6 87.4 43.7 56.3
AL 15.9 84.1 68.3 31.7 ND 56.4 43.6 26.9 73.1
AR 15.4 84.6 44.5 55.5 NE 58.3 41.7 50.0 50.0
AZ 0.0 100.0 0.0 100.0 NH 100.0 0.0 0.0 100.0
CA 0.0 100.0 0.0 100.0 NJ 0.0 100.0 0.0 100.0
CO 8.8 91.2 7.7 92.3 NM 31.9 68.1 39.7 60.3
CT 0.0 100.0 0.0 100.0 NV 5.6 94.5 2.8 97.2
DC 0.0 100.0 0.0 100.0 NY 0.0 100.0 0.0 100.0
DE 20.0 80.0 20.0 80.0 OH 4.4 95.6 10.7 89.3
FL 0.0 100.0 0.0 100.0 OK 1.2 98.9 45.3 54.7
GA 26.2 73.8 41.7 58.3 OR 4.7 95.3 8.4 91.6
HI 0.0 100.0 0.0 100.0 PA 8.9 91.1 26.1 73.9
IA 10.4 89.6 61.6 38.4 RI 0.0 100.0 0.0 100.0
ID 49.0 51.0 36.7 63.3 SC 22.7 77.4 24.9 75.1
IL 16.8 83.2 18.6 81.4 SD 97.1 2.9 100.0 0.0
IN 61.7 38.3 61.6 38.5 TN 0.3 99.7 0.0 100.0
KS 2.4 97.6 45.7 54.3 TX 9.1 90.9 22.1 78.0
KY 50.7 49.3 73.6 26.4 UT 10.1 89.9 7.5 92.5
LA 9.6 90.4 79.4 20.6 VA 31.0 69.1 38.9 61.2
MA 0.0 100.0 0.0 100.0 VT 65.0 35.0 0.0 100.0
MD 0.0 100.0 0.0 100.0 WA 10.4 89.6 6.0 94.0
ME 73.4 26.6 100.0 0.0 WI 10.9 89.1 0.0 100.0
MI 5.5 94.5 33.8 66.2 WV 0.0 100.0 12.6 87.4
MN 35.2 64.8 30.6 69.4 WY 66.3 33.7 70.0 30.0
MO 43.4 56.6 43.3 56.8
MS 25.1 74.9 27.2 72.8Total
Pop. 3.374E+07 2.477E+08 5.597E+07 2.255E+08
MT 0.0 100.0 42.0 58.0%Share 12.0% 88.0% 19.9% 80.1%
Source: Author’s tabulations of 2004 coverage report by First American Real Estate Inc.
Special Report
254 State Tax Notes, January 26, 2009
(C) T
ax Analysts 2009. A
ll rights reserved. Tax A
nalysts does not claim copyright in any public dom
ain or third party content.
due diligence required in settling a real estatetransaction. Related to such original data collectionservices is a group of organizations that processesand models the resulting data.
One of the largest real estate data brokers is FirstAmericanCorp.ofCalifornia,whichprovides titleandsettlement services, mortgage services, appraisal andvaluation services, screening and risk mitigation,property and ownership information, analytics andmodeling, insuranceandhomewarranty information,and investment management. Once a county abstractcompany, First American now belongs to the Fortune500 and has a subsidiary, CoreLogic, that is devoted tothe collection and sale of real estate information.32
Real estate data brokers routinely collect electroni-cally and also capture paper records and put in elec-tronic form information maintained on tax rolls andinformation maintained in deed offices throughoutthe nation.33 First American is one of several vendorsthat Fannie Mae uses in the construction of its resi-dential valuation models, which are resold to manycommercial lending institutions.
The basic idea here is for Census to either directlypurchase the real estate database of tax, assess-ment, and sales information and construct a TPVanalysis state by state, or purchase the use of thatdata from a third-party processor of databases.Unlike the earlier suggestions of relying on state-by-state sales ratio studies or obtaining simple infor-mation via school districts, the research project herewould be to forgo the historical Census field inves-tigation of tax roll offices and deed offices and simplyuse what electronic information was available.
The question that arises, given that some statesand parts of states are nondisclosure states, wouldbe how much of the U.S. property inventory could becovered from those sources.
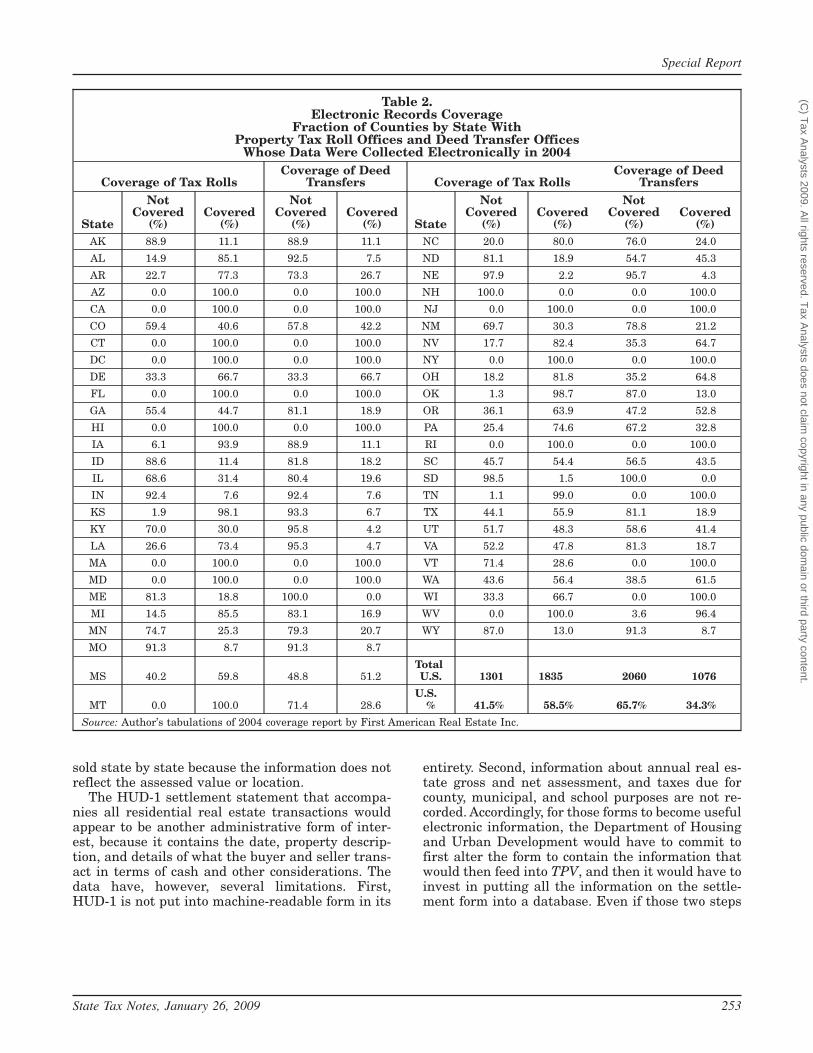
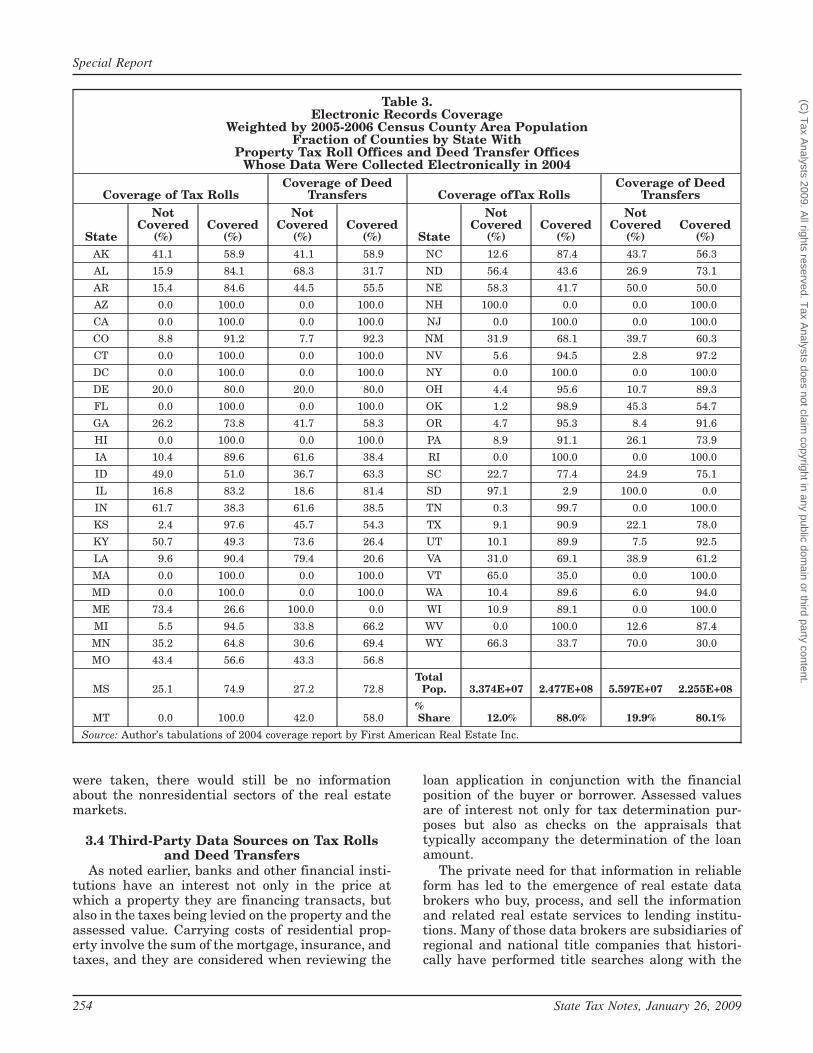
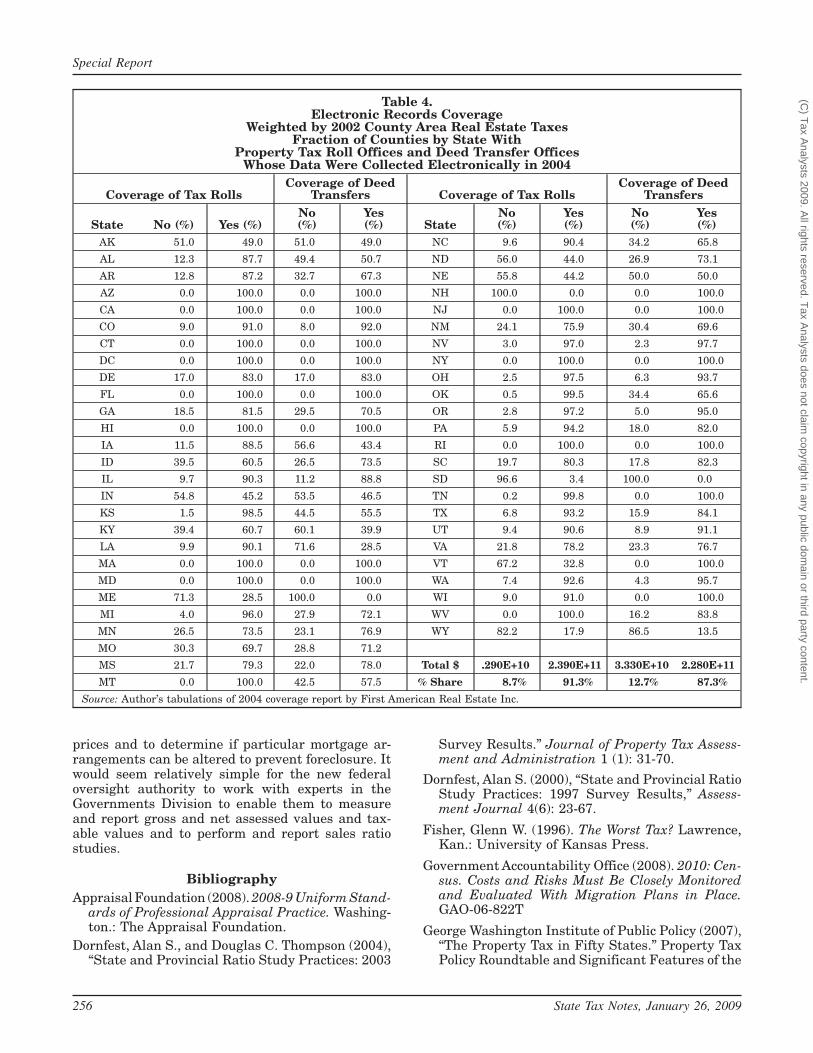
Table 2 (p. 253) shows by state the fraction ofcounty areas that are covered by the First Americandata collection process in terms of tax rolls and deedtransfer offices.34 Overall, 58 percent (about 1,800)of the county areas in the nation are coveredthrough tax rolls, and 34 percent (about 1,100) of the
county areas are covered through deed transfers.However, when we weight that county coverage bycounty population, we find that 88 percent of theU.S. population in terms of tax offices are covered,and 80 percent of the deed transfers are covered (seeTable 3. If we instead weight by 2002 county areataxes (county government + all municipal + allschool and all other property taxes), we find that 91percent of the tax roll offices are covered and 87percent of the deed transfer offices are covered (seeTable 4, next page).
Tables 2-4 indicate that coverage will be incom-plete in the rural parts of several states. It followsthat coverage of some kinds of uses, primarily agri-cultural, would be weak. Coverage of urban areasand commercial and industrial uses would likely bestrong.
Radar Logic Inc. covers the transactions and taxrolls of only 202 county areas. However, becausethose are major metropolitan areas, they manage tocover 37 percent of areas comprising 37 percent ofthe U.S. population in 2005-2006 and 46 percent ofthe total local property tax in 2002 (see tables 5-7,pp. 258-260).
See also the maps in Figures 1-6 (pp. 261-266),which depict data in the tables discussed above.
Although it was beyond the scope of this report toelicit database prices from those two commercialreal estate data sources, it seems likely that eachwould be well below the $26 million that Censusbelieves it would cost to recreate TPV. How muchanalysis and what sort of statistical reliability wouldresult from either approach are important follow-upissues; however, what those coverage calculationssuggest is that one could make substantial progressin recreating a TPV and would wind up using farmore universal information than was available in1982 or 1987.
4.0 Concluding RemarksWith the demise of the Governments Division’s
long-time commitment to measure gross assessed,net, and taxable property values and related evi-dence on the uniformity of the assessment process,much has been lost in what we know about realty inthe nation. It is difficult to judge whether an ongoingprocess of independent sales ratio studies could havebetter informed policymakers over the last decadeabout the buildup in property values and its dra-matic reversal. What I hope this review has accom-plished is to rekindle interest not only in the re-search and statistical communities, but also in theCensus Bureau, in working through in more detailthe implications of using existing data collectionmechanisms and electronic third parties.
As the federal government grapples with theproblems associated with the rapid decline in hous-ing values, it will subscribe to the various commer-cial data services to keep track of regional housing
32See http://www.firstam.com.33First American was the commercial real estate data
source for a Robert P. Strauss and David A. Strauss (2003)study of the fairness of assessments in four urban counties.(See ‘‘Residential Real Estate Assessment Fairness in FourUrban Areas, ’’ State Tax Notes, Mar. 8, 2004, p. 815, Doc2004-625, or 2004 STT 45-2.)
34Table 2 and later tables compare county-by-county cov-erage reported to the author by First American in 2004. Whenpopulation weighting is used, population is from the CensusBureau’s estimates for 2005-2006 as reported on the Govern-ments Division’s Web site. When property tax weight is used,property taxes refer to Census of Governments (2002) prop-erty tax collections (Item Code is T01) as maintained on theGovernments Division Web site.
Special Report
State Tax Notes, January 26, 2009 255
(C) T
ax Analysts 2009. A
ll rights reserved. Tax A
nalysts does not claim copyright in any public dom
ain or third party content.
prices and to determine if particular mortgage ar-rangements can be altered to prevent foreclosure. Itwould seem relatively simple for the new federaloversight authority to work with experts in theGovernments Division to enable them to measureand report gross and net assessed values and tax-able values and to perform and report sales ratiostudies.
BibliographyAppraisal Foundation (2008). 2008-9 Uniform Stand-
ards of Professional Appraisal Practice. Washing-ton.: The Appraisal Foundation.
Dornfest, Alan S., and Douglas C. Thompson (2004),‘‘State and Provincial Ratio Study Practices: 2003
Survey Results.’’ Journal of Property Tax Assess-ment and Administration 1 (1): 31-70.
Dornfest, Alan S. (2000), ‘‘State and Provincial RatioStudy Practices: 1997 Survey Results,’’ Assess-ment Journal 4(6): 23-67.
Fisher, Glenn W. (1996). The Worst Tax? Lawrence,Kan.: University of Kansas Press.
Government Accountability Office (2008). 2010: Cen-sus. Costs and Risks Must Be Closely Monitoredand Evaluated With Migration Plans in Place.GAO-06-822T
George Washington Institute of Public Policy (2007),‘‘The Property Tax in Fifty States.’’ Property TaxPolicy Roundtable and Significant Features of the
Table 4.Electronic Records Coverage
Weighted by 2002 County Area Real Estate TaxesFraction of Counties by State With
Property Tax Roll Offices and Deed Transfer OfficesWhose Data Were Collected Electronically in 2004
Coverage of Tax RollsCoverage of Deed
Transfers Coverage of Tax RollsCoverage of Deed
Transfers
State No (%) Yes (%)No(%)
Yes(%) State
No(%)
Yes(%)
No(%)
Yes(%)
AK 51.0 49.0 51.0 49.0 NC 9.6 90.4 34.2 65.8
AL 12.3 87.7 49.4 50.7 ND 56.0 44.0 26.9 73.1
AR 12.8 87.2 32.7 67.3 NE 55.8 44.2 50.0 50.0
AZ 0.0 100.0 0.0 100.0 NH 100.0 0.0 0.0 100.0
CA 0.0 100.0 0.0 100.0 NJ 0.0 100.0 0.0 100.0
CO 9.0 91.0 8.0 92.0 NM 24.1 75.9 30.4 69.6
CT 0.0 100.0 0.0 100.0 NV 3.0 97.0 2.3 97.7
DC 0.0 100.0 0.0 100.0 NY 0.0 100.0 0.0 100.0
DE 17.0 83.0 17.0 83.0 OH 2.5 97.5 6.3 93.7
FL 0.0 100.0 0.0 100.0 OK 0.5 99.5 34.4 65.6
GA 18.5 81.5 29.5 70.5 OR 2.8 97.2 5.0 95.0
HI 0.0 100.0 0.0 100.0 PA 5.9 94.2 18.0 82.0
IA 11.5 88.5 56.6 43.4 RI 0.0 100.0 0.0 100.0
ID 39.5 60.5 26.5 73.5 SC 19.7 80.3 17.8 82.3
IL 9.7 90.3 11.2 88.8 SD 96.6 3.4 100.0 0.0
IN 54.8 45.2 53.5 46.5 TN 0.2 99.8 0.0 100.0
KS 1.5 98.5 44.5 55.5 TX 6.8 93.2 15.9 84.1
KY 39.4 60.7 60.1 39.9 UT 9.4 90.6 8.9 91.1
LA 9.9 90.1 71.6 28.5 VA 21.8 78.2 23.3 76.7
MA 0.0 100.0 0.0 100.0 VT 67.2 32.8 0.0 100.0
MD 0.0 100.0 0.0 100.0 WA 7.4 92.6 4.3 95.7
ME 71.3 28.5 100.0 0.0 WI 9.0 91.0 0.0 100.0
MI 4.0 96.0 27.9 72.1 WV 0.0 100.0 16.2 83.8
MN 26.5 73.5 23.1 76.9 WY 82.2 17.9 86.5 13.5
MO 30.3 69.7 28.8 71.2
MS 21.7 79.3 22.0 78.0 Total $ .290E+10 2.390E+11 3.330E+10 2.280E+11
MT 0.0 100.0 42.5 57.5 % Share 8.7% 91.3% 12.7% 87.3%
Source: Author’s tabulations of 2004 coverage report by First American Real Estate Inc.
Special Report
256 State Tax Notes, January 26, 2009
(C) T
ax Analysts 2009. A
ll rights reserved. Tax A
nalysts does not claim copyright in any public dom
ain or third party content.

Property Tax — A Collaborative Project of theGeorge Washington Institute of Public Policy andthe Lincoln Institute of Land Policy. Available athttp://www.gwu.edu/~gwipp/lincoln/.
Gloudemans, Robert J. (1999). Mass Appraisal ofReal Property. Chicago, IAAO.
International Association of Assessing Officers.(2007). Standard on Ratio Studies. Kansas City,Mo.
National Research Council, Panel on Research andDevelopment Priorities for the U.S. Census Bu-reau’s State and Local Government StatisticsProgram, Committee on National Statistics, Divi-sion of Behavior and Social Sciences (2007). Stateand Local Government Statistics at a Crossroads.(Washington, DC: The National AcademiesPress.)
Strauss, Robert P. (1997), ‘‘Administrative and Rev-enue Implications of Federal Consumption Taxesfor the State and Local Sector,’’ American Journalof Tax Policy, 14, 8 (Fall 1997), 361-452. (Re-printed in two parts in Tax Notes, Feb. 22, 1999,p. 1173, and Tax Notes, Mar. 1, 1999, p. 1343.
‘‘Residential Real Estate Assessment Fairness inFour Urban Counties,’’ with David A. Strauss,State Tax Notes, Mar. 8, 2004, p. 815, Doc 2004-625, or 2004 STT 45-2 (reprinted from proceed-ings of the National Tax Association 96th AnnualConference on Taxation, Chicago, November2003, 298-305).
U.S. Department of Commerce, Bureau of the Cen-sus. (1972). State and Local Ratio Studies andProperty Assessment. Special Studies No. 72.(Washington, D.C.: Bureau of the Census, August1975.)
U.S. Department of Commerce, Bureau of the Cen-sus. (1980). State and Local Ratio Studies andProperty Assessment. Special Studies No. 99.(Washington, D.C.: Bureau of the Census, August1980.)
U.S. Department of Commerce, Bureau of the Cen-sus. (1982). 1982 Census of Governments. TaxableProperty Values and Assessment Sales Price Ra-tios. Volume 2. GC82(2). (Washington, D.C.: Bu-reau of the Census, February 1984.)
Special Report
State Tax Notes, January 26, 2009 257
(C) T
ax Analysts 2009. A
ll rights reserved. Tax A
nalysts does not claim copyright in any public dom
ain or third party content.
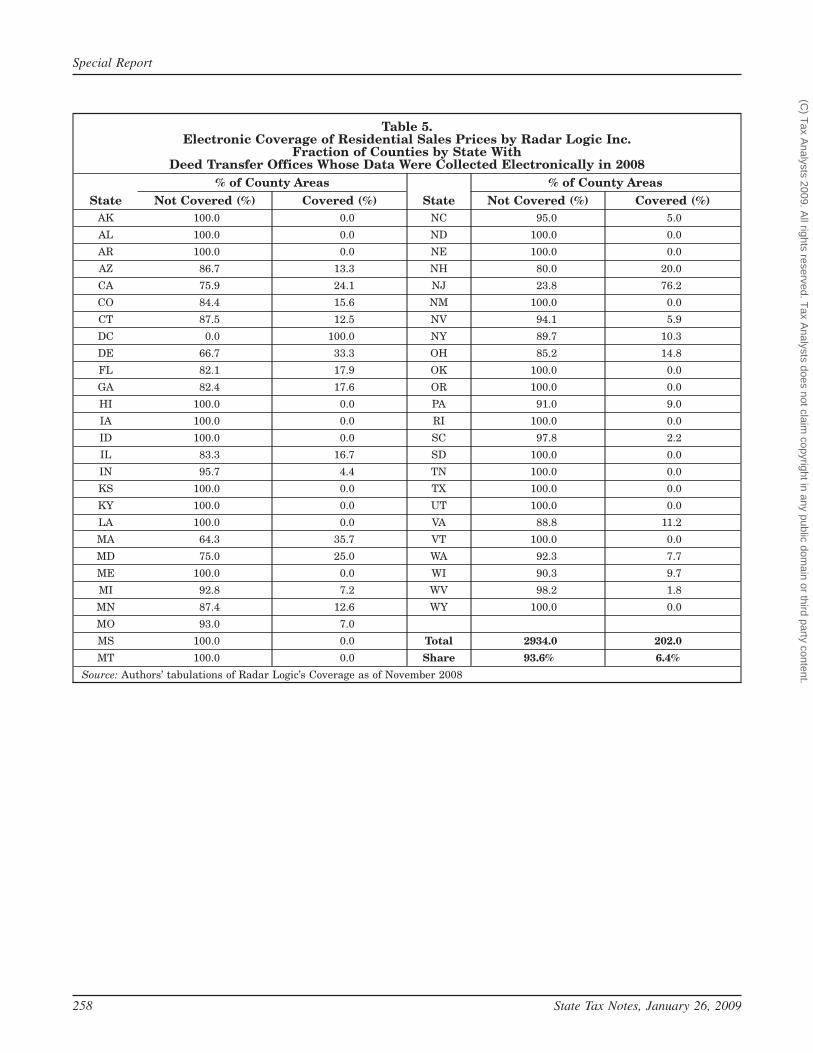
Table 5.Electronic Coverage of Residential Sales Prices by Radar Logic Inc.
Fraction of Counties by State WithDeed Transfer Offices Whose Data Were Collected Electronically in 2008
State% of County Areas
State% of County Areas
Not Covered (%) Covered (%) Not Covered (%) Covered (%)AK 100.0 0.0 NC 95.0 5.0
AL 100.0 0.0 ND 100.0 0.0
AR 100.0 0.0 NE 100.0 0.0
AZ 86.7 13.3 NH 80.0 20.0
CA 75.9 24.1 NJ 23.8 76.2
CO 84.4 15.6 NM 100.0 0.0
CT 87.5 12.5 NV 94.1 5.9
DC 0.0 100.0 NY 89.7 10.3
DE 66.7 33.3 OH 85.2 14.8
FL 82.1 17.9 OK 100.0 0.0
GA 82.4 17.6 OR 100.0 0.0
HI 100.0 0.0 PA 91.0 9.0
IA 100.0 0.0 RI 100.0 0.0
ID 100.0 0.0 SC 97.8 2.2
IL 83.3 16.7 SD 100.0 0.0
IN 95.7 4.4 TN 100.0 0.0
KS 100.0 0.0 TX 100.0 0.0
KY 100.0 0.0 UT 100.0 0.0
LA 100.0 0.0 VA 88.8 11.2
MA 64.3 35.7 VT 100.0 0.0
MD 75.0 25.0 WA 92.3 7.7
ME 100.0 0.0 WI 90.3 9.7
MI 92.8 7.2 WV 98.2 1.8
MN 87.4 12.6 WY 100.0 0.0
MO 93.0 7.0
MS 100.0 0.0 Total 2934.0 202.0
MT 100.0 0.0 Share 93.6% 6.4%
Source: Authors’ tabulations of Radar Logic’s Coverage as of November 2008
Special Report
258 State Tax Notes, January 26, 2009
(C) T
ax Analysts 2009. A
ll rights reserved. Tax A
nalysts does not claim copyright in any public dom
ain or third party content.
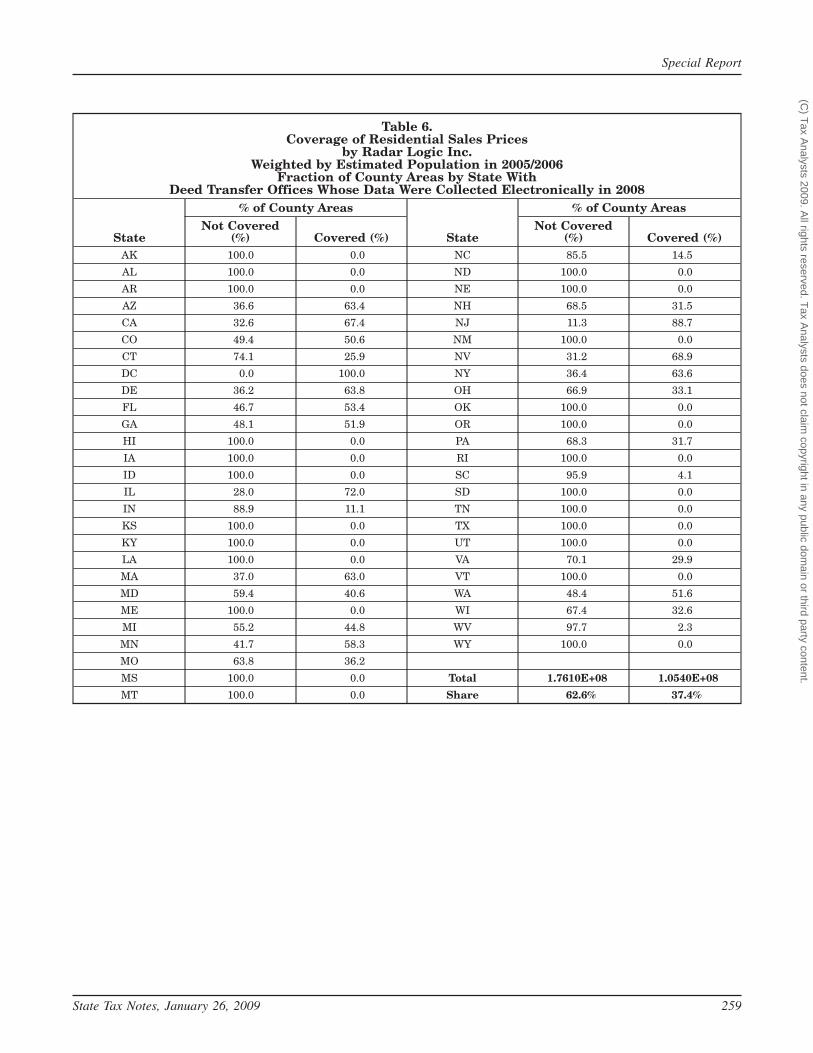
Table 6.Coverage of Residential Sales Prices
by Radar Logic Inc.Weighted by Estimated Population in 2005/2006
Fraction of County Areas by State WithDeed Transfer Offices Whose Data Were Collected Electronically in 2008
State
% of County Areas
State
% of County AreasNot Covered
(%) Covered (%)Not Covered
(%) Covered (%)AK 100.0 0.0 NC 85.5 14.5
AL 100.0 0.0 ND 100.0 0.0
AR 100.0 0.0 NE 100.0 0.0
AZ 36.6 63.4 NH 68.5 31.5
CA 32.6 67.4 NJ 11.3 88.7
CO 49.4 50.6 NM 100.0 0.0
CT 74.1 25.9 NV 31.2 68.9
DC 0.0 100.0 NY 36.4 63.6
DE 36.2 63.8 OH 66.9 33.1
FL 46.7 53.4 OK 100.0 0.0
GA 48.1 51.9 OR 100.0 0.0
HI 100.0 0.0 PA 68.3 31.7
IA 100.0 0.0 RI 100.0 0.0
ID 100.0 0.0 SC 95.9 4.1
IL 28.0 72.0 SD 100.0 0.0
IN 88.9 11.1 TN 100.0 0.0
KS 100.0 0.0 TX 100.0 0.0
KY 100.0 0.0 UT 100.0 0.0
LA 100.0 0.0 VA 70.1 29.9
MA 37.0 63.0 VT 100.0 0.0
MD 59.4 40.6 WA 48.4 51.6
ME 100.0 0.0 WI 67.4 32.6
MI 55.2 44.8 WV 97.7 2.3
MN 41.7 58.3 WY 100.0 0.0
MO 63.8 36.2
MS 100.0 0.0 Total 1.7610E+08 1.0540E+08
MT 100.0 0.0 Share 62.6% 37.4%
Special Report
State Tax Notes, January 26, 2009 259
(C) T
ax Analysts 2009. A
ll rights reserved. Tax A
nalysts does not claim copyright in any public dom
ain or third party content.

Table 7.Electronic Coverage of Residential Sales Prices by Radar Logic Inc.
Weighted by 2002 Real Estate TaxesFraction of Counties by State With
Deed Transfer OfficesWhose Data Were Collected Electronically in 2008
State
% of County Areas
State
% of County AreasNot Covered
(%) Covered (%)Not Covered
(%) Covered (%)AK 100.0 0.0 NC 79.0 21.1
AL 100.0 0.0 ND 100.0 0.0
AR 100.0 0.0 NE 100.0 0.0
AZ 33.0 67.0 NH 68.0 32.0
CA 27.4 72.6 NJ 12.4 87.6
CO 47.2 52.8 NM 100.0 0.0
CT 66.0 34.0 NV 28.2 71.8
DC 0.0 100.0 NY 29.5 70.5
DE 27.8 72.2 OH 59.5 40.5
FL 42.0 58.0 OK 100.0 0.0
GA 35.8 64.2 OR 100.0 0.0
HI 100.0 0.0 PA 63.0 37.0
IA 100.0 0.0 RI 100.0 0.0
ID 100.0 0.0 SC 94.5 5.5
IL 18.7 81.3 SD 100.0 0.0
IN 86.2 13.8 TN 100.0 0.0
KS 100.0 0.0 TX 100.0 0.0
KY 100.0 0.0 UT 100.0 0.0
LA 100.0 0.0 VA 52.2 47.8
MA 31.5 68.5 VT 100.0 0.0
MD 53.4 46.6 WA 39.6 60.4
ME 100.0 0.0 WI 64.2 35.8
MI 48.0 52.0 WV 97.0 3.0
MN 32.0 68.0 WY 100.0 0.0
MO 53.6 46.4
MS 100.0 0.0 Total $ 1.4000E+11 1.22000E+11
MT 100.0 0.0 Share 53.4% 46.6%
Special Report
260 State Tax Notes, January 26, 2009
(C) T
ax Analysts 2009. A
ll rights reserved. Tax A
nalysts does not claim copyright in any public dom
ain or third party content.
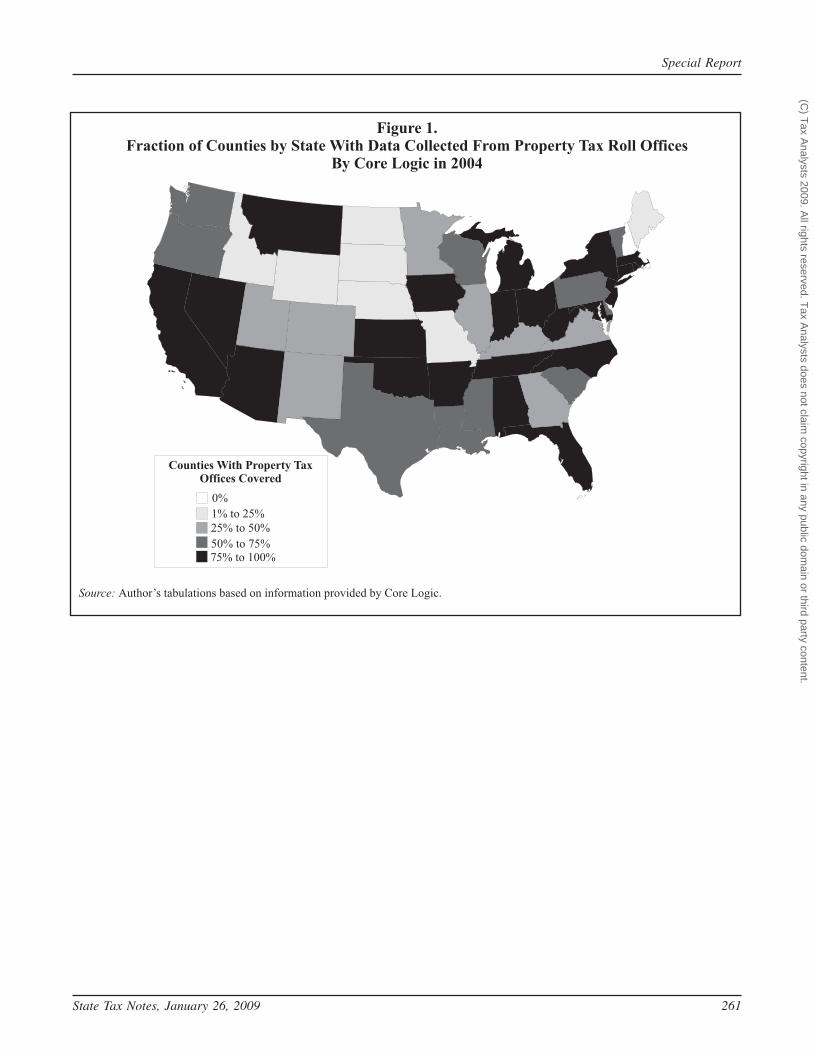
Figure 1.Fraction of Counties by State With Data Collected From Property Tax Roll Offices
By Core Logic in 2004
Source: Author’s tabulations based on information provided by Core Logic.
0%
Counties With Property TaxOffices Covered
1% to 25%
25% to 50%
50% to 75%75% to 100%
Special Report
State Tax Notes, January 26, 2009 261
(C) T
ax Analysts 2009. A
ll rights reserved. Tax A
nalysts does not claim copyright in any public dom
ain or third party content.
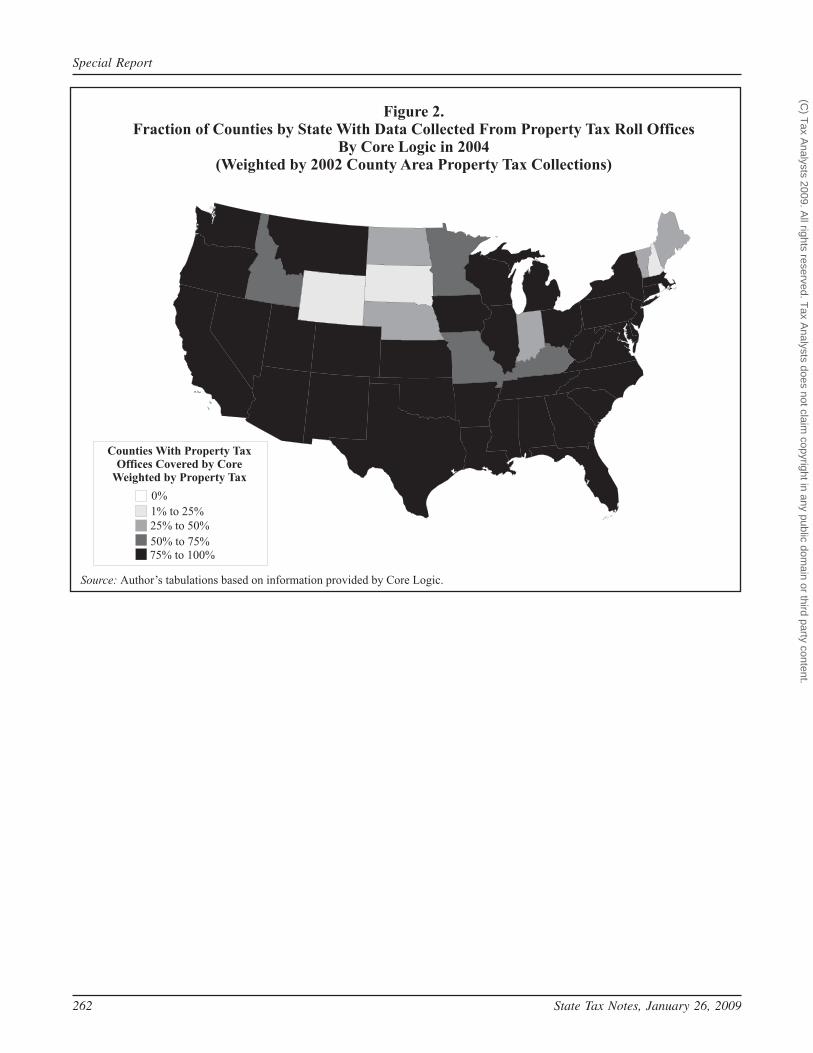
Figure 2.Fraction of Counties by State With Data Collected From Property Tax Roll Offices
By Core Logic in 2004(Weighted by 2002 County Area Property Tax Collections)
Source: Author’s tabulations based on information provided by Core Logic.
0%
Counties With Property TaxOffices Covered by Core
Weighted by Property Tax
1% to 25%
25% to 50%
50% to 75%75% to 100%
Special Report
262 State Tax Notes, January 26, 2009
(C) T
ax Analysts 2009. A
ll rights reserved. Tax A
nalysts does not claim copyright in any public dom
ain or third party content.

Figure 3.Fraction of Counties by State With Data Collected From Deed Transfer Offices
By Core Logic in 2004
Source: Author’s tabulations based on information provided by Core Logic.
0%
Counties With Deed TransferOffices Covered
1% to 25%
25% to 50%
50% to 75%75% to 100%
Special Report
State Tax Notes, January 26, 2009 263
(C) T
ax Analysts 2009. A
ll rights reserved. Tax A
nalysts does not claim copyright in any public dom
ain or third party content.
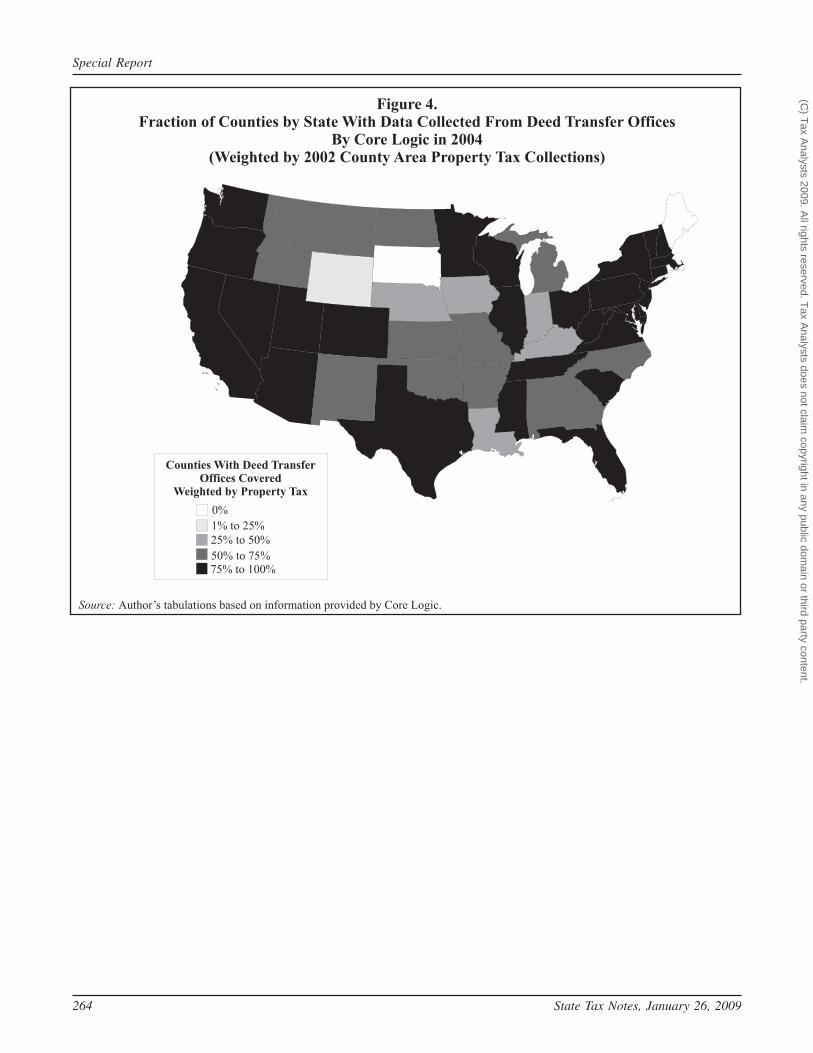
Figure 4.Fraction of Counties by State With Data Collected From Deed Transfer Offices
By Core Logic in 2004(Weighted by 2002 County Area Property Tax Collections)
Source: Author’s tabulations based on information provided by Core Logic.
0%
Counties With Deed TransferOffices Covered
Weighted by Property Tax
1% to 25%
25% to 50%
50% to 75%75% to 100%
Special Report
264 State Tax Notes, January 26, 2009
(C) T
ax Analysts 2009. A
ll rights reserved. Tax A
nalysts does not claim copyright in any public dom
ain or third party content.
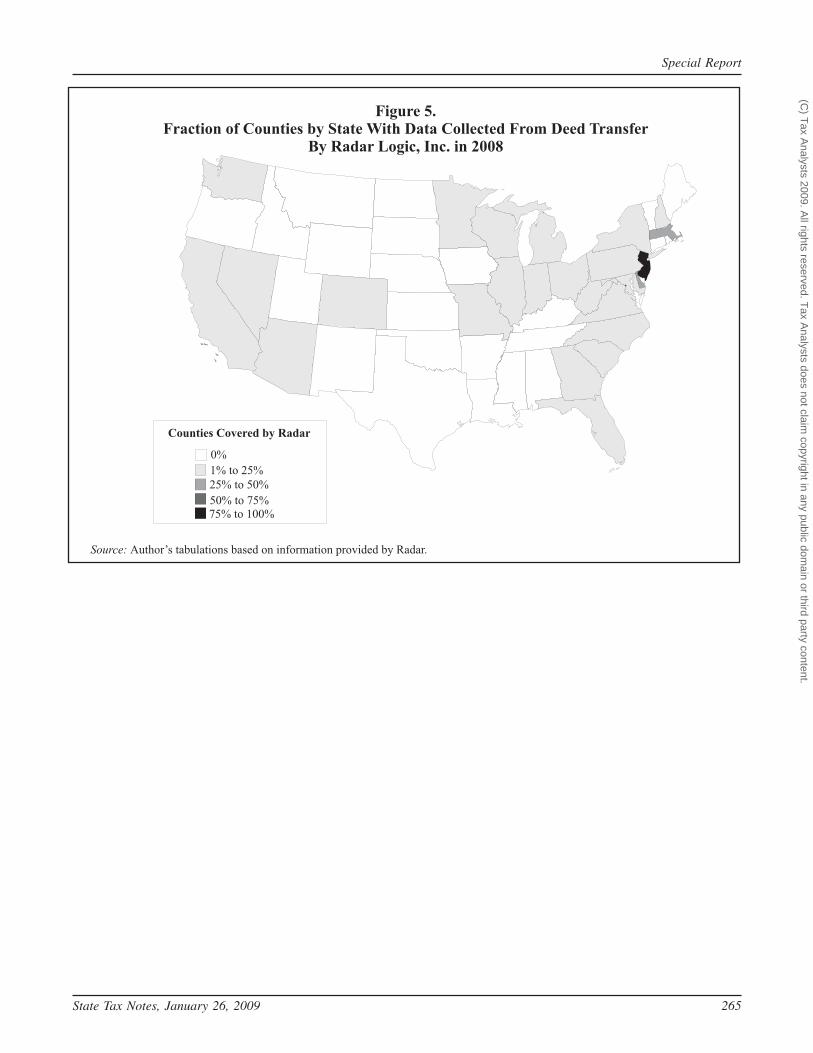
Figure 5.Fraction of Counties by State With Data Collected From Deed Transfer
By Radar Logic, Inc. in 2008
Source: Author’s tabulations based on information provided by Radar.
0%
Counties Covered by Radar
1% to 25%
25% to 50%
50% to 75%75% to 100%
Special Report
State Tax Notes, January 26, 2009 265
(C) T
ax Analysts 2009. A
ll rights reserved. Tax A
nalysts does not claim copyright in any public dom
ain or third party content.

Figure 6.Fraction of Counties by State With Data Collected From Deed Transfer
by Radar Logic, Inc. in 2008(Weighted by 2002 County Area Property Taxes)
Source: Author’s tabulations based on information provided by Radar.
0%
Counties Covered by RadarWeighted by Property Tax
1% to 25%
25% to 50%
50% to 75%75% to 100%
Special Report
266 State Tax Notes, January 26, 2009
(C) T
ax Analysts 2009. A
ll rights reserved. Tax A
nalysts does not claim copyright in any public dom
ain or third party content.