alternative approaches to income imputation in setting
TRANSCRIPT
3412 William H. Sewell Social Sciences Building | 1180 Observatory Drive | Madison, WI 53706
Phone: 608-262-6358 | Fax: 608-265-3119 | Web: www.irp.wisc.edu
Alternative Approaches to Income Imputation in Setting Child Support Orders
Leslie Hodges Chris Taber
Jeffrey Smith Institute for Research on Poverty
University of Wisconsin–Madison
September 2019 This report has been prepared under a contractual agreement between the Wisconsin Department of Child and Families and the Institute for Research on Poverty. Any views expressed in this paper are those of the authors and not necessarily of the sponsoring organization.

INTRODUCTION
Parental income is a key component in the determination of a child support obligation.
When the court does not have any evidence of the level of the noncustodial parent’s income, or
when recorded income is believed to be less than the noncustodial parent’s earnings capacity,
income is typically imputed.0F
1 In the past, income was often imputed based on full-time (35 or 40
hours per week) employment at the federal minimum wage (Fleming, 2017; Wis. Stat § DCF
150.03.3), and a child support order was assigned accordingly. However, in response to concerns
that orders based on imputed income may not accurately reflect the noncustodial parent’s ability
to pay, the Flexibility, Efficiency, and Modernization in Child Support Programs final rule of
December 2016 requires that if a state’s guidelines allow for income imputation, the order must
take into consideration “the specific circumstances of the noncustodial parent . . . to the extent
known, including such factors as the noncustodial parent’s assets, residence, employment and
earnings history, job skills, educational attainment, literacy, age, health, criminal record and
other employment barriers, and record of seeking work, as well as the local job market, the
availability of employers willing to hire the noncustodial parent, prevailing earnings level in the
local community, and other relevant background factors in the case.” (45 C.F.R. § 302.56(c)(iii)).
As Wisconsin prepares to review its guidelines in 2020, this report explores three
alternative approaches to imputing noncustodial parent income that could be considered
consistent with the 2016 ruling. First, we consider keeping the federal minimum wage ($7.25) as
the hourly wage rate but using estimates of hours worked by locality, occupation, and level of
1In this article, “imputed income” refers to income attributed by the courts to the noncustodial parent in the
process of order determination. This is the term used by the Federal Office of Child Support Enforcement in 2016 final rule (45 C.F.R. § 302.56(c)(iii)).

2
education. Second, we consider using estimates of workers’ annual earnings by locality,
occupation, and level of education. Third, we consider using estimates based on the actual
earnings of noncustodial parents with imputed income orders in the year after order
establishment. We obtain the estimates for the first two approaches from the 2017 American
Community Survey (ACS) that is publicly available from the Integrated Public Use Microdata
Series (IPUMS) USA database (Ruggles et al., 2019), and we obtain the estimates for the third
approach from Wisconsin Court Records Data (CRD) matched to Unemployment Insurance (UI)
wage records.
For each approach, we report average monthly imputed income amounts at three different
points in the distribution, the 25th percentile, the median (50th percentile), and the mean. We use
current Wisconsin guidelines to calculate the percentage of monthly income due for current
support (assuming one nonresident child) and the resulting monthly order amount. We report
results for several model cases varying the characteristics of the noncustodial parent by locality,
occupation, and level of education. We report estimates for all workers and, where possible,
separately by sex and by race. We discuss the strengths and weakness of these approaches in
light of several factors including the language of the December 2016 rule; the typical information
available to the court when establishing orders; recommendations on preferred data sources for
imputing income; and the existing research on patterns in employment, earnings, and order
compliance among noncustodial parents with imputed-income orders. We also briefly discuss
our considerations regarding the development of an on-line calculator where a user could enter
case-specific information to obtain an income estimate for a noncustodial parent whose income
information is unknown.

3
BACKGROUND AND POLICY CONTEXT
The child support program aims to ensure that parents contribute to the financial well-
being of their children even if they do not live with them. Federal legislation requires that states
develop and use a standard set of guidelines to calculate child support obligations based on the
income and assets of either or both parents (Child Support Enforcement Amendment, 1984;
Family Support Act, 1988; Wis. Stat § DCF 150). Under Wisconsin’s child support guidelines,
the standard percentage of a noncustodial parent’s gross income1F
2 allocated to child support for
one child begins at 17 percent, and increases for each additional child, up to 34 percent for
obligors with five or more children. The percentages are based on estimates of the proportion of
income spent on child rearing (Wis. Stat § DCF 150 Preface; Robb, 2019), and may be reduced
for lower income payers (Wis. Stat § DCF 150 Appendix C). Basing the obligation on a set
percentage of income is intended to facilitate simplicity and transparency in order
determinations, and to promote fairness and consistency across cases (Brito, 2012; Pirog, Klotz
& Beyers, 1998), but relies heavily on the assumption that courts have accurate information
about parents’ economic resources and abilities to pay.
The process of determining the child support obligation may be compromised if the court
has no evidence of the level of noncustodial parent income, or if the income of the noncustodial
parent is less than what a court perceives to be their potential income. In order to avoid delays in
establishing orders and to avoid awarding orders for no support or minimum amounts, all states
allow for income imputation, or the use of assumptions about how much a noncustodial parent is
2Gross income is calculated as income from all sources, less the amount of any public assistance or child
support income received.

4
able to earn, in lieu of using actual income or earnings in order determination (Demyan &
Passarella, 2018; Fleming, 2017; McCann, 2019; Venohr, 2015).
Although surveys of state child support program directors suggest that income imputation
is used as a “last resort” in order determination (Fleming, 2017), analyses of child support
caseload data suggest that orders are set using imputed income in about 15 to 25 percent of all
cases (Cancian, Cook, & Meyer, 2019; Venohr, 2018; Demyan & Passarella, 2018), and in 42 to
63 percent of cases where the noncustodial parent is low-income (Cancian et al., 2019; Demyan
& Passarella, 2018).2F
3 In Wisconsin specifically, recent analyses using the Wisconsin CRD
indicate that noncustodial parents’ income was imputed in 16 percent of all cases, and 42 percent
of cases where the noncustodial parent was low-income (Hodges & Cook, 2019; Cancian et al.,
2019).
Additionally, though not directly identifying imputed-income cases, several studies have
reported on the percentage of noncustodial parents with incomes equivalent to imputed income
amounts. For example, Venohr and Slattery-Quintanilla (2014) reported that 13 percent of
noncustodial parents on child support cases in Arizona had listed annual incomes equivalent to
full-time at the federal minimum wage. Using the same income standard, Takayesu (2011)
reported a rate of 20 percent among noncustodial parents in Orange County, California.
Although income imputation can facilitate the process of setting a child support order,
with the aim of ensuring that both parents are contributing to the well-being of their child(ren),
imputed income may not align with the actual economic circumstances of the noncustodial
parent (that is, their actual or potential earnings). Wisconsin guidelines direct the judiciary to
3Cancian et al. (2019) define low income as annual earnings less than 150 percent of the federal poverty
line. Demyan and Passarella (2018) define low income as annual earnings less than part-time (20 hours per week) at the minimum wage, which is equivalent to $7,540 for their study period.

5
impute income “at an amount that represents the parent’s ability to earn,” taking into account
education, training, work experience, previous earnings, physical and mental health, child care
responsibilities, and local employment conditions (Wis. Stat § DCF 150.03.3). The guidelines
also state that, “If evidence is presented that due diligence has been exercised to ascertain
information on the parent's actual income or ability to earn and that information is unavailable,”
courts may impute income based on a 35-hour work week at the federal minimum hourly wage
(Wis. Stat § DCF 150.03.3).
Compliance with child support obligations appears to be maximized when orders do not
exceed more than 25 percent of a noncustodial parents’ earnings (Hodges, Meyer, & Cancian,
2019; Takayesu, 2011; Meyer, Ha, & Hu, 2008), and this percentage is likely lower (closer to 10
to 15 percent) for more economically disadvantaged noncustodial parents (Hodges et al. 2019;
Meyer et al. 2008). If imputed income accurately reflects a noncustodial parent’s ability to pay,
then orders as a percentage of actual earnings are not likely to exceed these amounts. However,
Demyan and Passarella (2018) found that 65 percent of noncustodial parents in Maryland with
imputed incomes had orders that constituted more than 25 percent of their actual earnings in the
year after order establishment. In comparison, the rate was 33 percent for noncustodial parents
whose incomes were not imputed. Of the 65 percent of noncustodial parents with imputed-
income orders greater than 25 percent of their actual earnings, more than half had orders that
exceeded 75 percent of their actual earnings in the year after order establishment.
It is perhaps not surprising then that average payments and rates of compliance for
imputed-income cases are considerably lower than average payments and rates of compliance on
cases where the noncustodial parent’s income is not imputed. Demyan and Passarella (2018)
reported average annual payments of $975 for noncustodial parents with imputed incomes, and

6
$3,239 for noncustodial parents without imputed incomes. These estimates are quite similar to
Cancian, Cook, and Meyer (2019), who reported average payments of $946 for noncustodial
parents with imputed incomes, and $4,445 for noncustodial parents without imputed incomes.
Both sets of authors also find substantially lower rates of compliance (total amount paid as a
proportion of the amount due) for noncustodial parents with imputed-income orders compared to
those without. For those with imputed-income orders, rates of compliance in the year after order
establishment were 31 percent in both studies. For those with orders based on actual income,
rates of compliance were 67 percent in the Demyan and Passarella study and 71 percent in the
Cancian et al. study.
The findings from these recent studies, as well as research conducted prior to the
December 2016 ruling (i.e., Formoso, 2003; Takayesu, 2011; US DHHS OIG, 2000; Visher &
Courtney, 2006; Waller & Plotnick, 2001) suggests that imputing income at lower levels than the
current standard could result in more consistent payment of child support. In fact, prior to the
2016 rule, some local jurisdictions were already imputing income at lower levels. For example,
the local child support agency in St. Joseph County, Indiana, began imputing income at half the
federal poverty line for single-person households in cases where “a parent has a known
substance-abuse problem, impaired work ability due to a medical problem, a felony record, and
when he or she lacks both a high school diploma or GED degree and an employment history”
(Brinig & Garrison, 2018).
Although the 2016 rule does not necessarily imply imputing income at lower levels than
the current standard, it does imply moving away from imputing income with a fixed amount. In a
recent examination of quadrennial reviews of child support guidelines conducted by states in
2018, Hodges & Vogel (2019) examine how states were interpreting this ruling. They found that

7
review committees mostly recommended statutory changes to the language on income
imputation that directed the courts to consider factors related to individual circumstances of the
noncustodial parent but did not always provide additional guidance on how these factors should
be used. When review committees did provide more specifics, their recommendations tended to
use factors related to the individual circumstances of the noncustodial parent as a tool for
determining when to impute income at a fixed amount. For example, Arizona’s child support
guidelines, revised in 2018, state that “income of at least minimum wage should generally be
attributed to a parent after considering the specific circumstances of the parents to the extent
known” (Arizona Supreme Court, 2019; authors’ own emphasis).
In this report we explicitly consider how factors related to ability to pay can be used to
determine an imputed income amount. At the same time, we acknowledge that when income is
unknown the courts may have very little additional information about a noncustodial parent.
Based on a review of the typical forms3F
4 that the courts use to collect information about the
parents involved in child support cases, a review of a small number of child support case files4F
5,
and conversations with Wisconsin court records data collectors, we concluded that a limited set
of parental information is available to the courts, at least in the written records.5F
6 Therefore, we
prioritize factors that are likely to be important determinants of a noncustodial parents’ economic
4See, e.g., FA-4139V, “Financial Disclosure Statement” (Wis. Stat. §767.127). 5We were able to obtain redacted child support case files from several counties in order to get a sense of the
information that might be available to the courts. 6When we inquired about the lack of data on parents’ level of education in the CRD, the data collectors
informed us that the reason that this information was not collected was because it was infrequently included in the case files.

8
circumstances and potentially available to courts (such as sex, race, locality, occupation, and
level of education).6F
7
We report average monthly imputed income amounts at three different points in the
distribution, the 25th percentile, the median (50th percentile), and the mean. We include the 25th
percentile along with the median and the mean because, based on the findings of recent studies,
income imputation may indicate that the noncustodial parent has low income or is facing
significant barriers to employment.
Of recent studies of child support cases with imputed-income orders, Brinig & Garrison
(2018) provided the greatest detail regarding parental characteristics. Among their sample of
low-income child support cases in St. Joseph County, IN, where the father was the payer on the
case, they found that fathers who were African-American, who did not appear in court, who were
incarcerated or receiving Social Security Disability payments, who had housing instability
(higher rates of moves), and who had children with other partners, were all more likely to have
imputed-income orders (Brinig & Garrison, 2018). Unfortunately, they did not have information
about the actual earnings of the noncustodial parents in their sample either before or after order
establishment.
Demyan and Passarella (2018), on the other hand, had more limited information about the
parents on the child support cases that they examined, but did have access to UI wage records for
the parents on the cases. They found considerable differences in employment rates between those
with and without imputed-income orders: 50.6 percent compared to 68.3 percent had any
employment in the year after establishment and 40.9 percent compared to 68.3 percent were
7The data also contain limited information on incarceration; more information on this dimension would
allow its incorporation into the income imputation process.

9
employed in all four quarters. Even more striking were the contrasts in median annual earnings
from formal employment: $6,152 compared to $27,542.
We also consider both sex and race as factors related to ability to pay in our analyses. The
factors listed in the ruling—“assets, residence, employment and earnings history, job skills,
educational attainment, literacy, age, health, [and] criminal record” (45 C.F.R. §
302.56(c)(1)(iii))—suggest a gender and race-neutral approach to imputing income. This is
consistent with current child support policies that do not distinguish between whether the mother
or the father is the noncustodial parent (Moseley 1999). However, female and non-white workers
face unique challenges in the labor market such that sex and race are likely to be significant
determinates of earnings. Female workers are more likely to leave their jobs for compelling
family reasons and they are more likely to experience economic insecurity due to employment
interruptions (Bauer & Sousa-Poza, 2015). Lower levels of educational attainment and history
with the criminal justice system differentially affect employment opportunities and wages for
African American workers (Holzer, Offner, & Sorensen, 2005), who are overrepresented in the
IV-D caseload (Cancian, Meyer, & Han 2011; Holzer, Offner, & Sorensen, 2005), and cases with
imputed-income orders (Brinig & Garrison, 2018; Demyan & Passarella, 2018).
APPROACHES
Approach 1: Hours Worked
We consider three approaches that could be used to impute noncustodial parent income
consistent with the 2016 ruling. In the first approach, we calculate income by keeping the hourly
wage rate constant at the federal minimum wage in 2019 ($7.25), and using estimates of hours
worked per week by occupation, level of education, and county. This approach is similar to what
has been considered by some states in their child support guideline reviews (Venohr, 2018).

10
In large part, this type of approach has been motivated by evidence that hours of available
work vary across labor markets and across occupations and industrial sectors. For example, in
the recent review of New Mexico State Child Support Guidelines, Venohr (2018 p. 29) considers
variation in average hours worked per week by industry, and shows that averages vary from 27
hours in the leisure and hospitality industry to 39.6 in the construction industry. The approach
has also been motivated by national estimates of the percentage of workers working less than
full-time due to economic reasons (see, for instance, Demyan and Passerella (2018) who cite
Canon, Kudlyak, & Reed (2014)) and evidence that, particularly in some service industries and
occupations, work hours can vary from week to week or even day to day (Alexander & Haley-
Lock, 2015; Lambert et al., 2014).
This type of approach to imputing income has also been motivated by concerns that in
some states noncustodial parents with imputed incomes based on full-time work at the minimum
wage may not qualify for a low-income adjustment to their order (Venohr, 2018). In Wisconsin,
a noncustodial parent working 35 hours per week at the federal minimum wage would have a
monthly gross income of approximately $1,100, and would thus qualify for a low-income
adjustment. For a case with one child, under the Wisconsin guidelines schedule for low-income
payers, the noncustodial parents’ obligation would be 14 percent of their gross income, or 3
percentage points less than the standard 17 percent rate for one child (Wis. Stat § DCF 150
Appendix A; Wis. Stat § DCF 150 Appendix C). We consider hours worked per week for
workers at the 25th percentile of the hours distribution, as well as median and mean hours worked
per week. We also report the income, percentage of income, and order amount under the current
practice of imputing income at 35 hours per week at the federal minimum wage.

11
Approach 2: Earnings of Workers in Wisconsin
For a second approach, we calculate income using annual earnings estimates by locality,
occupation, and level of education for workers in Wisconsin. North Dakota has recently
incorporated a similar approach in their statute, allowing for income imputation at “six-tenths of
the state’s statewide average earnings for persons with similar work history and occupational
qualifications” (N.D. Admin. Code § 75-02-04.1; Venohr, 2018). Other states have raised
concerns that state-level earnings amounts may result in “too-high” orders. The recent report on
Florida child support guidelines, for example, states that “imputing standard amounts in default
cases based upon state median wage or statewide occupational wage rates does not comply with
this rule because it is unlikely to result in an order that a particular noncustodial parent has the
ability to pay” (Norrbin et al., 2017, p. 123). The report goes on to note that the Florida state
median wage was more than 2.5 times the minimum wage (Norrbin et al., 2017).
We share a similar concern that imputing income using state-level measures, such as the
median annual earnings of workers in Wisconsin, could result in too-high orders for many
parents. We estimate median annual earnings of $31,566 (in 2019 dollars) for workers in
Wisconsin.7F
8 This amount is well above the threshold for a low-income adjustment in Wisconsin,
which is $18,732 or 150 of the federal poverty line for a single person household and would
result in a monthly order of $447. Therefore, for this approach, we consider annual earnings of
workers at the 25th percentile of the earnings distribution, as well as median earnings and mean
earnings. Moreover, state-level estimates likely mask substantively meaningful within-state
variation in earnings by locality, occupation, and education. By accounting for these factors, we
8Authors’ own calculations using annual income from wages (adjusted to 2019 dollars) for individuals in
Wisconsin ages 16 to 65 who worked in the last year (N = 152,215), from the IPUMS USA 2017 ACS 5-year sample (Ruggles et al., 2019).

12
are more confident that this approach will produce income amounts that are both reasonable and
comparable to those from our other two approaches.
Approach 3: Earnings of Noncustodial Parents with Imputed-Income Orders
For a third approach, we construct a sample of noncustodial parents with imputed-income
orders from previous cohorts of Wisconsin child support cases. We then match the noncustodial
parents on these cases to Wisconsin UI wage records in order to calculate income using their
average earnings in the year following their court order. This approach is very different in that
we obtain direct evidence on the later earnings (in the formal labor market) of noncustodial
parents with imputed-income orders. It also gives us additional information to evaluate the other
two approaches by allowing us to examine the extent to which they result in imputed incomes
that align with what we know about the actual earnings of noncustodial parents on imputed-
income cases with similar characteristics. This approach is especially important because our read
of the prior literature suggests that noncustodial parents with imputed-income orders have
distinct employment and earnings patterns that differ from those of the larger child support
caseload, and that may or may not be captured by the first two approaches. However, we also
note that later earnings may be influenced by the order itself, particularly if the size of the order
relative to actual earnings leads to the accumulation of child support debt (Cancian, Heinrich, &
Chung, 2013). It is possible that the earnings of former fathers with imputed-income orders
might have been higher under a system where they received more modest support orders.
For each approach, we report the imputed-income amount (average monthly), percentage
of income under Wisconsin child support guidelines, and order amount (monthly) for several
“model cases” where we vary the characteristics of the noncustodial parent by occupation
(production occupations, food preparation and serving related occupations), education (less than

13
high school diploma, high school diploma/GED, four-year degree), and county (Dane County,
Marathon County, Milwaukee County, and Price County). We report results overall and
separately by sex (male, female) and race (white, black). We recognize that current child support
guidelines do not differentiate between whether the noncustodial parent is the mother or the
father in the determination of the support amount and that there may be legal constraints that
prohibit the courts from considering race and gender in order determination.8F
9 Reporting the
results from the different model cases for all individuals and separately by sex and race,
however, provides a sense of how much a gender-neutral or race-neutral approach masks
important differences between workers that would result in variation in imputed income
amounts.
DATA, SAMPLES, & MEASURES
American Community Survey (ACS) 2017 5-Year Sample
For Approaches 1 and 2, we use the publicly available ACS 2017 5-year sample from the
IPUMS USA database (Ruggles et al., 2019). The U.S. Census Bureau product describes its ACS
as the “premier source for detailed population and housing information about our nation” (US
Census Bureau, 2019a). We selected the ACS primarily because of its sample size and its
coverage of smaller geographical areas (US Census Bureau, 2019b). Using the ACS 5-year
sample allows us to generate estimates of earnings and hours worked that are representative at
the county level, though some counties with a population under 100,000 are aggregated into
Public Use Microdata Areas (PUMAs) in the microdata (US Census Bureau, 2019c).
9For a discussion of the legal basis for a gender-neutral approach to order determination see Clark (1999).
14
Our main ACS sample consists of 148,347 individuals between the ages of 18 and 65
living in Wisconsin who worked in the last year. In the ACS 2017 5-year sample there were
293,311 total individuals living in Wisconsin. Of these individuals, 180,040 (61 percent) were
between the ages of 18 and 65 (60,342 were under the age of 18 and 52,929 were over the age of
65). Of those between the ages of 18 and 65, 31,693 (18 percent) had not worked in the last year.
Since finding full-time work is a challenge for many people, rather than assume that they
work 35 hours per week, we attempt to predict the number of hours that workers with various
characteristics work per month. Our Approach 1 then takes the mean (or median or 25th
percentile) of the predicted hours values, and multiplies it by the minimum wage for an
alternative estimate of monthly earnings.
The ACS does not provide hours worked per month (or per year), so we need to estimate
it indirectly. For each of the individuals in our main ACS sample, we have information on the
usual number of hours that they worked per week in the last year, and the total number of weeks
they worked in the last year. To obtain our estimate of the number of hours per year for each
worker, we first multiply the number of hours per week that the individual reported they usually
worked in the last year by the number of weeks they reported working in the last year. We then
divide that total by 12 to get the average number of hours worked per month. We multiply the
mean (or median or 25th percentile) of this number by the minimum wage to get our Approach 1
estimate of monthly earnings. We calculate alternative estimates by demographic groups by
estimating the average (or median or 25th percentile) hours separately for the different groups.
We also have individuals’ reports of their total gross earned income in the last year,
which we use to obtain our measure of median annual earnings for Approach 2. We convert

15
earnings to 2019 dollars using the Personal Consumption Expenditures Price Index (PCEPI).9F
10
Additionally, we have information on their sex (male, female), race (white, black, and other race
or multiple races), level of education (less than high school, high school diploma or GED, four-
year degree or more), occupation10F
11, and county of residence11F
12 that allows us to calculate
conditional medians that likely better reflect individual labor market opportunities.
For Approach 3, we draw from the Wisconsin CRD12F
13, a sample of child support-related
cases filed in 21 Wisconsin counties. We use the same sample of 18,158 cases coming to court
between 1996 and 2010 used by Hodges and Cook (2019) in their report on the use of child
support guidelines in Wisconsin.13F
14 This is a larger number of cases than Cancian and colleagues
(2019), who restrict their sample to cohorts 30 and 33 (cases coming to court in 2010 and 2013).
10We prefer the PCEPI to the Consumer Price Index for methodological reasons; see e.g. the discussion at
https://www.clevelandfed.org/newsroom-and-events/publications/economic-trends/2014-economic-trends/et-20140417-pce-and-cpi-inflation-whats-the-difference.aspx
11We group occupations into 24 separate categories for business, science, and arts; business operations specialists; financial specialists; computer and mathematical; architecture and engineering; life, physical, and social science; community and social services occupations; legal occupations; education, training, and library occupations; arts, design, entertainment, sports, and media occupations; healthcare practitioners and technical occupations; healthcare support occupations; protective service occupations; food preparation and serving occupations; building and grounds cleaning and maintenance occupations; personal care and service occupations; sales and related occupations; office and administrative support occupations; farming, fishing, and forestry occupations; construction and extraction occupations; installation, maintenance, and repair workers; production occupations; transportation and material moving occupations; and military specific occupations.
12County/public use microdata areas (PUMA) includes separate categories for Brown, Dane, Kenosha, La Crosse (city), Marathon, Milwaukee, Outagamie, Racine, Rock, Sheboygan, Walworth, Waukesha, and Winnebago Counties. Other counties are combined, into a total of 15 groupings: (1) Northwest Wisconsin (includes 10 counties); (2) Oneida, Lincoln, Vilas, Langlade, and Forest; (3) West Central Wisconsin (includes eight counties); (4) Grant, Green, Iowa, Richland, and Lafayette; (5) Sauk and Columbia; (6) Dodge and Jefferson; (7) Marinette, Oconto, Door and Florence; (8) Manitowoc and Kewaunee; (9) East Central Wisconsin (includes five counties); (10) Fond du Lac and Calumet; (11) Wood, Portage, Juneau, and Adams; (12) Washington and Ozaukee; (13)Barron, Polk, Clark, and Chippewa (North); (14) St. Croix and Dunn; and (15) Eau Claire and Chippewa (South).
13The 21 CRD counties are: Calumet, Clark, Dane, Dodge, Dunn, Green, Jefferson, Juneau, Kewaunee, Marathon, Milwaukee, Monroe, Oneida, Ozaukee, Price, Racine, Richland, St. Croix, Sheboygan, Waukesha, and Winnebago.
14The CRD sample used by Hodges and Cook (2019) includes 20,468 total cases. Of these cases, they exclude 415 that did not have information about parental custody, 324 that did not have a weight, 971 where the parents reconciled, 352 that did not have a physical placement order, nine where the children were placed with a third party, 174 that had a split placement arrangement, and 65 that had additional missing information.
16
From the 18,158 cases coming to court between 1996 and 2010, we identify 13,249 cases (76
percent) that had a child support order at the time of the final judgement or paternity
establishment. In 13,017 of those cases, either the mother or the father on the case was identified
as the noncustodial parent and ordered to pay child support.14F
15
From the sample of cases with a child support order, we identify 1,973 imputed-income
cases (15 percent). We follow the same methods as Hodges and Cook (2019) and Cancian and
colleagues (2019) to identify imputed income. Specifically, we identify cases as having imputed-
income orders if the court record indicates that the type of support order is a “fixed-dollar order,
based on a percentage of potential income” or if there is a record of a deviation from the
guidelines that indicates that the potential earnings of the payer were used in order
determination.15F
16
For imputed-income cases, we are able to match the noncustodial parent to UI wage
records for the state of Wisconsin. We then record the annual earnings from formal employment
for each case in the year after the order was set.16F
17 We convert the earnings to 2019 dollars using
the PCEPI. The UI wage records only record positive earnings for individuals with covered jobs
in the state of Wisconsin. This means that we have no data on earnings for individuals who work
outside of Wisconsin, who work for certain employers (such as the federal government), who
work informally (for example, do odd jobs for cash), or who are self-employed. The CRD gives
us very limited demographic information about the workers relative to the ACS. However, we
15There were 230 cases that did not identify a payer, one that listed someone other than the noncustodial
parent as the payer, and one that indicated that payer changed over the case history. 16In the CRD, data collectors identify three types of deviations from the standard percentage-of-income
guidelines that indicate that imputed income was used in setting an order. These are deviations due to: (1) the potential earnings of the payer (general); (2) the potential earnings of the payer based on full-time federal minimum wage; and (3) the potential earnings of the payer based on part-time federal minimum wage.
17This refers to the four calendar quarters following the calendar quarter in which the order was set.

17
were able to match the noncustodial parent on the imputed-income cases to the KIDS caseload
data in order to obtain information about parental race for most cases.
The Wisconsin CRD matched to UI wage and KIDS data give us the advantage of having
detailed information about noncustodial parents in Wisconsin whose child support orders were
set using imputed income. In addition to information on the noncustodial parents’ later earnings
and race, we also have information on the location of the case (county) and, for some cases, the
noncustodial parent’s occupation. Unfortunately, data on noncustodial parent education was not
available from the CRD or from KIDS. Additionally, not all Wisconsin counties are represented
in the CRD sample. To represent different types of Wisconsin counties, we select four counties:
Milwaukee, Dane, Marathon, and Price.
RESULTS
Table 1 presents our results for Approach 1. For comparison, the first three columns
present the imputed income and order under the status quo assuming a constant 35 hours per
week. The next three sets of columns show the calculations using the 25th percentile of monthly
hours, the median of monthly hours, and the mean of monthly hours for each of the relevant
categories. One can see substantial variation in the orders depending on which calculation we
use.

18
Table 1. Approach 1: Monthly Income, Percentage of Income, and Burden Levels by County, Occupation, and Level of Education Approach 1: Hours Worked at Federal Minimum Wage
35 Hours at
Federal Minimum Wage 25th Percentile Median Mean
Scenario Income Percentage of Income
Order Amount Income
Percentage of Income
Order Amount Income
Percentage of Income
Order Amount Income
Percentage of Income
Order Amount
Wisconsin $1,100 14% $151 $920 12% $113 $1,257 15% $185 $1,131 14% $155 Production Occupation $1,100 14% $151 $1,257 15% $185 $1,257 15% $185 $1,199 14% $172
Less than High School Diploma $1,100 14% $151 $1,051 13% $138 $1,257 15% $185 $1,126 14% $154 High School Diploma $1,100 14% $151 $1,257 15% $185 $1,257 15% $185 $1,207 14% $173 Four-year degree $1,100 14% $151 $1,162 14% $162 $1,257 15% $185 $1,214 14% $174
Food preparation and service occupation $1,100 14% $151 $399 11% $45 $788 11% $88 $795 11% $89
Less than High School Diploma $1,100 14% $151 $237 11% $27 $657 11% $74 $704 11% $79 High School Diploma $1,100 14% $151 $399 11% $45 $788 11% $88 $799 11% $90 Four-year degree $1,100 14% $151 $526 11% $59 $943 12% $115 $895 12% $108
Dane County $1,100 14% $151 $788 11% $88 $1,257 15% $185 $1,098 13% $148 Marathon County $1,100 14% $151 $1,005 13% $129 $1,257 15% $185 $1,176 14% $166 Milwaukee County $1,100 14% $151 $788 11% $88 $1,257 15% $185 $1,097 13% $148 Price County $1,100 14% $151 $798 11% $89 $1,257 15% $185 $1,103 13% $149
Source: 2017 American Community Survey, 5 year sample. N= 148,347 individuals in Wisconsin ages 18 to 65. Notes: Percentage of income figures are based on the Wisconsin child support guidelines schedule for 2019 (Wis. Stat § DCF 150 Appendix A, 2019; Wis. Stat § DCF 150 Appendix C, 2019). Italics indicate income less than $781; this corresponds to the lowest monthly income amount on the Wisconsin low-income guidelines schedule, “monthly income up to $781.” https://docs.legis.wisconsin.gov/code/admin_code/dcf/101_199/150_c.pdf

19
Median hours result in the highest expected contributions. For a worker in Wisconsin,
this results in a monthly income level of $1,257 with a monthly order of $185 for a case with one
child. This income amount shows up in many scenarios, and is higher than the $1100 income and
$151 order we see under the current standard. This difference is due to the fact that a large
fraction of workers report working 40 hours per week and working the full year. As a result, the
median worker calculations often assume 40 hours per week rather than 35. One can also see that
for some groups (most notably food preparation and service with less than a high school
diploma) the median is substantially lower.
Mechanically, the 25th percentile must be lower than the median, but it is striking how
much lower it is. For most cases, the implied order amount is less than half of what the median
would yield. This is particularly the case for food preparation and service occupations. Income is
$237 per month at the 25th percentile of the hours distribution for a food preparation and service
occupation worker in Wisconsin with less than a high school diploma. This is almost three times
smaller than income at the median of the hours distribution for the same subgroup.
For the state as a whole and the four counties, the mean values fall between the median
and the 25th percentile. For the results by occupation, the mean values vary relative to the median
and the 25th percentile, sometimes yielding a payment between the two, and sometimes a higher
or lower payment. Between the three distributional measures for Approach 1, we prefer the
mean. In our view, this is a case where the median is a bit of a strange measure, since a large
fraction of workers report full-time (40 hours per week) full-year (52 weeks per year)
employment.
Table 2 presents the results for Approach 2. This table takes a similar format to Table 1
but uses earned income from the ACS rather than assuming the minimum wage. With some

20
exceptions, this approach leads to substantially higher orders compared to Approach 1; we also
see very large differences between the different distributional measures, with the mean
substantially larger than the median, and the median substantially larger than the 25th percentile.
We do not think the mean is a good metric here, given that it can be heavily influenced by a few
very high earners. The median does a much better job of quantifying the typical earner so we
lean towards that, though to be cautious one might prefer the 25th percentile.
Table 3 presents the results from Approach 3. This approach uses the actual income as
measured by UI records of parents with orders and imputed income. These results are stunning.
With some exceptions, this approach leads to substantially lower orders compared to the first two
approaches. In fact, at the 25th percentile and the median, income is very low—$0 to 4 a month
overall, and for all subgroups, less than $300 a month. The highest order amount from this
method using median income would be $31 in Price County. Using the 25th percentile equals $0
except for Price County. The means are larger, as one would expect, but still very small. Only in
production occupations and Marathon County does the monthly income amount exceed the
federal poverty line. Between the three distributional measures for Approach 3, we prefer the
mean. Using the 25th percentile and median measures from this approach would often yield $0
order amounts. However, it is important to keep the main result in mind; parents with imputed-
income orders seem to typically have remarkably low income from formal employment.
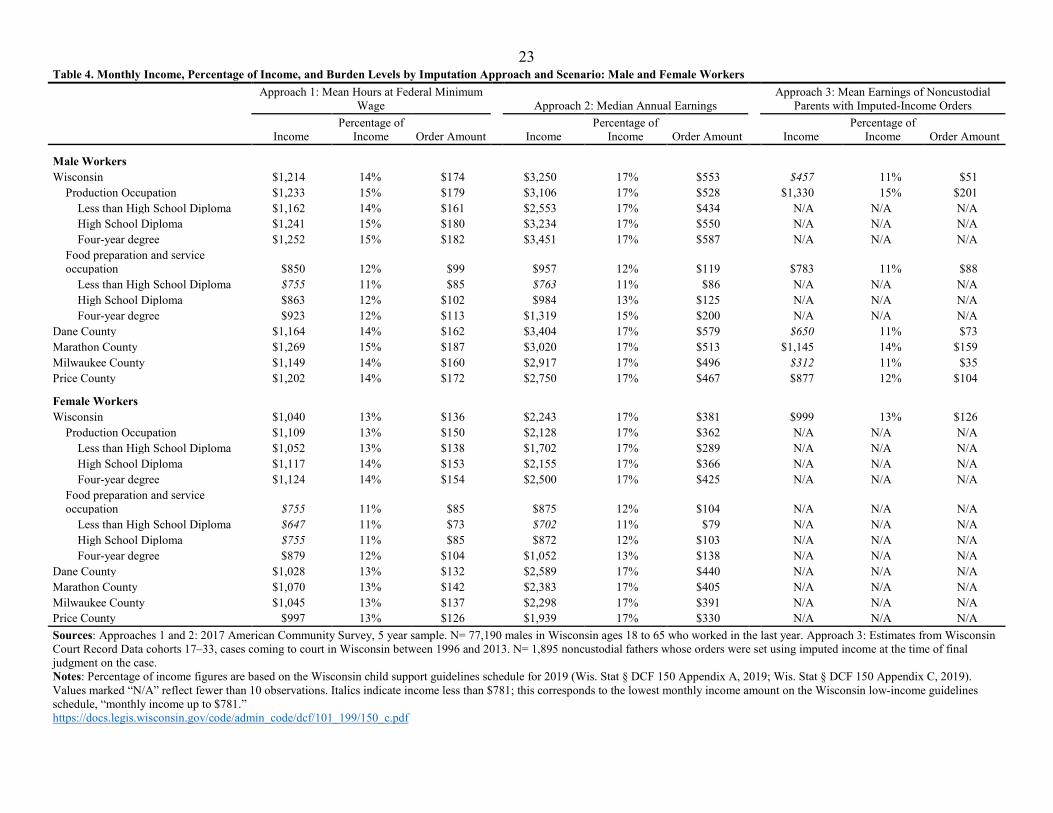
Tables 4 and 5 break these results down for various demographic groups. Rather than
show all 3 possibilities for each approach, we show only one per approach. We use our preferred
measures from each approach: the mean for Approach 1, the median for Approach 2, and the
mean for Approach 3.

21
Table 2. Approach 2: Monthly Income, Percentage of Income, and Burden Levels by County, Occupation, and Level of Education
Approach 2: Annual Earnings
25th Percentile Median Mean
Scenario Income Percentage of Income
Order Amount Income
Percentage of Income
Order Amount Income
Percentage of Income
Order Amount
Wisconsin $1,123 14% $154 $2,675 17% $455 $3,489 17% $593 Production Occupation $1,724 17% $293 $2,806 17% $477 $3,019 17% $513
Less than High School Diploma $1,315 15% $199 $2,213 17% $376 $2,351 17% $400 High School Diploma $1,727 17% $294 $2,894 17% $492 $3,059 17% $520 Four-year degree $1,917 17% $326 $3,146 17% $535 $3,685 17% $626
Food preparation and service occupation $400 11% $45 $896 12% $108 $1,176 14% $166 Less than High School Diploma $219 11% $25 $741 11% $83 $990 13% $125 High School Diploma $417 11% $47 $896 12% $108 $1,166 14% $162 Four-year degree $681 11% $76 $1,250 15% $182 $1,582 17% $269
Dane County $1,120 14% $153 $3,016 17% $513 $4,018 17% $683 Marathon County $1,277 15% $188 $2,648 17% $450 $3,365 17% $572 Milwaukee County $1,072 13% $142 $2,586 17% $440 $3,304 17% $562 Price County $863 12% $102 $2,333 17% $397 $2,837 17% $482 Source: 2017 American Community Survey, 5 year sample. N= 148,347 individuals in Wisconsin ages 18 to 65. Notes: Percentage of income figures are based on the Wisconsin child support guidelines schedule for 2019 (Wis. Stat § DCF 150 Appendix A, 2019; Wis. Stat § DCF 150 Appendix C, 2019). Italics indicate income less than $781; this corresponds to the lowest monthly income amount on the Wisconsin low-income guidelines schedule, “monthly income up to $781.” https://docs.legis.wisconsin.gov/code/admin_code/dcf/101_199/150_c.pdf

22
Table 3. Approach 3: Monthly Income, Percentage of Income, and Burden Levels by County
Approach 3: Annual Earnings of Noncustodial Parents with Imputed-Income Orders
25th Percentile Median Mean
Scenario N Income Percentage of Income
Order Amount Income
Percentage of Income
Order Amount Income
Percentage of Income
Order Amount
Wisconsin 1,941 $0 11% $0 $4 11% $0 $465 11% $52
Production Occupation 51 $0 11% $0 $242 11% $27 $1,330 15% $201
Food preparation and service occupation 27 $0 11% $0 $159 11% $18 $777 11% $87
Dane County 280 $0 11% $0 $17 11% $2 $669 11% $75
Marathon County 72 $0 11% $0 $250 11% $28 $1,129 14% $155
Milwaukee County 560 $0 11% $0 $0 11% $0 $314 11% $35
Price County 24 $53 11% $6 $273 11% $31 $862 12% $100
Source: Estimates from Wisconsin Court Record Data cohorts 17–33, cases coming to court in Wisconsin between 1996 and 2013. N= 1,941 cases in which the payer (noncustodial parent) is the father or mother and in which the child support order was set using imputed income. Excludes 38 cases where the noncustodial parent did not have a valid social security number for a match to the Unemployment Insurance wage records. Notes: Percentage of income figures are based on the Wisconsin child support guidelines schedule for 2019 (Wis. Stat § DCF 150 Appendix A, 2019; Wis. Stat § DCF 150 Appendix C, 2019). Italics indicate income less than $781; this corresponds to the lowest monthly income amount on the Wisconsin low-income guidelines schedule, “monthly income up to $781.” https://docs.legis.wisconsin.gov/code/admin_code/dcf/101_199/150_c.pdf
23
Table 4. Monthly Income, Percentage of Income, and Burden Levels by Imputation Approach and Scenario: Male and Female Workers
Approach 1: Mean Hours at Federal Minimum
Wage Approach 2: Median Annual Earnings Approach 3: Mean Earnings of Noncustodial
Parents with Imputed-Income Orders
Income Percentage of
Income Order Amount Income Percentage of
Income Order Amount Income Percentage of
Income Order Amount
Male Workers Wisconsin $1,214 14% $174 $3,250 17% $553 $457 11% $51
Production Occupation $1,233 15% $179 $3,106 17% $528 $1,330 15% $201 Less than High School Diploma $1,162 14% $161 $2,553 17% $434 N/A N/A N/A High School Diploma $1,241 15% $180 $3,234 17% $550 N/A N/A N/A Four-year degree $1,252 15% $182 $3,451 17% $587 N/A N/A N/A
Food preparation and service occupation $850 12% $99 $957 12% $119 $783 11% $88
Less than High School Diploma $755 11% $85 $763 11% $86 N/A N/A N/A High School Diploma $863 12% $102 $984 13% $125 N/A N/A N/A Four-year degree $923 12% $113 $1,319 15% $200 N/A N/A N/A
Dane County $1,164 14% $162 $3,404 17% $579 $650 11% $73 Marathon County $1,269 15% $187 $3,020 17% $513 $1,145 14% $159 Milwaukee County $1,149 14% $160 $2,917 17% $496 $312 11% $35 Price County $1,202 14% $172 $2,750 17% $467 $877 12% $104
Female Workers Wisconsin $1,040 13% $136 $2,243 17% $381 $999 13% $126
Production Occupation $1,109 13% $150 $2,128 17% $362 N/A N/A N/A Less than High School Diploma $1,052 13% $138 $1,702 17% $289 N/A N/A N/A High School Diploma $1,117 14% $153 $2,155 17% $366 N/A N/A N/A Four-year degree $1,124 14% $154 $2,500 17% $425 N/A N/A N/A
Food preparation and service occupation $755 11% $85 $875 12% $104 N/A N/A N/A
Less than High School Diploma $647 11% $73 $702 11% $79 N/A N/A N/A High School Diploma $755 11% $85 $872 12% $103 N/A N/A N/A Four-year degree $879 12% $104 $1,052 13% $138 N/A N/A N/A
Dane County $1,028 13% $132 $2,589 17% $440 N/A N/A N/A Marathon County $1,070 13% $142 $2,383 17% $405 N/A N/A N/A Milwaukee County $1,045 13% $137 $2,298 17% $391 N/A N/A N/A Price County $997 13% $126 $1,939 17% $330 N/A N/A N/A Sources: Approaches 1 and 2: 2017 American Community Survey, 5 year sample. N= 77,190 males in Wisconsin ages 18 to 65 who worked in the last year. Approach 3: Estimates from Wisconsin Court Record Data cohorts 17–33, cases coming to court in Wisconsin between 1996 and 2013. N= 1,895 noncustodial fathers whose orders were set using imputed income at the time of final judgment on the case. Notes: Percentage of income figures are based on the Wisconsin child support guidelines schedule for 2019 (Wis. Stat § DCF 150 Appendix A, 2019; Wis. Stat § DCF 150 Appendix C, 2019). Values marked “N/A” reflect fewer than 10 observations. Italics indicate income less than $781; this corresponds to the lowest monthly income amount on the Wisconsin low-income guidelines schedule, “monthly income up to $781.” https://docs.legis.wisconsin.gov/code/admin_code/dcf/101_199/150_c.pdf

24
Table 5. Monthly Income, Percentage of Income, and Burden Levels by Imputation Approach and Scenario: African American and White Workers
Approach 1: Mean Hours at
Federal Minimum Wage Approach 2: Median Annual Earnings Approach 3: Mean Earnings of Noncustodial
Parents with Imputed-Income Orders
Income Percentage of
Income Order Amount Income Percentage of
Income Order Amount Income Percentage of
Income Order Amount
African American Workers Wisconsin $1,013 13% $130 $1,838 17% $313 $253 11% $28
Production Occupation $1,060 13% $141 $2,002 17% $340 N/A N/A N/A Less than High School Diploma $827 11% $95 $1,140 14% $156 N/A N/A N/A High School Diploma $1,105 13% $149 $2,104 17% $358 N/A N/A N/A Four-year degree $1,144 14% $159 $2,917 17% $496 N/A N/A N/A
Food preparation and service occupation $772 11% $87 $526 11% $59 N/A N/A N/A
Less than High School Diploma $565 11% $63 $896 12% $108 N/A N/A N/A High School Diploma $819 11% $94 $942 12% $115 N/A N/A N/A Four-year degree $718 11% $81 $863 12% $102 N/A N/A N/A
Dane County $1,007 13% $130 $1,894 17% $322 $284 11% $32 Marathon County $1,072 13% $142 $1,833 17% $312 $434 11% $49 Milwaukee County $1,018 13% $131 $1,903 17% $323 $257 11% $29 Price County $1,108 13% $149 $1,754 17% $298 N/A N/A N/A
White Workers Wisconsin $1,142 14% $159 $2,833 17% $482 $773 11% $87
Production Occupation $1,214 14% $174 $2,979 17% $506 $1,056 13% $138 Less than High School Diploma $1,143 14% $159 $2,333 17% $397 N/A NA NA High School Diploma $1,220 14% $175 $3,016 17% $513 N/A N/A N/A Four-year degree $1,226 15% $178 $3,333 17% $567 N/A N/A N/A
Food preparation and service occupation $791 11% $89 $900 12% $108 $1,284 15% $192
Less than High School Diploma $662 11% $74 $528 11% $59 N/A N/A N/A High School Diploma $795 11% $89 $906 12% $109 N/A N/A N/A Four-year degree $911 12% $110 $1,254 15% $185 N/A N/A N/A
Dane County $1,113 13% $150 $3,193 17% $543 $1,016 13% $131 Marathon County $1,185 14% $167 $2,761 17% $469 $1,058 13% $141 Milwaukee County $1,130 14% $155 $3,016 17% $513 $639 11% $72 Price County $1,110 13% $150 $2,413 17% $410 $1,076 13% $143
Sources: Approaches 1 and 2: 2017 American Community Survey, 5 year sample. N= 4,284 African American individuals in Wisconsin ages 18 to 65 who worked in the last year. Approach 3: Estimates from Wisconsin Court Record Data cohorts 17–33, cases coming to court in Wisconsin between 1996 and 2013. N=864 African American noncustodial parents whose orders were set using imputed income at the time of final judgment on the case. Notes: Percentage of income figures are based on the Wisconsin child support guidelines schedule for 2019 (Wis. Stat § DCF 150 Appendix A, 2019; Wis. Stat § DCF 150 Appendix C, 2019). Values marked “N/A” reflect fewer than 10 observations. Italics indicate income less than $781; this corresponds to the lowest monthly income amount on the Wisconsin low-income guidelines schedule, “monthly income up to $781.” https://docs.legis.wisconsin.gov/code/admin_code/dcf/101_199/150_c.pdf

25
The results go largely as one would expect for male and female workers (see Table 4).
Males in the ACS sample used for Approaches 1 and 2 work slightly more hours (on average)
and have slightly higher median earnings, so they would have higher orders compared to the
overall group under both approaches. Females in the ACS sample work slightly fewer hours (on
average) and have slightly lower median earnings, so they would have lower orders compared to
the overall group under both approaches. Under Approach 3, since most of the sample is
noncustodial fathers, this group looks very much like the overall group. Notably, although the
sample size is quite small (N=46), noncustodial mothers with imputed-income orders have
higher average earnings than noncustodial fathers with imputed-income orders, and would have
orders nearly twice the size as noncustodial fathers under the third approach.
Considering the results by race (see Table 5), blacks generally would have lower orders
than whites under all three approaches. The difference between average hours worked for blacks
and whites is smaller than the difference in median earnings for blacks and whites, so that
Approach 1 results in more similar order amounts for the two groups than Approach 2. This
highlights an important distinction between hours worked and earnings that may be useful to the
courts when considering whether actual income reflects the noncustodial parent’s earnings
capacity. Blacks and whites in the ACS sample both work less than 40 hours per week on
average (32 hours per work and 36 hours per week respectively), but the difference in median
earnings suggests that the two groups receive much different returns for those efforts.
DEVELOPING AN IMPUTED-INCOME CALCULATOR
One limitation of each of the approaches considered in this report is that they do not
account for all factors related to economic circumstances discussed in the 2016 ruling. We
considered the possibility of using quantile regression analysis to predict noncustodial parents’
26
later earnings as a function of characteristics such as sex, age, locality, occupation, education,
history with the criminal justice system, literacy, and health. Quantile regression is preferable to
standard OLS regression because it provides imputed income estimates for the typical earner, as
well as for high earners and low earners. A quantile regression model would produce predicted
values of earnings as a function of factors such as age and level of education at different points in
the earnings distribution (i.e., fathers in the 25th, 50th, and 75th percentile of the earnings
distribution).
We also considered building a calculator that would use a prediction model based on later
earnings records of noncustodial parents with imputed-income orders in the Wisconsin CRD
data, as well as potentially drawing on outside data sources such as the ACS and the Survey of
Income and Program Participation (SIPP). Based on the numbers, this approach would produce
income estimates that would often result in $0 obligations. The distribution of earnings (from UI
wage records, shown in Appendix Table 1) in the year after order establishment shows that half
of noncustodial parents with imputed-income orders had less than $50 in formal earnings and
less than 10 percent had earnings greater than $17,500 (140 percent of the federal poverty line in
2019). Hence, even if we supplemented with information from the ACS and the SIPP, with the
CRD as our base, the calculator would likely produce imputed-income amount at or near $0.
An alternative would be to use only publicly-available data for the calculator, so that
income estimates similar to what are shown for Approach 1 and 2 were easily obtained. But there
are also some logistical factors to consider, such as the availability of resources for development,
implementation, and maintenance of this type of calculator.

27
SUMMARY
This report is part of a series that considers the use of the guidelines (Hodges & Cook,
2019), the way the guidelines treat cases in which the payer has low income (Hodges & Vogel,
2019), and the relationship between the use of income imputation in setting child support orders
and child support payments (Cancian et al., 2019). This report considered three alternative ways
that noncustodial parent income could be imputed when it is not known to the court: (1) keeping
the federal minimum wage ($7.25) as the hourly wage rate but using variations in hours worked
by locality, occupation, and level of education; (2) using annual earnings of workers in
Wisconsin by locality, occupation, and level of education, (3) using actual (formal) earnings of
noncustodial parents with imputed income orders from prior cohorts in the year after order
establishment. For each approach, we considered the income amount at different positions in the
distributions (e.g., the 25th percentile, the median, and the mean) and identified a preferred
measure: mean hours worked per week, median annual earnings, and mean earnings of
noncustodial parents with imputed-income orders.
Each of these approaches have strengths and weakness in terms of “right-sizing” orders
as well as accounting for the specific circumstances of the noncustodial parent in accordance
with the language of the December 2016 rule. The first approach, using mean hours worked per
week at the federal minimum wage, results in less variation and also lower order amounts than
the second approach, using median earnings. Both approaches typically result in higher orders
than the third approach, which uses the actual earnings of noncustodial parents with imputed-
income orders from prior CRD cohorts.
If the goal of the agency is to be as compliant as possible with the 2016 final rule, these
approaches can also be evaluated on the number of factors in the final ruling used in determining
the imputed-income amount. The first two approaches take multiple factors into account
28
including locality, occupation, education, as well as sex and race. The scale of the data (large
number of observations) makes it possible to generate estimates at fairly granular level (for
example, for a black male with a high school diploma working in a food service occupation in
Milwaukee). In contrast, with the third approach, using the Wisconsin CRD, it is not possible to
obtain earnings estimates at the same level of detail, due to the small number of imputed-income
cases and limited information available in the case records where the income of the noncustodial
parents is unknown.
Transparency about the way in which the estimates are generated is also important. For
the first two approaches, the data are publicly available. Additionally, the process for obtaining
the estimates is fairly easy to implement and understand, so that the estimates could be updated
on a regular basis. This is a clear advantage of the first two approaches compared to the third.
In comparing each of the different approaches in greater detail, we prioritized county-
level estimates (see Appendix Tables 2–7). This decision was made following a memorandum
from the Institute for Research on Poverty to the Wisconsin Department of Children and
Families that listed geographic relevance as among the most important principals in the selection
of indicators for imputing income. The memorandum stated specifically that “data points reliable
at the county-level are preferable” (Dresser & Cancian, 2018). It is possible that giving priority
to other factors (such as level of education) could lead to different conclusions about the
approaches.
Still, our findings have important implications for using imputed income in order
determination. Not only do the first two approaches considered in this report often result in
incomes above the current standard, for the most part they result in incomes that are well above
what we observe for noncustodial parents with imputed-income orders and similar characteristics

29
in the CRD. Together with recent research by Cancian and colleagues (2019) and Demyan &
Passarella (2018), this suggests imputing income at lower levels than the current standard, or, in
cases where the noncustodial parents has very low earnings, treating these earnings as evidence
of ability to pay.
This creates a challenge for child support policymakers who must consider the
implications of lower orders, especially for the well-being of the children on the case. If the
earnings of past noncustodial parents with imputed income orders are indicative of the earnings
of future noncustodial parents with income imputed orders, then more than half have earnings
consistent with a no-support order (that is, below the minimum amount on the Wisconsin
guidelines tables for low-income payers). Clearly, some of these noncustodial parents will have
earnings from informal employment arrangements. However, absent any way to track these
informal earnings, it seems unlikely that having more information about their economic
circumstances (such as a prior history of incarceration or literacy) would lead to different
conclusions.

30
Appendix Table 1. Distribution of Hours Worked, Annual Earnings (ACS), and Annual Earnings (WCRD) Min P10 P25 Median P75 P90 Max Approach 1
Hours Worked per Weeka 1 9.62 25.38 40 44 50 99 Approach 2
Annual Earnings of Workers in Wisconsina $0 $2,553 $12,311 $31,566 $53,108 $81,704 $443,246 Approach 3
Annual Earnings of Noncustodial Parents with Imputed-income Ordersb $0 $0 $0 $50 $5,580 $17,301 $276,789 Sources: Approaches 1 and 2: 2017 American Community Survey, 5 year sample. N= 152,215 individuals in Wisconsin ages 16 to 65. Approach 3: Estimates from Wisconsin Court Record Data cohorts 17–33, cases coming to court in Wisconsin between 1996 and 2013. N = 1,941 cases in which the payer (noncustodial parent) is the father or mother and in which the child support order was set using imputed income. Excludes 38 cases where the noncustodial parent did not have a valid social security number for a match to the Unemployment Insurance wage records.

31
Appendix Table 2. Approach 1: Monthly Income, Percentage of Income, and Burden Levels by County, Occupation, and Level of Education
Approach 1: Hours Worked at Federal Minimum Wage
35 Hours at Federal
Minimum Wage 25th Percentile Median Mean
Scenario Income Percentage of Income
Order Amount Income
Percentage of Income
Order Amount Income
Percentage of Income
Order Amount Income
Percentage of Income
Order Amount
Wisconsin $1,100 14% $151 $920 12% $113 $1,257 15% $185 $1,131 14% $155 Production Occupation $1,100 14% $151 $1,257 15% $185 $1,257 15% $185 $1,199 14% $172
Less than High School Diploma $1,100 14% $151 $1,051 13% $138 $1,257 15% $185 $1,126 14% $154 High School Diploma $1,100 14% $151 $1,257 15% $185 $1,257 15% $185 $1,207 14% $173 Four-year degree $1,100 14% $151 $1,162 14% $162 $1,257 15% $185 $1,214 14% $174
Food preparation and service occupation $1,100 14% $151 $399 11% $45 $788 11% $88 $795 11% $89 Less than High School Diploma $1,100 14% $151 $237 11% $27 $657 11% $74 $704 11% $79 High School Diploma $1,100 14% $151 $399 11% $45 $788 11% $88 $799 11% $90 Four-year degree $1,100 14% $151 $526 11% $59 $943 12% $115 $895 12% $108
Dane County $1,100 14% $151 $788 11% $88 $1,257 15% $185 $1,098 13% $148 Production Occupation $1,100 14% $151 $1,051 13% $138 $1,257 15% $185 $1,132 14% $155
Less than High School Diploma $1,100 14% $151 $798 11% $89 $1,257 15% $185 $1,119 14% $153 High School Diploma $1,100 14% $151 $1,100 13% $148 $1,257 15% $185 $1,137 14% $156 Four-year degree $1,100 14% $151 $1,051 13% $138 $1,257 15% $185 $1,111 13% $150
Food preparation and service occupation $1,100 14% $151 $290 11% $33 $785 11% $88 $766 11% $86 Less than High School Diploma $1,100 14% $151 $293 11% $33 $798 11% $89 $725 11% $81 High School Diploma $1,100 14% $151 $242 11% $27 $657 11% $74 $756 11% $85 Four-year degree $1,100 14% $151 $628 11% $70 $798 11% $89 $891 12% $107
Marathon County $1,100 14% $151 $1,005 13% $129 $1,257 15% $185 $1,176 14% $166 Production Occupation $1,100 14% $151 $1,257 15% $185 $1,257 15% $185 $1,222 14% $175
Less than High School Diploma $1,100 14% $151 $1,162 14% $162 $1,257 15% $185 $1,134 14% $155 High School Diploma $1,100 14% $151 $1,257 15% $185 $1,257 15% $185 $1,224 14% $175 Four-year degree $1,100 14% $151 $1,257 15% $185 $1,288 15% $192 $1,362 15% $209
Food preparation and service occupation $1,100 14% $151 $363 11% $41 $785 11% $88 $751 11% $84 Less than High School Diploma $1,100 14% $151 $126 11% $14 $299 11% $34 $369 11% $41 High School Diploma $1,100 14% $151 $382 11% $43 $798 11% $89 $765 11% $86 Four-year degree $1,100 14% $151 N/A N/A N/A N/A N/A N/A N/A N/A N/A
(table continues)

32
Appendix Table 2, continued
Approach 1: Hours Worked at Federal Minimum Wage
35 Hours at Federal
Minimum Wage 25th Percentile Median Mean
Income Percentage of Income
Order Amount Income
Percentage of Income
Order Amount Income
Percentage of Income
Order Amount Income
Percentage of Income
Order Amount
Milwaukee County $1,100 14% $151 $788 11% $88 $1,257 15% $185 $1,097 13% $148 Production $1,100 14% $151 $1,100 13% $148 $1,257 15% $185 $1,141 14% $156
Less than High School Diploma $1,100 14% $151 $1,051 13% $138 $1,257 15% $185 $1,127 14% $154 High School Diploma $1,100 14% $151 $1,100 13% $148 $1,257 15% $185 $1,139 14% $156 Four-year degree $1,100 14% $151 $1,100 13% $148 $1,257 15% $185 $1,213 14% $174
Food preparation and service $1,100 14% $151 $377 11% $42 $943 12% $115 $847 12% $99 Less than High School Diploma $1,100 14% $151 $317 11% $36 $1,100 13% $148 $865 12% $102 High School Diploma $1,100 14% $151 $363 11% $41 $880 12% $104 $830 11% $95 Four-year degree $1,100 14% $151 $598 11% $67 $943 12% $115 $948 12% $118
Price County $1,100 14% $151 $798 11% $89 $1,257 15% $185 $1,103 13% $149 Production $1,100 14% $151 $1,172 14% $165 $1,257 15% $185 $1,193 14% $168
Less than High School Diploma $1,100 14% $151 $943 12% $115 $1,257 15% $185 $1,060 13% $141 High School Diploma $1,100 14% $151 $1,257 15% $185 $1,257 15% $185 $1,213 14% $174 Four-year degree $1,100 14% $151 $943 12% $115 $1,257 15% $185 $1,082 13% $144
Food preparation and service $1,100 14% $151 $399 11% $45 $788 11% $88 $786 11% $88 Less than High School Diploma $1,100 14% $151 $157 11% $18 $788 11% $88 $763 11% $86 High School Diploma $1,100 14% $151 $471 11% $53 $788 11% $88 $782 11% $88 Four-year degree $1,100 14% $151 $473 11% $53 $943 12% $115 $851 12% $99
Source: 2017 American Community Survey, 5 year sample. N= 148,347 individuals in Wisconsin ages 18 to 65. Notes: Percentage of income figures are based on the Wisconsin child support guidelines schedule for 2019 (Wis. Stat § DCF 150 Appendix A, 2019; Wis. Stat § DCF 150 Appendix C, 2019). Values marked “N/A” reflect fewer than 10 observations. Italics indicate income less than $781; this corresponds to the lowest monthly income amount on the Wisconsin low-income guidelines schedule, “monthly income up to $781.” https://docs.legis.wisconsin.gov/code/admin_code/dcf/101_199/150_c.pdf

33
Appendix Table 3. Approach 2: Monthly Income, Percentage of Income, and Burden Levels by County, Occupation, and Level of Education
Approach 2: Annual Earnings 25th Percentile Median Mean
Scenario Income Percentage of Income
Order Amount Income
Percentage of Income
Order Amount Income
Percentage of Income
Order Amount
Wisconsin $1,123 14% $154 $2,675 17% $455 $3,489 17% $593 Production Occupation $1,724 17% $293 $2,806 17% $477 $3,019 17% $513
Less than High School Diploma $1,315 15% $199 $2,213 17% $376 $2,351 17% $400 High School Diploma $1,727 17% $294 $2,894 17% $492 $3,059 17% $520 Four-year degree $1,917 17% $326 $3,146 17% $535 $3,685 17% $626
Food preparation and service occupation $400 11% $45 $896 12% $108 $1,176 14% $166 Less than High School Diploma $219 11% $25 $741 11% $83 $990 13% $125 High School Diploma $417 11% $47 $896 12% $108 $1,166 14% $162 Four-year degree $681 11% $76 $1,250 15% $182 $1,582 17% $269
Dane County $1,120 14% $153 $3,016 17% $513 $4,018 17% $683 Production Occupation $1,315 15% $199 $2,502 17% $425 $2,638 17% $448
Less than High School Diploma $1,315 15% $199 $1,736 17% $295 $2,122 17% $361 High School Diploma $1,336 15% $202 $2,667 17% $453 $2,677 17% $455 Four-year degree $1,228 15% $178 $2,157 17% $367 $2,806 17% $477
Food preparation and service occupation $345 11% $39 $820 11% $94 $1,169 14% $162 Less than High School Diploma $190 11% $21 $949 12% $118 $997 13% $126 High School Diploma $333 11% $37 $766 11% $86 $1,121 14% $154 Four-year degree $426 11% $48 $958 12% $119 $1,717 17% $292
Marathon County $1,277 15% $188 $2,648 17% $450 $3,365 17% $572 Production Occupation $2,071 17% $352 $2,917 17% $496 $3,070 17% $522
Less than High School Diploma $1,553 17% $261 $2,068 17% $352 $2,386 17% $406 High School Diploma $2,241 17% $381 $2,917 17% $496 $3,067 17% $521 Four-year degree $2,500 17% $425 $3,507 17% $596 $4,700 17% $799
Food preparation and service occupation $255 11% $29 $880 12% $104 $1,319 15% $200 Less than High School Diploma $121 11% $14 $230 11% $26 $4,179 17% $710 High School Diploma $298 11% $33 $888 12% $105 $1,028 13% $132 Four-year degree N/A N/A N/A N/A N/A N/A N/A N/A N/A
Milwaukee County $1,072 13% $142 $2,586 17% $440 $3,304 17% $562 Production $1,498 16% $245 $2,589 17% $440 $2,777 17% $472
Less than High School Diploma $1,285 15% $192 $2,167 17% $368 $2,253 17% $383 High School Diploma $1,532 17% $254 $2,631 17% $447 $2,841 17% $483 Four-year degree $2,083 17% $354 $3,106 17% $528 $3,581 17% $609
Food preparation and service $491 11% $55 $1,035 13% $135 $1,290 15% $193 Less than High School Diploma $340 11% $38 $1,140 14% $156 $1,224 14% $175 High School Diploma $448 11% $50 $949 12% $118 $1,209 14% $173 Four-year degree $862 12% $100 $1,754 17% $298 $1,979 17% $336
(table continues)

34
Appendix Table 3, continued Approach 2: Annual Earnings 25th Percentile Median Mean
Scenario Income Percentage of Income
Order Amount Income
Percentage of Income
Order Amount Income
Percentage of Income
Order Amount
Price County $863 12% $102 $2,333 17% $397 $2,837 17% $482 Production $1,702 17% $289 $2,553 17% $434 $2,795 17% $475
Less than High School Diploma $777 11% $87 $1,929 17% $328 $2,217 17% $377 High School Diploma $1,771 17% $301 $2,587 17% $440 $2,872 17% $488 Four-year degree $1,578 17% $268 $1,872 17% $318 $2,465 17% $419
Food preparation and service $431 11% $48 $1,000 13% $127 $1,150 14% $160 Less than High School Diploma $207 11% $23 $1,060 13% $141 $946 12% $118 High School Diploma $431 11% $48 $922 12% $113 $1,133 14% $155 Four-year degree $706 11% $79 $1,422 16% $227 $1,566 17% $266
Source: 2017 American Community Survey, 5 year sample. N= 148,347 individuals in Wisconsin ages 18 to 65. Notes: Percentage of income figures are based on the Wisconsin child support guidelines schedule for 2019 (Wis. Stat § DCF 150 Appendix A, 2019; Wis. Stat § DCF 150 Appendix C, 2019). Values marked “N/A” reflect fewer than 10 observations. Italics indicate income less than $781; this corresponds to the lowest monthly income amount on the Wisconsin low-income guidelines schedule, “monthly income up to $781.” https://docs.legis.wisconsin.gov/code/admin_code/dcf/101_199/150_c.pdf

35
Appendix Table 4. Monthly Income, Percentage of Income, and Burden Levels by Imputation Approach and Scenario: Male Workers
Approach 1: Mean Hours at
Federal Minimum Wage Approach 2: Median Annual Earnings Approach 3: Mean Earnings of Noncustodial
Parents with Imputed-Income Orders
Scenario Income Percentage of
Income Order
Amount Income Percentage of
Income Order
Amount Income Percentage of
Income Order
Amount Wisconsin $1,214 14% $174 $3,250 17% $553 $457 11% $51
Production Occupation $1,233 15% $179 $3,106 17% $528 $1,330 15% $201 Less than High School Diploma $1,162 14% $161 $2,553 17% $434 N/A N/A N/A High School Diploma $1,241 15% $180 $3,234 17% $550 N/A N/A N/A Four-year degree $1,252 15% $182 $3,451 17% $587 N/A N/A N/A
Food preparation and service occupation $850 12% $99 $957 12% $119 $783 11% $88 Less than High School Diploma $755 11% $85 $763 11% $86 N/A N/A N/A High School Diploma $863 12% $102 $984 13% $125 N/A N/A N/A Four-year degree $923 12% $113 $1,319 15% $200 N/A N/A N/A
Dane County $1,164 14% $162 $3,404 17% $579 $650 11% $73 Production Occupation $1,157 14% $161 $2,979 17% $506 $762 11% $86
Less than High School Diploma $1,183 14% $167 $1,985 17% $337 N/A N/A N/A High School Diploma $1,162 14% $162 $3,016 17% $513 N/A N/A N/A Four-year degree $1,095 13% $148 $2,333 17% $397 N/A N/A N/A
Food preparation and service occupation $833 11% $95 $766 11% $86 $812 11% $93 Less than High School Diploma $786 11% $88 $949 12% $118 N/A N/A N/A High School Diploma $830 11% $95 $750 11% $84 N/A N/A N/A Four-year degree $912 12% $110 $1,277 15% $188 N/A N/A N/A
Marathon County $1,269 15% $187 $3,020 17% $513 $1,145 14% $159 Production Occupation $1,258 15% $185 $3,149 17% $535 N/A N/A N/A
Less than High School Diploma $1,178 14% $166 $3,069 17% $522 N/A N/A N/A High School Diploma $1,262 15% $186 $3,157 17% $537 N/A N/A N/A Four-year degree $1,356 15% $208 $3,447 17% $586 N/A N/A N/A
Food preparation and service occupation $745 11% $84 $1,106 13% $149 N/A N/A N/A Less than High School Diploma N/A N/A N/A N/A N/A N/A N/A N/A N/A High School Diploma $735 11% $82 $965 12% $120 N/A N/A N/A Four-year degree N/A N/A N/A N/A N/A N/A N/A N/A N/A
Milwaukee County $1,149 14% $160 $2,917 17% $496 $312 11% $35 Production $1,168 14% $162 $2,809 17% $477 N/A N/A N/A
Less than High School Diploma $1,194 14% $169 $2,500 17% $425 N/A N/A N/A High School Diploma $1,160 14% $161 $2,917 17% $496 N/A N/A N/A Four-year degree $1,191 14% $168 $2,979 17% $506 N/A N/A N/A
Food preparation and service $906 12% $109 $1,120 14% $153 N/A N/A N/A Less than High School Diploma $978 13% $124 $1,315 15% $199 N/A N/A N/A High School Diploma $872 12% $103 $1,000 13% $127 N/A N/A N/A Four-year degree $1,045 13% $137 $2,000 17% $340 N/A N/A N/A
(table continues)
36
Appendix Table 4, continued
Approach 1: Mean Hours at
Federal Minimum Wage Approach 2: Median Annual Earnings Approach 3: Mean Earnings of Noncustodial
Parents with Imputed-Income Orders
Scenario Income Percentage of
Income Order
Amount Income Percentage of
Income Order
Amount Income Percentage of
Income Order
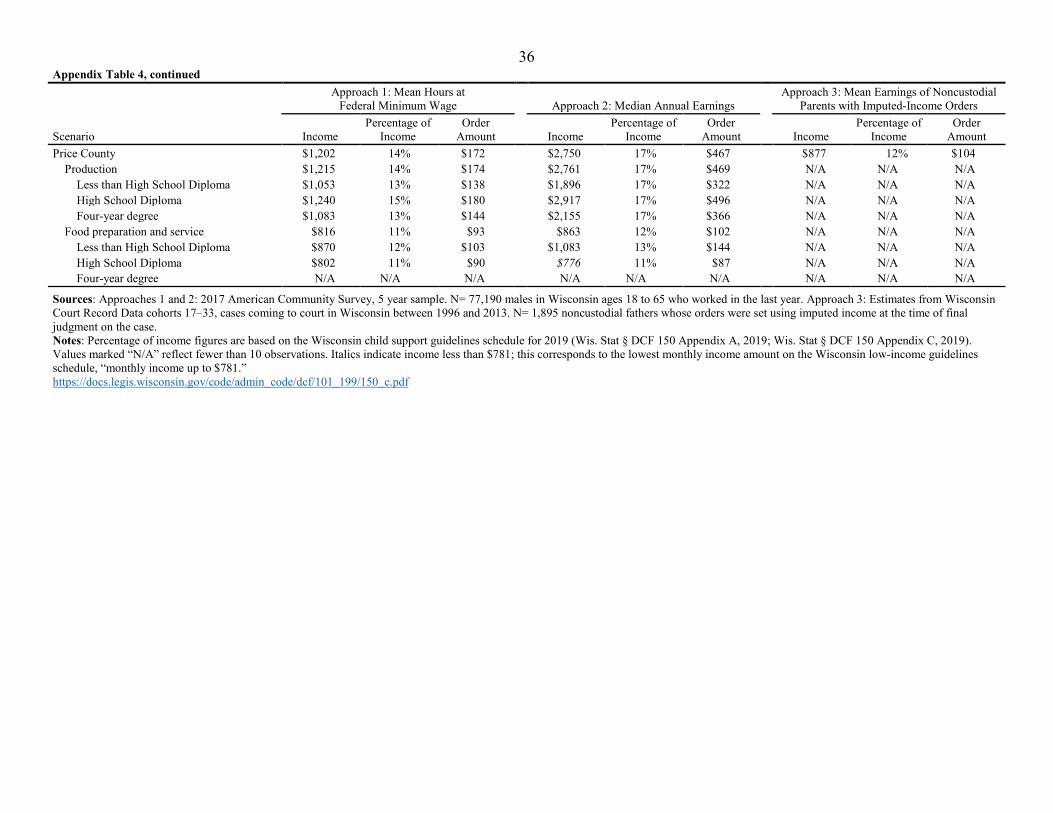
Amount Price County $1,202 14% $172 $2,750 17% $467 $877 12% $104
Production $1,215 14% $174 $2,761 17% $469 N/A N/A N/A Less than High School Diploma $1,053 13% $138 $1,896 17% $322 N/A N/A N/A High School Diploma $1,240 15% $180 $2,917 17% $496 N/A N/A N/A Four-year degree $1,083 13% $144 $2,155 17% $366 N/A N/A N/A
Food preparation and service $816 11% $93 $863 12% $102 N/A N/A N/A Less than High School Diploma $870 12% $103 $1,083 13% $144 N/A N/A N/A High School Diploma $802 11% $90 $776 11% $87 N/A N/A N/A Four-year degree N/A N/A N/A N/A N/A N/A N/A N/A N/A
Sources: Approaches 1 and 2: 2017 American Community Survey, 5 year sample. N= 77,190 males in Wisconsin ages 18 to 65 who worked in the last year. Approach 3: Estimates from Wisconsin Court Record Data cohorts 17–33, cases coming to court in Wisconsin between 1996 and 2013. N= 1,895 noncustodial fathers whose orders were set using imputed income at the time of final judgment on the case. Notes: Percentage of income figures are based on the Wisconsin child support guidelines schedule for 2019 (Wis. Stat § DCF 150 Appendix A, 2019; Wis. Stat § DCF 150 Appendix C, 2019). Values marked “N/A” reflect fewer than 10 observations. Italics indicate income less than $781; this corresponds to the lowest monthly income amount on the Wisconsin low-income guidelines schedule, “monthly income up to $781.” https://docs.legis.wisconsin.gov/code/admin_code/dcf/101_199/150_c.pdf

37
Appendix Table 5. Monthly Income, Percentage of Income, and Burden Levels by Imputation Approach and Scenario: Female Workers
Approach 1: Mean Hours at
Federal Minimum Wage Approach 2: Median Annual Earnings Approach 3: Mean Earnings of Noncustodial
Parents with Imputed-Income Orders
Scenario Income Percentage of
Income Order
Amount Income Percentage of
Income Order
Amount Income Percentage of
Income Order
Amount Wisconsin $1,040 13% $136 $2,243 17% $381 $999 13% $126
Production Occupation $1,109 13% $150 $2,128 17% $362 N/A N/A N/A Less than High School Diploma $1,052 13% $138 $1,702 17% $289 N/A N/A N/A High School Diploma $1,117 14% $153 $2,155 17% $366 N/A N/A N/A Four-year degree $1,124 14% $154 $2,500 17% $425 N/A N/A N/A
Food preparation and service occupation $755 11% $85 $875 12% $104 N/A N/A N/A Less than High School Diploma $647 11% $73 $702 11% $79 N/A N/A N/A High School Diploma $755 11% $85 $872 12% $103 N/A N/A N/A Four-year degree $879 12% $104 $1,052 13% $138 N/A N/A N/A
Dane County $1,028 13% $132 $2,589 17% $440 N/A N/A N/A Production Occupation $1,082 13% $144 $1,950 17% $332 N/A N/A N/A
Less than High School Diploma N/A N/A N/A N/A N/A N/A N/A N/A N/A High School Diploma $1,082 13% $144 $1,985 17% $337 N/A N/A N/A Four-year degree $1,134 14% $155 $2,155 17% $366 N/A N/A N/A
Food preparation and service occupation $698 11% $78 $833 11% $95 N/A N/A N/A Less than High School Diploma $657 11% $74 $817 11% $93 N/A N/A N/A High School Diploma $680 11% $76 $833 11% $95 N/A N/A N/A Four-year degree $872 12% $103 $900 12% $108 N/A N/A N/A
Marathon County $1,070 13% $142 $2,383 17% $405 N/A N/A N/A Production Occupation $1,121 14% $154 $2,586 17% $440 N/A N/A N/A
Less than High School Diploma N/A N/A N/A N/A N/A N/A N/A N/A N/A High School Diploma $1,124 14% $154 $2,589 17% $440 N/A N/A N/A Four-year degree N/A N/A N/A N/A N/A N/A N/A N/A N/A
Food preparation and service occupation $756 11% $85 $862 12% $100 N/A N/A N/A Less than High School Diploma N/A N/A N/A N/A N/A N/A N/A N/A N/A High School Diploma $794 11% $89 $880 12% $104 N/A N/A N/A Four-year degree N/A N/A N/A N/A N/A N/A N/A N/A N/A
Milwaukee County $1,045 13% $137 $2,298 17% $391 N/A N/A N/A Production $1,073 13% $142 $1,898 17% $323 N/A N/A N/A
Less than High School Diploma $1,001 13% $129 $1,467 16% $237 N/A N/A N/A High School Diploma $1,080 13% $143 $1,958 17% $333 N/A N/A N/A Four-year degree $1,276 15% $188 $3,333 17% $567 N/A N/A N/A
Food preparation and service $794 11% $89 $1,021 13% $131 N/A N/A N/A Less than High School Diploma $683 11% $77 $970 12% $121 N/A N/A N/A High School Diploma $793 11% $89 $932 12% $114 N/A N/A N/A Four-year degree $900 12% $108 $1,657 17% $282 N/A N/A N/A
(table continues)

38
Appendix Table 5, continued
Approach 1: Mean Hours at
Federal Minimum Wage Approach 2: Median Annual Earnings Approach 3: Mean Earnings of Noncustodial
Parents with Imputed-Income Orders
Scenario Income Percentage of
Income Order
Amount Income Percentage of
Income Order
Amount Income Percentage of
Income Order
Amount Price County $997 13% $126 $1,939 17% $330 N/A N/A N/A
Production $1,136 14% $156 $2,128 17% $362 N/A N/A N/A Less than High School Diploma $1,092 13% $147 $2,553 17% $434 N/A N/A N/A High School Diploma $1,143 14% $159 $2,128 17% $362 N/A N/A N/A Four-year degree $1,080 13% $143 $1,638 17% $278 N/A N/A N/A
Food preparation and service $772 11% $87 $1,034 13% $135 N/A N/A N/A Less than High School Diploma $647 11% $73 $863 12% $102 N/A N/A N/A High School Diploma $774 11% $87 $1,000 13% $127 N/A N/A N/A Four-year degree $854 12% $99 $1,034 13% $135 N/A N/A N/A
Sources: Approaches 1 and 2: 2017 American Community Survey, 5 year sample. N= 71,157 females in Wisconsin ages 18 to 65 who worked in the last year. Approach 3: Estimates from Wisconsin Court Record Data cohorts 17–33, cases coming to court in Wisconsin between 1996 and 2013. N= 46 noncustodial mothers whose orders were set using imputed income at the time of final judgment on the case. Notes: Percentage of income figures are based on the Wisconsin child support guidelines schedule for 2019 (Wis. Stat § DCF 150 Appendix A, 2019; Wis. Stat § DCF 150 Appendix C, 2019). Values marked “N/A” reflect fewer than 10 observations. Italics indicate income less than $781; this corresponds to the lowest monthly income amount on the Wisconsin low-income guidelines schedule, “monthly income up to $781.” https://docs.legis.wisconsin.gov/code/admin_code/dcf/101_199/150_c.pdf

39
Appendix Table 6. Monthly Income, Percentage of Income, and Burden Levels by Imputation Approach and Scenario: African American Workers
Approach 1: Mean Hours at
Federal Minimum Wage Approach 2: Median Annual Earnings Approach 3: Mean Earnings of Noncustodial
Parents with Imputed-Income Orders
Scenario Income Percentage of
Income Order
Amount Income Percentage of
Income Order
Amount Income Percentage of
Income Order
Amount Wisconsin $1,013 13% $130 $1,838 17% $313 $253 11% $28
Production Occupation $1,060 13% $141 $2,002 17% $340 N/A N/A N/A Less than High School Diploma $827 11% $95 $1,140 14% $156 N/A N/A N/A High School Diploma $1,105 13% $149 $2,104 17% $358 N/A N/A N/A Four-year degree $1,144 14% $159 $2,917 17% $496 N/A N/A N/A
Food preparation and service occupation $772 11% $87 $526 11% $59 N/A N/A N/A Less than High School Diploma $565 11% $63 $896 12% $108 N/A N/A N/A High School Diploma $819 11% $94 $942 12% $115 N/A N/A N/A Four-year degree $718 11% $81 $863 12% $102 N/A N/A N/A
Dane County $1,007 13% $130 $1,894 17% $322 $284 11% $32 Production Occupation $1,048 13% $137 $1,724 17% $293 N/A N/A N/A
Less than High School Diploma N/A N/A N/A N/A N/A N/A N/A N/A N/A High School Diploma $1,087 13% $147 $1,724 17% $293 N/A N/A N/A Four-year degree N/A N/A N/A $2,383 17% $405 N/A N/A N/A
Food preparation and service occupation $780 11% $87 $708 11% $79 N/A N/A N/A Less than High School Diploma N/A N/A N/A N/A N/A N/A N/A N/A N/A High School Diploma $877 12% $104 $1,726 17% $293 N/A N/A N/A Four-year degree N/A N/A N/A N/A N/A N/A N/A N/A N/A
Marathon County $1,072 13% $142 $1,833 17% $312 $434 11% $49 Production Occupation N/A N/A N/A N/A N/A N/A N/A N/A N/A
Less than High School Diploma N/A N/A N/A N/A N/A N/A N/A N/A N/A High School Diploma N/A N/A N/A N/A N/A N/A N/A N/A N/A Four-year degree N/A N/A N/A N/A N/A N/A N/A N/A N/A
Food preparation and service occupation N/A N/A N/A N/A N/A N/A N/A N/A N/A Less than High School Diploma N/A N/A N/A N/A N/A N/A N/A N/A N/A High School Diploma N/A N/A N/A N/A N/A N/A N/A N/A N/A Four-year degree N/A N/A N/A N/A N/A N/A N/A N/A N/A
Milwaukee County $1,018 13% $131 $1,903 17% $323 $257 11% $29 Production $1,048 13% $137 $2,280 17% $388 N/A N/A N/A
Less than High School Diploma $864 12% $102 $1,315 15% $199 N/A N/A N/A High School Diploma $1,077 13% $143 $2,455 17% $417 N/A N/A N/A Four-year degree $1,204 14% $172 $2,917 17% $496 N/A N/A N/A
Food preparation and service $817 11% $93 $1,021 13% $131 N/A N/A N/A Less than High School Diploma $645 11% $72 $896 12% $108 N/A N/A N/A High School Diploma $856 12% $100 $1,083 13% $144 N/A N/A N/A Four-year degree N/A N/A N/A N/A N/A N/A N/A N/A N/A
(table continues)

40
Appendix Table 6, continued
Approach 1: Mean Hours at
Federal Minimum Wage Approach 2: Median Annual Earnings Approach 3: Mean Earnings of Noncustodial
Parents with Imputed-Income Orders
Scenario Income Percentage of
Income Order
Amount Income Percentage of
Income Order
Amount Income Percentage of
Income Order
Amount Price County $1,108 13% $149 $1,754 17% $298 N/A N/A N/A
Production N/A N/A N/A N/A N/A N/A N/A N/A N/A Less than High School Diploma N/A N/A N/A N/A N/A N/A N/A N/A N/A High School Diploma N/A N/A N/A N/A N/A N/A N/A N/A N/A Four-year degree N/A N/A N/A N/A N/A N/A N/A N/A N/A
Food preparation and service N/A N/A N/A N/A N/A N/A N/A N/A N/A Less than High School Diploma N/A N/A N/A N/A N/A N/A N/A N/A N/A High School Diploma N/A N/A N/A N/A N/A N/A N/A N/A N/A Four-year degree N/A N/A N/A N/A N/A N/A N/A N/A N/A
Sources: Approaches 1 and 2: 2017 American Community Survey, 5 year sample. N= 4,284 African American individuals in Wisconsin ages 18 to 65 who worked in the last year. Approach 3: Estimates from Wisconsin Court Record Data cohorts 17–33, cases coming to court in Wisconsin between 1996 and 2013. N=864 African American noncustodial parents whose orders were set using imputed income at the time of final judgment on the case. Notes: Percentage of income figures are based on the Wisconsin child support guidelines schedule for 2019 (Wis. Stat § DCF 150 Appendix A, 2019; Wis. Stat § DCF 150 Appendix C, 2019). Values marked “N/A” reflect fewer than 10 observations. Italics indicate income less than $781; this corresponds to the lowest monthly income amount on the Wisconsin low-income guidelines schedule, “monthly income up to $781.” https://docs.legis.wisconsin.gov/code/admin_code/dcf/101_199/150_c.pdf

41
Appendix Table 7. Monthly Income , Percentage of Income, and Burden Levels by Imputation Approach and Scenario: White Workers
Approach 1: Mean Hours at
Federal Minimum Wage Approach 2: Median Annual Earnings Approach 3: Mean Earnings of Noncustodial
Parents with Imputed-Income Orders
Scenario Income Percentage of
Income Order
Amount Income Percentage of
Income Order
Amount Income Percentage of
Income Order
Amount Wisconsin $1,142 14% $159 $2,833 17% $482 $773 11% $87
Production Occupation $1,214 14% $174 $2,979 17% $506 $1,056 13% $138 Less than High School Diploma $1,143 14% $159 $2,333 17% $397 N/A NA NA High School Diploma $1,220 14% $175 $3,016 17% $513 N/A N/A N/A Four-year degree $1,226 15% $178 $3,333 17% $567 N/A N/A N/A
Food preparation and service occupation $791 11% $89 $900 12% $108 $1,284 15% $192 Less than High School Diploma $662 11% $74 $528 11% $59 N/A N/A N/A High School Diploma $795 11% $89 $906 12% $109 N/A N/A N/A Four-year degree $911 12% $110 $1,254 15% $185 N/A N/A N/A
Dane County $1,113 13% $150 $3,193 17% $543 $1,016 13% $131 Production Occupation $1,137 14% $156 $2,809 17% $477 N/A N/A N/A
Less than High School Diploma $1,012 13% $130 $1,726 17% $293 N/A N/A N/A High School Diploma $1,145 14% $159 $2,981 17% $507 N/A N/A N/A Four-year degree $1,149 14% $160 $2,155 17% $366 N/A N/A N/A
Food preparation and service occupation $759 11% $85 $833 11% $95 N/A N/A N/A Less than High School Diploma $618 11% $69 $733 11% $82 N/A N/A N/A High School Diploma $748 11% $84 $789 11% $89 N/A N/A N/A Four-year degree $949 12% $118 $1,447 16% $231 N/A N/A N/A
Marathon County $1,185 14% $167 $2,761 17% $469 $1,058 13% $141 Production Occupation $1,253 15% $182 $3,149 17% $535 N/A N/A N/A
Less than High School Diploma $1,215 14% $174 $3,420 17% $581 N/A N/A N/A High School Diploma $1,249 15% $181 $3,083 17% $524 N/A N/A N/A Four-year degree $1,388 16% $216 $3,830 17% $651 N/A N/A N/A
Food preparation and service occupation $746 11% $84 $851 12% $99 N/A N/A N/A Less than High School Diploma $345 11% $39 $175 11% $20 N/A N/A N/A High School Diploma $752 11% $84 $862 12% $100 N/A N/A N/A Four-year degree N/A N/A N/A N/A N/A N/A N/A N/A N/A
Milwaukee County $1,130 14% $155 $3,016 17% $513 $639 11% $72 Production $1,186 14% $167 $2,917 17% $496 N/A N/A N/A
Less than High School Diploma $1,180 14% $167 $2,413 17% $410 N/A N/A N/A High School Diploma $1,180 14% $166 $2,979 17% $506 N/A N/A N/A Four-year degree $1,254 15% $185 $3,333 17% $567 N/A N/A N/A
Food preparation and service $831 11% $95 $1,021 13% $131 N/A N/A N/A Less than High School Diploma $894 12% $108 $1,167 14% $162 N/A N/A N/A High School Diploma $791 11% $89 $863 12% $102 N/A N/A N/A Four-year degree $990 13% $125 $1,838 17% $313 N/A N/A N/A
(table continues)

42
Appendix Table7, continued
Approach 1: Mean Hours at
Federal Minimum Wage Approach 2: Median Annual Earnings Approach 3: Mean Earnings of Noncustodial
Parents with Imputed-Income Orders
Scenario Income Percentage of
Income Order
Amount Income Percentage of
Income Order
Amount Income Percentage of
Income Order
Amount Price County $1,110 13% $150 $2,413 17% $410 $1,076 13% $143
Production $1,207 14% $173 $2,586 17% $440 N/A N/A N/A Less than High School Diploma $1,087 13% $147 $1,787 17% $304 N/A N/A N/A High School Diploma $1,224 14% $175 $2,631 17% $447 N/A N/A N/A Four-year degree $1,062 13% $141 $1,750 17% $298 N/A N/A N/A
Food preparation and service $798 11% $90 $1,028 13% $132 N/A N/A N/A Less than High School Diploma $718 11% $81 $1,035 13% $135 N/A N/A N/A High School Diploma $800 11% $90 $953 12% $119 N/A N/A N/A Four-year degree $866 12% $103 $1,422 16% $227 N/A N/A N/A
Sources: Approaches 1 and 2: 2017 American Community Survey, 5 year sample. N = 137,338 white individuals in Wisconsin ages 18 to 65 who worked in the last year. Approach 3: Estimates from Wisconsin Court Record Data cohorts 17–33, cases coming to court in Wisconsin between 1996 and 2013. N = 735 white noncustodial parents whose orders were set using imputed income at the time of final judgment on the case. Notes: Percentage of income figures are based on the Wisconsin child support guidelines schedule for 2019 (Wis. Stat § DCF 150 Appendix A, 2019; Wis. Stat § DCF 150 Appendix C, 2019). Values marked “N/A” reflect fewer than 10 observations. Italics indicate income less than $781; this corresponds to the lowest monthly income amount on the Wisconsin low-income guidelines schedule, “monthly income up to $781.” https://docs.legis.wisconsin.gov/code/admin_code/dcf/101_199/150_c.pdf

43
REFERENCES
Alexander, C., & Haley‐Lock, A. (2015). Underwork, Work‐Hour Insecurity, and A New
Approach to Wage and Hour Regulation. Industrial Relations: A Journal of Economy and
Society, 54(4), 695–716.
Arizona Supreme Court. (2019). 2018 Arizona Child Support Guidelines. (Retrieved from)
https://www.azcourts.gov/familylaw#Guidelines.
Bauer, J. M., & Sousa-Poza, A. (2015). Impacts of Informal Caregiving on Caregiver
Employment, Health, and Family. Journal of Population Ageing 8.3: 113–145.
Brinig, M. F., & Garrison, M. (2018). Getting Blood from Stones: Results and Policy
Implications of an Empirical Investigation of Child Support Practice in St. Joseph
County, Indiana Paternity Actions. Family Court Review 56 (4): 521–543
Brito, T. L. (2012). Fathers Behind Bars: Rethinking Child Support Policy Toward Low-Income
Noncustodial Fathers and Their Families. J. Gender Race & Just., 15, 617.
Child Support Enforcement Amendment of 1984, Pub. L. No. 98–378 (1984).
Cancian, M., Cook, S., & Meyer, D. R. (2019). Child Support Payments, Income Imputation, and
Default Orders. Report prepared for Wisconsin Department of Children and Families.
Madison, WI: Institute for Research on Poverty.
Cancian, M. , Heinrich, C. J. & Chung, Y. (2013), Discouraging Disadvantaged Fathers’
Employment: An Unintended Consequence of Policies Designed to Support Families. J.
Pol. Anal. Manage., 32: 758–784. doi:10.1002/pam.21707.
Cancian, M., Meyer, D. R., & Han, E. (2011). Child support: Responsible fatherhood and the
quid pro quo. The Annals of the American Academy of Political and Social Science,
635(1), 140–162.

44
Canon, M., Kudlyak, M., & Reed, M. (2014). Is Involuntary Part-Time Employment Different
After the Great Recession? (Retrieved from)
https://www.stlouisfed.org/~/media/Files/PDFs/publications/pub_assets/pdf/re/2014/c/par
t_time.pdf
Clark, M. (1999). Imputing Parental Income in Child Support Determinations: What Price for
Child's Best Interest? Catholic University Law Review, 49(1), 167–200.
Demyan, N., & Passarella, L. (2018). Actual Earnings and Payment Outcomes Among Obligors
with Imputed Income, University of Maryland School of Social Work, Ruth Young
Center for Families & Children, 2018, accessed at:
https://familywelfare.umaryland.edu/reports1/guidelines_imputedincome.pdf;
Dresser, L., & Cancian, M. (2018). Information on Economic Opportunity to Inform Income
Imputation. Memorandum to Connie Chesnik and Maggie Renno, Wisconsin Department
of Children and Families. Madison, WI: Institute for Research on Poverty.
Family Support Act of 1988, Pub. L. No. 100–485, 102 Stat. 2343 (1988).
Fleming, J. (2017). Imputed Income and Default Practices: The State Directors' Survey of State
Practices Prior to the 2016 Final Rule. National Child Support Enforcement Association.
(Retrieved from) http://www.ncsea.org/documents/Imputed-Income-and-Default-
Practices_CSQ-April-2017.pdf.
Flexibility, Efficiency, and Modernization of Child Support Enforcement Programs, Final Rule,
45 C.F.R. § 301–305, 307 (2016).
Formoso, C. Determining the Composition and Collectability of Child Support Arrearages. WA:
Washington Department of Social and Health Services, Division of Child Support (2003);

45
Hodges, L & Cook, S. T. 2019. “The Use of Child Support Guidelines in Wisconsin: 2010 and
2013.” Submitted to the Wisconsin Department of Children and Families. Madison, WI:
Institute for Research on Poverty.
Hodges, L. & Vogel, L. K. 2019. “Recent Changes to State Child Support Guidelines for Low-
income Noncustodial Parents.” Submitted to the Wisconsin Department of Children and
Families. Madison, WI: Institute for Research on Poverty.
Hodges, L., Meyer, D. R. & Cancian, M. 2019. ”How Are Child Support Burdens Related to
Child Support Payments, Compliance, and Regularity?” Submitted to the Wisconsin
Department of Children and Families. Madison, WI: Institute for Research on Poverty.
Holzer, H. J., Offner, P., & Sorensen, E. (2005). Declining Employment Among Young Black
Less‐Educated Men: The Role of Incarceration and Child Support. Journal of Policy
Analysis and Management, 24(2), 329–350.
Lambert, S. J., Fugiel, P. J., & Henly, J. R. (2014). Precarious Work Schedules Among Early-
Career Employees in the U.S.: A National Snapshot. Research brief. Chicago: University
of Chicago, Employment Instability, Family Well-Being, and Social Policy Network
(EINet).
McCann, M. (2019). Child Support Guidelines Models by State. National Conference of State
Legislatures. Retrieved June 4, 2019, from http://www.ncsl.org/research/human-
services/guideline-models-by-state.aspx.
Meyer, D. R., Ha, Y., & Hu, M. C. (2008). Do High Child Support Orders Discourage Child
Support Payments? Social Service Review, 82(1), 93–118.
Norrbin, S. C., Macpherson, D. A., McCaleb, T. S., Norrbin, O., Sherron, K., & Roberts, V.
(2017). Review and Update of Florida’s Child Support Guidelines. Report to the Florida

46
Legislature. Tallahassee, FL: Florida State University, Department of Economics.
(Retrieved from) http://edr.state.fl.us/Content/special-research-projects/child-
support/ChildSupportGuidelinesFinalReport2017.pdf.
Pirog, M. A., Klotz, M. E., & Byers, K. V. (1998). Interstate Comparisons of Child Support
Orders Using State Guidelines. Family Relations, 289–295.
Robb, C. (2019). Cost of Raising Children and Expenditures on Children. Report prepared for
the Wisconsin Department of Children and Families. Madison, WI: Institute for Research
on Poverty.
Ruggles, S., Flood, S., Goeken, R., Grover, J., Meyer, E. Pacas, J. & Sobek, M. (2019). IPUMS
USA: Version 9.0 [dataset]. Minneapolis, MN: IPUMS.
https://doi.org/10.18128/D010.V9.0
Takayesu, M. (2011). How Do Child Support Order Amounts Affect Payments and Compliance?
Orange County Child Support Services. (Retrieved from)
https://ywcss.com/sites/default/files/pdf-
resource/how_do_child_support_orders_affect_payments_and_compliance.pdf.
U.S. Census Bureau (2019a). American Community Survey. (Retrieved from)
https://www.census.gov/programs-surveys/acs.
U.S. Census Bureau. (2019b). American Community Survey: When to Use 1-year, 3-year, or
5year Estimates. (Retrieved from)
https://www.census.gov/programssurveys/acs/guidance/estimates.html.
U.S. Census Bureau. (2019c). Geography Program: Public Use Microdata Areas (PUMAs).
(Retrieved from) https://www.census.gov/programs-surveys/geography/guidance/geo-
areas/pumas.html.

47
U.S. Department of Health and Human Services. Office of Inspector General. (2000).The
Establishment of Child Support Orders for Low Income Non-Custodial Parents,
Washington, D.C.: U.S. Department of Health and Human Services. OEI-05-99-00390
Venohr, J. 2015. Income Available for Child Support: Fact and Fiction in State Child Support
Guidelines. Denver, CO: Center for Policy Research. Available at:
https://centerforpolicyresearch.org/publications/income-available-for-child-support-fact-
and-fiction-in-state-child-support-guidelines/
Venohr, J. Review of the New Mexico Child Support Guidelines. Submitted to the New Mexico
Human Services Department, Child Support Enforcement Division. 2018
Venohr, J. & Slattery-Quintanilla, C. (2014). Arizona Child Support Guidelines Review:
Findings from Case File Data. Report to the Arizona Supreme Court. (Retrieved from)
http://www.azcourts.gov/Portals/31/GuidelinesReview/AZChildSupportGuidelinesRevie
wFindingsfromCas eFileData082014RED.pdf.
Visher, C. & Courtney, S. (2006). Cleveland Prisoners’ Experience Returning Home. Urban
Institute. (Retrieved from)
http://www.urban.org/UploadedPDF/311359_cleveland_prisoners.pdf
Waller, M. & Plotnick, R. (2001). Effective Child Support Policy for Low-Income Families:
Evidence from Street Level Research Journal of Policy Analysis and Management, Vol.
20, No. 1, Winter, 2001.