allocation of funding sources report development charges
TRANSCRIPT
Allocation of Funding Sources Report &
Development Charges Background Study
Black Creek Financial Strategy
Vaughan, Ontario
04 May 2016
A Division of FP&P HydraTek Inc.
216 Chrislea Road, Suite 204, Vaughan, ON L4L 8S5 Tel: 905-264-2420 | www.fabianpapa.com
30 St. Patrick Street, Suite 1000, Toronto, ON M5T 3A3Tel: 416-593-5090 | www.hemson.com

Allocation of Funding Sources Report & 04 May 2016 Development Charges Background Study
Page i
Executive Summary
The Vaughan Metropolitan Centre (VMC) is an integral component of the City’s long-term strategic plan, a provincially designated Urban Growth Centre, and is initially planned to consist of 12,000 residential units, home to 25,000 people, and accommodate 11,500 jobs of which 5,000 will be new office jobs. Integral to the development of the VMC are two important projects: (i) the channelization of Black Creek adjacent to Jane Street from Highway 7 to Highway 407; and (ii) improvements to the Edgeley Pond located at the northeast corner of Jane Street and Highway 7. These works are anticipated to cost in the order of $96.6 million, a massive undertaking by any measure, and for which the City is developing a comprehensive implementation plan and funding strategy. The purpose of this report is to support that work through the identification of appropriate funding sources, as well as to serve as the statutory background study in support of an Area-Specific Development Charges by-law(s). The costs requiring funding from City-wide development charges will be considered during Vaughan’s next City-Wide development charges update.
The methodology applied in this report involved an assessment of the functional benefits served by each component of the above noted projects, and an assessment of beneficial interests associated with each of the functions. Following application of the methodology, the resultant allocations of capital costs and area-specific development charges are as summarized in the tables below. It is important to note that more than one charge may apply to a given land area. More complete descriptions and definitions of the funding sources, particularly as they relate to benefitting interest groups against which the area-specific development charges are assessed are provided in the main body of the report.
An asset management plan is presented which identifies an equivalent annual funding need in the order of $1.06 million to cover ongoing operation and maintenance costs as well as the building of reserves for future significant expenditures, such as major repairs, rehabilitation and/or replacement.
Capital Cost Summary by Funding Source
Description of Funding Source Cost ($000) %
Immediately Affected Landowners $13,024.4 13.5%Vaughan Metropolitan Centre Areas Draining to Edgeley Pond $2,612.9 2.7%Undeveloped Land in Black Creek Drainage Shed $2,978.1 3.1%City-Wide Development Charges – Engineering $33,000.0 34.2%City-Wide Development Charges – Parks and Open Space $7,926.4 8.2%Parks 10% Discount – Tax $880.7 0.9%Benefit to Existing Funding $17,173.6 17.8%Local Service $17,070.9 17.7%Other Governments (York Region, Conservation Authority) $1,931.2 2.0%Totals $96,598.3 100.0%
Calculated Area-Specific Development Charges
Lands to which Area-Specific Development Charges Applicable (Maps provided in Appendix C)
Cost ($000)
Area (net ha)
Unadjusted Charge ($/ha)
Adjusted Charge after Cash Flow
($/ha) Immediately Affected Landowners* $13,024.4 5.47 $2,381,929 $2,514,568 Vaughan Metropolitan Centre Draining to Edgeley Pond $2,612.9 33.55 $77,890 $83,452 Undeveloped Lands in Black Creek Drainage Shed $2,978.1 161.12 $18,484 $22,581 Totals $18,615.4 or 19.3% of the total costs
* The charge for Immediately Affected Landowners is levied on the net hectares removed from the floodplain; other charges are based on net developable hectares.
Allocation of Funding Sources Report & 04 May 2016 Development Charges Background Study
Page ii
Contents
Executive Summary i
Contents ii
Introduction 1
Category A: Black Creek Channelization Works 3
Beneficial Interests 3
Allocation of Functional Benefit by Component 8
Category B: Edgeley Pond Improvements 12
Beneficial Interests 12
Allocation of Functional Benefit by Component 14
Additional Works 16
Category C: Erosion Improvements 16
Category D: Public Art 16
Category E: SWM Pond/Tank For Southeast Quadrant of VMC 16
Category F: DC and Related Engineering Studies 16
Contingencies & Soft Costs 17
Development Charges Calculations 18
Study Consistent with Development Charges Legislation 18
Services Considered in the Analysis 18
Development Areas Included in Study 19
Historic Service Levels 19
Growth-Related Capital Program 19
Calculated Development Charges 23
Asset Management Plan 24
Local Service Definitions 30
Works Cited 31
Appendix A Black Creek Channelization Works Cost Estimate
Appendix B Edgeley SWM Pond Improvements Cost Estimate
Appendix C Area-Specific Development Charge Maps
Appendix D Cash Flow Assumptions

Allocation of Funding Sources Report & 04 May 2016 Development Charges Background Study
Page 1
Introduction
Fabian Papa & Partners (fp&p) and Hemson Consulting Ltd. have been retained by the City of Vaughan to undertake a review of the Black Creek works in the vicinity of the Vaughan Metropolitan Centre (VMC) required to enable development in the floodplain and reduce flooding risk and establish a methodology for the allocation of the associated costs to relevant funding sources. The works involved have been identified by the following studies:
Black Creek Stormwater Optimization Study Municipal Class Environmental Assessment Master Plan Report (Phases 1 & 2). (AECOM, 2011)
Vaughan Metropolitan Centre Municipal Servicing Class Environmental Assessment Master Plan. (TMIG, 2012)
Black Creek Stormwater Optimization Study Municipal Class Environmental Assessment Master Plan (Phases 3 &4). (TMIG, under preparation)
Vaughan Metropolitan Centre – Black Creek Renewal Municipal Class Environmental Assessment. (TMIG, under preparation)
The VMC (see Figure 1) is an integral component of the City’s long-term strategic plan. The provincially designated Urban Growth Centre (UGC) is initially planned to consist of 12,000 residential units, home to 25,000 people, and accommodate 11,500 jobs of which 5,000 will be new office jobs. The TTC subway and VIVA public transit stations will seamlessly connect the VMC with other Greater Toronto Area centres.
In addition to the development anticipated directly in and adjacent to the VMC, the new downtown will be a focal point in the City. The Centre will include prime retail, recreation, social, cultural and transportation infrastructure that can be utilized by all Vaughan residents. For the VMC vision to be met, significant infrastructure improvements in the area are required to service the anticipated growth.
Figure 1 Vaughan Metropolitan Centre (VMC) (Urban Strategies, 2013)
Allocation of Funding Sources Report & 04 May 2016 Development Charges Background Study
Page 2
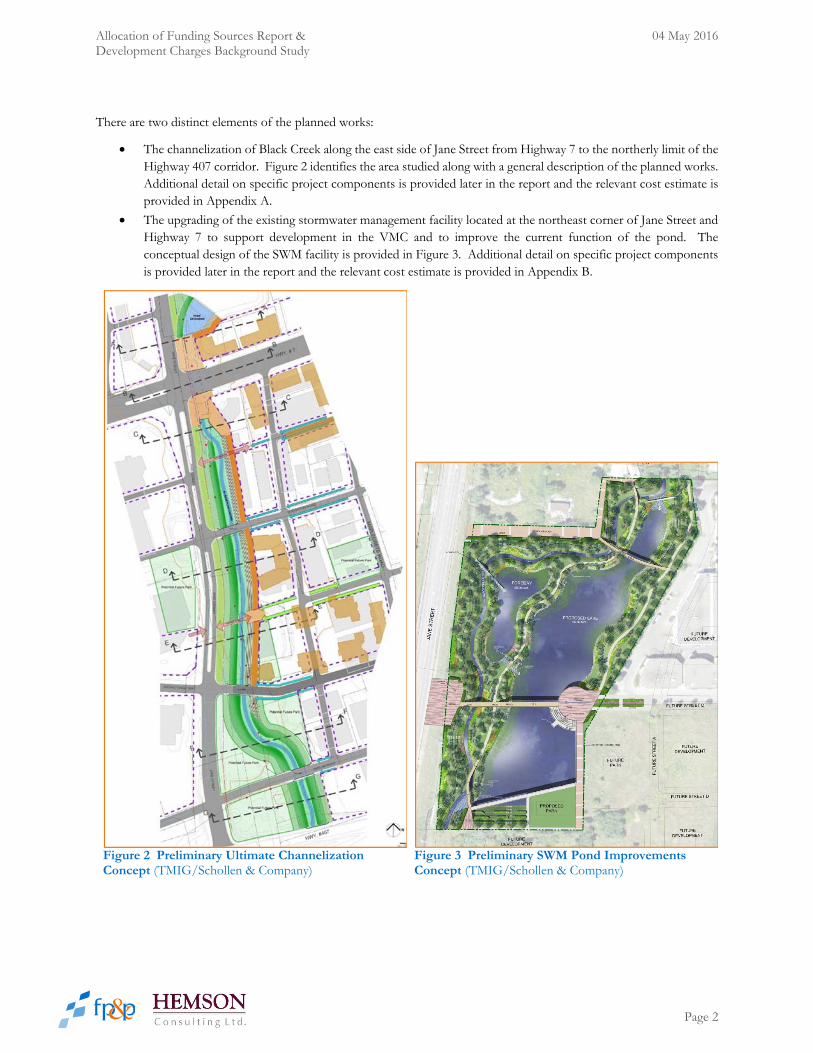
There are two distinct elements of the planned works:
The channelization of Black Creek along the east side of Jane Street from Highway 7 to the northerly limit of the Highway 407 corridor. Figure 2 identifies the area studied along with a general description of the planned works. Additional detail on specific project components is provided later in the report and the relevant cost estimate is provided in Appendix A.
The upgrading of the existing stormwater management facility located at the northeast corner of Jane Street and Highway 7 to support development in the VMC and to improve the current function of the pond. The conceptual design of the SWM facility is provided in Figure 3. Additional detail on specific project components is provided later in the report and the relevant cost estimate is provided in Appendix B.
Figure 2 Preliminary Ultimate Channelization Concept (TMIG/Schollen & Company)
Figure 3 Preliminary SWM Pond Improvements Concept (TMIG/Schollen & Company)

Allocation of Funding Sources Report & 04 May 2016 Development Charges Background Study
Page 3
Category A: Black Creek Channelization Works
The improvements to the stretch of Black Creek extending from Highway 7 to the Highway 407 corridor along the east side of Jane Street include a variety of elements and components that, in addition to the function of increasing hydraulic capacity and thereby containing the floodplain to within the limits of the channel, also provide benefits to individual landowners, future development within the tributary drainage shed as well as existing and future residents and employees of the City.
The subsequent sections discuss the benefitting interest groups and the allocation of costs among them associated with each of these benefits in mind.
BENEFICIAL INTERESTS
Each of the project components will serve one or more functional benefits which need to be treated differently in terms of beneficial interests and, in turn, funding sources. As an example, a bridge structure for a new road connection may serve a transportation function in addition to improving the hydraulic capacity of the creek at the road crossing. The approach is to firstly identify the various functional benefits to be considered, and secondly to ascribe the degree to which each component contributes to providing each of the functional benefits.
The following functional benefits have been identified as relevant for this analysis, each of which is described in detail below:
Improvement of hydraulic capacity of Black Creek waterway (flood control);
Transportation; and
Open Space Network.
Improvement of Hydraulic Capacity (Flood Control)
The predominant stormwater management objective being served by the infrastructure proposed as part of the Black Creek Renewal, particularly extending from Highway 7 to Highway 407, is flood containment through a high capacity naturalized channel. These works are expected to remove a significant amount of lands, both privately and publicly owned, from the existing floodplain allowing future development to proceed.
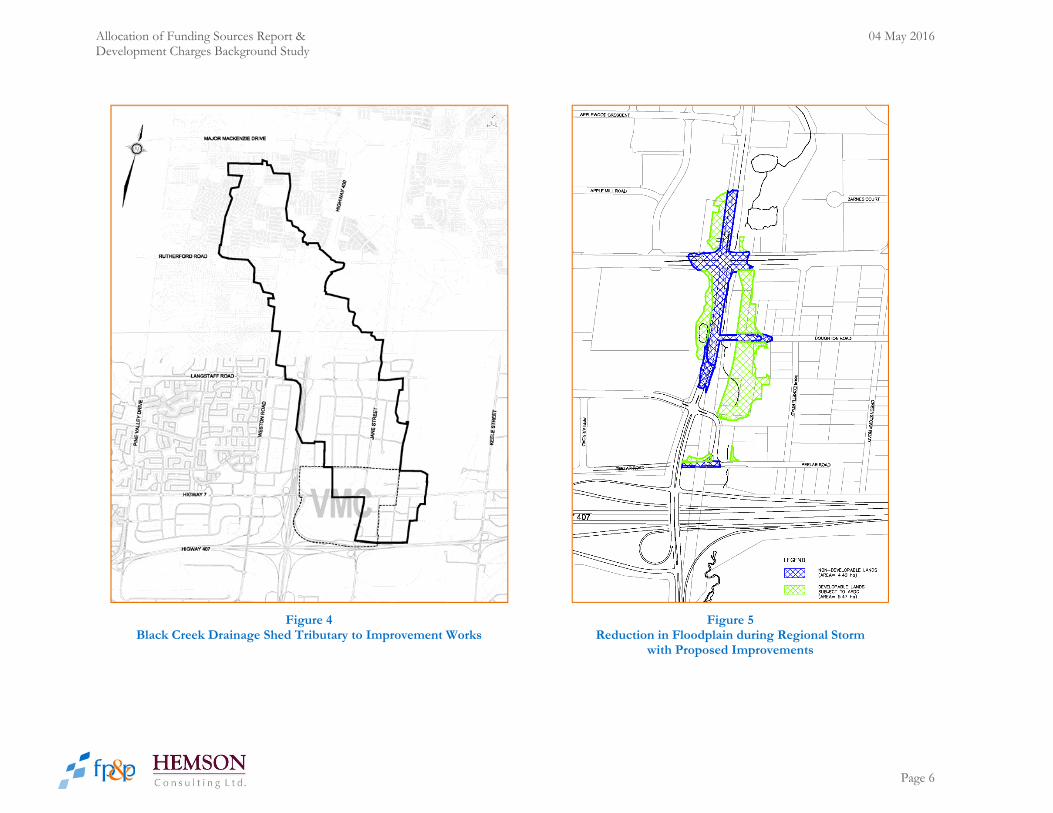
Black Creek Drainage Shed
The drainage shed associated with this stretch of Black Creek is identified in Figure 4 and is largely developed, although it does contain several vacant developable parcels. Given the proximity of these lands to the City’s new downtown core, it is reasonable to expect that some properties will undergo re-development in the foreseeable future, although this fraction is expected to be quite small.
This interest group benefits from these works since the improvements to the hydraulic capacity of Black Creek does result in a condition where there will be planned and available capacity in the infrastructure to receive flows from development lands without exacerbating the existing conditions known to have issues with respect to flooding. That is, without the improvements, the design criteria applied to new development would likely need to be more stringent than the “typical” criteria identified in previous work (AECOM, 2011) which itself is premised on the implementation of the improvements. More specifically, in the absence of the planned improvements, the on-site storage requirements for developments in this drainage shed would appropriately be increased above the City’s current standard in order to not exacerbate the current flooding risk.
It is noted that, although flow rates may be controlled on-site, total volumes of runoff will increase and on-site controls, while useful to limit flows to the receiving sewer system, may in fact yield counter-productive results further downstream as the various attenuated (or “flattened”) hydrographs are superimposed on each other. That is, this flattening of
Allocation of Funding Sources Report & 04 May 2016 Development Charges Background Study
Page 4
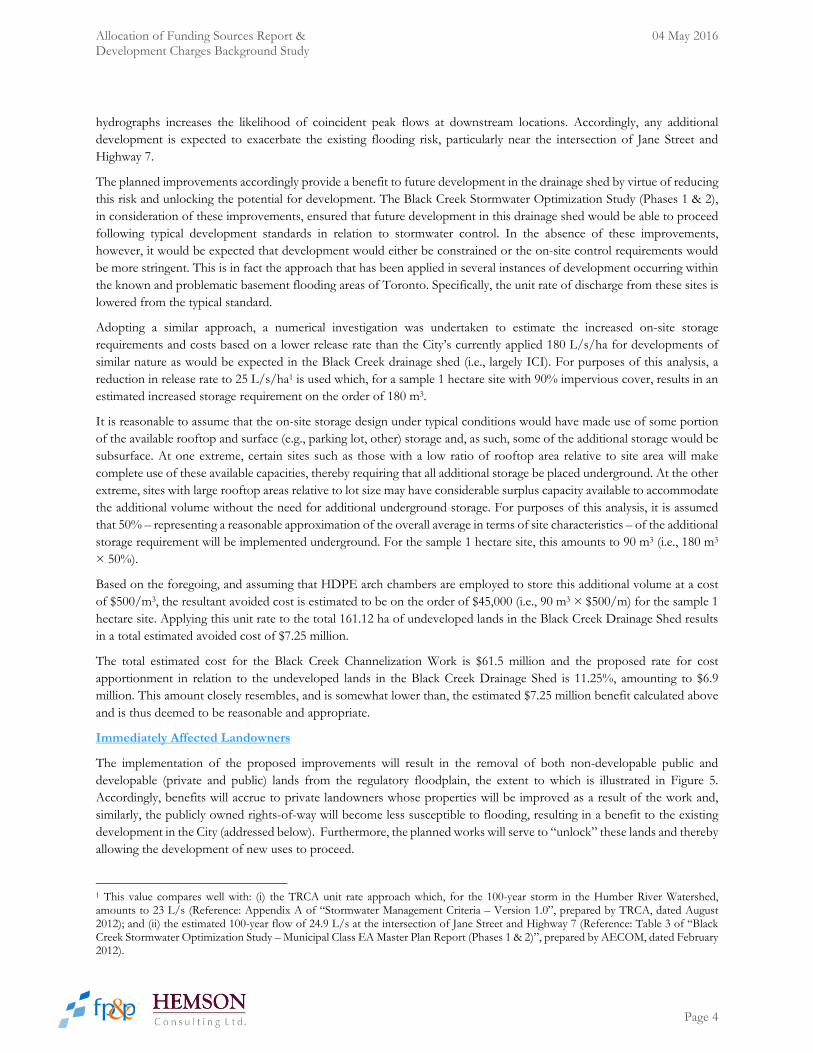
hydrographs increases the likelihood of coincident peak flows at downstream locations. Accordingly, any additional development is expected to exacerbate the existing flooding risk, particularly near the intersection of Jane Street and Highway 7.
The planned improvements accordingly provide a benefit to future development in the drainage shed by virtue of reducing this risk and unlocking the potential for development. The Black Creek Stormwater Optimization Study (Phases 1 & 2), in consideration of these improvements, ensured that future development in this drainage shed would be able to proceed following typical development standards in relation to stormwater control. In the absence of these improvements, however, it would be expected that development would either be constrained or the on-site control requirements would be more stringent. This is in fact the approach that has been applied in several instances of development occurring within the known and problematic basement flooding areas of Toronto. Specifically, the unit rate of discharge from these sites is lowered from the typical standard.
Adopting a similar approach, a numerical investigation was undertaken to estimate the increased on-site storage requirements and costs based on a lower release rate than the City’s currently applied 180 L/s/ha for developments of similar nature as would be expected in the Black Creek drainage shed (i.e., largely ICI). For purposes of this analysis, a reduction in release rate to 25 L/s/ha1 is used which, for a sample 1 hectare site with 90% impervious cover, results in an estimated increased storage requirement on the order of 180 m3.
It is reasonable to assume that the on-site storage design under typical conditions would have made use of some portion of the available rooftop and surface (e.g., parking lot, other) storage and, as such, some of the additional storage would be subsurface. At one extreme, certain sites such as those with a low ratio of rooftop area relative to site area will make complete use of these available capacities, thereby requiring that all additional storage be placed underground. At the other extreme, sites with large rooftop areas relative to lot size may have considerable surplus capacity available to accommodate the additional volume without the need for additional underground storage. For purposes of this analysis, it is assumed that 50% – representing a reasonable approximation of the overall average in terms of site characteristics – of the additional storage requirement will be implemented underground. For the sample 1 hectare site, this amounts to 90 m3 (i.e., 180 m3 × 50%).
Based on the foregoing, and assuming that HDPE arch chambers are employed to store this additional volume at a cost of $500/m3, the resultant avoided cost is estimated to be on the order of $45,000 (i.e., 90 m3 × $500/m) for the sample 1 hectare site. Applying this unit rate to the total 161.12 ha of undeveloped lands in the Black Creek Drainage Shed results in a total estimated avoided cost of $7.25 million.
The total estimated cost for the Black Creek Channelization Work is $61.5 million and the proposed rate for cost apportionment in relation to the undeveloped lands in the Black Creek Drainage Shed is 11.25%, amounting to $6.9 million. This amount closely resembles, and is somewhat lower than, the estimated $7.25 million benefit calculated above and is thus deemed to be reasonable and appropriate.
Immediately Affected Landowners
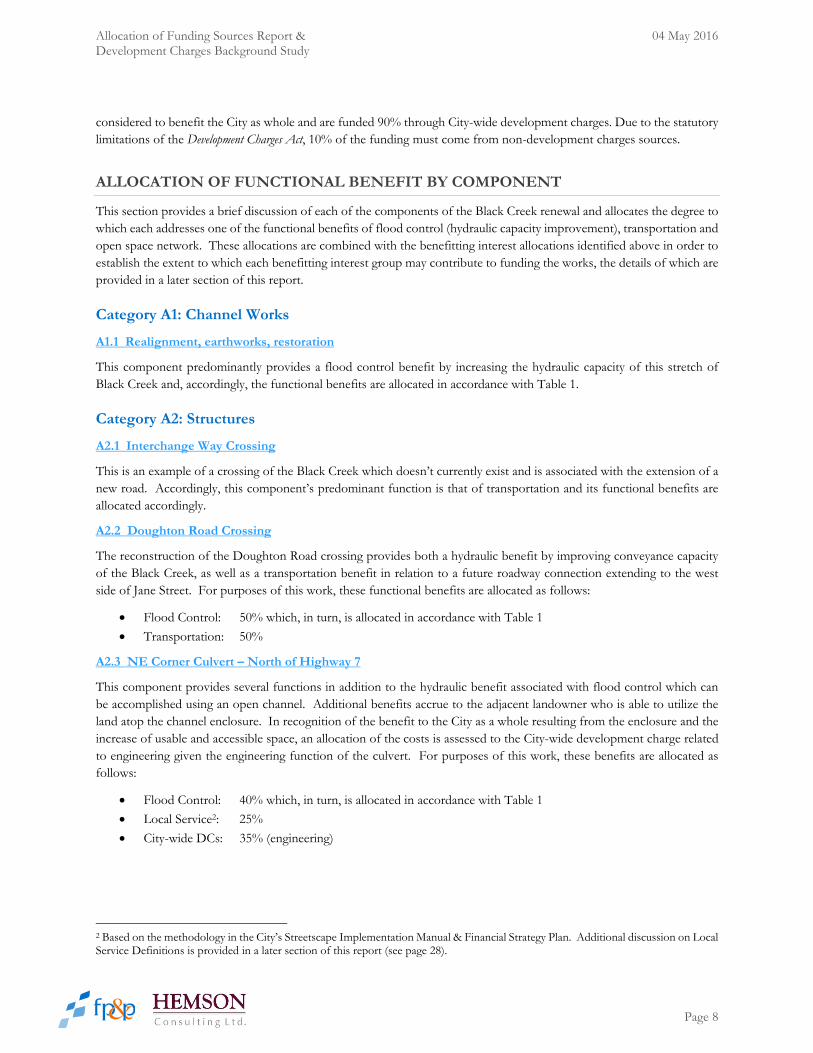
The implementation of the proposed improvements will result in the removal of both non-developable public and developable (private and public) lands from the regulatory floodplain, the extent to which is illustrated in Figure 5. Accordingly, benefits will accrue to private landowners whose properties will be improved as a result of the work and, similarly, the publicly owned rights-of-way will become less susceptible to flooding, resulting in a benefit to the existing development in the City (addressed below). Furthermore, the planned works will serve to “unlock” these lands and thereby allowing the development of new uses to proceed.
1 This value compares well with: (i) the TRCA unit rate approach which, for the 100-year storm in the Humber River Watershed, amounts to 23 L/s (Reference: Appendix A of “Stormwater Management Criteria – Version 1.0”, prepared by TRCA, dated August 2012); and (ii) the estimated 100-year flow of 24.9 L/s at the intersection of Jane Street and Highway 7 (Reference: Table 3 of “Black Creek Stormwater Optimization Study – Municipal Class EA Master Plan Report (Phases 1 & 2)”, prepared by AECOM, dated February 2012).

Allocation of Funding Sources Report & 04 May 2016 Development Charges Background Study
Page 5
As noted above, the allocation to lands in the Black Creek Drainage Shed is 11.25%. The remaining amount to be allocated is thus 88.75% for which it is instructive to consider the relative amount of land removed from the floodplain as a result of the planned improvement works. Based on the floodplain modelling and as illustrated in Figure 5, the following areas have been estimated:
Privately & publicly owned developable lands: 5.47 ha
Publicly owned non-developable lands: 4.40 ha
Total lands removed from floodplain: 9.87 ha
Based on these areas, the fraction of developable lands removed from the floodplain amounts to 55.41% of the 88.75% to be allocated, this amounts to 49.20% of the total costs related to hydraulic improvements. The remaining 44.59% of the 88.75% allocation, being 39.55%, is attributable to public sector improvements and is the topic of the next section.
Allocation of Funding Sources Report & 04 May 2016 Development Charges Background Study
Page 6
Figure 4 Black Creek Drainage Shed Tributary to Improvement Works
Figure 5 Reduction in Floodplain during Regional Storm
with Proposed Improvements

Allocation of Funding Sources Report & 04 May 2016 Development Charges Background Study
Page 7
City-Wide Future Development & Existing Development
Consistent with the approach utilized in the City’s 2013 Development Charges By-law, certain works are deemed to provide benefits to the City as a whole level which can be funded through City-wide development charges. In this regard all transportation, streetscaping and related engineered services and open space network projects have been considered at the City-wide level.
The allocation of costs related to the benefit accruing to the City as a whole may be funded through City-wide Development Charges under the 2013 by-law or a subsequent development charges by-law. Funding under the 2013 by-law may require the substitution of non-Black Creek projects since $20 million was identified for City-wide Black Creek Works in the Development Charges Study which is lower than the presently identified City-wide funding requirement.
The allocation of costs relating to the benefit accruing to existing development (residents and employees) in the City are to be funded through the City’s internal resources, such as general taxation, and utility rates and charges wherever applicable.
The distribution of the remaining 39.55% of benefits resulting from improvements in the hydraulic capacity of Black Creek between existing and future development can be apportioned based on existing and future population and employment, respectively. The 2011 Census population and employment total in Vaughan was 473,400 while the forecast future (2041) population and employment is 780,000 (Hemson estimate). Based on these figures, the existing population and employment represents 60.7% of the 2041 population and employment and new growth represents 39.3%. Applying these values to the remaining 39.55% of benefits noted above results in the following apportionment of costs related to the benefits accruing to these interest groups:
New Development (to be recovered through City-wide Development Charges): 15.50%
Existing Development (to be recovered through the City’s internal resources): 24.05%
Summary
To the extent that any individual project components are deemed to provide a hydraulic benefit, the allocation of costs indicated in Table 1 is applied.
Table 1 Allocation of Costs Related to Hydraulic (Flood Control) Benefits
Benefitting Interest Group Allocation
Black Creek Drainage Shed 11.25%
Immediately Affected Landowners 49.20%
City-wide Future Development 15.50%
Existing Development 24.05%
Total 100.00%
Transportation
While certain bridge structures are planned on existing roads to improve the hydraulic capacity of Black Creek, certain other bridge structures, both vehicular and pedestrian, are required as part of the planned development and in support of the population and employment growth of the Vaughan Metropolitan Center (VMC) and the City in general. Following the City’s policy, all growth-related transportation infrastructure is deemed to be of benefit to the City as a whole and is funded through City-wide development charges.
Open Space Network
The planned improvements to Black Creek are also intended to create value in a social dimension by virtue of the planned open space network. Maintaining consistency with the City’s current practice, all new open space network projects are
Allocation of Funding Sources Report & 04 May 2016 Development Charges Background Study
Page 8
considered to benefit the City as whole and are funded 90% through City-wide development charges. Due to the statutory limitations of the Development Charges Act, 10% of the funding must come from non-development charges sources.
ALLOCATION OF FUNCTIONAL BENEFIT BY COMPONENT
This section provides a brief discussion of each of the components of the Black Creek renewal and allocates the degree to which each addresses one of the functional benefits of flood control (hydraulic capacity improvement), transportation and open space network. These allocations are combined with the benefitting interest allocations identified above in order to establish the extent to which each benefitting interest group may contribute to funding the works, the details of which are provided in a later section of this report.
Category A1: Channel Works
A1.1 Realignment, earthworks, restoration
This component predominantly provides a flood control benefit by increasing the hydraulic capacity of this stretch of Black Creek and, accordingly, the functional benefits are allocated in accordance with Table 1.
Category A2: Structures
A2.1 Interchange Way Crossing
This is an example of a crossing of the Black Creek which doesn’t currently exist and is associated with the extension of a new road. Accordingly, this component’s predominant function is that of transportation and its functional benefits are allocated accordingly.
A2.2 Doughton Road Crossing
The reconstruction of the Doughton Road crossing provides both a hydraulic benefit by improving conveyance capacity of the Black Creek, as well as a transportation benefit in relation to a future roadway connection extending to the west side of Jane Street. For purposes of this work, these functional benefits are allocated as follows:
Flood Control: 50% which, in turn, is allocated in accordance with Table 1
Transportation: 50%
A2.3 NE Corner Culvert – North of Highway 7
This component provides several functions in addition to the hydraulic benefit associated with flood control which can be accomplished using an open channel. Additional benefits accrue to the adjacent landowner who is able to utilize the land atop the channel enclosure. In recognition of the benefit to the City as a whole resulting from the enclosure and the increase of usable and accessible space, an allocation of the costs is assessed to the City-wide development charge related to engineering given the engineering function of the culvert. For purposes of this work, these benefits are allocated as follows:
Flood Control: 40% which, in turn, is allocated in accordance with Table 1
Local Service2: 25%
City-wide DCs: 35% (engineering)
2 Based on the methodology in the City’s Streetscape Implementation Manual & Financial Strategy Plan. Additional discussion on Local Service Definitions is provided in a later section of this report (see page 28).

Allocation of Funding Sources Report & 04 May 2016 Development Charges Background Study
Page 9
A2.4 Peelar Road Crossing
This component provides both a hydraulic benefit by improving conveyance capacity of the Black Creek, as well as a transportation benefit. For purposes of this work, these functional benefits are allocated the same as Doughton Road as follows:
Flood Control: 50% which, in turn, is allocated in accordance with Table 1
Transportation: 50%
A2.5 Mews
The Mews identified in the VMC Secondary Plan which crosses the Black Creek and connects Jane Street with the future road network east thereof. The VMC Secondary Plan speaks to the intended purpose and function of a mews to serve as a right-of-way for transportation and utilities, amongst other matters. It is noted that the transportation function may include either or both of routine and emergency/special operations. Given these functions, this component of the work is allocated as a transportation benefit.
A2.6 Retaining Walls
The predominant function of this component is that of improved hydraulic conveyance and its functional benefits are allocated in accordance with Table 1.
A2.7 Removal of Existing Driveway Culvert (Access to Arena) and Restoration
The existing driveway providing access to the Doublerink Arenas/Vaughan Iceplex facility includes a culvert through which the Black Creek flows and which also represents a restriction to flow. In order to improve the hydraulic capacity of the Black Creek, this driveway and culvert have been identified for removal and, therefore, this component predominantly provides a flood control benefit with the functional benefits allocated in accordance with Table 1.
A2.8 Temporary Access to 7581 Jane Street
During the construction of the works, the existing access to 7581 Jane Street will need to be removed and reinstated on a temporary basis. These works are predominantly required to improve the hydraulic conveyance function of Black Creek and its functional benefits are accordingly allocated in accordance with Table 1.
Category A3: Bank Treatments, Urban Design and Landscape
A3.1 Naturalized Western Edge plus Eastern Edge South of Peelar Road
Based on the City’s interactions with TRCA this component was identified as part of the construction of the hydraulic improvements along Black Creek is necessary to facilitate development in the VMC. While this treatment is required, in part to create the channel itself, thus providing a hydraulic function, it is also considered an enhancement that provides additional benefit to the public through its integration with pedestrian trails and similar functions. For purposes of this work, these functional benefits are allocated as follows:
Flood Control: 85% which, in turn, is allocated in accordance with Table 1
Parks and Open Space: 15%
Allocation of Funding Sources Report & 04 May 2016 Development Charges Background Study
Page 10
A3.2 Terraced Steps
Similar to the above, the terraced steps along the channel provide both a hydraulic function and, by virtue of aesthetics and integration with the public realm, also provide non-engineering benefits. In addition, they also provide a local service benefit to adjacent landowners. For purposes of this work, these functional benefits are allocated as follows:
Local Service2: 25%
Flood Control & Parks: 75% general allocation which is further allocated as follows: o Flood Control: 85% which, in turn, is allocated in accordance with Table 1 o Parks and Open Space: 15%
A3.3 Urban Plazas – paving, furniture, lighting (Intersection of Jane and Highway 7)
The costs related to these works have been split across four categories. A 25% local service3 share is identified based on the arterial road guidelines in the City’s Streetscape Implementation Manual & Financial Strategy Plan. A 25% share has been assumed to be funded by the Region of York. For the remaining 50%, it is anticipated that this project will have equivalent parks and open space and streetscape components resulting in a 25% apportionment to City-wide parks and engineering development charges respectively. Since this is a new project no benefit to existing shares are identified.
A3.4 Urban Buffer – amenitized eastern edge, promenade paving, furniture, lighting
Following the methodology of the City’s Streetscape Implementation Manual & Financial Strategy Plan which identifies a multi-pronged approach to funding this type of work, and given that these components (i.e., A3.3 & A3.4) are located at the intersection of two arterial roads, the local development contribution3 is deemed to be 25%. The remainder of the costs associated with this work is allocated evenly to the City-wide Development Charges related to both Engineering and Parks and Open Space, as well as York Region since both Highway 7 and Jane Street are regional roads.
A3.5 Sustainable Transitional Feature NE Corner of Jane and Highway 7
This feature sits atop the proposed enclosure of the Black Creek identified in A2.3 and, similarly, provides a local service benefit3 which is deemed to be 25% of the benefit. The remainder of the benefits are deemed to be equally divided among City-wide Development Charges related to both Engineering (based on technical function of wetlands) and Parks and Open Space (based on aesthetics and public enjoyment of space).
Land Acquisitions
The land acquisitions required to implement the above works are to be distributed to the benefitting interest groups so as to match the distribution to these groups following the above noted allocations. The underlying rationale is that the acquisitions are a necessary element to achieving all of the other benefits noted above.
It is noted that the land acquisitions contemplated herein are only for those parcels required to implement the “interim solution”, while the remainder of lands necessary to complete the ultimate solution are expected to be conveyed to the City at the time of (re-)development of the properties to which this matter relates. Accordingly, lands to be conveyed through the (re-)development processes are attributed fully as a local service.
The City retained a third party appraisal firm to estimate the market values of the land required for the Black Creek Channel Revitalization Works for budgeting purposes. The estimated market value was based on existing and anticipated future land uses. The appraisal provided for a low, medium, median and high value per category and was not a property specific appraisal but rather for categories of land uses.
A blended land value per hectare was then established by taking 50% of the median value for each of the land use categories which were identified in the future VMC Secondary Plan (Schedule F). The categories used were as follows:
3 Additional discussion on Local Service Definitions is provided in a later section of this report (see page 28).

Allocation of Funding Sources Report & 04 May 2016 Development Charges Background Study
Page 11
Station Precinct
Neighbourhood Precinct
Major Park & Open Space
Industrial
The established rates by category were then applied to the estimated number of hectares per category. The total value was then divided by the total estimated number of hectares required for the Black Creek Channel Revitalization Works to establish the blended rate. The resulting blended rate using this methodology is approximately $2.7 million per hectare.
This should not be considered to be the value of land for any specific parcel to be acquired. An independent property specific appraisal prepared by an accredited appraiser in good standing with the Appraisal Institute of Canada within 6 months of the acquisition is required. The land areas used are also estimates and require a reference plan to confirm actual land areas. Based on future acquisitions, the City reserves the right to reopen the ASDC By-law to review and adjust the land values as deemed necessary.
Allocation of Funding Sources Report & 04 May 2016 Development Charges Background Study
Page 12
Category B: Edgeley Pond Improvements
The planned improvement and expansion works to the existing SWM facility located at the northeast corner of Jane Street and Highway 7 (Edgeley Pond) provide several functional benefits. In the absence of any development, there is a need to improve the existing pond’s function and this project includes these previously identified retrofits that benefit the existing community. Beyond this, the planned facility also provides the opportunity to provide a functional benefit, particularly in terms of water quality control, for a portion of the lands within the VMC. Additional future (re-)development lands within the upstream drainage shed also benefit from the improved function of the facility. Given the strategic location of the facility and the future vision for the VMC, this project capitalizes on the opportunity to provide a meaningful enhancement to the space to be enjoyed by the public.
The subsequent sections discuss the benefitting interest groups and the allocation of costs among them associated with each of these benefits in mind.
BENEFICIAL INTERESTS
The beneficial interest groups discussed below have been identified as relevant for this analysis.
Lands in VMC Serviced by Pond
The Edgeley Pond will collect and process flows from approximately 33.55 ha of contributing drainage area within the Vaughan Metropolitan Centre (see Figure 6) for purposes of water quality control. Accordingly, there is a substantial benefit accruing to these landowners noting that, in the absence of this opportunity, additional developable tablelands would have been required to satisfy this water quality control objective given the size of the catchment area in question. Moreover, it is likely that two facilities would have been required given the physical division of the entire drainage area by Jane Street, thereby reducing efficiencies related to economies of scale.
To understand the value of this benefit, it is reasonable to assume that something in the order of 2 ha (±5 acres) might otherwise be required for this purpose, representing approximately 6.5% of the participating 33.55 ha drainage area (and 4.1% of the ±49 ha contributing drainage area) which is a typical, and perhaps modest, fraction of land required for such purposes. The benefits derived therefore include the value of this land, as well as any construction-related works that would otherwise be required to construct these facilities.
The City as a Whole
This facility is intended to provide an interesting and enjoyable public space and certain elements of the project contribute to this specifically.
Existing Development
In the absence of development in the VMC and the public realm elements noted above, it is recognized that the retrofit of this pond is desirable to improve its function as a stormwater management facility, improving downstream quality in addition to providing other related benefits. It is noted that the retrofit-only design of the pond does not provide a broader benefit (i.e., to development in the VMC as well as the City as a whole) as currently envisioned and, based on technical function alone, would be considerably less expensive.

Allocation of Funding Sources Report & 04 May 2016 Development Charges Background Study
Page 13
Figure 6 Areas in VMC Tributary to Edgeley Pond (SWM Pond P1 NE) (annotated excerpt from VMC Municipal Servicing Class EA Master Plan prepared by TMIG, 2012)
Allocation of Benefit between VMC Lands Serviced by Pond and Existing Development
Wherever it is deemed that works provide benefit to both these interest groups, the allocation is weighted more heavily against existing development, in recognition of the need to retrofit this facility and the large upstream drainage area it handles. Simultaneously, the benefit afforded to private landowners by permitting the use of this facility and avoiding loss of developable lands is quite considerable. For the purposes of this work, the allocation of benefit to these interest groups is provided in Table 2.
Table 2 Allocation of Costs Related to Edgeley Pond Improvements
Benefitting Interest Group Allocation
Lands in VMC Serviced by Pond 25%
Existing Development 75%
Allocation of Funding Sources Report & 04 May 2016 Development Charges Background Study
Page 14
ALLOCATION OF FUNCTIONAL BENEFIT BY COMPONENT
Category B1: Base Design Components
B1.1 Earthworks, Erosion/Sediment Control, Site Preparation
B1.2 Natural Channel Realignment and Restoration
B1.3 Plant Material
These components of the work (i.e., B1.1 to B1.3) are required for the construction of the pond as a whole and, as such, the allocation of costs is in accordance with Table 2.
B1.4 Inlet and Outlet Control Structures – Main Pond
These structures are deemed to be for the sole benefit of the existing facility and are allocated entirely to the existing development.
B1.5 Structures Servicing VMC Lands
This category of costs includes those structures which convey and process stormwater drainage derived from that portion of the VMC lands which drain to this pond. Costs associated with these works are ascribed entirely to this benefitting interest group.
B1.6 Edge Treatments (Base Design)
This class of edge treatments is considered to be typical of stormwater management pond design and affects the pond as a whole. The allocation of costs is therefore in accordance with Table 2.
B1.7 Urban Design Features (Base Design)
Urban design features are common in contemporary stormwater management pond design and this component addresses the base, rather than the enhanced component of design. The allocation of costs is therefore in accordance with Table 2.
Category B2: Enhanced Design Components
B2.1 Urban Design Features (Enhanced Design)
B2.2 Site Furnishing
The works that fall into the above categories (i.e. B2.1 & B2.2) are above and beyond what would normally be expected and are provided to improve the public space. These works provide a City-wide benefit and are allocated to Parks and Open Space Development Charges.
B2.3 Bridges
While the bridges envisioned for the pond provide an improvement to the public space, they are designed for and serve the additional benefit of access to the pond for purposes of maintenance. This also provides benefit to the existing lands as well as future lands draining into the facility. For purposes of this work, these functional benefits are allocated as follows:
Park and Open Space: 62.5%
Benefit to Existing 37.5%
Allocation of Funding Sources Report & 04 May 2016 Development Charges Background Study
Page 15
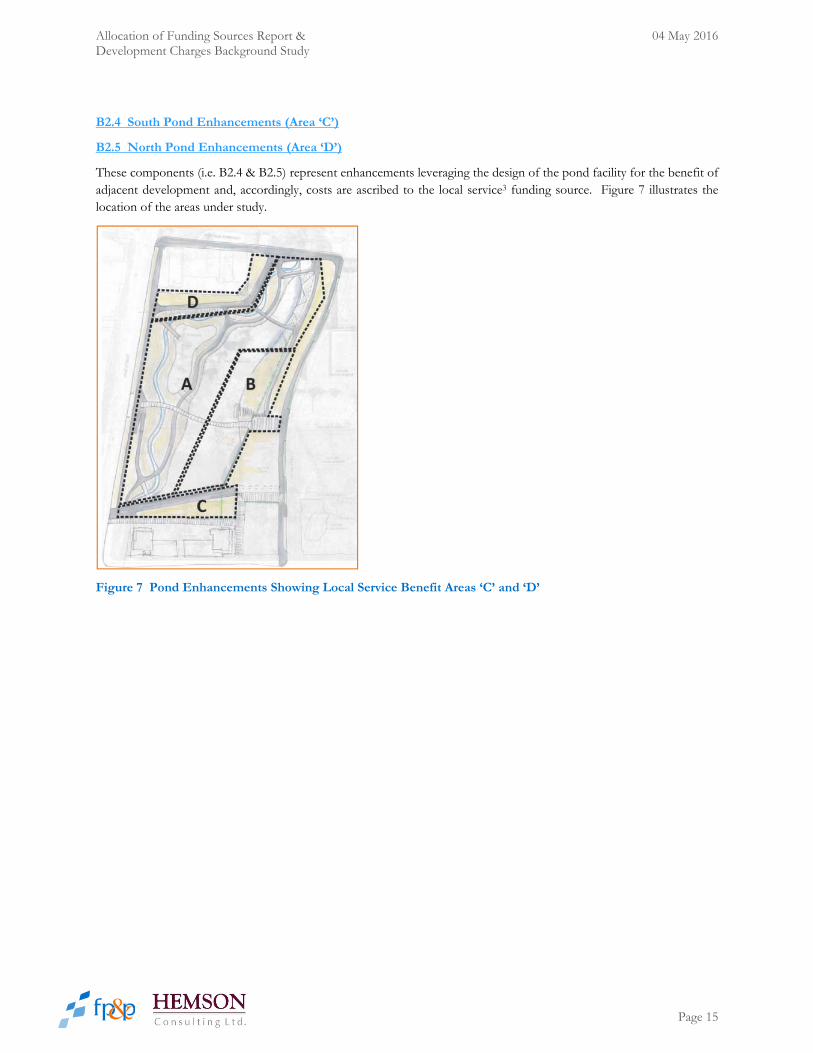
B2.4 South Pond Enhancements (Area ‘C’)
B2.5 North Pond Enhancements (Area ‘D’)
These components (i.e. B2.4 & B2.5) represent enhancements leveraging the design of the pond facility for the benefit of adjacent development and, accordingly, costs are ascribed to the local service3 funding source. Figure 7 illustrates the location of the areas under study.
Figure 7 Pond Enhancements Showing Local Service Benefit Areas ‘C’ and ‘D’
Allocation of Funding Sources Report & 04 May 2016 Development Charges Background Study
Page 16
Additional Works
CATEGORY C: EROSION IMPROVEMENTS
These works include improvements to the Black Creek south of Highway 407 towards Steeles Avenue West. Given that the works serve to improve existing conditions to a perceivably greater extent compared to the facilitation of future development in the upstream drainage shed, the allocation of costs related to this work are assigned to existing development. It is worth noting that funds are understood to be available through TRCA and which have been historically collected for this sort of activity. Based on this, the cost apportionment is further divided such that 25% is ascribed to “other government” funding sources and the remaining 75% is deemed to benefit the existing community.
CATEGORY D: PUBLIC ART
Any public art installation is deemed to be a Local Service that will be paid for by the specific developer as part of its development negotiation process with the City.
CATEGORY E: SWM POND/TANK FOR SOUTHEAST QUADRANT OF VMC
The Municipal Class EA Master Plan for the Vaughan Metropolitan Centre identified the need for a SWM pond to be located on the south side of Peelar Road, immediately east of the Black Creek. Since the time of that work, and based on discussions between the City and the relevant land interests, the concept of an underground tank running parallel to the east side of the realigned Black Creek has been developed, which will be subject to finalization through the EA process. This tank is intended to service municipal-owned lands (i.e. entirely or predominantly rights-of-way) while individual developments will be required to provide on-site controls. On this basis, the benefits of this work are ascribed to future re-development (growth) in the area through City-wide development charges related to engineering.
CATEGORY F: DC AND RELATED ENGINEERING STUDIES
Similar to the methodology applied earlier to land acquisitions required in relation to the Black Creek channelization works, these studies are treated herein to be distributed to the benefitting interest groups so as to match the distribution to these groups following all the above noted allocations (i.e. Categories A to E). The underlying rationale is that the studies are a necessary element to achieving all of the other benefits noted above. Of note, the parks-related studies could also be funded though the City’s general government development charges service category.
Allocation of Funding Sources Report & 04 May 2016 Development Charges Background Study
Page 17
Contingencies & Soft Costs
In addition to the estimated construction cost of the works, additional provisions need to be accounted for when establishing actual overall costs that may be incurred.
A component-specific contingency is carried in the analysis and accounts for the variability in the construction cost estimate provided. This variability, and the resultant contingency, can be wide and is dependent upon various factors including the degree of certainty relating to the scope of the project, the level to which designs have been advanced, the ability to cluster project components to achieve economies of scale, and timing impacts amongst other matters. For instance, given the fragmented ownership of lands associated with the Black Creek Channelization Works, it is expected that implementation of the works will occur on a piecemeal basis, thereby resulting in inefficiencies which are intended to be accounted for by the contingencies applied to these works.
Also, the remaining costs to complete the design work (soft costs) as well as construction-related contingencies are included in the overall costs. Similarly, these can vary significantly depending on the extent to which detailed design work is still required, as well as the uncertainties associated with implementation of the project. For instance, the values used for this category of additional costs are lower for works related to the Edgeley Pond improvements relative to the Black Creek Channelization work since there is more knowledge (and less uncertainty) related to the pond improvements. Further, the pond works are generally self-contained within a single site whereas the channelization works will be complicated by the numerous and fragmented properties along its route, in addition to road crossings, as well as proximity to Jane Street and other actively used transportation and business elements. As well, the channelization works will occur through a narrow corridor for which the drainage function must be maintained during construction which can significantly impact the cost of construction. In contrast, within the pond there is space and opportunity to stage works in a manner that maintains functionality during construction.
Allocation of Funding Sources Report & 04 May 2016 Development Charges Background Study
Page 18
Development Charges Calculations
This study calculates development charges for the Black Creek related works in the City of Vaughan in compliance with the provisions of the Development Charges Act, 1997 (DCA) and its associated regulation (Ontario Regulation 82/98).
The City’s existing 2013 City Development Charge Bylaw 045-2013, that expires on September 21, 2018, would not be amended through this study. It is the City’s intent to pass by-laws related to area-specific development charges (ASDCs) calculated herein in 2016 and the City-wide development charges capital expenditures identified in this study will be considered during the next City-wide by-law update.
STUDY CONSISTENT WITH DEVELOPMENT CHARGES LEGISLATION
The City needs to continue implementing development charges to fund capital projects related to growth so that development pays for its capital requirements to the extent allowed by the Development Charges Act and so that new services required by growth are provided in a fiscally responsible manner.
o The Development Charges Act and O. Reg. 82/98 requires that a development charges background study be prepared in which development charges are determined with reference to:
o a forecast of the amount, type and location of development anticipated in the study areas; o a review of future capital projects, including an analysis of gross expenditures, funding sources, and net
expenditures incurred or to be incurred by the City to provide for the expected development, including the determination of the growth and non-growth-related components of the capital projects; and
o an examination of the long-term capital and operating costs for the capital infrastructure required for each service to which the development charges by-laws would relate.
This report identifies the growth-related net capital costs which are attributable to development that is forecast to occur in the City. These costs are apportioned to types of development (residential, non-residential) in a uniform land-based manner.
SERVICES CONSIDERED IN THE ANALYSIS
The following City services have been included in the development charge analysis: o Area-Specific Stormwater and/or Floodplain Management o City-wide Engineering o City-wide Parks and Open Space Development
City-wide engineering can include storm, transportation, streetscape, lighting, sidewalks, culvert and other similar infrastructure.
The area-specific approach was used for stormwater and/or floodplain management infrastructure since it more closely aligns the capital costs and benefits to the development areas being improved.
As permitted by the legislation and consistent with the City’s existing practice, the area-specific stormwater management development charges have been calculated on a land area (per net hectare) basis.

Allocation of Funding Sources Report & 04 May 2016 Development Charges Background Study
Page 19
DEVELOPMENT AREAS INCLUDED IN STUDY
The area-specific development charges calculated in this study are based on the development or redevelopment of three defined geographies within the Black Creek watershed and Vaughan Metropolitan Centre (VMC) areas. The applicable areas are illustrated in the Area-Specific Development Charges maps (Appendix C) and summarized in Table 3.
Table 3 Development Areas Included in the Study
Area Description Net Hectares
Immediately Affected Landowners (Map 1) 5.47 (ha removed from floodplain)
Vaughan Metropolitan Centre Areas Draining to Edgeley Pond (Map 2) 33.55 (developable ha)
Undeveloped Lands in Black Creek Drainage Shed (Map 3) 161.12 (developable ha)
HISTORIC SERVICE LEVELS
Since this area-specific development charges calculation deals with a “hard” service, namely stormwater and/or floodplain management, historic service level inventories are not required and Provincial, Conservation Authority and City environmental and safety requirements take precedence.
However, during the course of the allocation of project costs, consideration was given to enhancements that exceed the City’s base stormwater management requirements. In these instances, the costs associated with the enhancements were assigned to City-wide development charges or benefit to existing development depending on the characteristics of the enhanced feature.
GROWTH-RELATED CAPITAL PROGRAM
The growth-related capital program is based on a 2041 benefiting period with the assumption that all lands will develop/redevelop over the 2011 to 2041 period. A retroactive treatment of the ASDC by-law has been included in development agreements for projects that have proceeded prior to ASDC by-law enactment.
The City of Vaughan provided the project listing and cost estimates contained in the capital program. Many of the costs were prepared by specialized consultants retained by the City.
Table 4 summarizes the funding apportionments described in the prior sections of this report.
Table 5 details the capital program considered in the funding strategy which totals $96.6 million.
Table 6 shows the capital costs apportioned to each funding source.
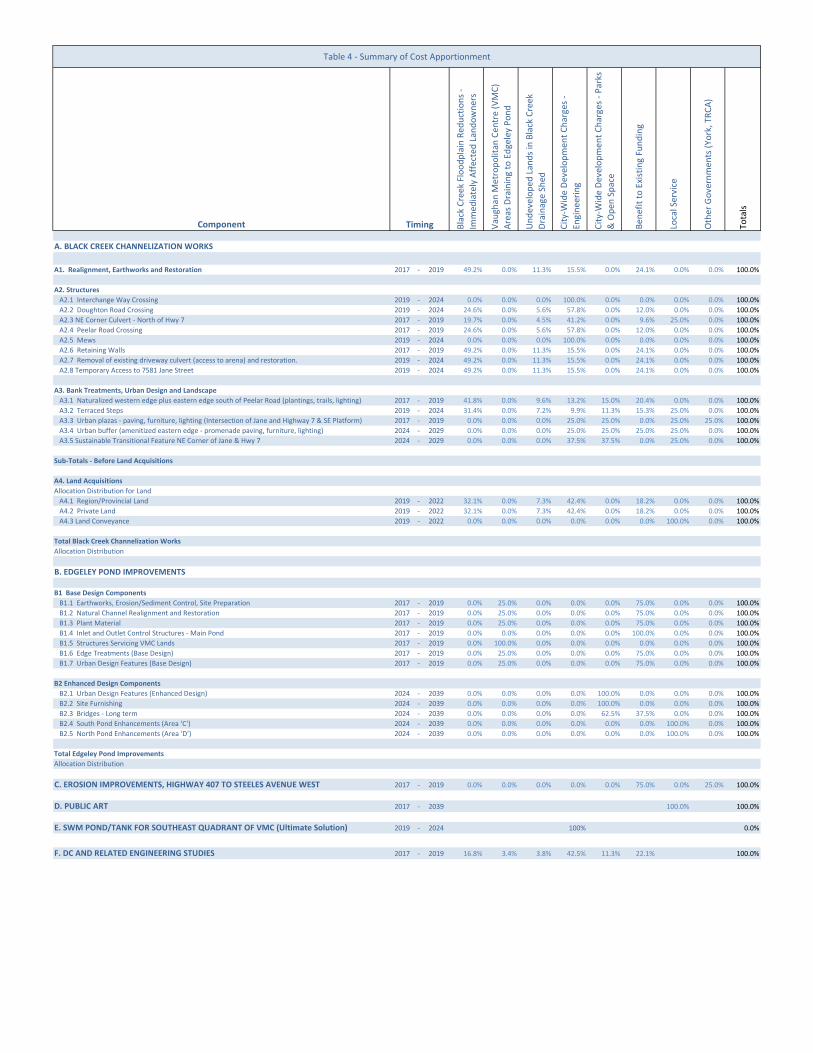
Table 4 ‐ Summary of Cost Apportionment
Component Timing Black Creek Floodplain Red
uctions ‐
Immed
iately Affected Landowners
Vaughan
Metropolitan
Cen
tre (VMC)
Areas Draining to Edgeley Pond
Undeveloped
Lands in Black Creek
Drainage Shed
City‐Wide Developmen
t Charges ‐
Engineering
City‐Wide Developmen
t Charges ‐ Parks
& Open
Space
Ben
efit to Existing Funding
Local Service
Other Governmen
ts (Yo
rk, TRCA)
Totals
A. BLACK CREEK CHANNELIZATION WORKS
A1. Realignment, Earthworks and Restoration 2017 ‐ 2019 49.2% 0.0% 11.3% 15.5% 0.0% 24.1% 0.0% 0.0% 100.0%
A2. Structures
A2.1 Interchange Way Crossing 2019 ‐ 2024 0.0% 0.0% 0.0% 100.0% 0.0% 0.0% 0.0% 0.0% 100.0%
A2.2 Doughton Road Crossing 2019 ‐ 2024 24.6% 0.0% 5.6% 57.8% 0.0% 12.0% 0.0% 0.0% 100.0%
A2.3 NE Corner Culvert ‐ North of Hwy 7 2017 ‐ 2019 19.7% 0.0% 4.5% 41.2% 0.0% 9.6% 25.0% 0.0% 100.0%
A2.4 Peelar Road Crossing 2017 ‐ 2019 24.6% 0.0% 5.6% 57.8% 0.0% 12.0% 0.0% 0.0% 100.0%
A2.5 Mews 2019 ‐ 2024 0.0% 0.0% 0.0% 100.0% 0.0% 0.0% 0.0% 0.0% 100.0%
A2.6 Retaining Walls 2017 ‐ 2019 49.2% 0.0% 11.3% 15.5% 0.0% 24.1% 0.0% 0.0% 100.0%
A2.7 Removal of existing driveway culvert (access to arena) and restoration. 2019 ‐ 2024 49.2% 0.0% 11.3% 15.5% 0.0% 24.1% 0.0% 0.0% 100.0%
A2.8 Temporary Access to 7581 Jane Street 2019 ‐ 2024 49.2% 0.0% 11.3% 15.5% 0.0% 24.1% 0.0% 0.0% 100.0%
A3. Bank Treatments, Urban Design and Landscape
A3.1 Naturalized western edge plus eastern edge south of Peelar Road (plantings, trails, lighting) 2017 ‐ 2019 41.8% 0.0% 9.6% 13.2% 15.0% 20.4% 0.0% 0.0% 100.0%
A3.2 Terraced Steps 2019 ‐ 2024 31.4% 0.0% 7.2% 9.9% 11.3% 15.3% 25.0% 0.0% 100.0%
A3.3 Urban plazas ‐ paving, furniture, lighting (Intersection of Jane and Highway 7 & SE Platform) 2017 ‐ 2019 0.0% 0.0% 0.0% 25.0% 25.0% 0.0% 25.0% 25.0% 100.0%
A3.4 Urban buffer (amenitized eastern edge ‐ promenade paving, furniture, lighting) 2024 ‐ 2029 0.0% 0.0% 0.0% 25.0% 25.0% 25.0% 25.0% 0.0% 100.0%
A3.5 Sustainable Transitional Feature NE Corner of Jane & Hwy 7 2024 ‐ 2029 0.0% 0.0% 0.0% 37.5% 37.5% 0.0% 25.0% 0.0% 100.0%
Sub‐Totals ‐ Before Land Acquisitions
A4. Land Acquisitions
Allocation Distribution for Land
A4.1 Region/Provincial Land 2019 ‐ 2022 32.1% 0.0% 7.3% 42.4% 0.0% 18.2% 0.0% 0.0% 100.0%
A4.2 Private Land 2019 ‐ 2022 32.1% 0.0% 7.3% 42.4% 0.0% 18.2% 0.0% 0.0% 100.0%
A4.3 Land Conveyance 2019 ‐ 2022 0.0% 0.0% 0.0% 0.0% 0.0% 0.0% 100.0% 0.0% 100.0%
Total Black Creek Channelization Works
Allocation Distribution
B. EDGELEY POND IMPROVEMENTS
B1 Base Design Components
B1.1 Earthworks, Erosion/Sediment Control, Site Preparation 2017 ‐ 2019 0.0% 25.0% 0.0% 0.0% 0.0% 75.0% 0.0% 0.0% 100.0%
B1.2 Natural Channel Realignment and Restoration 2017 ‐ 2019 0.0% 25.0% 0.0% 0.0% 0.0% 75.0% 0.0% 0.0% 100.0%
B1.3 Plant Material 2017 ‐ 2019 0.0% 25.0% 0.0% 0.0% 0.0% 75.0% 0.0% 0.0% 100.0%
B1.4 Inlet and Outlet Control Structures ‐ Main Pond 2017 ‐ 2019 0.0% 0.0% 0.0% 0.0% 0.0% 100.0% 0.0% 0.0% 100.0%
B1.5 Structures Servicing VMC Lands 2017 ‐ 2019 0.0% 100.0% 0.0% 0.0% 0.0% 0.0% 0.0% 0.0% 100.0%
B1.6 Edge Treatments (Base Design) 2017 ‐ 2019 0.0% 25.0% 0.0% 0.0% 0.0% 75.0% 0.0% 0.0% 100.0%
B1.7 Urban Design Features (Base Design) 2017 ‐ 2019 0.0% 25.0% 0.0% 0.0% 0.0% 75.0% 0.0% 0.0% 100.0%
B2 Enhanced Design Components
B2.1 Urban Design Features (Enhanced Design) 2024 ‐ 2039 0.0% 0.0% 0.0% 0.0% 100.0% 0.0% 0.0% 0.0% 100.0%
B2.2 Site Furnishing 2024 ‐ 2039 0.0% 0.0% 0.0% 0.0% 100.0% 0.0% 0.0% 0.0% 100.0%
B2.3 Bridges ‐ Long term 2024 ‐ 2039 0.0% 0.0% 0.0% 0.0% 62.5% 37.5% 0.0% 0.0% 100.0%
B2.4 South Pond Enhancements (Area 'C') 2024 ‐ 2039 0.0% 0.0% 0.0% 0.0% 0.0% 0.0% 100.0% 0.0% 100.0%
B2.5 North Pond Enhancements (Area 'D') 2024 ‐ 2039 0.0% 0.0% 0.0% 0.0% 0.0% 0.0% 100.0% 0.0% 100.0%
Total Edgeley Pond Improvements
Allocation Distribution
C. EROSION IMPROVEMENTS, HIGHWAY 407 TO STEELES AVENUE WEST 2017 ‐ 2019 0.0% 0.0% 0.0% 0.0% 0.0% 75.0% 0.0% 25.0% 100.0%
D. PUBLIC ART 2017 ‐ 2039 100.0% 100.0%
E. SWM POND/TANK FOR SOUTHEAST QUADRANT OF VMC (Ultimate Solution) 2019 ‐ 2024 100% 0.0%
F. DC AND RELATED ENGINEERING STUDIES 2017 ‐ 2019 16.8% 3.4% 3.8% 42.5% 11.3% 22.1% 100.0%

Table 5 ‐ Summary of Capital Costs
Component Timing Componen
t Cost Estim
ate
Componen
t‐Specific Contingency
Soft Cost and Constuction Contingency
City Admin Fee
Net HST
Totals
A. BLACK CREEK CHANNELIZATION WORKS
A1. Realignment, Earthworks and Restoration 2017 ‐ 2019 $6,500,000 30.0% 30.0% 3.0% 1.76% $11,513,686
A2. Structures
A2.1 Interchange Way Crossing 2019 ‐ 2024 $1,500,000 30.0% 30.0% 3.0% 1.76% $2,657,004
A2.2 Doughton Road Crossing 2019 ‐ 2024 $1,000,000 30.0% 30.0% 3.0% 1.76% $1,771,336
A2.3 NE Corner Culvert ‐ North of Hwy 7 2017 ‐ 2019 $3,000,000 30.0% 30.0% 3.0% 1.76% $5,314,009
A2.4 Peelar Road Crossing 2017 ‐ 2019 $1,000,000 30.0% 30.0% 3.0% 1.76% $1,771,336
A2.5 Mews 2019 ‐ 2024 $750,000 30.0% 30.0% 3.0% 1.76% $1,328,502
A2.6 Retaining Walls 2017 ‐ 2019 $200,000 30.0% 30.0% 3.0% 1.76% $354,267
A2.7 Removal of existing driveway culvert (access to arena) and restoration. 2019 ‐ 2024 $500,000 30.0% 30.0% 3.0% 1.76% $885,668
A2.8 Temporary Access to 7581 Jane Street 2019 ‐ 2024 $250,000 30.0% 30.0% 3.0% 1.76% $442,834
A3. Bank Treatments, Urban Design and Landscape
A3.1 Naturalized western edge plus eastern edge south of Peelar Road (plantings, trails, lighting) 2017 ‐ 2019 $975,000 30.0% 30.0% 3.0% 1.76% $1,727,053
A3.2 Terraced Steps 2019 ‐ 2024 $3,500,000 30.0% 30.0% 3.0% 1.76% $6,199,677
A3.3 Urban plazas ‐ paving, furniture, lighting (Intersection of Jane and Highway 7 & SE Platform) 2017 ‐ 2019 $3,000,000 30.0% 30.0% 3.0% 1.76% $5,314,009
A3.4 Urban buffer (amenitized eastern edge ‐ promenade paving, furniture, lighting) 2024 ‐ 2029 $2,000,000 30.0% 30.0% 3.0% 1.76% $3,542,673
A3.5 Sustainable Transitional Feature NE Corner of Jane & Hwy 7 2024 ‐ 2029 $2,000,000 30.0% 30.0% 3.0% 1.76% $3,542,673
Sub‐Totals ‐ Before Land Acquisitions $46,364,728
A4. Land Acquisitions
Allocation Distribution for Land
A4.1 Region/Provincial Land 2019 ‐ 2022 $2,452,427 25.0% 0.0% 3.0% 1.76% $3,213,072
A4.2 Private Land 2019 ‐ 2022 $2,080,873 25.0% 0.0% 3.0% 1.76% $2,726,276
A4.3 Land Conveyance 2019 ‐ 2022 $7,013,206 25.0% 0.0% 3.0% 1.76% $9,188,421
Total Black Creek Channelization Works $61,492,498
Allocation Distribution
B. EDGELEY POND IMPROVEMENTS
B1 Base Design Components
B1.1 Earthworks, Erosion/Sediment Control, Site Preparation 2017 ‐ 2019 $1,974,000 50.0% 10.0% 3.0% 1.76% $3,413,858
B1.2 Natural Channel Realignment and Restoration 2017 ‐ 2019 $750,000 20.0% 10.0% 3.0% 1.76% $1,037,647
B1.3 Plant Material 2017 ‐ 2019 $1,175,000 10.0% 10.0% 3.0% 1.76% $1,490,176
B1.4 Inlet and Outlet Control Structures ‐ Main Pond 2017 ‐ 2019 $610,000 20.0% 10.0% 3.0% 1.76% $843,953
B1.5 Structures Servicing VMC Lands 2017 ‐ 2019 $545,000 20.0% 10.0% 3.0% 1.76% $754,023
B1.6 Edge Treatments (Base Design) 2017 ‐ 2019 $1,050,000 10.0% 10.0% 3.0% 1.76% $1,331,647
B1.7 Urban Design Features (Base Design) 2017 ‐ 2019 $100,000 10.0% 10.0% 3.0% 1.76% $126,823
B2 Enhanced Design Components
B2.1 Urban Design Features (Enhanced Design) 2024 ‐ 2039 $642,000 10.0% 10.0% 3.0% 1.76% $814,207
B2.2 Site Furnishing 2024 ‐ 2039 $720,000 10.0% 10.0% 3.0% 1.76% $913,129
B2.3 Bridges ‐ Long term 2024 ‐ 2039 $2,950,000 20.0% 10.0% 3.0% 1.76% $4,081,410
B2.4 South Pond Enhancements (Area 'C') 2024 ‐ 2039 $447,500 10.0% 10.0% 3.0% 1.76% $567,535
B2.5 North Pond Enhancements (Area 'D') 2024 ‐ 2039 $507,500 10.0% 10.0% 3.0% 1.76% $643,629
Total Edgeley Pond Improvements $16,018,037
Allocation Distribution
C. EROSION IMPROVEMENTS, HIGHWAY 407 TO STEELES AVENUE WEST 2017 ‐ 2019 $1,600,000 25.0% 15.0% 3.0% 1.76% $2,410,694
D. PUBLIC ART 2017 ‐ 2039 $500,000 15.0% 15.0% 3.0% 1.76% $693,075
E. SWM POND/TANK FOR SOUTHEAST QUADRANT OF VMC (Ultimate Solution) 2019 ‐ 2024 $15,000,000 0.0% 0.0% 3.0% 1.76% $15,721,920
F. DC AND RELATED ENGINEERING STUDIES 2017 ‐ 2019 $250,000 0.0% 0.0% 3.0% 1.76% $262,032
TOTAL ALLOCATION OF COSTS $96,598,256
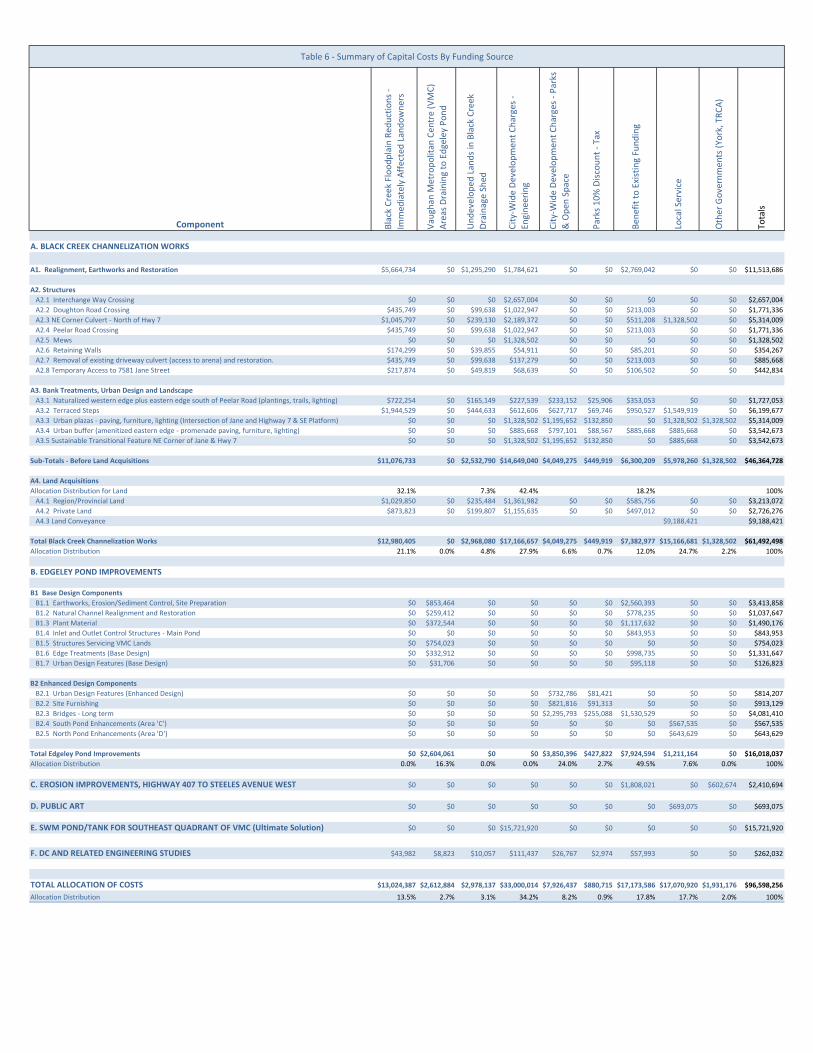
Table 6 ‐ Summary of Capital Costs By Funding Source
Component Black Creek Floodplain Red
uctions ‐
Immed
iately Affected Landowners
Vaughan
Metropolitan
Cen
tre (VMC)
Areas Draining to Edgeley Pond
Undeveloped
Lands in Black Creek
Drainage Shed
City‐Wide Developmen
t Charges ‐
Engineering
City‐Wide Developmen
t Charges ‐ Parks
& Open
Space
Parks 10% Discount ‐ Tax
Ben
efit to Existing Funding
Local Service
Other Governmen
ts (Yo
rk, TRCA)
Totals
A. BLACK CREEK CHANNELIZATION WORKS
A1. Realignment, Earthworks and Restoration $5,664,734 $0 $1,295,290 $1,784,621 $0 $0 $2,769,042 $0 $0 $11,513,686
A2. Structures
A2.1 Interchange Way Crossing $0 $0 $0 $2,657,004 $0 $0 $0 $0 $0 $2,657,004
A2.2 Doughton Road Crossing $435,749 $0 $99,638 $1,022,947 $0 $0 $213,003 $0 $0 $1,771,336
A2.3 NE Corner Culvert ‐ North of Hwy 7 $1,045,797 $0 $239,130 $2,189,372 $0 $0 $511,208 $1,328,502 $0 $5,314,009
A2.4 Peelar Road Crossing $435,749 $0 $99,638 $1,022,947 $0 $0 $213,003 $0 $0 $1,771,336
A2.5 Mews $0 $0 $0 $1,328,502 $0 $0 $0 $0 $0 $1,328,502
A2.6 Retaining Walls $174,299 $0 $39,855 $54,911 $0 $0 $85,201 $0 $0 $354,267
A2.7 Removal of existing driveway culvert (access to arena) and restoration. $435,749 $0 $99,638 $137,279 $0 $0 $213,003 $0 $0 $885,668
A2.8 Temporary Access to 7581 Jane Street $217,874 $0 $49,819 $68,639 $0 $0 $106,502 $0 $0 $442,834
A3. Bank Treatments, Urban Design and Landscape
A3.1 Naturalized western edge plus eastern edge south of Peelar Road (plantings, trails, lighting) $722,254 $0 $165,149 $227,539 $233,152 $25,906 $353,053 $0 $0 $1,727,053
A3.2 Terraced Steps $1,944,529 $0 $444,633 $612,606 $627,717 $69,746 $950,527 $1,549,919 $0 $6,199,677
A3.3 Urban plazas ‐ paving, furniture, lighting (Intersection of Jane and Highway 7 & SE Platform) $0 $0 $0 $1,328,502 $1,195,652 $132,850 $0 $1,328,502 $1,328,502 $5,314,009
A3.4 Urban buffer (amenitized eastern edge ‐ promenade paving, furniture, lighting) $0 $0 $0 $885,668 $797,101 $88,567 $885,668 $885,668 $0 $3,542,673
A3.5 Sustainable Transitional Feature NE Corner of Jane & Hwy 7 $0 $0 $0 $1,328,502 $1,195,652 $132,850 $0 $885,668 $0 $3,542,673
Sub‐Totals ‐ Before Land Acquisitions $11,076,733 $0 $2,532,790 $14,649,040 $4,049,275 $449,919 $6,300,209 $5,978,260 $1,328,502 $46,364,728
A4. Land Acquisitions
Allocation Distribution for Land 32.1% 7.3% 42.4% 18.2% 100%
A4.1 Region/Provincial Land $1,029,850 $0 $235,484 $1,361,982 $0 $0 $585,756 $0 $0 $3,213,072
A4.2 Private Land $873,823 $0 $199,807 $1,155,635 $0 $0 $497,012 $0 $0 $2,726,276
A4.3 Land Conveyance $9,188,421 $9,188,421
Total Black Creek Channelization Works $12,980,405 $0 $2,968,080 $17,166,657 $4,049,275 $449,919 $7,382,977 $15,166,681 $1,328,502 $61,492,498
Allocation Distribution 21.1% 0.0% 4.8% 27.9% 6.6% 0.7% 12.0% 24.7% 2.2% 100%
B. EDGELEY POND IMPROVEMENTS
B1 Base Design Components
B1.1 Earthworks, Erosion/Sediment Control, Site Preparation $0 $853,464 $0 $0 $0 $0 $2,560,393 $0 $0 $3,413,858
B1.2 Natural Channel Realignment and Restoration $0 $259,412 $0 $0 $0 $0 $778,235 $0 $0 $1,037,647
B1.3 Plant Material $0 $372,544 $0 $0 $0 $0 $1,117,632 $0 $0 $1,490,176
B1.4 Inlet and Outlet Control Structures ‐ Main Pond $0 $0 $0 $0 $0 $0 $843,953 $0 $0 $843,953
B1.5 Structures Servicing VMC Lands $0 $754,023 $0 $0 $0 $0 $0 $0 $0 $754,023
B1.6 Edge Treatments (Base Design) $0 $332,912 $0 $0 $0 $0 $998,735 $0 $0 $1,331,647
B1.7 Urban Design Features (Base Design) $0 $31,706 $0 $0 $0 $0 $95,118 $0 $0 $126,823
B2 Enhanced Design Components
B2.1 Urban Design Features (Enhanced Design) $0 $0 $0 $0 $732,786 $81,421 $0 $0 $0 $814,207
B2.2 Site Furnishing $0 $0 $0 $0 $821,816 $91,313 $0 $0 $0 $913,129
B2.3 Bridges ‐ Long term $0 $0 $0 $0 $2,295,793 $255,088 $1,530,529 $0 $0 $4,081,410
B2.4 South Pond Enhancements (Area 'C') $0 $0 $0 $0 $0 $0 $0 $567,535 $0 $567,535
B2.5 North Pond Enhancements (Area 'D') $0 $0 $0 $0 $0 $0 $0 $643,629 $0 $643,629
Total Edgeley Pond Improvements $0 $2,604,061 $0 $0 $3,850,396 $427,822 $7,924,594 $1,211,164 $0 $16,018,037
Allocation Distribution 0.0% 16.3% 0.0% 0.0% 24.0% 2.7% 49.5% 7.6% 0.0% 100%
C. EROSION IMPROVEMENTS, HIGHWAY 407 TO STEELES AVENUE WEST $0 $0 $0 $0 $0 $0 $1,808,021 $0 $602,674 $2,410,694
D. PUBLIC ART $0 $0 $0 $0 $0 $0 $0 $693,075 $0 $693,075
E. SWM POND/TANK FOR SOUTHEAST QUADRANT OF VMC (Ultimate Solution) $0 $0 $0 $15,721,920 $0 $0 $0 $0 $0 $15,721,920
F. DC AND RELATED ENGINEERING STUDIES $43,982 $8,823 $10,057 $111,437 $26,767 $2,974 $57,993 $0 $0 $262,032
TOTAL ALLOCATION OF COSTS $13,024,387 $2,612,884 $2,978,137 $33,000,014 $7,926,437 $880,715 $17,173,586 $17,070,920 $1,931,176 $96,598,256
Allocation Distribution 13.5% 2.7% 3.1% 34.2% 8.2% 0.9% 17.8% 17.7% 2.0% 100%
Allocation of Funding Sources Report & 04 May 2016 Development Charges Background Study
Page 23
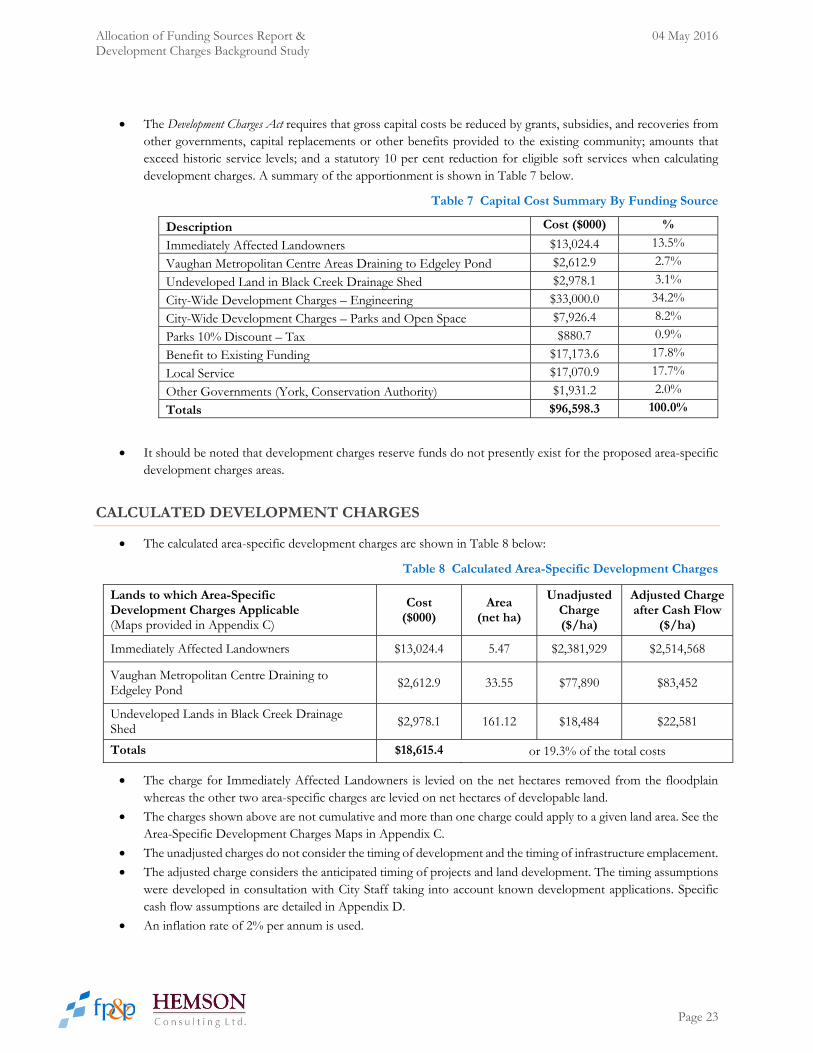
The Development Charges Act requires that gross capital costs be reduced by grants, subsidies, and recoveries from other governments, capital replacements or other benefits provided to the existing community; amounts that exceed historic service levels; and a statutory 10 per cent reduction for eligible soft services when calculating development charges. A summary of the apportionment is shown in Table 7 below.
Table 7 Capital Cost Summary By Funding Source
Description Cost ($000) %
Immediately Affected Landowners $13,024.4 13.5%
Vaughan Metropolitan Centre Areas Draining to Edgeley Pond $2,612.9 2.7%
Undeveloped Land in Black Creek Drainage Shed $2,978.1 3.1%
City-Wide Development Charges – Engineering $33,000.0 34.2%
City-Wide Development Charges – Parks and Open Space $7,926.4 8.2%
Parks 10% Discount – Tax $880.7 0.9%
Benefit to Existing Funding $17,173.6 17.8%
Local Service $17,070.9 17.7%
Other Governments (York, Conservation Authority) $1,931.2 2.0%
Totals $96,598.3 100.0%
It should be noted that development charges reserve funds do not presently exist for the proposed area-specific development charges areas.
CALCULATED DEVELOPMENT CHARGES
The calculated area-specific development charges are shown in Table 8 below:
Table 8 Calculated Area-Specific Development Charges
Lands to which Area-Specific Development Charges Applicable (Maps provided in Appendix C)
Cost ($000)
Area (net ha)
Unadjusted Charge ($/ha)
Adjusted Charge after Cash Flow
($/ha)
Immediately Affected Landowners $13,024.4 5.47 $2,381,929 $2,514,568
Vaughan Metropolitan Centre Draining to Edgeley Pond $2,612.9 33.55 $77,890 $83,452
Undeveloped Lands in Black Creek Drainage Shed
$2,978.1 161.12 $18,484 $22,581
Totals $18,615.4 or 19.3% of the total costs
The charge for Immediately Affected Landowners is levied on the net hectares removed from the floodplain whereas the other two area-specific charges are levied on net hectares of developable land.
The charges shown above are not cumulative and more than one charge could apply to a given land area. See the Area-Specific Development Charges Maps in Appendix C.
The unadjusted charges do not consider the timing of development and the timing of infrastructure emplacement.
The adjusted charge considers the anticipated timing of projects and land development. The timing assumptions were developed in consultation with City Staff taking into account known development applications. Specific cash flow assumptions are detailed in Appendix D.
An inflation rate of 2% per annum is used.
Allocation of Funding Sources Report & 04 May 2016 Development Charges Background Study
Page 24
It is assumed that the City would issue external debt for projects constructed between 2017 and 2020. A 20-year mortgage style debenture with a current Infrastructure Ontario fixed interest rate of 2.81% is assumed.
Projects emplaced after 2020 were assumed to be reserve funded with long-term interest rates of 5% applied to negative balances and 3.5% applied to positive balances.
ASSET MANAGEMENT PLAN
The recently enacted changes to the Development Charges Act4 require that development charges background studies include the preparation of an asset management plan that shall, inter alia, demonstrate that all assets whose capital costs are proposed to be funded under the development charges by-law are financially sustainable over their full life cycle. This section of the background study has been prepared in general accordance with provincial guidelines5 in relation to the preparation of an asset management plan and follows the overall organizational structure set out therein.
The planned intensification of development in the vicinity of, or otherwise benefitting from, the Black Creek Channelization Works and the Edgeley Pond Improvements is dependent on these works to reduce and contain the regulatory floodplain to within publicly-controlled lands as well as to ensure proper handling of stormwater. A considerable amount of investment is required to implement this infrastructure and it is important to ensure that the intended level of service offered by it can be sustained over its full life cycle, being the purpose of this asset management plan.
State of the Infrastructure
Asset Types
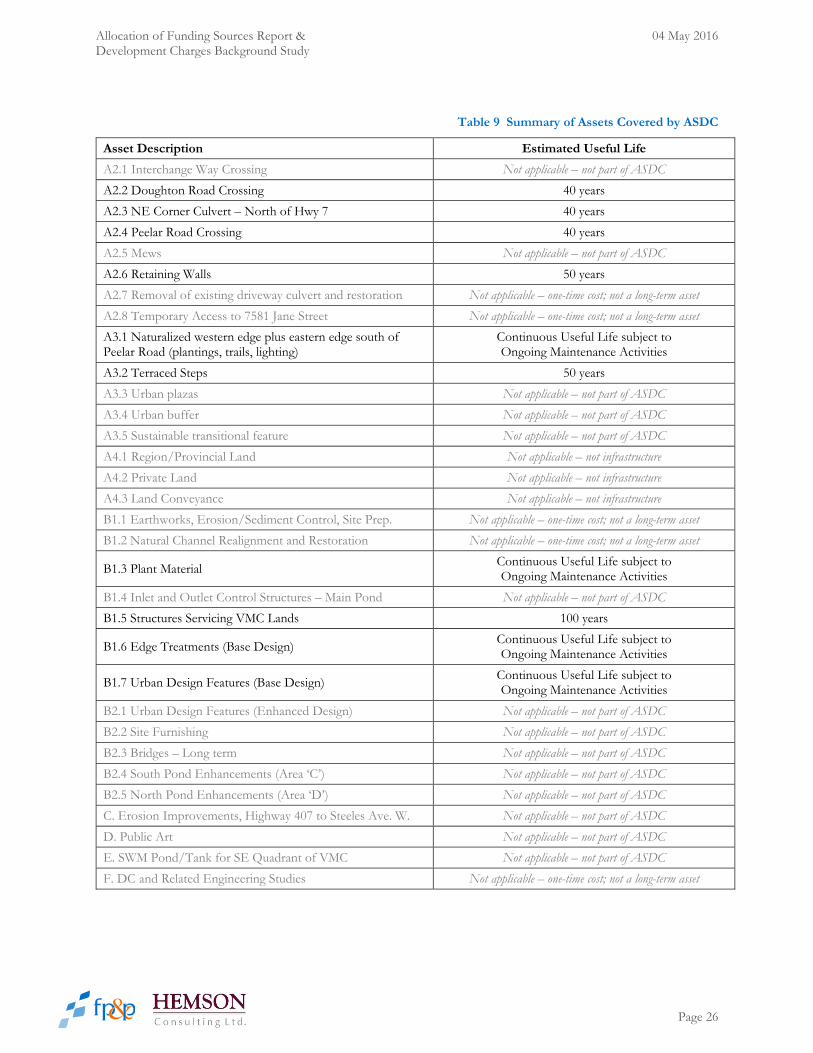
A summary of the future municipal-owned assets covered by this Area-Specific Development Charges (ASDC), along with their estimated useful lives, is presented in Table 9. For the purpose of consistency of presentation, each of the assets discussed throughout this report is identified, although not all assets are covered by the ASDC. The reasons for this may include the following:
Certain assets may be covered by other funding sources (e.g. City-Wide DCs, Local Service, etc.) that are or will be addressed through other municipal/public processes. In such cases, these are identified as “Not Applicable – not part of ASDC” in the table.
Some of the works identified herein represent one-time costs and are temporary in nature and, as such, there are no ongoing operation and maintenance costs, nor are there ultimate replacement costs related to them. These works may include matters such as grading, removals or works that are temporary in nature. These cases are identified as “Not Applicable – one-time cost; not a long-term asset” in the table.
Some of the costs identified herein do not pertain to infrastructure (e.g., land costs) and, similarly, there are no ongoing operation and maintenance costs, nor are there ultimate replacement costs, related to them. These cases are identified as “Not Applicable – not infrastructure” in the table.
Certain assets, particularly those relating to landscaping and related matters, are considered herein to not have a “useful life” in the traditional sense, but are rather considered to provide the requisite level of service on a continuous basis through regular (annual) maintenance activities. Accordingly, the “useful life” is identified in Table 9 as “Continuous Useful Life subject to Ongoing Maintenance Activities”, rather than in years.
4 Bill 73 (Chapter 26, Statutes of Ontario, 2015), An Act to amend the Development Charges Act, 1997 and the Planning Act. 5 Building Together: Guide for Municipal Asset Management Plans. Ontario Ministry of Infrastructure. 2012.
Allocation of Funding Sources Report & 04 May 2016 Development Charges Background Study
Page 25
It is noted that the cost estimates prepared for each of the projects’ components as identified in this study include the “lumping” of numerous individual elements. Accordingly, some assumptions are necessary when estimating future funding requirements, which are discussed in later sub-sections.
Allocation of Funding Sources Report & 04 May 2016 Development Charges Background Study
Page 26
Table 9 Summary of Assets Covered by ASDC
Asset Description Estimated Useful Life
A2.1 Interchange Way Crossing Not applicable – not part of ASDC
A2.2 Doughton Road Crossing 40 years
A2.3 NE Corner Culvert – North of Hwy 7 40 years
A2.4 Peelar Road Crossing 40 years
A2.5 Mews Not applicable – not part of ASDC
A2.6 Retaining Walls 50 years
A2.7 Removal of existing driveway culvert and restoration Not applicable – one-time cost; not a long-term asset
A2.8 Temporary Access to 7581 Jane Street Not applicable – one-time cost; not a long-term asset
A3.1 Naturalized western edge plus eastern edge south of Peelar Road (plantings, trails, lighting)
Continuous Useful Life subject to Ongoing Maintenance Activities
A3.2 Terraced Steps 50 years
A3.3 Urban plazas Not applicable – not part of ASDC
A3.4 Urban buffer Not applicable – not part of ASDC
A3.5 Sustainable transitional feature Not applicable – not part of ASDC
A4.1 Region/Provincial Land Not applicable – not infrastructure
A4.2 Private Land Not applicable – not infrastructure
A4.3 Land Conveyance Not applicable – not infrastructure
B1.1 Earthworks, Erosion/Sediment Control, Site Prep. Not applicable – one-time cost; not a long-term asset
B1.2 Natural Channel Realignment and Restoration Not applicable – one-time cost; not a long-term asset
B1.3 Plant Material Continuous Useful Life subject to Ongoing Maintenance Activities
B1.4 Inlet and Outlet Control Structures – Main Pond Not applicable – not part of ASDC
B1.5 Structures Servicing VMC Lands 100 years
B1.6 Edge Treatments (Base Design) Continuous Useful Life subject to Ongoing Maintenance Activities
B1.7 Urban Design Features (Base Design) Continuous Useful Life subject to Ongoing Maintenance Activities
B2.1 Urban Design Features (Enhanced Design) Not applicable – not part of ASDC
B2.2 Site Furnishing Not applicable – not part of ASDC
B2.3 Bridges – Long term Not applicable – not part of ASDC
B2.4 South Pond Enhancements (Area ‘C’) Not applicable – not part of ASDC
B2.5 North Pond Enhancements (Area ‘D’) Not applicable – not part of ASDC
C. Erosion Improvements, Highway 407 to Steeles Ave. W. Not applicable – not part of ASDC
D. Public Art Not applicable – not part of ASDC
E. SWM Pond/Tank for SE Quadrant of VMC Not applicable – not part of ASDC
F. DC and Related Engineering Studies Not applicable – one-time cost; not a long-term asset

Allocation of Funding Sources Report & 04 May 2016 Development Charges Background Study
Page 27
Asset Valuation
In terms of asset valuations, and given that the Area-Specific Development Charges covered by this study relate to new infrastructure that will be implemented, the estimated costs are used to represent initial (or soon-to-be-current) values. (Accordingly, neither depreciated historical costs nor replacement cost estimates are applicable.) Implementation costs at this time are estimates only and are thus assumed to be the actual implementation costs, on the understanding that these will vary. Further, the contingencies continue to be carried for this assessment to help mitigate the risk of possible changes in actual costs relative to estimated costs, and to lend conservatism to the analysis.
Asset Age Distribution & Condition
Given that the Area-Specific Development Charges covered by this study relate to new infrastructure that will be emplaced, this component of the evaluation is not applicable (but included here for the sake of completeness), since the infrastructure in question is accordingly at the beginning of its life cycle (i.e. new).
Monitoring & Updates
The City is expected to routinely monitor the condition and related characteristics of these assets, including value estimation, as part of its ongoing asset management program in relation to its complete stock of infrastructure.
Expected Levels of Service
For initial guidance on expected levels of service in relation to the infrastructure covered by this Area-Specific Development Charge, the following documents are referenced:
Black Creek Stormwater Optimization Study Municipal Class Environmental Assessment Master Plan Report (Phases 1 & 2). (AECOM, 2011)
Vaughan Metropolitan Centre Municipal Servicing Class Environmental Assessment Master Plan. (TMIG, 2012).
Transportation Master Plan. (November 2012)
Stormwater Management Master Plan Municipal Class Environmental Assessment. (Cole Engineering Group Ltd., June 2014)
Vaughan Engineering Design Criteria & Standard Drawings, 2016.
Black Creek Stormwater Optimization Study Municipal Class Environmental Assessment Master Plan Report (Phases 3 & 4). (TMIG, under preparation)
Vaughan Metropolitan Centre – Black Creek Renewal Municipal Class Environmental Assessment. (TMIG, under preparation)
Levels of service are expected to be reviewed from time to time as routine updates to the Master Plans are undertaken, in addition to any specific studies that relate to the infrastructure in question. Among the external issues that may affect the levels of service offered by the infrastructure, perhaps the impacts of climate change are among the most important for the City to monitor.
In addition, the National Water and Wastewater Benchmarking Initiative (NWWBI)6 and the Ontario Municipal CAO’s Benchmarking Initiative (OMBI)7 include data from numerous municipalities across Canada regarding a number of performance indicators such that the City can track its performance relative to its peers in this regard.
Asset Management Strategy
The purpose of the asset management strategy is to inform the activities that will enable the assets to provide the desired levels of service on a continuous basis and in a sustainable manner. For the sake of completeness, the following sub-
6 www.nationalbenchmarking.ca 7 www.ombi.ca

Allocation of Funding Sources Report & 04 May 2016 Development Charges Background Study
Page 28
sections identify the various components that are typically considered in such strategies, although only some are applied in this assessment.
Non-Infrastructure Solutions
Non-infrastructure solutions are actions or policies that can lower costs or extend asset life (e.g. better integrated infrastructure planning and land use planning, demand management, insurance, process optimization, managed failures, etc.). Given that the proposed infrastructure will be new and land use plans well established, the City should diligently control development applications within the affected watershed to ensure compliance with the design intent of the infrastructure. The City should also routinely monitor the condition as well as the actual performance of the infrastructure over time to better understand these matters and adapt as necessary to ensure the continued sustainability of the infrastructure and the levels of service it provides. For purposes of this work, costs associated with these activities are not explicitly assigned and are assumed to be adequately covered in other components of the life cycle costs. Subsequent asset management plans to be developed by the City for its overall stock of infrastructure will have the opportunity to explicitly consider this for the infrastructure.
Maintenance Activities
Maintenance activities, typically funded though operations, include regularly scheduled inspection and maintenance, or more significant repair and activities associated with unexpected events. For purposes of this work, it is assumed that annual maintenance activities will amount to 2% of the initial capital cost of the work over the life of assets with finite useful lives, and 4% of the initial capital cost for those with continuous useful lives. Subsequent asset management plans to be developed by the City for its overall stock of infrastructure will have the opportunity to refine this approach.
Renewal and Rehabilitation Activities
Renewal/rehabilitation activities include significant repairs designed to extend the life of the asset. For purposes of this exercise, it is assumed that the costs associated with these activities are included in other components of the life cycle costs. Subsequent asset management plans to be developed by the City for its overall stock of infrastructure will have the opportunity to explicitly consider this for the infrastructure in question.
Replacement Activities
Replacement activities are those that are expected to occur once an asset has reached the end of its useful life and renewal/rehabilitation is no longer an option. For purposes of this work, it is assumed that replacement occurs at the end of the useful life of each asset as identified in Table 9, and the estimated cost is equal to the initial capital cost, adjusted for inflation at a rate of 2% per annum. As noted above, certain assets associated with the infrastructure considered in the Area-Specific Development Charges considered herein, particularly those relating to landscaping and related matters, are considered to not have a “useful life” in the traditional sense, but are rather considered to provide the requisite levels of service on a continuous basis through regular (annual) maintenance activities.
Disposal Activities
This includes activities associated with disposing of an asset once it has reached the end of its useful life, or is otherwise no longer needed by the municipality. For purposes of this exercise, it is assumed that the costs associated with these activities are negligible and/or are otherwise included in other components of the life cycle costs. Subsequent asset management plans to be developed by the City for its overall stock of infrastructure will have the opportunity to explicitly consider this for the identified infrastructure.
Expansion Activities
This includes planned expansion activities (if necessary) required to extend services to previously unserviced areas, or expand services to meet growth demands. This is not applicable to the infrastructure considered in the Area-Specific Development Charges by-law covered herein.

Allocation of Funding Sources Report & 04 May 2016 Development Charges Background Study
Page 29
Procurement Methods
It is expected that traditional procurement practices employed by the City for the ongoing operation, maintenance, repair, rehabilitation and replacement of the infrastructure in question will continue to be appropriate given the passive nature of the infrastructure. This can be reviewed and re-considered in subsequent asset management plans developed by the City for its entire stock of infrastructure.
Overview of Risks
In terms of risks associated with the strategy (i.e. ways the plan could fail to generate the expected service levels) and any actions that could be taken in response, it is expected that ongoing monitoring and maintenance of the asset will be crucially important to mitigating any such risks. Routine inspections of the infrastructure will yield information on how well it is withstanding the hydraulic and other loadings it is being subjected to, and provide potential warning signs in relation to where it needs strengthening (e.g. erosion, removal of blockages, etc.).
Financing Strategy
For purposes of this work, the funding required for the long-term sustainability of the identified assets was established as a single, uniform annualized payment based on the assumptions noted above and summarized as follows:
Annual maintenance activities were assumed to require 4% of the initial capital costs for continuous projects and 2% for projects with finite useful lives;
The replacement cost of the asset at the end of its useful life (Table 9) was assumed to equate to the future value of the initial capital cost of the asset, adjusted for inflation at a rate of 2% per annum over that period; and
The uniform annualized cost was calculated as an equivalent annuity using the above assumptions and with a discount rate equating to the rate of inflation (i.e. 2%).
The results of this approach are presented in Table 10 and indicate that an annual funding requirement in the order of $1.06 million is required. This represents an increase in the City’s current tax levy of 0.61%, which is reasonable given the scale of infrastructure. This estimate should be viewed as conservative since it does not take into account future taxation revenue due to assessment growth, which is relatively certain in the City of Vaughan. Collection of these funds is expected to pay for annual maintenance activities, with surplus funds being allocated to reserves for future replacement or other significant activities. Further, it is noted that multiple sources of funding are expected to contribute to this, including general taxation as well as user fees. Accordingly, it is expected that these rates can be absorbed by the tax and user base and the assets will be financially sustainable.
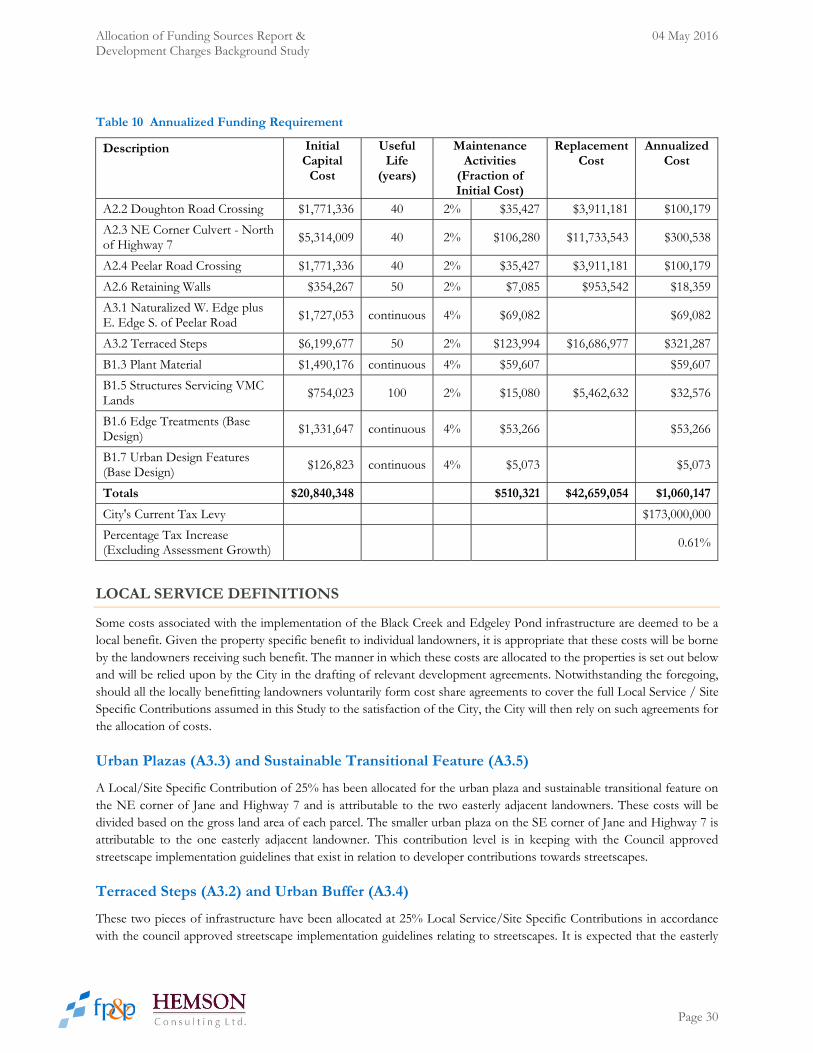
Allocation of Funding Sources Report & 04 May 2016 Development Charges Background Study
Page 30
Table 10 Annualized Funding Requirement
Description Initial Capital
Cost
Useful Life
(years)
Maintenance Activities
(Fraction of Initial Cost)
Replacement Cost
Annualized Cost
A2.2 Doughton Road Crossing $1,771,336 40 2% $35,427 $3,911,181 $100,179
A2.3 NE Corner Culvert - North of Highway 7 $5,314,009 40 2% $106,280 $11,733,543 $300,538
A2.4 Peelar Road Crossing $1,771,336 40 2% $35,427 $3,911,181 $100,179
A2.6 Retaining Walls $354,267 50 2% $7,085 $953,542 $18,359
A3.1 Naturalized W. Edge plus E. Edge S. of Peelar Road $1,727,053 continuous 4% $69,082 $69,082
A3.2 Terraced Steps $6,199,677 50 2% $123,994 $16,686,977 $321,287
B1.3 Plant Material $1,490,176 continuous 4% $59,607 $59,607
B1.5 Structures Servicing VMC Lands $754,023 100 2% $15,080 $5,462,632 $32,576
B1.6 Edge Treatments (Base Design) $1,331,647 continuous 4% $53,266 $53,266
B1.7 Urban Design Features (Base Design) $126,823 continuous 4% $5,073 $5,073
Totals $20,840,348 $510,321 $42,659,054 $1,060,147
City's Current Tax Levy $173,000,000
Percentage Tax Increase (Excluding Assessment Growth) 0.61%
LOCAL SERVICE DEFINITIONS
Some costs associated with the implementation of the Black Creek and Edgeley Pond infrastructure are deemed to be a local benefit. Given the property specific benefit to individual landowners, it is appropriate that these costs will be borne by the landowners receiving such benefit. The manner in which these costs are allocated to the properties is set out below and will be relied upon by the City in the drafting of relevant development agreements. Notwithstanding the foregoing, should all the locally benefitting landowners voluntarily form cost share agreements to cover the full Local Service / Site Specific Contributions assumed in this Study to the satisfaction of the City, the City will then rely on such agreements for the allocation of costs.
Urban Plazas (A3.3) and Sustainable Transitional Feature (A3.5)
A Local/Site Specific Contribution of 25% has been allocated for the urban plaza and sustainable transitional feature on the NE corner of Jane and Highway 7 and is attributable to the two easterly adjacent landowners. These costs will be divided based on the gross land area of each parcel. The smaller urban plaza on the SE corner of Jane and Highway 7 is attributable to the one easterly adjacent landowner. This contribution level is in keeping with the Council approved streetscape implementation guidelines that exist in relation to developer contributions towards streetscapes.
Terraced Steps (A3.2) and Urban Buffer (A3.4)
These two pieces of infrastructure have been allocated at 25% Local Service/Site Specific Contributions in accordance with the council approved streetscape implementation guidelines relating to streetscapes. It is expected that the easterly

Allocation of Funding Sources Report & 04 May 2016 Development Charges Background Study
Page 31
side of the Black Creek will act as a complimentary streetscape to Jane Street and will also be complimentary to the built form adjacent to the terraced steps and urban buffer and therefore it is appropriate to apply the streetscape methodology. Further allocation to individual landowners will be based on a per linear metre rate based on frontage to the Black Creek Channel. The current (2014 costing) estimate of this rate is $3,980/linear metre, but may increase or decrease based on final design and costing. The total frontage attributable to these features is currently estimated at 612 linear metres.
Land Conveyance (A4.3)
Lands in private ownership that are required to construct the interim and ultimate channel designs will be considered a 100% Local Service/Site Specific contribution from the land owner. These will be dedicated without compensation through development agreements at the time of development pursuant to sections 41 and 51 of the Planning Act. Depending upon the immediacy of need, some lands may be acquired at an earlier time at the discretion of the City (Project A4.2). Funding required for any such acquisitions has been considered through this strategy on a provisional basis.
NE Corner Culvert – North of Hwy 7 (A2.3) and the South Pond Enhancements (B2.4)
For the NE Corner Culvert – North of Hwy 7 project, the enclosed design is considered to provide a significant benefit to the adjacent landowners and therefore a contribution representing 25% of the cost is deemed to be the local share. For the South Pond Enhancements, the infrastructure is optional in nature and therefore considered to fully (100%) benefit the two easterly/southerly adjacent landowners. The costs will be divided based on the gross land area of each parcel.
North Pond Enhancements (B2.5)
This infrastructure is optional in nature and therefore is considered to be a 100% benefit to the northerly adjacent landowner.
Public Art (D)
Public art is considered to be a 100% Local/Site Specific contribution and will follow the guidelines and requirements outlined in the City’s Cultural Framework and Public Art Plan.
Works Cited
AECOM. (2011). Black Creek Stormwater Optimization Study Municipal Class Environmental Assessment Master Plan Report (Phases 1 & 2). Vaughan.
City of Vaughan. (2010, September 7). Official Plan 2010. Vaughan, Ontario, Canada.
Ontario. (2009). Development Charges Act, 1997 (as amended in 2009).
TMIG. (2012). Vaughan Metropolitan Centre Municipal Servicing Class Environmental Assessment Master Plan. Vaughan.
TMIG. (under preparation). Black Creek Stormwater Optimization Study Municipal Class Environmental Assessment Master Plan (Phases 3 & 4). Vaughan.
TMIG. (under preparation). Vaughan Metropolitan Centre - Black Creek Renewal Municipal Class Environmental Assessment. Vaughan.
Urban Strategies. (2013). Vaughan Metropolitan Centre Secondary Plan: Creating a New Downtown. Vaughan.
Allocation of Funding Sources Report & 04 May 2016 Development Charges Background Study
Appendix A Black Creek Channelization Works
Cost Estimate

VMC Black Creek Renewal August 13, 2014Cost Estimate for Preliminary Concept
Est. Quantity Unit Unit Price Subtotal Section Total
A Structure RemovalRemoval of existing driveway culvert (access to arena) and restoration 4 1 unit $500,000 $500,000
$500,000
SUB-TOTAL $500,000
CONTINGENCY (construction sequencing, environmental controls, flow management, etc.)3 30% $150,000HST 13% $84,500
TOTAL $700,000
Est. Quantity Unit Unit Price Subtotal Section Total
A Channel WorksRealignment, earthworks, restoration (Doughton to Interchange) 1 300 linear metres $5,000 $1,500,000
Earthworks, restoration (south of Interchange) 300 linear metres $5,000 $1,500,000Contingency (soil quality, dewatering, utility relocation, stabilization, etc.) 30% $900,000 $3,900,000
B Structures1 unit $1,500,000 $1,500,0001 unit $1,000,000 $1,000,000
1 unit $250,000 $250,000
300 linear metres $500 $150,000
Interchange Way crossing (15 m span bridge)Doughton Road crossing (Twin 7.3 m Conspan Arch) Temporary access to 7581 Jane Street 4
Retaining walls 4
Contingency (foundations, restoration, grading requirements, etc.) 30% $870,000 $3,770,000
C Bank treatments, urban design, and landscape2
Naturalized western edge south of Interchange, + eastern edge south of Peelar (plantings, trails, lighting) 600 linear metres $750 $450,000Urban plaza - paving, furniture, lighting (northeast corner of Jane and Hwy 7) 2000 square metres $750 $1,500,000Contingency (materials, extents, etc.) 30% $585,000 $2,535,000
SUB-TOTAL $10,205,000
CONTINGENCY (construction sequencing, environmental controls, flow management, etc.)3 30% $3,061,500HST 13% $1,724,645
TOTAL $15,000,000
Est. Quantity Unit Unit Price Subtotal Section Total
A Channel WorksRealignment, earthworks, restoration1 1300 linear metres $5,000 $6,500,000Contingency (soil quality, dewatering, utility relocation, stabilization, etc.) 30% $1,950,000 $8,450,000
B StructuresInterchange Way crossing (15 m span bridge) 1 unit $1,500,000 $1,500,000Doughton Road crossing (Twin 7.3 m Conspan Arch) 1 unit $1,000,000 $1,000,000NE Corner Culvert - north of Highway 7 1 unit $3,000,000 $3,000,000Peelar Road crossing (Twin 7.3 m Conspan Arch) 1 unit $1,000,000 $1,000,000Mews 3 unit $250,000 $750,000Retaining walls 100 linear metres $500 $50,000Contingency (foundations, restoration, grading requirements, etc.) 30% $2,190,000 $9,490,000
C Bank treatments, urban design, and landscape2
Naturalized western edge, + eastern edge south of Peelar (plantings, trails, lighting) 1300 linear metres $750 $975,000Terraced steps 700 linear metres $5,000 $3,500,000Urban plazas - paving, furniture, lighting 4000 square metres $750 $3,000,000Urban buffer (amenitized eastern edge - promenade paving, furniture, lighting) 4000 square metres $500 $2,000,000Contingency (materials, extents, etc.) 30% $2,842,500 $12,317,500
SUB-TOTAL $30,257,500
CONTINGENCY (construction sequencing, environmental controls, flow management, etc.)3 30% $9,077,250HST 13% $5,113,518
TOTAL $44,400,000
Notes:1 based on conventional greenfield channel realignment works, length extended to account for realigned section2 estimate does not include signature urban design features (water features, island, Black Mountain), Edgeley Pond structure modifications, parks, Jane St streetscape, or integrated SWM components3 confirmation of temporary re-routing requirements, coordination with development, etc. required during design4 noted costs do not build towards the ultimate concept, and must be added to the cost of the ultimate concept to determine total project cost
1 Immediate Improvements $650,000
2 Interim Improvements $520,000
SUB-TOTAL $1,170,000
CONTINGENCY (construction sequencing, environmental controls, flow management, etc.)3 30% $351,000
HST 13% $197,730
TOTAL ADDITIONAL COSTS BEYOND ULTIMATE CONCEPT $1,700,000
TMIG | Schollen & Company
Total
Immediate Improvements Plan
Interim Improvements Plan
Ultimate Improvements Plan
Summary of Costs that do not Build Toward Ultimate Concept

Allocation of Funding Sources Report & 04 May 2016 Development Charges Background Study
Appendix B Edgeley SWM Pond Improvements
Cost Estimate

VMC - Edgeley Pond Improvements Updated February 18, 2015Cost Estimate for Preliminary Concept TMIG | Schollen & Company
B1 Base Design ComponentsEst. Quantity Unit Unit Price Subtotal Section Total
B1.1 Earthworks, Erosion/Sediment Control, Site PrepCut and Fill 75000 cubic metres $15 $1,125,000Mobilization 1 lump sum $15,000 $15,000Sediment and Erosion Control 1600 linear metres $10 $16,000Construction Fence 1200 linear metres $15 $18,000Clearing and Grubbing, Topsoil Stripping 60000 square metres $10 $600,000Dewatering 1 $200,000 $200,000Contingency (soil quality/disposal, dewatering, utility relocation, etc.) 50% $987,000 $2,961,000
B1.2 Natural Channel Realignment and RestorationRealignment, restoration, stabilization 500 linear metres $1,500 $750,000Contingency (by-pass requirements, environmental controls, etc.) 20% $150,000 $900,000
B1.3 Plant MaterialSeeding, sod, shrubs, grasses, wildflowers 25000 square metres $25 $625,000Tree planting 800 each $500 $400,000Aquatic plantings 6000 each $25 $150,000Contingency (additional materials to satisfy agency requirements) 10% $117,500 $1,292,500
B1.4 Inlet and Outlet Control Structures - Main PondInlet control weir 1 each $10,000 $10,000Outlet structure (headwalls, major and minor system, fish passage) 1 each $600,000 $600,000Contingency (outlet structure complexity, integration with downstream system, pipe lengths and sizes) 20% $122,000 $732,000
B1.4 Structures Servicing VMC LandsWest inlet (aqueduct) 50 linear metres $1,500 $75,000West inlet (headwall, flow control) 1 each $30,000 $30,000East inlet (headwall, flow control) 1 each $30,000 $30,000East stormwater management tanks 200 linear metres $2,000 $400,000East stormwater polishing tank 1 each $10,000 $10,000Contingency (extents, sizing, structural) 20% $109,000 $654,000
B1.6 Edge TreatmentsShoreline Riverstone / Fieldstone Boulders (4m width surrounding lake) 3500 square metres $150 $525,000Concrete retaining wall (south side, standard concrete) 750 square metres $700 $525,000Contingency (extents, material selection) 10% $105,000 $1,155,000
B1.7 Urban Design Features (Base Design)Trail (3m wide asphalt, medium duty) 1000 square metres $100 $100,000Contingency (extents, material selection) 10% $10,000 $110,000
SUB-TOTAL $7,804,500CONTINGENCY (construction sequencing, environmental controls, flow management, etc.) 10% $780,450HST 13% $1,116,044
BASE DESIGN SUB-TOTAL $9,700,000
B2 Enhanced Design ComponentsEst. Quantity Unit Unit Price Subtotal Section Total
B2.1 Urban Design Features (Enhanced Design)Concrete steps 1 each $10,000 $10,000Concrete ramp 120 linear metres $100 $12,000Lockstone paving 5500 square metres $100 $550,000Concrete curbs 700 linear metres $100 $70,000Contingency (extents, material selection, structural) 10% $64,200 $706,200
B2.2 Site FurnishingBenches 40 each $3,000 $120,000Waste receptacles 40 each $3,000 $120,000Bike Racks 10 each $500 $5,000Interpretive signs 10 each $5,000 $50,000Lighting 50 each $5,000 $250,000Handrails 350 linear metres $500 $175,000Contingency (extents, material selection) 10% $72,000 $792,000
B2.3 BridgesBridge 1 25 linear metres $10,000 $250,000Bridge 2 70 linear metres $10,000 $700,000Bridge 3 100 linear metres $10,000 $1,000,000Bridge 4 50 linear metres $10,000 $500,000Bridge 5 50 linear metres $10,000 $500,000Contingency (extents, material selection, structural) 20% $590,000 $3,540,000
B2.4 South Pond Enhancements (Area 'C')Site prep, ESC, etc. 1 lump sum $10,000 $10,000Lockstone paving 2000 square metres $100 $200,000Concrete curbs 500 linear metres $100 $50,000Concrete retaining wall (incremental cost beyond base components, standard to patterned/textured) 750 square metres $250 $187,500Contingency (extents, material selection, structural) 10% $44,750 $492,250
B2.5 North Pond Enhancements (Area 'D')Site prep, ESC, etc. 1 lump sum $10,000 $10,000Fill 2000 cubic metres $15 $30,000Concrete retaining wall (patterned/textured) 400 square metres $950 $380,000Handrails 250 linear metres $350 $87,500Contingency (extents, material selection, structural) 10% $50,750 $558,250
SUB-TOTAL $6,088,700CONTINGENCY (construction sequencing, environmental controls, flow management, etc.) 10% $608,870HST 13% $870,684
ENHANCED DESIGN SUB-TOTAL $7,570,000
ULTIMATE DESIGN TOTAL (BASE + ENHANCED) $17,270,000
Notes: - 50% contingency applied to earthworks to account for risk associated with dewatering, material quality, disposal requirements etc.- 20% contingency applied to elements having uncertain structurual or technical requirements- 10% contingency applied to more flexible elements with respect to extents, material selection, or timing- 10% contingency applied to totals to account for risk associated with construction sequencing, approvals, integration with adjacent properties- Totals include HST as shown- Area 'C' is labeled as Area 'B' on the detailed Schollen breakdown- Area 'D' is labeled as Area 'A' on the detailed Schollen breakdown
Allocation of Funding Sources Report & 04 May 2016 Development Charges Background Study
Appendix C Area-Specific Development Charges Maps

Allocation of Funding Sources Report & 04 May 2016 Development Charges Background Study
Map 1: Black Creek Floodplain Reductions – Immediately Affected Landowners

Allocation of Funding Sources Report & 04 May 2016 Development Charges Background Study
Map 2: Vaughan Metropolitan Centre Lands Draining into Edgeley Pond

Allocation of Funding Sources Report & 04 May 2016 Development Charges Background Study
Map 3: Undeveloped Lands in the Black Creek Drainage Shed
Allocation of Funding Sources Report & 04 May 2016 Development Charges Background Study
Appendix D Cash Flow Assumptions
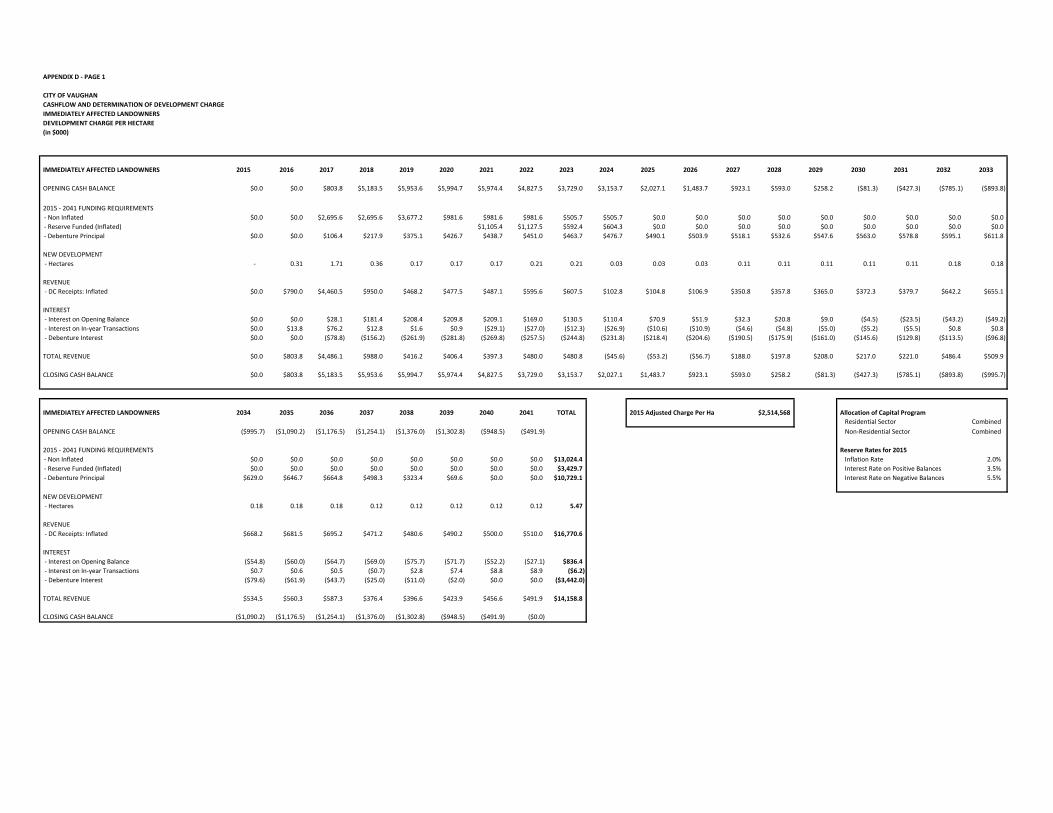
APPENDIX D ‐ PAGE 1
CITY OF VAUGHAN
CASHFLOW AND DETERMINATION OF DEVELOPMENT CHARGE
IMMEDIATELY AFFECTED LANDOWNERS
DEVELOPMENT CHARGE PER HECTARE
(in $000)
IMMEDIATELY AFFECTED LANDOWNERS 2015 2016 2017 2018 2019 2020 2021 2022 2023 2024 2025 2026 2027 2028 2029 2030 2031 2032 2033
OPENING CASH BALANCE $0.0 $0.0 $803.8 $5,183.5 $5,953.6 $5,994.7 $5,974.4 $4,827.5 $3,729.0 $3,153.7 $2,027.1 $1,483.7 $923.1 $593.0 $258.2 ($81.3) ($427.3) ($785.1) ($893.8)
2015 ‐ 2041 FUNDING REQUIREMENTS
‐ Non Inflated $0.0 $0.0 $2,695.6 $2,695.6 $3,677.2 $981.6 $981.6 $981.6 $505.7 $505.7 $0.0 $0.0 $0.0 $0.0 $0.0 $0.0 $0.0 $0.0 $0.0
‐ Reserve Funded (Inflated) $1,105.4 $1,127.5 $592.4 $604.3 $0.0 $0.0 $0.0 $0.0 $0.0 $0.0 $0.0 $0.0 $0.0
‐ Debenture Principal $0.0 $0.0 $106.4 $217.9 $375.1 $426.7 $438.7 $451.0 $463.7 $476.7 $490.1 $503.9 $518.1 $532.6 $547.6 $563.0 $578.8 $595.1 $611.8
NEW DEVELOPMENT
‐ Hectares ‐ 0.31 1.71 0.36 0.17 0.17 0.17 0.21 0.21 0.03 0.03 0.03 0.11 0.11 0.11 0.11 0.11 0.18 0.18
REVENUE
‐ DC Receipts: Inflated $0.0 $790.0 $4,460.5 $950.0 $468.2 $477.5 $487.1 $595.6 $607.5 $102.8 $104.8 $106.9 $350.8 $357.8 $365.0 $372.3 $379.7 $642.2 $655.1
INTEREST
‐ Interest on Opening Balance $0.0 $0.0 $28.1 $181.4 $208.4 $209.8 $209.1 $169.0 $130.5 $110.4 $70.9 $51.9 $32.3 $20.8 $9.0 ($4.5) ($23.5) ($43.2) ($49.2)
‐ Interest on In‐year Transactions $0.0 $13.8 $76.2 $12.8 $1.6 $0.9 ($29.1) ($27.0) ($12.3) ($26.9) ($10.6) ($10.9) ($4.6) ($4.8) ($5.0) ($5.2) ($5.5) $0.8 $0.8
‐ Debenture Interest $0.0 $0.0 ($78.8) ($156.2) ($261.9) ($281.8) ($269.8) ($257.5) ($244.8) ($231.8) ($218.4) ($204.6) ($190.5) ($175.9) ($161.0) ($145.6) ($129.8) ($113.5) ($96.8)
TOTAL REVENUE $0.0 $803.8 $4,486.1 $988.0 $416.2 $406.4 $397.3 $480.0 $480.8 ($45.6) ($53.2) ($56.7) $188.0 $197.8 $208.0 $217.0 $221.0 $486.4 $509.9
CLOSING CASH BALANCE $0.0 $803.8 $5,183.5 $5,953.6 $5,994.7 $5,974.4 $4,827.5 $3,729.0 $3,153.7 $2,027.1 $1,483.7 $923.1 $593.0 $258.2 ($81.3) ($427.3) ($785.1) ($893.8) ($995.7)
IMMEDIATELY AFFECTED LANDOWNERS 2034 2035 2036 2037 2038 2039 2040 2041 TOTAL 2015 Adjusted Charge Per Ha $2,514,568 Allocation of Capital Program
Residential Sector Combined
OPENING CASH BALANCE ($995.7) ($1,090.2) ($1,176.5) ($1,254.1) ($1,376.0) ($1,302.8) ($948.5) ($491.9) Non‐Residential Sector Combined
2015 ‐ 2041 FUNDING REQUIREMENTS Reserve Rates for 2015
‐ Non Inflated $0.0 $0.0 $0.0 $0.0 $0.0 $0.0 $0.0 $0.0 $13,024.4 Inflation Rate 2.0%
‐ Reserve Funded (Inflated) $0.0 $0.0 $0.0 $0.0 $0.0 $0.0 $0.0 $0.0 $3,429.7 Interest Rate on Positive Balances 3.5%
‐ Debenture Principal $629.0 $646.7 $664.8 $498.3 $323.4 $69.6 $0.0 $0.0 $10,729.1 Interest Rate on Negative Balances 5.5%
NEW DEVELOPMENT
‐ Hectares 0.18 0.18 0.18 0.12 0.12 0.12 0.12 0.12 5.47
REVENUE
‐ DC Receipts: Inflated $668.2 $681.5 $695.2 $471.2 $480.6 $490.2 $500.0 $510.0 $16,770.6
INTEREST
‐ Interest on Opening Balance ($54.8) ($60.0) ($64.7) ($69.0) ($75.7) ($71.7) ($52.2) ($27.1) $836.4
‐ Interest on In‐year Transactions $0.7 $0.6 $0.5 ($0.7) $2.8 $7.4 $8.8 $8.9 ($6.2)
‐ Debenture Interest ($79.6) ($61.9) ($43.7) ($25.0) ($11.0) ($2.0) $0.0 $0.0 ($3,442.0)
TOTAL REVENUE $534.5 $560.3 $587.3 $376.4 $396.6 $423.9 $456.6 $491.9 $14,158.8
CLOSING CASH BALANCE ($1,090.2) ($1,176.5) ($1,254.1) ($1,376.0) ($1,302.8) ($948.5) ($491.9) ($0.0)

APPENDIX D ‐ PAGE 2
CITY OF VAUGHAN
CASHFLOW AND DETERMINATION OF DEVELOPMENT CHARGE
VMC AREAS DRAINING TO EDGELEY POND
DEVELOPMENT CHARGE PER HECTARE
(in $000)
VMC AREAS DRAINING TO EDGELEY POND 2015 2016 2017 2018 2019 2020 2021 2022 2023 2024 2025 2026 2027 2028 2029 2030 2031 2032 2033
OPENING CASH BALANCE $0.0 $0.0 $0.0 $111.6 $168.8 $168.7 $172.1 $179.1 $321.4 $475.0 $640.5 $818.4 $1,009.3 $912.0 $812.3 $710.0 $605.3 $497.8 $365.5
2015 ‐ 2041 FUNDING REQUIREMENTS
‐ Non Inflated $0.0 $0.0 $871.0 $871.0 $871.0 $0.0 $0.0 $0.0 $0.0 $0.0 $0.0 $0.0 $0.0 $0.0 $0.0 $0.0 $0.0 $0.0 $0.0
‐ Reserve Funded (Inflated) $0.0 $0.0 $0.0 $0.0 $0.0 $0.0 $0.0 $0.0 $0.0 $0.0 $0.0 $0.0 $0.0
‐ Debenture Principal $0.0 $0.0 $34.4 $70.4 $108.2 $111.2 $114.3 $117.5 $120.8 $124.2 $127.7 $131.3 $135.0 $138.8 $142.7 $146.7 $150.8 $155.1 $159.4
NEW DEVELOPMENT
‐ Hectares ‐ ‐ 1.95 1.95 1.95 1.95 1.95 3.29 3.29 3.29 3.29 3.29 0.50 0.50 0.50 0.50 0.50 0.31 0.31
REVENUE
‐ DC Receipts: Inflated $0.0 $0.0 $169.1 $172.4 $175.9 $179.4 $183.0 $315.7 $322.0 $328.4 $335.0 $341.7 $52.8 $53.8 $54.9 $56.0 $57.1 $36.6 $37.3
INTEREST
‐ Interest on Opening Balance $0.0 $0.0 $0.0 $3.9 $5.9 $5.9 $6.0 $6.3 $11.2 $16.6 $22.4 $28.6 $35.3 $31.9 $28.4 $24.9 $21.2 $17.4 $12.8
‐ Interest on In‐year Transactions $0.0 $0.0 $2.4 $1.8 $1.2 $1.2 $1.2 $3.5 $3.5 $3.6 $3.6 $3.7 ($2.3) ($2.3) ($2.4) ($2.5) ($2.6) ($3.3) ($3.4)
‐ Debenture Interest $0.0 $0.0 ($25.5) ($50.5) ($75.0) ($71.9) ($68.8) ($65.6) ($62.3) ($58.9) ($55.4) ($51.8) ($48.1) ($44.3) ($40.4) ($36.4) ($32.3) ($28.1) ($23.7)
TOTAL REVENUE $0.0 $0.0 $146.0 $127.7 $108.0 $114.6 $121.4 $259.8 $274.5 $289.7 $305.6 $322.2 $37.7 $39.1 $40.5 $41.9 $43.4 $22.7 $23.0
CLOSING CASH BALANCE $0.0 $0.0 $111.6 $168.8 $168.7 $172.1 $179.1 $321.4 $475.0 $640.5 $818.4 $1,009.3 $912.0 $812.3 $710.0 $605.3 $497.8 $365.5 $229.1
VMC AREAS DRAINING TO EDGELEY POND 2034 2035 2036 2037 2038 2039 2040 2041 TOTAL
2015 Adjusted Charge Per Ha $83,452 Allocation of Capital Program
OPENING CASH BALANCE $229.1 $88.6 ($56.2) ($206.5) ($257.3) ($246.8) ($170.6) ($88.5) Residential Sector Combined
Non‐Residential Sector Combined
2015 ‐ 2041 FUNDING REQUIREMENTS
‐ Non Inflated $0.0 $0.0 $0.0 $0.0 $0.0 $0.0 $0.0 $0.0 $2,612.9 Reserve Rates for 2015
‐ Reserve Funded (Inflated) $0.0 $0.0 $0.0 $0.0 $0.0 $0.0 $0.0 $0.0 $0.0 Inflation Rate 2.0%
‐ Debenture Principal $163.9 $168.5 $173.2 $118.3 $60.6 $0.0 $0.0 $0.0 $2,773.2 Interest Rate on Positive Balances 3.5%
Interest Rate on Negative Balances 5.5%
NEW DEVELOPMENT
‐ Hectares 0.31 0.31 0.31 0.66 0.66 0.66 0.66 0.66 33.55
REVENUE
‐ DC Receipts: Inflated $38.1 $38.8 $39.6 $84.8 $86.5 $88.2 $90.0 $91.8 $3,428.8
INTEREST
‐ Interest on Opening Balance $8.0 $3.1 ($3.1) ($11.4) ($14.2) ($13.6) ($9.4) ($4.9) $233.6
‐ Interest on In‐year Transactions ($3.5) ($3.6) ($3.7) ($0.9) $0.5 $1.5 $1.6 $1.6 $0.4
‐ Debenture Interest ($19.2) ($14.6) ($9.9) ($5.0) ($1.7) $0.0 $0.0 $0.0 ($889.7)
TOTAL REVENUE $23.4 $23.7 $23.0 $67.5 $71.1 $76.2 $82.1 $88.5 $2,773.2
CLOSING CASH BALANCE $88.6 ($56.2) ($206.5) ($257.3) ($246.8) ($170.6) ($88.5) ($0.0)

APPENDIX D ‐ PAGE 3
CITY OF VAUGHAN
CASHFLOW AND DETERMINATION OF DEVELOPMENT CHARGE
UNDEVELOPED LANDS IN BLACK CREEK DRAINAGE SHED
DEVELOPMENT CHARGE PER HECTARE
(in $000)
UNDEVELOPED LANDS IN BLACK CREEK DRAINAGE SHED 2015 2016 2017 2018 2019 2020 2021 2022 2023 2024 2025 2026 2027 2028 2029 2030 2031 2032 2033
OPENING CASH BALANCE $0.0 $137.1 $281.8 $391.5 $464.3 $481.8 $486.3 $176.5 ($158.6) ($352.4) ($563.7) ($591.5) ($617.6) ($641.8) ($663.8) ($683.7) ($701.0) ($715.7) ($727.4)
2015 ‐ 2041 FUNDING REQUIREMENTS
‐ Non Inflated $0.0 $0.0 $616.4 $616.4 $840.8 $224.4 $224.4 $224.4 $115.6 $115.6 $0.0 $0.0 $0.0 $0.0 $0.0 $0.0 $0.0 $0.0 $0.0
‐ Reserve Funded (Inflated) $309.5 $326.5 $177.4 $187.2 $0.0 $0.0 $0.0 $0.0 $0.0 $0.0 $0.0 $0.0 $0.0
‐ Debenture Principal $0.0 $0.0 $24.3 $49.8 $85.8 $97.6 $100.3 $103.1 $106.0 $109.0 $112.1 $115.2 $118.5 $121.8 $125.2 $128.7 $132.3 $136.1 $139.9
NEW DEVELOPMENT
‐ Hectares 5.97 5.97 5.97 5.97 5.97 5.97 5.97 5.97 5.97 5.97 5.97 5.97 5.97 5.97 5.97 5.97 5.97 5.97 5.97
REVENUE
‐ DC Receipts: Inflated $134.8 $137.4 $140.2 $143.0 $145.9 $148.8 $151.8 $154.8 $157.9 $161.0 $164.3 $167.5 $170.9 $174.3 $177.8 $181.4 $185.0 $188.7 $192.5
INTEREST
‐ Interest on Opening Balance $0.0 $4.8 $9.9 $13.7 $16.2 $16.9 $17.0 $6.2 ($8.7) ($19.4) ($31.0) ($32.5) ($34.0) ($35.3) ($36.5) ($37.6) ($38.6) ($39.4) ($40.0)
‐ Interest on In‐year Transactions $2.4 $2.4 $2.0 $1.6 $1.1 $0.9 ($7.1) ($7.6) ($3.5) ($3.7) $0.9 $0.9 $0.9 $0.9 $0.9 $0.9 $0.9 $0.9 $0.9
‐ Debenture Interest $0.0 $0.0 ($18.0) ($35.7) ($59.9) ($64.4) ($61.7) ($58.9) ($56.0) ($53.0) ($49.9) ($46.8) ($43.6) ($40.2) ($36.8) ($33.3) ($29.7) ($25.9) ($22.1)
TOTAL REVENUE $137.1 $144.6 $134.1 $122.6 $103.3 $102.1 $100.0 $94.5 $89.7 $84.9 $84.2 $89.1 $94.3 $99.7 $105.4 $111.4 $117.7 $124.3 $131.2
CLOSING CASH BALANCE $137.1 $281.8 $391.5 $464.3 $481.8 $486.3 $176.5 ($158.6) ($352.4) ($563.7) ($591.5) ($617.6) ($641.8) ($663.8) ($683.7) ($701.0) ($715.7) ($727.4) ($736.1)
UNDEVELOPED LANDS IN BLACK CREEK DRAINAGE SHED 2034 2035 2036 2037 2038 2039 2040 2041 TOTAL 2015 Adjusted Charge Per Ha $22,581 Allocation of Capital Program
Residential Sector Combined
OPENING CASH BALANCE ($736.1) ($741.4) ($743.0) ($740.7) ($691.2) ($590.8) ($419.4) ($217.5) Non‐Residential Sector Combined
2015 ‐ 2041 FUNDING REQUIREMENTS Reserve Rates for 2015
‐ Non Inflated $0.0 $0.0 $0.0 $0.0 $0.0 $0.0 $0.0 $0.0 $2,978.1 Inflation Rate 2.0%
‐ Reserve Funded (Inflated) $0.0 $0.0 $0.0 $0.0 $0.0 $0.0 $0.0 $0.0 $1,000.6 Interest Rate on Positive Balances 3.5%
‐ Debenture Principal $143.8 $147.9 $152.0 $113.9 $73.9 $15.9 $0.0 $0.0 $2,453.3 Interest Rate on Negative Balances 5.5%
NEW DEVELOPMENT
‐ Hectares 5.97 5.97 5.97 5.97 5.97 5.97 5.97 5.97 161.12
REVENUE
‐ DC Receipts: Inflated $196.3 $200.2 $204.2 $208.3 $212.5 $216.7 $221.1 $225.5 $4,762.7
INTEREST
‐ Interest on Opening Balance ($40.5) ($40.8) ($40.9) ($40.7) ($38.0) ($32.5) ($23.1) ($12.0) ($536.7)
‐ Interest on In‐year Transactions $0.9 $0.9 $0.9 $1.7 $2.4 $3.5 $3.9 $3.9 $15.0
‐ Debenture Interest ($18.2) ($14.2) ($10.0) ($5.7) ($2.5) ($0.4) $0.0 $0.0 ($787.0)
TOTAL REVENUE $138.5 $146.2 $154.3 $163.5 $174.4 $187.3 $201.9 $217.5 $3,453.9
CLOSING CASH BALANCE ($741.4) ($743.0) ($740.7) ($691.2) ($590.8) ($419.4) ($217.5) $0.0