all the way q1 - maersk
TRANSCRIPT

A.P. Møller - Mærsk A/S | Interim Report | 5 May 2021Esplanaden 50, DK-1263 Copenhagen K / Registration no. 22756214
ALL THE WAY
2021Q1

Table of contents
The Interim Report for Q1 2021 of A.P. Møller - Mærsk A/S (further referred to as A.P. Moller - Maersk as the consolidated group of companies) has been prepared in accordance with IAS 34 ‘Interim Financial Reporting’ as issued by the International Accounting Standards Board (IASB) and adopted by the EU and additional Danish disclosure requirements for interim financial reporting of listed companies.
The interim consolidated financial statements have not been subject to audit or review.
Comparative figuresUnless otherwise stated, all figures in parentheses refer to the corresponding figures for the same period prior year.
Forward-looking statementsThe interim report contains forward-looking state-ments. Such statements are subject to risks and uncertainties as numerous factors, many of which are beyond the control of A.P. Moller - Maersk, may cause the actual development and results to dif-fer materially from expectations contained in the interim report.
Contacts for further informationSøren Skou, CEOTel. +45 3363 1901
Patrick Jany, CFOTel. +45 3363 3106
InvestorsStig Frederiksen, Head of Investor RelationsTel. +45 3363 3106
MediaSigne Wagner, Head of External RelationsTel. +45 3363 1901
The Q2 2021 Interim Report is expected tobe announced on 6 August 2021.
Webcast and dial-in informationA webcast relating to the Q1 2021 Interim Report will be held on 5 May 2021 at 11.00 (CET). Dial-in infor mation on investor.maersk.com.
Presentation material for the webcast will be available on the same page.
3 Directors’ Report3 Message from the CEO
4 Highlights Q1 2021
5 Summary financial information
6 Financial review
8 Guidance for 2021
9 Market update
10 Ocean
11 Logistics & Services
13 Terminals & Towage
15 Manufacturing & Others
16 Statement of the Board of Directors and the Executive Board
17 Financials 17 Condensed income statement
17 Condensed statement of comprehensive income
18 Condensed balance sheet at 31 March
19 Condensed cash flow statement
20 Condensed statement of changes in equity
21 Notes
25 Additional information25 Quarterly summary
26 Definition of terms
2 A.P. Moller - Maersk Interim Report Q1 | 5 May 2021

”A.P. Moller - Maersk delivered an exceptionally strong performance in Q1 2021 with a record profit for the quarter.
The high growth and profitability were driven by solid demand across Ocean, Logistics and Terminals, coupled with strong freight rates. Strong demand combined with bottle-necks, lack of capacity and equipment shortage in the global supply chains drove freight rates up significantly.
While the pandemic continues to impact the industry with a temporary economic upside coupled with significant operational challenges, our focus remains on the long-term transformation of our business, prioritising our customer’s wish for connected logistic services now and in the future. The need for a strong and accountable logistics partner was evident during the quarter and our integrator-strategy was validated by strong customer support and growth.
In Ocean, EBITDA almost tripled reflecting strong volumes, significant increases in freight rates and lower bunker fuel prices.
Logistics & Services continued its strong growth momentum, driven by organic growth and margin expansion, but also positive synergies from the acquisitions of Performance Team and KGH.
Also, Terminals & Towage had a strong performance, led by terminals with growth in volumes and higher storage income, given congestions in multiple locations. Those exceptional results came in a persisting difficult environment where countries are still contending with the effects of the pandemic. We have continued to dedicate significant efforts to the safety of our employees and contribute to the societies where we operate, this quarter with a particular emphasis in India.
Overall, I am very pleased with Q1. The strong profitability, with an EBIT of USD 3.1bn compared to USD 552m a year ago led to a ROIC of 15.7% and very strong free cash flow.
Given the strong start of the year and that we now expect the current dynamics to last into the fourth quarter, we have upgraded our guidance significantly. Further-more, we will accelerate the current share buy-back programme for it to be com-pleted as early as September and will subsequently launch a new, additional share buy-back programme of approximately USD 5bn over two years.”
Søren SkouChief Executive Officer A.P. Moller - Maersk
Message from the CEO
3 Message from the CEO Directors’ ReportA.P. Moller - Maersk Interim Report Q1 | 5 May 2021
Highlights Q1 2021
• A.P. Moller - Maersk delivered a record performance in Q1 2021 with a significant increase in revenue, EBITDA and EBIT. Profit for the period almost equalled the profit for the full year 2020. Business in Q1, particular in Ocean, was strongly impacted by the significant distortion of demand caused by the ongoing pandemic. Higher demand, mainly on headhaul volumes from exports out of Asia, triggered significant bottlenecks which in turn implied a sharp increase in short-term rates and contract renegotiations.
• Revenue increased by 30% or USD 2.9bn to USD 12.4bn (USD 9.6bn), driven by an increase in Ocean of 31% or USD 2.2bn, while revenue increased in Logistics & Services by 42% or USD 603m. In Terminals & Towage, revenue increased by 20% or USD 178m while Manufacturing & Others saw an increase of USD 47m.
• EBITDA increased to USD 4.0bn (USD 1.5bn), with 85% coming from Ocean and the EBITDA margin increased to 32.5% (15.9%).
• EBIT increased to USD 3.1bn (USD 552m) as a result of a significantly improved EBITDA. The EBIT margin increased to 24.9% (5.8%).
• EBIT in Ocean increased to USD 2.7bn (USD 348m), driven by higher volumes and increase in freight rates and bunker cost reductions from lower fuel prices in Q1 2021 versus Q1 2020.
• In Logistics & Services, EBIT increased to USD 139m (USD 29m) reflecting the significant growth in revenue driven by strong performance across all product offerings.
• In Terminals & Towage, gateway EBIT increased to USD 239m (USD 162m), driven by higher volumes, higher storage income due to congestions and the consolidation of Pipavav, India.
• Free cash flow increased to USD 2.4bn (USD 445m) due to disciplined CAPEX at USD 329m (USD 310m) and good cash flow from operating activities increasing to USD 3.4bn (USD 1.2bn), driven by the significant increase in EBITDA.
• Return on invested capital (ROIC), last twelve months, increased to 15.7% (3.8%), as earnings improved and invested capital declined slightly.
• Net interest-bearing debt decreased to USD 7.7bn (USD 9.2bn end of 2020), as free cash flow of USD 2.4bn was used for dividends of USD 889m and share buy-back of USD 333m, and a net decrease in lease liabilities of USD 324m. Excluding lease liabilities, the Group had a net cash position of USD 677m (debt of USD 485m end of 2020).
• Given the strong cash flow generation and balance sheet the Board of Directors has decided to accelerate the remaining share buy-back programme to be completed within the next five months.
• The guidance for the underlying EBITDA is expected to be in the range of USD 13.0bn-15.0bn and the underlying EBIT in the range of USD 9.0-11.0bn, as announced on 26 April 2021.
4 Highlights Q1 2021 Directors’ ReportA.P. Moller - Maersk Interim Report Q1 | 5 May 2021

Summary financial informationQ1 12M
Income statement 2021 2020 2020
Revenue 12,439 9,571 39,740
Profit before depreciation, amortisation and impairment losses, etc. (EBITDA) 4,039 1,521 8,226Depreciation, amortisation and impairment losses, net 1,025 1,073 4,541Gain on sale of non-current assets, etc., net 7 19 202Share of profit/loss in joint ventures and associated companies 76 85 299Profit/loss before financial items (EBIT) 3,097 552 4,186Financial items, net -230 -215 -879Profit/loss before tax 2,867 337 3,307Tax 150 128 407Profit/loss for the period 2,717 209 2,900A.P. Møller - Mærsk A/S’ share 2,697 197 2,850
Underlying profit/loss1 2,712 197 2,960
Balance sheet
Total assets 56,734 53,990 56,117Total equity 31,905 27,945 30,854Invested capital 39,829 39,977 40,121Net interest-bearing debt 7,746 11,978 9,232
Cash flow statement
Cash flow from operating activities 3,433 1,216 7,828Gross capital expenditure, excl. acquisitions and divestments (CAPEX) 329 310 1,322Cash flow from financing activities -2,534 -1,620 -5,618Free cash flow 2,372 445 4,648
Financial ratios
Revenue growth 30.0% 0.3% 2.2%EBITDA margin 32.5% 15.9% 20.7%EBIT margin 24.9% 5.8% 10.5%Cash conversion 85% 80% 95%Return on invested capital after tax (ROIC) (last twelve months) 15.7% 3.8% 9.4%Equity ratio 56.2% 51.8% 55.0%Underlying ROIC1 (last twelve months) 15.9% 3.8% 9.6%Underlying EBITDA1 4,039 1,521 8,324Underlying EBITDA margin1 32.5% 15.9% 20.9%Underlying EBIT1 3,092 540 4,231Underlying EBIT margin1 24.9% 5.6% 10.6%
Stock market ratios
Earnings per share – USD 139 10 145Diluted earnings per share – USD 139 10 145Cash flow from operating activities per share, USD 178 61 399Share price (B share), end of period, DKK 14,735 6,092 13,595Share price (B share), end of period, USD 2,324 894 2,246Total market capitalisation, end of period, USD 43,243 17,002 41,957
1 Underlying profit/loss is profit/loss for the period from continuing operations adjusted for net gains/losses from sale of non-current assets etc. and net impairment losses as well as transaction, restructuring and integration costs related to major transactions. The adjustments are net of tax and include A.P. Moller - Maersk’s share of mentioned items in joint ventures and associated companies.
5
Amounts in USD million
Summary financial information Directors’ ReportA.P. Moller - Maersk Interim Report Q1 | 5 May 2021

Financial review Q1 2021Revenue increased by USD 2.9bn to USD 12.4bn (USD 9.6bn), with an increase in Ocean of USD 2.2bn and USD 603m in Logistics & Services.
EBITDA increased to USD 4.0bn (USD 1.5bn), primarily related to Ocean with an EBITDA increase to USD 3.4bn, driven by the increased freight revenue due to signifi-cantly higher volumes and freight rates in light of result-ing bottlenecks and equipment shortages, and bunker cost reductions mainly from lower fuel prices. In Logistics & Services, EBITDA increased by USD 137m to USD 205m (USD 68m), due to strong performance across all product offerings. In gateway terminals, EBITDA increased by USD 110m, driven by higher volumes, higher storage income due to congestions and the consolidation of Pipavav, India.
EBIT of USD 3.1bn (USD 552m) was positively impacted by the improved EBITDA and marginally by lower depreciations as a result of reassessing the useful life-time of container assets. The EBIT margin increased to 24.9% (5.8%).
Financial expenses, net, amounted to USD 230m (USD 215m), positively impacted by lower gross debt, more than offset by negative foreign exchange rate impacts.
Tax increased to USD 150m (USD 128m), primarily due to improved financial performance.
The underlying profit was USD 2.7bn (USD 197m).
Cash flow from operating activities was USD 3.4bn (USD 1.2bn), positively impacted by an increase in EBITDA of USD 2.5bn, partly offset by a negative change in net working capital of USD 459m, leading to a cash conversion of 85% (80%).
Gross capital expenditure (CAPEX) was USD 329m (USD 310m), mainly unchanged with higher investments in Ocean and Manufacturing & Others, mostly offset by lower investments in Terminals & Towage.
Financial reviewFree cash flow was USD 2.4bn (USD 445m), positively impacted by higher cash flow from operating activities, partly offset by increased lease payments mainly due to lease buyouts.
Cash flow from borrowings was negative by USD 483m (negative USD 385m), due to repayments and prepayments of bonds and loans given the strong cash flow generation and high cash balance.
Contractual capital commitments totalled USD 1.8bn (USD 1.7bn at year-end 2020), of which USD 1.3bn is related to commitments towards terminal concession grantors. Strong commitment to capital discipline and free cash flow genera-tion continues to be a key strategic focus.
The liquidity reserve increased to USD 11.4bn (USD 11.0bn at year-end 2020), and was composed of liquid funds and term deposits of USD 5.4bn excluding restricted cash (USD 4.9bn at year-end 2020), and undrawn revolving credit facilities of USD 6.0bn (USD 6.2bn at year-end 2020).
Capital structure and credit ratingNet interest-bearing debt decreased to USD 7.7bn (USD 9.2bn at year-end 2020), as free cash flow of USD 2.4bn for the period was partly offset by dividend payments of USD 889m, share buy-back of USD 333m and a net decrease in lease liabilities of USD 324m. Excluding lease liabilities, the Group had a net cash position of USD 677m (debt of USD 485m at year-end 2020).
A.P. Moller - Maersk remains investment grade-rated and holds a Baa2 Stable outlook (an upgrade from Baa3 Positive outlook) rating from Moody’s and a BBB (positive) rating from Standard & Poor’s.
DividendThe ordinary dividend of DKK 330 per A.P. Møller - Mærsk A/S share of nominally DKK 1,000 (USD 1.1bn, net of withholding tax) declared at the Annual General Meeting on 23 March 2021, was paid on 26 March 2021.
Highlights Q1USD million Revenue EBITDA EBIT CAPEX
2021 2020 2021 2020 2021 2020 2021 2020
Ocean 9,478 7,230 3,444 1,175 2,700 348 193 175Logistics & Services 2,045 1,442 205 68 139 29 21 23Terminals & Towage 1,089 911 380 276 272 197 91 103Manufacturing & Others 342 295 32 43 7 18 27 8Unallocated activities, eliminations, etc. -515 -307 -22 -41 -21 -40 -3 1A.P. Moller - Maersk consolidated 12,439 9,571 4,039 1,521 3,097 552 329 310
6 Financial review Q1 2021 Directors’ ReportA.P. Moller - Maersk Interim Report Q1 | 5 May 2021

Share buy-backThe present share buy-back programme initiated in Novem-ber 2020 of DKK 10bn (around USD 1.6bn), was initially planned to run from December 2020 over a period of up to 15 months. It will now be accelerated to be completed as early as September 2021.
During Q1, A.P. Moller - Maersk bought back 30,451 A shares and 121,805 B shares worth DKK 2,1bn (around USD 333m).
At 31 March 2021, A.P. Moller - Maersk owns a total of 149,627 A shares and 620,548 B shares as treasury shares, corresponding to 3.84% of the share capital. On 23 March 2021, the Annual General Assembly approved that the Board of Directors can decide to acquire own shares up to a maximum of 15% of the share capital.
Transformation metricsA.P. Moller - Maersk is accelerating the transformation towards becoming the global integrator of container logis-tics, and four metrics are tracked besides the overall ROIC target as leading indicators for the strategic progress over the next five years (see table). Specific targets will be intro-duced at the Capital Markets Day on 11 May 2021.
Value creation is measured by the return on invested capital (ROIC), last twelve months, and increased to 15.7% (3.8%), as earnings improved and invested capital decreased slightly. The underlying return on invested capital increased to 15.9% (3.8%).
Growing the business is measured by the focus on growth in organic revenue in Logistics & Services and gateway terminals. Revenue increased by USD 574m to USD 2.8bn.
Profitability in Logistics & Services is measured by EBITA, which increased by 400% to USD 150m.
Progress in the commercial synergies from the revenue growth between Logistics & Services and the top 200 Ocean customers was USD 893m.
Progress, on the commercial digitalisation and product offering in Ocean, is in the first phase measured via Maersk SPOT volume share of total short-term volumes, which was 36.2% in Q1. The percentage is based on the last four weeks of the reported period for all brands.
Change in managementIt was announced that Navneet Kapoor, Chief Technology & Information Officer (CTIO), was appointed member of the Executive Board as per 1 April 2021.
The Executive Board consists of Søren Skou, Patrick Jany, Vincent Clerc, Morten H. Engelstoft, Henriette Hallberg Thygesen and Navneet Kapoor.
Five-year transformation metricsQ1 12M
2021 2020 2020
Value creationReturn on Invested Capital (ROIC) 1 15.7% 3.8% 9.4%
GrowthOrganic revenue in Logistics & Services and gateway terminals, USDm 2,756 2,182 9,624
ProfitabilityEBITA in Logistics & Services, USDm 150 30 289
Commercial synergiesLogistics & Services revenue with top 200 Ocean customers, USDm 893 531 2,647
Commercial digitalisation and product offering in Ocean 2Maersk SPOT volume share of total short-term volumes 36.2% 15.0% 36.1%
1 Last twelve months2 Maersk SPOT volume share of total short-term volumes of all brands is based on the last four weeks of the period shown.
7 Financial review Q1 2021 Directors’ ReportA.P. Moller - Maersk Interim Report Q1 | 5 May 2021

Guidance for 2021Given the Q1 2021 result and the revised expectations that the exceptional market situation will continue well into the Q4 2021 - vs. the previous expectations that the situation would continue in Q1 and normalise thereafter – the full-year guidance has been revised upwards on 26 April 2021 to:
• Underlying EBITDA in the range of USD 13.0-15.0bn (previously USD 8.5-10.5bn) com pared to USD 8.3bn in 2020
• Underlying EBIT in the range of USD 9.0-11.0bn (previ-ously USD 4.3-6.3bn) compared to USD 4.2bn in 2020
• Free cash flow (FCF) of minimum USD 7.0bn (previously above USD 3.5bn) compared to USD 4.6bn in 2020.
Ocean is still expected to grow in line with global con-tainer demand, which is now expected to grow 5-7% in 2021 (previously 3-5% in 2021), primarily driven by the export volumes out of China to the USA.
For the years 2021-2022, the accumulated CAPEX is now expected to be around USD 7.0bn (previously USD 4.5-5.5bn).
Sensitivity guidance
Financial performance for A.P. Moller - Maersk for 2021 depends on several factors and is subject to uncertainties related to COVID-19, bunker fuel prices and freight rates, given the uncertain macroeconomic conditions.
All else being equal, the sensitivities for 2021 for four key assumptions are listed in the table below:
Factors Change Effect on EBIT(midpoint of guidance)
Rest of year
Container freight rate +/- 100 USD/FFE +/- USD 1.0bnContainer freight volume +/- 100,000 FFE +/- USD 0.1bnBunker price (net of expected BAF coverage) +/- 100 USD/tonne +/- USD 0.3bnForeign exchange rate (net of hedges) +/- 10% change in USD +/- USD 0.1bn
Underlying EBITDA is earnings before interest, taxes, depreciation and amortisation adjusted for restructuring and integration costs.
Underlying EBIT is operating profit before interest and taxes adjusted for restructuring and integration costs, net gains/losses from sale of non-current assets and net impairment losses.
8 Full-year guidance for 2021 Directors’ ReportA.P. Moller - Maersk Interim Report Q1 | 5 May 2021
Market updateThe global economy travelled a bumpy road in the first part of 2021 as a direct consequence of the COVID-19 pandemic. North America, Europe and Latin America continued to be the regions worst affected, but vaccination programmes are now underway in a significant number of countries. How-ever, the pace of roll-out differs significantly across coun-tries, and vaccination programmes are only about to start in many emerging and developing countries.
The US economic recovery remains on track on the back of its vaccine roll-out and the USD 1.9 trillion fiscal package. Moreover, retail sales recovered in Q1, and the job market continues to improve.
The European economy remained weak in Q1 2021, after slowing in Q4 2020. For some emerging markets, the rise in USD interest rates has led to increased capital outflows which together with rising COVID-19 cases could hinder their recovery.
Dynamics in economic activity, trade and demand patterns will, for the remaining part of 2021, also be highly depend-ent on the further development of the COVID-19 pandemic.
Global container volumes increased by around 8.4% in Q1 2021, showing a stronger momentum than expected earlier in the year. Significant public stimulus packages, combined with the fact that country lockdowns weighed more heavily on services consumption than on goods consumption, sup-ported container trade. Above all, North American imports from the Far East rose 40% in Q1, while European imports from the Far East increased 14% given the low comparison basis in Q1 2020, as countries where entering lockdowns. Looking ahead, global container demand is projected to increase by 5-7% in 2021 up from negative 1.8% in 2020.
At the end of Q1, the nominal global container fleet stood at 24.1m TEU, an increase of 3.6% in Q1 2020. Idled fleet declined significantly in Q1 2021 (to 1.0% at the end of the quarter) compared to Q1 2020, as the industry adjusted to higher demand, driving up effective supply growth. Con-sequently, the demand-supply loosened in Q1 2021 com-pared to Q4 2020, which partly mirrors normal season-ality. Freight and charter rates were nevertheless per-sistently high, largely reflecting bottlenecks in domestic logistics and scarce container equipment. Freight rates out of China, as measured by the China Composite Freight Index (CCFI), increased by 111% in Q1 compared to the same quarter last year.
The other transport and logistics categories were in broad terms impacted by the same dynamics and market drivers that steered the ocean industry, above all the COVID-19 pandemic.
According to Drewry, port throughput volumes increased by 8.6% in Q1 2021, mainly driven by North America and Asia. Many ports were impacted by supply disruptions from the blockage for six days of the Suez Canal in March as well as bottlenecks due to domestic logistics and scarce availa-bility of empty containers following extraordinary demand in the USA. In line with projections for ocean trade, global port throughput growth is expected to grow significantly in 2021.
Other Logistics & Services categories experienced continued strong growth, such as E-commerce, with sales increasing 35% in the USA and 38% in the Euro area in Q1 (year-on-year), following extraordinary demand for online sales of elec-tronics and household products. USA E-commerce sales now represent 16% of total US retail sales. The airfreight industry was challenged by supply constraints as passenger freight remained very low, capping the available cargo freight sup-ply. Air freight volumes increased around 8% (y/y) in Q1 (January and February average), according to IATA.
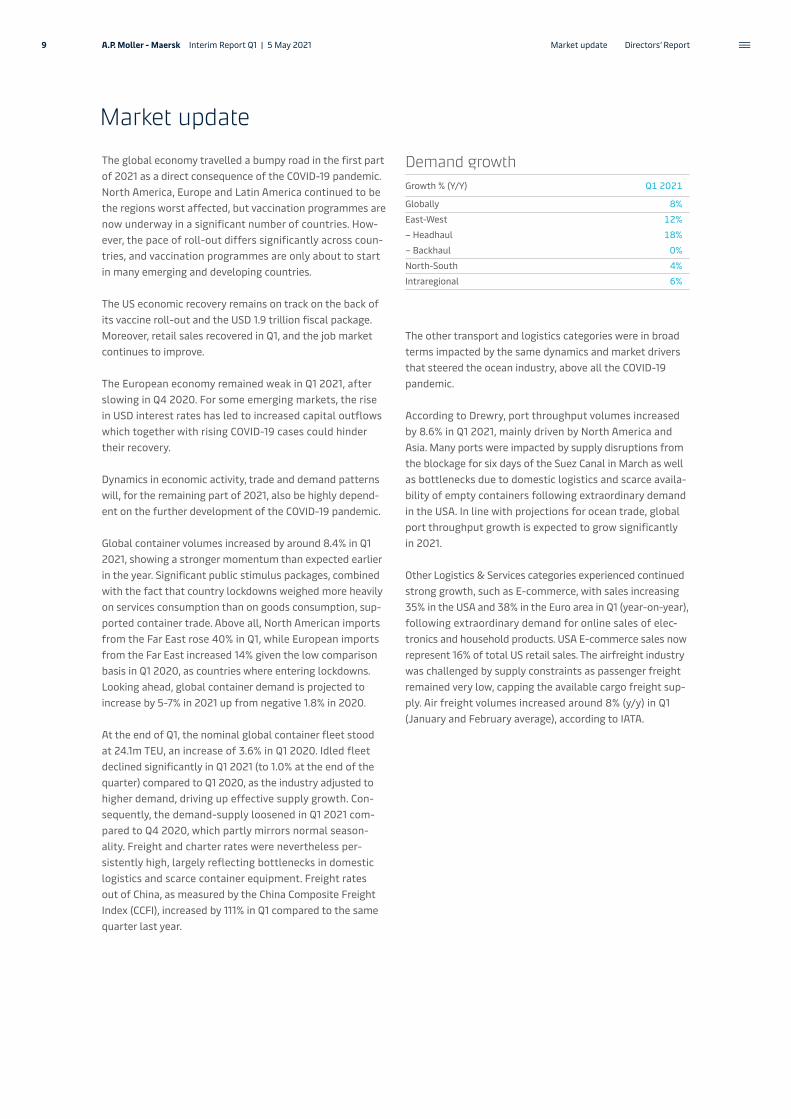
Demand growthGrowth % (Y/Y) Q1 2021
Globally 8%East-West 12%– Headhaul 18%– Backhaul 0%North-South 4%Intraregional 6%
9 Market update Directors’ ReportA.P. Moller - Maersk Interim Report Q1 | 5 May 2021
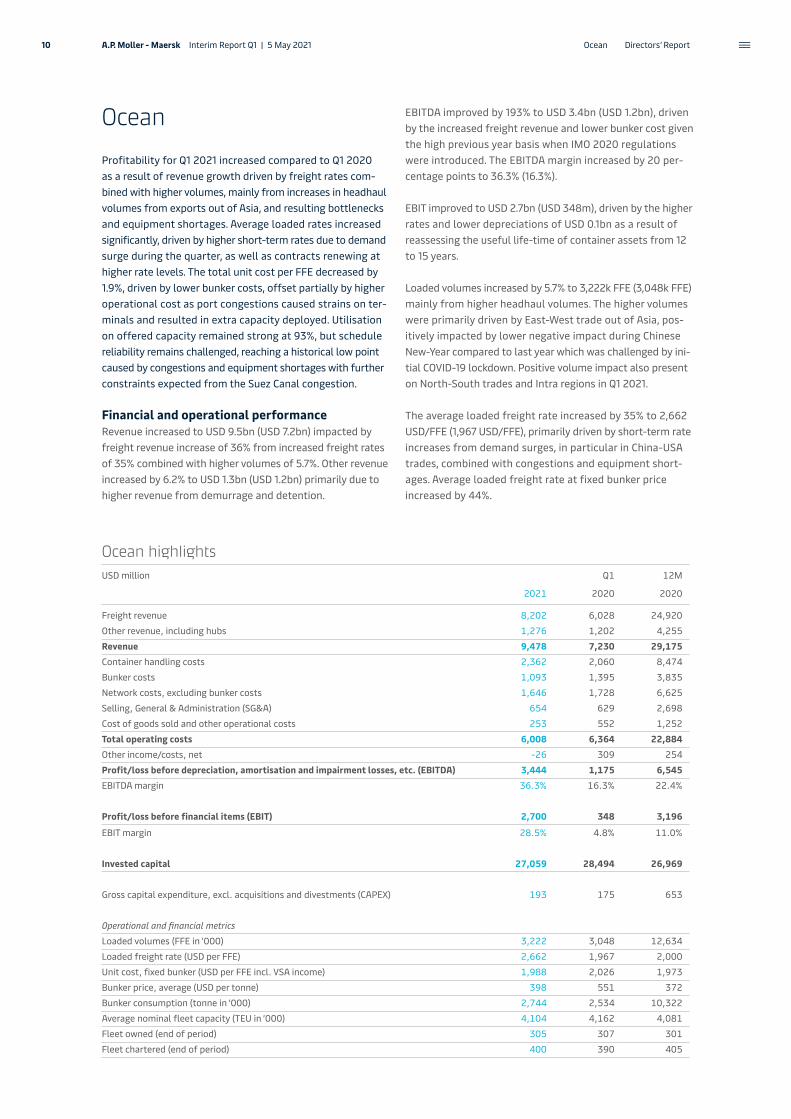
OceanProfitability for Q1 2021 increased compared to Q1 2020 as a result of revenue growth driven by freight rates com-bined with higher volumes, mainly from increases in headhaul volumes from exports out of Asia, and resulting bottlenecks and equipment shortages. Average loaded rates increased significantly, driven by higher short-term rates due to demand surge during the quarter, as well as contracts renewing at higher rate levels. The total unit cost per FFE decreased by 1.9%, driven by lower bunker costs, offset partially by higher operational cost as port congestions caused strains on ter-minals and resulted in extra capacity deployed. Utilisation on offered capacity remained strong at 93%, but schedule reliability remains challenged, reaching a historical low point caused by congestions and equipment shortages with further constraints expected from the Suez Canal congestion.
Financial and operational performanceRevenue increased to USD 9.5bn (USD 7.2bn) impacted by freight revenue increase of 36% from increased freight rates of 35% combined with higher volumes of 5.7%. Other revenue increased by 6.2% to USD 1.3bn (USD 1.2bn) primarily due to higher revenue from demurrage and detention.
EBITDA improved by 193% to USD 3.4bn (USD 1.2bn), driven by the increased freight revenue and lower bunker cost given the high previous year basis when IMO 2020 regulations were introduced. The EBITDA margin increased by 20 per-centage points to 36.3% (16.3%).
EBIT improved to USD 2.7bn (USD 348m), driven by the higher rates and lower depreciations of USD 0.1bn as a result of reassessing the useful life-time of container assets from 12 to 15 years.
Loaded volumes increased by 5.7% to 3,222k FFE (3,048k FFE) mainly from higher headhaul volumes. The higher volumes were primarily driven by East-West trade out of Asia, pos-itively impacted by lower negative impact during Chinese New-Year compared to last year which was challenged by ini-tial COVID-19 lockdown. Positive volume impact also present on North-South trades and Intra regions in Q1 2021. The average loaded freight rate increased by 35% to 2,662 USD/FFE (1,967 USD/FFE), primarily driven by short-term rate increases from demand surges, in particular in China-USA trades, combined with congestions and equipment short-ages. Average loaded freight rate at fixed bunker price increased by 44%.
Ocean highlightsUSD million Q1 12M
2021 2020 2020
Freight revenue 8,202 6,028 24,920Other revenue, including hubs 1,276 1,202 4,255Revenue 9,478 7,230 29,175Container handling costs 2,362 2,060 8,474Bunker costs 1,093 1,395 3,835Network costs, excluding bunker costs 1,646 1,728 6,625Selling, General & Administration (SG&A) 654 629 2,698Cost of goods sold and other operational costs 253 552 1,252Total operating costs 6,008 6,364 22,884Other income/costs, net -26 309 254Profit/loss before depreciation, amortisation and impairment losses, etc. (EBITDA) 3,444 1,175 6,545EBITDA margin 36.3% 16.3% 22.4%
Profit/loss before financial items (EBIT) 2,700 348 3,196
EBIT margin 28.5% 4.8% 11.0%
Invested capital 27,059 28,494 26,969
Gross capital expenditure, excl. acquisitions and divestments (CAPEX) 193 175 653
Operational and financial metricsLoaded volumes (FFE in ’000) 3,222 3,048 12,634Loaded freight rate (USD per FFE) 2,662 1,967 2,000Unit cost, fixed bunker (USD per FFE incl. VSA income) 1,988 2,026 1,973Bunker price, average (USD per tonne) 398 551 372Bunker consumption (tonne in ’000) 2,744 2,534 10,322Average nominal fleet capacity (TEU in ’000) 4,104 4,162 4,081Fleet owned (end of period) 305 307 301Fleet chartered (end of period) 400 390 405
10 Ocean Directors’ ReportA.P. Moller - Maersk Interim Report Q1 | 5 May 2021

Total operating costs was 5.6% lower at USD 6.0bn (USD 6.4bn), driven by lower bunker cost, partly offset by higher container handling costs as a result of higher volumes and the bottlenecks in the supply chains due to COVID-19. Adjusting for the impact of foreign exchange rates, oper-ating costs decreased by 3.7%.
Bunker costs decreased by 22% to USD 1.1bn (USD 1.4bn), with a decrease in average bunker price of 28% to 398 USD/tonne (551 USD/tonne) compared to Q1 2020, where IMO regulations were imposed with requirements on low-sulphur fuel oil. Bunker consumption increased by 8.3% and bunker efficiency increased by 0.5% to 41.8 g/TEU*NM (42.0 g/TEU*NM).
Average quarterly prices for high-sulphur fuel oil in Singa-pore and Rotterdam soared by 25% q/q and 29% q/q from Q4 2020 to Q1 2021, respectively, averaging USD 377/tonne (t) and USD 357/t in Q1 2021. Similarly, average quarterly low-sulphur fuel oil prices increased significantly by 33% q/q to USD 484/t in Singapore and 33% q/q to USD 453/t in Rotter dam from Q4 2020 to Q1 2021. Low-sulphur 0.1% marine gasoil rose by 32% q/q to USD 504/t in Singapore and 32% q/q to USD 492/t in Rotterdam in Q1 2021 over Q4 2020.
Unit cost at fixed bunker decreased by 1.9% to 1,988 USD/FFE (2,026 USD/FFE), driven by lower container costs and other non-operational costs, partly offset by higher container handling costs and development in foreign exchange rate. Adjusting for the negative impact of developments in foreign exchange rate, unit cost at fixed bunker decreased by 3.0%.
The average nominal capacity of 4,104k TEU decreased by 1.4%. However, deployed capacity was higher in Q1 2021 due to fewer vessels in dry dock. There were no vessels in the newbuilding programme end of Q1, and the fleet consisted of 305 owned and 400 chartered vessels, of which 64k TEU or 1.6% of the fleet were idle (10 vessels), mainly due to repairs, scrubbers retrofitting and capacity adjustments.
Key initiatives in Q1During Q1 2021, Ocean has taken further steps towards partnering with key customers, offering contract customers additional flexibility and space to help with the volatility in their supply chains. Through this the share of business from contract customers has increased, along with an increase in contract validity to build further stability and resilience in customer partnerships, in line with the Ocean strategy.
Twill, the end-to-end digital product designed for small customers without in-house logistic capabilities, crossed average 3,758 FFE per week by end of Q1 2021 compared to average 169 FFE per week same period last year.
As result of increased demand for allocation from contrac-tual customers, Ocean had to reduce Maersk Spot availability. To protect the quality of the product, the amount of offers that could be made was reduced due to the operational envi-ronment and ability to deliver. Consequently, the adoption
rate of Maersk Spot as a percentage of total short-term volumes was flat in Q1 2021 at 36% (15%) across all brands or 52% (25%) if measured on the Maersk brand. Maersk Spot remains a critical product for freight forwarder customers.
Decarbonisation is a core element of the Ocean integrator strategy and a strong focus amongst customers. In Q1 2021, the world’s first carbon-neutral liner vessel was announced with expected arrival in 2023, seven years ahead of the initial 2030-ambition. All future new buildings will have dual fuel technology installed.
Logistics & ServicesA.P. Moller - Maersk’s capabilities to meet customer’s needs for Logistics & Services solutions were further strengthened in Q1 2021 resulting in revenue growth. EBITDA increased to USD 205m (USD 68m) and EBIT increased to USD 139m (USD 29m), driven by strong performance across all product offer-ings including Landside Transportation margin improvement, earnings from Performance Team in North America and integration of KGH in Europe strengthening the offering of end-to-end solutions.
Loaded volumesFFE (’000) Q1 2021 Q1 2020 Change Change %
East-West 1,536 1,417 119 8.4North-South 974 961 13 1.4Intra-regional 712 670 42 6.3Total 3,222 3,048 174 5.7
Average freight ratesUSD/FFE Q1 2021 Q1 2020 Change Change %
East-West 2,668 1,887 781 41.4North-South 3,356 2,525 831 32.9Intra-regional 1,876 1,405 471 33.5Total 2,662 1,967 695 35.3
Fleet overview, end Q1 2021 Q1 2021 Q4 2020
TEU
Own container vessels 2,257,212 2,199,030Chartered container vessels 1,763,664 1,845,885Total fleet 4,020,876 4,044,915
Number of vessels
Own container vessels 305 301Chartered container vessels 400 405Total fleet 705 706
11 Ocean | Logistics & Services Directors’ ReportA.P. Moller - Maersk Interim Report Q1 | 5 May 2021

Financial and operational performanceRevenue increased by 42% to USD 2.0bn (USD 1.4bn), posi-tively impacted by strong performance across all services. Gross profit increased by 67% to USD 511m (USD 306m), driven by growth and higher margins in Landside Transpor-tation and increased profitability in Contract Logistics facil-ities in North America, specifically driven by the integra-tion of Performance Team. EBITDA increased to USD 205m (USD 68m) with an EBITDA margin of 10.0% (4.7%) and EBIT increased to USD 139m (USD 29m) with an EBIT margin of 6.8% (2.0%) and an EBIT conversion ratio of 27.2% (9.5%).
The Managed by Maersk services revenue was up by 58% to USD 348m (USD 220m), driven by an increase in Lead Logistics Supply Chain Management volumes of 42% to 20.684 kcbm (14,572 kcbm) due to strong performance in Asia Pacific and Customs Services volumes up 199% to 1,095k declarations (366k declarations).
The Fulfilled by Maersk services revenue was up by 107% to USD 457m (USD 221m), driven by Contract Logistics activities and turnaround of facilities in North America, combined with increasing volumes and a growing footprint from the acqui-sition of Performance Team. The growth in Contract Logistics is 38% organic and 62% inorganic.
The Transported by Maersk services revenue was up by 24% to USD 1,240m (USD 1,001m), driven by a 39% increase in Air freight forwarding volumes to 36.3k tonne (26.1k tonne)
primarily coming from Asia Pacific and Landside Transpor-tation Intermodal volumes increase of 20% to 1,037k FFE (863k FFE) mainly due to a higher penetration ratio into existing Ocean customers.
The wind down of former Damco freight forwarding ocean activities is progressing as per plan and the volumes are down 53% to 47 kTEU (100 kTEU).
New Logistics & Services categories‘Global supply chains are complex and hard to manage for customers and lack of connectivity between service providers makes global logistics unpredictable and increasingly com-plex. True integration means the ability to bring it all together. To organise and optimise; to assume responsibility and deliver accountability. “By Maersk” matches how the customer thinks about logistics.’
See the following page for a description of the new product families and the strategic rationale behind the changes made.
Logistics & Services highlightsUSD million Q1 12M
2021 2020 2020
Revenue 2,045 1,442 6,963Direct costs (third party cost) 1,534 1,136 5,328Gross profit 511 306 1,635Direct Operating Expenses 195 143 708Selling, General & Administration (SG&A) 111 95 473Profit/loss before depreciation, amortisation and impairment losses, etc. (EBITDA) 205 68 454EBITDA margin 10.0% 4.7% 6.5%
Profit/loss before financial items (EBIT) 139 29 264EBIT margin 6.8% 2.0% 3.8%
Invested capital 1,692 783 1,773
Gross capital expenditure, excl. acquisitions and divestments (CAPEX) 21 23 109
Operational and financial metricsEBIT conversion (EBIT/gross profit - %) 27.2% 9.4% 16.1%Managed by Maersk revenue 348 220 1,014Fulfilled by Maersk revenue 457 221 1,457Transported by Maersk revenue 1,240 1,001 4,492Supply chain management volumes (kcbm) 20,684 14,572 77,023Intermodal volumes (kFFE) 1,037 863 3,640Sea freight volumes (TEU) 46,827 100,281 401,369Air freight volumes (tonne) 36,329 26,139 138,086
Organic/inorganicQ1-20A Organic Inorganic Q1-21A
Revenue 1,442 425 177 2,045 30% 12%
EBITA 30 105 15 150
12 Logistics & Services Directors’ ReportA.P. Moller - Maersk Interim Report Q1 | 5 May 2021
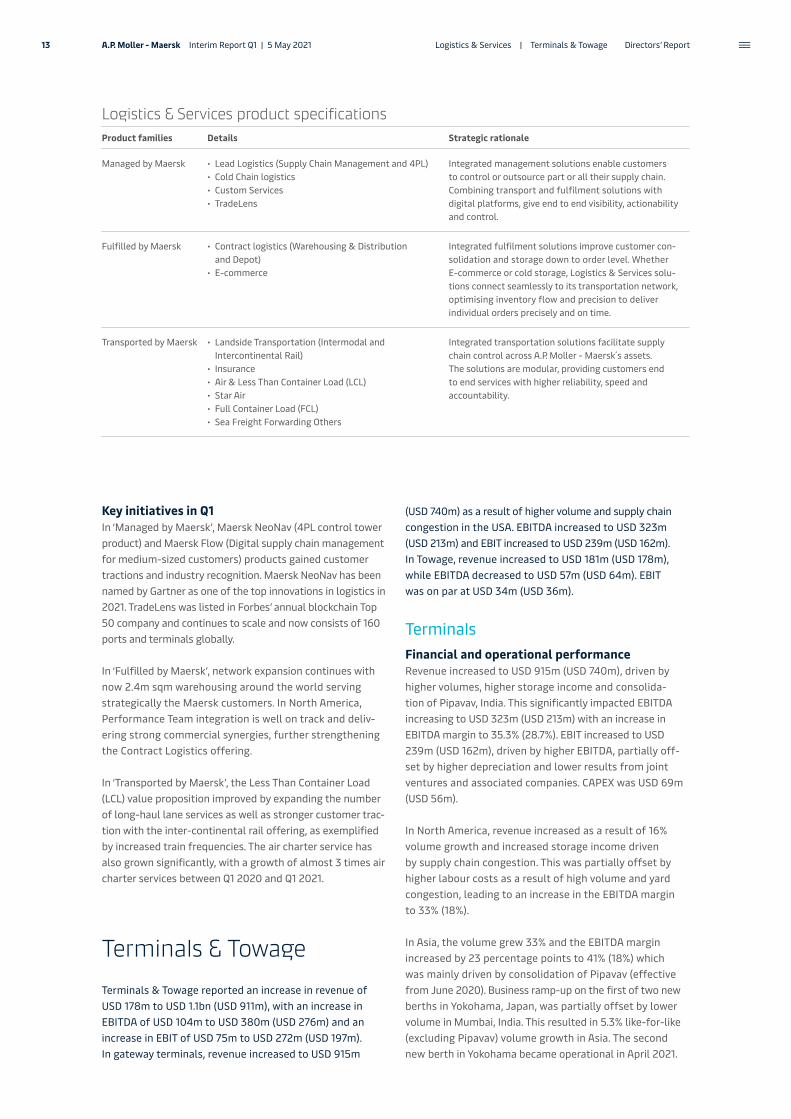
Key initiatives in Q1In ‘Managed by Maersk’, Maersk NeoNav (4PL control tower product) and Maersk Flow (Digital supply chain manage ment for medium-sized customers) products gained customer tractions and industry recognition. Maersk NeoNav has been named by Gartner as one of the top innovations in logistics in 2021. TradeLens was listed in Forbes’ annual blockchain Top 50 company and continues to scale and now consists of 160 ports and terminals globally.
In ‘Fulfilled by Maersk’, network expansion continues with now 2.4m sqm warehousing around the world serving strategically the Maersk customers. In North America, Performance Team integration is well on track and deliv-ering strong commercial synergies, further strengthening the Contract Logistics offering.
In ‘Transported by Maersk’, the Less Than Container Load (LCL) value proposition improved by expanding the number of long-haul lane services as well as stronger customer trac-tion with the inter-continental rail offering, as exemplified by increased train frequencies. The air charter service has also grown significantly, with a growth of almost 3 times air charter services between Q1 2020 and Q1 2021.
Terminals & TowageTerminals & Towage reported an increase in revenue of USD 178m to USD 1.1bn (USD 911m), with an increase in EBITDA of USD 104m to USD 380m (USD 276m) and an increase in EBIT of USD 75m to USD 272m (USD 197m). In gateway terminals, revenue increased to USD 915m
(USD 740m) as a result of higher volume and supply chain congestion in the USA. EBITDA increased to USD 323m (USD 213m) and EBIT increased to USD 239m (USD 162m). In Towage, revenue increased to USD 181m (USD 178m), while EBITDA decreased to USD 57m (USD 64m). EBIT was on par at USD 34m (USD 36m).
TerminalsFinancial and operational performanceRevenue increased to USD 915m (USD 740m), driven by higher volumes, higher storage income and consolida-tion of Pipavav, India. This significantly impacted EBITDA increasing to USD 323m (USD 213m) with an increase in EBITDA margin to 35.3% (28.7%). EBIT increased to USD 239m (USD 162m), driven by higher EBITDA, partially off-set by higher depreciation and lower results from joint ventures and associated companies. CAPEX was USD 69m (USD 56m).
In North America, revenue increased as a result of 16% volume growth and increased storage income driven by supply chain congestion. This was partially offset by higher labour costs as a result of high volume and yard congestion, leading to an increase in the EBITDA margin to 33% (18%).
In Asia, the volume grew 33% and the EBITDA margin increased by 23 percentage points to 41% (18%) which was mainly driven by consolidation of Pipavav (effective from June 2020). Business ramp-up on the first of two new berths in Yokohama, Japan, was partially offset by lower volume in Mumbai, India. This resulted in 5.3% like-for-like (excluding Pipavav) volume growth in Asia. The second new berth in Yokohama became operational in April 2021.
Logistics & Services product specificationsProduct families Details Strategic rationale
Managed by Maersk • Lead Logistics (Supply Chain Management and 4PL)• Cold Chain logistics• Custom Services• TradeLens
Integrated management solutions enable customers to control or outsource part or all their supply chain. Combining transport and fulfilment solutions with digital platforms, give end to end visibility, action ability and control.
Fulfilled by Maersk • Contract logistics (Warehousing & Distribution and Depot)
• E-commerce
Integrated fulfilment solutions improve customer con-solidation and storage down to order level. Whether E-commerce or cold storage, Logistics & Services solu-tions connect seamlessly to its transportation network, optimising inventory flow and precision to deliver individual orders precisely and on time.
Transported by Maersk • Landside Transportation (Intermodal and Intercontinental Rail)
• Insurance• Air & Less Than Container Load (LCL)• Star Air• Full Container Load (FCL)• Sea Freight Forwarding Others
Integrated transportation solutions facilitate supply chain control across A.P. Moller - Maersk´s assets. The solutions are modular, providing customers end to end services with higher reliability, speed and accountability.
13 Logistics & Services | Terminals & Towage Directors’ ReportA.P. Moller - Maersk Interim Report Q1 | 5 May 2021

In Latin America, increased revenue per move in Callao, Peru, and volume growth of 5% supported an increase in the EBITDA-margin to 49% (39%). In Africa and Middle East volume decreased by 2.3% driven by loss of ser-vices in Cotonou, Benin. The volume reduction in combi-nation with negative impact from foreign exchange rates led to a reduction in the EBITDA margin of the Africa and Middle East region to 36% (39%). In Europe, the EBITDA margin decreased to 20% (27%) mainly due to a non- recurring adjustment in lease costs and changes to ter-minal volume mix.
Gateway volumes increased by 10% (increased by 5.6% like-for-like, adjusted for Pipavav) and utilisation was high at 73% (70%) with volume growth mainly in North America, offset by capacity increases. Volume from the Ocean segment increased by 11%, and volume from exter-nal customers increased by 9.7%.
Upwards shifts in both revenue and cost in North America were the main drivers behind an increase in global revenue per move of 11% to USD 298 (USD 267) and an increase in cost per move of 1.5% to USD 236 (USD 233). Adjusted for foreign exchange rates, volume mix effects and port folio changes, revenue per move increased by 11% and cost per move increased by 1.9%.
The Suez Canal blocking had a neglectable impact on Q1 2021 financials.
Results from joint ventures and associated companiesThe share of profit in joint ventures and associated com-panies decreased to USD 58m (USD 67m). The result for Q1 2021 was positively impacted by higher results in Santos, Brazil and Tema, Ghana, whereas the result in Q1 2020 benefitted from foreign exchange rate gains.
Terminals & Towage highlightsUSD million Q1 12M
2021 2020 2020
Revenue 1,089 911 3,807Concession fees (excl. capitalised lease expenses) 78 56 287Labour cost (blue collar) 345 298 1,236Other operational cost 144 151 520Selling, General & Administration (SG&A) and other costs, etc. 142 130 559Total operating costs 709 635 2,602Profit/loss before depreciation, amortisation and impairment losses, etc. (EBITDA) 380 276 1,205EBITDA margin 34.9% 30.3% 31.7%
Profit/loss before financial items (EBIT) 272 197 828EBIT margin 25.0% 21.6% 21.7%
Invested capital 10,216 9,417 10,389
Gross capital expenditure, excl. acquisitions and divestments (CAPEX) 91 103 457
Operational and financial metrics
Terminal volumes – financially consolidated (moves, m) 3.1 2.8 11.5 Ocean segment 1.1 1.0 4.1 External customers 2.0 1.8 7.4Terminal revenue per move – financially consolidated (USD) 298 267 275Terminal cost per move – financially consolidated (USD) 236 233 232Result from joint ventures and associated companies (USDm) 64 71 236Number of operational tug jobs (harbour towage) (’000) 35 37 138Annualised EBITDA per tug (terminal towage) (USD in ’000) 933 1,086 956
Regional EBITDA margin, Terminals1Percentage Q1 2021 Q1 2020
North America 33 18Latin America 49 39Europe, Russia and the Baltics 20 27Asia 41 18Africa and Middle East 36 39Total 35 29
Regional volume, Terminals1Million moves Q1 2021 Q1 2020 Growth (%)
North America 0.7 0.6 16.0Latin America 0.6 0.6 5.0Europe, Russia and the Baltics 0.7 0.6 2.0Asia 0.6 0.5 33.4Africa and Middle East 0.5 0.5 -2.3Total 3.1 2.8 10.2
1 Financially consolidated.
14 Terminals & Towage Directors’ ReportA.P. Moller - Maersk Interim Report Q1 | 5 May 2021
Key initiatives in Q1The construction work in Abidjan, Ivory Coast, has com-menced and the first phase is expected to go live in 2022. Tenders for the expansion work has been concluded in APM Terminals Poti, Georgia and the enlargement of the terminal is expected to complete in 2023. Yokohama ter-minal expansion work was completed by the end of Q1.
TowageFinancial and operational performanceAlthough COVID-19 impacted the activity level and cre-ated operational challenges, towage profitability remains resilient. Revenue increased by USD 3m to USD 181m (USD 178m), however, adjusted for foreign exchange rate development, it decreased by USD 12m or 6.5%. Revenue was negatively impacted by lower harbour towage activ-ity, measured by the number of tug jobs, by 5.1% particu-larly due to Brexit and continued impacts of COVID-19, partly offset by a ramp-up of activities in Tangier Med 2, Morocco. EBITDA decreased to USD 57m (USD 64m), mainly impacted by non-recurring items, such as higher IT cost related to new applications, as well as a USD 3m compen-sation for early termination of contracts for pilot boats received in 2020, partly offset by lower bunkering costs.
For terminal towage, annualised EBITDA per tug decreased, primarily impacted by the compensation received for pilot boats in 2020.
Results from joint ventures and associated companiesThe share of profit in joint ventures and associated compa-nies increased by 32% to USD 6m (USD 4m), with increases driven by the Americas, Australia and China.
Key initiatives in Q1During Q1, Svitzer renewed two important Harbour Towage contracts in Brazil and Argentina. Two contract extensions were signed in Oman. In Europe, Harbour Towage operations commenced in Emden, Germany in January 2021.
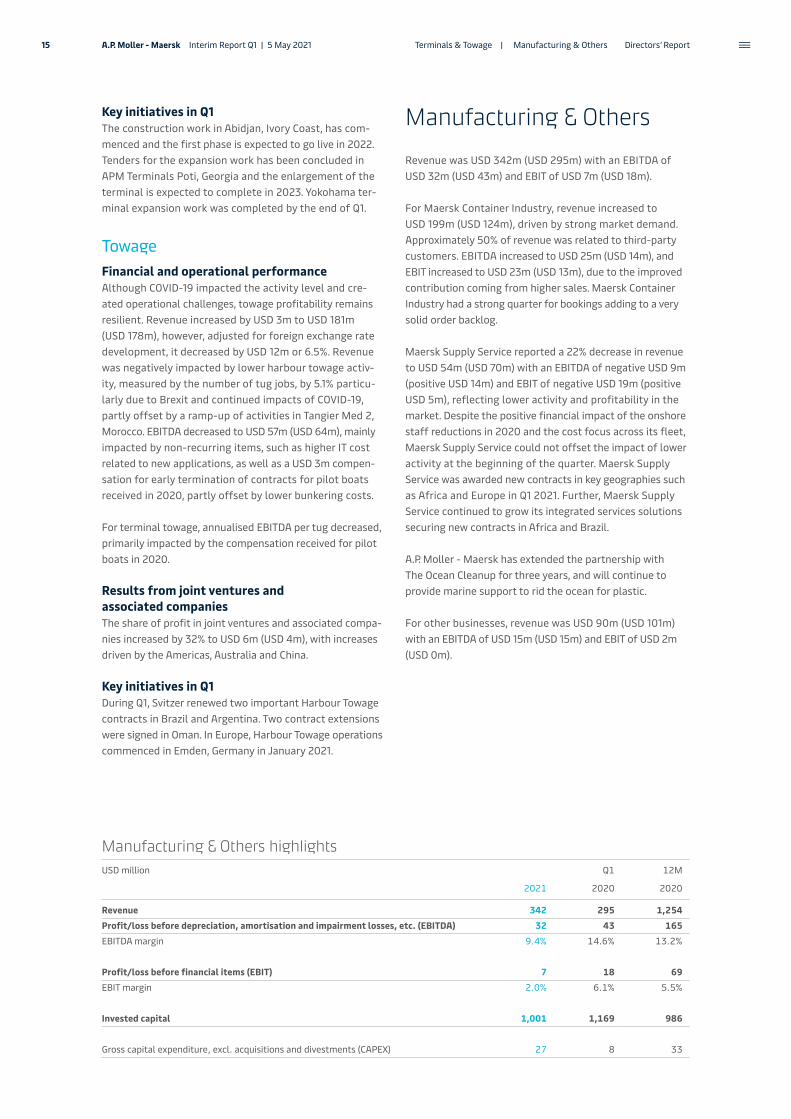
Manufacturing & OthersRevenue was USD 342m (USD 295m) with an EBITDA of USD 32m (USD 43m) and EBIT of USD 7m (USD 18m).
For Maersk Container Industry, revenue increased to USD 199m (USD 124m), driven by strong market demand. Approximately 50% of revenue was related to third-party customers. EBITDA increased to USD 25m (USD 14m), and EBIT increased to USD 23m (USD 13m), due to the improved contribution coming from higher sales. Maersk Container Industry had a strong quarter for bookings adding to a very solid order backlog.
Maersk Supply Service reported a 22% decrease in revenue to USD 54m (USD 70m) with an EBITDA of negative USD 9m (positive USD 14m) and EBIT of negative USD 19m (positive USD 5m), reflecting lower activity and profitability in the market. Despite the positive financial impact of the onshore staff reductions in 2020 and the cost focus across its fleet, Maersk Supply Service could not offset the impact of lower activity at the beginning of the quarter. Maersk Supply Service was awarded new contracts in key geographies such as Africa and Europe in Q1 2021. Further, Maersk Supply Service continued to grow its integrated services solutions securing new contracts in Africa and Brazil.
A.P. Moller - Maersk has extended the partnership with The Ocean Cleanup for three years, and will continue to provide marine support to rid the ocean for plastic.
For other businesses, revenue was USD 90m (USD 101m) with an EBITDA of USD 15m (USD 15m) and EBIT of USD 2m (USD 0m).
Manufacturing & Others highlightsUSD million Q1 12M
2021 2020 2020
Revenue 342 295 1,254Profit/loss before depreciation, amortisation and impairment losses, etc. (EBITDA) 32 43 165EBITDA margin 9.4% 14.6% 13.2%
Profit/loss before financial items (EBIT) 7 18 69EBIT margin 2.0% 6.1% 5.5%
Invested capital 1,001 1,169 986
Gross capital expenditure, excl. acquisitions and divestments (CAPEX) 27 8 33
15 Terminals & Towage | Manufacturing & Others Directors’ ReportA.P. Moller - Maersk Interim Report Q1 | 5 May 2021

Statement of the Board of Directors and the Executive Board
The Board of Directors and the Executive Board have today discussed and approved the Interim Report of A.P. Møller - Mærsk A/S for the period 1 January 2021 to 31 March 2021.
The Interim Report has not been audited or reviewed by the com-pany’s independent auditors.
The interim consolidated financial statements of A.P. Møller - Mærsk A/S have been prepared in accordance with IAS 34 Interim Financial Reporting as adopted by the EU and additional Danish disclosure requirements for interim financial reporting of listed companies.
In our opinion, the interim consolidated financial statements (pages 17-25) give a true and fair view of A.P. Moller - Maersk’s con-solidated assets, liabilities and financial position at 31 March 2021 and of the results of A.P. Moller - Maersk’s consolidated operations and cash flows for the period 1 January to 31 March 2021.
Furthermore, in our opinion, the Directors’ report (pages 3-15) includes a fair review of the development in A.P. Moller - Maersk’s operations and financial conditions, the results for the period, cash flows and financial position as well as a description of the most significant risks and uncertainty factors that A.P. Moller - Maersk faces, relative to the disclosures in the annual report for 2020.
Copenhagen, 5 May 2021
Executive Board
Søren Skou — CEO
Patrick Jany — CFO
Vincent Clerc
Morten Engelstoft
Henriette Hallberg Thygesen
Board of Directors
Jim Hagemann Snabe — Chairman
Ane Mærsk Mc-Kinney Uggla — Vice Chairman
Bernard L. Bot
Marc Engel
Arne Karlsson
Thomas Lindegaard Madsen
Blythe S. J. Masters
Amparo Moraleda
Jacob Andersen Sterling
Robert Mærsk Uggla
16 Statement of the Board of Directors and the Executive Board Directors’ ReportA.P. Moller - Maersk Interim Report Q1 | 5 May 2021

Financials
Condensed income statementNote Q1 12M
2021 2020 2020
1 Revenue 12,439 9,571 39,7401 Profit before depreciation, amortisation and impairment losses, etc. (EBITDA) 4,039 1,521 8,226
Depreciation, amortisation and impairment losses, net 1,025 1,073 4,541Gain on sale of non-current assets, etc., net 7 19 202Share of profit/loss in joint ventures and associated companies 76 85 299Profit/loss before financial items (EBIT) 3,097 552 4,186Financial items, net -230 -215 -879Profit/loss before tax 2,867 337 3,307Tax 150 128 407Profit/loss for the period 2,717 209 2,900
Of which:Non-controlling interests 20 12 50A.P. Møller - Mærsk A/S’ share 2,697 197 2,850
Earnings per share, USD 139 10 145Diluted earnings per share, USD 139 10 145
Condensed statement of comprehensive incomeNote Q1 12M
2021 2020 2020
Profit/loss for the period 2,717 209 2,900
Translation from functional currency to presentation currency -217 -356 195Reclassified to income statement, gain on sale of non-current assets, etc., net 7 - 64Cash flow hedges -61 -201 43Tax on other comprehensive income -9 27 10Share of other comprehensive income of joint ventures and associated companies, net of tax -8 8 5Total items that have been or may be reclassified subsequently to the income statement -288 -522 317
Other equity investments 1 - 2Actuarial gains/losses on defined benefit plans, etc. - 170 -207Tax on other comprehensive income - - -4Total items that will not be reclassified to the income statement 1 170 -209
Other comprehensive income, net of tax -287 -352 108
Total comprehensive income for the period 2,430 -143 3,008
Of which:Non-controlling interests 19 3 47A.P. Møller - Mærsk A/S’ share 2,411 -146 2,961
17 Interim consolidated financial statements Q1 2021 FinancialsA.P. Moller - Maersk Interim Report Q1 | 5 May 2021
Amounts in USD million

Condensed balance sheet at 31 MarchNote 31 March 12M
2021 2020 2020
Intangible assets 5,019 4,189 5,145Property, plant and equipment 26,395 26,861 26,481Right-of-use assets 7,963 8,315 8,323
Financial non-current assets, etc. 2,995 3,521 3,183Deferred tax 256 259 249Total non-current assets 42,628 43,145 43,381
Inventories 1,475 1,126 1,049Receivables, etc. 5,996 5,523 5,603Securities 1 2 1Cash and bank balances 6,418 4,041 5,865Assets held for sale 216 153 218Total current assets 14,106 10,845 12,736Total assets 56,734 53,990 56,117
Note 31 March 12M
2021 2020 2020
Equity attributable to A.P. Møller - Mærsk A/S 30,918 27,230 29,850Non-controlling interests 987 715 1,004Total equity 31,905 27,945 30,854
Lease liabilities, non-current 7,039 7,178 7,356Borrowings, non-current 5,092 6,953 5,868Other non-current liabilities 1,875 2,144 1,985Total non-current liabilities 14,006 16,275 15,209
Lease liabilities, current 1,384 1,252 1,391Borrowings, current 946 802 758Other current liabilities 8,407 7,642 7,814Liabilities associated with assets held for sale 86 74 91Total current liabilities 10,823 9,770 10,054Total liabilities 24,829 26,045 25,263Total equity and liabilities 56,734 53,990 56,117
18
Amounts in USD million
Interim consolidated financial statements Q1 2021 FinancialsA.P. Moller - Maersk Interim Report Q1 | 5 May 2021

Condensed cash flow statementNote Q1 12M
2021 2020 2020
Profit/loss before financial items 3,097 552 4,186Non-cash items, etc. 883 902 4,305Change in working capital -459 -162 -239Cash flow from operating activities before tax 3,521 1,292 8,252Taxes paid -88 -76 -424Cash flow from operating activities 3,433 1,216 7,828Purchase of intangible assets and property, plant and equipment (CAPEX) -329 -310 -1,322Sale of intangible assets and property, plant and equipment 35 46 435Sale of other equity investments 4 - 5Acquisition of subsidiaries and activities - -32 -425Sale of subsidiaries and activities 1 5 36Dividends received 59 22 177Financial investments etc., net -100 13 70Cash flow used for investing activities -330 -256 -1,024Repayments of/proceeds from borrowings, net -483 -385 -1,860Repayments of lease liabilities -629 -342 -1,710Financial payments, net -83 -74 -292Financial expenses paid on lease liabilities -114 -113 -468Purchase of own shares -333 -296 -806Dividends distributed -889 -375 -430Dividends distributed to non-controlling interests -12 -12 -92Other equity transactions 9 -23 40Cash flow from financing activities -2,534 -1,620 -5,618Net cash flow for the period 569 -660 1,186Cash and cash equivalents, beginning of period 5,845 4,758 4,758Currency translation effect on cash and bank balances 7 -66 -80Cash and cash equivalents, end of period 6,421 4,032 5,864Of which classified as assets held for sale -20 - -19Cash and cash equivalents, end of period 6,401 4,032 5,845
Cash and cash equivalentsCash and bank balances 6,418 4,041 5,865Overdrafts 17 9 20Cash and cash equivalents, end of period 6,401 4,032 5,845
Cash and bank balances include USD 1.0bn (USD 1.0bn) relating to cash and bank balances in countries with exchange control or other restrictions. These funds are not readily available for general use by the parent company or other subsidiaries.
19
Amounts in USD million
Interim consolidated financial statements Q1 2021 FinancialsA.P. Moller - Maersk Interim Report Q1 | 5 May 2021

Condensed statement of changes in equityA.P. Møller - Mærsk A/S
Share capital Translation reserve
Reserve for other equity investments
Reserve for hedges
Retained earnings
Total Non- controlling
interests
Total equity
Equity 1 January 2021 3,632 -432 -6 -42 26,698 29,850 1,004 30,854
2021Other comprehensive income, net of tax - -208 2 -70 -10 -286 -1 -287Profit/loss for the period - - - - 2,697 2,697 20 2,717Total comprehensive income for the period - -208 2 -70 2,687 2,411 19 2,430
Dividends to shareholders - - - - -1,017 -1,017 -45 -1,062Value of share-based payment - - - - 2 2 - 2
2 Purchase of own shares - - - - -333 -333 - -333Sale of own shares - - - - 5 5 - 5
2 Capital increases and decreases - - - - - - 9 9Transfer of gain/loss on disposal of equity investments to retained earnings - -2 - 2 - - - Total transactions with shareholders - - -2 - -1,341 -1,343 -36 -1,379
Equity 31 March 2021 3,632 -640 -6 -112 28,044 30,918 987 31,905
Equity 1 January 2020 3,774 -692 -4 -97 25,117 28,098 739 28,837
2020 Other comprehensive income, net of tax - -348 - -173 178 -343 -9 -352Profit/loss for the period - - - - 197 197 12 209Total comprehensive income for the period - -348 - -173 375 -146 3 -143
Dividends to shareholders - - - - -430 -430 -28 -458Value of share-based payment - - - - 4 4 - 4Purchase of own shares - - - - -296 -296 - -296Capital increases and decreases - - - - - - 1 1Total transactions with shareholders - - - - -722 -722 -27 -749
Equity 31 March 2020 3,774 -1,040 -4 -270 24,770 27,230 715 27,945
20
Amounts in USD million
Interim consolidated financial statements Q1 2021 FinancialsA.P. Moller - Maersk Interim Report Q1 | 5 May 2021

Note 1 Segment information Ocean Logistics
& ServicesTerminals & Towage
Manu facturing & Others
Total
Q1 2021External revenue 9,307 1,996 852 263 12,418Inter-segment revenue 171 49 237 79 536Total segment revenue 9,478 2,045 1,089 342 12,954Unallocated items 24Eliminations -539Total revenue 12,439
Segment profit/loss before depreciation, amortisation and impairment losses, etc. (EBITDA) 3,444 205 380 32 4,061Unallocated items -20Eliminations -2Consolidated profit/loss before depreciation, amortisation and impairment losses, etc. (EBITDA) 4,039
Segment Profit/loss before financial items (EBIT) 2,700 139 272 7 3,118Unallocated items -23Eliminations 2Consolidated Profit/loss before financial items (EBIT) 3,097
Segment Invested capital, Segments 27,059 1,692 10,216 1,001 39,968Unallocated items -8Eliminations -52Consolidated Invested capital, Segments 39,908
Consolidated Invested capital, Non-segments -79
Consolidated Invested capital 39,829
Segment gross capital expenditures, excl. acquisitions and divestments (CAPEX) 193 21 91 27 332Unallocated items -1Eliminations -2Consolidated gross capital expenditures, excl. acquisitions and divestments (CAPEX) 329
21
Amounts in USD million
Interim consolidated financial statements Q1 2021 FinancialsA.P. Moller - Maersk Interim Report Q1 | 5 May 2021

Note 1 Segment information – continued Ocean Logistics
& ServicesTerminals & Towage
Manu facturing & Others
Total
Q1 2020External revenue 7,142 1,391 732 289 9,554Inter-segment revenue 88 51 179 6 324Total segment revenue 7,230 1,442 911 295 9,878Unallocated items 21Eliminations -328Total revenue 9,571
Segment profit/loss before depreciation, amortisation and impairment losses, etc. (EBITDA) 1,175 68 276 43 1,562Unallocated items -41Eliminations -Consolidated profit/loss before depreciation, amortisation and impairment losses, etc. (EBITDA) 1,521
Segment Profit/loss before financial items (EBIT) 348 29 197 18 592Unallocated items -43Eliminations 3Consolidated Profit/loss before financial items (EBIT) 552
Segment Invested capital, Segments 28,494 783 9,417 1,169 39,863Unallocated items 241Eliminations -31Consolidated Invested capital, Segments 40,073
Consolidated Invested capital, Non-segments -96
Consolidated Invested capital 39,977
Segment gross capital expenditures, excl. acquisitions and divestments (CAPEX) 175 23 103 8 309Unallocated items -Eliminations 1Consolidated gross capital expenditures, excl. acquisitions and divestments (CAPEX) 310
22
Amounts in USD million
Interim consolidated financial statements Q1 2021 FinancialsA.P. Moller - Maersk Interim Report Q1 | 5 May 2021
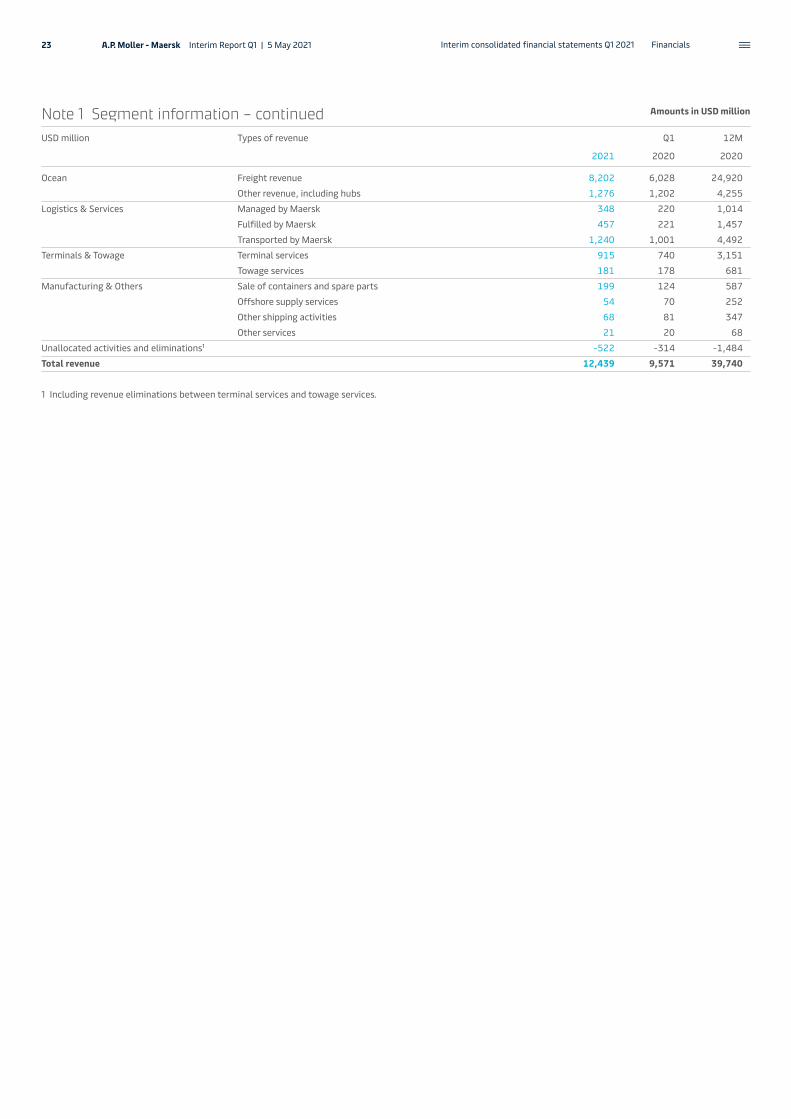
Note 1 Segment information – continuedUSD million Types of revenue Q1 12M
2021 2020 2020
Ocean Freight revenue 8,202 6,028 24,920Other revenue, including hubs 1,276 1,202 4,255
Logistics & Services Managed by Maersk 348 220 1,014Fulfilled by Maersk 457 221 1,457Transported by Maersk 1,240 1,001 4,492
Terminals & Towage Terminal services 915 740 3,151Towage services 181 178 681
Manufacturing & Others Sale of containers and spare parts 199 124 587Offshore supply services 54 70 252Other shipping activities 68 81 347Other services 21 20 68
Unallocated activities and eliminations1 -522 -314 -1,484Total revenue 12,439 9,571 39,740
1 Including revenue eliminations between terminal services and towage services.
23
Amounts in USD million
Interim consolidated financial statements Q1 2021 FinancialsA.P. Moller - Maersk Interim Report Q1 | 5 May 2021

Note 2 Share capital and earnings per shareDevelopment in the number of shares:
A shares of B shares of Nominal value
DKK 1,000 DKK 500 DKK 1,000 DKK 500 DKK million USD million
1 January 2020 10,756,265 226 10,060,401 166 20,817 3,77431 March 2020 10,756,265 226 10,060,401 166 20,817 3,774
1 January 2021 10,599,293 216 9,432,463 166 20,032 3,63231 March 2021 10,599,293 216 9,432,463 166 20,032 3,632
At the Annual General Meeting of A.P. Møller - Mærsk A/S on 23 March 2021, the shareholders decided on the cancellation of treasury shares, whereby the share capital will decrease from nominally DKK 20,031,947,000 by nominally DKK 655,931,000 in total, divided into 131,186 A shares and 524,745 B shares of DKK 1,000 to nominally DKK 19,376,016,000 by cancellation of own shares.
Development in the holding of own shares:
No. of shares of DKK 1,000 Nominal value DKK million % of share capital
Own shares 2021 2020 2021 2020 2021 2020
A shares1 January 119,176 134,279 119 134 0.59% 0.65%Addition 30,451 55,605 30 56 0.16% 0.26%31 March 149,627 189,884 149 190 0.75% 0.91%
B shares1 January 505,281 587,949 505 588 2.52% 2.82%Addition 121,805 221,999 122 222 0.61% 1.07%Disposal 6,538 3,777 7 4 0.03% 0.02%31 March 620,548 806,171 620 806 3.10% 3.87%
Disposals of own shares are related to the share option plans and the restricted shares plan.
The dividend of DKK 330 per share of DKK 1,000 – total of DKK 6,610m is equivalent to USD 1,017m excluding own shares. Hereof, USD 889m was paid to shareholders on March 26, 2021 and the withholding tax of USD 130m is payable in Q2 2021. Payment of dividends to shareholders does not trigger taxes to A.P. Moller - Maersk.
The interim consolidated financial statements have been prepared in accordance with IAS 34 Interim Financial Reporting as issued by the Inter-national Accounting Standards Board (IASB) and adopted by the EU and additional Danish disclo-sure require ments for interim financial reporting of listed companies.
The accounting policies, judgements and signifi-cant estimates are consistent with those applied in
the Annual Report 2020, notes 23 and 24, to which reference is made, apart from the changes described below:
Change to product groups in reportable segmentAs part of the refinement of the segment structure of A.P. Moller - Maersk, the product groups of the Logistics & Services segment have been updated. Refer to the Logistics & Services product specifi-cations on page 13.
Change to accounting estimatesThe estimated useful life and residual values of containers have been revised. The net effect of the changes was an increase in EBIT of USD 106m in Q1 2021.
The useful life of new containers is typically esti-mated to 15 years. The residual values are initially estimated between 10% and 30%, depending on the container type.
Note 3 Accounting policies, judgements and significant estimates
24
Amounts in USD million
Interim consolidated financial statements Q1 2021 FinancialsA.P. Moller - Maersk Interim Report Q1 | 5 May 2021

Additional information
Quarterly summary2021 2020
Income statement Q1 Q4 Q3 Q2 Q1
Revenue 12,439 11,255 9,917 8,997 9,571Profit before depreciation, amortisation and impairment losses etc. (EBITDA) 4,039 2,711 2,297 1,697 1,521Depreciation, amortisation and impairment losses, net 1,025 1,222 1,097 1,149 1,073Gain on sale of non-current assets etc., net 7 30 8 145 19Share of profit/loss in joint ventures and associated companies 76 75 81 58 85Profit/loss before financial items (EBIT) 3,097 1,594 1,289 751 552Financial items, net -230 -272 -160 -232 -215Profit/loss before tax 2,867 1,322 1,129 519 337Tax 150 21 182 76 128Profit/loss for the period 2,717 1,301 947 443 209A.P. Møller - Mærsk A/S’ share 2,697 1,299 927 427 197
Underlying profit/loss 2,712 1,361 1,043 359 197
Balance sheet
Total assets 56,734 56,117 56,162 55,319 53,990Total equity 31,905 30,854 29,547 28,569 27,945Invested capital 39,829 40,121 40,404 40,186 39,977Net interest-bearing debt 7,746 9,232 10,804 11,564 11,978
Cash flow statement
Cash flow from operating activities 3,433 2,569 2,176 1,867 1,216Gross capital expenditure, excl. acquisitions and divestments (CAPEX) 329 370 280 362 310Cash flow from financing activities -2,534 -2,400 -1,539 -59 -1,620Free cash flow 2,372 1,666 1,486 1,051 445
Financial ratios
Revenue growth 30.0% 16.4% -1.4% -6.5% 0.3%EBITDA margin 32.5% 24.1% 23.2% 18.9% 15.9%EBIT margin 24.9% 14.2% 13.0% 8.3% 5.8%Cash conversion 85% 95% 95% 110% 80%Return on invested capital after tax (ROIC) 15.7% 9.4% 5.9% 4.7% 3.8%Equity ratio 56.2% 55.0% 52.6% 51.6% 51.8%Underlying ROIC 1 15.9% 9.6% 6.2% 4.6% 3.8%Underlying EBITDA 1 4,039 2,705 2,401 1,697 1,521Underlying EBITDA margin1 32.5% 24.0% 24.2% 18.9% 15.9%Underlying EBIT 1 3,092 1,663 1,385 642 540Underlying EBIT margin 1 24.9% 14.8% 14.0% 7.1% 5.6%
Stock market ratios
Earnings per share, USD 139 66 48 21 10Diluted earnings per share, USD 139 66 48 21 10Cash flow from operating activities per share, USD 178 132 111 95 61Share price (B share), end of period, DKK 14,735 13,595 10,080 7,728 6,092Share price (B share), end of period, USD 2,324 2,246 1,585 1,161 894Total market capitalisation, end of period, USD 43,243 41,957 29,583 21,827 17,002
1 Underlying profit/loss is profit/loss for the period from continuing operations adjusted for net gains/losses from sale of non-current assets etc. and net impairment losses as well as transaction, restructuring and integration costs related to major transactions. The adjustments are net of tax and include A.P. Moller - Maersk’s share of mentioned items in joint ventures and associated companies.
25
Amounts in USD million
Quarterly summary Additional informationA.P. Moller - Maersk Interim Report Q1 | 5 May 2021

Definition of terms Technical terms, abbreviations and definitions of key figures and financial ratios.
BackhaulThe direction of the trade route with the lowest volumes, whereas the opposite direction is referred to as headhaul.
Bunker Adjustment Factor (BAF)A surcharge applied to freight rates to compensate unexpected fuel oil price variations as an element in the contracts with customers.
CAPEXCash payments for intangible assets and property, plant and equipment, excluding acquisitions and divest-ments.
Cash conversionCash flow from operating activities to EBITDA ratio.
Cash flow from operating activities per shareA.P. Moller - Maersk’s operating cash flow from continuing operations divided by the number of shares (of DKK 1,000 each), excluding A.P. Moller - Maersk’s holding of own shares.
Cost per moveIncludes cost (EBITDA less revenue less other income), depreciation and excludes IFRIC12 construction cost.
EBITEarnings Before Interest and Taxes.
EBITAEarnings Before Interest, Tax and Amortisation.
EBITDAEarnings Before Interest, Taxes, Depreciation and Amortisation.
Equity ratioCalculated as equity divided by total assets.
FFEForty Foot container Equivalent unit.
Free cash flow (FCF)Comprised of cash flow from operating activities, purchase/sale of intangible assets and property, plant and equip-ment, dividends received, repayments of lease liabilities, financial payments and financial expenses paid on lease liabilities.
Gross profitThe sum of revenue, less variable costs and loss on debtors.
HeadhaulThe direction of the trade route with the highest volumes, whereas the return direction is referred to as backhaul.
IMO 2020The International Maritime Organiza-tion’s (IMO) 0.5% global cap on sulphur dioxide (SOx) content in fuels for shipping has entered into force on 1 January 2020.
IMOThe International Maritime Organi-zation.
Invested capitalSegment assets less liabilities.
kcbmThe freight volume of the shipment for domestic and international freight. Cubic metre (CBM) measurement is calculated by multi plying the width, height and length together of the shipment.
Loaded volumesLoaded volumes refer to the number of FFE´s loaded on a shipment, which are loaded on first load at vessel departure time excluding displaced FFE´s.
Net interest-bearing debt (NIBD)Equals interest-bearing debt, including leasing liabilities, fair value of deriva-tives hedging the underlying debt, less cash and bank balances as well as other interest-bearing assets.
Return on invested capital after tax (ROIC)Profit/loss before financial items for the year (EBIT) less tax on EBIT divided by the average invested capital, last twelve months.
Revenue per moveIncludes terminal revenue, other income, government grants and excludes IFRIC12 construction revenue.
TEUTwenty-foot container Equivalent Unit.
Time charterHire of a vessel for a specified period.
Total market capitalisationTotal number of shares – excluding A.P. Moller - Maersk A/S’ holding of own shares – multiplied by the end- of-quarter price quoted by Nasdaq Copenhagen.
Underlying profit/lossUnderlying profit/loss is profit/loss for the period from continuing oper-ations adjusted for net gains/losses from sale of non-current assets etc. and net impairment losses as well as transaction, restructuring and inte-gration costs related to major trans-actions. The adjustments are net of tax and include A.P. Moller - Maersk’s share of mentioned items in joint ventures and associated companies.
VSAVessel Sharing Agreement is usually reached between various partners within a shipping consortium who agree to operate a liner service along a specified route using a specified number of vessels.
4PLA 4PL is a fourth-party logistics pro-vider managing resources, technology, infrastructure, and managing external 3PLs to design, build and provide supply chain solutions for businesses.
26 Definition of terms Additional informationA.P. Moller - Maersk Interim Report Q1 | 5 May 2021

Colophon
EditorsStig Frederiksen Finn GlismandHenrik Jensen
Design and layoute-Types
Produced in Denmark 2021
Board of Directors
Jim Hagemann Snabe, Chairman
Ane Mærsk Mc-Kinney Uggla, Vice Chairman
Bernard L. Bot
Marc Engel
Arne Karlsson
Thomas Lindegaard Madsen
Blythe S. J. Masters
Amparo Moraleda
Jacob Andersen Sterling
Robert Mærsk Uggla
Executive Board
Søren Skou, Chief Executive Officer (CEO)
Patrick Jany (CFO)
Vincent Clerc
Morten Engelstoft
Navneet Kapoor
Henriette Hallberg Thygesen
Audit Committee
Arne Karlsson, Chairman
Bernard L. Bot
Amparo Moraleda
Jim Hagemann Snabe
Remuneration Committee
Jim Hagemann Snabe, Chairman
Robert Mærsk Uggla
Amparo Moraleda
Nomination Committee
Ane Mærsk Mc-Kinney Uggla, Chairman
Jim Hagemann Snabe
Robert Mærsk Uggla
Transformation & Innovation Committee
Jim Hagemann Snabe, Chairman
Marc Engel
Blythe S. J. Masters
Amparo Moraleda
27 ColophonA.P. Moller - Maersk Interim Report Q1 | 5 May 2021