all seven countries would benefit from a stronger culture ... · all seven countries would benefit...
TRANSCRIPT

UNESCO SCIENCE REPORT
All seven countries would benefit from a stronger culture of evaluation in the area of STI policies.Deniz Eröcal and Igor Yegorov
Istanbul Technical University's experimental solar-powered car Ariba VI negotiating heavy traffic on a bridge over the Bosphorus on its first long-distance test drive on 20 August 2013.Photo: © Istanbul Technical University Solar Car Team
312

Countries in the Black Sea basin
313
Chapter 12
INTRODUCTION
Turkey is making progress, others have lost groundFor want of a better term, the seven countries covered in the present chapter shall be referred to collectively as the ‘Black Sea countries.’ They do not constitute a world region in the traditional sense1 but they do present some structural similarities. For one thing, they share geographical proximity, with all but Armenia and Azerbaijan being situated in the Black Sea basin. In addition, all seven are middle-income economies seeking to move into a higher income bracket. Their differences are equally instructive. If we take trade in manufactured goods, for instance, we can discern three groups: countries with traditionally close economic integration with the Russian Federation (Armenia, Belarus, Moldova and Ukraine), some of which are now diversifying their trading partners (Moldova and Ukraine); countries which are increasingly integrated in global markets (Georgia and Turkey) and countries with a weak focus on trade in manufactured goods (Azerbaijan) [Table 12.1]. All seven, however, have made efforts over the past two decades to strengthen their mutual economic and institutional ties. The best illustration of this is the Organization of the Black Sea Economic Cooperation (Box 12.1).
Six of the seven Black Sea countries were part of the former Union of Soviet Socialist Republics (USSR) up until the early 1990s. The seventh, Turkey, was less industrialized and had been beset by recurrent economic crises up until this period.
1. Bulgaria and Romania also lie on the Black Sea but they are covered in Chapter 9.
A great deal has changed since. Turkey is gradually catching up to the advanced economies, whereas some of the other Black Sea countries are losing ground. Notwithstanding this, these seven countries are arguably more comparable with one another today in economic and technological terms than at any other time in modern history. Certainly, all harbour an undeniable potential for accelerated development.
In the five years to 2013, the economies of Azerbaijan, Belarus, Georgia, Moldova and Turkey grew faster than those of high-income countries – themselves beset by recession following the US subprime crisis – but below the average for middle-income economies. All but Azerbaijan and Belarus fell into recession in 2009 before returning to modest positive growth the following year. Ukraine’s economy shrank most in 2009, by 15%; it is the only Black Sea country where GDP per capita remains below 2008 levels. The current economic crisis in Ukraine is associated with the ongoing conflict, which saw GDP drop by more than 6% in 2014. Macro-economic indicators for most other countries have remained under control, with the notable exception of inflation in Belarus, which climbed to more than 50% in 2011 and 2012 before falling back to 18%, and unemployment, which has been cruising on a 16–18% plateau in Armenia and Georgia and at around 10% in Turkey and Ukraine, according to the International Labour Organization. Over this five-year period, only Turkey showed progress in terms of human development, as defined by the UNDP’s index. Growth in Azerbaijan was largely driven by high oil prices.
12 . Countries in the Black Sea basinArmenia, Azerbaijan, Belarus, Georgia, Moldova, Turkey, Ukraine
Deniz Eröcal and Igor Yegorov
Table 12.1: Socio-economic trends in the Black Sea countries
Population trendsInternet
access Trends in GDP Employment Manufactured exports
Popu
latio
n (‘00
0s)
2014
Cum
ulat
ive
grow
th20
08–2
013
Per 1
00 p
opul
atio
n 20
13
Per c
apita
(cu
rrent
PPP
$)20
08
Per c
apita
(cu
rrent
PPP
$)20
13
Aver
age g
row
th
per a
nnum
20
08–2
013
As a
shar
e of a
dult
popu
latio
n20
13 (%
)
Shar
e em
ploy
ed in
in
dust
ry, a
vera
ge
2010
–20
12 (%
)
As a
shar
e of t
otal
m
erch
andi
se
expo
rts,
2012
(%)
As a
shar
e of G
DP
2012
(%)
Chan
ge ov
er
10 ye
ars i
n sh
are
of G
DP, 2
012 (
%)
Armenia 2 984 0.0 46.3 7 099 7 774 1.7 63 17 22.1 3.2 -8.4
Azerbaijan 9 515 6.0 58.7 13 813 17 139 5.5 66 14 2.4 1.1 -0.9
Belarus 9 308 -2.1 54.2 13 937 17 615 4.4 56 26 46.7 33.8 -1.0
Georgia 4 323 -1.6 43.1 5 686 7 165 3.5 65 6 53.4 8.0 4.3
Moldova 3 461 -4.1 48.8 3 727 4 669 4.0 40 19 37.2 11.0 -1.0
Turkey 75 837 6.5 46.3 15 178 18 975 3.3 49 26 77.7 15.0 2.0
Ukraine 44 941 -2.6 41.8 8 439 8 788 -0.2 59 26 60.6 23.5 -5.0
Source: UNESCO Institute for Statistics; for employment and manufactured exports: World Bank’s World Development Indicators, accessed November 2014
UNESCO SCIENCE REPORT
314
Many post-Soviet states suffer from diminished territorial integrity, which hinders their ability to focus on long-term development issues. They bear the stigma of what have been termed ‘frozen conflicts,’ the legacy of short-lived wars which have led to part of their territory escaping their control: the mountainous Karabakh (Arcakh) region, disputed by Armenia and Azerbaijan since 1991, the breakaway Transnistria region in Moldova (since 1992), the breakaway regions of Abkhazia and South Ossetia in Georgia (both since 1990–1992) and, most recently, Crimea and the Donbass regions in Ukraine. Since 2014, the European Union (EU), USA and a number of other countries have imposed sanctions on the Russian Federation, which they accuse of fostering separatism in Ukraine. Tensions with the Russian Federation had emerged in 2013 after Georgia, Moldova and Ukraine announced their intention of signing association agreements with the EU to foster closer political ties and economic integration.
In addition to economic and geopolitical problems, most Black Sea countries also face demographic challenges. The population is declining in all but Azerbaijan and Turkey. Since the mid-2000s, Turkey has been able to reverse the decline in its employment-to-population ratio by implementing a series of pro-market economic reforms. High emigration rates have prevented Moldova from stemming its own haemorrhage. Most other countries in this group have managed to maintain relatively high employment rates, unlike many advanced economies.
TRENDS IN REGIONAL STI GOVERNANCEBlack Sea scientists co-operate with East and WestFor the Black Sea countries, the EU collectively represents the most important node for international co-operation in science and technology (S&T). A glance at cross-border co-operation in scientific authorship (see p. 322) suggests that all seven countries do indeed have links with the principal scientific powers of the Organisation of Economic Co-operation for Development (OECD) but that most of the former Soviet states have also maintained their historic scientific ties with the Russian Federation. The data also reveal that there is now close collaboration between Azerbaijan and Turkey. The USA is a key partner for all seven countries, thanks partly to the active academic diaspora from Armenia and Georgia living in the USA. Turkey’s own academic diaspora is tipped to grow in coming years, owing to the large presence of Turkish PhD students in the USA.
The EU’s Framework Programme for Research and Technological Development, including its current Horizon 2020 Programme (2014–2020), is an important instrument for co-operation. Having signed an association agreement with the EU as long ago as 1964, Turkey has been an Associated Country of the European Research Area and the EU’s six-year Framework Programmes for some time now. It is also a member of a
The Organization of the Black Sea Economic Cooperation (BSEC) comprises 12 members: Albania, Armenia, Azerbaijan, Bulgaria, Georgia, Greece, Moldova, Romania, the Russian Federation, Serbia, Turkey and Ukraine. Belarus is not a member.
The BSEC was founded in 1992, shortly after the disintegration of the USSR, in order to develop prosperity and security within a region centred on the Black Sea Basin and straddling the European Union. It officially became an intergovernmental organization through an agreement signed in 1998.
One of BSEC’s strategic goals is to deepen ties with the European Commission in Brussels. To some extent, the institutions of BSEC mirror those of the EU. The Council of Ministers of Foreign Affairs is BSEC’s central decision-making organ.
It meets every six months. There is also a Parliamentary Assembly modelled on that of the Council of Europe and a Permanent International Secretariat, based in Istanbul, which is headed by a Secretary-General.
The BSEC Business Council is made up of experts and representatives of Chambers of Commerce of the member states; it promotes co-operation between the public and private sectors. Another structure is the Black Sea Trade and Development Bank, which administers the funding allocated to regional co-operation projects. In this task, the bank receives support from the European Investment Bank and the European Bank for Reconstruction and Development. There is also an International Centre for Black Sea Studies.
The BSEC has adopted two Action Plans on Cooperation in Science and Technology. The first covered the period 2005–2009
and the second 2010 –2014. With no dedicated budget, the second action plan was funded on a project basis. Two key projects were the EU-funded Scientific and Technological International Cooperation Network for Eastern European and Central Asian countries (IncoNet EECA) and the Networking on Science and Technology in the Black Sea Region project (BS–ERA–Net), which had got under way in 2008 and 2009 respectively. Another thrust of the action plan targeted the development of physical and virtual multinational infrastructure by pooling the resources of BSEC member states, the networking of research institutes and universities in BSEC countries and their connection to the European gigabit network and other EU e-networks like e-Science.
Source: www.internationaldemocracywatch.org; www.bsec-organization.org
Box 12.1: The Organization of the Black Sea Economic Cooperation

Chapter 12
research body supported by the Framework Programme, known as European Cooperation in Science and Technology (COST). Like Ukraine, Turkey also participates in Eureka, an intergovernmental organization providing pan-European funding and co-ordination for market-driven industrial R&D. The recent geopolitical developments in the Black Sea region or, for that matter, in the Middle East, do not necessarily imply that there will be major shifts in the orientation of Turkey’s co-operation in S&T. However, anecdotal evidence suggests that Turkey’s ambitions for advanced defence-related R&D are growing.
The EU’s association agreements signed with Georgia, Moldova and Ukraine in mid-2014 envisage enhancing these countries’ participation in Horizon 2020. Whereas it is too early to detect the impact on S&T of the past two years’ geopolitical tensions in the region, it is probable that they will accelerate Ukraine’s co-operation2 with the EU. In March 2015, Ukraine signed an agreement with the EU for associate membership of the Horizon 2020 Programme (2014–2020) with significantly more advantageous conditions on the table than previously, notably the possibility for Ukraine to participate in scientific co-operation at a fraction of the original cost. This should pave the way to more active involvement by Ukrainian scientists in Horizon 2020 but may also increase the emigration of Ukrainian scientists to the EU in the short term. A similar but milder effect can be expected from Moldova’s own association agreement with the EU. Moldova has been officially associated with the Framework Programme since 2012 (Sonnenburg et al., 2012).
Those Black Sea countries which do not have association agreements with the EU are also eligible for Framework Programme funding; moreover, projects such as ERA’s Networking on Science and Technology in the Black Sea (BS-ERA.NET) have sought to enhance their involvement in the Framework Programme. In co-operation with the BSEC, the EU’s Networking on Science and Technology in the Black Sea Region project (2009–2012) has been instrumental in funding a number of cross-border co-operative projects, notably in clean and environmentally sound technologies (Box 12.1). The absence of a formal co-operation framework may, however, be constraining Belarus’ ability to participate in the Framework Programme, despite the country’s relatively high level of international collaboration in R&D.
Other multilateral projects are presently striving to expand their reach. One example is the Science and Technology Centre in Ukraine, funded by Canada, the EU, Sweden and
2. Ukraine and the EU signed an agreement in 2010 which determined key thematic areas for co-operation: environmental and climate research, including observation of the Earth’s surface; biomedical research; agriculture, forestry and fisheries; industrial technologies; materials science and metrology; non-nuclear power engineering; transport; information society technologies; social research; S&T policy studies and training and the exchange of specialists.
the USA. This intergovernmental organization has the status of a diplomatic mission. It was established in 1993 to promote nuclear non-proliferation but its scope has since been extended to fostering co-operation in a wide range of technological fields with Azerbaijan, Georgia, Moldova and Uzbekistan3.
The impetus to create a Eurasian Economic Union – the other major consequence of the recent geopolitical tensions – has also gained strength, with the signing of the Union’s founding treaty in May 2014 by Belarus, Kazakhstan and the Russian Federation, followed by Armenia’s accession to it in October 2014 (see Chapter 14). As co-operation in S&T within the latter group of countries is already considerable and well-codified in legal texts, the Eurasian Economic Union is expected to have a limited additional impact on co-operation among public laboratories or academia but it may encourage R&D links among businesses.
TRENDS IN HUMAN RESOURCES AND R&D
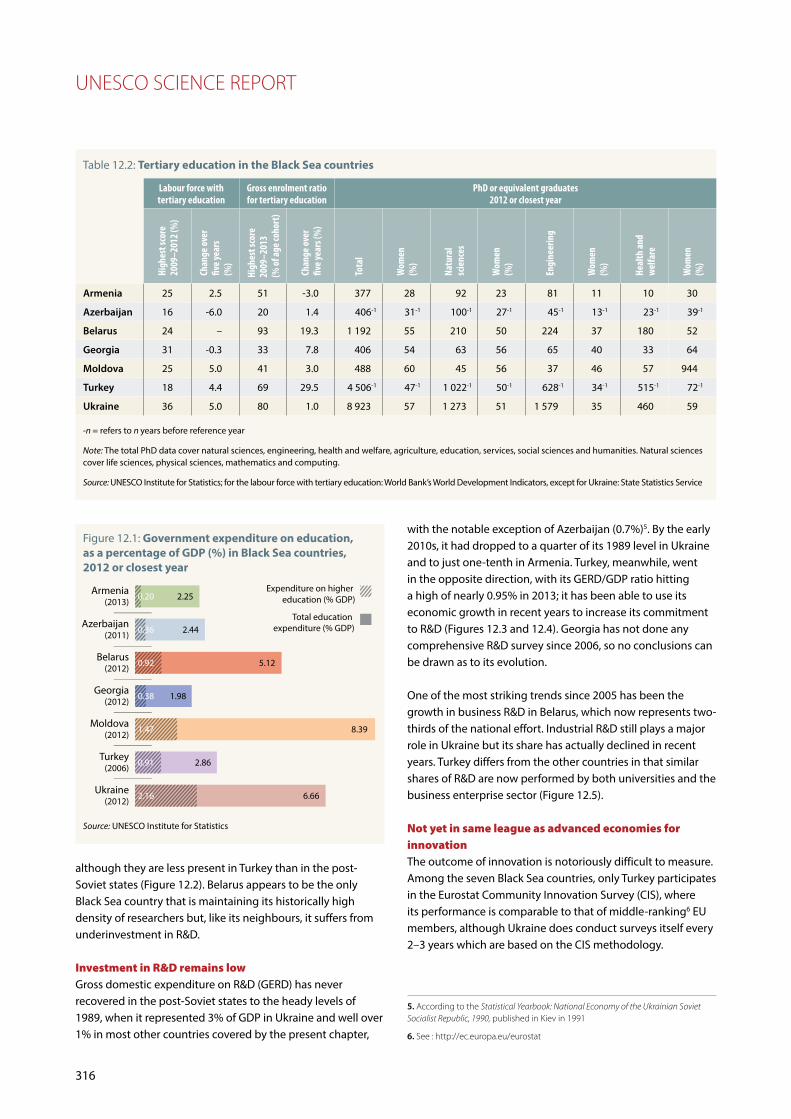
High tertiary enrolment ratesEducation is one of the region’s strengths. Belarus and Ukraine both compare well with developed countries for the gross tertiary enrolment rate: more than nine-tenths of 19–25 year-olds in Belarus and eight-tenths in Ukraine. As for Turkey, which started from low levels, it has recently made great strides (Table 12.2). Of note is that Moldova and Ukraine invest heavily in higher education: 1.5% and 2.2% of GDP respectively (Figure 12.1). Two countries are experiencing difficulty, however, in converging with advanced economies, or even in maintaining their current levels of tertiary attainment: Azerbaijan and Georgia.
Gender equality a reality in most Black Sea countriesIn Georgia, Moldova and Ukraine, the majority of PhD graduates are women. The figures are almost as high in Belarus and Turkey, which have achieved gender parity in this respect. In Armenia and Azerbaijan, women make up one-third of the total. In natural sciences, they make up half of PhD graduates in Belarus, Georgia, Turkey and Ukraine.
Ukraine is regressing4 from its historically high density of researchers, in a context of a declining or stagnating population, whereas Belarus has managed to preserve its advantage. The most striking trend concerns Turkey, where the researcher density has gone from being the lowest in the region in 2001 to the highest (Figure 12.2). Women tend to represent between one-third and two-thirds of researchers,
3. See: www.stcu.int
4. Only Moldova, Turkey and Ukraine claim to publish data on researchers in full-time equivalents (FTE), in line with international best practice. However, the prevalence of multiple part-time jobs among R&D personnel makes head count data a more precise measure for Ukraine.
315
Countries in the Black Sea basin
UNESCO SCIENCE REPORT
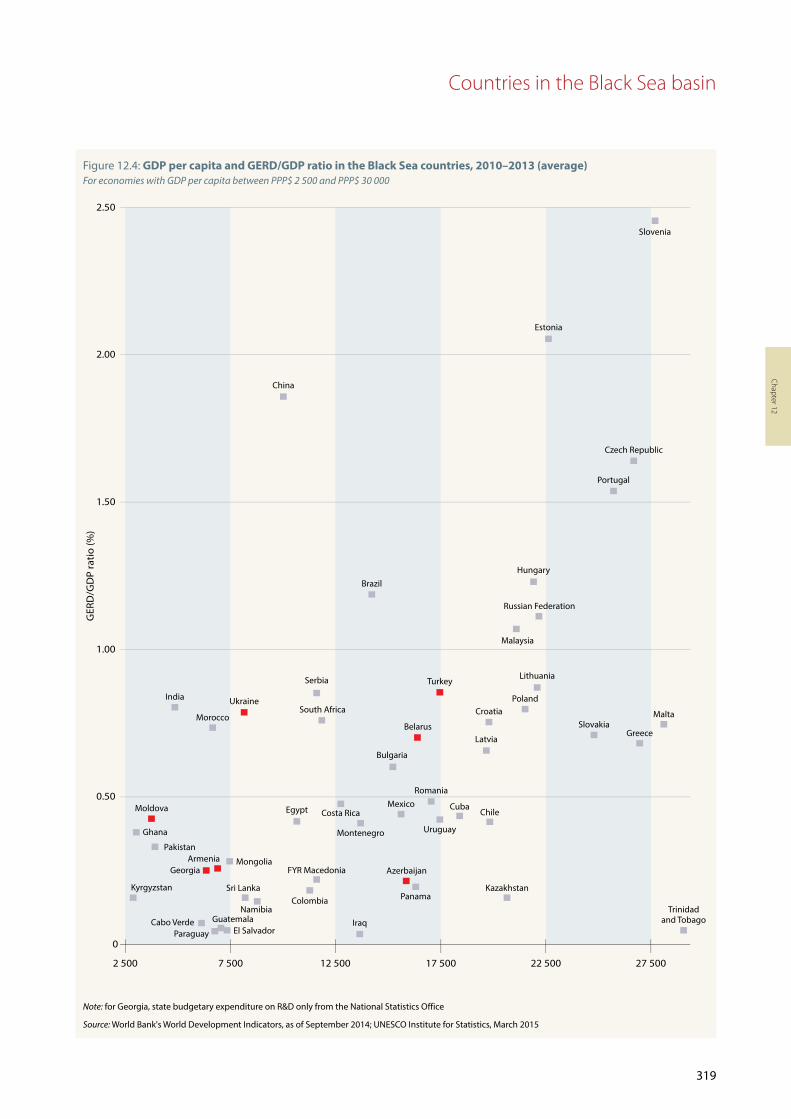
with the notable exception of Azerbaijan (0.7%)5. By the early 2010s, it had dropped to a quarter of its 1989 level in Ukraine and to just one-tenth in Armenia. Turkey, meanwhile, went in the opposite direction, with its GERD/GDP ratio hitting a high of nearly 0.95% in 2013; it has been able to use its economic growth in recent years to increase its commitment to R&D (Figures 12.3 and 12.4). Georgia has not done any comprehensive R&D survey since 2006, so no conclusions can be drawn as to its evolution.
One of the most striking trends since 2005 has been the growth in business R&D in Belarus, which now represents two-thirds of the national effort. Industrial R&D still plays a major role in Ukraine but its share has actually declined in recent years. Turkey differs from the other countries in that similar shares of R&D are now performed by both universities and the business enterprise sector (Figure 12.5).
Not yet in same league as advanced economies for innovationThe outcome of innovation is notoriously difficult to measure. Among the seven Black Sea countries, only Turkey participates in the Eurostat Community Innovation Survey (CIS), where its performance is comparable to that of middle-ranking6 EU members, although Ukraine does conduct surveys itself every 2–3 years which are based on the CIS methodology.
5. According to the Statistical Yearbook: National Economy of the Ukrainian Soviet Socialist Republic, 1990, published in Kiev in 1991
6. See : http://ec.europa.eu/eurostat
although they are less present in Turkey than in the post-Soviet states (Figure 12.2). Belarus appears to be the only Black Sea country that is maintaining its historically high density of researchers but, like its neighbours, it suffers from underinvestment in R&D.
Investment in R&D remains lowGross domestic expenditure on R&D (GERD) has never recovered in the post-Soviet states to the heady levels of 1989, when it represented 3% of GDP in Ukraine and well over 1% in most other countries covered by the present chapter,
Armenia(2013)
Azerbaijan(2011)
Belarus(2012)
Georgia(2012)
Moldova(2012)
Turkey(2006)
Ukraine(2012)
2.25 0.20
2.44
0.36
5.12
0.92
1.98
0.38
8.39
1.47
2.86
0.91
6.66
2.16
Total education expenditure (% GDP)
Expenditure on higher education (% GDP)
Figure 12.1: Government expenditure on education, as a percentage of GDP (%) in Black Sea countries, 2012 or closest year
Source: UNESCO Institute for Statistics
Table 12.2: Tertiary education in the Black Sea countries
Labour force with tertiary education
Gross enrolment ratio for tertiary education
PhD or equivalent graduates2012 or closest year
High
est s
core
20
09–2
012 (
%)
Chan
ge ov
er
five y
ears
(%
)
High
est s
core
20
09–2
013
(% of
age c
ohor
t)
Chan
ge ov
er
five y
ears
(%)
Tota
l
Wom
en
(%)
Natu
ral
scie
nces
Wom
en
(%)
Engi
neer
ing
Wom
en
(%)
Heal
th an
d we
lfare
Wom
en
(%)
Armenia 25 2.5 51 -3.0 377 28 92 23 81 11 10 30
Azerbaijan 16 -6.0 20 1.4 406-1 31-1 100-1 27-1 45-1 13-1 23-1 39-1
Belarus 24 – 93 19.3 1 192 55 210 50 224 37 180 52
Georgia 31 -0.3 33 7.8 406 54 63 56 65 40 33 64
Moldova 25 5.0 41 3.0 488 60 45 56 37 46 57 944
Turkey 18 4.4 69 29.5 4 506-1 47-1 1 022-1 50-1 628-1 34-1 515-1 72-1
Ukraine 36 5.0 80 1.0 8 923 57 1 273 51 1 579 35 460 59
-n = refers to n years before reference year
Note: The total PhD data cover natural sciences, engineering, health and welfare, agriculture, education, services, social sciences and humanities. Natural sciences cover life sciences, physical sciences, mathematics and computing.
Source: UNESCO Institute for Statistics; for the labour force with tertiary education: World Bank’s World Development Indicators, except for Ukraine: State Statistics Service
316

Countries around the Black Sea
Turkey 2 217
2 648
1 9291 7761 662
1 237
1 048
702
Belarus* 1 961
Azerbaijan 1 677
Ukraine* 1 451Armenia* 1 300
Moldova 932
Georgia – 1 183
500
2001 2002 2003 2004 2005 2006 2007 2008 2009 2010 2011 2012 2013
1000
1500
2000
2500
3000
* based on underestimated data, as many researchers have secondary jobs in R&D
Source: UNESCO Institute for Statistics, March 2015
Note: This figure is more useful for discerning the evolution over time than strict cross-country comparisons, as the latter do not all apply international statistical methodologies. Data are unavailable for Armenia and Georgia.
Turkey 609
Belarus 1 183
837
680
229
79 100Azerbaijan 124
Ukraine 511
Moldova 730
300
600
900
1 200
1 500
Rese
arch
ers
in b
usin
ess
ente
rpris
es p
er m
illio
n in
habi
tant
s
2001 2002 2003 2004 2005 2006 2007 2008 2009 2010 2011 2012 2013
Figure 12.2: Trends in researchers from the Black Sea countries, 2001–2013
Turkey's researcher density has doubled in a decadeResearchers per million inhabitants, by head count
Gender parity is a reality in most Black Sea countriesResearchers by field of employment and gender, in head counts, 2013
*Partial dataNote: Data for Turkey are for 2011.
Total Natural sciences Engineering Medical sciencesAgricultural
sciences Social sciences Humanities
Total Women (%)
Total Women (%)
Total Women (%)
Total Women (%)
Total Women (%)
Total Women (%)
Total Women (%)
Armenia* 3 870 48.1 2 194 46.4 546 33.5 384 61.7 45 66.7 217 47.0 484 60.5
Azerbaijan 15 784 53.3 5 174 53.9 2 540 46.5 1 754 58.3 1 049 38.5 2 108 48.9 3 159 63.1
Belarus 18 353 41.1 3 411 50.6 11 195 31.5 876 64.6 1 057 60.1 1 380 59.1 434 60.8
Moldova 3 250 48.0 1 168 45.7 448 29.0 457 52.5 401 45.4 411 68.4 365 52.6
Turkey 166 097 36.2 14 823 35.9 47 878 24.8 31 092 46.3 6 888 31.6 24 421 41.1 12 350 41.9
Ukraine 65 641 45.8 16 512 44.5 27 571 37.2 4 200 65.0 5 289 55.0 4 644 61.4 2 078 67.8
Researcher density in the business sector is up in Belarus and Turkey Researchers employed by business enterprises per million inhabitants, by head count
317
Chapter 12

318
UNESCO SCIENCE REPORT
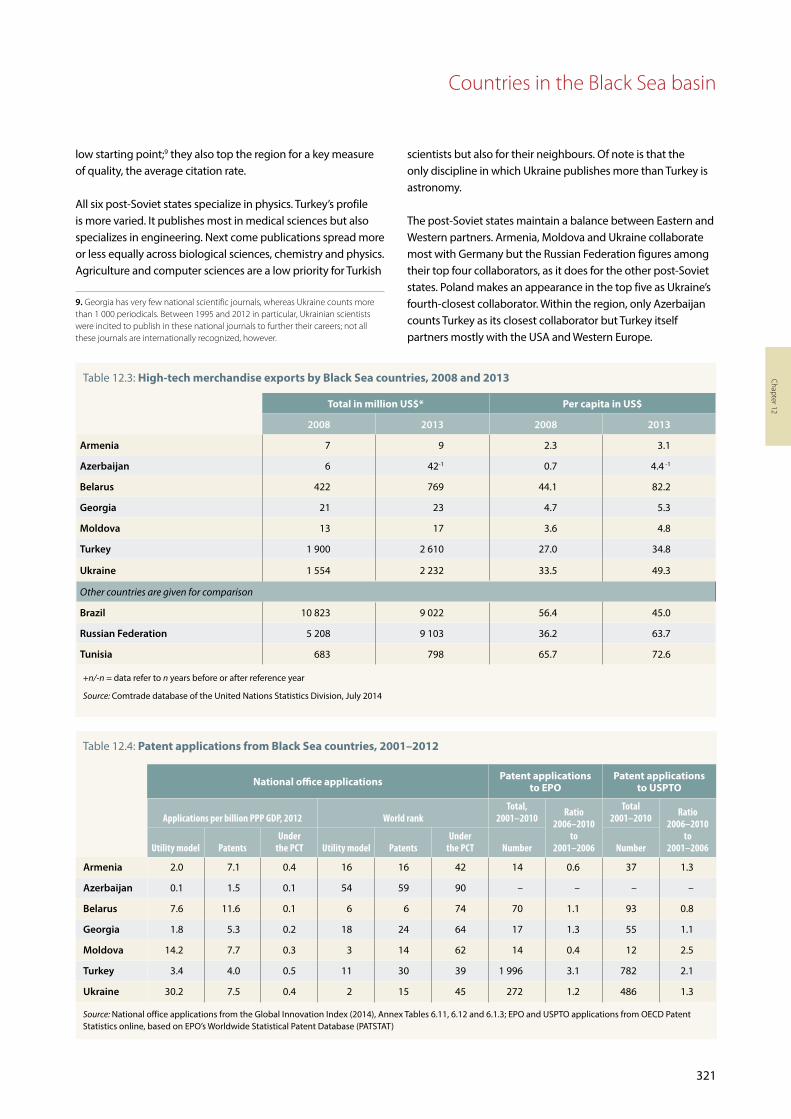
High-tech exports7 provide a more approximate measure; they place Belarus and Ukraine, and to a lesser extent Turkey, at levels similar to those of some major middle-income countries but their performance is by no means comparable to that of countries pursuing global competitiveness through technology-intensive production, such as Israel or the Republic of Korea (Table 12.3). This said, the fact that some countries are expanding production and trade in medium-tech products can also attest to STI activity, as we shall see in some of the country profiles that follow.
Patents provide an even more roundabout indicator of innovation. Moreover, most Black Sea countries do not have patent indicators using the ‘nowcasting’ method, which provides reasonably accurate and timely estimates for OECD countries. With this caveat in mind, we can observe the following (Table 12.4):
n Per unit of GDP, the number of patents filed by residents at the national patent offices of Black Sea countries was
7. including a growing number of commodities such as computers and other ICT goods
among the highest in the world in 2012, according to the Global Innovation Index (2014).
n Patent Cooperation Treaty applications, indicating an extra effort to protect intellectual property internationally, have been growing moderately in Armenia, Moldova and Ukraine and very strongly in Turkey. Applications to the two largest developed country offices (European Patent Office and the US Patent and Trademark Office) have grown quite strongly for Turkish residents and, to a lesser extent, for Armenian and Ukrainian ones.
n None of the Black Sea countries seem to invest significant resources in Triadic patents, indicating that they are not yet at a stage of development where they can compete with the advanced economies for S&T-driven industrial competitiveness.
n The Black Sea countries appear to invest heavily in acquiring trademarks, which give a measure of creative effort but are less directly correlated with S&T as such, according to the Global Innovation Index (2014).
Figure 12.3: GERD/GDP ratio for the Black Sea countries, 2001–2013
Source: UNESCO Institute for Statistics, March 2015
Turkey 0.95
1.02
0.71
0.54
0.34
0.280.24
Belarus 0.69
Azerbaijan 0.21
Ukraine 0.77
Armenia 0.24
Moldova 0.36
2001 2002 2003 2004 2005 2006 2007 2008 2009 2010 2011 2012 20130.0
0.2
0.4
0.6
0.8
1.0
1.2
Georgia 0.18
Chapter 12
Note: for Georgia, state budgetary expenditure on R&D only from the National Statistics Office Source: World Bank's World Development Indicators, as of September 2014; UNESCO Institute for Statistics, March 2015
Figure 12.4: GDP per capita and GERD/GDP ratio in the Black Sea countries, 2010–2013 (average)For economies with GDP per capita between PPP$ 2 500 and PPP$ 30 000
0
0.50
1.00
1.50
GER
D/G
DP
ratio
(%)
2.00
2.50
27 500
Slovenia
Estonia
China
Czech Republic
Portugal
HungaryBrazil
Russian Federation
Malaysia
LithuaniaTurkey
Croatia
Latvia
South Africa
Egypt Costa Rica
UkraineIndia
Moldova
Kyrgyzstan
Cabo VerdeParaguay
GuatemalaEl Salvador
Georgia FYR Macedonia
PakistanArmenia Mongolia
Sri Lanka
Namibia
Ghana
Panama
Montenegro
Colombia
Serbia
Morocco
Bulgaria
Mexico
Belarus
Romania
Cuba
Uruguay
Azerbaijan
Iraq
Chile
Kazakhstan
Trinidadand Tobago
Poland
SlovakiaMalta
Greece
22 50017 50012 5007 5002 500
Countries in the Black Sea basin
319

320
UNESCO SCIENCE REPORT
n On the whole, the legislative and institutional framework for intellectual property protection is in place in the Black Sea countries but there is room for improvement, especially for countries which are not members of the World Trade Organization (WTO8), both as concerns compliance with WTO’s Agreement on Trade-Related Aspects of Intellectual Property Rights (Sonnenburg et al., 2012) and, in the case of Turkey, a stronger commitment to fighting counterfeiting and piracy, for instance (EC, 2014).
8. Georgia joined the WTO in 2000, Moldova in 2001, Armenia in 2003 and Ukraine in2008. Turkey has been a member of the Global Agreement on Trade and Tariffs (the precursor to WTO) since 1951. Neither Azerbaijan, nor Belarus is a member.
Publications progressing in some countries, stagnating in othersIf we measure productivity in terms of articles published in international journals, we find that Belarus, Moldova and Ukraine were at about the same level in 2014 as in 2005; this should be of concern (Figure 12.6). Armenia and Turkey have made the most progress, with Armenia having almost doubled the number of articles per million inhabitants from 122 to 232 over this period and Turkey’s ratio having risen from 185 to 311 per million. If we combine researcher density and output per researcher, Turkey has clearly made the greatest progress; it also has higher population growth than its neighbours. Georgian scientists have not only increased their publication rate from a
Figure 12.5: GERD in the Black Sea region by sector of performance, 2005 and 2013
Note: The data for Armenia and Georgia do not show business R&D expenditure as a separate category, since official statistics tend to use the classification system inherited from Soviet times when all industrially oriented companies belonged to the state; although some companies have since been privatized, business expenditure on R&D tends to be included in public sector expenditure to preserve a time series.
Source: UNESCO Institute for Statistics, March 2015
2005
Armenia Azerbaijan Belarus Georgia Moldova Turkey Ukraine
2013 2005 2013 2005 2013 2005 2005 2013 2005 2013 2005 20130
20
40
60
80
100
Business enterprise Government Higher education
94.2
5.8
88.6
11.4
72.6
20.9
6.5
85.5
10.3
4.0
38.6
44.4
17.0
23.8
65.3
10.8
72.8
17.9
9.3
69.8
19.9
10.4
11.6
33.8
54.6
10.4
47.5
42.1
30.2
65.1
4.7
38.6
55.3
6.2
73.2
26.8
Countries in the Black Sea basin
321
Chapter 12
scientists but also for their neighbours. Of note is that the only discipline in which Ukraine publishes more than Turkey is astronomy.
The post-Soviet states maintain a balance between Eastern and Western partners. Armenia, Moldova and Ukraine collaborate most with Germany but the Russian Federation figures among their top four collaborators, as it does for the other post-Soviet states. Poland makes an appearance in the top five as Ukraine’s fourth-closest collaborator. Within the region, only Azerbaijan counts Turkey as its closest collaborator but Turkey itself partners mostly with the USA and Western Europe.
low starting point;9 they also top the region for a key measure of quality, the average citation rate.
All six post-Soviet states specialize in physics. Turkey’s profile is more varied. It publishes most in medical sciences but also specializes in engineering. Next come publications spread more or less equally across biological sciences, chemistry and physics. Agriculture and computer sciences are a low priority for Turkish
9. Georgia has very few national scientific journals, whereas Ukraine counts more than 1 000 periodicals. Between 1995 and 2012 in particular, Ukrainian scientists were incited to publish in these national journals to further their careers; not all these journals are internationally recognized, however.
Table 12.3: High-tech merchandise exports by Black Sea countries, 2008 and 2013
+n/-n = data refer to n years before or after reference year
Source: Comtrade database of the United Nations Statistics Division, July 2014
Total in million US$* Per capita in US$
2008 2013 2008 2013
Armenia 7 9 2.3 3.1
Azerbaijan 6 42-1 0.7 4.4 -1
Belarus 422 769 44.1 82.2
Georgia 21 23 4.7 5.3
Moldova 13 17 3.6 4.8
Turkey 1 900 2 610 27.0 34.8
Ukraine 1 554 2 232 33.5 49.3
Other countries are given for comparison
Brazil 10 823 9 022 56.4 45.0
Russian Federation 5 208 9 103 36.2 63.7
Tunisia 683 798 65.7 72.6
Table 12.4: Patent applications from Black Sea countries, 2001–2012
National office applications Patent applications to EPO
Patent applications to USPTO
Applications per billion PPP GDP, 2012 World rank Total,
2001–2010 Ratio 2006–2010
to 2001–2006
Total 2001–2010 Ratio
2006–2010to
2001–2006Utility model PatentsUnder
the PCT Utility model PatentsUnder
the PCT Number Number
Armenia 2.0 7.1 0.4 16 16 42 14 0.6 37 1.3
Azerbaijan 0.1 1.5 0.1 54 59 90 – – – –
Belarus 7.6 11.6 0.1 6 6 74 70 1.1 93 0.8
Georgia 1.8 5.3 0.2 18 24 64 17 1.3 55 1.1
Moldova 14.2 7.7 0.3 3 14 62 14 0.4 12 2.5
Turkey 3.4 4.0 0.5 11 30 39 1 996 3.1 782 2.1
Ukraine 30.2 7.5 0.4 2 15 45 272 1.2 486 1.3
Source: National office applications from the Global Innovation Index (2014), Annex Tables 6.11, 6.12 and 6.1.3; EPO and USPTO applications from OECD Patent Statistics online, based on EPO’s Worldwide Statistical Patent Database (PATSTAT)

UNESCO SCIENCE REPORT Strong growth in publications in the smaller countries and Turkey
Turkey has the highest publication intensity, followed by ArmeniaPublications per million inhabitants in 2014
Georgia comes closest to the OECD average for the citation rate Average citation rate, 2008–2012
Figure 12.6: Scientific publication trends in the Black Sea countries, 2005–2014
322
237
381
978
13 830
2005 2006 2007 2008 2009 2010 2011 2012 2013 2014
Turkey 23 596
4 029Ukraine 4 895
Belarus 1 077
Armenia 691
Georgia 527Azerbaijan 425
Moldova 248
0
200
400
600
800
1 000
1 200
0
5 000
10 000
15 000
20 000
25 000
213
305
0.92
0.97
0.760.70
0.600.63
Armenia
Ajerbaija
n
Belarus
Georgia
Moldova
Turkey
Ukraine0.0
0.2
0.4
0.6
0.8
0.55
OECD average: 1.08
Armenia
Ajerbaija
n
Belarus
Georgia
Moldova
Turkey
Ukraine0
50
100
150
200
250
300
232
109
311
72
122116
45

Countries in the Black Sea basin
The post-Soviet states balance collaboration with Eastern and Western EuropeMain foreign partners, 2008–2014 (number of papers)
1st collaborator 2nd collaborator 3rd collaborator 4th collaborator 5th collaborator
Armenia USA (1 346) Germany (1 333) France/Rus. Fed. (1 247) Italy (1 191)
Azerbaijan Turkey (866) Russian Fed. (573) USA (476) Germany (459) UK (413)
Belarus Russian Fed. (2 059) Germany (1 419) Poland (1 204) USA (1 064) France (985)
Georgia USA (1 153) Germany (1 046) Russian Fed. (956) UK (924) Italy (909)
Moldova Germany (276) USA (235) Russian Fed. (214) Romania (197) France (153)
Turkey USA (10 591) Germany (4 580) UK (4 036) Italy (3 314) France (3 009)
Ukraine Russian Fed. (3 943) Germany (3 882) USA (3 546) Poland (3 072) France (2 451)
Source: Thomson Reuters’ Web of Science, Science Citation Index Expanded, data treatment by Science–Metrix
The former Soviet states collaborate a lot internationally, Turkey less soShare of papers with foreign co-authors, 2008–2014 (%)
Georgian, Armenian and Moldovan scientists score best for the 10% most-cited papers
Share of papers among 10% most-cited, 2008–2012 (%)
Armenia
Ajerbaijan
Belarus
Georgia
Moldova
Turkey
Ukraine
0 0 20 40 60
60.1
53.0
58.4
71.9
71.2
18.8
47.5
OECD
average: 29.4%
G20 average: 24.6%
9.2
10.7
7.9
5.8
5.6
6.6
246810
4.4OECD average: 11.1%
The former Soviet states publish most in physics, Turkey most in medical sciencesCumulative totals by field, 2008–2014
Ajerbaijan
Belarus
Georgia
Moldova
Turkey
Ukraine
Armenia
Agriculture Astronomy Biological sciences Chemistry Computer science Engineering Geosciences
Mathematics Medical sciences Physics PsychologyOther life sciences Social sciences
18 180
289 420 15 304 64 307 177
2
2 440 3
9
30
26 95 693 32 240 101 313 76 1 028
1
5
15
5 513 1 140 35 827 118 341
325
10 2 738
1
8
30 176 286 154 16
121
161 474 232 5 1 264 2
17
22 76 497 23 122 54 61 95 5 563 6
6 380
559 14 101
10 987
3 314 18 508 8 949 5 253 45 154
932 9 191
178
687
124
982 1 413 5 436 72 3 945 1 339 2 352
1 091
7 10 288
4
29
323
Note: : Some unclassified articles are excluded from these totals, including 28 140 for Turkey, 6 072 for Ukraine and 1 242 for Belarus.
Chapter 12

UNESCO SCIENCE REPORT
324
COUNTRY PROFILES
ARMENIA
A need to strengthen science–industry linkagesArmenia has made a considerable effort to transform its S&T system in recent years. Three important ingredients for success are in place: a strategic vision, political will and high-level support. Building an efficient research system is a strategic objective for the Armenian authorities (Melkumian, 2014). Armenian and foreign experts highlight other advantages, such as the strong science base, a large Armenian diaspora and traditional national values that emphasize education and skills.
Nonetheless, there are still a number of hurdles to overcome before the country can build a well-functioning national innovation system. The most critical among these are the poor linkages between universities, research institutions and the business sector. This is partly a legacy of its Soviet past, when the policy focus was on developing linkages across the Soviet economy, not within Armenia. R&D institutes and industry were part of value chains within a large market that disintegrated. Two decades on, domestic businesses have yet to become effective sources of demand for innovation.
Over the past decade, the government has made an effort to encourage science–industry linkages. The Armenian ICT sector has been particularly active: a number of public–private partnerships have been established between ICT companies and universities, in order to give students marketable skills and generate innovative ideas at the interface of science and business. Examples are Synopsys Inc. and the Enterprise Incubator Foundation (Box 12.2).
Plans to become a knowledge-based economy by 2020 In Armenia, regulations governing ‘public good’ R&D have tended to be a step ahead of those related to the commercialization of R&D. The first legislative act was the Law on Scientific and Technological Activity (2000). It defined key concepts related to the conduct of R&D and related organizations. Next came a key policy decision, the government resolution of 2007 establishing the State Committee of Science (SCS). While being a committee within the Ministry of Education and Science, the SCS was empowered with wide-ranging responsibilities as the leading public agency for the governance of science, including the drafting of legislation, rules and regulations on the organization and funding of science. Shortly after the creation of the SCS, competitive project financing was introduced to complement basic funding of public R&D institutions; this funding has dropped over the years in relative terms. SCS is also the lead agency for the development and implementation of research programmes in Armenia (UNECE, 2014).
Synopsys Inc. Synopsys Inc. celebrated ten years in Armenia in October 2014. This multinational specializes in the provision of software and related services to accelerate innovation in chips and electronic systems. Today, it employs 650 people in Armenia.
In 2004, Synopsys Inc. acquired LEDA Systems, which had established an Interdepartmental Chair on Microelectronic Circuits and Systems with the State Engineering University of Armenia. The Chair, now part of the global Synopsys University Programme, supplies Armenia with more than 60 microchip and electronic design automation specialists each year.
Synopsys has since expanded this initiative by opening
interdepartmental chairs at Yerevan State University, the Russian–Armenian (Slavonic) University and the European Regional Academy.
The Enterprise Incubator Foundation The Enterprise Incubator Foundation (EIF) was founded jointly in 2002 by the government and the World Bank and has since become the driving force of Armenia’s ICT sector. It acts as a ‘one-stop agency’ for the ICT sector, dealing with legal and business aspects, educational reform, investment promotion and start-up funding, services and consultancy for ICT companies, talent identification and workforce development.
It has implemented various projects in Armenia with international companies such as Microsoft, Cisco Systems, Sun Microsystems, Hewlett Packard and Intel.
One such project is the Microsoft Innovation Center, which offers training, resources and infrastructure, as well as access to a global expert community.
In parallel, the Science and Technology Entrepreneurship Programme helps technical specialists bring innovative products to market and create new ventures, as well as encouraging partnerships with established companies. Each year, EIF organizes the Business Partnership Grant Competition and Venture Conference. In 2014, five winning teams received grants for their projects of either US$7 500 or US$15 000. EIF also runs technology entrepreneurship workshops, which offer awards for promising business ideas.
Source: compiled by authors
Box 12.2: Two public–private partnerships in Armenia’s ICT sector

Countries in the Black Sea basin
325
Chapter 12
The SCS led the preparation of three key documents which were subsequently adopted by the government in 2010: the Strategy for the Development of Science 2011–2020, Science and Technology Development Priorities for 2010–2014 and the Strategic Action Plan for the Development of Science for 2011–2015. The Strategy envisages a competitive knowledge-based economy drawing on basic and applied research. The Action Plan seeks to translate this vision into operational programmes and instruments supporting R&D in the country.
The Strategy envisions that ‘by 2020, Armenia is a country with a knowledge-based economy and is competitive within the European Research Area with its level of basic and applied research.’ The following targets have been formulated:
n Creation of a system capable of sustaining the development of science and technology;
n Development of scientific potential, modernization of scientific infrastructure;
n Promotion of basic and applied research;
n Creation of a synergistic system of education, science and innovation; and
n Becoming a prime location for scientific specialization in the European Research Area.
Based on this strategy, the Action Plan was approved by the government in June 2011. It defined the following targets:
n Improve the S&T management system and create the requisite conditions for sustainable development;
n Involve more young, talented people in education and R&D, while upgrading research infrastructure;
n Create the requisite conditions for the development of an integrated STI system; and
n Enhance international co-operation in R&D.
Although the strategy clearly pursues a ‘science push’ approach, with public research institutes as the key policy target, it nevertheless mentions the goals of generating innovation and establishing an innovation system. However, the business sector, which is the main driver of innovation, is not mentioned. In between the Strategy and the Action Plan, the government issued a resolution in May 2010 on Science and Technology Development Priorities for 2010–2014. These priorities were:
n Armenian studies, humanities and social sciences;
n Life sciences;
n Renewable energy, new energy sources;
n Advanced technologies, information technologies;
n Space, Earth sciences, sustainable use of natural resources;
n Basic research promoting essential applied research.
The Law on the National Academy of Sciences (May 2011) is also expected to play a key role in shaping the Armenian innovation system. It allows the academy to carry out wider business activities concerning the commercialization of R&D results and the creation of spin-offs; it also makes provision for restructuring the National Academy of Sciences by combining institutes involved in closely related research areas into a single body. Three of these new centres are particularly relevant: the Centre for Biotechnology, the Centre for Zoology and Hydro-ecology and the Centre for Organic and Pharmaceutical Chemistry.
In addition to horizontal innovation and science policies, the government strategy focuses support schemes on selected sectors of industrial policy. In this context, the State Committee of Science invites private sector participation on a co-financing basis in research projects targeting applied results. More than 20 projects have been funded in so-called targeted branches: pharmaceuticals, medicine and biotechnology, agricultural mechanization and machine building, electronics, engineering, chemistry and particularly the ICT sphere.
Low R&D spending, shrinking researchersGERD is low in Armenia, averaging 0.25% of GDP over 2010–2013, with little annual variation observed in recent years. This is only around one-third of the ratios observed in Belarus and Ukraine. However, the statistical record of R&D expenditure is incomplete in Armenia, as expenditure in the privately-owned business enterprises is not surveyed. With this proviso, we can affirm that the share of R&D funding from the state budget has increased since the 2008–2009 financial crisis and accounted for around two-thirds (66.3%) of GERD in 2013. In parallel, the number of researchers in the public sector has dropped by 27% since 2008, to 3 870 (2013). Female researchers accounted for 48.1% of the total in 2013. They are underrepresented in engineering and technology (33.5%) but prevalent in medical and health sciences (61.7%) and agriculture (66.7%).
A high degree of autonomy for Armenian universitiesArmenia has a well-established system of tertiary education that encompasses 22 state universities, 37 private universities, four universities established under intergovernmental agreements and nine branches of foreign universities. Universities in Armenia have a high degree of autonomy in formulating curricula and setting tuition fees. Armenia joined the Bologna Process10 in 2005 and universities are
10. The Bologna Process involves 46 European countries which have committed to creating a Higher Education Area. Three key priorities are to generalize across Europe the bachelor’s–master’s–PhD system, quality assurance and the recognition of qualifications. See the box in the UNESCO Science Report 2010, p. 150.
UNESCO SCIENCE REPORT
326
over the period 2011–2014, according to the IMF’s World Economic Outlook (2014).
Some observers expect Azerbaijan’s oil output to pursue its decline. The European Bank for Reconstruction and Development makes this point, for instance, in its Strategy for Azerbaijan 2014. With the world having entered a period of lower oil prices in 2014, devising a growth strategy that is not dependent on commodity exports is becoming more of a strategic issue for Azerbaijan. One example of the government’s desire to strengthen non-oil sources of growth is its decision to finance infrastructure projects through the State Oil Fund of Azerbaijan, which has received high international recognition as a sovereign wealth fund (World Bank, 2010).
An environment not yet conducive to innovationThe National Strategy for the Development of Science in the Republic of Azerbaijan in 2009–2015 (Government of Azerbaijan, 2009) itself recognizes that Azerbaijan’s S&T environment is ill-prepared to realize the country’s innovative potential. GERD has not kept up with the phenomenal growth in GDP in the first decade of the century. Despite a brief surge in 2009, GERD actually contracted by 4% in real terms between 2009 and 2013, as the share of R&D performed by the business sector fell from 22% to 10%. Over the past decade, the number of Azeri researchers has stagnated, even declining in the business sector. AzStat indicates a 37% jump in total researchers in 2011–2013 but the country does not publish data in full-time equivalents.
Apart from sheer numbers, the ageing of the research body is a key issue in Azerbaijan. Already in 2008, 60% of Azeri PhD-holders were aged 60 years or more (Government of Azerbaijan, 2009). AzStat data suggest that the proportion of researchers under the age of 30 dropped from 17.5% in 2008 to 13.1% in 2013. Moreover, there is no indication of a determined educational effort to bring fresh blood to the research establishment. Tertiary enrolment as a whole has been stagnant (Table 12.2) and the number of doctoral graduates in science and engineering is dropping, as is the share of women among them; women represented 27% of the total in 2006 but only 23% by 2011. Finding qualified labour has become a serious problem for high-tech enterprises in Azerbaijan (Hasanov, 2012).
The weakness of Azerbaijan’s STI effort is also reflected in its modest publication and patent record, coupled with very low exports in high-tech goods (Tables 12.3 and 12.4 and Figure 12.6). A number of qualitative issues underlie these quantitative shortcomings. According to a UNESCO Memorandum from 2009 on the Formulation of a Science, Technology and Innovation (STI) Strategy and STI Institutional
currently working to align the standards and quality of their qualifications. With only a few exceptions, universities tend to focus almost exclusively on teaching and do not engage in, or encourage, research by staff (UNECE, 2014).
Armenia ranks 60th out of 122 countries for education – lagging somewhat behind Belarus and Ukraine but ahead of Azerbaijan and Georgia (WEF, 2013). Armenia ranks better for tertiary enrolment (44th out of 122 countries), with 25% of the workforce possessing tertiary education (Table 12.2). It performs poorly, though, according to the workforce and employment index (113th out of 122 countries), primarily due to high unemployment and low levels of employee training.
Next steps for Armenian Greater focus needs to be assigned to integrating
Armenian R&D institutes and businesses into global value and supply chains by further developing co-operation with leading producers as a specialized supplier of components, for instance.
n The poor statistical base and a limited evaluation culture make it difficult to obtain a clear picture of technological capabilities; this poses clear challenges for evidence-based policy making.
n R&D institutes could be restructured to increase the efficiency of resource allocation to R&D, such as by turning some of them into technical institutes supporting knowledge-intensive SMEs. These institutes should rely on a combination of public and commercial funding and co-operate closely with technoparks.
n The introduction of a system of international evaluation could serve as a basis for integrating complementary university research departments and research institutes, in order to make savings that could be used gradually to raise expenditure on education; the criteria for selecting centres of excellence would give equal weight to the institution’s international and local relevance.
AZERBAIJAN
Moves to reduce dependence on commodity exportsOil and gas extraction dominates the Azeri economy. From the early to late 2000s, its share in GDP rose from around a quarter to more than half, before receding somewhat in more recent years. Oil and gas account for around 90% of exports and the bulk of fiscal revenues (Ciarreta and Nasirov, 2012). During a period of high oil prices, growth led by energy exports enabled a sharp rise in per capita income and a dramatic fall in the measured poverty rate. Non-oil GDP also grew but, following the 2008–2009 global financial crisis, economic growth slowed considerably to about 2% per year
Countries in the Black Sea basin
327
Chapter 12
Capacity Building in Azerbaijan: Plan of Action, November 2009–December 2010, these issues include the following:
n STI functions are concentrated in the Azerbaijan National Academy of Sciences (ANAS) and universities have failed to develop strong R&D links with the business enterprise sector.
n Certain administrative or other hurdles constrain the expansion of private universities.
n The allocation of government funding to public universities seems to follow popular demand for certain subjects, such as business studies or international relations, and penalize studies in science and engineering disciplines.
n There appear to be special difficulties in expanding doctoral programmes in regular university departments.
n R&D equipment is obsolete and the measured productivity of research is very low.
n Financial allocations to research institutions are not transparent and there is insufficient independent evaluation.
The entire spectrum of science–industry linkages, from technology transfer offices to business incubators, technoparks and early-stage financing, remain weak in Azerbaijan (Dobrinsky, 2013). The R&D system consists largely of sector-based government laboratories and remains ‘isolated from market and society’ (Hasanov, 2012). Innovative SMEs are rare, as everywhere, but even larger enterprises do not seem to pursue technology-intensive activities. Only 3% of Azerbaijan’s industrial output is high-tech (Hasanov, 2012). The growth of technologically intensive activity is constrained by problems in the general business environment, where Azerbaijan ranks near the bottom for Eastern Europe and Central Asia (World Bank, 2011), despite improvements in recent years.
More generally, according to Hasanov (2012), the governance of Azerbaijan’s national innovation system is characterized by limited administrative capacity for policy design and implementation; the lack of an evaluation culture; an arbitrary policy-making process; a lack of quantitative targets in most of the adopted policy documents related to the promotion of innovation and a low level of awareness of recent international trends among government officials responsible for developing innovation policy.
STI has become a greater priorityIn recent years, the government has sought to develop the contribution of STI to the economy, notably by inviting UNESCO’s assistance in 2009 in developing an Azerbaijan Science, Technology and Innovation Strategy. This document was intended to build on the National Strategy (Government of Azerbaijan, 2009) adopted by Presidential Decree in May 2009, with ANAS being designated co-ordinator of the Strategy.
More recently, the government has launched a new wave of initiatives, notably by elevating responsibility for STI policy to cabinet level. In March 2014, the mandate of the former Ministry of Communications and Information Technologies was also broadened to that of Ministry of Communications and High Technologies. This development is part of a series of executive actions since 2012, including the:
n creation of a State Fund for the Development of Information Technologies (2012), which is intended to provide start-up funding11 for innovative and applied S&T projects in ICT fields through equity participation or low-interest loans;
n announcement of the development project Azerbaijan – 2020: Outlook for the Future by the Presidency (July 2012), which establishes STI-related goals12 in communications and ICTs, such as the implementation of the Trans-Eurasian Information Super Highway project or equipping the country with its own telecommunications satellites;
n presidential order on the establishment of a High Technologies Park (November 2012);
n adoption of the Third National Strategy for Information Society Development in Azerbaijan covering 2014–2020 (April 2014) – Azerbaijan had the greatest Internet penetration of any Black Sea country in 2013: 59% of the population (Table 12.1);
n creation of a Knowledge Fund under the auspices of the Presidency (May 2014); and the
n creation of a National Nuclear Research Centre under the new Ministry of Communications and High Technologies (May 2014).
The following constitute the current priority areas for S&T development in Azerbaijan, according to a presentation made by Bunyamin Seyidov from ANAS to a Horizon 2020 Eastern Partnership meeting in Chisinau in March 2014:
n ICTs;
n energy and environment;
n efficient utilization of natural resources;
n natural sciences;
n nanotechnologies and new materials;
n safety and risk reduction technologies;
n biotechnology;
n space research; and
n e-governance.
11. See: http://mincom.gov.az/ministry/structure/state-fund-for-development-of-information-technologies-under-mcht
12. See: www.president.az/files/future_en.pdf

UNESCO SCIENCE REPORT
328
Next steps for AzerbaijanThere is no doubt that Azerbaijan is aware of the need to step up its STI effort. Nor is it surprising that the country has not yet managed to overcome the ‘Dutch disease’ associated with a sudden surge in oil wealth (see glossary, p. 738). Although the country has suddenly been propelled to the ranks of an upper middle-income country for GDP per capita, it is still catching up in terms of modernizing its economic and institutional fabric. There is now a need to follow through on these good intentions with decisive reforms, including the following:
n The past few years have seen a vast number of laws and presidential decrees and decisions proclaimed on STI matters but few concrete improvements; it would be useful to carry out a comprehensive evaluation of past measures to identify what is preventing regulatory initiatives from being translated into action.
n The large number of STI policy documents adopted in Azerbaijan contain surprisingly few quantitative targets; it would be worthwhile to consider adopting a small number of cautious and judiciously chosen targets, in order to measure progress towards the desired goals and facilitate an ex post evaluation.
n The government should take decisive steps to improve the general business environment, such as by strengthening the rule of law, in order to help Azerbaijan derive economic benefits from its input into innovation.
BELARUS
A specialization in engineering and oil refiningBelarus is not well-endowed with natural resources and relies largely on imported energy and raw materials. Historically, the country has always specialized in processing; the main activities of its large industrial sector (42% of GDP in 2013) are engineering (agricultural technology and specialized heavy vehicles such as tractors) and the refining of oil supplied mainly by Russia. These sectors are heavily dependent on external demand, which is why foreign trade contributes a bigger share of GDP for this upper middle-income economy than for any other in this group (Table 12.1). With 50% of trade involving the Russian Federation, the Belarusian economy has been vulnerable to the crisis currently affecting its biggest commercial partner; for example, after the Russian ruble lost nearly 30% of its value in just a few days in December 2014, the value of the Belarus ruble fell by half.
The Belarusian authorities have followed a path of gradual transition towards a market economy. The state retains significant levers of influence over the economy and there has only been limited privatization of large enterprises. The authorities have developed initiatives in recent years
to improve the business environment and promote the development of SMEs. However, state companies continue to dominate production and exports, whereas the rate of new firm creation remains low (UNECE, 2011).
Belarus is a catching-up economy that will remain dependent on imported technology for some time to come, despite having declared 20 years ago that its strategic policy objective was to develop an economy based on science and technology. Since then, more than 25 laws and presidential decrees have been introduced, some 40 governmental decrees have been issued and many other legal acts have been put in place to contribute to this stated aim. All this has created broad awareness of the importance of science and technology for the country’s economic prosperity.
Ministries and other governmental bodies have developed The Concept for the National Innovation System on the basis of the National Strategy 2020, adopted in 2006, the Technology forecast 2006–2025 and other strategic documents. The Concept approved by the Science and Technology Policy Committee of the Council of Ministers in 2006 recognizes the sectorial approach as being predominant in developing and implementing the country’s science and innovation policy.
Scientific co-operation is growingThe government was planning to increase GERD to 1.2–1.4% of GDP by 2010 but this has not been achieved. This eliminates any likelihood of reaching the more recent target of raising GERD to 2.5–2.9% of GDP by 2015, a target ensconced in the Programme of Social and Economic Development for the Republic of Belarus covering 2011–2015 (Tatalovic, 2014).
The Belarusian R&D system is strongly dominated by technical sciences, which represent approximately 70% of GERD, whatever the source of funding (including the state’s goal-oriented programmes). Sectorial ministries in Belarus each have their own established funds to finance innovation in key economic sectors, such as construction, industry, housing and so on. Arguably the most successful of these funds is that targeting ICT companies.
Only 3.6% of R&D funding was spent on international co-operation in 2012 , according to the Belarusian journal Nauka i innovatsii (2013). There is no specific national policy document on international collaboration in the various scientific fields. The share of GERD funded from abroad, which oscillated around 5–8% between 2003 and 2008, climbed to 9.7% on average in 2009–2013. The number of research projects with international partners has also more than doubled in the past seven years.

Countries in the Black Sea basin
329
Chapter 12
A skilled labour force but ageing researchersThe Belarusian R&D system reflects the legacy of its Soviet past, as privately owned business enterprises are not a major performer of R&D, in contrast to what you find in market economies. This said, the R&D system is, in principle, largely oriented towards enterprises, which buy S&T services from ‘branch’ research institutes. In Belarus, the latter play a bigger role in providing S&T services than the university sector. This feature has remained a strong characteristic of the Belarusian system, despite the gradual transformation taking place.
Belarus has preserved engineering competencies in large enterprises and has a skilled labour force. Although its R&D potential remains high, the deteriorating age structure, coupled with brain drain, has negatively affected actual performance. In the past ten years, the share of R&D staff aged between 30 and 39 years has halved from more than 30% to about 15% of the total. The number of those aged 60 and above has grown six-fold. The reputation of scientists and their status remain high in Belarus but the profession’s appeal has waned.
The distribution of R&D staff within the country is irregular. Three-quarters of researchers are still concentrated in the capital, followed by the Minsk and Gomel regions. Relocating research personnel is costly and strongly dependent both on the availability of research infrastructure and the overall economic situation, which has not been conducive in recent years to relocation programmes.
Owing to changes in statistical methodology which now consider state enterprises operating like commercial entities as being part of the business enterprise sector, in line with the OECD’s approach, business spending on R&D has risen to the detriment of government funding (down to roughly 0.45% of GDP in 2013). The role of the higher education sector remains negligible.
The number of articles published in internationally tracked journals has stagnated in recent years (Figure 12.6). Belarus is performing much better in terms of national patents. Domestic patent applications are up from fewer than 700 per year in the early 1990s to more than 1 200 in 2007–2012. For this indicator, Belarus is doing better than some of the new EU members, such as Bulgaria or Lithuania.
Next steps for BelarusFrom the foregoing, it would seem advisable to consider taking the following steps:
n Complementing existing ‘vertical’ instruments in high-level policy documents with ‘horizontal’ ones cutting across firms, industries and sectors to improve linkages among the various stakeholders in innovation;
n Facilitating and encouraging access by innovative SMEs to state science and technology programmes; in addition to the development of science and technology parks, innovation-related tax incentives could be applied across all sectors and industries and incentives could be offered to foreign firms to encourage them to set up R&D centres in Belarus;
n Granting targeted tax relief for early-stage innovation by SMEs, in particular, such as subsidized loans, innovation grants or vouchers and credit guarantee schemes, which take on some of the risk borne by the innovative SME of defaulting on a loan;
n Conducting an ex post evaluation (which combines quantitative and qualitative assessments) of the degree to which programmes, projects and policy instruments meet policy objectives and targets; incorporating elements that facilitate subsequent ex post evaluation at the early stages of designing programmes, policies and related instruments; and
n Expanding the scope and outreach of regional programmes promoting science and technology to encompass regional innovative development, accompanied by the requisite additional resources.
GEORGIA
Ahead on market reforms but STI could do more to drive developmentCompared with other economies at a similar stage of development, Georgia is one of the most advanced in implementing market-oriented reforms but also one of the least focused on nurturing STI for socio-economic development.
With few natural resources to speak of and hardly any legacy of heavy industry, Georgia’s economy has been dominated by the agro-industry since Soviet times. As late as 2009, food and beverages represented 39% of manufacturing output and the share of agriculture in employment stood at 53% (FAO, 2012). Exports of transport services (including oil and gas via pipelines) have become important sources of revenue, representing 5–6% of GDP in the last five years, according to the World Bank. Broad-based growth is presently reducing the relative importance of these sectors, however. The Georgian economy grew by an average of 6% per year between 2004 and 2013, driven by ‘a noteworthy push on structural reforms and liberalisation starting in 2004’ (World Bank, 2014).
Indeed, Georgia has been one of the most resolute reformers of modern times when it comes to advancing economic freedoms and improving the business environment. The country rose 101 places in the World Bank’s Doing Business Indicator between 2005 and 2011. Meanwhile, its extensive anti-

UNESCO SCIENCE REPORT
330
corruption and administrative simplification campaign helped lower the share of the informal economy in Georgia’s fast-growing GDP from 32% to 22% from 2004 to 2010 (OECD et al., 2012).
Against the backdrop of this economic success story, Georgia currently presents a much more ambivalent picture when it comes to STI:
n Government funding for R&D is low and unstable – state budgetary expenditure on R&D tripled between 2009 and 2011, only to contract by two-thirds again by 2013, according to the National Statistics Office. The budget is allocated in a haphazard way as a result of institutional inertia and much of it is spent on non-scientific needs (State Audit Office, 2014).
n R&D in the business sector is not measured and there is a general lack of comparable data on STI for recent years.
n Georgia occupies a median position among the seven Black Sea countries in terms of scientific output
(Figure 12.6).
The government’s recent audit of the science sector (State Audit Office, 2014) makes a critical assessment of the situation, arguing that, ‘science does not significantly participate in the process of economic and social development (in Georgia).’ The assessment underlines the disconnect between applied research and concrete innovation and ‘the private sector’s lack of interest in research.’ It also deplores the absence of any evaluation of publicly funded research.
In addition to its own half-hearted efforts to generate new knowledge and technology, Georgia is making little use of the technology that is globally available; despite the country’s relative openness to trade, its imports of high-tech goods have stagnated at low levels, with just 6% growth over 2008–2013, according to the UN's Comtrade database.
Urgent challenges in educationThe country’s neglect of education is likely to constrain future growth prospects. Although the educational attainment of the adult population has been historically high in Georgia, the tertiary enrolment rate in 2013 remained 13.5 percentage points below the peak in 2005. Doctorates awarded in science and engineering slid by 44% (to a total of 92) in the five years to 2012 and enrolment at this level in these fields also fell sharply, although there has been a surge in recent years, according to the UNESCO Institute for Statistics.
Georgia also faces challenges with regard to the quality of secondary education. The performance of the country’s 15 year-olds in reading, mathematics and science was comparable to that of some of the lowest-ranking countries in the OECD’s Programme for International Student Assessment
in 2009 (Walker, 2011). Georgia also ranks below comparable countries in the Trends in International Mathematics and Science Study survey of 2007. At the tertiary level, Georgia’s inbound mobility is virtually zero, indicating serious attractiveness problems. As outbound mobility is high, brain drain is also a potential problem, according to a 2010 study by the Technopolis Group of the way in which doctoral programmes are run in EU neighbouring programmes.
Time for a strategic visionThe present STI institutional structure in Georgia began to emerge after what is known as the Revolution of Roses13
in 2003. Cabinet-level responsibility for science policy rests within the Ministry of Education and Science (MoES), within the framework of the Law on Higher Education (2005) and the Law on Science, Technologies and their Development (2004, modified in 2006). The National Academy of Sciences was formed by merging older academies in 2007; it fulfils an advisory role in STI matters. The principal government instrument for funding public research is the Shota Rustaveli National Science Foundation, which was formed in 2010 by merging the National Science Foundation with the Foundation for Georgian Studies, Humanities and Social Sciences.
The government’s own audit acknowledges that a ‘strategic vision and priorities of scientific activities are not defined.’ Moreover, in the absence of top-down sectorial priorities, the Rustaveli Foundation is believed to allocate project funding across fields based on the merits of each proposal in isolation. There are no data to assess the outcome of recent reforms designed to integrate public research institutions and universities and knowledge transfer offices are yet to be created on university campuses (State Audit Office, 2014).
International development partners from advanced Western economies have been active in Georgia in the past ten years and have contributed studies on the strengths, weaknesses, opportunities and threats facing STI in Georgia. One such Constraints Analysis was undertaken by the Government of Georgia in co-operation with the Millennium Development Challenge Corporation in 2011. These partners have also analysed specific science sectors and trends in overseas development assistance. One example is the study by Georgia’s Reforms Associates in 2014 on Analyzing Ways to Promote Research in Social Sciences in Georgia’s Higher Education Institutions, funded by USAID.
Next steps for GeorgiaThe government’s liberal, hands-off approach to economic development has brought considerable benefits but Georgia
13. The Revolution of Roses was characterized by widespread protests over disputed parliamentary elections which led to President Eduard Shevardnadze’s forced resignation in November 2003.

Countries in the Black Sea basin
331
Chapter 12
would now gain from additional policies that harness STI to development. It should act upon the recommendations made by the State Audit Office (2014) and consider the following:
n There is a need to improve the availability of timely and internationally comparable data on STI input and output.
n On the education front, Georgia has key advantages on which it can capitalize, including the greatly reduced level of corruption and the absence of demographic pressure; it now needs to reverse the declining tertiary enrolment rates and address quality issues in secondary education.
n There is a need to reflect on an advisory structure on STI matters which would incorporate the perspectives of stakeholders outside government and academic circles, especially the enterprise sector, in the design and implementation of STI policies.
n The development of a national innovation strategy would improve the coherence and co-ordination of policies in different governmental spheres: education, industry, international trade, taxation, etc.
MOLDOVA
An alternative growth engine to replace remittancesMoldova has one of the lowest levels of GDP per capita in Europe and the lowest in the Black Sea region (Table 12.1). Moldova’s emigrant population is among the largest in the world, in relative terms; it accounts for about 30% of the labour force. Workers’ remittances are high (23% of GDP in 2011) but their contribution is expected to stagnate (World Bank, 2013), so the country needs an alternative growth engine based on exports and investment.
Moldova’s economy recovered strongly from the global financial crisis, growing by more than 7% in 2010–2011, but growth has been unstable since, with GDP contracting by 0.7% in 2012 only to rebound by 8.9% in 2013, according to the IMF. This underlines Moldova’s vulnerability to the Eurozone crisis and climatic events such as droughts (World Bank, 2013).
After peaking at 0.55% of GDP in 2005, GERD dropped to 0.36% in 2013, according to the UNESCO Institute for Statistics. The share of GERD performed by business enterprises has been very erratic, dropping from 18% in 2005 to 10% in 2010 before bouncing back to 20% in 2013. The low level of R&D investment means that research infrastructure remains undeveloped, although ICT networks and databases are available to researchers to some extent.
A centralized national innovation systemThe Academy of Sciences is the main policy-making body in Moldova; it fulfils the role of ministry of science, as its
president is a member of the government. It is also the main policy implementation body. Nearly all public R&D and innovation funding programmes are managed by the Academy through its executive body, the Supreme Council for Science and Technological Development, and its subordinated management bodies and agencies, the Centre for Fundamental and Applied Research Funding, the Centre for International Projects and the Agency for Innovation and Technology Transfer. The Consultative Council for Expertise assures the evaluation of these three funding agencies. With its 19 research institutes, the Academy is also the country’s main research organization. Sectorial research institutes under certain ministries also carry out research.
The country’s 32 universities also perform scientific research but not necessarily technological development. The business enterprise sector also performs R&D but only four entities14 are accredited by the Academy of Sciences, thereby giving them access to public competitive R&D funding.
Given the trend in Moldova towards emigration and brain drain, the number of researchers per million inhabitants has stagnated at a level well below those of other Black Sea countries (Figure 12.2). The share of the population with tertiary education is relatively high but the number of new doctorate graduates per 1 000 population aged 25–34 years is less than a fifth of the EU average. Moldova has difficulty in attracting and retaining foreign students and researchers, as the education offered by local universities does not meet market expectations and generally offers unattractive conditions (Cuciureanu, 2014).
The Innovation Strategy: Innovation for Competitiveness developed by the Ministry of the Economy for the period 2013–2020 outlines five general objectives: adoption of an open governance model for research and innovation; strengthening entrepreneurship and innovation skills; encouraging innovation in enterprises; applying knowledge to solve societal and global problems; and stimulating demand for innovative products and services. In parallel, the Strategy for Research and Development of the Republic of Moldova until 2020 prepared under the guidance of the Academy of Sciences and approved in December 2013 establishes an R&D investment target of 1% of GDP by 2020. Neither strategy identifies clear thematic priorities.
The government’s main funding instruments are the so-called institutional projects, which allocate more than 70% of public funds in a semi-competitive mode. These competitive funding
14. Three state enterprises have been accredited, the Institute of Agricultural Engineering (Mecagro), the Research and Production Enterprise of Aquatic Biological Resources (Aquaculture Moldova) and the Research Institute for Construction (INCERCOM) and have access to public competitive R&D funding. A fourth, the Institute for Development of an Information Society, is in the process of obtaining accreditation. Source: http://erawatch.jrc.ec.europa.eu

UNESCO SCIENCE REPORT
332
schemes include state programmes for R&D, international projects and projects for the transfer of new technologies and processes, grants for young researchers, including PhD fellowships, as well as grants for the procurement of equipment, the editing of monographs or for organizing scientific conferences.
The rest is allocated through other funding modes, such as block grants to the administration, research facilities or to subordinated agencies of the Academy of Sciences and to pay for infrastructure. In recent years, there has been a trend towards increasing the share of institutional funding at the expense of the other funding instruments.
Only the state programmes for R&D have a thematic focus (Figure 12.7). The procedure for funding policy instruments, evaluation, monitoring and reporting is identical for each thematic priority. The topics tend to be broad and government funding modest. Moreover, programme-based R&D financing has dropped by two-thirds in the past five years to an insignificant € 0.35 million in 2012.
Next steps for MoldovaSince the 2004 Law on Science and Innovation, the combination of reforms and closer ties with the EU in research and innovation have helped to prop up the national science system but have not been enough to stop its decline. A recent paper by a consultant to the Academy of Sciences recommends prioritizing the following reforms (Dumitrashko, 2014):
n Updating research equipment and the country’s technical base;
n Designing targeted incentive schemes to encourage the young to embark on a research career, including stipends, grants and awards for young scientists, programmes for training abroad and so on;
n Greater participation in the European Research Area and other international networks;
n Accelerating technology transfer and encouraging partnerships between research institutions and the business enterprise sector.
TURKEY
Ambitious development targets to 2023 In the past decade, Turkey has experienced an economic boom that was only briefly curtailed by the global financial crisis. This has carried GDP per capita from one-third (32%) that of high-income economies in 2003 to almost half (47%) in 2013, according to the World Bank’s World Development Indicators, and reduced economic inequalities (OECD, 2014, Box 12.1.) Growth has been driven by the emergence of new, first-generation enterprises in previously non-industrial, low-income parts of the country and accompanied by an expanding employment rate (OECD, 2012, Figure 2.2).
Figure 12.7: Budget breakdown of Moldova’s state programmes for R&D, by thematic priority, 2012 (%)
Source: Cuciureanu (2014)
Efficient growth of the energy sector, energy security, including
renewable resources
Consolidation of the rule of law and utilization of cultural heritage in the perspective of
European integration
Biomedicine, pharmaceuticals and human health
Efficient utilization of human, natural and information resources
for sustainable development
Nanotechnology, industrial engineering, new materials and products
Agricultural biotechnology, soil fertility and food security
2012
12.8
2.5
28.1
16.7
26.9
13.0

Countries in the Black Sea basin
333
Chapter 12
Formulated in 2008, the government’s Strategic Vision 2023 includes ambitious15 development targets, such as achieving a GERD/GDP ratio of 3% by the time the republic celebrates its centenary in 2023 and turning Turkey into a Eurasian hub for medium- and high-tech exports (Table 12.5). It also puts the country’s STI policy goals in context. To the same end, the Tenth Development Plan (2014–2018) establishes operational targets to 2018 such as that of raising the share of business expenditure to 60% of GERD (MoDev, 2013, Table 23), which would imply doubling the number of FTE researchers in five years.
External factors could frustrate Turkey’s ambitions Turkey’s ambitions could yet be frustrated by external factors. The country’s economic growth remains dependent on foreign capital flows. As much of these flows are non-FDI, growth is subject to changing perceptions of Turkey’s country risk, or to swings in monetary policy in the USA or Eurozone. With many of Turkey’s principal export markets appearing to be trapped in an extended period of modest growth, at best, Turkey’s official development targets seem very difficult to reach. Apart from a period between 2002 and 2007 when total factor productivity growth was the main driver, it is the increases in capital and labour input which still primarily drive growth in Turkey (Serdaroğlu, 2013). Historically, growth in manufacturing has been driven mainly by greater use of technology, rather than by the generation of new technologies (Şenturk, 2010). All these reasons justify a renewed focus and re-examination of STI policies in Turkey, in order to learn from recent experience.
Some university–industry collaboration but quality is an issueSince the release of the UNESCO Science Report 2010, Turkey has been pursuing the vigorous expansion of R&D which began around 2004. The R&D intensity of the economy is
15. See: www.tubitak.gov.tr/en/about-us/policies/content-vision-2023
approaching levels found in advanced economies such as Spain or Italy, but is well below that found in fast-growing emerging market economies such as China, where the business enterprise sector contributes more than 70% of GERD. At the same time:
n Turkey has pursued its efforts to improve the quantity and quality of schooling available to the average person. For instance, there has been a significant improvement in the scores of 15 year-olds in mathematics in the OECD’s Programme for International Student Assessment; this feat is attributed both to the growing wealth of the general population, which can afford better tutoring, and to the impact of education sector reforms (Rivera-Batiz and Durmaz, 2014).
n Internationally comparable opinion surveys of managers generally place Turkey below levels found in the more advanced emerging market economies, although there has been some improvement in the past five years, according to the Global Innovation Index (2014) and successive Global Competitiveness Reports since 2008.
n More generally, Turkey’s rankings in qualitative international comparisons tend not to match its ambitions. One international survey of business executives in 25 of the principal innovative economies suggests that the gap between in-country executives’ opinion of the quality of the innovation environment in Turkey and that of outsiders is one of the widest of any country (Edelman Berland, 2012).
n Whereas the percentage of women with a PhD in science and engineering fields has been improving in recent years, the gender balance between researchers has been going the other way, especially in the private sector, and remains quite low in decision-making circles. As of 2014, none of the 20 permanent members of the Supreme Council for Science and Technology was a woman.
Table 12.5: Key development targets for Turkey to 2018 and 2023
Situation in 2012 Targets to 2018 Targets to 2023
GDP per capita at market prices (US$) 10 666 16 000 25 000
Merchandise exports (US$ billions) 152 227 500
Share of world trade (%) 1.0 _ 1.5
GERD/GDP ratio 0.86 1.80 3.0
Share of GERD performed by business enterprise sector (%) 43.2 60.0 _
Researchers (FTE) 72 109 176 000 _
Source: MoDev (2013); World Bank’s World Development Indicators, accessed November 2014; UNESCO Institute for Statistics, March 2015

UNESCO SCIENCE REPORT
334
A highly centralized national innovation system The institutional structure of the Turkish STI system remains highly centralized (TÜBITAK, 2013, Figure 1.1). Key recent developments include:
n The mandate of the former Ministry of Industry and Commerce was broadened in 2011 to that of a Ministry of Science, Technology and Industry, which now oversees the Scientific and Technological Research Council of Turkey (TÜBITAK).
n The former State Planning Agency was transformed into the Ministry of Development in 2011 and is now responsible for preparing the Technological Research Sector Investment Budget, amounting to PPP$1.7 billion in 2012 (TÜBITAK, 2013), and for co-ordinating regional development agencies.
n In August 2011, the government changed the statutes of the Turkish Academy of Sciences (TUBA) by decree and increased the share of members it can appoint directly to its Science Council, fuelling concerns in the press about TUBA’s future scientific independence.
n Chaired by the prime minister, the Supreme Council for Science and Technology has met five times since 2010 to review progress and foster co-ordination in STI matters. Its recent meetings have tended to focus on a single specific technology sector: energy in 2013, health in 2014.
n Current activities are governed by the National Science, Technology and Innovation Strategy (2011–2016), which sets the following sectorial priorities:
– Target-based approaches in three areas with a strong R&D and innovation capacity: automotive, machinery manufacturing and ICTs;
– Needs-based approaches in areas where acceleration is required: defence, space, health, energy, water and food.
Businesses have not grasped the government’s helping handTurkey participates in various European research co-operation networks and is one of the founding members of the OECD. In 2014, Turkey became an Associate Member of the European Organization for Nuclear Research (CERN), where it had been an Observer since 1961. Turkey has long had close ties to Europe: it was one of the first countries to conclude an Association Agreement with the EU in 1964; it has enjoyed a customs union with the EU since 1996 and opened accession negotiations in 2005. Despite this, science diplomacy got off to a slow start with the EU’s Sixth Framework Programme for Research and Innovation (2002–2006), before accelerating under the Seventh
Framework Programme (2007–2013). Efforts are now being made to seize the opportunities available under the Horizon 2020 programme (2014–2020) more fully. Despite this, the Turkish innovation system's international linkages remain limited, in terms of outcome:
n In innovation surveys, Turkey ranks lowest among OECD countries for both national and international collaboration involving firms, according to the OECD’ STI Scoreboard of 2013.
n The share of GERD funded from abroad is one of the lowest in the Black Sea grouping and has not kept pace with the expansion of the country’s STI effort in recent years: at just 0.8% in 2013, according to the UNESCO Institute for Statistics, it accounted for 0.01% of GDP.
n Although patenting has grown in recent years, Turkey has one of the lowest rates for cross-border ownership of patents among OECD countries and the share of business R&D funded by foreign enterprises is negligible, according to the OECD’s STI Scoreboard (2013). Moreover, unlike many emerging market economies, Turkey does not take part in international trade in R&D services in any significant way.
This said, other aspects of Turkey’s international linkages in STI offer promise:
n Turks are the sixth-largest national contingent for PhDs in science and engineering fields awarded to foreigners in the USA; they earned a total of 1 935 degrees in 2008–2011 (about 3.5% of all foreigners in the USA), compared to the 5 905 similar degrees awarded inside Turkey over the same period (NSB, 2014).
n Generally, Turkish international co-operation in science per se is much stronger than that in innovation. For instance, the USA–Turkey bilateral link is one of the more important examples of co-authorship of scientific articles, according to the OECD’s STI Scoreboard (2013).
On the whole, the dynamic Turkish private sector has not grasped the government’s helping hand when it comes to STI. The Turkish economy has rebounded well from the tight contraction of 2008–2009 but its export performance is not keeping up with competitors in developed country markets (OECD, 2014). Whereas the technologically more advanced regions in the northwest of the country have continued to grow and deepen their integration with the EU, thanks to the customs union, the Turkish economy’s overall shift to higher-tech patenting and exports has been slow, owing partly to the rapid expansion of a ‘middle ground’ of enterprises specializing in relatively low-tech manufactured goods such as textiles, food, plastic and metal products in much of the country for export to developing countries (OECD, 2012). With the boom in Turkish trade with developing countries, the

Countries in the Black Sea basin
335
Chapter 12
EU’s share of Turkish exports has been declining, particularly since 2007; this decline can also be interpreted as slower integration into EU value chains and the technological upgrading that this entails (Işik, 2012).
This said, export performance may not fully capture the ongoing technological transformation:
n The share of manufacturing employment in medium-tech sectors has been growing (OECD, 2012). Anecdotal evidence points to technology-intensive service sectors with growing excellence but few exports to speak of, one example being in-house professional software development in banking, telecommunications and so on. The share of services within business expenditure on R&D has grown strongly from around 20% in the mid-2000s to 47% in 2013, according to the latest OECD statistics.
n There is strong growth in medium-tech exports such as in automotive or machinery production, a trend that is echoed in the field of intellectual property, where the strong recent growth in patenting has been mostly in low or medium technology (Soybilgen, 2013).
n Within a considerably open economy characterized by a customs union with the EU, many Turkish enterprises can afford to import the highest-tech machinery available in their sector, develop production in keeping with global best practice and seek excellence in high-end manufacturing within seemingly low-tech sectors, such as textiles, foodstuffs or logistics.
Next steps for TurkeyHaving made great strides in the level of public support for STI in the past decade, the public authorities now need to consider additional measures to interconnect better the
different players participating in the Turkish innovation system to make the whole more coherent: scientists, universities, public laboratories, large or small enterprises, NGOs and so on.
Measures could include:
n making a systematic effort to involve representatives of industry in the design and implementation of government-driven schemes, from technology parks to the regional development agencies that have been set up since the late 2000s;
n reversing the declining gender balance in human resources in STI, in general, and improving it at the highest decision-making levels, such as within the Supreme Council on Science and Technology;
n moderating the tendency to pursue top-down priorities and sector-specific incentives by taking better account of the very diversified and broad-based dynamism of the Turkish private sector;
n publishing consolidated and timely data on total public support for STI, including the amount of tax incentives;
n surveying barriers to FDI in R&D, as well as the R&D activities of Turkish multinationals abroad;
n strengthening the culture of evaluation regarding public-sector initiatives in the area of STI and their outcomes, both as concerns the system as a whole and key government initiatives such as technoparks (Box 12.3)
or participation in international research networks like Horizon 2020. The government should seize upon the available expertise in internationally comparable evaluations, such as the innovation reviews conducted by the OECD.
Technoparks created in association with universities have been one of the Turkish government’s flagship schemes to foster business incubation in recent years. The first technoparks were set up in 2001 in Ankara and Kocaeli in Turkey’s traditional industrial heartland.
By 2011, there were a total of 43 technoparks, 32 of which were operational. Their number may have even climbed to 52 by 2014, according to press reports. Turkey’s technoparks
host some 2 500 firms, 91 of which have foreign capital. In 2013, they employed 23 000 R&D personnel and generated US$1.5 billion in exports (1% of the total).
Although this feat is impressive, recent reports have been critical of the trend towards a certain inertia, with a growing number of universities establishing technology parks only to struggle to provide them with professional management and adequate funding. Reports deplore the scarcity of performance evaluations of existing
parks and the lack of published data on the cost of tax breaks and other forms of public support extended to them. A 2009 report by the State Audit Committee underlined the need for an independent evaluation and impact assessment of existing technoparks – a judgement confirmed by a more recent report by a Ministry of Science, Technology and Industry inspector (Morgül, 2012).
Source: authors; see the Association of TurkishTechnology Parks: www.tgbd.org.tr/en
Box 12.3: Time to assess the impact of Turkish technoparks

UNESCO SCIENCE REPORT
336
UKRAINE
Co-operation with the EU in S&T is a priorityAll Ukrainian governments in the past decade have announced plans to restructure the economy to make it more innovative and competitive. This modernization, combined with higher living standards, is a prerequisite for adhesion to the EU, the country’s long-term ambition.
The country’s crucial problems, such as energy wastage, poor environmental protection and an obsolete industrial sector and infrastructure, are not going to be solved without international co-operation and the acquisition of new knowledge. Moreover, national priorities in S&T tend to have a lot in common with those of the EU.
The following priorities figured in the State Law of Ukraine on Priorities for the Development of Science and Technology (2010):
n Basic research into key scientific problems in different disciplines;
n Environmental studies;
n ICTs;
n Energy generation and energy-saving technologies;
n New materials;
n Life sciences and methods for combating the main diseases.
The share of foreign sources in R&D funding is relatively high in Ukraine, accounting for about 25% of GERD in 2010–2013. Ukrainian state statistics do not provide information about the distribution of funding by country of origin. However, it is known that a substantial share is associated with the Russian Federation, the USA, EU and China.
Ukraine concluded a new agreement with the EU on S&T co-operation in 2010 that was implemented a year later. It has opened up new opportunities for co-operation and creates framework conditions for a number of joint initiatives, such as joint research projects with EU funding, joint expeditions, the exchange of information and so on. In July 2015, the Ukrainian parliament ratified the agreement for the country's associate membership of the EU's Horizon 2020 programme (2014–2020).
Successive crises have eroded R&D spendingSuccessive crises have had a negative impact on the economy, in general, and R&D funding, in particular: first, there was the economic crisis of the late 2000s then depreciation of the national currency, the Ukrainian hryvnia (UAH), and,
in 2013–2015, the Euromaidan Revolution followed by armed conflict. In 2009, Ukrainian exports fell by 49% over the previous year and the economy contracted by 15%. The crisis resulted from a combination of factors, including the slump in international prices for steel, which forced the metallurgy and machine-building industries to reduce wages and lay off workers, and the suspension of gas supplies by Russia in January 2009 in a dispute over Ukraine’s natural gas debt. The crisis in turn affected GERD, which represented UAH 8 025 million (€ 796 million) in 2007 but had declined (in euro terms) to UAH 8 236 million (€ 680 million) by 2009. In 2010, Ukraine returned to positive growth (4.2%) and GERD had recovered to UAH 9 591 million (€ 865 million) by 2011 but R&D intensity shrank over the same period from 0.85% (2007) to 0.77% (2013) measured in PPPs. GERD is expected to decline once more in euros in 2014 (HSE, 2014).
State funding of R&D has itself fluctuated over the past decade; it accounted for 36% of GERD in 2002, 55% in 2008 and 47% in 2013. The bulk of state funding goes towards supporting the state-sponsored academies of sciences, including the National Academy of Sciences. The state has tried to involve the private sector in research projects but this has met with limited success, largely because the state itself has repeatedly failed to meet its own obligations when it comes to financing research projects.
Low-tech heavy industries form the core of the economyThe share of business funding of R&D has dropped since 2003 (36%). It hit a low of 26% in 2009 and has stagnated since (29% in 2013). The generally low level of private sector expenditure on R&D is a consequence of the specific structure of the Ukrainian economy: two-thirds of business spending on R&D is concentrated in machine-building, an industry which has seen its contribution to the national economy contract since independence in 1991, with an acceleration in its decline during the economic crisis of 2008–2009 and again during the political crisis of 2013–2015, Russia being the machine-building sector’s main customer up until now. Heavy industries with low R&D intensity form the core of the national economy: ferrous metallurgy, production of basic chemicals and coal-mining.
Technoparks in decline since abolition of tax breaks The most successful experiments in commercializing research projects were those associated with technoparks in 1999–2005. In fact, these technoparks were more evocative of ‘clusters’ of high-tech companies and groups of scientists and engineers who enjoyed a favourable regime for realizing their research and innovation projects. The best technoparks were those

Countries in the Black Sea basin
337
Chapter 12
related programmes, as well as for fixing S&T priorities and the provision of scientific advice. Their situation has been complicated by the de facto absorption of numerous Ukrainian research institutions in Crimea by the Russian Federation since 2014, including the A.O. Kovalevsky Institute of Biology of the Southern Seas in Sebastopol and the Crimean Astrophysical Observatory in Nauchny.
The public research system currently lags behind the world average for the quantity of research articles and their impact. The number of Ukrainian publications has not yet recovered to 2008 levels and the citation rate is one of the lowest among Black Sea countries. The share of Ukrainian publications in the Web of Science declined from 0.5% in 1996–2000 to about 0.2% in 2012. Ukraine has an especially poor record in social sciences, computer sciences, life sciences – and agricultural science, despite being the world’s third-biggest grain exporter in 2011, with higher than average yields (Figure 12.6). The shares of Ukrainian publications in some areas of technical sciences, such as welding and electric machines, are much higher (Zinchenko, 2013).
No long-term human resource policy for R&DThe government’s long-term human resource policy in R&D could be defined as ‘inertial’ rather than targeted, despite the different types of special stipend16 for scientists, the most recent of which was introduced in 2012 to finance studies abroad. Although Ukraine joined the Bologna Process, which aims to harmonize higher education across Europe, in 2005, it still preserves a mixed17 system. In 2014, the new Minister for Education and Science announced plans to harmonize Ukrainian degrees with the three-tiered degree system: bachelor’s –master’s–PhD. Many scientists are of pensionable age in Ukraine. The average age of Doctors of Science is more than 61 years and that of Candidates of Science more than 53. The average age of researchers has been growing by one year every three years (Yegorov, 2013).
Concern about the relevance of higher education Ukraine inherited a relatively well-developed education system from the Soviet era. It still preserves some positive features of this system with its emphasis on mathematics and natural sciences at school level. However, serious concerns have been raised as to the quality of S&T education since independence.
16. Young scientists may also apply for parliamentary stipends and stipends from the National Academy of Sciences. Hundreds of distinguished older scientists receive lifelong stipends from the President of Ukraine. Special monthly salaries for the members and corresponding members of the state-sponsored academies of sciences could also be considered specific stipends for scientists.
17. Bachelor’s and master’s degrees have been introduced but the Soviet qualification of ‘specialist’ has been preserved. The Soviet Candidate of Science must not only hold a master’s degree but also count no fewer than five publications to his or her name. The Soviet Doctor of Science must be a Candidate of Science with substantial scientific experience and at least 20 international publications.
established by institutes of the National Academy of Sciences which had a strong technological orientation, such as the Paton Institute of Electric Welding and the Institute of Monocrystals. Both the institutes themselves and their registered innovation projects were entitled to tax breaks. However, since the abolition of these tax breaks in 2005, the number of innovation projects has stagnated and the role played by technoparks in national innovation has declined.
Most research bodies focus on industrial developmentResearch policy in Ukraine is overseen mainly by the central ministries but local bodies also have some tools at their disposal with which they can exert influence over local universities and research institutions, in particular. Local bodies can introduce tax incentives, for example, provide financial support from local budgets and allocate public land for technoparks and business incubators. Traditionally, the university sector has played a subordinate role in the national research system, as it focuses mainly on teaching. The share of GERD performed by the higher education sector has hovered between 5% and 7% since the turn of the century. There are more than 340 universities but only 163 of them performed R&D in 2013. Approximately 40 of these universities are privately owned.
The Ministry of Science and Education plays the key role in determining science policy, along with the Ministry of Economic Development and Trade, although a number of other ministries and agencies distribute state funds to specific research programmes, projects and research bodies. The total number of ministries and agencies with science budgets varied from 31 to 44 in the 2000s (UNECE, 2013).
The State Committee for Science and Technology has changed its name and functions several times since its creation in 1991, most recently in December 2010 when the majority of its departments were incorporated into the Ministry of Science and Education and other ministries or state agencies. The former special State Committee on Science, Education and Informatization became an agency in 2011 and was fully incorporated into the Ministry of Science and Education in mid-2014; this committee is directly responsible for S&T policy formulation under the ministry’s supervision (UNECE, 2013).
The majority of research institutions are associated with specific economic areas and focus on industrial R&D. Formally, these organizations are subordinated to the different ministries and state agencies but, in recent years, ties with the ministries have weakened. The National Academy of Sciences and five other state-sponsored academies have traditionally been key actors in the national research system, as they receive three-quarters of the state budget devoted to R&D. Academies are responsible for basic research but also for the co-ordination of many research- and innovation-

UNESCO SCIENCE REPORT
338
For one thing, as universities have limited interaction with industry, programmes do not follow the latest advances in the business world. Some high-tech sectors no longer exist, including electronics and a number of military-related enterprises in the machine-building industry. Demand for degrees in some technical disciplines has declined, especially in industry, after graduates were unable to find a job suited to their qualifications.
With the exception of agriculture, health care and services, the share of graduates in natural sciences has shrunk by one-quarter and in technical sciences by more than one-fifth since the mid-2000s. The share of students studying humanities and the arts, on the other hand, has grown by 5% and, in social sciences, business and law by as much as 45%, according to the State Statistical Office.
Between 2001 and 2012, the number of students climbed from 1.5 million to 2.5 million. This expansion will be short-lived, however. With the country’s overall population declining, the number of students will likewise decline in the coming years. Nor are there many foreign students in Ukraine, although several foreign universities have established campuses in Ukraine, including Moscow State Lomonosov University, while some foreign universities have established joint programmes with their Ukrainian counterparts. Graduates receive a dual diploma from both universities. Arguably the best-known twinning programmes concern the Kiev Polytechnic Institute and several German technical universities.
Next steps for UkraineThe government formed in 2014 has developed a series of measures to address the following key issues in Ukrainian research policy:
n Establishment of research priorities which correspond to the goals of national development;
n A clear orientation of R&D towards respecting the best EU standards, with the intention of joining the European Research Area; and
n Administrative changes to improve the governance of the R&D system.
However, policy measures outlined in different strategic documents are much less concerned with identifying specific demands for knowledge and especially with providing strategic intelligence on structural changes in the economy. Moreover, rather limited measures have been envisaged to improve knowledge circulation, to meet business knowledge demands and to increase resource mobilization in the private sector.
Ukrainian research and innovation policy with respect to industry is almost exclusively focused on direct state support for the six national academies of sciences, state-owned companies and state universities. There is a noteworthy lack of co-ordination between research policy (focusing on the quality of academic research and the provision of skilled researchers) and economic development policies, owing to a fragmentation of the responsibilities of both the state ministries and agencies and the central and regional authorities.
In April 2011, the State Agency for Science, Innovation and Informatization created the first so-called State Key Laboratory for Molecular and Cell Biology. The idea was to provide extra funding for research in molecular and cell biology in priority areas which required collaboration among researchers from different institutions.
Research projects were selected on the basis of the evaluation by an expert group, headed by the German Nobel Prize laureate Erwin Neher. Projects were then approved by the Scientific Council, which included several prominent scholars and state officials. This procedure was designed
to minimize any ‘external’ influence on the decision-making process and was relatively new to Ukraine.
The institutional members of the Key Laboratory were the Institute of Physiology and the Institute of Molecular Biology and Genetics, both attached to the National Academy of Sciences. It fell to the Scientific Council of the Key Laboratory, however, to select research projects on a competitive basis from among the research proposals it received from scholars, irrespective of their institutional affiliation.
Project funding was provided by the State Fund for Basic Research. In addition to these ‘standard block grants,’ project
teams were entitled to receive extra funding via the regular budgets of their own institutes, as long as these were attached to the National Academy of Sciences.
Two projects were selected for funding in 2011– 2012 and another two in 2013. A total of UAH 2 million (circa €190 000) was disbursed for the latter two projects in 2013.
Funding for the laboratory dried up in 2014, as a result of the economic crisis.
Source: compiled by authors
Box 12.4: A first for Ukraine: the Key Laboratory

339
Chapter 12
Countries in the Black Sea basin
CONCLUSIONCountries can learn from one another and from emerging economiesMost Black Sea countries still have a long way to go to catch up to dynamic middle-income countries when it comes to the STI policy environment and levels of investment in human resources, R&D and ICT infrastructure. In global comparisons, they tend to fare better for output than for input, with the notable exception of Azerbaijan and Georgia, which seem to have particular difficulties in translating their modest R&D effort into economic gains. Georgia, for instance, has a relatively strong standing in some branches of humanities but these publications do not fuel R&D and technology-driven innovation.
Most countries can look back on a strong orientation towards science and technology in their education systems and economic structures of the not too distant past. Some vestiges of this period still survive in the post-Soviet states, such as the high prevalence of graduates with technical qualifications or of publications in physical sciences and engineering. With the right sort of policies and incentives, the reorientation of these countries towards technology-intensive development would be a much less challenging prospect than for those developing countries which are still in the process of shedding their traditional agrarian socio-economic structures.
In order to make the transition to an innovation-driven economy, all the post-Soviet states situated in the Black Sea region will have no choice but to engage in fundamental reforms, including a steep increase in R&D funding. Moreover, if they are to intensify their R&D effort to any significant extent, the business sector will need stronger incentives to invest in R&D. These incentives will need to create a business-friendly environment that is conducive to a thriving market economy, not least by fighting corruption and eliminating oligarchic ownership and control structures. No traditional STI policy initiative can expect to have a decisive impact on private sector R&D if the business environment remains largely hostile to the emergence of new enterprises and market-based challenges to existing power relations.
In the case of Turkey, which has already accomplished substantial progress in the past decade for a wide range of STI indicators – be they educational attainment, researcher and R&D intensity or the number of patents – priority issues have more to do with improving co-ordination and collaboration among the various actors of the national innovation system, in addition to strengthening accountability and improving efficiency. In parallel, the targets fixed by the government for further quantitative growth translate a worthy ambition, even if some targets may be overoptimistic.
For all countries, making the various components of the national innovation landscape work as a system, rather than as disjointed parts, while maintaining sufficient flexibility remains a challenge. It is evident that Azerbaijan and Georgia, in particular, would benefit from a clearer focus on a national innovation strategy at the highest political level. As for Armenia, Belarus, Moldova and Ukraine, they would get more mileage out of their existing STI strategies by making a more determined effort to address shortcomings in the business environment.
All seven countries would benefit from a stronger culture of evaluation in the area of STI policies, not least Turkey, which has raised its level of investment in R&D by so much in recent years. This would also help countries to establish and pursue more realistic goals and targets in this area.
All countries should also make a bigger effort to converge with global best practice for STI data availability, quality and timeliness; this is especially critical for Georgia and, to a lesser extent, for Armenia and Azerbaijan.
The countries around the Black Sea have an understandable tendency to look more or less exclusively to the European Union or the Russian Federation, or to both, for partnerships in science and technology and international comparisons. It would be helpful for them to look beyond this geographical sphere, in order to get a better grasp of how S&T-related policies and performance are evolving in other emerging market economies and developing countries, some of which are becoming key international players or policy innovators. Countries around the Black Sea should also look closer to home when it comes to seizing opportunities for scientific co-operation and learning from one another’s successes and failures. The present chapter has striven to point them in that direction.
KEY TARGETS FOR BLACK SEA COUNTRIES
n Azerbaijan is to double GDP per capita to US$13 000 by 2020;
n All educational institutions in Azerbaijan are to have internet access and free open education resources are to be developed by 2020;
n Belarus is to increase its GERD/GDP ratio to 2.5–2.9% of GDP by 2015, up from 0.7% in 2011;
n Turkey is to increase its GERD/GDP ratio to 3.0% of GDP by 2023, up from 0.9% in 2011;
n Industrial GERD in Turkey is to rise from 43.2% of total spending on R&D in 2011 to 60.0% by 2018;
n The number of Turkish FTE researchers is to more than double from 72 000 (2012) to 176 000 (2018).

UNESCO SCIENCE REPORT
340
REFERENCESCiarreta, A. and S. Nasirov (2012) Development trends in
the Azerbaijan oil and gas sector: Achievements and challenges, Energy Policy, Vol. 40(C).
Cuciureanu, G. (2014) Erawatch Country Reports 2013: Moldova.
Dobrinsky, R. (2013) The National Innovation System of Azerbaijan in the Context of the Effective Development and Diffusion of Green Technologies. Presentation to the Joint National Seminar on Ways to Green Industry. Astana, 23-25 October 2013.
Dumitrashko, M. (2014) Key moments in the development and problems of the scientific sphere of Republic of Moldova (in Russian), Innovatsii, 6.
EC (2014) Turkey Progress Report 2014. European Commission: Brussels.
Edelman Berland (2012): GE Global Innovation Barometer 2013 – Focus on Turkey. See: http://files.publicaffairs.geblogs.com.
FAO (2012) Eastern Europe and Central Asia Agroindustry Development Country Brief: Georgia. United Nations Food and Agriculture Organization.
Government of Azerbaijan (2009) Azәrbaycan Respublikasında 2009–2015-ci illәrdә elmin inkişafı uzrә Milli Strategiya (National Strategy for the Development of Science in the Republic of Azerbaijan for 2009). Azerbaijan Presidential Decree No. 255 of 4 May 2009.
Hasanov, A. (2012) Review of the Innovation System in Azerbaijan. Presentation to IncoNET EECA Conference on Innovating Innovation Systems, 14 May, Vienna. Technology Transfer Center, Azerbaijan National Academy of Sciences.
HSE (2014) Science Indicators: Statistical Data Book (in Russian). Higher School of Economics: Moscow.
Işik, Y. (2012) Economic developments in the EU and Turkey. Online op-ed in reflectionsTurkey. See: www.reflectionsturkey.com, December.
Melkumian, M. (2014) Ways of enhancing the effectiveness of Armenia’s social and economic development of Armenia (in Russian), Mir Peremen, 3: 28–40.
MoDev (2013) Tenth Development Plan 2014–2018 (in Turkish, summary in English). Ministry of Development of Turkey: Ankara. See: www.mod.gov.tr.
Morgul, M. B. (2012) Problems and proposed solutions for technoparks and R&D centres (in Turkish). Anahtar. Journal of the Ministry of Science, Technology and Industry, no. 286, October.
NSB (2014) Science and Engineering Indicators 2014. National Science Board. National Science Foundation: Arlington VA (USA).
OECD (2014) OECD Economic Surveys: Turkey 2014. Organisation for Economic Co-operation and Development: Paris.
OECD (2012) OECD Economic Surveys: Turkey 2012. Organisation for Economic Co-operation and Development: Paris.
OECD et al. (2012) SME Policy Index: Eastern Partner Countries 2012. Organisation for Economic Co-operation and Development, European Commission, European Training Foundation, European Bank for Reconstruction and Development. See: http://dx.doi.org/10.1787/9789264178847-en.
Rivera-Batiz, F. L. and M.Durmaz (2014) Why did Turkey’s PISA Score Rise? Bahçesehir University Economic and Social Research Centre (BETAM), Research Note 14/174, 22 October.
Şenturk, S. S. (2010) Total Factor Productivity Growth in Turkish Manufacturing Industries: a Malmquist Productivity Index Approach. Master of Science Thesis, Royal Institute of Technology: Stockholm.
Serdaroğlu, T. (2013) Financial Openness and Total Factor Productivity in Turkey (in Turkish), Planning Expert Thesis, Ministry of Development: Ankara.
Sonnenburg, J., Bonas, G. and K. Schuch (eds) [2012] White Paper on Opportunities and Challenges in View of Enhancing the EU Cooperation with Eastern Europe, Central Asia and South Caucasus in Science, Research and Innovation. Prepared under the EU’s Seventh Framework Programme, INCO-NET EECA Project. International Centre for Black Sea Studies: Athens
Soybilgen, B. (2013) Innovation in Turkey: Strong in Quantity, Weak in Quality (in Turkish). Research note 13/148, Bahçesehir University Centre for Economic and Social Research, 6 December. See: http://betam.bahcesehir.edu.tr
Countries in the Black Sea basin
341
Chapter 12
State Audit Office (2014) Effectiveness of Government Measures for Management of Science. Performance Audit. Report N7/100, 24 March. Tbilisi (Georgia).
State Statistics Service (2014) Science, Technology and Innovation Activities in Ukraine in 2013 (in Ukrainian). Kiev.
Tatalovic, M. (2014) Report: Belarus Science Funding Goals ‘Remain Elusive’. See: www.scilogs.com.
TÜBITAK (2013) Science, Technology and Innovation in Turkey 2012. Scientific and Technological Research Council: Ankara.
UNECE (2014) Review of Innovation Development in Armenia. United Nations Economic Commission for Europe: Geneva and New York.
UNECE (2013) Review of Innovation Development in Ukraine (in Russian), United Nations Economic Commission for Europe: Geneva and New York.
UNECE (2011) Review of Innovation Development in Belarus (in Russian). United Nations Economic Commission for Europe: Geneva and New York.
Walker, M. (2011) PISA 2009 Plus Results: Performance of 15-year-olds in Reading, Mathematics and Science for 10 Additional Participants. ACER Press: Melbourne.
WEF (2013) The Human Capital Report. World Economic Forum: Geneva.
World Bank (2014) Country Partnership Strategy for Georgia, FY2014 – FY2017.
World Bank (2013) Country Partnership Strategy for the Republic of Moldova, FY 2011–2014.
World Bank (2011) Running a Business in Azerbaijan. Enterprise Surveys Country Note, no.8.
World Bank (2010) Country Partnership Strategy for Azerbaijan for the Period FY 2011–2014.
Yegorov, I. (2013) Erawatch Country Reports 2012: Ukraine. See: http://erawatch.jrc.ec.europa.eu.
Zinchenko, N. S. (2013) Ukraine in the EU Framework Programmes: experience and perspectives (in Ukrainian). Problemy Nauki, 2: 13–18.
Deniz Eröcal (b.1962: Turkey) is an independent consultant and researcher based in Paris (France), who works on policy and economics in the sphere of science, technology, innovation and sustainable development. Previously, he held several positions at the Organisation for Economic Cooperation and Development for 20 years, including Counsellor to the Director for Science, Technology and Industry. Mr Eröcal holds a Master's in International Relations from the School of Advanced International Studies at Johns Hopkins University (USA).
Igor Yegorov (b.1958: Ukraine) is Deputy Director of the Institute of Economy and Forecasting that forms part of the National Academy of Sciences in Kiev, from which he received his PhD in the Economics of Science and Technology in 2006. Dr Yegorov has been involved in many European Union sponsored projects concerning economics, science, technology and innovation in Ukraine. He has also been a consultant for the UNESCO Institute of Statistics for several years.