all india study on sectoral demand of diesel & petrol - · pdf filereport – all...
TRANSCRIPT

Report
Petroleum Planning and Analysis Cell
By
2013
All India Study on
Sectoral Demand of
Diesel & Petrol
Report – All India Study on Sectoral Demand of Diesel & Petrol 1
Contents Acknowledgement ................................................................................................................................. 7
Abbreviations and Acronyms ................................................................................................................. 8
Executive Summary ................................................................................................................................ 9
1.0 Introduction .............................................................................................................................. 15
a. Petroleum sector in India at a glance ...................................................................................... 16
b. Major petroleum dependant sectors ...................................................................................... 17
i. Diesel .................................................................................................................................... 17
ii. Petrol .................................................................................................................................... 18
c. Trends in consumption pattern of diesel ................................................................................ 19
i. Transport sector ................................................................................................................... 19
ii. Non-Transport sector ........................................................................................................... 20
2.0 Study Background .................................................................................................................... 22
3.0 Research Objective ................................................................................................................... 22
4.0 Scope of work of the study ...................................................................................................... 23
5.0 Methodology & Coverage ........................................................................................................ 23
a. Selection of districts in each of the identified states .............................................................. 24
b. Selection of retail outlet .......................................................................................................... 25
c. Operational methodology ........................................................................................................ 26
d. Time period ............................................................................................................................... 27
6.0 Geographical coverage ............................................................................................................. 28
a. State wise coverage.................................................................................................................. 28
b. List of States, Districts and number of retail outlets covered ................................................ 29
7.0 All India Consolidated Retail Results ....................................................................................... 33
a. All India Consolidated Findings – Retail sales ......................................................................... 33
b. All India Zone wise findings - Retail sales ................................................................................ 38
i. North Zone’s break up in consumption of Diesel and Petrol - Exclusively Retail .............. 38
ii. East Zone’s break up in consumption of Diesel and Petrol - Exclusively Retail ................. 41
iii. West Zone’s break up in consumption of Diesel and Petrol - Exclusively Retail ........... 45
iv. South Zone’s break up in consumption of Diesel and Petrol - Exclusively Retail .............. 48
8.0 Survey Findings under different time periods – Retail Sales .................................................. 51
9.0 All India Composite Results for Diesel – Retail and Direct Sales ............................................ 81
a. Survey Findings under different time periods – Retail and Direct Sales ................................ 81
b. All India Diesel Aggregated & Consolidated Findings – Retail + Direct Sales ......................... 84
10.0 Findings of the household / customer survey ......................................................................... 85
11.0 Conclusion ................................................................................................................................ 86
12.0 Appendix ................................................................................................................................... 88

Report – All India Study on Sectoral Demand of Diesel & Petrol 2
Tables
Table 1: Selection of Districts in Each of the Identified State ............................................................. 24
Table 2: State Wise RO Coverage ......................................................................................................... 25
Table 3: Geographical Coverage .......................................................................................................... 28
Table 4: State Wise Coverage .............................................................................................................. 28
Table 5: District Wise RO Coverage ..................................................................................................... 29
Table 6: Diesel Consumption Break up Amongst Transport Sector Categories ................................. 51
Table 7: Diesel Consumption Break up Amongst Non-Transport Sector Categories ......................... 52
Table 8: Diesel Consumption Break up Amongst Transport Sector Categories ................................. 53
Table 9: Diesel Consumption Break up Amongst Non-Transport Sector Categories ......................... 54
Table 10: Diesel Consumption Break up Amongst Transport Sector Categories ............................... 55
Table 11: Diesel Consumption Break up Amongst Non-Transport Sector Categories ....................... 56
Table 12: Diesel Consumption Break up Amongst Transport Sector Categories ............................... 57
Table 13: Diesel Consumption Break up Amongst Non-Transport Sector Categories ....................... 58
Table 14: Diesel Consumption Break up Amongst Transport Sector Categories ............................... 59
Table 15: Diesel Consumption Break up Amongst Non-Transport Sector Categories ....................... 60
Table 16: Diesel Consumption Break up Amongst Transport Sector Categories ............................... 62
Table 17: Diesel Consumption Break up Amongst Non-Transport Sector Categories ....................... 62
Table 18: Diesel Consumption Break up Amongst Transport Sector Categories ............................... 63
Table 19: Diesel Consumption Break up Amongst Non-Transport Sector Categories ....................... 64
Table 20: Diesel Consumption Break up Amongst Transport Sector Categories ............................... 65
Table 21: Diesel Consumption Break up Amongst Non-Transport Sector Categories ....................... 66
Table 22: Diesel Consumption Break up Amongst Transport Sector Categories ............................... 67
Table 23: Diesel Consumption Break up Amongst Non-Transport Sector Categories ....................... 68
Table 24: Diesel Consumption Break up Amongst Transport Sector Categories ............................... 69
Table 25: Diesel Consumption Break up Amongst Non-Transport Sector Categories ....................... 70
Table 26: Diesel Consumption Break up Amongst Transport Sector Categories ............................... 72
Table 27: Diesel Consumption Break up Amongst Non-Transport Sector Categories ....................... 72
Table 28: Diesel Consumption Break up Amongst Transport Sector Categories ............................... 73
Table 29: Diesel Consumption Break up Amongst Non-Transport Sector Categories ....................... 74
Table 30: Diesel Consumption Break up Amongst Transport Sector Categories ............................... 75
Table 31: Diesel Consumption Break up Amongst Non-Transport Sector Categories ....................... 76
Table 32: Diesel Consumption Break up Amongst Transport Sector Categories ............................... 77
Table 33: Diesel Consumption Break up Amongst Non-Transport Sector Categories ....................... 78
Table 34: Diesel Consumption Break up Amongst Transport Sector Categories ............................... 79
Table 35: Diesel Consumption Break up Amongst Non-Transport Sector Categories ....................... 80
Table 36: All India End-use Share (%) of Diesel in Retail and Direct – July - September of 2012 ...... 81
Table 37: All India End-use Share (%) of Diesel in Retail and Direct: October - December of 2012 .. 82
Table 38: All India End-use Share (%) of Diesel in Retail and Direct: April – June of 2013 ................ 83
Table 39: All India End-use Share (%) of Diesel in Retail and Direct – All India Aggregate ............... 84
Table 40: Zone-wise – Aggregate consumption of diesel - Retail Sales ............................................. 88
Table 41: Zone-wise – Aggregate consumption of Petrol - Retail Sales ............................................. 89
Table 42: State-wise – Consumption of Diesel in Transport Sector - Retail Sales ............................. 90
Table 43: State-wise – Consumption of Diesel in Non-Transport Sector - Retail Sales ..................... 91
Table 44: State-wise – Consumption of Petrol - Retail Sales .............................................................. 92

Report – All India Study on Sectoral Demand of Diesel & Petrol 3
Figures Figure 1: All India End-use Share (%) of Diesel in Retail and Direct Sales Combined ........................ 10
Figure 2: All India End-use Share (%) of Diesel in Retail ..................................................................... 11
Figure 3: All India End-use Share (%) of Petrol in Retail ..................................................................... 12
Figure 4: Trends in Consumption of Diesel in India (Million Tonnes) ................................................ 17
Figure 5: Trends in Consumption of Petrol in India (Million Tonnes)................................................. 18
Figure 6: Operational Methodology .................................................................................................... 26
Figure 7: Distribution amongst Category of Retail Outlets ................................................................. 29
Figure 8: All India End-use Share (%) of Diesel in Retail – Aggregate ................................................. 33
Figure 9: All India End-use % Share of Diesel in Retail – Zone Wise Aggregate ................................. 34
Figure 10: All India End-use % Share of Diesel in Retail – Zone Wise Aggregate for Transport ........ 35
Figure 11: All India End-use % Share of Diesel in Retail – Zone Wise Aggregate for Non-Transport 36
Figure 12: Petrol-Retail Consumption Break-up (All India) – Zone Wise Aggregate .......................... 37
Figure 13: North Zone End-use Share (%) of Diesel in Retail – Final .................................................. 38
Figure 14: North Zone End-use % Share of Diesel in Retail – State Wise ........................................... 39
Figure 15: North Zone End-use % Share of Diesel in Retail – State Wise for Transport .................... 39
Figure 16: North Zone End-use % Share of Diesel in Retail – State Wise for Non-Transport ............ 40
Figure 17: Petrol-Retail Consumption Break-up (North Zone) – State Wise ...................................... 41
Figure 18: East Zone End-use Share (%) of Diesel in Retail – Final ..................................................... 42
Figure 19: East Zone End-use % Share of Diesel in Retail – State Wise .............................................. 42
Figure 20: East Zone End-use % Share of Diesel in Retail – State Wise for Transport ....................... 43
Figure 21: East Zone End-use % Share of Diesel in Retail – State Wise for Non-Transport ............... 44
Figure 22: Petrol-Retail Consumption Break-up (East Zone) – State Wise ......................................... 44
Figure 23: West Zone End-use Share (%) of Diesel in Retail – Final ................................................... 45
Figure 24: West Zone End-use % Share of Diesel in Retail – State Wise ............................................ 45
Figure 25: West Zone End-use % Share of Diesel in Retail – State Wise for Transport ..................... 46
Figure 26: West Zone End-use % Share of Diesel in Retail – State Wise for Non-Transport ............. 47
Figure 27: Petrol-Retail Consumption Break-up (West Zone) – State Wise ....................................... 47
Figure 28: South Zone End-use Share (%) of Diesel in Retail – Final .................................................. 48
Figure 29: South Zone End-use % Share of Diesel in Retail – State Wise ........................................... 48
Figure 30: South Zone End-use % Share of Diesel in Retail – State Wise for Transport .................... 49
Figure 31: South Zone End-use % Share of Diesel in Retail – State Wise for Non-Transport ............ 49
Figure 32: Petrol-Retail Consumption Break-up (South Zone) – State Wise ...................................... 50
Figure 33: Diesel Consumption Break up Amongst the Transport & Non-Transport Sector ............. 51
Figure 34: Petrol Consumption Break up Amongst the Sector Categories ......................................... 52
Figure 35: Diesel Consumption Break up Amongst the Transport & Non-Transport Sector Wise .... 53
Figure 36: Petrol Consumption Break up Amongst the Sector Categories Sector Wise .................... 54
Figure 37: Diesel Consumption Break up Amongst the Transport & Non-Transport Sector ............. 55
Figure 38: Petrol Consumption Break up Amongst the Sector Categories ......................................... 56
Figure 39: Diesel Consumption Break up Amongst the Transport & Non-Transport Sector ............. 57
Figure 40: Petrol Consumption Break up Amongst the Sector Categories ......................................... 58
Figure 41: Diesel Consumption Break up Amongst the Transport & Non-Transport Sector ............. 59
Figure 42: Petrol Consumption Break up Amongst the Sector Categories ......................................... 60
Figure 43: Diesel Consumption Break up Amongst the Transport & Non-Transport Sector ............. 61

Report – All India Study on Sectoral Demand of Diesel & Petrol 4
Figure 44: Petrol Consumption Break up Amongst the Sector Categories ......................................... 62
Figure 45: Diesel Consumption Break up Amongst the Transport & Non-Transport Sector ............. 63
Figure 46: Petrol Consumption Break up Amongst the Sector Categories ......................................... 64
Figure 47: Diesel Consumption Break up Amongst the Transport & Non-Transport Sector ............. 65
Figure 48: Petrol Consumption Break up Amongst the Sector Categories ......................................... 66
Figure 49: Diesel Consumption Break up Amongst the Transport & Non-Transport Sector ............. 67
Figure 50: Petrol Consumption Break up Amongst the Sector Categories ......................................... 68
Figure 51: Diesel Consumption Break up Amongst the Transport & Non-Transport Sector ............. 69
Figure 52: Petrol Consumption Break up Amongst the Sector Categories ......................................... 70
Figure 53: Diesel Consumption Break up Amongst the Transport & Non-Transport Sector ............. 71
Figure 54: Petrol Consumption Break up Amongst the Sector Categories ......................................... 72
Figure 55: Diesel Consumption Break up Amongst the Transport & Non-Transport Sector ............. 73
Figure 56: Petrol Consumption Break up Amongst the Sector Categories ......................................... 74
Figure 57: Diesel Consumption Break up Amongst the Transport & Non-Transport Sector ............. 75
Figure 58: Petrol Consumption Break up Amongst the Sector Categories ......................................... 76
Figure 59: Diesel Consumption Break up Amongst the Transport & Non-Transport Sector ............. 77
Figure 60: Petrol Consumption Break up Amongst the Sector Categories ......................................... 78
Figure 61: Diesel Consumption Break up Amongst the Transport & Non-Transport Sector ............. 79
Figure 62: Petrol Consumption Break up Amongst the Sector Categories ......................................... 80
Report – All India Study on Sectoral Demand of Diesel & Petrol 5

Report – All India Study on Sectoral Demand of Diesel & Petrol 6

Report – All India Study on Sectoral Demand of Diesel & Petrol 7
Acknowledgement
We are thankful to Petroleum Planning & Analysis Cell (PPAC), Ministry of
Petroleum & Natural Gas, Government of India for assigning this study, “All
India Study on Sectoral Demand of Diesel & Petrol” to the consultant. We are
grateful to Shri Augustine Peter, Director General, PPAC, Shri Rohit Dawar,
Additional Director PPAC & Shri Vijay Sethi, former Additional Director PPAC,
for extending their support.
The consultant had the pleasure of interacting with the various OMC as well as
their representatives at state and zonal level for providing us the required
support and help from time to time.
Last but not the least we would like to thank our entire team of research
professionals, our field staff across India and support teams for their spirit and
enduring cooperation in compiling this compendium of information.

Report – All India Study on Sectoral Demand of Diesel & Petrol 8
Abbreviations and Acronyms
BTS Base Transceiver Station
GWh Giga Watt-Hours
HCV Heavy Commercial Vehicles
LCV Light Commercial Vehicles
LNG Liquefied Natural Gas
LPG Liquefied Petroleum Gas
MMT Million Metric Tonnes
MTS Metric Tonnes
OMC Oil Marketing Companies
OMCs Oil Marketing Companies
PPAC Petroleum Planning & Analysis Cell
PSU Public Sector Undertaking
RO Retail Outlet
STC State Transport Corporation
UPS Uninterruptible Power Supply
UV Utility Vehicles

Report – All India Study on Sectoral Demand of Diesel & Petrol 9
Executive Summary
Diesel and Petrol are strategic commodities; they play a vital role in the socio-
economic development of a country. Any uncertainty about their supply can
impact the functioning of the economy. In order to reduce this uncertainty it is
important to plan and use the resources judiciously. But, before planning, it is
essential to understand the consumption pattern of these products. Tentative
information pertaining to category-wise overall consumption is available with
different sources but there is no correct picture available on category-wise
retail sales of Diesel / Petrol, as it is not maintained by dealers operating the
retail outlets. It is important to note that during last one decade, retail share in
total diesel sale has gone up from 78.5 to 82.1 per cent in 2011-12.
Keeping in mind with the above scenario, Petroleum Planning and Analysis Cell
(PPAC), an attached office of the Ministry of Petroleum and Natural Gas,
engaged Nielsen India to conduct an in-depth research covering over 2000
retail outlets (RO) spread across 150 districts in 16 states in India. The study
was focused to estimate the share of different consuming segments within the
transport and non-transport sector for diesel and petrol sold through retail
outlets of Public Sector Undertaking (PSU) Oil Marketing Companies (OMCs) on
a state-wise, zone-wise and All India basis. To give a more realistic picture, an
attempt was also made to put together the direct sales figures (diesel sold
directly by the Oil Marketing Companies (OMCs) to bulk consumers like
industry, railways, defense, etc.) and retail sales figures to arrive an all India
estimate share of different consuming segments within the transport and non-
transport sector.
To meet the study objectives, at each RO, retail data was collected through
primary survey technique collecting data from the dispensers against the
vehicle category /model for vehicle entering for fuelling up for 12 hours (24
hours in case of a RO situated on a highway) for 7 days in a staggered manner.
Besides this, direct sales data of diesel provided by PPAC has helped to draw a
complete picture of the consumption pattern of diesel at the national level. This
exercise was done over four different time periods – January to March 2012,
July to September of 2012, October to December of 2012 and April to June of
2013 and the aggregate level data has been arrived both at national and zone

Report – All India Study on Sectoral Demand of Diesel & Petrol 10
level. PPAC had commissioned Nielsen India to conduct the whole field survey
and to submit a comprehensive report keeping in mind the basic objective of
the study.
It appears that that transport sector accounts for 70% (both direct and retail
sales) consumption of diesel at all India level; LCVs, HCVs and Buses together
account for about 38%. This is due to, the large distances that are travelled by
commercial vehicles vis-à-vis passenger vehicles. Cars and UVs category
contribute nearly 22% of the diesel sales, in which private vehicle consumes
little less than 60% of total in this category. This huge private consumption of
diesel is due to growing population of UVs and cars, especially amongst private
car owners. This segment is expected to grow very fast due to introduction of
new generation fuel efficient vehicles by different vehicle manufacturers. Also
change in consumer attitude of a particular segment to opt for UVs rather than
conventional cars. However, it is interesting to note that there is significant
diesel consumption in commercial car and UV segment. Agriculture sector
accounts for around 13%. Agri-implements largely stand for Tractor based agri-
equipment such as Harvesters, Threshers, etc. Pan India consumption pattern
of diesel by transport and non-transport sector for both direct and retail sales
has been presented in the following graph below:
Figure 1: All India End-use Share (%) of Diesel in Retail and Direct Sales Combined
Source: Primary survey of ROs and PPAC
Cars & UVs - Private, 13.15%
Cars & UVs - Commercial, 8.94%
3 Wheelers-Passenger/Goods,
6.39%
HCV/LCV, 28.25% Buses, 9.55%
Aviation/Shipping, 0.48%
Railways, 3.24%
Tractors, Agri Implements and
Agri Pumpset, 13.00%
Industry - Genset, 4.06%
Industry - Other Purpose, 4.96%
Others (Genset for non-industry) & Others, 6.45%
Mobile Tower, 1.54% Transport Non Transport

Report – All India Study on Sectoral Demand of Diesel & Petrol 11
At an All India level, for diesel, the retail sales data echoes similar trend where
in transport sector, diesel consumption is maximum in HCV/ LCV/ Buses
followed by private cars and UVs. In the non-transport sector, maximum
consumption is in agriculture (tractors) followed by gen-set. This may be
because tractors are not necessarily used only for agricultural purposes. Today
they are also used for commercial purposes, such as for transporting
construction material like bricks, stones, mined sand as well as other goods. As
the cost remains low for using tractors for the transportation of these materials
not only due to lesser fuel consumption, but also because these vehicle enjoy
various exemptions like not having to pay toll on highways. It has also been
evident from the retail outlet survey that a sizeable quantity of diesel being
consumed by infrastructure construction industry, stone crushers, drilling &
boring, etc.
Pan India consumption pattern of diesel by transport and non-transport sector
for retail sales has been presented in the following graph below:
Figure 2: All India End-use Share (%) of Diesel in Retail
Source: Primary survey of ROs
On the other hand at an All India level, for petrol, study reveals that 2-wheelers
segment accounts for the highest consumption at 61.42%. This is because
majority of middle-class income population including college students prefer to
travel by 2-wheelers, as it is more economical than traveling by car. Whereas
Cars & UVs Private, 15.13%
Cars & UVs Commercial, 10.29%
3 Wheelers-Passenger/Goods,
7.36%
HCV/LCV, 32.54%
Buses, 8.26%
Tractors , 7.65%
Agri Implements, 3.13%
Agri Pumpset, 3.33%
Industry - Genset, 4.34%
Industry - Other Purpose, 2.11%
Others, 4.08%
Mobile Tower, 1.77%
Non-Transport Transport

Report – All India Study on Sectoral Demand of Diesel & Petrol 12
car category contributes for 34% of retail petrol consumption in India as per
survey; in the coming years, there can be a significant drop in the consumption
of petrol due to increasing price difference between petrol and diesel. Due to
this, people prefer to opt for cars run on diesel as they find it to be more
economical in the long run, though they are slightly expensive than the petrol
driven car at the time of taking out on road. It is interesting to note, 2-wheeler
and cars together account for 95% of the total consumption of petrol (retail
sales) in India. Pan India consumption pattern of petrol has been presented in
the following graph below:
Figure 3: All India End-use Share (%) of Petrol in Retail
Source: Primary survey of ROs
At a zonal level, for diesel (only retail), North zone has the highest share of
diesel consumption in non-transport sector and West zone has the highest
consumption of diesel in the transport sector. Similar trend is observed in case
of HCV/LCV which is over and above the diesel consumption share by all the
other categories in the transport sector. This trend is observed across all the
four zones. In West zone the consumption share of diesel by HCV/LCV is almost
half of the total diesel consumption in the zone. Amongst all the 16 states
covered in the study, diesel consumption share by HCV/LCV is highest in the
state of Maharashtra. This is due to positioning of large commercial hubs in
West zone comprising, Maharashtra and Gujarat vis-à-vis the other states
under consideration. Both, Maharashtra and Gujarat are among the top 5
contributing states to the GDP of India. Diesel consumption share in Buses is
Cars, 34.33%
SUVs, 1.51%
2-Wheelers, 61.42%
3-Wheelers, 2.34% Others, 0.39%
Report – All India Study on Sectoral Demand of Diesel & Petrol 13
highest in South zone, followed by East Zone. This is presumably because South
India has a better road infrastructure and many of the privately owned buses
not only run intra-state bus also interstate. North zone, consisting of states like
Punjab, Haryana and Uttar Pradesh, has the highest share of diesel
consumption in tractors, agri-implements, pump-sets and industrial purposes
(including gen sets). The reason may be attributed by the fact that agriculture /
agro based are the major activity in North India. Punjab, in comparison to all
the other states covered in the study, ranks the highest in diesel consumption
share by tractors and agri implements. Delhi has the highest diesel
consumption share for Industrial back up power purposes which may be due to
shortfall of power supply in the state.
In case of cars and UVs, diesel consumption share (private and commercial) is
highest in the state of Delhi. This is because Delhi is an important business
centre and almost every MNC has a branch/head office in Delhi/NCR. It is
interesting to note that for a few states like Haryana and Bihar, the diesel
consumption in commercial cars and UVs (with yellow number plates) is less
vis-à-vis the other states under consideration. However, there are many cars
and UVs without the yellow plates that are being used for commercial purposes
in those states as per survey. For zone wise and state wise details of diesel
consumption (retail) by transport and non-transport sectors, please refer to the
Appendix.
At zonal level, for petrol, across all the four zones, 2-wheelers lead in the
consumption share of petrol. Whereas, consumption share of petrol by cars is
highest in the North zone. For North and West zone, consumption share of
petrol by UVs and 3-wheelers is less than 5% while for the rest two zones;
percentage share of petrol in UVs and 3-wheelers is almost double (10%). The
consumption share of petrol by 3-wheeler is almost equal in South and East
zone, however for North and West zone, the consumption share in 3-wheelers
is almost negligible. This is presumably because several auto drivers in North
and West zone may have shifted to CNG either by learning that it is more
economical for them to run their 3- wheelers on CNG than on petrol or due to
government mandate on use of CNG in 3 wheelers. Compared to all states,
Orissa leads with highest share of petrol consumption by 2-wheelers. Delhi
however is the leading state followed by Punjab in case of petrol consumption

Report – All India Study on Sectoral Demand of Diesel & Petrol 14
share by cars. Assam has the highest consumption share of petrol by 3-
wheelers. Gujarat has the lowest consumption share of petrol by UVs.
In-depth survey was conducted at ROs to those who are buying loose fuel
(diesel and petrol) in tanks/ barrels from the ROs. It reveals, in majority of the
cases there is an agreement between the RO and owner of bearer of the tank/
barrels where the bearers simply ask for certain quantity of diesel with a less
knowledge about exact application of the diesel. The tracer survey reveals that
majority is getting consumed to run genset for different application such as for
running mobile tower, for electrification at factory/ office, hotels, hospitals as
well as for commercial complex including housing complex. This kind of activity
is very much rampant in case of urban outlets. Whereas in case of highway or
rural outlet it is mainly consumed for running pump set and other agri-
equipment as an alternative to electricity. Even in case of rural areas they carry
diesel to nearby village for storage and consumption whenever needed.

Report – All India Study on Sectoral Demand of Diesel & Petrol 15
1.0 Introduction
Energy is the lifeblood of economy of a nation. How the overall role energy can
play in the economy of a nation and how it serves as the mainspring of
economic growth do not need explanation.
Though India is the world’s fourth-largest energy user, its per capita
consumption is among the lowest in the world. Stagnant output of crude oil
has increased external dependence for its sourcing (77% on consumption
basis) and as a result crude oil constitutes the major item in India’s import bill.
Rising crude oil prices and volatility has negative implications for the Indian
economy and the ambition of putting the economy on a higher growth
trajectory.
In view of the criticality of energy usage for economic growth, it is imperative
for India to formulate appropriate policies and strategies that reduce
dependence on crude and product imports and review pricing strategies of
regulated products, especially diesel. Lack of information on sectoral demand
of diesel and petrol not only poses a challenge for taking policy decisions by
the Government, but also creates a deficiency when it comes to demand
estimation of these products. This necessitates estimation and analysis of
diesel and petrol consumption trends in different sectors/ sub-sectors of the
economy.
The other implicit purpose of this study is to bring to the fore the actual facts /
statistics pertaining to the recent trend of “dieselization” of private motor
transport (at the time of commissioning of the study). Debate was on whether
diesel subsidy was flowing to deserving sectors and consumers or largely to the
well to do sections of the society. Historically, petrol has always been more
expensive than diesel because of higher incidence of taxes on petrol. Since the
government has always been wary of increasing diesel prices for its perceived
adverse impact on inflation, the price gap of diesel with petrol has been
widening. This had led to preference for diesel vehicles vis-à-vis petrol vehicles,
leading to ‘dieselization' of private motor transport, in particular.

Report – All India Study on Sectoral Demand of Diesel & Petrol 16
a. Petroleum sector in India at a glance
After Coal, Oil is the largest energy source for the country with a share of
about 30.5% in the primary energy consumption basket1. The high rate of
economic growth in the Indian economy has been fuelled by an increasing
demand for oil, and consequently, imports of crude oil are also increasing. The
indigenous production of crude oil has not been increasing in tandem with
consumption and demand for petroleum products. For an emerging economy
like India, this gap is likely to increase over the coming years.
Consumption of petroleum products during 2012-13 was 157.1 million
metric tonnes (MMT) (including sales through private imports) which is
6.0% higher than the 148.1 MMT consumed during 2011-12
During 2012-13 the country imported 184.8 MMT of crude oil and 10.91
MMT LNG against 171.7 MMT and 11.63 MMT respectively during 2011-
12.2
Being an environmentally clean fuel, Natural Gas is fast emerging as an
alternative to liquid hydrocarbon. Natural Gas presently meets around 8.7% of
the primary energy demand1. Considering the global trend of shift in energy
mix from oil to natural gas, the share of natural gas in hydrocarbon
consumption in the Indian context is also likely to increase substantially in the
days to come.
To meet the growing energy demand over the next few years, India will have
to enhance its energy security by procuring energy supplies at affordable
prices. While the country has surplus refining capacity and is a net exporter of
petroleum products, major investments will have to be made in the domestic
upstream industry and to acquire hydrocarbon reserves abroad. To this it
seems that the first few steps have already been taken, with the petroleum
minister, approving raising crude oil output from Barmer oilfield in the state of
Rajasthan, and stating that he is now preparing a roadmap to cut India's
energy imports by 50% in next seven years to make India self-reliant by 20303.
1 BP Statistical Review of Word Energy 2013
2 Petroleum Planning & Analysis Cell
3 http://articles.economictimes.indiatimes.com/2013-01-22/news/36484322_1_diesel-prices-petrol-and-
diesel-petrol-prices

Report – All India Study on Sectoral Demand of Diesel & Petrol 17
b. Major petroleum dependant sectors
In 2012-13 India depended on foreign crude oil to meet 84.5% of its refinery
requirement. However, in terms of domestic consumption of petroleum
products, the dependence was significantly lower, at 77%4, the remaining
import being aimed at production for export markets.
Of the total consumption of all types of petroleum products in 2012-13, high
speed diesel oil accounted for 43.98%. This was followed by Petrol (10.02%),
LPG (9.93%) and Naphtha (7.82%)4.
i. Diesel
The following table shows the trend in consumption of diesel in India over a
period of 32 years.
Figure 4: Trends in Consumption of Diesel in India (Million Tonnes)
Diesel is mainly used in the road transport, agriculture, industry and power
generation sectors.
4 Petroleum Planning & Analysis Cell
3.84 6.6 10.35
14.89 21.14
32.26 37.96 40.19 42.9
47.67 51.67
56.32 60.07
64.75 69.08
0
10
20
30
40
50
60
70
80
Trends in Consumption of Diesel in India (Million Tonnes)
Source: Petroleum Planning & Analysis Cell
CAGR 1970-71
to 2012-13 is
7%

Report – All India Study on Sectoral Demand of Diesel & Petrol 18
ii. Petrol
The following table shows the trend in consumption of petrol in India over a
period of 32 years.
Figure 5: Trends in Consumption of Petrol in India (Million Tonnes)
Motor Spirit (MS), Motor Gasoline, Petrol and Gasoline are terms
interchangeably used in India for this light distillate product of refineries.
Motor spirit (MS) is used as a transportation fuel in vehicles such as passenger
cars, two-wheelers and three-wheelers.
1.45 1.28 1.52 2.28
3.55 4.68
6.61
8.65 9.29 10.33
11.26 12.82
14.19 14.99
15.74
0
2
4
6
8
10
12
14
16
18
Trends in Consumption of Petrol in India (Million Tonnes)
Source: Petroleum Planning & Analysis Cell
CAGR 1970-71
to 2012-13 is
5.7%

Report – All India Study on Sectoral Demand of Diesel & Petrol 19
c. Trends in consumption pattern of diesel
i. Transport sector
Due to lower price of diesel and widening price gap with petrol, there was a
surge in the demand for diesel models in most of the passenger vehicle
segments, despite the petrol variants being priced cheaper. Another
complementing factor was the relatively higher fuel efficiency of diesel models.
These two factors can be presumed to be the prime reasons for impacting the
sales of petrol vehicles for the first time in history during 2011-12. Many
models that were offering both the fuel options, the diesel variants accounted
for as much as 80% of sales during 2011-12. According to the Society of Indian
Automobile Manufacturers (SIAM), the proportion of diesel car sales to total
sales has steadily risen from 21.4% in FY08 to 28.42% in FY11. However, in
FY12, at least 40% of the total cars sold in the country run on diesel5.
Seeing this trend many top makers like Maruti, Hyundai and Ford have
announced investments to boost diesel engine capacity. However, in case of
complete deregulation of diesel prices, there may be some moderation in the
rush for diesel cars. But then as per industry experts, an increase in diesel price
will have very little impact on UV and commercial vehicle demand, but may
slightly shift demand to petrol driven cars in the passenger car segment in the
small and mid-range.
5 http://timesofindia.indiatimes.com/business/india-business/Surge-in-sales-of-diesel-cars-may-
ease/articleshow/18067725.cms

Report – All India Study on Sectoral Demand of Diesel & Petrol 20
ii. Non-Transport sector
Tractors and Agri-implements
In terms of volume, India is one of the largest tractor markets in the world,
besides China and the USA. The prospects of domestic industry are highly
linked to monsoon which remains a key factor in determining agricultural
production. Better irrigated states like Punjab and Haryana have a high tractor
density (over 100 per 1,000 ha), while Rajasthan, Gujarat, Himachal, Tamil
Nadu, Maharashtra, Andhra, Madhya Pradesh and West Bengal have low levels
of tractor penetration—a pointer to the substantial growth potential that the
latter set offers. On an all-India basis, tractor penetration remains low at
around 13 per 1,000 ha. Besides their use in farming, tractors find application
in activities such as harvesting and irrigation, land reclamation, drawing water,
powering agricultural implements and rural transportation. In addition, lately,
the tractors are also being used for non-agricultural purposes including
haulage in construction and infrastructure projects, which has expanded the
tractor market.6 For the financial year 2013-14, growth is expected to be
modest and industry expects volume to expand by 5%-7%7.
Also, there is expected to be a rise in use of farm tools that run on diesel, as
lately farmers in India have learnt that mechanisation is important as it can
help them in raising their farm income by increasing productivity and limiting
post-harvest losses. And with convenient and tailor made finance options it
has become much easier for them to buy tractors, tillers or other agricultural-
implements.
Generators
The power shortage in India is of the order of about 9%: at peak periods it goes
up to 18%. In some regions it is worse. The deficit is increasingly being met
through power produced by diesel and heavy fuel oil-powered generating sets.
The power backup market in India is growing at an annual rate of 10-15% due
6 IUP Journal of Marketing Management, May 2013
7 Indian Tractor Industry – ICRA Research Services, October 2013
Report – All India Study on Sectoral Demand of Diesel & Petrol 21
to rising demand-supply gap, however varying within the three different
segments – generators, UPS and inverters.8
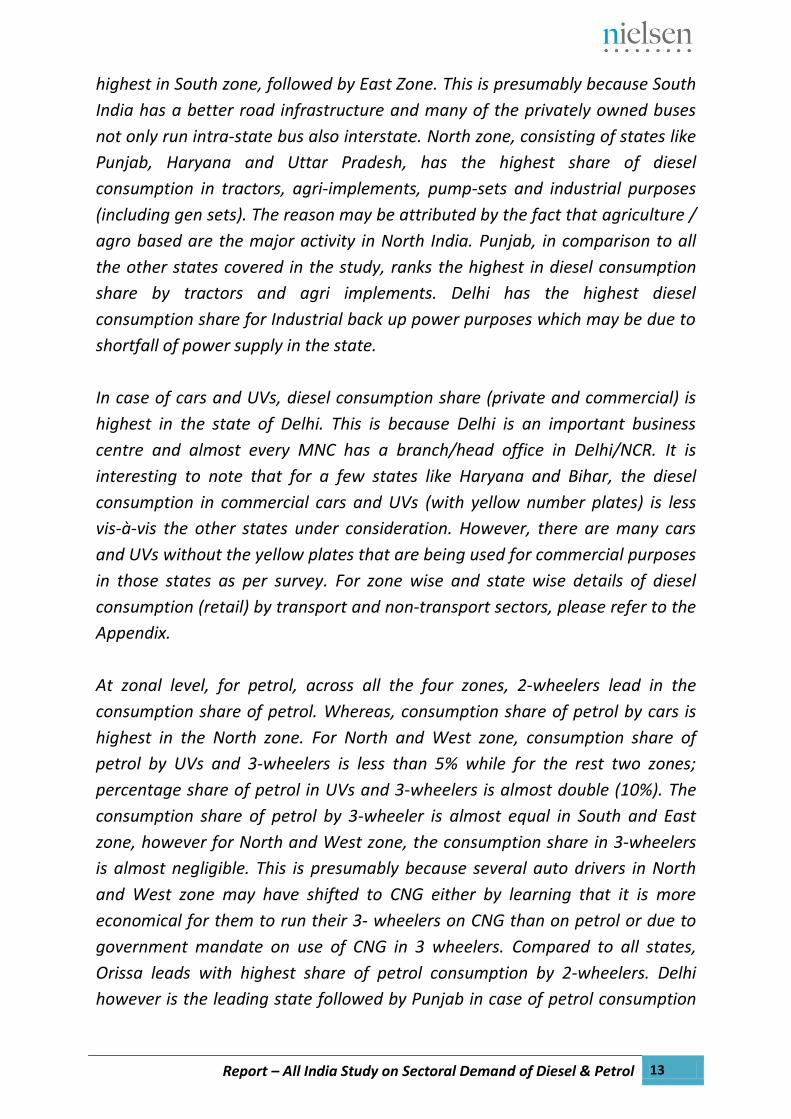
Agri-pumps
Pumpsets in India are used in domestic, agriculture, construction and industrial
sectors. Agriculture sector leads the usage of pumps in India with prominent
uses like irrigation. The number of farmers using diesel powered pumps is high
in villages having remote or minimal access to electricity. However, there too,
poor farmers are ignorant of the fact that using efficient and technologically
advanced pumps will be beneficial to them by bringing down the fuel usage.
Mobile Towers
In the telecom sector, service providers have started infrastructure sharing in
order to save capital cost and the cost of fuel needed to operate the Base
Transceiver Station (BTS). In the coming days, this transformation may reduce
the consumption of diesel in mobile sites.
8 Construction Week, Business Line
Report – All India Study on Sectoral Demand of Diesel & Petrol 22
2.0 Study Background
The total diesel sold in the country during 2012-13 was 69,080 TMT and petrol
15,744 TMT. While diesel constitutes about 44% of total consumption of
petroleum products in India, petrol accounts for about 10%.
Out of the total petrol and diesel sales in the country, more than 99% of the
petrol and 90% of the diesel is sold through retail outlets (petrol pumps), for
which there is no system of capturing the consumption data of the sectors and
categories based on their end-use. However, the sector-wise consumption of
diesel sold directly by the Oil Marketing Companies (OMCs) for bulk consumers
like industry, railways, defense, etc. is available. The data related to sectoral
consumption of these products is an important input for any policy
formulation.
This study (i.e. All India Study on Sectoral Demand for Diesel and Petrol)
commissioned by Petroleum Planning and Analysis Cell (PPAC) aims at
providing critical inputs through Retail data on sector wise consumption of
Diesel and Petrol from ROs for the intended strategic/ policy interventions.
PPAC commissioned Nielsen (India) Pvt. Ltd. to carry out quarterly sample
surveys across a specified number of selected retail outlets of PSU OMCs for
arriving at the sectoral/ segment wise demand of Petrol & Diesel sold through
retail outlets.
3.0 Research Objective
The broad objective of the study was to estimate the percentage share of
sectors/ segments in consumption of Diesel and Petrol sold through retail
outlets on a state-wise, zone-wise and all India basis.

Report – All India Study on Sectoral Demand of Diesel & Petrol 23
4.0 Scope of work of the study
As per the terms of reference, the scope of work for this study was:
• To capture the consumption trend for diesel across the following sub-
categories:
– Cars & Utility Vehicles (UVs) – Private
– Cars & UVs – Commercial
– Buses
– Light Commercial Vehicles (LCVs) & Heavy Commercial Vehicles
(HCVs)
– Agriculture (Tractors, Pump Sets, Other Agri Equipment)
– Power Generation (Gensets)
– Industrial Applications
– Others (such as Mobile Towers etc.)
• To capture the consumption trend for petrol across the following sub-
categories:
– Cars
– 2- Wheelers / 3-wheelers
– UVs
– Others, if any
5.0 Methodology & Coverage
This study was conducted in four phases, wherein each phase consisted of a
stint of three months. This was done to understand the percentage change and
factors for change in consumption pattern for both diesel and petrol at
different time periods at state, zonally and all India level.
This study encompasses minimum 2000 Retail Outlets (ROs) spread across 150
districts in 16 states.

Report – All India Study on Sectoral Demand of Diesel & Petrol 24
a. Selection of districts in each of the identified states
16 states were selected for this study, which constituted 85% of the total sales
of diesel and petrol in India (during 2011-12).
To shortlist the districts within each of the identified states:
Firstly, the numbers of districts in each of the identified state were
listed.
Then the ratios were calculated – number of districts in each identified
state to the aggregate number of districts in these states.
Based on these ratios, one arrived at the final number of districts to be
covered in each of the 16 states.
Then the selection of urban and rural districts in these states was done based
on the vehicle population data, as well as the past sales volume of petrol and
diesel. (The final go ahead was taken only after the approval of the committee
members of PPAC).
Table 1: Selection of Districts in Each of the Identified State
S. No. States No. of
Districts Proportion
No. of districts to be
covered
1 Andhra Pradesh 23 0.05 7
2 Assam 27 0.06 8
3 Bihar 38 0.08 12
4 Delhi 9 0.02 3
5 Gujarat 26 0.05 8
6 Haryana 21 0.04 7
7 Karnataka 30 0.06 9
8 Kerala 14 0.03 4
9 Madhya Pradesh 50 0.10 16
10 Maharashtra 35 0.07 12
11 Orissa 30 0.06 9
12 Punjab 20 0.04 6
13 Rajasthan 33 0.07 10
14 Tamil Nadu 32 0.07 10
15 Uttar Pradesh 75 0.16 23
16 West Bengal 19 0.04 6
Total 482 1.00 150

Report – All India Study on Sectoral Demand of Diesel & Petrol 25
b. Selection of retail outlet
The retail outlets were selected from the list of outlets provided by OMCs for
each district. OMCs provided a list of 20 ROs per district in consultation with
the joint coordination committee of PPAC and OMCs. Of these 20 ROs, in
agreement to the sample size, 13-14 ROs were selected per district by Nielsen,
taking into consideration the sales volume and class market catered, so as to
cover all types of ROs (i.e. A, B, C, D, and E).
Table 2: State Wise RO Coverage
S. No. State Total ROs covered
1 Andhra Pradesh 89
2 Assam 100
3 Bihar 173
4 Delhi 45
5 Gujarat 107
6 Haryana 99
7 Karnataka 117
8 Kerala 59
9 Madhya Pradesh 178
10 Maharashtra 150
11 Orissa 112
12 Punjab 87
13 Rajasthan 145
14 Tamil Nadu & Pondicherry 131
15 Uttar Pradesh 325
16 West Bengal 89
TOTAL 2006
In this way the final list of ROs to be covered for this study for each district was
prepared and the same was shared and discussed with PPAC and OMCs before
launching of field work.

Report – All India Study on Sectoral Demand of Diesel & Petrol 26
c. Operational methodology
To collect the data in order to meet the research objectives, there were two
sets of questionnaires that were administered at each of the identified RO.
Figure 6: Operational Methodology
As per the sampling frame, 13 to 14 ROs were allotted to each district. To cater
to these 13-14 ROs, a team of 5 to 6 investigators were allotted to a district in
each state and as per the location and traffic coming to the RO, 2 to 3
enumerators were allotted to each RO. In some cases only one enumerator
was also there. The investigators were responsible for taking down
observations for both the transport and non-transport segment. In case of
non-transport segment i.e. for loose sales in cans, barrels containers, etc., the
respondents were interviewed to find out the quantity, frequency and the
purpose of this purchase. In certain cases, even the addresses for such kind of
consumers were noted so that they could be traced and interviewed. In this
way, close to 1000 households/consumers were interviewed in each phase,
Observation Sheet
• Enumerator had to be physically present at the RO and note down the volume of fuel filled from the dispensers against the vehicle category /model for each vehicle entering the RO and also capture the loose sales of petrol and diesel
• For each RO, this exercise was carried out for 12 hours for 7 days in a staggered manner across the quarter. In case an identified RO was situated on a highway, instead of 12 hours the same exercise was done for 24 hours for 7 days in a row
• In order to perform this assignment, Nielsen ensured that sufficient enumerators are allocated to each RO depending on the location and traffic that comes in and out of that RO. However, it must be noted that 2 wheelers count as well as volume was not taken into account in case of metros /mini metros and Class 1 towns as it was practically not possible.
Outlet Questionnaire
• This questionnaire was administered to the outlet owner/manager by the supervisor on duty, in order to have a bird’s eye view of the filling pattern, volume, type of vehicles that are coming to their RO, hours of operation, seasonality and more.
Report – All India Study on Sectoral Demand of Diesel & Petrol 27
belonging to various selected districts to understand the purpose and quantity
of the loose diesel purchased from the covered ROs.
To ensure data consistency and accuracy, multiple checks were performed at
various levels. Also, multiple layers were rooted during the course of the study
to have a close control and monitoring at the grass root level. Each state had a
supervisor and each day, every enumerator had to report to the supervisor of
their respective state and brief them on the developments of the fieldwork.
Apart from supervising, each supervisor was also responsible to carry out the
necessary back checks of the work out carried by enumerators in each district
of their respective state and also be in touch with the local sales officer/OMC
for any issues or clarity while conducting the fieldwork.
All the ROs were monitored by Nielsen supervisors without the knowledge of
enumerators, who were locally sourced. It was ensured that all the 2000 ROs
were contacted on their land line numbers to confirm the presence of the
enumerator on the field and to confirm that necessary signature with stamping
was done on the daily sheets from the authorized representative of respective
RO. Also, a feedback from all the ROs was taken regarding the enumerators.
d. Time period
The time periods were selected in consultation with PPAC. The first phase of
survey was from January till March 2012, the second phase of survey was from
July till September 2012, the third phase of survey was from October till
December 2012 and the last phase of survey was from April till June 2013.
Report – All India Study on Sectoral Demand of Diesel & Petrol 28
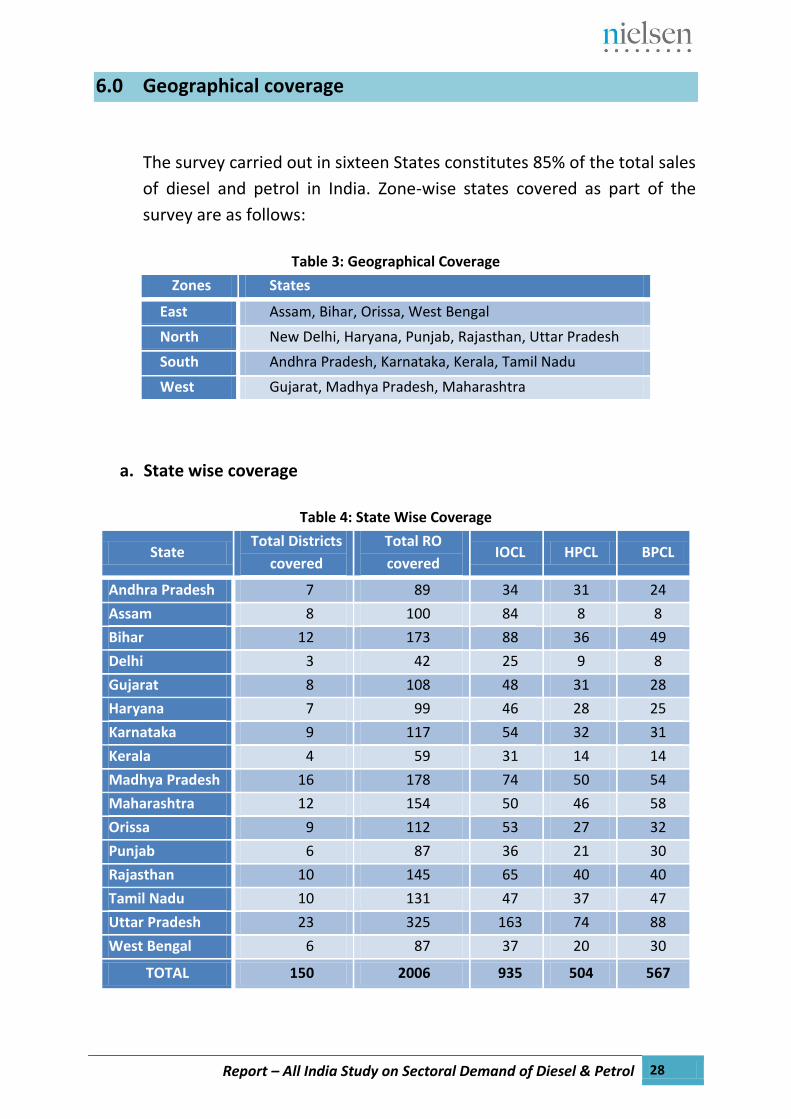
6.0 Geographical coverage
The survey carried out in sixteen States constitutes 85% of the total sales
of diesel and petrol in India. Zone-wise states covered as part of the
survey are as follows:
Table 3: Geographical Coverage
Zones States
East Assam, Bihar, Orissa, West Bengal
North New Delhi, Haryana, Punjab, Rajasthan, Uttar Pradesh
South Andhra Pradesh, Karnataka, Kerala, Tamil Nadu
West Gujarat, Madhya Pradesh, Maharashtra
a. State wise coverage
Table 4: State Wise Coverage
State Total Districts
covered
Total RO
covered IOCL HPCL BPCL
Andhra Pradesh 7 89 34 31 24
Assam 8 100 84 8 8
Bihar 12 173 88 36 49
Delhi 3 42 25 9 8
Gujarat 8 108 48 31 28
Haryana 7 99 46 28 25
Karnataka 9 117 54 32 31
Kerala 4 59 31 14 14
Madhya Pradesh 16 178 74 50 54
Maharashtra 12 154 50 46 58
Orissa 9 112 53 27 32
Punjab 6 87 36 21 30
Rajasthan 10 145 65 40 40
Tamil Nadu 10 131 47 37 47
Uttar Pradesh 23 325 163 74 88
West Bengal 6 87 37 20 30
TOTAL 150 2006 935 504 567
Report – All India Study on Sectoral Demand of Diesel & Petrol 29
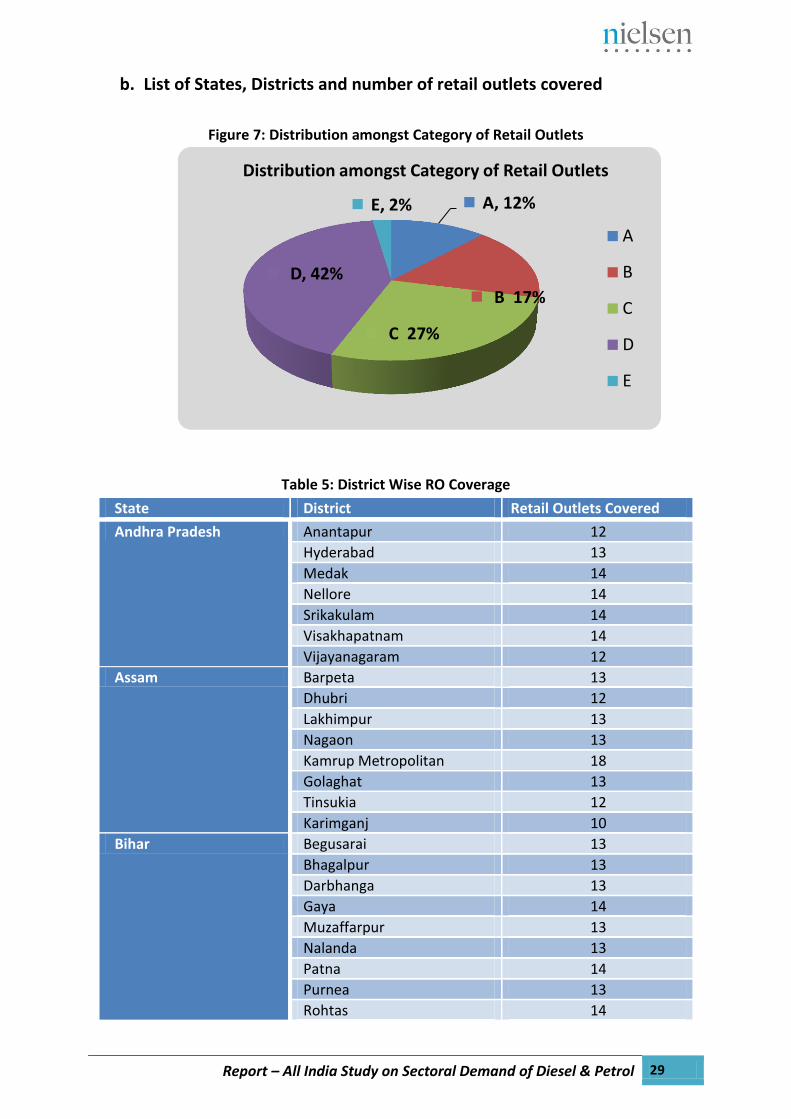
b. List of States, Districts and number of retail outlets covered
Figure 7: Distribution amongst Category of Retail Outlets
Table 5: District Wise RO Coverage
State District Retail Outlets Covered
Andhra Pradesh Anantapur 12
Hyderabad 13
Medak 14
Nellore 14
Srikakulam 14
Visakhapatnam 14
Vijayanagaram 12
Assam Barpeta 13
Dhubri 12
Lakhimpur 13
Nagaon 13
Kamrup Metropolitan 18
Golaghat 13
Tinsukia 12
Karimganj 10
Bihar Begusarai 13
Bhagalpur 13
Darbhanga 13
Gaya 14
Muzaffarpur 13
Nalanda 13
Patna 14
Purnea 13
Rohtas 14
A, 12%
B 17%
C 27%
D, 42%
E, 2%
Distribution amongst Category of Retail Outlets
A
B
C
D
E
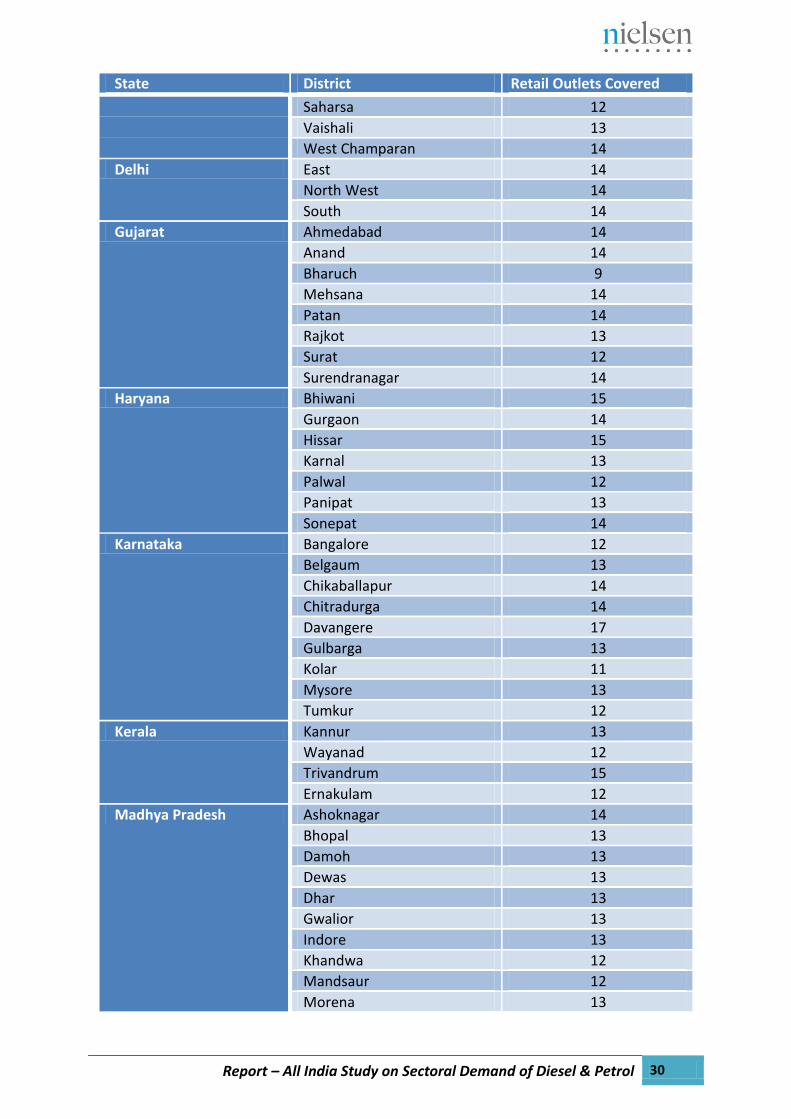
Report – All India Study on Sectoral Demand of Diesel & Petrol 30
State District Retail Outlets Covered
Saharsa 12
Vaishali 13
West Champaran 14
Delhi East 14
North West 14
South 14
Gujarat Ahmedabad 14
Anand 14
Bharuch 9
Mehsana 14
Patan 14
Rajkot 13
Surat 12
Surendranagar 14
Haryana Bhiwani 15
Gurgaon 14
Hissar 15
Karnal 13
Palwal 12
Panipat 13
Sonepat 14
Karnataka Bangalore 12
Belgaum 13
Chikaballapur 14
Chitradurga 14
Davangere 17
Gulbarga 13
Kolar 11
Mysore 13
Tumkur 12
Kerala Kannur 13
Wayanad 12
Trivandrum 15
Ernakulam 12
Madhya Pradesh Ashoknagar 14
Bhopal 13
Damoh 13
Dewas 13
Dhar 13
Gwalior 13
Indore 13
Khandwa 12
Mandsaur 12
Morena 13
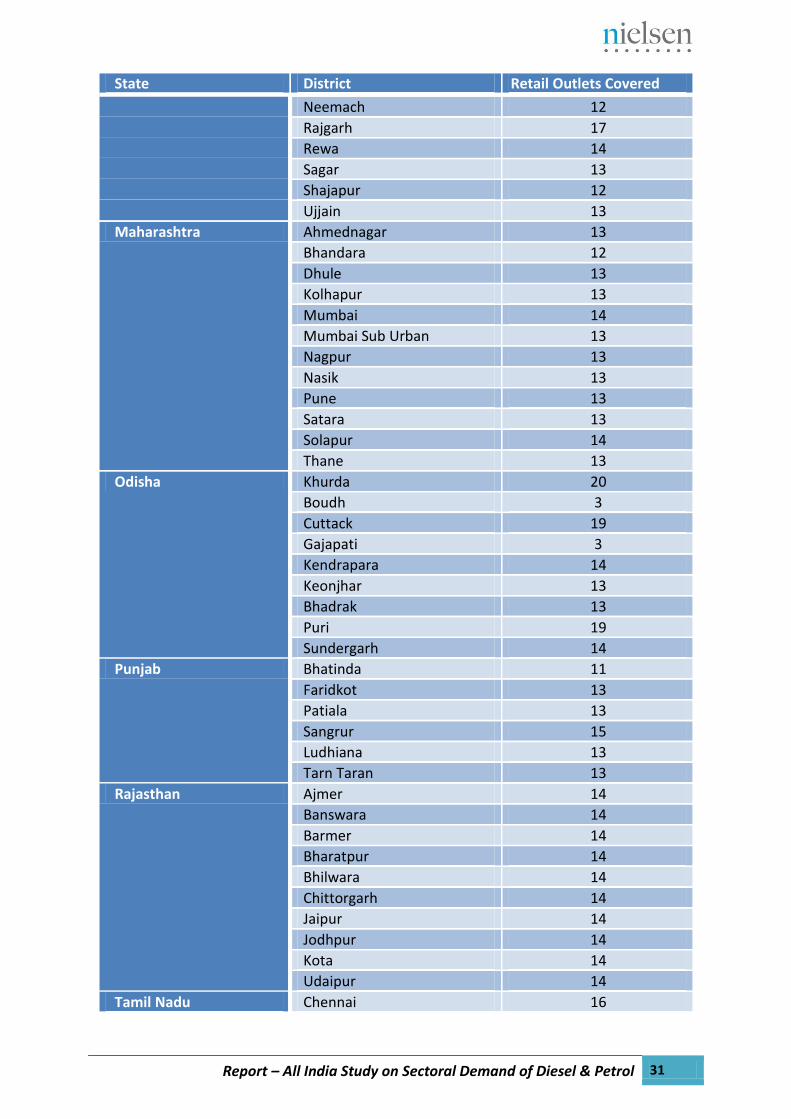
Report – All India Study on Sectoral Demand of Diesel & Petrol 31
State District Retail Outlets Covered
Neemach 12
Rajgarh 17
Rewa 14
Sagar 13
Shajapur 12
Ujjain 13
Maharashtra Ahmednagar 13
Bhandara 12
Dhule 13
Kolhapur 13
Mumbai 14
Mumbai Sub Urban 13
Nagpur 13
Nasik 13
Pune 13
Satara 13
Solapur 14
Thane 13
Odisha Khurda 20
Boudh 3
Cuttack 19
Gajapati 3
Kendrapara 14
Keonjhar 13
Bhadrak 13
Puri 19
Sundergarh 14
Punjab Bhatinda 11
Faridkot 13
Patiala 13
Sangrur 15
Ludhiana 13
Tarn Taran 13
Rajasthan Ajmer 14
Banswara 14
Barmer 14
Bharatpur 14
Bhilwara 14
Chittorgarh 14
Jaipur 14
Jodhpur 14
Kota 14
Udaipur 14
Tamil Nadu Chennai 16

Report – All India Study on Sectoral Demand of Diesel & Petrol 32
State District Retail Outlets Covered
Coimbatore 13
Erode 13
Karur 13
Namakkal 15
Perambalur 14
Krishnagiri 13
Tuticorin 13
Thiruvarur 13
Tirupur 13
Uttar Pradesh Agra 14
Allahabad 14
Barelly 14
Basti 14
Ballia 14
Bijnore 13
Bulandshahar 14
Deoria 14
Faizabad 14
Gorakhpur 14
Goutam Budh Nagar 14
Ghaziabad 14
Kanpur Nagar 14
Lucknow 14
Mathura 14
Mau 14
Meerut 14
Mirzapur 14
Pilibhit 14
Sitapur 14
Saharanpur 14
Unnao 14
Varanasi 14
West Bengal Bardhaman 14
Darjeeling 14
Kolkata 14
Malda 13
North 24 Parganas 14
Purba Madinipur 14
Report – All India Study on Sectoral Demand of Diesel & Petrol 33
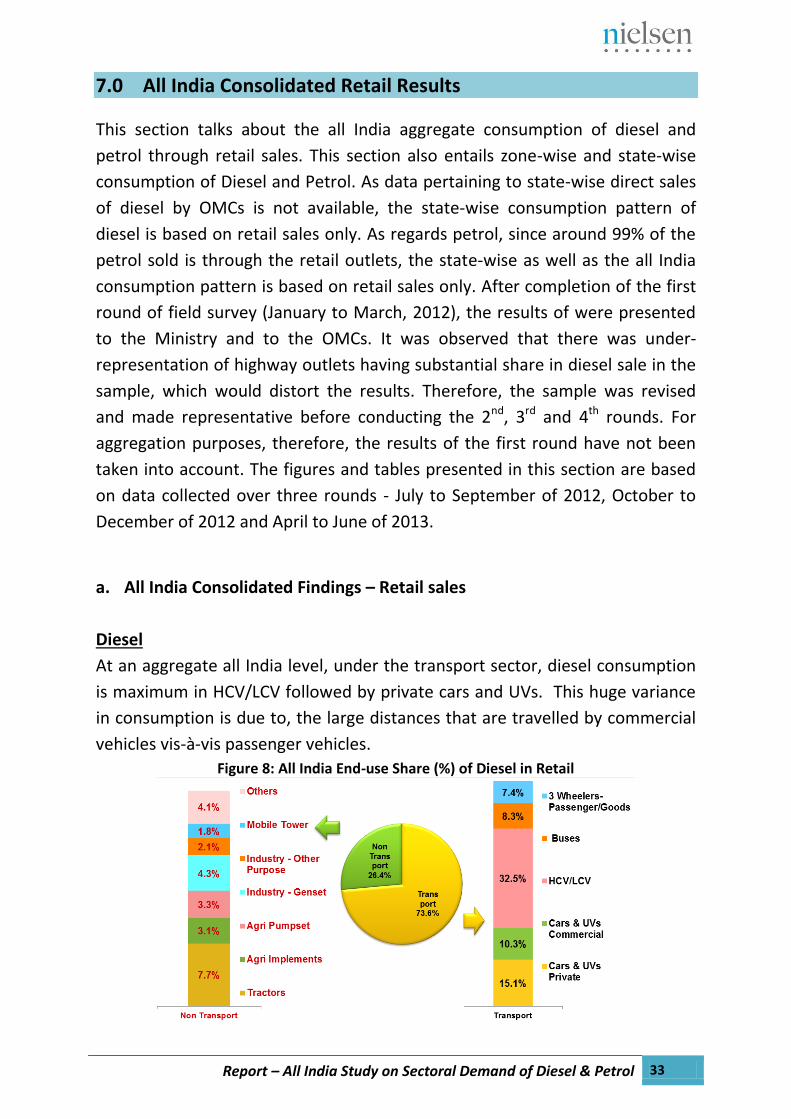
7.0 All India Consolidated Retail Results
This section talks about the all India aggregate consumption of diesel and
petrol through retail sales. This section also entails zone-wise and state-wise
consumption of Diesel and Petrol. As data pertaining to state-wise direct sales
of diesel by OMCs is not available, the state-wise consumption pattern of
diesel is based on retail sales only. As regards petrol, since around 99% of the
petrol sold is through the retail outlets, the state-wise as well as the all India
consumption pattern is based on retail sales only. After completion of the first
round of field survey (January to March, 2012), the results of were presented
to the Ministry and to the OMCs. It was observed that there was under-
representation of highway outlets having substantial share in diesel sale in the
sample, which would distort the results. Therefore, the sample was revised
and made representative before conducting the 2nd, 3rd and 4th rounds. For
aggregation purposes, therefore, the results of the first round have not been
taken into account. The figures and tables presented in this section are based
on data collected over three rounds - July to September of 2012, October to
December of 2012 and April to June of 2013.
a. All India Consolidated Findings – Retail sales
Diesel
At an aggregate all India level, under the transport sector, diesel consumption
is maximum in HCV/LCV followed by private cars and UVs. This huge variance
in consumption is due to, the large distances that are travelled by commercial
vehicles vis-à-vis passenger vehicles.
Figure 8: All India End-use Share (%) of Diesel in Retail

Report – All India Study on Sectoral Demand of Diesel & Petrol 34
On the other hand for all India basis, in the non-transport sector, diesel
consumption is maximum in tractors followed by industry genset. Plausible
reason can be that, tractors are not necessarily used only for agricultural
purposes. Today they are also used for commercial purposes, such as for
transporting construction material such as bricks, stones, mined sand as well as
other goods. As the cost remains low for using tractors for the transportation
of these materials not only due to lesser fuel consumption, but also because
these vehicle enjoy various exemptions like not having to pay toll on highways.
Figure 9: All India End-use % Share of Diesel in Retail – Zone Wise
North zone has the highest share of diesel consumption in non-transport
sector and West zone has the highest consumption of diesel in the transport
sector.
In the North zone, the diesel consumption share in transport sector is
comparatively less than that of non-transport sector when compared to the
other three zones. This is due to the extensive agricultural activities in the
states considered under North zone (especially Punjab and Haryana) where
majority of people make their livelihood through agriculture and therefore, to
have high crop yield they might be making extensive use of tractors and other
agricultural equipment’s like power tillers etc. that run on diesel.
63.29% 76.34% 73.14%
83.39% 73.58%
36.71% 23.66% 26.86% 16.61% 26.42%
0%
10%
20%
30%
40%
50%
60%
70%
80%
90%
100%
North Zone South Zone East Zone West Zone All India
NonTransport
Transport

Report – All India Study on Sectoral Demand of Diesel & Petrol 35
Figure 10: All India End-use % Share of Diesel in Retail – Zone Wise for Transport
At an all India level, the diesel consumption by volume in the transport sector
is the highest in the commercial and buses category (40.80%) followed by cars
and UVs (25.42%). Consumption by Private cars and UV is 15.13%.
Here, the interesting point to note is that the diesel consumption in the
HCV/LCV for West zone is very high compared to North, East and South zone.
This is presumed to be due to more commercial activities in West zone
comprising of Maharashtra, Gujarat and Madhya Pradesh vis-à-vis the other
three zones. For the financial year 2010-11, Maharashtra contributed 25 per
cent9 of the country's industrial output and 23.2 per cent of its GDP; this might
be the reason for high diesel consumption in the HCV/LCV for West zone.
9 http:// www.rediff.com/business/slide-show/slide-show-1-top-25-states-with-highest-gdp/20120223.htm
13.73% 17.13% 17.79% 14.40% 15.13%
10.02% 9.96% 9.37%
11.17% 10.29%
35.72%
41.60% 37.50% 47.35%
40.80%
3.83%
7.65% 8.47%
10.48%
7.36%
0%
10%
20%
30%
40%
50%
60%
70%
80%
90%
North Zone South Zone East Zone West Zone All India
3 Wheelers
HCV/LCV &Buses
Cars & UVsCom.
Cars & UVsPvt.

Report – All India Study on Sectoral Demand of Diesel & Petrol 36
Figure 11: All India End-use % Share of Diesel in Retail – Zone Wise for Non-Transport
At an all India level, the diesel consumption by volume in the Non-Transport
sector is the highest in tractors (7.65%) followed by Industry genset (4.34%).
Though the shortage of electricity is a problem in states such as Delhi, Uttar
Pradesh, Bihar, Tamil Nadu, Karnataka etc., the country faced a huge power
deficit of over 12,000 MW10 during the peak hours in the last financial year, but
it’s somehow interesting to note that for some states this gap is significantly
less vis-à-vis other states. This conclusion can be inferred from the above
diagram, where the diesel consumption by volume for Industry gensets in West
zone is almost 1/3rd to that of North Zone.
It is also interesting to note that the diesel consumption by volume for agri
pumpset is least in South zone followed by West zone. However, it is presumed
that this may differ year on year, as use of agri pumpset is inversely relational
to the amount of rainfall. But still, the possibilities of better irrigational
systems in South zone than the rest of the zones cannot be ruled out.
10
http:// articles.economictimes.indiatimes.com/2013-04-14/news/38529356_1_peak-power-deficit-power-shortage-central-electricity-authority
12.32%
5.03% 7.04%
4.27% 7.65%
5.09%
2.26% 2.28%
1.88%
3.13%
4.55%
1.98%
4.33%
2.26%
3.33%
6.42%
5.58%
2.82%
2.18%
4.34%
3.17%
2.44% 1.72%
0.98%
2.11%
1.82%
1.60% 2.57%
1.45%
1.77%
3.35%
4.77%
6.11%
3.59%
4.08%
0%
5%
10%
15%
20%
25%
30%
35%
40%
45%
50%
North Zone South Zone East Zone West Zone All India
Others
MobileTower
Industry -OtherPurpose
Industry -Genset
AgriPumpset
AgriImplements
Tractors

Report – All India Study on Sectoral Demand of Diesel & Petrol 37
Petrol
Figure 12: Petrol-Retail Consumption Break-up (All India) – Zone Wise Aggregate
The consumption of petrol in terms of volume for 2-wheelers is highest in the
West zone (63.7%) followed by East and South zone. North zone has the
lowest consumption of petrol in terms of volume for 2-wheelers, and highest
consumption of petrol for 4 wheelers.
The 3-wheeler consumption of petrol in terms of volume is almost equal in
South and East zone, however for North and West zone, the consumption of
petrol in terms of volume in 3-wheelers is almost negligible.
This is presumably because several auto drivers in North and West zone may
have shifted to CNG due to one of the following reasons:
Auto drivers learnt the fact that it is more economical for them to run their
3- wheelers on CNG than on petrol.
Due to government mandate on use of CNG in 3 wheelers
0%
10%
20%
30%
40%
50%
60%
70%
North Zone South Zone East Zone West Zone All India
40.17%
27.71% 27.39%
34.72% 34.33%
2.94% 3.77% 2.79% 0.43% 1.51%
54.72%
60.76% 61.66% 63.70%
61.42%
1.84% 6.53% 6.48%
1.10% 2.34%
0.33% 1.22% 1.69% 0.06% 0.39%
Cars UVs 2-Wheelers 3-Wheelers Others

Report – All India Study on Sectoral Demand of Diesel & Petrol 38
b. All India Zone wise findings - Retail sales
i. North Zone’s break up in consumption of Diesel and Petrol - Exclusively
Retail
In the Transport sector of North zone, diesel consumption is maximum in
HCV/LCV (28.9%), followed by Private Cars and UVs (13.7%).
In the Non-Transport sector, diesel consumption is the maximum in tractors
(12.3%).
Diesel consumption in tractors, Agri-implements and Agri-pump sets
congregated together is approximately 22% of the total diesel consumption in
North zone. This tells that agriculture is the main industry in North zone of
India. Surprisingly, for South, West and East zones, the diesel consumption in
tractors, Agri-implements and Agri-pump sets grouped together is only 13.6%,
9.3% and 8.5% of the total diesel consumption in respective zones.
Figure 13: North Zone End-use Share (%) of Diesel in Retail – Final
Diesel consumption in the transport sector of North zone is maximum in the
state of Rajasthan and least in Punjab. This may be due to lesser agricultural
activitiy in Rajasthan.

Report – All India Study on Sectoral Demand of Diesel & Petrol 39
Figure 14: North Zone End-use % Share of Diesel in Retail – State Wise
In North zone, Delhi has the highest diesel consumption in private cars and UVs
at 34.7%. It is interesting to note that in Haryana, there is diesel consumption
of only 4.5% in commercial cars and UVs. This is presumably because, for this
study only the cars and UVs with yellow number plates have been taken into
account under the commercial cars and UVs segment. However, there are
many cars and UVs without the yellow plates that are being used for
commercial purposes, which have not been considered.
Diesel consumption in HCV/LCV and Buses segment in Haryana is the highest,
presumably because long distance commercial vehicles are refuelling diesel in
Haryana due to price advantage as compared to neighbouring states.
Figure 15: North Zone End-use % Share of Diesel in Retail – State Wise for Transport
71.90% 64.56%
52.87%
76.84%
55.60% 63.29%
28.10% 35.44% 47.13% 23.16% 44.40% 36.71%
0%
10%
20%
30%
40%
50%
60%
70%
80%
90%
100%
Delhi Haryana Punjab Rajasthan UP North Zone
NonTransport
Transport
34.69%
7.56% 14.15% 15.61% 14.67% 13.73%
18.43%
4.46%
9.75% 16.82%
9.33% 10.02%
18.50%
50.55% 26.50%
39.58%
25.72% 35.72%
0.29%
1.99%
2.48%
4.83%
5.88%
3.83%
0%
10%
20%
30%
40%
50%
60%
70%
80%
90%
Delhi Haryana Punjab Rajasthan UP North Zone
3 Wheelers
HCV/LCV &Buses
Cars & UVsCom.
Cars & UVsPvt.

Report – All India Study on Sectoral Demand of Diesel & Petrol 40
In Delhi, the diesel consumption for Industrial back up power purposes is
almost 17.3%. This is presumably because of the shortfall of power supply.
About 58 per cent of the shortfall in the state is met by purchasing power
through long-term power purchase agreements (PPA) with power generators
in other states and a further 13 per cent of the shortfall is met by purchasing
power on a short-term basis from other states or on the spot market11. In
coming times, the situation may worsen, as the states that Delhi relies on for
its additional power, need to bridge their deficits and might be less willing to
meet Delhi’s continued and growing need for power.
In Uttar Pradesh, the diesel consumption for running of mobile towers is 3.9%.
This presumably is because Uttar Pradesh has the highest number of BTS
installed in a state in India, almost 12 per cent12, and to keep the mobile
towers operational, diesel is essential.
Figure 16: North Zone End-use % Share of Diesel in Retail – State Wise for Non-Transport
11
http:// www.thehindu.com/todays-paper/tp-national/tp-newdelhi/sun-holds-key-to-end-delhis-power-shortage/article4947300.ece 12
http://telecomtalk.info/india-has-736654mobile-towers-and-only-96112bts-are-3g-enabled/103422/
0.65%
10.20%
17.69%
12.42% 14.00% 12.32%
7.29%
8.58%
2.50% 4.29%
5.09%
0.21%
3.26%
7.02%
1.87%
7.27% 4.55%
9.84%
8.24%
6.19%
3.20%
6.45%
6.42%
7.53%
2.52%
2.56%
1.25%
4.61%
3.17%
0.02%
0.43%
2.01%
0.87%
3.92%
1.82%
9.85%
3.49%
3.09%
1.05%
3.86%
3.35%
0%
10%
20%
30%
40%
50%
Delhi Haryana Punjab Rajasthan UP North Zone
Others
MobileTower
Industry -OtherPurposeIndustry -Genset
AgriPumpset
AgriImplements
Tractors

Report – All India Study on Sectoral Demand of Diesel & Petrol 41
Figure 17: Petrol-Retail Consumption Break-up (North Zone) – State Wise
The state of Rajasthan leads in North zone in consumption of petrol by 2-
wheelers (73.85%) whereas Delhi leads in consumption of petrol in cars
(56.94%).
Interesting point to note is that in Delhi, the petrol consumption for 3 wheelers
is almost zero. This may be due to the mandate by state government on use of
only CNG for 3 wheelers.
Another point noteworthy is that the state of Rajasthan leads amongst all
states in percentage consumption of petrol by UVs.
ii. East Zone’s break up in consumption of Diesel and Petrol - Exclusively
Retail
In the Transport sector of East zone, diesel consumption is maximum in
HCV/LCV (26.8%) followed by Private Cars and UVs (17.8%). In the Non-
Transport sector, diesel consumption is the maximum in tractors (7.0%).
In East zone, the diesel consumption for running of mobile towers is very
significant at 2.6%. This presumably is due to the lack of power source at high
altitudes because of hilly terrain. In fact the peak power deficit in the seven-
sister states of North-east India - Assam, Meghalaya, Manipur, Tripura,
Mizoram, Arunachal Pradesh and Nagaland - deteriorated to 11 per cent from
0%
10%
20%
30%
40%
50%
60%
70%
80%
Delhi Haryana Punjab Rajasthan UP North Zone
56.94% 54.83% 56.63%
18.58%
31.74%
40.17%
1.20% 0.59% 0.91% 5.15% 4.14% 2.94%
41.80% 44.44%
40.81%
73.85%
60.19% 54.72%
0.07% 0.14% 1.65%
2.22% 3.20% 1.84% 0.19% 0.73% 0.33%
Cars UVs 2-Wheelers 3-Wheelers Others

Report – All India Study on Sectoral Demand of Diesel & Petrol 42
8.7 per cent13 in 2012. In such a case, generators remain to be the only option
for mobile service providers to keep the Base Transceiver Station (BTS)
operational.
Figure 18: East Zone End-use Share (%) of Diesel in Retail – Final
In the East zone, share of diesel consumption in non-transport sector is
maximum in the state of Bihar and least in Odisha.
Figure 19: East Zone End-use % Share of Diesel in Retail – State Wise
13
http:// articles.economictimes.indiatimes.com/2013-09-16/news/42114483_1_peak-power-deficit-august-2012-power-shortage
81.33% 81.99% 78.11%
55.04%
73.14%
18.67% 18.01% 21.89% 44.96% 26.86%
0%
10%
20%
30%
40%
50%
60%
70%
80%
90%
100%
West Bengal Odisha Assam Bihar East Zone
NonTransport
Transport
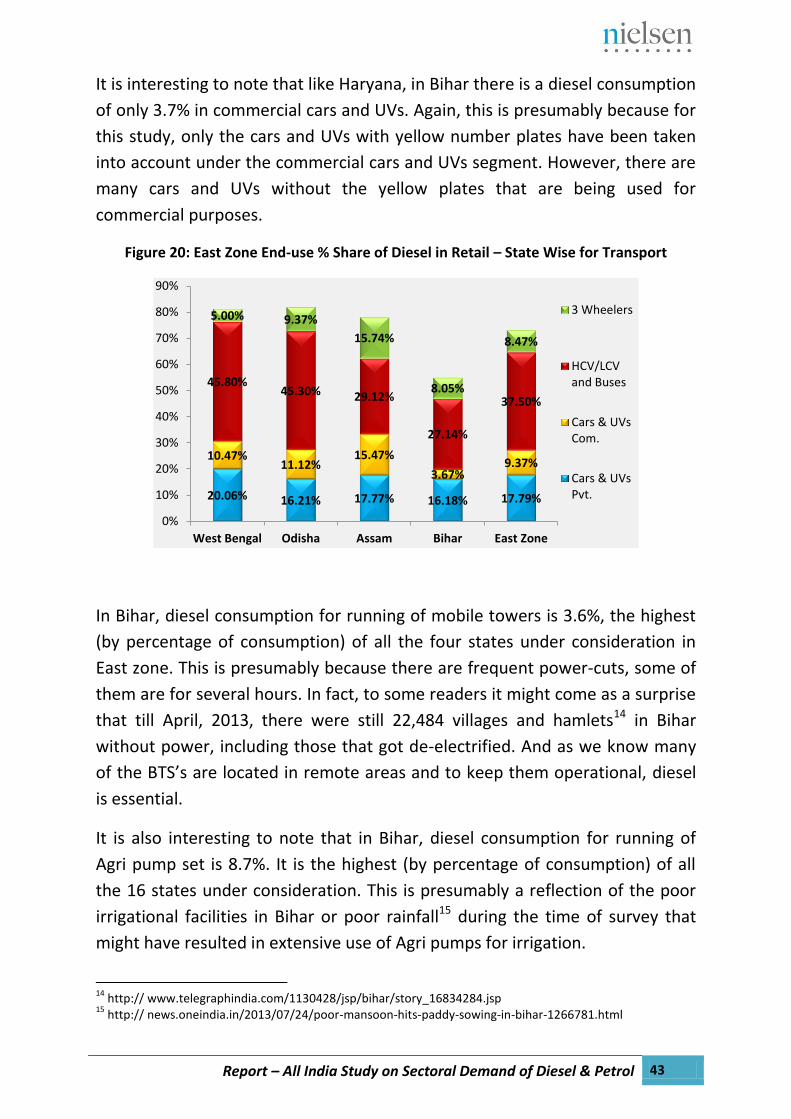
Report – All India Study on Sectoral Demand of Diesel & Petrol 43
It is interesting to note that like Haryana, in Bihar there is a diesel consumption
of only 3.7% in commercial cars and UVs. Again, this is presumably because for
this study, only the cars and UVs with yellow number plates have been taken
into account under the commercial cars and UVs segment. However, there are
many cars and UVs without the yellow plates that are being used for
commercial purposes.
Figure 20: East Zone End-use % Share of Diesel in Retail – State Wise for Transport
In Bihar, diesel consumption for running of mobile towers is 3.6%, the highest
(by percentage of consumption) of all the four states under consideration in
East zone. This is presumably because there are frequent power-cuts, some of
them are for several hours. In fact, to some readers it might come as a surprise
that till April, 2013, there were still 22,484 villages and hamlets14 in Bihar
without power, including those that got de-electrified. And as we know many
of the BTS’s are located in remote areas and to keep them operational, diesel
is essential.
It is also interesting to note that in Bihar, diesel consumption for running of
Agri pump set is 8.7%. It is the highest (by percentage of consumption) of all
the 16 states under consideration. This is presumably a reflection of the poor
irrigational facilities in Bihar or poor rainfall15 during the time of survey that
might have resulted in extensive use of Agri pumps for irrigation.
14
http:// www.telegraphindia.com/1130428/jsp/bihar/story_16834284.jsp 15
http:// news.oneindia.in/2013/07/24/poor-mansoon-hits-paddy-sowing-in-bihar-1266781.html
20.06% 16.21% 17.77% 16.18% 17.79%
10.47% 11.12%
15.47%
3.67% 9.37%
45.80% 45.30% 29.12%
27.14%
37.50%
5.00% 9.37%
15.74%
8.05%
8.47%
0%
10%
20%
30%
40%
50%
60%
70%
80%
90%
West Bengal Odisha Assam Bihar East Zone
3 Wheelers
HCV/LCVand Buses
Cars & UVsCom.
Cars & UVsPvt.

Report – All India Study on Sectoral Demand of Diesel & Petrol 44
Figure 21: East Zone End-use % Share of Diesel in Retail – State Wise for Non-Transport
The state of Odisha leads in East zone in the consumption of petrol by 2-
wheelers at 82.28%, whereas West Bengal leads in consumption of diesel in
cars at 44.42%. This is presumably because West Bengal is more urban than
Odisha and has one of the metropolitan cities (Kolkata) of India as its capital.
Figure 22: Petrol-Retail Consumption Break-up (East Zone) – State Wise
3.72% 4.84% 3.75%
14.15%
7.04% 2.18% 0.69% 2.57%
3.28%
2.28% 2.87% 0.61%
3.89%
8.71%
4.33% 3.65%
1.68%
4.87%
1.51%
2.82% 2.97%
0.61%
1.36%
1.19%
1.72% 2.17%
1.13%
3.32%
3.59%
2.57% 1.11%
8.45%
2.14%
12.53%
6.11%
0%
10%
20%
30%
40%
50%
West Bengal Odisha Assam Bihar East Zone
Others
Mobile Tower
Industry -OtherPurpose
Industry -Genset
Agri Pumpset
AgriImplements
Tractors
0%
10%
20%
30%
40%
50%
60%
70%
80%
90%
West Bengal Orissa Assam Bihar East Zone
44.42%
11.66%
36.24%
18.24%
27.39%
4.48% 2.55% 2.84% 0.85% 2.79%
45.40%
82.28%
42.61%
75.18%
61.66%
4.67% 0.89%
16.02%
5.41% 6.48% 1.03% 2.62% 2.29% 0.32% 1.69%
Cars UVs 2-Wheelers 3-Wheelers Others

Report – All India Study on Sectoral Demand of Diesel & Petrol 45
iii. West Zone’s break up in consumption of Diesel and Petrol - Exclusively
Retail
In the Transport sector of West zone, diesel consumption is maximum in
HCV/LCV (40.4%) followed by Private Cars and UVs (14.4%). In the Non-
Transport sector, diesel consumption is the maximum in tractors (4.3%). In the
West zone, only 12.3% of the diesel consumption is there in Non-Transport
sector, excluding diesel consumption in tractor. Whereas, for North, East and
South zone the diesel consumption in Non-Transport sector (excluding diesel
consumption in tractor) is 24.4%, 19.9% and 18.7% respectively.
Figure 23: West Zone End-use Share (%) of Diesel in Retail – Final
In the West zone, share of diesel consumption in the transportation segment
is maximum in the state of Maharashtra (87.21%) and least in the state of
Madhya Pradesh (67.96%).
Figure 24: West Zone End-use % Share of Diesel in Retail – State Wise
85.47%
67.96%
87.21% 83.39%
14.53% 32.04% 12.79% 16.61%
0%
10%
20%
30%
40%
50%
60%
70%
80%
90%
100%
Gujarat Madhya Pradesh Maharashtra West Zone
NonTransport
Transport

Report – All India Study on Sectoral Demand of Diesel & Petrol 46
Both Gujarat and Maharashtra have a very high diesel consumption in
HCV/LCV and Buses, as both states have very large commercial hubs wherein
various industries like automobile, chemical, textiles etc. are positioned.
Moreover, both these states are the most industrialized states in the country,
so the high consumption of diesel by HCV/LCV is expected in these states. Both
these states are amongst the top 5 contributing states to the GDP of India.16
Figure 25: West Zone End-use % Share of Diesel in Retail – State Wise for Transport
It is interesting to note that in contrast to Gujarat and Maharashtra, for
Madhya Pradesh diesel consumption for running of agri pump set is 6.2%.
However, this again, presumably is a reflection of the poor irrigational facilities
in Madhya Pradesh or due to the fact the Madhya Pradesh is more agriculture
dependent than Maharashtra and Gujarat.17
Another interesting point worth noting is the similarity in the composition of
diesel consumption in the states of Gujarat and Maharashtra. It is presumably
due to similar geographical location and like type of industries in these states
or both.
16
http:// en.wikipedia.org/wiki/List_of_Indian_states_by_GDP 17
Directorate of Economics and Statistics, Department of Agriculture and Cooperation, Ministry of Agriculture, Government of India
15.65% 13.93% 13.10% 14.40%
11.11% 12.93% 10.53% 11.17%
47.04%
32.76%
53.64% 47.35%
11.68%
8.34%
9.94% 10.48%
0%
10%
20%
30%
40%
50%
60%
70%
80%
90%
Gujarat Madhya Pradesh Maharashtra West Zone
3 Wheelers
HCV/LCV &Buses
Cars & UVsCom.
Cars & UVsPvt.

Report – All India Study on Sectoral Demand of Diesel & Petrol 47
Figure 26: West Zone End-use % Share of Diesel in Retail – State Wise for Non-Transport
The state of Madhya Pradesh leads in West zone in consumption of petrol by
2-wheelers at 69.28%, whereas the state of Maharashtra leads in consumption
of diesel in cars at 38.43%.
It is interesting to note that in Gujarat, consumption of petrol by volume in UVs
is only 0.1%, the lowest (by percentage consumption of petrol) of all the 16
states under consideration. This is presumably because, people in Gujarat are
now going for UVs that run on diesel.
Figure 27: Petrol-Retail Consumption Break-up (West Zone) – State Wise
2.96%
11.85%
2.73% 4.27% 2.40%
2.72%
0.91% 1.88% 1.22%
6.23%
1.88%
2.26% 1.61%
3.63%
2.26%
2.18% 0.92%
0.81%
1.11%
0.98% 0.97%
1.63%
1.95%
1.45% 4.44%
5.17%
1.95%
3.59%
0%
5%
10%
15%
20%
25%
30%
35%
40%
Gujarat Madhya Pradesh Maharashtra West Zone
Others
Mobile Tower
Industry -Other Purpose
Industry -Genset
Agri Pumpset
AgriImplements
Tractors
0%
10%
20%
30%
40%
50%
60%
70%
Gujarat Madhya Pradesh Maharashtra West Zone
34.92%
24.64%
38.33% 34.72%
0.05% 1.66% 2.30% 0.43%
64.45% 69.28%
55.94%
63.70%
0.58% 4.16% 3.10% 1.10%
0.01% 0.26% 0.32% 0.06%
Cars UVs 2-Wheelers 3-Wheelers Others

Report – All India Study on Sectoral Demand of Diesel & Petrol 48
iv. South Zone’s break up in consumption of Diesel and Petrol - Exclusively
Retail
In the Transport sector of South zone, diesel consumption is maximum in
HCV/LCV at 30.0%, followed by Private Cars and UVs at 17.1%. In the Non-
Transport sector, diesel consumption is the maximum in Industry genset
(5.6%). Diesel consumption in Buses is significantly higher in the South zone
(11.6%), followed by East Zone (10.7%). It is presumably because South India
has a better road infrastructure and many of the privately owned buses not
only run intra state bus also interstate.
Figure 28: South Zone End-use Share (%) of Diesel in Retail – Final
In the South zone, share of diesel consumption in transport is maximum in the
state of Tamil Nadu (77.64%) and least in the state of Andhra Pradesh
(73.86%).
Figure 29: South Zone End-use % Share of Diesel in Retail – State Wise
73.86% 76.06% 76.43% 77.64% 76.34%
26.14% 23.94% 23.57% 22.36% 23.66%
0%
10%
20%
30%
40%
50%
60%
70%
80%
90%
100%
AndhraPradesh
Kerala Karnataka Tamil Nadu South Zone
NonTransport
Transport

Report – All India Study on Sectoral Demand of Diesel & Petrol 49
Unlike other zones, all the four states under South zone have a very similar
diesel consumption pattern in Transport sector.
Figure 30: South Zone End-use % Share of Diesel in Retail – State Wise for Transport
Again, like Transport sector all the four states under South Zone have a very
similar diesel consumption pattern in the overall Non-Transport sector.
Figure 31: South Zone End-use % Share of Diesel in Retail – State Wise for Non-Transport
16.99% 16.22% 18.62% 16.71% 17.13%
7.16% 8.26% 9.87% 11.81% 9.96%
42.24% 41.94% 42.02% 40.99% 41.60%
7.47% 9.63% 5.92% 8.12% 7.65%
0%
10%
20%
30%
40%
50%
60%
70%
80%
90%
AndhraPradesh
Kerala Karnataka Tamil Nadu South Zone
3 Wheelers
HCV/LCV &Buses
Cars & UVsCom.
Cars & UVsPvt.
6.70% 3.76% 4.98% 4.48% 5.03%
1.96%
2.15%
3.88%
1.69% 2.26%
2.56%
1.43%
2.16%
1.72% 1.98%
5.59%
5.57%
4.49%
6.08% 5.58%
3.09%
2.14%
2.03% 2.36%
2.44%
1.09%
1.24%
1.57% 1.95%
1.60%
5.17%
7.65% 4.47%
4.07% 4.77%
0%
5%
10%
15%
20%
25%
30%
AndhraPradesh
Kerala Karnataka Tamil Nadu South Zone
Others
Mobile Tower
Industry -Other Purpose
Industry -Genset
Agri Pumpset
AgriImplements
Tractors

Report – All India Study on Sectoral Demand of Diesel & Petrol 50
Figure 32: Petrol-Retail Consumption Break-up (South Zone) – State Wise
The state of Andhra Pradesh leads in South zone in consumption of petrol by 2-
wheelers at 65.19%, whereas Karnataka leads in consumption of petrol in cars
at 29.24%.
Tamil Nadu followed by Kerala has the highest percentage consumption of
petrol in 3-wheelers at 8.2% and 7.9% respectively. This maybe due to very few
CNG/ Auto LPG stations in these states.
0%
10%
20%
30%
40%
50%
60%
70%
AndhraPradesh
Kerala Karnataka Tamil Nadu South Zone
26.04% 27.36% 29.24% 27.90% 27.71%
3.26% 2.62% 4.73% 4.01% 3.77%
65.19%
60.33% 59.81% 58.77% 60.76%
4.33% 7.93%
5.15% 8.25% 6.53%
1.17% 1.77% 1.07% 1.07% 1.22%
Cars UVs 2-Wheelers 3-Wheelers Others

Report – All India Study on Sectoral Demand of Diesel & Petrol 51
8.0 Survey Findings under different time periods – Retail Sales
July - September of 2012
All India
For the period July-September 2012, North zone has the highest share of diesel
consumption in non-transport sector and South zone has the highest
consumption of diesel in the transport sector.
Figure 33: Diesel Consumption Break up Amongst the Transport & Non-Transport Sector
At an all India level, for the period July-September 2012, the diesel
consumption in the transport sector is the highest in the HCV/LCV and Buses
category at 41.17%, followed by private cars and UVs at 14.73%.
Table 6: Diesel Consumption Break up Amongst Transport Sector Categories
July - September
of 2012
Diesel Transport
Cars & UVs
Private
Cars & UVs
Commercial
HCV/LCV &
Buses
3 Wheelers-
Passenger/Goods
North Zone 12.67% 9.69% 36.97% 3.93%
South Zone 14.14% 11.14% 43.31% 7.62%
East Zone 16.84% 10.61% 38.15% 9.35%
West Zone 18.31% 8.43% 46.10% 7.04%
All India 14.73% 10.11% 41.17% 6.52%
63.26%
81.98% 80.11% 71.93% 73.50%
36.74% 18.02% 19.89% 28.07% 26.50%
0%
10%
20%
30%
40%
50%
60%
70%
80%
90%
100%
North Zone South Zone East Zone West Zone All India
NonTransport
Transport

Report – All India Study on Sectoral Demand of Diesel & Petrol 52
At an all India level, for the period July-September 2012, diesel consumption in
the non-transport sector is the highest in the tractors category at 6.09%,
followed by industry gensets at 4.46%. This is presumably because July is the
last month of the Kharif season for sowing of Kharif crops and September is the
first month for harvesting of crops sowed during Kharif season.
Table 7: Diesel Consumption Break up Amongst Non-Transport Sector Categories
July -
September
of 2012
Diesel Non-Transport
Tractors Agri
Implements
Agri
Pumpset
Industry
- Genset
Industry
- Other
Purpose
Mobile
Tower
Others
(Genset
for non-
industry
purposes)
& Others
North Zone 8.45% 4.75% 5.85% 7.91% 3.71% 2.28% 3.80%
South Zone 4.19% 2.74% 2.22% 2.32% 1.00% 1.58% 3.97%
East Zone 4.40% 2.51% 2.35% 3.64% 1.84% 1.29% 3.86%
West Zone 6.53% 2.63% 5.53% 2.00% 1.54% 3.29% 6.55%
All India 6.09% 3.39% 4.04% 4.46% 2.18% 2.05% 4.30%
For the period July-September 2012, the petrol consumption for 2- wheelers is
highest in the South zone at 63.32%, followed by West and East zones.
Figure 34: Petrol Consumption Break up Amongst the Sector Categories
0%
10%
20%
30%
40%
50%
60%
70%
North Zone South Zone East Zone West Zone All India
38.78% 34.36%
28.80% 25.70%
33.99%
4.43% 0.53%
4.94% 3.23% 1.75%
54.21%
63.32%
56.60% 60.04% 61.00%
2.01% 1.65% 8.27% 8.17%
2.76%
0.57% 0.14% 1.39% 2.85% 0.51%
Cars UVs 2-Wheelers 3-Wheelers Others
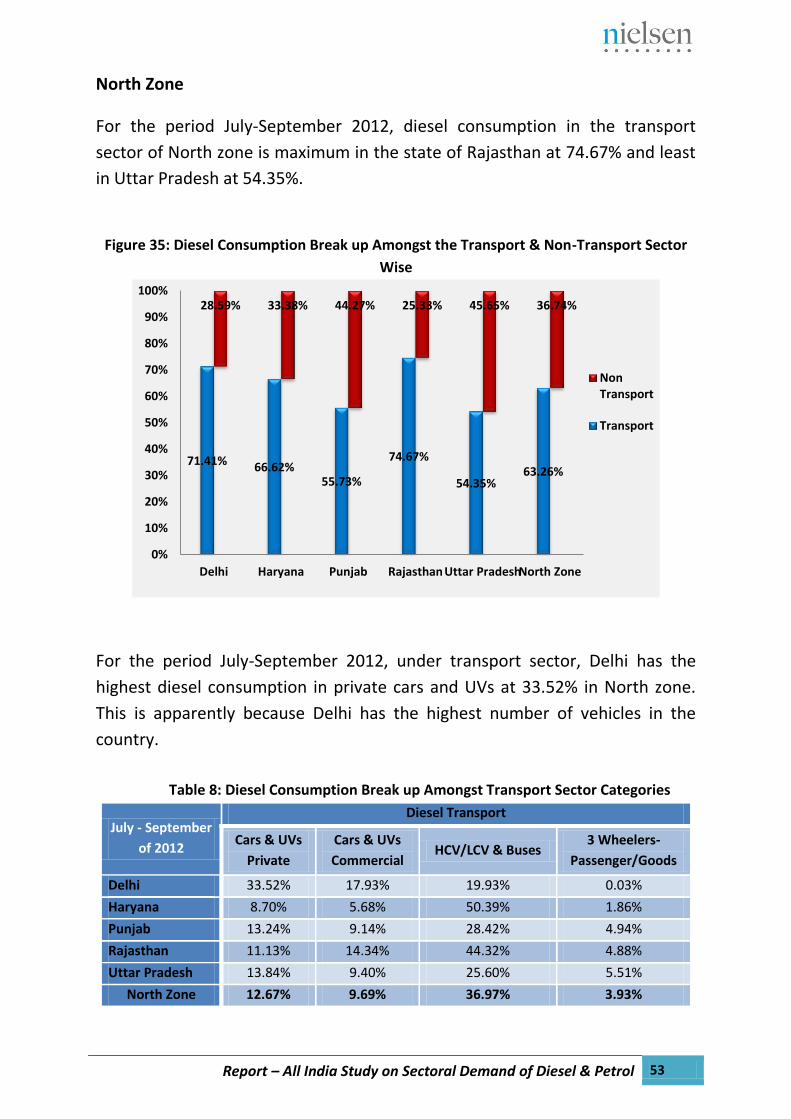
Report – All India Study on Sectoral Demand of Diesel & Petrol 53
North Zone
For the period July-September 2012, diesel consumption in the transport
sector of North zone is maximum in the state of Rajasthan at 74.67% and least
in Uttar Pradesh at 54.35%.
Figure 35: Diesel Consumption Break up Amongst the Transport & Non-Transport Sector
Wise
For the period July-September 2012, under transport sector, Delhi has the
highest diesel consumption in private cars and UVs at 33.52% in North zone.
This is apparently because Delhi has the highest number of vehicles in the
country.
Table 8: Diesel Consumption Break up Amongst Transport Sector Categories
July - September
of 2012
Diesel Transport
Cars & UVs
Private
Cars & UVs
Commercial HCV/LCV & Buses
3 Wheelers-
Passenger/Goods
Delhi 33.52% 17.93% 19.93% 0.03%
Haryana 8.70% 5.68% 50.39% 1.86%
Punjab 13.24% 9.14% 28.42% 4.94%
Rajasthan 11.13% 14.34% 44.32% 4.88%
Uttar Pradesh 13.84% 9.40% 25.60% 5.51%
North Zone 12.67% 9.69% 36.97% 3.93%
71.41% 66.62% 55.73%
74.67%
54.35% 63.26%
28.59% 33.38% 44.27% 25.33% 45.65% 36.74%
0%
10%
20%
30%
40%
50%
60%
70%
80%
90%
100%
Delhi Haryana Punjab Rajasthan Uttar PradeshNorth Zone
NonTransport
Transport

Report – All India Study on Sectoral Demand of Diesel & Petrol 54
For the period July-September 2012, under non-transport sector, Punjab has
the highest diesel consumption in tractors at 13.35% in North zone. It is
presumably because Punjab is one of the foremost states in agricultural
production not only in North zone but also in the entire country. Punjab
contributes 13-14 per cent towards the total food grain production of the
country.18
Table 9: Diesel Consumption Break up Amongst Non-Transport Sector Categories
July -
September of
2012
Diesel Non-Transport
Tractors Agri
Implements
Agri
Pumpset
Industry
-
Genset
Industry
- Other
Purpose
Mobile
Tower
Others (Genset-
non-industry
purposes) &
Others
Delhi 0.93% 0.00% 0.34% 10.53% 11.08% 0.03% 5.68%
Haryana 7.12% 6.67% 5.38% 8.60% 2.49% 0.39% 2.72%
Punjab 13.35% 6.78% 6.75% 7.61% 3.94% 3.08% 2.77%
Rajasthan 10.02% 3.60% 3.69% 3.93% 1.40% 1.40% 1.29%
Uttar Pradesh 8.18% 3.73% 8.18% 9.44% 5.04% 4.64% 6.44%
North Zone 8.45% 4.75% 5.85% 7.91% 3.71% 2.28% 3.80%
For the period July-September 2012, the state of Rajasthan leads in North zone
in consumption of Petrol by 2 wheelers at 72.08%, whereas Delhi leads in
consumption of MS in cars at 55.85%.
Figure 36: Petrol Consumption Break up Amongst the Sector Categories Sector Wise
18
Agro--Economic Research Centre, Department of Economics and Sociology, Punjab Agricultural University
0%
10%
20%
30%
40%
50%
60%
70%
80%
Delhi Haryana Punjab Rajasthan UttarPradesh
North Zone
55.85% 53.19% 54.93%
16.93%
30.58%
38.78%
1.31% 0.40% 0.53%
7.08% 7.08% 4.43%
42.79% 46.22%
42.56%
72.08%
58.12% 54.21%
0.06% 0.19% 1.99% 3.55% 2.99% 2.01% 0.38% 1.24% 0.57%
Cars UVs 2-Wheelers 3-Wheelers Others

Report – All India Study on Sectoral Demand of Diesel & Petrol 55
East Zone
For the period July-September 2012, diesel consumption in the transport
sector of East zone is maximum in the state of West Bengal and least in Bihar.
Figure 37: Diesel Consumption Break up Amongst the Transport & Non-Transport Sector
For the period July-September 2012, under transport sector, Orissa (19.34%)
and West Bengal (19.31%) have the highest diesel consumption in private cars
and UVs in East zone.
Table 10: Diesel Consumption Break up Amongst Transport Sector Categories
July - September
of 2012
Diesel Transport
Cars & UVs
Private
Cars & UVs
Commercial
HCV/LCV &
Buses
3 Wheelers-
Passenger/Goods
West Bengal 19.31% 8.79% 48.79% 5.24%
Orissa 19.34% 9.81% 44.43% 5.87%
Assam 19.04% 14.60% 29.18% 14.22%
Bihar 16.12% 3.83% 26.94% 5.98%
East Zone 18.31% 8.43% 38.15% 7.04%
82.13% 79.44% 77.05%
52.87%
71.93%
17.87% 20.56% 22.95% 47.13% 28.07%
0%
10%
20%
30%
40%
50%
60%
70%
80%
90%
100%
West Bengal Orissa Assam Bihar East Zone
NonTransport
Transport

Report – All India Study on Sectoral Demand of Diesel & Petrol 56
For the period July-September 2012, under non-transport sector, Bihar has the
highest diesel consumption in tractors at 12.9% in East zone.
Table 11: Diesel Consumption Break up Amongst Non-Transport Sector Categories
July -
September
of 2012
Diesel Non-Transport
Tractors Agri
Implements
Agri
Pumpset
Industry
-
Genset
Industry
- Other
Purpose
Mobile
Tower
Others
(Genset
for non-
industry
purposes)
& Others
West
Bengal
2.63% 2.73% 2.87% 2.33% 2.70% 2.95% 1.66%
Orissa 4.09% 0.94% 0.94% 1.39% 1.24% 0.94% 10.99%
Assam 5.79% 2.91% 3.32% 3.59% 1.54% 3.46% 2.35%
Bihar 12.90% 3.45% 12.66% 1.15% 0.42% 5.10% 11.45%
East Zone 6.53% 2.63% 5.53% 2.00% 1.54% 3.29% 6.55%
For the period July-September 2012, the state of Orissa leads in East zone in
consumption of petrol by 2 wheelers, whereas West Bengal leads in
consumption of petrol in cars.
Figure 38: Petrol Consumption Break up Amongst the Sector Categories
0%
10%
20%
30%
40%
50%
60%
70%
80%
West Bengal Orissa Assam Bihar East Zone
42.01%
10.24%
34.36%
16.83%
25.70%
4.17% 4.22% 2.89% 0.93% 3.23%
45.81%
79.00%
39.60%
75.89%
60.04%
6.87%
0.51%
20.10%
6.27% 8.17%
1.13% 6.03%
3.05% 0.08%
2.85%
Cars UVs 2-Wheelers 3-Wheelers Others
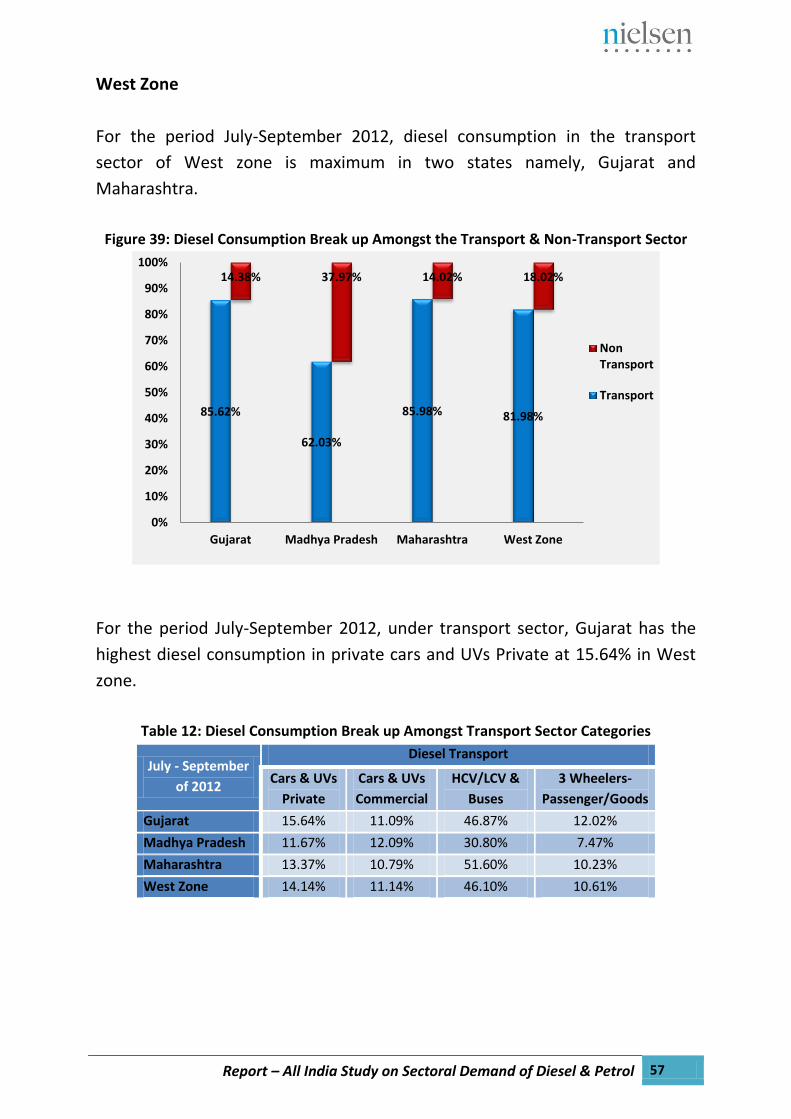
Report – All India Study on Sectoral Demand of Diesel & Petrol 57
West Zone
For the period July-September 2012, diesel consumption in the transport
sector of West zone is maximum in two states namely, Gujarat and
Maharashtra.
Figure 39: Diesel Consumption Break up Amongst the Transport & Non-Transport Sector
For the period July-September 2012, under transport sector, Gujarat has the
highest diesel consumption in private cars and UVs Private at 15.64% in West
zone.
Table 12: Diesel Consumption Break up Amongst Transport Sector Categories
July - September
of 2012
Diesel Transport
Cars & UVs
Private
Cars & UVs
Commercial
HCV/LCV &
Buses
3 Wheelers-
Passenger/Goods
Gujarat 15.64% 11.09% 46.87% 12.02%
Madhya Pradesh 11.67% 12.09% 30.80% 7.47%
Maharashtra 13.37% 10.79% 51.60% 10.23%
West Zone 14.14% 11.14% 46.10% 10.61%
85.62%
62.03%
85.98% 81.98%
14.38% 37.97% 14.02% 18.02%
0%
10%
20%
30%
40%
50%
60%
70%
80%
90%
100%
Gujarat Madhya Pradesh Maharashtra West Zone
NonTransport
Transport

Report – All India Study on Sectoral Demand of Diesel & Petrol 58
For the period July-September 2012, under non-transport sector, Madhya
Pradesh has the highest diesel consumption in tractors at 12.17% in West
zone.
Table 13: Diesel Consumption Break up Amongst Non-Transport Sector Categories
July -
September of
2012
Diesel Non-Transport
Tractors Agri
Implements
Agri
Pumpset
Industry
-
Genset
Industry
- Other
Purpose
Mobile
Tower
Others
(Genset
for non-
industry
purposes)
& Others
Gujarat 2.92% 3.52% 0.72% 1.23% 0.82% 0.97% 4.20%
Madhya
Pradesh
12.17% 4.28% 7.89% 4.17% 0.96% 1.86% 6.63%
Maharashtra 2.36% 1.15% 1.64% 2.87% 1.24% 2.20% 2.57%
West Zone 4.19% 2.74% 2.22% 2.32% 1.00% 1.58% 3.97%
For the period July-September 2012, the state of Madhya Pradesh leads in
West zone in consumption of petrol by 2 wheelers whereas Maharashtra leads
in consumption of petrol in cars.
Figure 40: Petrol Consumption Break up Amongst the Sector Categories
0%
10%
20%
30%
40%
50%
60%
70%
Gujarat Madhya Pradesh Maharashtra West Zone
34.62%
22.56%
37.70% 34.36%
0.07% 2.83% 3.78%
0.53%
64.21% 66.82%
53.02%
63.32%
1.09%
6.96% 4.49%
1.65% 0.01% 0.82% 1.00% 0.14%
Cars UVs 2-Wheelers 3-Wheelers Others
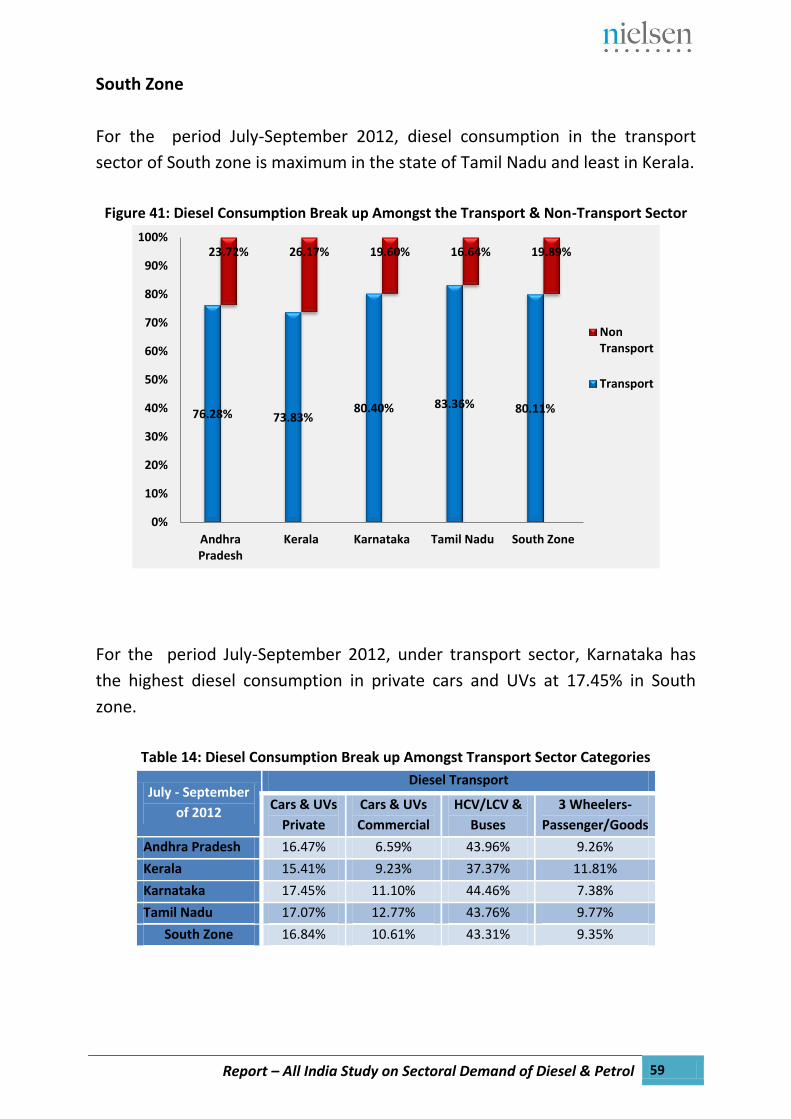
Report – All India Study on Sectoral Demand of Diesel & Petrol 59
South Zone
For the period July-September 2012, diesel consumption in the transport
sector of South zone is maximum in the state of Tamil Nadu and least in Kerala.
Figure 41: Diesel Consumption Break up Amongst the Transport & Non-Transport Sector
For the period July-September 2012, under transport sector, Karnataka has
the highest diesel consumption in private cars and UVs at 17.45% in South
zone.
Table 14: Diesel Consumption Break up Amongst Transport Sector Categories
July - September
of 2012
Diesel Transport
Cars & UVs
Private
Cars & UVs
Commercial
HCV/LCV &
Buses
3 Wheelers-
Passenger/Goods
Andhra Pradesh 16.47% 6.59% 43.96% 9.26%
Kerala 15.41% 9.23% 37.37% 11.81%
Karnataka 17.45% 11.10% 44.46% 7.38%
Tamil Nadu 17.07% 12.77% 43.76% 9.77%
South Zone 16.84% 10.61% 43.31% 9.35%
76.28% 73.83% 80.40% 83.36% 80.11%
23.72% 26.17% 19.60% 16.64% 19.89%
0%
10%
20%
30%
40%
50%
60%
70%
80%
90%
100%
AndhraPradesh
Kerala Karnataka Tamil Nadu South Zone
NonTransport
Transport
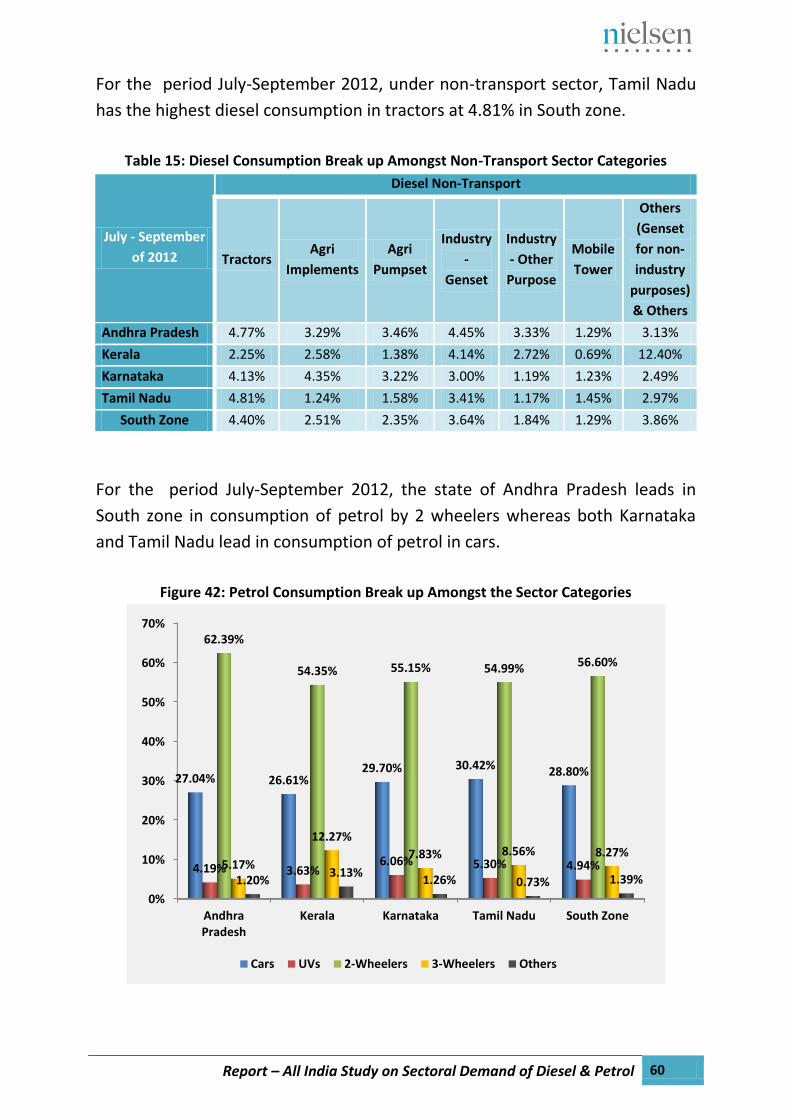
Report – All India Study on Sectoral Demand of Diesel & Petrol 60
For the period July-September 2012, under non-transport sector, Tamil Nadu
has the highest diesel consumption in tractors at 4.81% in South zone.
Table 15: Diesel Consumption Break up Amongst Non-Transport Sector Categories
July - September
of 2012
Diesel Non-Transport
Tractors Agri
Implements
Agri
Pumpset
Industry
-
Genset
Industry
- Other
Purpose
Mobile
Tower
Others
(Genset
for non-
industry
purposes)
& Others
Andhra Pradesh 4.77% 3.29% 3.46% 4.45% 3.33% 1.29% 3.13%
Kerala 2.25% 2.58% 1.38% 4.14% 2.72% 0.69% 12.40%
Karnataka 4.13% 4.35% 3.22% 3.00% 1.19% 1.23% 2.49%
Tamil Nadu 4.81% 1.24% 1.58% 3.41% 1.17% 1.45% 2.97%
South Zone 4.40% 2.51% 2.35% 3.64% 1.84% 1.29% 3.86%
For the period July-September 2012, the state of Andhra Pradesh leads in
South zone in consumption of petrol by 2 wheelers whereas both Karnataka
and Tamil Nadu lead in consumption of petrol in cars.
Figure 42: Petrol Consumption Break up Amongst the Sector Categories
0%
10%
20%
30%
40%
50%
60%
70%
AndhraPradesh
Kerala Karnataka Tamil Nadu South Zone
27.04% 26.61% 29.70% 30.42% 28.80%
4.19% 3.63% 6.06% 5.30% 4.94%
62.39%
54.35% 55.15% 54.99% 56.60%
5.17%
12.27%
7.83% 8.56% 8.27%
1.20% 3.13%
1.26% 0.73% 1.39%
Cars UVs 2-Wheelers 3-Wheelers Others

Report – All India Study on Sectoral Demand of Diesel & Petrol 61
October - December of 2012
This is the period just after the increase of Rs. 5 per litre in diesel made in
September, 2012
The diesel consumption for private and commercial cars and UVs taken
together is highest for the period October-December 2012, of all the three
periods under purview. This is probably because autumn and winter break for
many schools and colleges fall in the months of October and December and
during these holidays people plan for outings or vacations.
All India
For the period October-December 2012, North zone has the highest share of
diesel consumption in non-transport sector and West zone has the highest
consumption of diesel in the transport sector.
Figure 43: Diesel Consumption Break up Amongst the Transport & Non-Transport Sector
At an all India level, for the period October-December 2012, the diesel
consumption in the transport sector is the highest in the HCV/LCV category
and Buses category at 40.58% followed by private cars and UVs at 15.74%.
63.95% 76.58% 75.24%
83.65% 74.17%
36.05% 23.42% 24.76% 16.35% 25.83%
0%
10%
20%
30%
40%
50%
60%
70%
80%
90%
100%
North Zone South Zone East Zone West Zone All India
NonTransport
Transport

Report – All India Study on Sectoral Demand of Diesel & Petrol 62
Table 16: Diesel Consumption Break up Amongst Transport Sector Categories
October -
December of
2012
Diesel Transport
Cars & UVs
Private
Cars & UVs
Commercial
HCV/LCV &
Buses
3 Wheelers-
Passenger/Goods
North Zone 14.25% 10.38% 35.67% 3.64%
South Zone 18.51% 10.17% 40.64% 7.26%
East Zone 18.65% 9.23% 38.48% 8.89%
West Zone 14.48% 11.45% 47.01% 10.72%
All India 15.74% 10.50% 40.58% 7.35%
At an all India level, for the period October-December 2012, the diesel
consumption in the non-transport sector is the highest in the tractors category
at 8.05%. This is probably because October to December is the period for
sowing of Rabi crops.
Table 17: Diesel Consumption Break up Amongst Non-Transport Sector Categories
October -
December
of 2012
Diesel Non-Transport
Tractors Agri
Implements
Agri
Pumpset
Industry
- Genset
Industry -
Other Purpose
Mobile
Tower Others
North Zone 13.07% 4.62% 4.48% 5.82% 3.20% 1.51% 3.35%
South Zone 5.14% 1.30% 3.16% 5.02% 2.50% 1.47% 4.83%
East Zone 6.42% 1.70% 4.81% 2.15% 1.86% 2.18% 5.65%
West Zone 4.85% 1.77% 2.25% 1.89% 0.74% 1.37% 3.47%
All India 8.05% 2.69% 3.60% 3.84% 2.08% 1.57% 4.00%
For the period October-December 2012, the petrol consumption for 2-
wheelers is highest in the West zone at 64% followed by East and South zone.
Figure 44: Petrol Consumption Break up Amongst the Sector Categories
0%
10%
20%
30%
40%
50%
60%
70%
North Zone South Zone East Zone West Zone All India
40.02%
28.26% 27.69%
34.90% 34.62%
3.26% 3.34% 3.03% 0.33% 1.27%
54.39%
60.77% 61.83% 64.09%
62.05%
2.14% 6.38% 6.41%
0.68% 1.84% 0.20%
1.26% 1.04% 0.00% 0.22%
Cars UVs 2-Wheelers 3-Wheelers Others

Report – All India Study on Sectoral Demand of Diesel & Petrol 63
North Zone
For the period October-December 2012, diesel consumption in the transport
sector of North zone is maximum in the state of Rajasthan and least in Punjab.
Figure 45: Diesel Consumption Break up Amongst the Transport & Non-Transport Sector
For the period October-December 2012, under transport sector, Delhi has the
highest diesel consumption in private cars and UVs at 36.62% in North zone.
Table 18: Diesel Consumption Break up Amongst Transport Sector Categories
October -
December of 2012
Diesel Transport
Cars & UVs
Private
Cars & UVs
Commercial
HCV/LCV &
Buses
3 Wheelers-
Passenger/Goods
Delhi 34.62% 18.04% 17.32% 0.03%
Haryana 7.12% 4.61% 51.64% 1.92%
Punjab 14.58% 10.01% 27.33% 1.12%
Rajasthan 17.82% 16.62% 39.40% 4.12%
Uttar Pradesh 14.95% 10.27% 24.67% 6.41%
North Zone 14.25% 10.38% 35.67% 3.64%
70.01% 65.29%
53.04%
77.96%
56.30% 63.95%
29.99% 34.71% 46.96% 22.04% 43.70% 36.05%
0%
10%
20%
30%
40%
50%
60%
70%
80%
90%
100%
Delhi Haryana Punjab Rajasthan UttarPradesh
North Zone
NonTransport
Transport

Report – All India Study on Sectoral Demand of Diesel & Petrol 64
For the period October-December 2012, under non-transport sector, Punjab
has the highest diesel consumption in tractors at 18.09% in North zone.
Table 19: Diesel Consumption Break up Amongst Non-Transport Sector Categories
October -
December of
2012
Diesel Non-Transport
Tractors Agri
Implements
Agri
Pumpset
Industry
-
Genset
Industry
- Other
Purpose
Mobile
Tower
Others
(Genset
for non-
industry
purposes)
& Others
Delhi 0.83% 0.00% 0.18% 10.79% 6.63% 0.03% 11.53%
Haryana 10.41% 6.98% 2.46% 8.04% 2.66% 0.35% 3.81%
Punjab 18.09% 8.07% 8.12% 5.04% 2.12% 2.19% 3.33%
Rajasthan 12.88% 1.89% 1.18% 2.67% 1.28% 0.58% 1.56%
Uttar Pradesh 15.58% 3.76% 7.87% 5.52% 4.89% 3.18% 2.90%
North Zone 13.07% 4.62% 4.48% 5.82% 3.20% 1.51% 3.35%
For the period October-December 2012, the state of Rajasthan leads in North
zone in consumption of petrol by 2 wheelers, whereas both Delhi and Punjab
lead in consumption of petrol in cars.
Figure 46: Petrol Consumption Break up Amongst the Sector Categories
0%
10%
20%
30%
40%
50%
60%
70%
80%
Delhi Haryana Punjab Rajasthan UttarPradesh
North Zone
57.04% 55.13% 56.78%
17.22%
31.66%
40.02%
1.41% 0.68% 1.41% 6.23%
4.23% 3.26%
41.50% 44.06%
40.24%
74.33%
59.64%
54.39%
0.05% 0.13% 1.57% 2.11% 4.02% 2.14%
0.00% 0.00% 0.00% 0.11% 0.45% 0.20%
Cars UVs 2-Wheelers 3-Wheelers Others

Report – All India Study on Sectoral Demand of Diesel & Petrol 65
East Zone
For the period October-December 2012, diesel consumption in the transport
sector of East zone is maximum in the state of West Bengal and least in Bihar.
Figure 47: Diesel Consumption Break up Amongst the Transport & Non-Transport Sector
For the period October-December 2012, under transport sector, West Bengal
has the highest diesel consumption in private cars and UVs at 22.27% in East
zone.
Table 20: Diesel Consumption Break up Amongst Transport Sector Categories
October -
December of
2012
Diesel Transport
Cars & UVs
Private
Cars & UVs
Commercial
HCV/LCV &
Buses
3 Wheelers-
Passenger/Goods
West Bengal 22.27% 10.02% 46.31% 4.87%
Orissa 13.17% 12.31% 49.10% 9.62%
Assam 18.23% 15.93% 28.66% 16.54%
Bihar 18.26% 2.67% 27.29% 9.11%
East Zone 18.65% 9.23% 38.48% 8.89%
83.47% 84.20% 79.36%
57.33%
75.24%
16.53% 15.80% 20.64% 42.67% 24.76%
0%
10%
20%
30%
40%
50%
60%
70%
80%
90%
100%
West Bengal Orissa Assam Bihar East Zone
NonTransport
Transport

Report – All India Study on Sectoral Demand of Diesel & Petrol 66
For the period October-December 2012, under non-transport sector, Bihar has
the highest diesel consumption in tractors at 13.4% in East zone.
Table 21: Diesel Consumption Break up Amongst Non-Transport Sector Categories
October -
December
of 2012
Diesel Non-Transport
Tractors Agri
Implements
Agri
Pumpset
Industry
-
Genset
Industry
- Other
Purpose
Mobile
Tower
Others
(Genset
for non-
industry
purposes)
& Others
West
Bengal
3.58% 1.31% 3.27% 3.21% 3.26% 1.44% 0.46%
Orissa 5.02% 0.65% 0.57% 1.01% 0.29% 1.13% 7.13%
Assam 1.34% 1.89% 6.04% 4.87% 1.23% 3.28% 1.99%
Bihar 13.40% 2.78% 8.81% 0.21% 1.58% 3.16% 12.73%
East Zone 6.42% 1.70% 4.81% 2.15% 1.86% 2.18% 5.65%
For the period October-December 2012, the state of Orissa leads in East zone
in consumption of petrol by 2-wheelers, whereas West Bengal leads in
consumption of petrol in cars.
Figure 48: Petrol Consumption Break up Amongst the Sector Categories
0%
10%
20%
30%
40%
50%
60%
70%
80%
90%
West Bengal Orissa Assam Bihar East Zone
46.26%
11.11%
36.78%
17.88%
27.69%
5.10% 2.04% 3.91%
0.72% 3.03%
43.45%
84.68%
41.21%
76.11%
61.83%
4.21% 0.99%
16.42%
5.19% 6.41%
0.98% 1.18%
1.68% 0.10% 1.04%
Cars UVs 2-Wheelers 3-Wheelers Others

Report – All India Study on Sectoral Demand of Diesel & Petrol 67
West Zone
For the period October-December 2012, diesel consumption in the transport
sector of West zone is maximum in the state of Maharashtra and least in
Madhya Pradesh.
Figure 49: Diesel Consumption Break up Amongst the Transport & Non-Transport Sector
For the period October-December 2012, under transport sector, Gujarat has
the highest diesel consumption in private cars and UVs at 15.87% in West
zone.
Table 22: Diesel Consumption Break up Amongst Transport Sector Categories
October -
December of 2012
Diesel Transport
Cars & UVs
Private
Cars & UVs
Commercial
HCV/LCV &
Buses
3 Wheelers-
Passenger/Goods
Gujarat 15.87% 11.22% 47.34% 11.93%
Madhya Pradesh 13.01% 15.21% 30.14% 8.11%
Maharashtra 13.44% 10.21% 53.38% 10.35%
West Zone 14.48% 11.45% 47.01% 10.72%
86.36%
66.47%
87.38% 83.65%
13.64% 33.53% 12.62% 16.35%
0%
10%
20%
30%
40%
50%
60%
70%
80%
90%
100%
Gujarat Madhya Pradesh Maharashtra West Zone
NonTransport
Transport

Report – All India Study on Sectoral Demand of Diesel & Petrol 68
For the period October-December 2012, under non-transport sector, Madhya
Pradesh has the highest diesel consumption in tractors at 14.32% in West
zone.
Table 23: Diesel Consumption Break up Amongst Non-Transport Sector Categories
October -
December of
2012
Diesel Non-Transport
Tractors Agri
Implements
Agri
Pumpset
Industry
- Genset
Industry
- Other
Purpose
Mobile
Tower
Others
(Genset
for non-
industry
purposes)
& Others
Gujarat 3.09% 2.31% 1.12% 1.34% 0.65% 1.01% 4.12%
Madhya Pradesh 14.32% 2.31% 6.76% 3.67% 0.33% 1.52% 4.62%
Maharashtra 3.11% 0.92% 1.76% 1.82% 1.02% 1.74% 2.25%
West Zone 4.85% 1.77% 2.25% 1.89% 0.74% 1.37% 3.47%
For the period October-December 2012, the state of Madhya Pradesh leads in
West zone in consumption of petrol by 2-wheelers, whereas Maharashtra
leads in consumption of petrol in cars.
Figure 50: Petrol Consumption Break up Amongst the Sector Categories
0%
10%
20%
30%
40%
50%
60%
70%
Gujarat Madhya Pradesh Maharashtra West Zone
35.06%
25.23%
38.12% 34.90%
0.01% 1.90% 2.67%
0.33%
64.81% 68.23%
55.09%
64.09%
0.12%
4.64% 4.12% 0.68%
0.00% 0.00% 0.00% 0.00%
Cars UVs 2-Wheelers 3-Wheelers Others

Report – All India Study on Sectoral Demand of Diesel & Petrol 69
South Zone
For the period October-December 2012, diesel consumption in the transport
sector of South zone is maximum in two states, namely Kerala and Tamil Nadu
and least in Andhra Pradesh.
Figure 51: Diesel Consumption Break up Amongst the Transport & Non-Transport Sector
For the period October-December 2012, under transport sector, Karnataka has
the highest diesel consumption in private cars and UVs at 20.23% in South
zone.
Table 24: Diesel Consumption Break up Amongst Transport Sector Categories
October -
December of
2012
Diesel Transport
Cars & UVs
Private
Cars & UVs
Commercial
HCV/LCV &
Buses
3 Wheelers-
Passenger/Goods
Andhra Pradesh 18.29% 5.63% 42.78% 6.15%
Kerala 17.11% 7.41% 44.47% 9.13%
Karnataka 20.23% 9.12% 41.51% 5.29%
Tamil Nadu 18.13% 13.59% 38.30% 8.34%
South Zone 18.51% 10.17% 40.64% 7.26%
72.85% 78.12% 76.15% 78.36% 76.58%
27.15% 21.88% 23.85% 21.64% 23.42%
0%
10%
20%
30%
40%
50%
60%
70%
80%
90%
100%
Andhra Pradesh Kerala Karnataka Tamil Nadu South Zone
NonTransport
Transport

Report – All India Study on Sectoral Demand of Diesel & Petrol 70
For the period October-December 2012, under non-transport sector, Andhra
Pradesh has the highest diesel consumption in tractors at 7.09% in South zone.
Table 25: Diesel Consumption Break up Amongst Non-Transport Sector Categories
October -
December of
2012
Diesel Non-Transport
Tractors Agri
Implements
Agri
Pumpset
Industry
-
Genset
Industry
- Other
Purpose
Mobile
Tower
Others
(Genset
for non-
industry
purposes)
& Others
Andhra Pradesh 7.09% 1.48% 4.10% 5.02% 3.15% 0.79% 5.52%
Kerala 4.36% 1.68% 1.49% 5.68% 1.23% 1.21% 6.23%
Karnataka 5.39% 3.10% 2.75% 4.12% 2.11% 1.15% 5.23%
Tamil Nadu 4.20% 0.28% 3.23% 5.29% 2.63% 2.03% 3.98%
South Zone 5.14% 1.30% 3.16% 5.02% 2.50% 1.47% 4.83%
For the period October-December 2012, the state of Andhra Pradesh leads in
South zone in consumption of petrol by 2-wheelers, whereas Karnataka leads
in consumption of petrol in cars.
Figure 52: Petrol Consumption Break up Amongst the Sector Categories
0%
10%
20%
30%
40%
50%
60%
70%
AndhraPradesh
Kerala Karnataka Tamil Nadu South Zone
26.28% 28.59%
31.23% 27.28% 28.26%
2.89% 2.21% 4.06% 3.68% 3.34%
65.22% 61.71%
59.50% 58.33% 60.77%
4.26% 6.41%
4.23%
9.23% 6.38%
1.35% 1.08% 0.98% 1.48% 1.26%
Cars UVs 2-Wheelers 3-Wheelers Others
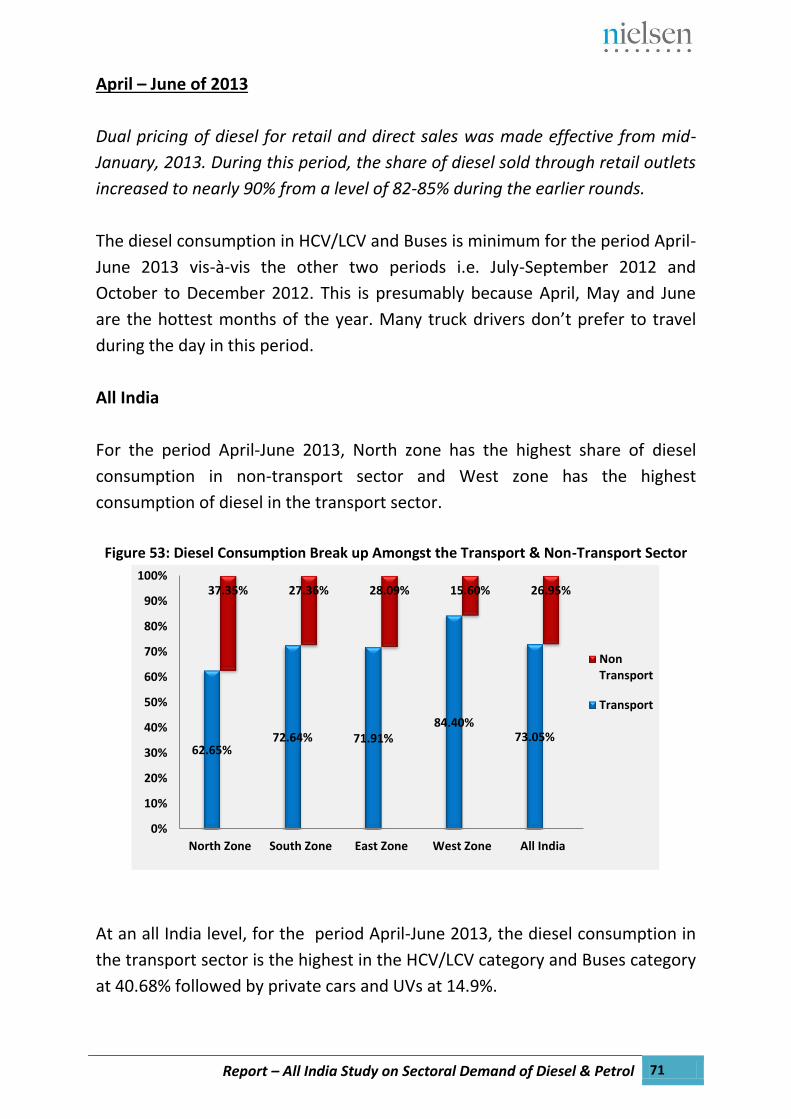
Report – All India Study on Sectoral Demand of Diesel & Petrol 71
April – June of 2013
Dual pricing of diesel for retail and direct sales was made effective from mid-
January, 2013. During this period, the share of diesel sold through retail outlets
increased to nearly 90% from a level of 82-85% during the earlier rounds.
The diesel consumption in HCV/LCV and Buses is minimum for the period April-
June 2013 vis-à-vis the other two periods i.e. July-September 2012 and
October to December 2012. This is presumably because April, May and June
are the hottest months of the year. Many truck drivers don’t prefer to travel
during the day in this period.
All India
For the period April-June 2013, North zone has the highest share of diesel
consumption in non-transport sector and West zone has the highest
consumption of diesel in the transport sector.
Figure 53: Diesel Consumption Break up Amongst the Transport & Non-Transport Sector
At an all India level, for the period April-June 2013, the diesel consumption in
the transport sector is the highest in the HCV/LCV category and Buses category
at 40.68% followed by private cars and UVs at 14.9%.
62.65% 72.64% 71.91%
84.40% 73.05%
37.35% 27.36% 28.09% 15.60% 26.95%
0%
10%
20%
30%
40%
50%
60%
70%
80%
90%
100%
North Zone South Zone East Zone West Zone All India
NonTransport
Transport

Report – All India Study on Sectoral Demand of Diesel & Petrol 72
Table 26: Diesel Consumption Break up Amongst Transport Sector Categories
April – June of 2013
Diesel Transport
Cars & UVs Private Cars & UVs Commercial
HCV/LCV & Buses
3 Wheelers-Passenger/Goods
North Zone 14.20% 9.94% 34.60% 3.91%
South Zone 16.05% 9.16% 40.96% 6.48%
East Zone 16.17% 10.59% 35.61% 9.55%
West Zone 14.55% 10.93% 48.78% 10.14%
All India 14.90% 10.23% 40.68% 7.24%
At an all India level, for the period April-June 2013, the diesel consumption in
the non-transport sector is the highest in the tractors category at8.71%
followed by industry gensets at 4.74%. This is presumably because December
to Jaunuary is the period for harvesting of Zaid Rabi crops, May to July is the
period for sowing of Kharif crops and April is the last month in the harvesting
season of Rabi crop.
Table 27: Diesel Consumption Break up Amongst Non-Transport Sector Categories
April – June of
2013
Diesel Non-Transport
Tractors Agri
Implements Agri
Pumpset Industry - Genset
Industry - Other
Purpose
Mobile Tower
Others (Genset-non-industry
purposes) & Others
North Zone 15.20% 5.88% 3.38% 5.62% 2.65% 1.69% 2.94%
South Zone 5.50% 2.98% 0.49% 7.91% 2.93% 2.00% 5.55%
East Zone 8.37% 2.59% 2.42% 4.55% 1.75% 2.25% 6.17%
West Zone 3.79% 1.21% 2.31% 2.33% 1.18% 1.41% 3.36%
All India 8.71% 3.34% 2.39% 4.74% 2.08% 1.72% 3.97%
For the period April-June 2013, the petrol consumption for 2-wheelers is
highest in both South and West zones at around 64% followed by East and
North zones.
Figure 54: Petrol Consumption Break up Amongst the Sector Categories
0%
10%
20%
30%
40%
50%
60%
70%
North Zone South Zone East Zone West Zone All India
41.66%
26.30% 28.48%
35.41% 34.43%
1.20% 3.17% 2.24% 0.41% 1.53%
55.55%
64.30% 62.80% 63.55% 60.98%
1.38% 5.20% 5.19%
0.63% 2.56% 0.22%
1.03% 1.30% 0.00% 0.50%
Cars UVs 2-Wheelers 3-Wheelers Others
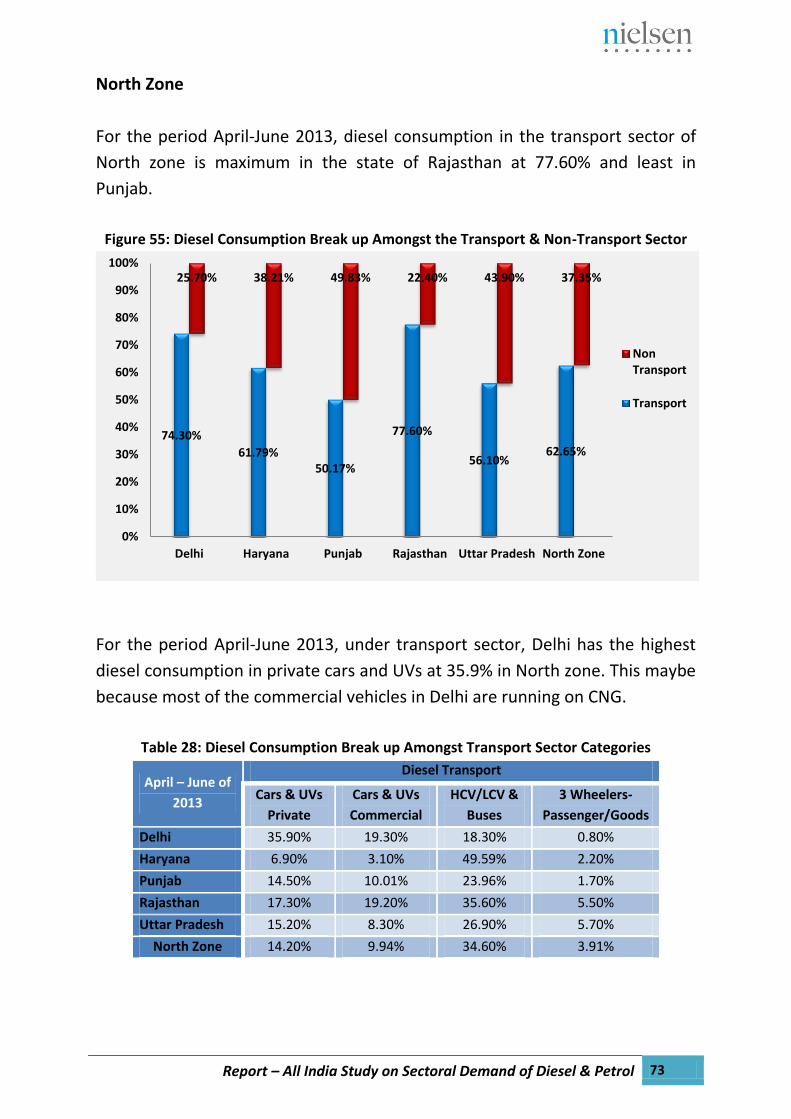
Report – All India Study on Sectoral Demand of Diesel & Petrol 73
North Zone
For the period April-June 2013, diesel consumption in the transport sector of
North zone is maximum in the state of Rajasthan at 77.60% and least in
Punjab.
Figure 55: Diesel Consumption Break up Amongst the Transport & Non-Transport Sector
For the period April-June 2013, under transport sector, Delhi has the highest
diesel consumption in private cars and UVs at 35.9% in North zone. This maybe
because most of the commercial vehicles in Delhi are running on CNG.
Table 28: Diesel Consumption Break up Amongst Transport Sector Categories
April – June of
2013
Diesel Transport
Cars & UVs
Private
Cars & UVs
Commercial
HCV/LCV &
Buses
3 Wheelers-
Passenger/Goods
Delhi 35.90% 19.30% 18.30% 0.80%
Haryana 6.90% 3.10% 49.59% 2.20%
Punjab 14.50% 10.01% 23.96% 1.70%
Rajasthan 17.30% 19.20% 35.60% 5.50%
Uttar Pradesh 15.20% 8.30% 26.90% 5.70%
North Zone 14.20% 9.94% 34.60% 3.91%
74.30%
61.79% 50.17%
77.60%
56.10% 62.65%
25.70% 38.21% 49.83% 22.40% 43.90% 37.35%
0%
10%
20%
30%
40%
50%
60%
70%
80%
90%
100%
Delhi Haryana Punjab Rajasthan Uttar Pradesh North Zone
NonTransport
Transport

Report – All India Study on Sectoral Demand of Diesel & Petrol 74
For the period April-June 2013, under non-transport sector, Punjab has the
highest diesel consumption in tractors at 21.11% in North zone.
Table 29: Diesel Consumption Break up Amongst Non-Transport Sector Categories
April – June of
2013
Diesel Non-Transport
Tractors Agri
Implements
Agri
Pumpset
Industry
- Genset
Industry
- Other
Purpose
Mobile
Tower
Others (Genset-non-
industry purposes)
& Others
Delhi 0.19% 0.00% 0.11% 8.20% 5.00% 0.01% 12.19%
Haryana 13.02% 8.21% 1.98% 8.10% 2.40% 0.56% 3.94%
Punjab 21.11% 10.68% 6.14% 6.10% 1.80% 0.88% 3.12%
Rajasthan 14.06% 2.16% 0.98% 3.10% 1.10% 0.69% 0.31%
Uttar Pradesh 18.04% 5.39% 5.77% 4.50% 3.90% 3.98% 2.32%
North Zone 15.20% 5.88% 3.38% 5.62% 2.65% 1.69% 2.94%
For the period April-June 2013, the state of Rajasthan leads in North zone in
consumption of petrol by 2-wheelers at 75.11, whereas Punjab leads in
consumption of petrol in cars at 58.12%.
Figure 56: Petrol Consumption Break up Amongst the Sector Categories
Considering all the three time periods, Delhi, Haryana and Punjab are the only
states, all belonging to North zone, where the petrol consumption in cars is
more than the petrol consumption in 2 wheelers. This is probably due to the
lower prices of petrol in these states than the rest of the states under
consideration. And also because of people preferring cars that run on petrol
than diesel due to their lower initial costs and lower maintenance costs.
0%
10%
20%
30%
40%
50%
60%
70%
80%
Delhi Haryana Punjab Rajasthan UttarPradesh
North Zone
57.89% 56.09% 58.12%
21.53%
32.94%
41.66%
0.88% 0.70% 0.79% 2.22% 1.20% 1.20%
41.14% 43.11% 39.69%
75.11%
62.76%
55.55%
0.09% 0.10% 1.40% 1.04% 2.60% 1.38%
0.00% 0.00% 0.00% 0.10% 0.50% 0.22%
Cars UVs 2-Wheelers 3-Wheelers Others
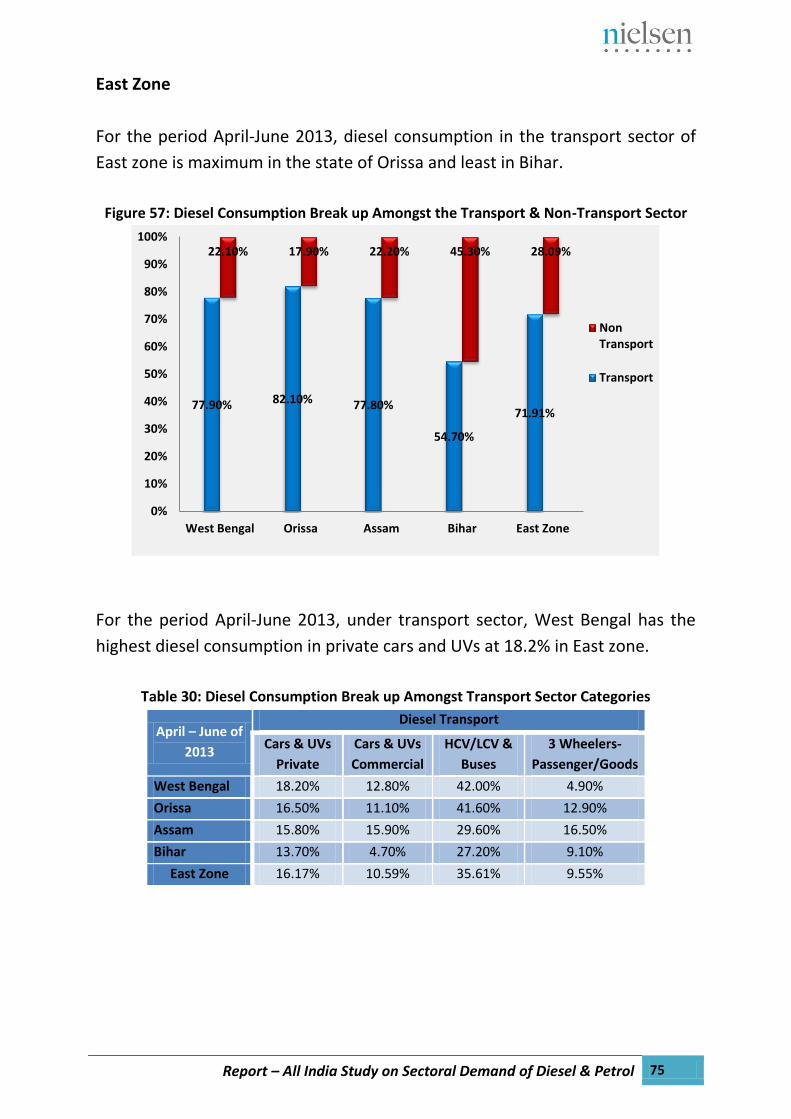
Report – All India Study on Sectoral Demand of Diesel & Petrol 75
East Zone
For the period April-June 2013, diesel consumption in the transport sector of
East zone is maximum in the state of Orissa and least in Bihar.
Figure 57: Diesel Consumption Break up Amongst the Transport & Non-Transport Sector
For the period April-June 2013, under transport sector, West Bengal has the
highest diesel consumption in private cars and UVs at 18.2% in East zone.
Table 30: Diesel Consumption Break up Amongst Transport Sector Categories
April – June of
2013
Diesel Transport
Cars & UVs
Private
Cars & UVs
Commercial
HCV/LCV &
Buses
3 Wheelers-
Passenger/Goods
West Bengal 18.20% 12.80% 42.00% 4.90%
Orissa 16.50% 11.10% 41.60% 12.90%
Assam 15.80% 15.90% 29.60% 16.50%
Bihar 13.70% 4.70% 27.20% 9.10%
East Zone 16.17% 10.59% 35.61% 9.55%
77.90% 82.10% 77.80%
54.70%
71.91%
22.10% 17.90% 22.20% 45.30% 28.09%
0%
10%
20%
30%
40%
50%
60%
70%
80%
90%
100%
West Bengal Orissa Assam Bihar East Zone
NonTransport
Transport

Report – All India Study on Sectoral Demand of Diesel & Petrol 76
For the period April-June 2013, under non-transport sector, Bihar has the
highest diesel consumption in tractors at 16.5% in East zone.
Table 31: Diesel Consumption Break up Amongst Non-Transport Sector Categories
April – June
of 2013
Diesel Non-Transport
Tractors Agri
Implements
Agri
Pumpset
Industry
-
Genset
Industry
- Other
Purpose
Mobile
Tower
Others
(Genset
for non-
industry
purposes)
& Others
West Bengal 5.05% 2.65% 2.40% 5.60% 2.90% 2.20% 1.30%
Orissa 5.44% 0.46% 0.30% 2.80% 0.30% 1.34% 7.26%
Assam 4.33% 2.99% 1.98% 6.30% 1.30% 3.22% 2.08%
Bihar 16.50% 3.71% 4.09% 3.50% 1.60% 2.40% 13.50%
East Zone 8.37% 2.59% 2.42% 4.55% 1.75% 2.25% 6.17%
For the period April-June 2013, the state of Orissa leads in East zone in
consumption of petrol by 2-wheelers at 82.80%, whereas West Bengal leads in
consumption of petrol in cars at 44.80%.
Figure 58: Petrol Consumption Break up Amongst the Sector Categories
0%
10%
20%
30%
40%
50%
60%
70%
80%
90%
West Bengal Orissa Assam Bihar East Zone
44.80%
13.20%
37.30%
19.70%
28.48%
4.20% 1.70% 1.90% 0.90% 2.24%
46.70%
82.80%
46.20%
73.80%
62.80%
3.30% 1.10%
12.40%
4.90% 5.19%
1.00% 1.20% 2.20% 0.70% 1.30%
Cars UVs 2-Wheelers 3-Wheelers Others

Report – All India Study on Sectoral Demand of Diesel & Petrol 77
West Zone
For the period April-June 2013, diesel consumption in the transport sector of
West zone is maximum in the state of Maharashtra and least in Madhya
Pradesh.
Figure 59: Diesel Consumption Break up Amongst the Transport & Non-Transport Sector
For the period April-June 2013, under transport sector, Madhya Pradesh has
the highest diesel consumption in private cars and UVs at 16.88% in West
zone.
For Gujarat, diesel consumption in 3-wheelers-Passenger/Goods is decreasing
period on period. Diesel consumption in 3-wheelers-Passenger/Goods in July-
September 2012, October-December 2012 and April-June 2013 was 12.02%,
11.93% and 11.13% respectively. This is presumably because many of the 3-
wheelers-Passenger/Goods might have shifted to CNG.
Table 32: Diesel Consumption Break up Amongst Transport Sector Categories
April – June of
2013
Diesel Transport
Cars & UVs
Private
Cars & UVs
Commercial
HCV/LCV &
Buses
3 Wheelers-
Passenger/Goods
Gujarat 15.45% 11.02% 46.90% 11.13%
Madhya Pradesh 16.88% 11.51% 37.04% 9.35%
Maharashtra 12.56% 10.60% 55.67% 9.29%
West Zone 14.55% 10.93% 48.78% 10.14%
84.50% 74.78%
88.12% 84.40%
15.50% 25.22% 11.88% 15.60%
0%
10%
20%
30%
40%
50%
60%
70%
80%
90%
100%
Gujarat Madhya Pradesh Maharashtra West Zone
NonTransport
Transport

Report – All India Study on Sectoral Demand of Diesel & Petrol 78
For the period April-June 2013, under non-transport sector, Madhya Pradesh
has the highest diesel consumption in tractors at 9.2% in West zone.
Table 33: Diesel Consumption Break up Amongst Non-Transport Sector Categories
April – June of
2013
Diesel Non-Transport
Tractors Agri
Implements
Agri
Pumpset
Industry
-
Genset
Industry
- Other
Purpose
Mobile
Tower
Others
(Genset
for non-
industry
purposes)
& Others
Gujarat 2.88% 1.48% 1.75% 2.22% 1.28% 0.94% 4.95%
Madhya Pradesh 9.20% 1.69% 4.22% 3.10% 1.13% 1.52% 4.36%
Maharashtra 2.69% 0.70% 2.21% 2.15% 1.09% 1.92% 1.12%
West Zone 3.79% 1.21% 2.31% 2.33% 1.18% 1.41% 3.36%
For the period April-June 2013, the state of Madhya Pradesh leads in West
zone in consumption of petrol by 2-wheelers at 72.61%, whereas Maharashtra
leads in consumption of petrol in cars at 39.13%.
Figure 60: Petrol Consumption Break up Amongst the Sector Categories
0%
10%
20%
30%
40%
50%
60%
70%
80%
Gujarat Madhya Pradesh Maharashtra West Zone
36.35%
26.01%
39.13% 35.41%
0.31% 0.31% 0.56% 0.41%
63.13%
72.61%
59.50% 63.55%
0.21% 1.07% 0.81% 0.63% 0.00% 0.00% 0.00% 0.00%
Cars UVs 2-Wheelers 3-Wheelers Others
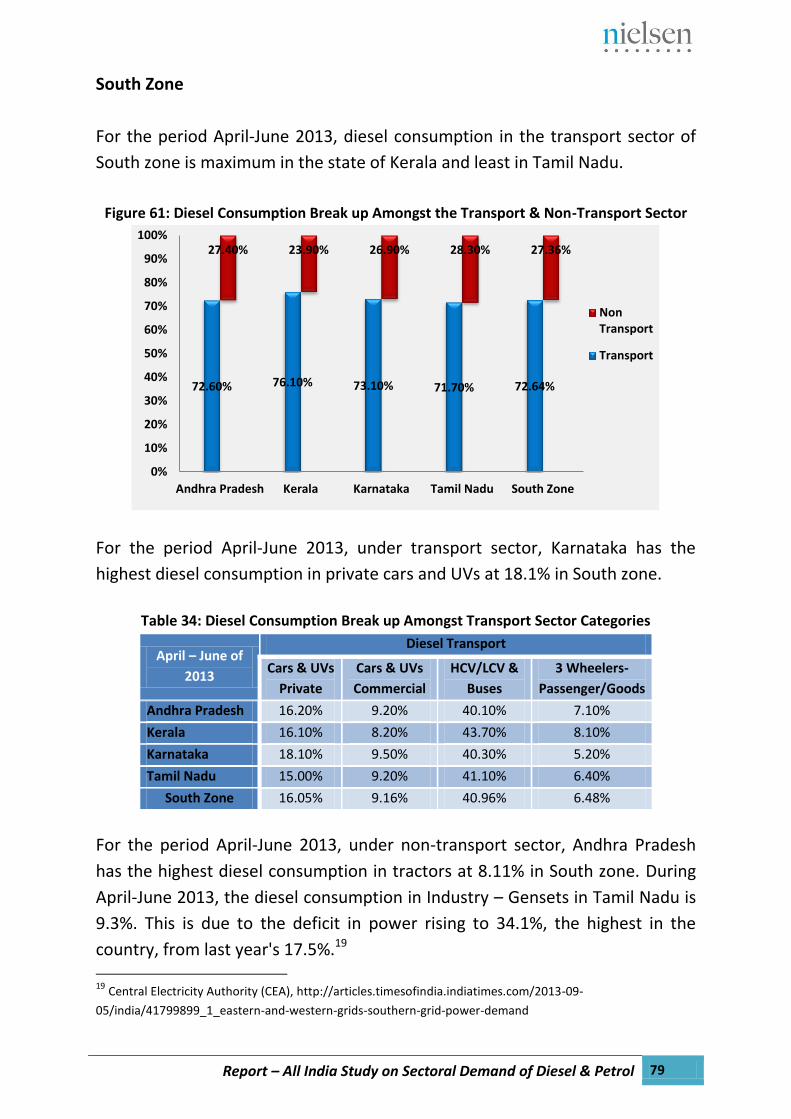
Report – All India Study on Sectoral Demand of Diesel & Petrol 79
South Zone
For the period April-June 2013, diesel consumption in the transport sector of
South zone is maximum in the state of Kerala and least in Tamil Nadu.
Figure 61: Diesel Consumption Break up Amongst the Transport & Non-Transport Sector
For the period April-June 2013, under transport sector, Karnataka has the
highest diesel consumption in private cars and UVs at 18.1% in South zone.
Table 34: Diesel Consumption Break up Amongst Transport Sector Categories
April – June of
2013
Diesel Transport
Cars & UVs
Private
Cars & UVs
Commercial
HCV/LCV &
Buses
3 Wheelers-
Passenger/Goods
Andhra Pradesh 16.20% 9.20% 40.10% 7.10%
Kerala 16.10% 8.20% 43.70% 8.10%
Karnataka 18.10% 9.50% 40.30% 5.20%
Tamil Nadu 15.00% 9.20% 41.10% 6.40%
South Zone 16.05% 9.16% 40.96% 6.48%
For the period April-June 2013, under non-transport sector, Andhra Pradesh
has the highest diesel consumption in tractors at 8.11% in South zone. During
April-June 2013, the diesel consumption in Industry – Gensets in Tamil Nadu is
9.3%. This is due to the deficit in power rising to 34.1%, the highest in the
country, from last year's 17.5%.19 19 Central Electricity Authority (CEA), http://articles.timesofindia.indiatimes.com/2013-09-
05/india/41799899_1_eastern-and-western-grids-southern-grid-power-demand
72.60% 76.10% 73.10% 71.70% 72.64%
27.40% 23.90% 26.90% 28.30% 27.36%
0%
10%
20%
30%
40%
50%
60%
70%
80%
90%
100%
Andhra Pradesh Kerala Karnataka Tamil Nadu South Zone
NonTransport
Transport

Report – All India Study on Sectoral Demand of Diesel & Petrol 80
Table 35: Diesel Consumption Break up Amongst Non-Transport Sector Categories
April – June of
2013
Diesel Non-Transport
Tractors Agri
Implements
Agri
Pumpset
Industry
- Genset
Industry
- Other
Purpose
Mobile
Tower
Others (Genset-
non-industry
purposes) &
Others
Andhra Pradesh 8.11% 1.19% 0.20% 7.20% 2.80% 1.19% 6.71%
Kerala 4.57% 2.22% 1.41% 6.80% 2.50% 1.77% 4.63%
Karnataka 5.36% 4.21% 0.63% 6.20% 2.70% 2.28% 5.52%
Tamil Nadu 4.44% 3.48% 0.38% 9.30% 3.20% 2.34% 5.16%
South Zone 5.50% 2.98% 0.49% 7.91% 2.93% 2.00% 5.55%
For the period April-June 2013, the state of Andhra Pradesh leads in South
zone in consumption of petrol by 2-wheelers at 67.50%, whereas both Kerala
and Karnataka lead in consumption of petrol in cars at around 27%.
Figure 62: Petrol Consumption Break up Amongst the Sector Categories
0%
10%
20%
30%
40%
50%
60%
70%
AndhraPradesh
Kerala Karnataka Tamil Nadu South Zone
25.00% 26.90% 27.10% 26.30% 26.30%
2.80% 2.10% 4.20% 3.20% 3.17%
67.50% 64.30% 64.00% 62.40% 64.30%
3.70% 5.50% 3.70% 7.10% 5.20%
1.00% 1.20% 1.00% 1.00% 1.03%
Cars UVs 2-Wheelers 3-Wheelers Others

Report – All India Study on Sectoral Demand of Diesel & Petrol 81
9.0 All India Composite Results for Diesel – Retail and Direct Sales
a. Survey Findings under different time periods – Retail and Direct Sales
July - September of 2012
For the period July-September 2012, diesel consumption in transport sector is
69.80% and in non-transport sector it is 30.20%. For this period, diesel
consumption is maximum in HCV/LCV at 28.78%, followed by private Cars and
UVs at 12.49%.
Table 36: All India End-use Share (%) of Diesel in Retail and Direct – July - September of
2012
End Use Segment Overall %
(Only Retail)
Retail Sales Volume (TMT)
Direct Sales
Volume (TMT)
Overall Volume
(Retail and Direct) (TMT)
Overall % (Retail and
Direct)
CARS/UVs
Cars & UVs - Private 14.73 2315.26 - 2315.26 12.49
Cars & UVs - Commercial 10.11 1589.09 - 1589.09 8.57
3 Wheelers-Passenger/Goods
7.49 1177.28 - 1177.28 6.35
COMMERCIAL VEHICLES
HCV/LCV 33.94 5334.69 - 5334.69 28.78
Buses 7.23 1136.41 649 1785.41 9.63
OTHER TRANSPORT
Aviation/Shipping - - 96 96.00 0.52
Railways - - 642 642.00 3.46
AGRICULTURE
Tractors 6.09 957.76 133 2125.36 11.46
Agri Implements 3.39 532.93
Agri Pumpset 4.04 634.67
OTHERS
Industry - Genset 4.46 700.83 54 754.83 4.07
Industry - Other Purpose 2.18 342.49 687 1029.49 5.55
Mobile Tower 2.05 321.56 - 321.56 1.73
Others (Genset for non-industry purposes) & Others
4.30 675.26 692 1367.26 7.38
TOTAL 100.00 15718.23 2953.00 18538.23 100.00
For June-September 2012, nearly 36% of the total diesel consumed by Buses is
directly supplied by Oil Marketing Companies (OMCs) to State Transport
Corporations (STC).

Report – All India Study on Sectoral Demand of Diesel & Petrol 82
October - December of 2012
For the period July-September 2012, diesel consumption in transport sector is
about 70% and in non-transport sector it is about 30%. For this time period,
diesel consumption is maximum in HCV/LCV at 27.06%, followed by private
Cars and UVs at 13.42%.
Table 37: All India End-use Share (%) of Diesel in Retail and Direct: October - December of
2012
End Use Segment Overall %
(Only Retail)
Retail Sales
Volume
(TMT)
Direct
Sales
Volume
(TMT)
Overall
Volume
(Retail and
Direct)
(TMT)
Overall %
(Retail
and
Direct)
CARS/UVs
Cars & UVs - Private 15.74 2769.76 - 2769.76 13.42
Cars & UVs - Commercial 10.50 1848.99 - 1848.99 8.96
3 Wheelers-
Passenger/Goods
7.35 1294.16 - 1294.16 6.27
COMMERCIAL VEHICLES
HCV/LCV 31.74 5586.92 - 5586.92 27.06
Buses 8.84 1555.86 660 2215.86 10.73
OTHER TRANSPORT
Aviation/Shipping - - 99 99.00 0.48
Railways - - 634 634.00 3.07
AGRICULTURE
Tractors 8.05 1417.17 221 2744.58 13.29
Agri Implements 2.69 473.02
Agri Pumpset 3.60 633.40
OTHERS
Industry - Genset 3.84 676.17 54 730.17 3.54
Industry - Other Purpose 2.08 366.39 734 1100.39 5.33
Mobile Tower 1.57 275.86 - 275.86 1.34
Others (Genset for non-
industry purposes) & Others
4.00 704.31 640 1344.31 6.51
TOTAL 100.00 17602.01 3042.00 20644.01 100.00
For October-December 2012, nearly 30% of the total diesel consumed by Buses
is directly supplied by Oil Marketing Companies (OMCs) to State Transport
Corporations (STC).

Report – All India Study on Sectoral Demand of Diesel & Petrol 83
April – June of 2013
For the period April-June 2013, diesel consumption in transport sector is
70.63% and in non-transport sector it is 29.37%. For this time period, diesel
consumption is maximum in HCV/LCV at 29.16%, followed by private Cars and
UVs at 13.56%.
Table 38: All India End-use Share (%) of Diesel in Retail and Direct: April – June of 2013
End Use Segment
Overall %
(Only
Retail)
Retail Sales
Volume
(TMT)
Direct
Sales
Volume
(TMT)
Overall
Volume
(Retail and
Direct) (TMT)
Overall %
(Retail
and
Direct)
CARS/UVs
Cars & UVs - Private 14.90 2751.15 - 2751.15 13.56
Cars & UVs - Commercial 10.23 1889.57 - 1889.57 9.31
3 Wheelers-
Passenger/Goods
7.24 1336.18 - 1336.18 6.58
COMMERCIAL VEHICLES
HCV/LCV 32.05 5918.44 - 5918.44 29.16
Buses 8.63 1593.49 98 1691.49 8.33
OTHER TRANSPORT
Aviation/Shipping - - 93 93.00 0.46
Railways - - 655 655.00 3.23
AGRICULTURE
Tractors 8.71 1608.46 78 2744.37 13.52
Agri Implements 3.34 616.61
Agri Pumpset 2.39 441.30
OTHERS
Industry - Genset 4.74 875.87 59 934.87 4.61
Industry - Other Purpose 2.08 383.34 445 828.34 4.08
Mobile Tower 1.72 318.38 - 318.38 1.57
Others (Genset for non-
industry purposes) &
Others
3.97 732.20 403 1135.20 5.59
TOTAL 100.00 18465.00 1831.00 20296.00 100.00
For April-June 2013, only 6 % of the total diesel consumed by Buses is directly
supplied by Oil Marketing Companies (OMCs) to State Transport Corporations
(STC). This drop is presumably because STCs are bulk consumers of diesel and
after partial deregulation in diesel prices (mid-January 2013 onwards), OMCs
have started charging the market price from STCs. Now most of the STC buses
are purchasing diesel from city ROs late at night.

Report – All India Study on Sectoral Demand of Diesel & Petrol 84
b. All India Diesel Aggregated & Consolidated Findings – Retail + Direct Sales
At an aggregate all India level, diesel consumption in transport sector is 70%
and in non-transport sector it is 30%. At an all India level, diesel consumption is
maximum in HCV/LCV at 28.25%, followed by private cars and UVs at 13.15%.
Buses consume about 9.55% and railways about 3.24% of total diesel
consumption.
The agriculture sector is a major consumer of diesel with 13% of the total
consumption accounted for by it.
Diesel consumption by other segments is 17 per cent. This comprises of
industry 9.02% (of which gensets 4.06 % and others for industrial purposes
4.96%), mobile towers (1.54%) and others 6.45% comprising of gensets for
non-industrial purposes, civil construction, etc.
Table 39: All India End-use Share (%) of Diesel in Retail and Direct – All India Aggregate
End Use Segment
Retail Sales
Volume
(TMT)
Direct Sales
Volume
(TMT)
Overall Volume
(Retail and
Direct) (TMT)
Overall %
(Retail and
Direct)
CARS/UVs
Cars & UVs - Private 2612.06 - 2612.06 13.15
Cars & UVs - Commercial 1775.88 - 1775.88 8.94
3 Wheelers-Passenger/Goods 1269.21 - 1269.21 6.39
COMMERCIAL VEHICLES
HCV/LCV 5613.35 - 5613.35 28.25
Buses 1428.59 469 1897.59 9.55
OTHER TRANSPORT
Aviation/Shipping - 96 96.00 0.48
Railways - 644 643.67 3.24
AGRICULTURE
Tractors 1327.80 144 2582.44 13.00
Agri Implements 540.85
Agri Pumpset 569.79
OTHERS
Industry - Genset 750.96 56 806.63 4.06
Industry - Other Purpose 364.07 622 986.07 4.96
Mobile Tower 305.27 - 305.27 1.54
Others (Genset for non-
industry purposes) & Others
703.92 578 1282.26 6.45
TOTAL 17261.75 2608.67 19870.41 100.00

Report – All India Study on Sectoral Demand of Diesel & Petrol 85
10.0 Findings of the household / customer survey
During the study in all the rounds, in-depth survey had been carried out of
those who are buying loose diesel i.e. in cans/ barrels, instead of taking fuel in
the tanks of their vehicle. The survey had been carried out both in urban and
rural outlet with a limited sample size. The total number of observations was
4000 i.e. 1000 in each round. The consumption in pump sets has seen a decline
in certain pockets. Secondly the ROs surveyed in the outskirts have seen a
great off take in terms of other activities such as road construction, gensets,
and bakery applications. The all India major findings are enumerated below:
In majority of the cases, bearer of the can / barrels simply asks for
certain quantity of diesel, with less knowledge about exact application of
that diesel. The tracer survey reveals that majority is getting consumed
to run generator sets under different application areas, e.g. running gen
set at mobile tower, running gen set at the factory/ office, running gen
set for hotels, hospitals as well as for commercial and housing complex.
This kind of activity is very much rampant in case of urban outlet.
Whereas in case of highway or rural outlets, it is mainly consumed for
running pump set & other agri equipment as an alternative to electricity.
Even in case of rural areas, they carry diesel to nearby villages for
storage and consumption whenever needed.
In urban areas, one of the interesting applications is to use diesel as fuel
especially for bakery and sweetmeat industry.
The average purchase per transaction varies widely in the range of 25 to
200 litters. There is no consistency in terms of frequency of purchase.

Report – All India Study on Sectoral Demand of Diesel & Petrol 86
11.0 Conclusion
Following conclusions can be made from the data collected during the field
work:
Diesel
At an aggregate all India level, under the transport sector, diesel
consumption is maximum in HCV/LCV and Buses followed by private
Cars and UVs. The large number of additions of the modern and
improved technology diesel vehicles on the roads during the past couple
of years may have contributed to the higher trend in consumption of
diesel in private cars and UVs. Whereas in non-transport sector, diesel
consumption is maximum in tractors segment followed by industry
generators. This is apparently because tractors are not necessarily used
only for agricultural purpose, but they are also used for commercial
purposes and as a means for transporting people.
In North Zone, under transport sector, diesel consumption is maximum
in HCV/LCV and Buses at 35.72%, followed by Private Cars and UVs at
13.73%. Whereas under non-transport sector, diesel consumption in
tractors, agri implements and agri pump sets congregated together is
approximately 22% of the total diesel consumption in North zone. This is
perhaps because agriculture is the main activity in North India.
In East zone, under transport sector, diesel consumption is maximum in
HCV/LCV and Buses at 37.5%, followed by Private Cars and UVs at
17.79%. Whereas under non-transport sector, diesel consumption for
running of mobile towers is very significant at 2.6%. This is probably due
to the lack of power source at high altitudes because of hilly terrain and
low density rural areas. In such a case, generators remain to be the only
option for mobile service providers to keep the BTS operational.
In West zone, under transport sector, diesel consumption is maximum in
HCV/LCV and Buses at 47.35%, followed by Private Cars and UVs at
14.4%. Whereas, diesel consumption is only 12.3% in non-transport
sector, excluding diesel consumption in tractor. For North, East and
South zones, the diesel consumption in non-transport sector (excluding
diesel consumption in tractor) is 24.4%, 19.9% and 18.7% respectively.
Report – All India Study on Sectoral Demand of Diesel & Petrol 87
In South zone, under transport sector, diesel consumption is maximum
in HCV/LCV and Buses at 41.6%, followed by Private Cars and UVs at
17.13%. Whereas, under non-transport sector, South zone is the only
zone where diesel consumption in Industry genset (5.58%) is more than
the diesel consumption in tractors (5.03%). This presumably may be
because of huge power deficit in the Southern states.
Petrol:
At an aggregate all India level, North zone has the lowest consumption
of petrol in terms of volume for 2-wheelers, and highest consumption of
petrol by 4 wheelers.
In North zone, the state of Rajasthan leads in consumption of petrol by
2-wheelers, whereas Delhi leads in consumption of petrol in cars.
In East zone, the state of Orissa leads in East zone in consumption of
petrol by 2- wheelers, whereas West Bengal leads in consumption of
petrol in cars. This is presumably because West Bengal is more urban
than Orissa and has one of the metropolitan cities (Kolkata) of India as
its capital.
In West zone, the state of Madhya Pradesh leads in the consumption of
petrol by 2- wheelers, whereas the state of Maharashtra leads in the
consumption of petrol in cars.
In South zone, the state of Andhra Pradesh leads in consumption of
petrol by 2- wheelers, whereas Karnataka leads in consumption of petrol
in cars.

Report – All India Study on Sectoral Demand of Diesel & Petrol 88
12.0 Appendix
Details of Retail Sales of Diesel – Zone wise
The following table shows the diesel consumption across categories for each
zone:
Table 40: Zone-wise – Aggregate consumption of diesel - Retail Sales
End Use Segment North East West South Overall
(%)
CARS/UVs
Cars & UVs - Private 13.73 17.79 14.40 17.13 15.13
Cars & UVs - Commercial 10.02 9.37 11.17 9.96 10.29
3 Wheelers-Passenger/Goods 3.83 8.47 10.48 7.65 7.36
COMMERCIAL VEHICLES
HCV/LCV and Buses 35.72 37.50 47.35 41.60 40.80
AGRICULTURE
Tractors 12.32 7.04 4.27 5.03 7.65
Agri Implements 5.09 2.28 1.88 2.26 3.13
Agri Pumpset 4.55 4.33 2.26 1.98 3.33
OTHERS
Industry - Genset 6.42 2.82 2.18 5.58 4.34
Industry - Other Purpose 3.17 1.72 0.98 2.44 2.11
Mobile Tower 1.82 2.57 1.45 1.60 1.77
Others (Genset for non-industry purposes) & Others 3.35 6.11 3.59 4.77 4.08
HIGHEST LOWEST
o In North zone, in the transport sector, diesel consumption is
maximum in Heavy or Light Commercial Vehicles and Buses (35.72%)
followed by Private Cars and UVs (13.73%), whereas in the non-
transport sector, diesel consumption is the maximum in Tractors
(12.32%). The diesel consumption in Tractors is the highest in North
zone compared to all other zones.
o In East zone, in the transport sector, diesel consumption is maximum
in Heavy or Light Commercial Vehicles and Buses (37.5%) followed by
Private Cars and UVs (17.79%) whereas in the non-transport sector,
diesel consumption is the maximum in Tractors (7%). %). The diesel
consumption in Private Cars and UVs is the highest in East zone
compared to all other zones.
o In West zone, in the transport sector, diesel consumption is maximum
in Heavy or Light Commercial Vehicles and Buses (47.35%) followed by

Report – All India Study on Sectoral Demand of Diesel & Petrol 89
Private Cars and UVs (14.4%) whereas in the non-transport sector,
diesel consumption is the maximum in Tractors (4.3%). The diesel
consumption in HCV/LCV and Buses is the highest in West zone
compared to all other zones.
o In South zone, in the transport sector, diesel consumption is
maximum in Heavy or Light Commercial Vehicles and Buses (41.6%)
followed by Private Cars and UVs (17.13%) whereas, in the non-
transport sector, diesel consumption is the maximum in Industry
genset (5.6%).
Details of Retail Sales of Petrol – Zone wise
The following table shows the petrol consumption across categories for
each zone:
Table 41: Zone-wise – Aggregate consumption of Petrol - Retail Sales
North Zone East Zone West Zone South Zone All India
Cars 40.17% 27.39% 34.72% 27.71% 34.33%
UVs 2.94% 2.79% 0.43% 3.77% 1.51%
2-Wheelers 54.72% 61.66% 63.70% 60.76% 61.42%
3-Wheelers 1.84% 6.48% 1.10% 6.53% 2.34%
Others 0.33% 1.69% 0.06% 1.22% 0.39%
HIGHEST LOWEST
o In North zone, petrol consumption is maximum in 2 wheelers
(54.72%) followed by Cars (40.17%). The petrol consumption in Cars is
the highest in North zone and in 2-wheelers it is the lowest compared
to all other zones.
o In East zone, petrol consumption is maximum in 2 wheelers (61.66%)
followed by Cars (27.39%). The petrol consumption in Cars is the
lowest in East zone compared to all other zones.
o In West zone, petrol consumption is maximum in 2 wheelers (63.7%)
followed by Cars (34.72%). The petrol consumption in 2-wheelers is
the highest in West zone compared to all other zones.
o In South zone, petrol consumption is maximum in 2 wheelers
(60.76%) followed by Cars (27.71%). The petrol consumption in 3-
wheelers is the highest in South zone compared to all other zones.

Report – All India Study on Sectoral Demand of Diesel & Petrol 90
Details of Retail Sales of Diesel – State wise
The following table shows the diesel consumption across transport
categories for all 16 states:
Table 42: State-wise – Consumption of Diesel in Transport Sector - Retail Sales
S.
No. States
Diesel Transport
Cars & UVs
Private
Cars & UVs
Commercial
HCV/LCV
& Buses
3 Wheelers-
Passenger/Goods
(%)
1 Andhra Pradesh 16.99 7.16 42.24 7.47
2 Assam 17.77 15.47 29.12 15.74
3 Bihar 16.18 3.67 27.14 8.05
4 Delhi 34.69 18.43 18.49 0.29
5 Gujarat 15.65 11.11 47.04 11.68
6 Haryana 7.56 4.46 50.54 1.99
7 Karnataka 18.62 9.87 42.02 5.92
8 Kerala 16.22 8.26 41.94 9.63
9 Madhya Pradesh 13.93 12.93 32.75 8.34
10 Maharashtra 13.10 10.53 53.64 9.94
11 Orissa 16.21 11.12 45.29 9.37
12 Punjab 14.15 9.75 26.49 2.48
13 Rajasthan 15.61 16.82 39.58 4.83
14 Tamil Nadu 16.71 11.81 41.00 8.12
15 Uttar Pradesh 14.67 9.33 25.72 5.88
16 West Bengal 20.06 10.47 45.80 5.00
All India 15.13 10.29 40.80 7.36
o Diesel consumption by private cars & UVs is maximum in Delhi
(34.69%) followed by West Bengal (20.06%) and lowest in Haryana
(7.56%)
o Diesel consumption by commercial cars & UVs is again maximum in
Delhi (18.43%) and lowest in Bihar (3.67%)
o In the states like Maharashtra and Haryana the diesel consumption by
Heavy or Light commercial vehicles and buses is more than 50%.
o Diesel consumption by 3 Wheelers-Passenger/Goods is maximum in
Assam (15.74%).

Report – All India Study on Sectoral Demand of Diesel & Petrol 91
The following table shows the diesel consumption across non-transport
categories for all 16 states:
Table 43: State-wise – Consumption of Diesel in Non-Transport Sector - Retail Sales
S.
No. States
Diesel Non-Transport
Tractors Agri
Implements
Agri
Pumpset
Industry
- Genset
Industry
- Other
Purpose
Mobile
Tower
Others
(Genset
for non-
industry
purposes)
& Others
(%)
1 Andhra Pradesh 6.70 1.96 2.56 5.59 3.09 1.09 5.17
2 Assam 3.75 2.57 3.89 4.87 1.36 3.32 2.14
3 Bihar 14.15 3.28 8.71 1.51 1.19 3.59 12.53
4 Delhi 0.65 0.00 0.21 9.84 7.53 0.02 9.85
5 Gujarat 2.96 2.40 1.22 1.61 0.92 0.97 4.44
6 Haryana 10.20 7.29 3.26 8.24 2.52 0.43 3.49
7 Karnataka 4.98 3.88 2.16 4.49 2.03 1.57 4.47
8 Kerala 3.76 2.15 1.43 5.57 2.14 1.24 7.65
9 Madhya
Pradesh 11.85 2.72 6.23 3.63 0.81 1.63 5.17
10 Maharashtra 2.73 0.91 1.88 2.26 1.11 1.95 1.95
11 Orissa 4.84 0.69 0.61 1.68 0.61 1.13 8.45
12 Punjab 17.69 8.58 7.02 6.19 2.56 2.01 3.09
13 Rajasthan 12.42 2.50 1.87 3.20 1.25 0.87 1.05
14 Tamil Nadu 4.48 1.69 1.72 6.08 2.36 1.95 4.07
15 Uttar Pradesh 14.00 4.29 7.27 6.45 4.61 3.92 3.86
16 West Bengal 3.72 2.18 2.87 3.65 2.97 2.17 1.11
All India 7.65 3.13 3.33 4.34 2.11 1.77 4.08
o Diesel consumption by Tractors is maximum in Punjab (17.69%)
followed by Bihar (14.15%) and lowest in Delhi (0.65%).
o Diesel consumption by Industry genset is maximum in Delhi (9.84%)
followed by Haryana (8.24%).
o Diesel consumption by Mobile tower is maximum in Bihar (3.59%)
followed by Assam (3.32%).

Report – All India Study on Sectoral Demand of Diesel & Petrol 92
Details of Retail Sales of Petrol – State wise
Table 44: State-wise – Consumption of Petrol - Retail Sales
S.
No. States
Petrol
Cars UVs 2-Wheelers 3-Wheelers Others
(%)
1 Andhra Pradesh 26.04 3.26 65.19 4.33 1.17
2 Assam 36.24 2.84 42.61 16.02 2.29
3 Bihar 18.24 0.85 75.18 5.41 0.32
4 Delhi 56.94 1.20 41.80 0.07 0.00
5 Gujarat 34.92 0.05 64.45 0.58 0.01
6 Haryana 54.83 0.59 44.44 0.14 0.00
7 Karnataka 29.24 4.73 59.81 5.15 1.07
8 Kerala 27.36 2.62 60.33 7.93 1.77
9 Madhya Pradesh 24.64 1.66 69.28 4.16 0.26
10 Maharashtra 38.33 2.30 55.94 3.10 0.32
11 Orissa 11.66 2.55 82.28 0.89 2.62
12 Punjab 56.63 0.91 40.81 1.65 0.00
13 Rajasthan 18.58 5.15 73.85 2.22 0.19
14 Tamil Nadu 27.90 4.01 58.77 8.25 1.07
15 Uttar Pradesh 31.74 4.14 60.19 3.20 0.73
16 West Bengal 44.42 4.48 45.40 4.67 1.03
All India 34.33 1.51 61.42 2.34 0.39
o Petrol consumption by cars is maximum in Delhi (56.94%) and closely
followed by Punjab (56.63%), while it is minimum in Orissa (11.66%).
o In the states like Orissa and Bihar, the petrol consumption by 2-
wheelers is more than 75%.
o Petrol consumption by 3-Wheelers is maximum in Assam (16.02%).
o Petrol consumption by UVs is maximum in Rajasthan (5.15%) and
minimum in Gujarat (0.05%).

Report – All India Study on Sectoral Demand of Diesel & Petrol 93
The questionnaires used for the study are as follows:
1. QUESTIONNAIRE FOR RETAIL OUTLET
Retail Outlet Number No. of Hours of Operation
_From_________To____
Qtr. No. State Code District Oil Co.:
BPC/HPC/IOC
Name of Retail Outlet
Address
Contact Details Proprietor Name FAX No.
Phone no.
1. Type of retail outlet
Type Code
(1/2/3/4) Class of Market : A/B/C/D/E (Pl Tick)
COCO (1)/ ‘A’ Site RO(2)/Regular
Outlet(3) / Rural Outlet (4)
No: of Dispensers –MS
No: of Dispensers -HSD
2. Average monthly sales: (a)Petrol kL (b)Diesel kL 3. Is there any seasonality in sales of HSD (Diesel) at your RO? YES NO 4. If yes, please specify the peak, lean and average months for sale of Diesel:
S No. Months Peak Months (Yes/No) Lean Months (Yes/No) Average Sales
1 April
2 May
3 June
5. Is there any seasonality in sales of MS (Petrol) at your RO? YES NO 6. If yes, please specify the peak, lean and average months for sale of MS (Petrol):
S No. Months Peak Months (Yes/No) Lean Months (Yes/No) Average Sales
1 April
2 May
3 June
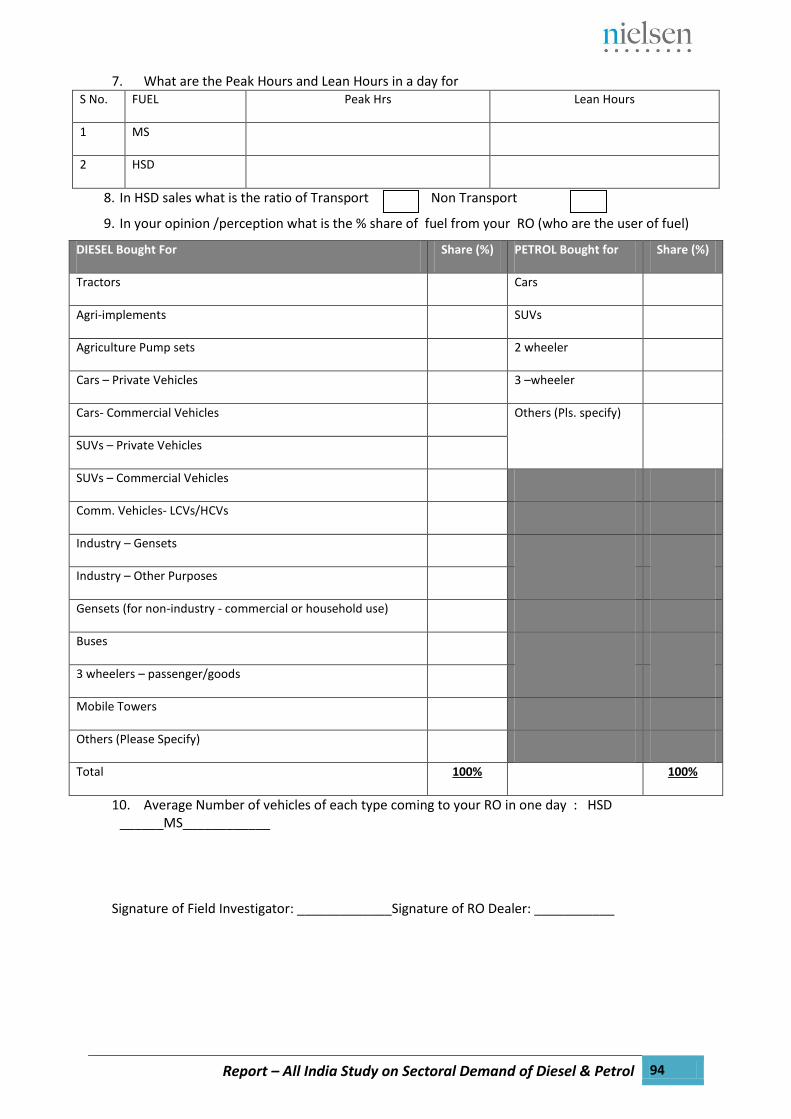
Report – All India Study on Sectoral Demand of Diesel & Petrol 94
7. What are the Peak Hours and Lean Hours in a day for S No. FUEL Peak Hrs Lean Hours
1 MS
2 HSD
8. In HSD sales what is the ratio of Transport Non Transport
9. In your opinion /perception what is the % share of fuel from your RO (who are the user of fuel)
DIESEL Bought For Share (%) PETROL Bought for Share (%)
Tractors Cars
Agri-implements SUVs
Agriculture Pump sets 2 wheeler
Cars – Private Vehicles 3 –wheeler
Cars- Commercial Vehicles Others (Pls. specify)
SUVs – Private Vehicles
SUVs – Commercial Vehicles
Comm. Vehicles- LCVs/HCVs
Industry – Gensets
Industry – Other Purposes
Gensets (for non-industry - commercial or household use)
Buses
3 wheelers – passenger/goods
Mobile Towers
Others (Please Specify)
Total 100% 100%
10. Average Number of vehicles of each type coming to your RO in one day : HSD ______MS____________
Signature of Field Investigator: _____________Signature of RO Dealer: ___________

Report – All India Study on Sectoral Demand of Diesel & Petrol 95
2. OBSERVATION STUDY
(RETAIL OUTLET)
Retail Outlet Number
NAME & address of RO : _________________________________ OIL COM: BPC/HPC/IOC (PL TICK)
State
District Date:______________
Qtr No. DAY Mon(1)/Tue(2)/Wed(3)/Thu(4)/Friday(5)/Sat(6)/Sun(7)
Fuel Petrol 1
Diesel 2
Excl. 2
whlr
(Y/N)
Fuel Petrol 1
Diesel 2
Excl. 2
whlr
(Y/N)
TOT-1 OPEN CLOSE TOT-17 OPEN CLOSE
TOT-2 OPEN CLOSE TOT-18 OPEN CLOSE
TOT-3 OPEN CLOSE TOT-19 OPEN CLOSE
TOT-4 OPEN CLOSE TOT-20 OPEN CLOSE
TOT-5 OPEN CLOSE TOT-21 OPEN CLOSE
TOT-6 OPEN CLOSE TOT-22 OPEN CLOSE
TOT-7 OPEN CLOSE TOT-23 OPEN CLOSE
TOT-8 OPEN CLOSE TOT-24 OPEN CLOSE
TOT-9 OPEN CLOSE TOT-25 OPEN CLOSE
TOT-10 OPEN CLOSE TOT-26 OPEN CLOSE
TOT-11 OPEN CLOSE TOT-27 OPEN CLOSE
TOT-12 OPEN CLOSE TOT-28 OPEN CLOSE
TOT-13 OPEN CLOSE TOT-29 OPEN CLOSE
TOT-14 OPEN CLOSE TOT-30 OPEN CLOSE
TOT-15 OPEN CLOSE TOT-31 OPEN CLOSE
TOT-16 OPEN CLOSE TOT-32 OPEN CLOSE
Note : Totalizer Opening and Closing reading should be for the duration of the Survey done during that day and not for full working hours of the Retail Outlet

Report – All India Study on Sectoral Demand of Diesel & Petrol 96
Survey Time From ________hrs to ________hrs
Veh_Model Fuel Petrol 1
Diesel 2
Qty Veh_Model Fuel Petrol 1
Diesel 2
Qty Veh_Model Fuel Petrol 1
Diesel 2
Qty
Report – All India Study on Sectoral Demand of Diesel & Petrol 97
Survey Time From ________hrs to ________hrs
Veh_Model Fuel Petrol 1
Diesel 2
Qty Veh_Model Fuel Petrol 1
Diesel 2
Qty Veh_Model Fuel Petrol 1
Diesel 2
Qty

Report – All India Study on Sectoral Demand of Diesel & Petrol 98
Survey Time From ________hrs to ________hrs
Veh_Model Fuel Petrol 1
Diesel 2
Qty Veh_Model Fuel Petrol 1
Diesel 2
Qty Veh_Model Fuel Petrol 1
Diesel 2
Qty

Report – All India Study on Sectoral Demand of Diesel & Petrol 99
Survey Time From ________hrs to ________hrs
Veh_Model Fuel Petrol 1
Diesel 2
Qty Veh_Model Fuel Petrol 1
Diesel 2
Qty Veh_Model Fuel Petrol 1
Diesel 2
Qty

Report – All India Study on Sectoral Demand of Diesel & Petrol 100
2. Containers Sales
Fuel Petrol 1
Diesel 2
Qty Purpose *
(refer code/ sub code
below)
Fuel Petrol 1
Diesel 2
Qty Purpose*
(refer code/ sub
code below)
Fuel Petrol 1
Diesel 2
Qty Purpose*
(refer code/ sub code
below)
3. On an avg what has been the mileage for different category of vehicles:
Bikes______ Scooters _______ Cars _____ S UV ______ Trucks _____ Bus _ ____ 3 Wheeler
Purpose* Code Sub code Purpose* Code
GENERATOR 1 0 HARVESTOR 3
AGRICULTURE/PUMP SET 1 1 FISHING 4
INDUSTRIAL 1 2 TRACTORS 5
MOBILE TOWER 1 3 RE SALES 6
UNREGISTERED VEHICLE (JUGGAD) 2 OTHERS 7

Report – All India Study on Sectoral Demand of Diesel & Petrol 101
In case of Tractors
Make of Tractor Average Hours of Operation Make of Tractor Average Hours of Operation
Name & Signature of Field Investigator______________________________________Name & Signature of Outlet Dealer___________________________________

Report – All India Study on Sectoral Demand of Diesel & Petrol 102
3. CHECK LIST FOR HOUSEHOLD SURVEY
District: _____________________
City: _________________
Name: ____________________________________________________________
Add: ______________________________________________________________
1. Do you purchase loose HSD in containers /barrels : Yes / No: _________________
2. What is the average quantity of HSD purchased in last month: ________________
3. For What purpose have you purchased:
Purpose* Code Sub Code
Purpose* Code
GENERATOR 1 0 HARVESTOR 3
AGRICULTURE/PUMP SET 1 1 FISHING 4
INDUSTRIAL 1 2 TRACTORS 5
MOBILE TOWER 1 3 RE SALES 6
UNREGISTERED VEHICLE (JUGGAD)
2 OTHERS
4. Frequency of Purchase: _____________________

Report – All India Study on Sectoral Demand of Diesel & Petrol 103
Picture Credits:
http://india.blogs.nytimes.com/2012/07/31/indias-long-struggle-for-power/?_r=0
http://carimg.sulekha.com/automotive-albums/default/original/india_petrol_pump.jpg
http://im.rediff.com/money/2010/oct/27diesel4.jpg
http://media2.intoday.in/indiatoday/images/stories/petrol_350_102712035348.jpg
http://newsimg.bbc.co.uk/media/images/44800000/jpg/_44800641_trucklineap466.jpg
http://static.indianexpress.com/m-
images/wed%20jul%2025%202012,%2017;25%20hrs/M_Id_303775_Petrol,_diesel,_LPG_prices.jpg
http://india.air1.info/en/Images/get_quote_330_190.jpg
http://www.theguardian.com/global-development/2012/mar/01/gaza-energy-crisis-risk-hardship
http://static.panoramio.com/photos/large/37541231.jpg
http://www.autojunction.in/wcsstore/AJeRetailstore/images/content/features/Photo-25.jpg
http://surajyadavopinion.blogspot.in/2011/06/does-reliance-have-role-in-fluctuating.html
http://uk.reuters.com/article/2009/01/09/uk-india-strike-sb-idUKTRE5084C220090109
http://www.team-bhp.com/forum/route-travel-queries/53117-cng-filling-pumps-pune-2.html
http://kanglaonline.com/2012/11/no-shortage-of-fuel-oken/
http://www.bcmtouring.com/forum/itinerary-f10/mumbai-kolhapur-belgaum-bangalore-best-route-hotels-
bangalore-t40394/
Copyright © Petroleum Planning & Analysis Cell (PPAC) Disclaimer: This report has been generated on the basis of primary data collection exercise across different Retail Outlets during the time period – January 2012 to June of 2013.This report is furnished to the recipient for information purposes only. Recipients should conduct their own investigation and analysis of any information contained in this report. Petroleum Planning & Analysis Cell (PPAC) makes no representations or warranties regarding the accuracy or completeness of such information and expressly disclaims any and all liabilities based on such information or on omissions there from. The recipient must not reproduce, disclose or distribute the information contained herein without the prior written consent of PPAC. Contact Details: Petroleum Planning & Analysis Cell (PPAC)
(Ministry of Petroleum & Natural Gas, Government of India) 2nd Floor, Core-8, SCOPE Complex 7 Institutional Area, Lodhi Road, New Delhi - 110 003, India Phone: +91-11-24306100, 24361314