all aboard florida ridership and revenue study...all aboard florida ridership and revenue study may...
TRANSCRIPT

Prepared for:
Prepared by:
May 7, 2015
All Aboard Florida Ridership and Revenue Study
Case 1:15-cv-00632-CRC Document 21-2 Filed 05/28/15 Page 2 of 154

All Aboard Florida Ridership and Revenue Study
May 7, 2015
Page ii
This Report was prepared by The Louis Berger Group, Inc. (LBG) for the benefit of Florida East Coast Industries, LLC (Client) pursuant to a Professional Services Agreement dated January 1, 2012.
LBG has performed its services to the level customary for competent and prudent engineers performing such services at the time and place where the services to our Client were provided. LBG makes or intends no other warranty, express or implied. Certain assumptions regarding future trends and forecasts may not materialize, which may affect actual future performance and market demand, so actual results are uncertain and may vary significantly from the projections developed as part of this assignment. The data used in the Report was current as of the date of the Report and may not now represent current conditions. Unless you are the Client, or a party to a fully executed Reliance Letter Agreement with LBG concerning this project (Relying Party), you may not rely on the information, data, and descriptions in this report as reasonably necessary for evaluation of this project. The Report is provided for information purposes only. LBG makes no representations or warranty that the information in the Report is sufficient to provide all the information, evaluations and analyses necessary to satisfy the entire due diligence needs of a Relying Party.
Case 1:15-cv-00632-CRC Document 21-2 Filed 05/28/15 Page 3 of 154

All Aboard Florida Ridership and Revenue Study
May 7, 2015
Page iii
TableofContents
Executive Summary ............................................................................................................................. 1
ES‐1 Overview of the Investment Grade Study Process .............................................................................. 5
ES‐2 Study Purpose and Objective............................................................................................................... 6
ES‐3 Study Process ....................................................................................................................................... 6
ES‐4 Key Assumptions .................................................................................................................................. 8
ES‐5 Forecast Sensitivity Testing ................................................................................................................ 9
1. Introduction ................................................................................................................................. 1
1.1 Investment Grade Study Objectives and Criteria .............................................................................. 1
1.2 Summary of Data Sources and Methods .......................................................................................... 2
1.3 Overview of All Aboard Florida ......................................................................................................... 3
1.4 Overview of the Relevant Travel Market .......................................................................................... 3
1. 5 Review of Previous Studies ............................................................................................................... 5
1.5.1 Florida Overland Express (FOX) ................................................................................................. 6
2. The Market for Intercity Rail in Southeast and Central Florida .................................................... 10
2.1 Regional Study Area ........................................................................................................................ 10
2.2 Regional Socioeconomic and Travel Conditions ............................................................................. 10
2.2.1 Population ................................................................................................................................... 10
2.2.2 Employment ................................................................................................................................ 12
2.2.3 Regional Travel ............................................................................................................................ 13
2.3 Station Area Socioeconomic Conditions ......................................................................................... 19
2.4 Future Socioeconomic and Travel Conditions ................................................................................ 29
2.4.1 Population Forecasts ................................................................................................................... 29
2.4.2 Employment Forecasts ................................................................................................................ 32
2.4.3 Travel Forecasts .......................................................................................................................... 34
3. Intercity Trip Characteristics ....................................................................................................... 35
3.1 Intercity Travel Volumes ................................................................................................................. 35
3.2 Data Sources ................................................................................................................................... 35
3.3 Trip Purpose and Modes of Travel .................................................................................................. 36
3.4 Market Geography .......................................................................................................................... 36
3.5 Intercity Travel Volumes ................................................................................................................. 40
3.5.1 Autos ........................................................................................................................................... 40
3.5.1.1 I‐95 Corridor Coalition Trip Data ............................................................................................. 40
3.5.1.2 Evaluation of ICAT Data through AAF O‐D Survey .................................................................. 41
Case 1:15-cv-00632-CRC Document 21-2 Filed 05/28/15 Page 4 of 154

All Aboard Florida Ridership and Revenue Study
May 7, 2015
Page iv
3.5.1.3 Comparison to Florida Turnpike Counts and MPO Travel Data .............................................. 41
3.5.2 Air ................................................................................................................................................ 43
3.5.3 Rail ............................................................................................................................................... 44
3.5.3.1 Long Distance Rail (Amtrak) .................................................................................................... 44
3.5.3.2 Commuter Rail (Tri‐Rail) .......................................................................................................... 44
3.5.4 Bus Trips ...................................................................................................................................... 45
3.5.5 Annualization .............................................................................................................................. 46
3.5.6 Consideration of Auto Captives .................................................................................................. 47
4. Primary Market Research and Analysis ....................................................................................... 48
4.1 Overview of Market Research Objectives ....................................................................................... 48
4.2 Origin‐Destination Survey ............................................................................................................... 48
4.2.1 Overview of Methods ............................................................................................................. 48
4.2.2 Survey Design .......................................................................................................................... 49
4.2.3 Sampling Plan and Administration .......................................................................................... 49
4.2.4 Data Overview ......................................................................................................................... 50
4.2.5 Data Preparation ..................................................................................................................... 52
4.3 Stated Preference Survey................................................................................................................ 56
4.3.1 Overview of Methods ............................................................................................................. 56
4.3.2 Survey Design .......................................................................................................................... 56
4.3.3 Survey Testing ......................................................................................................................... 64
4.3.4 Sampling Plan and Survey Administration .............................................................................. 64
4.3.5 Summary of Key Data Tabulation & Frequencies ................................................................... 66
4.3.6 Trading Analysis ...................................................................................................................... 84
5. Travel Demand Model Development .......................................................................................... 86
5.1 Discrete Choice Analysis/Model Estimation ................................................................................... 86
5.1.1 Conceptual Overview .................................................................................................................. 86
5.1.2 Summary of Model Estimation Process ...................................................................................... 89
5.1.2.1 Long Distance Model............................................................................................................... 89
5.1.2.2 Short Distance Model ............................................................................................................. 93
5.1.3 Model Estimation Results ........................................................................................................... 94
5.2 Model Application Overview .......................................................................................................... 95
5.3 Level of Service Assumptions .......................................................................................................... 96
5.3.1 Auto ............................................................................................................................................. 96
5.3.1.1 Highway Travel Times ............................................................................................................. 96
Case 1:15-cv-00632-CRC Document 21-2 Filed 05/28/15 Page 5 of 154

All Aboard Florida Ridership and Revenue Study
May 7, 2015
Page v
5.3.1.2 Highway Travel Costs .............................................................................................................. 97
5.3.2 Bus ............................................................................................................................................... 98
5.3.3 Existing Rail ................................................................................................................................. 99
5.3.4 Air Travel ................................................................................................................................... 100
5.3.5 AAF service ................................................................................................................................ 100
5.3.6 Station Access and Egress ......................................................................................................... 101
5.3.6.1 Access and Egress Travel Time .............................................................................................. 101
5.3.6.2 Access and Egress Cost ......................................................................................................... 102
5.4 Model Calibration ......................................................................................................................... 104
5.4.1 Long Distance Model Calibration .............................................................................................. 105
5.4.2 Short Distance Model Calibration ............................................................................................. 105
6.0 Ridership and Revenue Forecast Findings ............................................................................. 107
6.1 Overall Level of Ridership and Revenue ....................................................................................... 107
6.1.1 Ramp‐Up .............................................................................................................................. 109
6.1.2 Methodological Overview .................................................................................................... 109
6.2 Fare Revenue Estimation and Optimization ................................................................................. 110
6.2.1 Fare Sensitivity Analysis ....................................................................................................... 110
6.2.2 Premium Service Amenity Pricing ........................................................................................ 113
6.3 Network Model Ridership & Revenue Forecasts .......................................................................... 117
6.3.1 Market Capture and Compatibility with Existing Modes of Travel ...................................... 117
6.3.2 Auto Captives Ridership Adjustment ................................................................................... 120
6.3.3 Additional Sensitivity Tests ................................................................................................... 120
6.3.3.1 In‐Vehicle Travel Time ...................................................................................................... 120
6.3.3.2 Frequency of Service ........................................................................................................ 121
6.3.3.3 Access/Egress Travel Time ............................................................................................... 121
6.3.3.4 Access‐Egress Cost ........................................................................................................... 122
6.3.3.5 Auto IVTT .......................................................................................................................... 122
6.3.3.6 Auto Fuel Prices ................................................................................................................ 123
6.3.3.7 Air Fares ........................................................................................................................... 123
6.3.3.8 Parking and Shuttle Fees .................................................................................................. 123
6.3.4 Ridership Forecast Level‐of‐Service Assumptions ............................................................... 124
6.3.4.1 Highway Congestion Growth ........................................................................................... 124
6.3.4.2 Transit Connectivity Impacts ............................................................................................ 125
6.3.5 Induced Ridership ................................................................................................................ 125
Case 1:15-cv-00632-CRC Document 21-2 Filed 05/28/15 Page 6 of 154

All Aboard Florida Ridership and Revenue Study
May 7, 2015
Page vi
6.4 Additional Ridership Sources ........................................................................................................ 126
6.5 Overall Forecast Summary ............................................................................................................ 128
6.5.1 Forecast Growth Comparison .............................................................................................. 131
6.6 Segment Loading and Boardings & Alightings .............................................................................. 132
6.8 Uncertainty and Forecast Risk ...................................................................................................... 134
7.0 Conclusion ............................................................................................................................ 135
List of Acronyms .............................................................................................................................. 136
Case 1:15-cv-00632-CRC Document 21-2 Filed 05/28/15 Page 7 of 154

All Aboard Florida Ridership and Revenue Study
May 7, 2015
Page ES‐1
ExecutiveSummary
Introduction
Florida East Coast Industries, Inc. (FECI) commissioned The Louis Berger Group, Inc. (LBG) to develop an investment grade ridership and revenue forecast for the re‐introduction of passenger rail service on its existing right of way. The proposed new passenger rail service, named All Aboard Florida (AAF), will be a privately owned and operated, intercity service that is intended to initially connect key cities in Southeast Florida (Miami, Fort Lauderdale, and West Palm Beach) with Orlando in Central Florida.
Each year, travelers make hundreds of millions of trips between the communities in Southeast and Central Florida that will be served by AAF, making the region one of the most actively traveled areas in the United States. The proposed AAF service will operate on a corridor running directly through some of the most densely populated communities in the State of Florida with stations located proximate to major sites and connected to local transit hubs (bus, commuter rail, etc.).
The introduction of a new passenger rail system to serve the Miami‐Orlando corridor has been carefully studied in the past by a number of public agencies and has long been recognized as a viable and needed service given the scale and demographics of the region, level of travel activity and the existing and growing congestion on Florida’s highways. Southeast Florida is the fourth most populous urbanized region in the U.S. The City of Orlando is the most visited city in the nation while Miami is home to the world’s largest cruise port and the travel gateway to Latin America. However, no intercity rail alternative comparable to the proposed AAF service exists currently. These factors, together with several of the key findings by LBG in conducting this study, support the potential for substantial ridership for the proposed AAF service.
All Aboard Florida System
Case 1:15-cv-00632-CRC Document 21-2 Filed 05/28/15 Page 8 of 154

All Aboard Florida Ridership and Revenue Study
May 7, 2015
Page ES‐2
ExecutiveSummary(continued)
Summary of Key Findings and Estimated Ridership
With frequent service between city centers within the corridor, AAF offers the prospect of substantial time savings to current users of auto, bus, traditional rail and even air. To determine how these time savings would alter travel behavior and generate ridership and revenue for AAF, LBG undertook a detailed examination of current travel activity and behavior, and conducted surveys that determined traveler preferences and willingness to pay. Best practices in discrete choice analysis and travel network modeling were employed and findings were tested and referenced to previous studies. The investment grade forecasts prepared for this feasibility study were intended to be conservative in nature. The analysis revealed that introduction of AAF service would complement existing modes of travel and draw a substantial number of business and non‐business travelers.
Key Findings
The thorough study effort resulted in the following key findings:
Substantial “Addressable Market” – Hundreds of millions of trips are taken annually between the four cities that will be served by AAF. LBG’s study included a determination of the portion of these total trips that both originate and terminate within a defined distance of a proposed AAF station (a station “catchment area”). The AAF addressable market is assumed to include only those trips beginning and ending within station catchment areas. Based upon detailed analysis, LBG concluded that the addressable market for AAF intercity service amounts to over 110 million trips made by individuals annually1.
Challenging Intercity Trip – At a distance of approximately 230 miles, the journey from Orlando to Miami is relatively short for air travel (with total air travel time disproportionately long for the distance given airport security and delays); and relatively long for an auto trip, where traffic congestion can make the four to five hour trip unpleasant and unreliable. Travel volumes on key highways connecting Central and Southeast Florida are expected to exceed capacity by 2030, resulting in further delays and reduction in reliability.
Demonstrated Market Travel Growth – Intercity travel on the Florida Turnpike between Orlando and Miami has grown by an average of 3.5 percent per year since 2000 and air travel between these cities has seen annual growth of 3.2 percent during the same period. LBG long‐term growth rates for the AAF system are conservative and are below these historical travel levels.
Demonstrated Market Demographic Growth – In the past 30 years, population in the market area has grown by an annual average of 2.5 percent and employment has grown by an annual average of 3 percent. Within one mile of proposed AAF stations, annual population growth has ranged from 2 percent to 5 percent since 1990 indicating strong growth in the urban core at the heart of the AAF alignment.
No Comparable Service – AAF can provide travel time savings of 25% to 50% when compared to existing surface modes (auto, bus and rail) and with a journey time of around three hours from Orlando to Miami is competitive with air on door‐to‐door travel times. There is no comparable service to AAF for intercity travel in the existing market.
1 Addressable market is comprised of trips over 40 miles (50 million trips annually) and trips under 40 miles (60 million trips annually)
Case 1:15-cv-00632-CRC Document 21-2 Filed 05/28/15 Page 9 of 154

All Aboard Florida Ridership and Revenue Study
May 7, 2015
Page ES‐3
Established Willingness to Pay – The optimized fares estimated in this study are highly competitive with existing modes of travel when time, tolls, and travel costs are considered and are comparable to other successful rail services in the U.S.
Long‐Standing Interest – Given the profile of the travel market and the central location of the rail line, there has been interest among stakeholders and the public in developing passenger service on the Florida East Coast corridor for decades.
Estimated Ridership
In connection with the investment grade evaluation, LBG prepared estimates for annual ridership and farebox revenue. This forecast accounts for all elements important to future ridership potential including targeted market segments and induced ridership. LBG identified critical assumptions subject to varying levels of uncertainty and developed a series of sensitivity tests in order to test the impact of uncertainty on the ridership and revenue forecasts. These sensitivity tests are summarized in Section ES‐5. The ridership and revenue is summarized in the table below for 2020, the first year after stabilized ridership is achieved. This forecast comprises of service between each of the three stations in south Florida (Short Distance trips) and trips from the stations in south Florida to Orlando (Long Distance trips).
AAF Ridership and Revenue Forecast, 2020 (2012 $)
2020 Forecast
Short Distance (1) Long Distance (2) Total
Ridership: 2,813,200 2,534,100 5,347,300
Fare Revenue: $64,143,400 $229,436,300 $293,579,700
(1) Short distance trips = Miami ‐ Ft. Lauderdale, Miami‐West Palm Beach, Ft. Lauderdale ‐ West Palm Beach
(2) Long distance trips = Southeast Florida – Orlando
AAF Annual Ridership Forecast, 2017‐2030
Case 1:15-cv-00632-CRC Document 21-2 Filed 05/28/15 Page 10 of 154

All Aboard Florida Ridership and Revenue Study
May 7, 2015
Page ES‐4
AAF Fare Revenue Forecast, 2017‐2030 (2012 $)
As shown in the forecast charts presented above, we expect ridership and revenue for the initial years of AAF to start at relatively low levels and grow to a stabilized volume after three years. This reflects a conservative assumption for “ramp‐up,” a period of time during which ridership is building up to long‐term forecast levels as travelers become acquainted with the new rail service and adjust their trip‐making habits. To ensure a conservative approach to estimation of initial year ridership and revenue, LBG assumed a three year ramp‐up period: the first year at 30 percent of forecasted volumes, second year at 60 percent, and third year at 80 percent of the forecast. This assumption is consistent with previous rail service forecasts in Florida. The forecasts include the assumption that Short Distance rail service will not be fully operational until the second quarter of 2017, and Long Distance revenue service will begin in fourth quarter 2017.
The forecasts include induced ridership demand. Introduction of a new mode of travel, particularly premium rail service which is more convenient and improves travel time, can often encourage travelers to make trips they may not have made in the absence of the new service. This is called induced ridership. Previous studies have found that the introduction of intercity rail service can result in levels of induced travel ranging from 5 percent to 30 percent. The highest levels of induced travel have been observed on high speed rail services serving multiple markets over distances of 200 to 500 miles. LBG’s evaluation of induced ridership in the forecast for AAF estimates the potential for a 20 percent increase in AAF ridership that has been included in our estimate for 2020.
Estimated Market Share
The forecast shows that the addition of the AAF service will complement the existing modes of travel between core locations in Florida. Station locations offered by AAF in Miami, Ft. Lauderdale, West Palm Beach, and Orlando will provide an alternative source of transportation for travelers with origins or destinations at or near these urban cores.
The forecast indicates that after the initial ramp up period, AAF will serve approximately 10 percent of the overall market for travel between Southeast Florida and Central Florida—the Long Distance market, which is expected to comprise the largest portion of AAF revenues. In the Short Distance market, AAF will serve approximately 1.2 percent of the overall market.
Case 1:15-cv-00632-CRC Document 21-2 Filed 05/28/15 Page 11 of 154

All Aboard Florida Ridership and Revenue Study
May 7, 2015
Page ES‐5
AAF Long Distance Market Share and Ridership Composition, 2020
AAF Short Distance Market Share and Ridership Composition, 2020
ES‐1OverviewoftheInvestmentGradeStudyProcess
An investment grade ridership study is one of the most rigorous and thorough forecasting processes. Investment grade studies are common in the finance and project development industries. Below is a summary of the key characteristics of LBG’s investment grade process:
New Primary Source Research – Over 1,800 stated‐preference surveys and 10,800 origin and
destination surveys were conducted to confirm travel behavior, preferences, and willingness to
pay.
Independent approach – The forecasting model was constructed from the bottom up using data gathered from regional planning agencies, stakeholder organizations, and recognized commercial sources.
Accepted methods – Best practices in discrete choice analysis and network travel demand modeling were employed.
Case 1:15-cv-00632-CRC Document 21-2 Filed 05/28/15 Page 12 of 154

All Aboard Florida Ridership and Revenue Study
May 7, 2015
Page ES‐6
Critical evaluation of economic growth assumptions – Outlook for growth in travel market was carefully evaluated and conservative assumptions were adopted.
Thorough documentation – The study details the data collection, evaluation, and forecasting procedures.
Benchmarking and validation – Forecast assumptions and findings were validated against previous reports. Alternative mode choice models were developed and evaluated against known travel patterns.
Sensitivity Testing – LBG recognizes that forecast assumptions are subject to varying levels of uncertainty. Sensitivity tests were conducted on the ridership and revenue forecast in order to evaluate the extent to which the uncertainty could impact the forecasts.
ES‐2StudyPurposeandObjective
Planning for implementation of AAF service in Southeast and Central Florida is well advanced. Environmental permitting is complete and construction has begun in the southern portion of the rail corridor. Operations planning have been conducted, station program development and design are underway and environmental review is in process on the remaining portion of the corridor. At this phase in the project development process, a thorough understanding of demand potential can contribute to the finalization of business planning activities that are underway. The objective of this study is to provide FECI with an independent overview of ridership and revenue that will inform and advance the project planning efforts and decisions of potential investors and funding partners.
The study follows the objectives of an investment grade evaluation appropriate for project planning and development. It includes new primary source research for the understanding of travel patterns and travel behavior; a critical evaluation of input assumptions; and demonstration of the sensitivity of the forecast to those assumptions. A summary description of the study design and how it meets the objectives of an investment grade evaluation is presented in this executive summary.
ES‐3StudyProcess
To determine the extent and magnitude of the demand for a new mode of travel between Central Florida and Southeast Florida, LBG undertook a thorough assessment of the existing and potential future intercity travel market, the attributes of the current modes of travel in the corridor, and prospects for future growth. The study included the following key activities.
Research to Establish Market Size and Catchment Area – Residents and visitors to cities in the corridor make millions of trips per year, but only a select portion of these trips involve travel between the central business districts and surrounding activity centers that would be served by AAF stations. To identify the addressable market, LBG gathered extensive data on current levels of travel by auto, rail, air, and bus; and several sources of information on traveler origin and destination patterns. The research established a market of over 110 million intercity trips per year in areas reasonably served by the stations2. These findings on the size and characteristics of
2 Addressable market is comprised of trips over 40 miles (50 million trips annually) and trips under 40 miles (60 million trips annually)
Case 1:15-cv-00632-CRC Document 21-2 Filed 05/28/15 Page 13 of 154

All Aboard Florida Ridership and Revenue Study
May 7, 2015
Page ES‐7
the market are consistent with previous studies undertaken for rail projects in Florida, and provide a conservative base for the demand forecast.
Identification of Travel Network and Competing Modes of Travel – The demand forecasting process also requires a thorough understanding of the travel network and the schedule, journey time, and cost attributes of all modes of travel using the network. This report outlines the assumptions and data sources LBG used to establish the highway, rail, and air travel network. The report also documents the attributes of each mode of travel used as inputs to the demand forecast.
Assessment of the Prospect for Growth in Travel – An investment grade forecast requires thorough examination of the prospect for growth in the overall travel market. By gathering data from regional transportation planning agencies and other accepted public and commercial sources, LBG established conservative and reasonable growth rates for the overall market based on observed trends in each segment. Based on observed trends in each of the metropolitan regions within the corridor, LBG expects the overall number of intercity trips to grow by 1.7 percent per year.
Primary Research on Traveler Preferences and Willingness to Pay – When travelers choose to make a journey by auto or by rail they weigh the time and money cost of travel and make a choice based in part on their travel budget and willingness to pay. Travel behavior is also influenced by trip purpose (e.g., business, leisure, commute, airport access) and other factors such as party size and need for a vehicle at the destination. The AAF
system is an entirely new type of service for the region whose unique features can only be tested in hypothetical scenarios that pit AAF against other competing modes. The current state‐of‐the‐practice uses mode choice Stated Preference surveys (SP) as the basis for understanding how individuals (or groups of individuals) value individual attributes, such as access time, in‐vehicle travel time, headways, and cost ‐ of a transportation choice.
Demand Forecasting – The LBG study team employed best practices in discrete choice analysis and network travel demand forecasting to determine diversions from existing modes of travel to AAF and ridership volumes on the AAF system by city‐pair segment. SP survey data was used to develop estimates of the AAF market share and is the basis of the AAF ridership forecast.
Sensitivity Testing – The report provides the findings of sensitivity tests demonstrating the effect of changes in key forecast assumptions (e.g., AAF fare prices) on ridership and revenue. These sensitivity tests are used to establish the stability of the forecast model and inform project planning.
Figure ES‐4: Stated Preference Survey ‐ The study featured a Stated Preference survey to determine information on travel patterns, preferences, and traveler willingness to pay for travel time savings.
Case 1:15-cv-00632-CRC Document 21-2 Filed 05/28/15 Page 14 of 154

All Aboard Florida Ridership and Revenue Study
May 7, 2015
Page ES‐8
ES‐4KeyAssumptions
To develop a conservative approach for forecasting AAF ridership that is appropriate for evaluation by lenders and investors during the planning stage of project development, the study team made several key assumptions for the Base Case. As planning for the project advances, these assumptions are likely to be altered or enhanced resulting in further refinement of the ridership and revenue forecast. To reflect the full potential for enhancements to ridership, LBG has been commissioned to provide FECI with a separate Business Plan Case forecast reflecting all aspects of the AAF team’s business planning. The conservative assumptions used in the Base Case presented in this report, include the following:
The forecast study area is limited to the extent of the metropolitan areas in Central and Southeast Florida. Transfer connections to existing transit and bus services are assumed but future connections such as Sun Rail in Central Florida may enhance AAF ridership.
The forecast team utilized a base year and future year auto travel trip table prepared on behalf of a third party for general application in the study of interregional projects in the I‐95 corridor including Florida. The study team has evaluated the base year trip table by comparing it to traffic counts on intercity roadways, and to the findings of a survey implemented for this study. These comparisons were undertaken to ensure that the trip data used in this study is consistent with the origin and destination patterns as they currently exist in the corridor. The information was compared further to data maintained by regional planning agencies to ensure consistency in assumptions for current conditions and the potential for trip growth anticipated for the corridor. Trips tables for other modes of travel were based on information obtained from relevant planning agencies and operators.
Station market catchment areas and trip filters were developed to establish reasonable boundaries for the addressable market and to eliminate illogical station access patterns. As described in Section 3, this is the basis for establishing the size of the candidate market at over 15 million trips per year for the long‐distance journey between Orlando and the three cities in Southeast Florida. When trips between the three cities in Southeast Florida are considered along with trips between Southeast Florida and Orlando, the number grows to over 110 million.
A fare optimization analysis was conducted to determine the appropriate fare level for the revenue analysis. All fares and competing mode costs were fixed in real terms. For purposes of estimating the future cost of auto travel, gas prices were set at $4 (based on U.S. Energy Information Administration (EIA) reference case forecast).
Growth in the future auto travel market was assumed to keep pace with the regional outlook on population and household growth. LBG took the conservative assumption that any growth in income would not be considered in trip making. LBG utilized the official forecasts of Amtrak, Tri‐Rail and the Federal Aviation Administration for rail and air modes of travel. These are conservative assumptions for growth outlook that are based on current fundamentals of the travel market. Future growth in income that outpaces the demographic rate of change, would most likely result in increased intercity travel overall and increased ridership for AAF in particular.
The estimation of the future travel market, does not include any changes in the location of households or employment related to transit‐oriented development in the areas surrounding the stations.
Case 1:15-cv-00632-CRC Document 21-2 Filed 05/28/15 Page 15 of 154

All Aboard Florida Ridership and Revenue Study
May 7, 2015
Page ES‐9
Congested auto travel times were accounted for in estimating station access and long‐distance auto travel times. Given the history of growth in highway congestion and challenges in expanding the highway network, regional planners consider it likely that congestion within and between the regions will increase, making non‐highway modes of travel more competitive.
AAF presents users with a premium service unlike any other service in the State of Florida. It is often the case that Stated Preference surveys which underlie the mode choice model and forecast do not fully capture the value that users attribute to the premium nature of services such as AAF. Our survey research and fare price benchmarking was designed to compensate for this providing the basis for a comprehensive view on traveler willingness to pay.
AAF management has a detailed and robust business development and marketing initiatives underway to establish cooperative arrangements with travel providers, travel arrangers, and key tourist and convention markets. LBG independently evaluated these initiatives and accounted for ridership and revenue based on expected fares for the key market segments targeted in order to reflect the full potential for expansion of the travel market with the introduction of a new mode of travel.
Induced demand potential was based on a method of evaluating the improvement in the generalized cost of travel that has been accepted in other studies for high speed transportation in the U.S. As a novel form of transportation in Florida, AAF is likely to experience ridership demand for tourism and leisure travel based on its convenience and amenities.
ES‐5ForecastSensitivityTesting
LBG conducted a variety of sensitivity tests to identify sources of forecast risk and evaluate the Base Case Forecast. Key findings include the following.
Overall, a decrease in AAF running time of 10 percent (i.e., a reduction of 20 minutes in the running time from Miami to Orlando) could be expected to result in an increase of just over 7 percent in ridership. In the SEF market a similar decrease of 10 percent in run time (7 minutes) would result in a 5 percent increase in ridership. Should the running time need to be increased from the levels assumed in this study, a similar magnitude of decrease in ridership could be expected.
An increase in the frequency of service by 20 percent (over the one departure per hour base assumption) would be expected to result in a 5.4 percent increase in ridership in the Miami to West Palm Beach short distance market, and a 1.4 percent increase for the longer distance city pairs.
An increase in the amount of time to access an AAF station by 20 percent for long distance travel (due, for example, to congestion on local roadways) would be expected to result in an 8 percent decrease in ridership. For travelers making trips on AAF within Southeast Florida the impact would be greater: a 13 percent decrease in ridership.
For long distance intercity travel, an increase in the cost of accessing an AAF station by 20 percent (attributable to an increase in gas prices or feeder transit fares) would be expected to result in a 2.5 percent decrease in ridership. Access cost is more important for short distance travelers and a similar increase in access cost would result in a 7 percent decrease in ridership.
Case 1:15-cv-00632-CRC Document 21-2 Filed 05/28/15 Page 16 of 154

All Aboard Florida Ridership and Revenue Study
May 7, 2015
Page ES‐10
For long distance travel, an increase in auto travel time of 20 percent (attributable to an increase in intercity and intracity roadway congestion in the region) would be expected to result in an 8 percent increase in AAF ridership. For the short distance market where journey times are lower, the increase in AAF ridership would be 4 percent. If the increase in travel time were only to apply to intercity auto travel (in a scenario with heavy congestion on freeways but with little change in access times to stations via local roadways, for example), the increase in AAF ridership would be 16 percent in the long distance market and 12 percent for short distance riders.
An increase in fuel prices of 20 percent would be expected to result in a 1.4 percent increase in AAF ridership for both long and short distance markets. Should AAF fares also increase to pass on the cost of higher AAF fuel related operating costs, there would likely be no net increase in ridership.
An increase in air fares of 20 percent would be expected to result in a 1.7 percent increase in AAF ridership. Should air fares decrease by a similar magnitude, a decrease in AAF ridership of 2.6 percent would be expected.
Case 1:15-cv-00632-CRC Document 21-2 Filed 05/28/15 Page 17 of 154

All Aboard Florida Ridership and Revenue Study
May 7, 2015
Page 1
1. Introduction
This section of the AAF Investment Grade Ridership and Revenue Report, presents a summary of study objectives and methods, along with an overview of the proposed AAF service and the existing travel market.
1.1 InvestmentGradeStudyObjectivesandCriteria
The ridership and fare revenue forecasts presented in this report are characterized as being investment‐grade with respect to accuracy, reliability and credibility. The integrity of the study is underpinned by the following key features:
The use of independent and experienced travel demand forecasting consultants.
Surveys designed to measure characteristics of existing intercity travel demand in Southeast Florida.
A critical assessment of economic growth projections that are used to estimate the overall increase in travel demand.
The development of a forecasting model for AAF based on current travel, transport system and economic growth data.
The adoption of conservative assumptions regarding factors affecting AAF usage.
Alternative model estimates (sensitivity testing) intended to quantify the impacts of different assumptions of key forecasting inputs on forecast results.
Emphasis on near term forecasts—investment decision makers commonly place greater emphasis on the early years of operation than the later years (which include growth that is expected, but not certain, to occur).
The key features noted above ensure highly reliable forecasts. However, it is not possible to forecast future events with certainty. Assumptions regarding economic growth, competition between modes and external factors affecting overall travel demand and AAF usage may prove inaccurate. Changes from these assumptions could produce lower or higher ridership than the estimates contained in this report. Outputs of the investment‐grade forecast that were used to determine the economic, financial, and business planning dimensions of the proposed investment include the following:
Overall ridership demand estimates
Station‐station segment ridership estimates
Market share analysis
Market breakdown by user type (business/non‐business, etc.)
Ridership demand elasticity with respect to fare
Ridership demand with respect to level of service
User benefit metrics (values‐of‐time)
Case 1:15-cv-00632-CRC Document 21-2 Filed 05/28/15 Page 18 of 154
All Aboard Florida Ridership and Revenue Study
May 7, 2015
Page 2
LBG segmented its technical approach and analysis into five distinct areas of study outlined below. Each of these study areas are discussed in greater detail within their respective chapters of this report.
Review of previous studies and relevant literature (Section 2)
Market assessment (Section 3)
Primary market research – stated preference survey, supplemental survey, origin‐destination survey (Section 4)
Travel demand model development and calibration (Section 5)
Ridership and revenue analysis (Section 6)
The peer review process utilized for this report is summarized in Section 7 and the study conclusions are discussed in Section 8. Additional supporting information on the survey research is presented in Appendix A.
1.2 SummaryofDataSourcesandMethods
To estimate ridership demand for the All Aboard Florida service, LBG undertook a thorough assessment of the existing and potential future intercity travel market, the attributes of the current modes of travel in the corridor, and prospects for future growth. Key research activities included:
Determine Market Size. The LBG study team reviewed existing data sources on intercity trips between Central Florida and Southeast Florida and within Southeast Florida and conducted an Origin and Destination survey to determine the size of the market as well its potential for future growth.
Primary Research on Traveler Preferences. In line with the current state‐of‐the‐practice, the LBG study team used mode choice Stated Preference surveys (SP) as the basis for understanding how individuals (or groups of individuals) value individual attributes, such as access time, in‐vehicle travel time, headways, and cost ‐ of a transportation choice
Demand Forecasting. The LBG study team employed best practices in discrete choice analysis and network travel demand forecasting to determine diversions from existing modes of travel to the All Aboard Florida service and ridership volumes on the All Aboard Florida service by city‐pair segment. SP survey data was used to develop estimates of the All Aboard Florida service market share and is the basis of the ridership forecast. Sensitivity tests demonstrate the effect of changes in fare and other forecast assumptions on All Aboard Florida ridership and revenue.
Case 1:15-cv-00632-CRC Document 21-2 Filed 05/28/15 Page 19 of 154

All Aboard Florida Ridership and Revenue Study
May 7, 2015
Page 3
1.3 OverviewofAllAboardFlorida Florida East Coast Industries, Inc. (FECI) commissioned The Louis Berger Group, Inc. (LBG) to develop an investment grade ridership and revenue forecast for the re‐introduction of passenger rail service along the existing right‐of‐way currently used for freight rail operations by an affiliate, Florida East Coast Railway. The proposed new passenger rail service, named All Aboard Florida (AAF), will be a privately owned and operated, intercity passenger rail service that is intended to connect the three key cities in Southeast Florida (Miami, Fort Lauderdale, and West Palm Beach) with Orlando in Central Florida. The service will follow the design and operations plan of other successful intercity rail passenger services, providing all reserved coach and business class seating, on board wireless internet service, food service and related amenities. With a journey time of just over three hours the service will provide an important complement to existing modes of travel in the corridor. The central locations of proposed AAF stations offer the potential for good connectivity to existing and proposed bus, commuter rail, and streetcar systems in Southeast Florida and Central Florida including Metrorail, Metromover, Tri‐Rail, Broward County Transit, The WAVE Streetcar, and SunRail. The project development team is exploring plans to optimize connectivity to these transit systems and is also evaluating the provision of dedicated shuttles to meet the AAF trains.
1.4 OverviewoftheRelevantTravelMarketThe proposed service would provide an alternative mode option for travel between major cities in the Southeast Florida, as well as for travel from Southeast Florida to Central Florida. With a population of 5.56 million in 2010, the South Florida metropolitan area is the most populous metropolitan area in the Southeastern United States and the eight most populous metro area in the United States.3 Main cities include Miami, Fort Lauderdale, Pompano Beach, West Palm Beach, and Boca Raton. Miami
3 U.S. Census Bureau, 2010.
Figure 1.3‐1: Proposed Route and Stations
Case 1:15-cv-00632-CRC Document 21-2 Filed 05/28/15 Page 20 of 154

All Aboard Florida Ridership and Revenue Study
May 7, 2015
Page 4
International Airport is the busiest airport in Florida (35.7 million4 passengers in 2010) and ranks second in the United States in terms of international passenger count, with 1.5 million international passengers annually.5 Central Florida’s main city, Orlando, and the surrounding Greater Orlando region attracted 51 million visitors in 2010.6 Attractions include Walt Disney World Resort, Universal Orlando Resort and SeaWorld Parks & Entertainment. Convention and trade show attendance at the Orange County Convention Center, in 2011 equaled 1 million. Orlando International Airport, a station location, is the second busiest airport in Florida after Miami International Airport with 34.9 million passengers in 2010. Orlando’s secondary airport, Orlando Sanford International Airport had 1.7 million passengers in 2010 while cruise traffic at Port Canaveral accounted for 2.8 million passengers.
A total of 17.4 percent of overseas7 non‐resident travelers enter the United States through one of the main South Florida and Central Florida airports: Miami International Airport (12.4 percent); Orlando International Airport (3.2 percent) and Fort Lauderdale International Airport (1.7 percent).
Auto vehicles are the dominant mode of intercity travel between Orlando and Miami. The two main routes between the cities are the I‐95 and the Florida Turnpike. Free‐flow driving times between both cities are estimated at approximately 4 hour 15 minutes along the I‐95 and at 3 hour 50 minutes along the Florida Turnpike, which is a toll road.8 Travel times during congested peak periods can be substantially greater.
Air, rail and bus account for a small proportion of trips between the Orlando and Miami. While there are more than 30 flights a day between Orlando International Airport and Miami International Airport/Fort Lauderdale‐Hollywood International Airport, when eliminating connecting passengers, the annual number of air passengers is limited. Recently, Southwest made the decision to cease service to Fort Lauderdale given the cost considerations of operations on a short‐haul route.9 Two AMTRAK trains, the Silver Meteor and the Silver Star, each run once daily between Orlando and Southeast Florida. The Silver Meteor, which is the fastest because it does not make a detour to Tampa, takes about 3 hour 45 minutes from Orlando to West Palm Beach and 5 hours 45 minutes from Orlando to Miami. In addition, there are a few private bus companies that operate several buses daily between Orlando and Southeast Florida along the Florida Turnpike.
Travel within Southeast Florida is also mostly by automobile. Between Miami and West Palm Beach the Florida Turnpike runs parallel with I‐95. Driving from Miami to West Palm Beach takes about 1 hour 17 minutes on the I‐95 and 1 hour 27 minutes on the Turnpike.10 Driving time between Miami and Fort Lauderdale is about 35 minutes while the drive from Fort Lauderdale to West Palm Beach takes about 50 minutes. During congested peak periods it is not uncommon for these travel times to increase by 30 to 50 percent due to incidents or weather making journey and arrival times during these key periods unreliable. The main alternative mode of transportation is rail. Tri Rail, a commuter rail line run by the
4 http://www.airports.org/cda/aci_common/display/main/aci_content07_c.jsp?zn=aci&cp=1‐5‐54‐55_666_2__ 5 http://www.airports.org/cda/aci_common/display/main/aci_content07_c.jsp?zn=aci&cp=1‐5‐212‐1376_666_2__ 6 http://corporate.visitorlando.com/research‐and‐statistics/research‐summary/ 7 Overseas travelers include all international except Canada and Mexico. 8 Google Maps 9 Florida News Journal, July 17, 2012. 10 Google Maps
Case 1:15-cv-00632-CRC Document 21-2 Filed 05/28/15 Page 21 of 154

All Aboard Florida Ridership and Revenue Study
May 7, 2015
Page 5
South Florida Regional Transportation Authority (SFRTA) links Miami, Fort Lauderdale, and West Palm Beach. The 71‐mile line has 18 stops and an annual ridership of 3.6 million.
According to Texas Transportation Institute’s 2010 Urban Mobility Report, Central and South Florida highways are the most congested in the State, which results in millions of hours of travel delay and excessive fuel consumption and pollutant emissions. State and local agencies have been active in evaluating alternatives to the severe congestion on north‐south roadway links. In June 2010, FDOT prepared the I‐95 Transportation Alternatives Study, in consultation with the Department of Law Enforcement, the Department of Environmental Protection, the Division of Emergency Management, the Office of Tourism, Trade and Economic Development and affected MPOs and regional planning councils located along the corridor. The study, which provides an assessment of concerns and proposed solutions related to I‐95, found that “I‐95 is overwhelmed with traffic demand” and that “[t]ravel within specific urban areas along the I‐95 corridor is highly congested in peak travel periods due to single driver automobile use.” This study concluded, among other things, that “[p]assenger rail service presents a mobility option to serve Florida’s East Coast along the I‐95 corridor” with multiple benefits including the reduction of “fossil fuel use and greenhouse gases (GHGs); job creation and economic development around station locations; and, better connectivity between northern and southern sections of Florida.”
The potential for intercity rail as a viable alternative has long been recognized by many, including FDOT, which developed the Florida Intercity Passenger Rail “Vision Plan” (FDOT, August 2006). Among other things, the plan found that the state’s intercity travel market would grow from slightly more than 100 million trips in 2006 to nearly 200 million trips by 2020, and 320 million trips by 2040 (FDOT, August 2006). This increase will exacerbate existing transportation problems and require significant development of new infrastructure to meet the needs of this market. In June 2009, FDOT released the 2009 Florida Rail System Plan: Policy Element (FDOT, March 2009), which updated the 2006 Florida Freight and Passenger Rail Plan and built upon previous rail planning efforts, including the 2006 Florida Intercity Passenger Rail Vision Plan to show that:
There is a rising public interest in rail options to meet intercity and regional mobility needs;
The existing congestion on Florida’s highways may be mitigated by a passenger rail alternative, which would also serve to increase the mobility of tourists, business travelers, and citizens – especially older Floridians; and
Reliance on alternate transit options is expected to increase in light of growing concerns over dependence on foreign oil, fluctuating gas prices, and fuel supply disruptions as a result of natural disasters.
1.5 ReviewofPreviousStudiesRecognizing that rail service could complement existing transportation infrastructure and work to relieve congestion and promote mobility and economic development, the state and private parties have undertaken studies of rail implementation. This section provides an overview of those studies most relevant to a forecast for a study of AAF ridership and revenue and demonstrates the how the AAF forecast is generally consistent with these previous efforts in terms of methods, size of the addressable travel market, and overall ridership and revenue forecast findings.
Case 1:15-cv-00632-CRC Document 21-2 Filed 05/28/15 Page 22 of 154

All Aboard Florida Ridership and Revenue Study
May 7, 2015
Page 6
1.5.1 FloridaOverlandExpress(FOX)Following the mandate received under The High Speed Rail Act of 1992, FDOT entered into a public‐private partnership with Florida Overland Express (FOX), a private international consortium of engineering, construction and rail equipment companies, to develop a high speed rail system linking Tampa‐Orlando‐Miami. While the state withdrew support and the project was cancelled in 1999, the FOX ridership studies provide useful information for the current study. The FOX service was subject to several studies including:
Florida Overland Express Intercity Travel Survey (1997) by Transportation Consulting Group
Ridership and Revenue Study – Florida Overland Express (1998) by SYSTRA
Florida Overland Express High Speed Rail Study ‐ Final Ridership and Revenue Report (1998) by
KPMG Peat Marwick
KPMG Peat Marwick and SYSTRA developed independent ridership forecasts for 2005‐2044 under three possible FOX alignments. In developing their forecast, the firms used a database of existing intercity travel volumes, mode shares, traveler characteristics and socioeconomic data that was developed at the start of the study. The database development was supported by an extensive primary data collection effort, including highway and airport user surveys and focus group sessions. Upon completion of the independent ridership forecasts, the forecasts were reconciled into one forecast for each of the three alignments.
As outlined in Table 1.5.1, the size of the addressable market estimated for 2010 in the FOX study is substantially similar to the size of the market we use as the basis for the forecast in this study.
Table 1.5‐1 – FOX Ridership and Revenue Study Estimate of Intercity Person Trips
1997 Base Year 2010 Forecast Year
Auto Air Auto Air
Long distance trips (100 miles or more)
Central Florida – Palm Beach 2,756,000 186,000 4,651,000 301,000
Central Florida – Southeast Florida 6,068,000 1,391,000 9,394,000 2,182,000
Short distance trips (less than 100 miles)
Palm Beach – Southeast Florida 24,431,000 58,000 36,783,000 92,000
TOTAL 33,255,000 1,635,000 50,828,000 2,575,000
The magnitude of the travel market assumed for the 2010 forecast year corresponds well to the travel market assumptions employed in this study for comparable segments of the AAF service. For example, the estimate of the total auto market (in person trips) from Central Florida to Palm Beach established for this study is 5.2 million, with an additional 10.5 million traveling from Central Florida to Miami and Fort Lauderdale. This corresponds well to the findings of our study which estimated a total long distance intercity travel market of over 15 million. The LBG estimate of the short distance auto travel market between Palm Beach and Miami / Fort Lauderdale is 40 million in annual person trips—also consistent with the FOX study. The overall level of Air Trips estimated for 2010 in this study is comparable at 2.3 million (note that our study assumes no air travel between Palm Beach and Miami and Fort Lauderdale).
Case 1:15-cv-00632-CRC Document 21-2 Filed 05/28/15 Page 23 of 154

All Aboard Florida Ridership and Revenue Study
May 7, 2015
Page 7
The process for ridership forecasting employed in the AAF forecast corresponds closely with the process employed in the FOX study. The forecast consisted of (1) a mode share model that estimated the market share of the total intercity travel by mode based on trip characteristics such as travel time, cost and frequency and (2) an induced demand model that addressed the growth in the intercity travel volumes resulting from the new service.
The consensus ridership forecast for each of the three FOX alignments (which included service through to Tampa) ranged from 5.3 million (no station in West Palm Beach) to 8.3 million. The ridership for the FOX segments that are comparable to the current study (Miami to Orlando) ranged from 3.2 million to 5.2 million. With AAF ridership at 5.3 for the 2020 forecast, including 2.5 million in long distance trips between Southeast Florida and Orlando, the AAF forecast findings are comparable to the earlier FOX forecast. Differences in ridership estimates are to be expected, however, especially in the comparison between Miami‐Orlando journeys and travel within Southeast Florida, as the FOX service was planned to operate at a higher speed (220 mph); with greater frequency of service; and higher fare structure, favoring longer distance travel. Considering these differences, however, we believe our forecast for AAF service is consistent with the magnitude of the estimated travel market, forecasting methods employed, and findings.
1.5.2 OtherHighSpeedRailInitiatives
Following an amendment to the Florida constitution in 2000 that mandated the state to develop a High Speed Rail network, the Florida Legislature enacted the Florida High Speed Rail Authority Act in 2001, which created the Florida High Speed Rail Authority (HSRA). HSRA’s vision plan identified the Tampa – Orlando segment as the first phase of a statewide high speed rail network and preliminary assessments and environmental studies for the segment were developed. The project stalled after the constitutional mandate was repealed in 2004. A brief revival occurred in 2009 when the Federal Railroad Administration identified Florida as one of the potential high speed rail corridors that could be eligible for federal funding under the American Recovery and Reinvestment Act. Florida submitted successful applications for the Tampa‐Orlando and the Orlando‐Miami segments but the project was cancelled when the Governor formally rejected the funds in 2011 and the USDOT redirected the funds to other states.
In 2002, Wilbur Smith Associates (WSA) and AECOM each produced independent ridership and revenue forecasts for the Florida High Speed Rail Authority that were published in a single Investment Grade Ridership Study for the Tampa‐Orlando corridor.11 The Florida High Speed Rail Enterprise published a two‐page update to that forecast in September 200912 ‐‐ forecasts that were later included in the Florida DOT’s application for federal funding in October 2009.13 The 2002 R&R Summary identified three markets:
Intercity, which are potential trips originating and ending in the seven counties in the Tampa Bay, Lakeland and Orlando areas.
11 AECOM and WSA, Investment Grade Ridership Study: Summary Report, Prepared for Florida High Speed Rail Authority, November 20, 2002. 12 http://flhsr.squarespace.com/storage/FHSR%20ridership.revised.doc 13 Attachment TOM 3, Service Development Program, Florida High Speed Rail, Tampa‐Orlando‐Miami, pages 13‐15, October 2009.
Case 1:15-cv-00632-CRC Document 21-2 Filed 05/28/15 Page 24 of 154

All Aboard Florida Ridership and Revenue Study
May 7, 2015
Page 8
Airport access‐choice, which are people who are traveling to or from Orlando International Airport for air travel and have the usual choices of ground transportation options.
Airport access‐captive, which are people who are traveling to or from Orlando International Airport for air travel on a vacation package deal where ground transportation is included in the package, and the cost of that transportation is hidden in the package.
In 2002, HNTB and TEMS prepared a report14 on ridership and revenue for the Orlando‐Miami segment of Florida High Speed Rail for the Florida High Speed Rail Authority. The study evaluated the following four alignment options:
CSX railroad alignment
Florida Turnpike
I‐95
FEC railroad
The 2020 ridership forecast, based on the I‐95 alignment option and stations at Orlando International Airport, Brevard County, Fort Pierce, West Palm Beach, Fort Lauderdale and the Miami Intermodal Center, equals between 4.6 and 7.1 million passengers between Southeast Florida and Orlando, depending on the technology used. The corresponding farebox revenue ranges from $231 million to $354 million (in 2002 dollars). The higher level of ridership and revenue forecast for FHSR is attributable to the speed of the service (at 220 mph over twice that proposed for AAF); differences in alignment, station locations, and cities served; and differences in fare price structure. Allowing for these differences, we believe our forecast for AAF service is generally comparable to the published FHSR evaluations.
1.5.3 FloridaIntercityRailPassengerVisionPlan
In 2006, FDOT prepared the Florida Intercity Passenger Rail Vision Plan, a plan that builds upon previous studies exploring the potential of higher speed rail to assist in meeting the State’s mobility needs. Based on an assessment of the market, operating and infrastructure requirements for implementing a statewide passenger rail system, the report’s key findings are:
The system can be developed incrementally
The system can be developed using existing rail and highway right‐of‐ways (FEC and CSX rail
right‐of‐way, and FDOT‐owned highway corridors)
The system will be eligible for federal funding because it will meet FRA’s public‐private
partnership requirements.
The study projects that the intercity travel market in Florida will expand from about 100 million trips to 200 million trips by 2020, and to 320 million trips by 2040. Table 1.5‐2 presents the number of trips for the segment relevant to this study.
14 HNTB Corporation and TEMS, Florida High Speed Rail Authority: Orlando‐Miami Planning Study, Prepared for Florida High Speed Rail Authority, March 2003.
Case 1:15-cv-00632-CRC Document 21-2 Filed 05/28/15 Page 25 of 154

All Aboard Florida Ridership and Revenue Study
May 7, 2015
Page 9
Table 1.5‐2 – Intercity Rail Vision Plan Estimate of Intercity Person Trips
Year Volume
2000 9,446,524
2020 18,420,722
2040 30,394,191
The estimate for 2010 developed for this study of over 15 million long distance intercity travelers (Orlando to Southeast Florida exclusive of trips between Southeast Florida destinations) is comparable in magnitude to the estimates outlined in the Vision Plan, falling between the 2000 and 2020 estimates. The Vision Plan outlined the phasing for two potential routes ‐ the inland route and the coastal route – and proposes a system that combines the physically and economically feasible components of both routes but does not present intercity ridership estimates for the segments relevant for this study.
Case 1:15-cv-00632-CRC Document 21-2 Filed 05/28/15 Page 26 of 154
All Aboard Florida Ridership and Revenue Study
May 7, 2015
Page 10
2. TheMarketforIntercityRailinSoutheastandCentralFloridaDespite the distances between city centers, the communities and economies of Southeast Florida are interconnected in many ways. Substantial numbers of people travel between Miami, Fort Lauderdale, and West Palm Beach for business, journey to work, recreation, and other purposes. Substantial demand for travel between these centers and Orlando also exists. This section outlines the characteristics of the overall intercity travel market and an evaluation of prospects for growth.
2.1 RegionalStudyArea
Data gathering for the ridership study began with collection of information on demographic and market conditions for the Southeast Florida and the Central Florida regions. This regional study area was determined based on the proposed station locations, which are Orlando, Miami, Fort Lauderdale and West Palm Beach. The study area consists of following counties and the Metropolitan Planning Organizations (MPOs) that guide transportation policy and investment priorities:
Orange, Osceola, and Seminole County (MetroPlan Orlando); Lake and Brevard County
Miami‐Dade County (Miami‐Dade MPO)
Broward County (Broward MPO)
Palm Beach County (Palm Beach MPO)
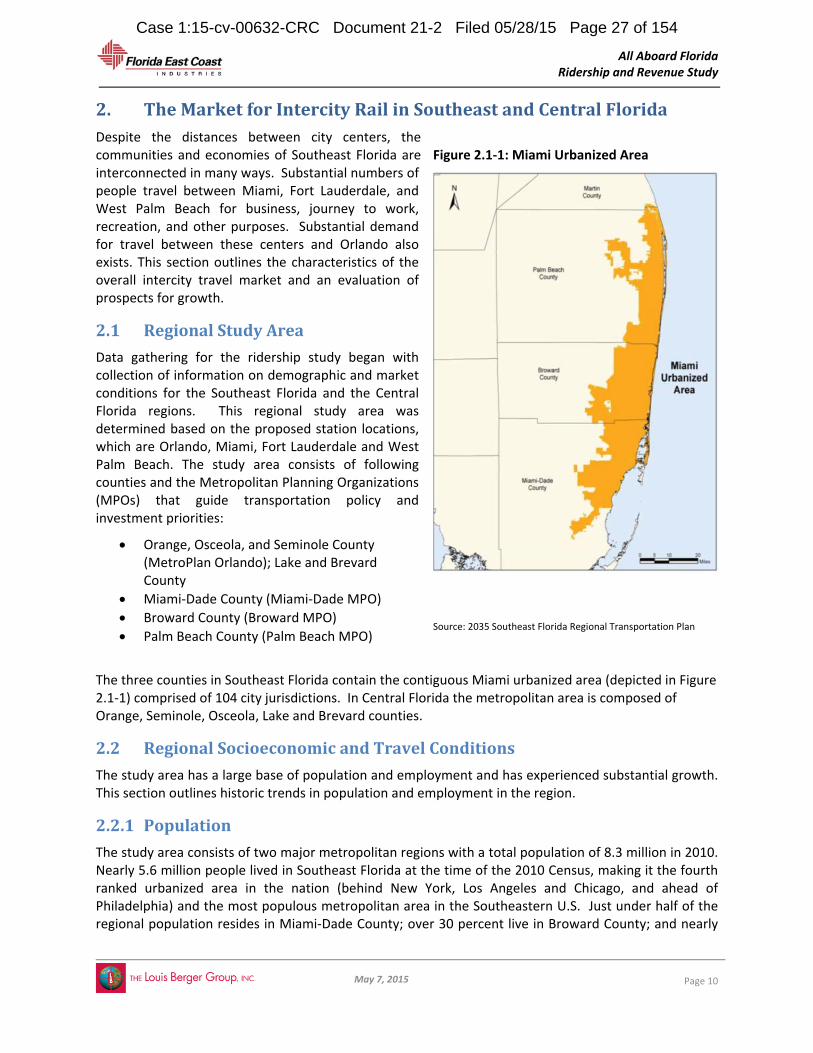
The three counties in Southeast Florida contain the contiguous Miami urbanized area (depicted in Figure 2.1‐1) comprised of 104 city jurisdictions. In Central Florida the metropolitan area is composed of Orange, Seminole, Osceola, Lake and Brevard counties.
2.2 RegionalSocioeconomicandTravelConditions
The study area has a large base of population and employment and has experienced substantial growth. This section outlines historic trends in population and employment in the region.
2.2.1 Population
The study area consists of two major metropolitan regions with a total population of 8.3 million in 2010. Nearly 5.6 million people lived in Southeast Florida at the time of the 2010 Census, making it the fourth ranked urbanized area in the nation (behind New York, Los Angeles and Chicago, and ahead of Philadelphia) and the most populous metropolitan area in the Southeastern U.S. Just under half of the regional population resides in Miami‐Dade County; over 30 percent live in Broward County; and nearly
Figure 2.1‐1: Miami Urbanized Area
Source: 2035 Southeast Florida Regional Transportation Plan
Case 1:15-cv-00632-CRC Document 21-2 Filed 05/28/15 Page 27 of 154

All Aboard Florida Ridership and Revenue Study
May 7, 2015
Page 11
25 percent of the region’s population lives in Palm Beach County. The region has experienced substantial growth since 1970 when it had nearly 2.3 million residents. Palm Beach, which had the lowest population base in that year, has experienced the highest rate of growth, averaging 3.4 percent per year over the forty year period. Both Palm Beach and Broward counties today are larger than Miami‐Dade was in 1970. The Central Florida region counted 2.7 million residents in 2010, including 2.1 million residing in Greater Orlando, the fifth most populous metropolitan area in the Southeastern U.S. The Central region experienced an average of 2.3 percent growth per year in the 2000‐2010 period, more than double the rate of Southeast Florida.
Figure 2.2‐1: Population, 1970‐2010 (in thousands)
Source: LBG, 2012 from data provided by Woods & Poole Economics
Table 2.2‐1: Average Annual Growth in Population
1970‐2010 1990‐2010 2000‐2010
Central Florida 3.2% 2.5% 2.3%
Southeast Florida 2.3% 1.6% 1.1%
Palm Beach 3.4% 2.1% 1.5%
Broward 2.6% 1.7% 0.7%
Miami‐Dade 1.7% 1.3% 1.0%
Total Study Area 2.5% 1.9% 1.4%
Population growth in the region as a whole has averaged an annual gain of 2.5 percent since 1970 (see Table 2.2‐1). In the past 20 years the growth rate has moderated to 1.9 percent. With the effects of a major recession still being felt, growth since 2000 has averaged 1.4 percent.
1970 1975 1980 1985 1990 1995 2000 2001 2002 2003 2004 2005 2010
Central Florida 760 932 1,089 1,333 1,644 1,880 2,135 2,197 2,256 2,316 2,397 2,486 2,684
Palm Beach 353 479 586 723 872 1,014 1,136 1,160 1,191 1,218 1,252 1,278 1,323
Broward 630 871 1,026 1,133 1,263 1,447 1,631 1,663 1,690 1,708 1,725 1,747 1,754
Miami Dade 1,279 1,498 1,643 1,777 1,944 2,086 2,260 2,287 2,316 2,336 2,359 2,386 2,505
‐
500
1,000
1,500
2,000
2,500
3,000
Case 1:15-cv-00632-CRC Document 21-2 Filed 05/28/15 Page 28 of 154
All Aboard Florida Ridership and Revenue Study
May 7, 2015
Page 12
2.2.2 Employment
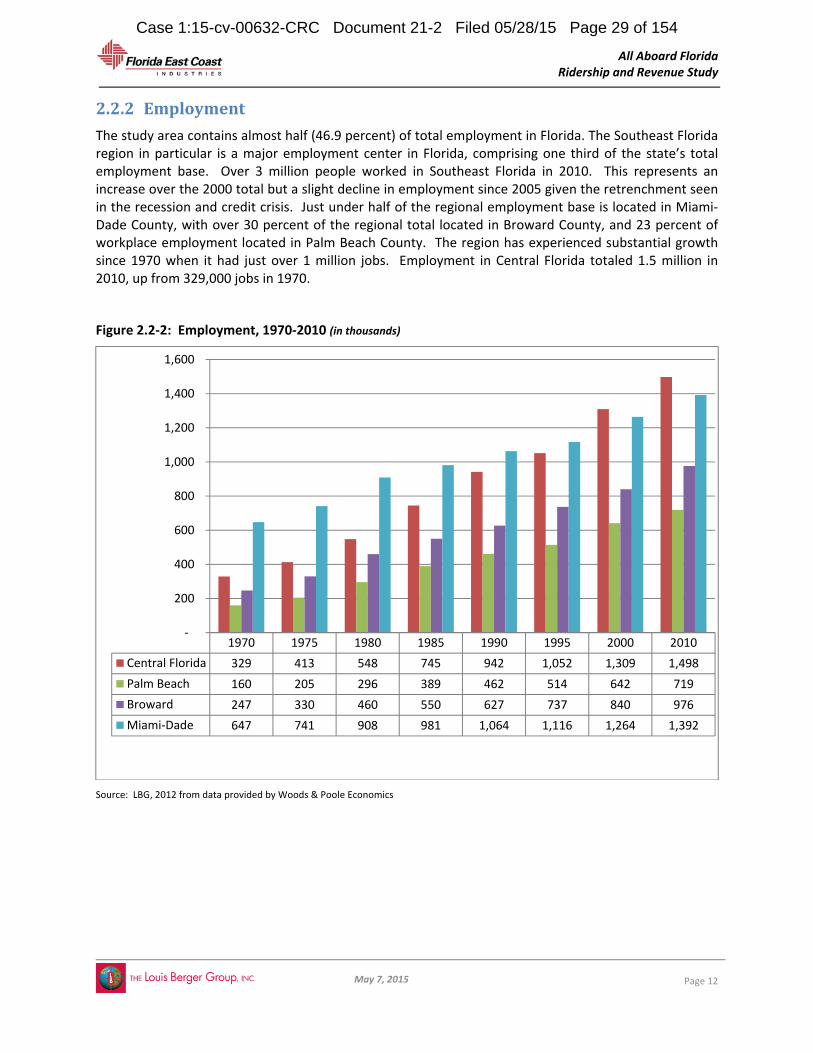
The study area contains almost half (46.9 percent) of total employment in Florida. The Southeast Florida region in particular is a major employment center in Florida, comprising one third of the state’s total employment base. Over 3 million people worked in Southeast Florida in 2010. This represents an increase over the 2000 total but a slight decline in employment since 2005 given the retrenchment seen in the recession and credit crisis. Just under half of the regional employment base is located in Miami‐Dade County, with over 30 percent of the regional total located in Broward County, and 23 percent of workplace employment located in Palm Beach County. The region has experienced substantial growth since 1970 when it had just over 1 million jobs. Employment in Central Florida totaled 1.5 million in 2010, up from 329,000 jobs in 1970.
Figure 2.2‐2: Employment, 1970‐2010 (in thousands)
Source: LBG, 2012 from data provided by Woods & Poole Economics
1970 1975 1980 1985 1990 1995 2000 2010
Central Florida 329 413 548 745 942 1,052 1,309 1,498
Palm Beach 160 205 296 389 462 514 642 719
Broward 247 330 460 550 627 737 840 976
Miami‐Dade 647 741 908 981 1,064 1,116 1,264 1,392
‐
200
400
600
800
1,000
1,200
1,400
1,600
Case 1:15-cv-00632-CRC Document 21-2 Filed 05/28/15 Page 29 of 154

All Aboard Florida Ridership and Revenue Study
May 7, 2015
Page 13
Table 2.2‐2: Average Annual Growth in Employment
1970‐2010 1990‐2010 2000‐2010
Central Florida 3.9% 2.3% 1.4%
Southeast Florida 2.7% 1.8% 1.2%
Palm Beach 3.8% 2.2% 1.1%
Broward 3.5% 2.2% 1.5%
Miami‐Dade 1.9% 1.4% 1.0%
Total Study Area 3.0% 2.0% 1.2%
Employment growth in the region as a whole has averaged an annual gain of 3.0 percent since 1970 (see Table 2.2‐2). In the past 20 years the growth rate has moderated to 2.0 percent. With the effects of a major recession still being felt, growth since 2000 has averaged 1.2 percent.
2.2.3 RegionalTravel
Strong population and employment growth has been accompanied by steady growth in travel on the region’s freeways. As illustrated in Figure 2.2‐3, daily vehicle miles traveled (VMT) in Southeast Florida have grown from 12 million in 1982 to a peak of over 40 million in 2007—an annual average rate of growth of 4.7 percent. In Central Florida, daily vehicle miles traveled grew from 3 million to 13 million during that same time period, which corresponds to an annual average rate of 5.8 percent. Following the recession and credit crisis in 2008, VMT posted its first sustained decline and has leveled off in both regions. This leveling of VMT is a pattern that has been observed in metropolitan areas nationwide. A return to growth in VMT is likely however, as population and employment growth resume. Capacity limitations and fuel costs may work to constrain demand in freeway VMT.
Figure 2.2‐3: Freeway VMT, 1982‐2010
Source: Texas Transportation Institute, Annual Urban Mobility Report, 2010
‐
5
10
15
20
25
30
35
40
45
millions
Central Florida Southeast Florida
Case 1:15-cv-00632-CRC Document 21-2 Filed 05/28/15 Page 30 of 154

All Aboard Florida Ridership and Revenue Study
May 7, 2015
Page 14
As increases in VMT have outpaced highway capacity, especially during peak periods, annual hours of travel delay have climbed steadily. For Southeast Florida, figure 2.2‐4 depicts an annual hours of travel delay (solid line) rising from 20 million in 1982 to just under 160 million in 2005. Although moderating with the recession, delay remains high at 140 million hours in 2010. Travel times are much longer than would be anticipated at free‐flow speeds. The regional travel time index (dashed line) estimates the ratio of actual travel times in relation to free‐flow speeds. The index reached 1.24 in 2010, down from a peak of 1.30 at the height of the regional economic activity prior to 2007. In Central Florida, annual hours of delay increased from 4 million in 1982 to 40 million in 2007. In 2010, the annual delay was 38 million. The region’s travel time index was 1.18 in 2010.
Figure 2.2‐4: Annual Hours of Delay and Travel Time Index, 1982‐2010
Source: Texas Transportation Institute, Annual Urban Mobility Report, 2010
Key highways linking Central and Southeast Florida are experiencing current issues with congestion as volume reaches the capacity of the roadway. State and regional transportation agencies expect this to worsen in the next 30 years. Figure 2.2‐5 shows anticipated change in volume to capacity ratios for key regional highway links. As volumes approach or exceed a V/C ratio of 1.0 during the peak hour of travel, speeds and reliability are expected to diminish substantially.
‐
0.20
0.40
0.60
0.80
1.00
1.20
1.40
‐
20
40
60
80
100
120
140
160
180
1982 1986 1990 1994 1998 2002 2006 2010
Travel Tim
e In
dex (TTI)
millions of hours
Southeast Florida Delay Central Florida Delay
Southeast Florida TTI Central Florida TTI
Case 1:15-cv-00632-CRC Document 21-2 Filed 05/28/15 Page 31 of 154

All Aboard Florida Ridership and Revenue Study
May 7, 2015
Page 15
Figure 2.2‐5: Anticipated Change in Volume to Capacity Ratios 2007‐2040
Source: Freight Analysis Framework, U.S. Federal Highway Administration, 2010; LBG, 2012.
Map ID Segment Name State
2007 AADT*
2040 AADT*
2007 V/C Ratio
2040 V/C Ratio
1 State Route 528 east of State Route
417 FL 49,478 75,440 0.82 1.16
2 Florida Turnpike, State Route 91,
south of US Route 441 FL 30,050 45,818 0.71 1.01
3 Florida Turnpike, State Route 91,
north of State Route 60 FL 26,000 39,642 0.53 0.79
4 I‐95 south of State Route 528 FL 48,500 73,949 0.87 1.25
5 I‐95 north of State Route 706 FL 70,954 108,185 0.72 1.05
6 Florida Turnpike, State Route 91,
north of State Route 706 FL 36,000 54,890 0.57 0.87
7 I‐95 north of State Route 870 FL 274,277 418,198 1.31 2.00
8 Florida Turnpike, State Route 91,
north of State Route 870 FL 94,200 143,629 0.94 1.42
9 I‐95 north of State Route 820 FL 283,774 432,678 1.07 1.64
10 Florida Turnpike, State Route 91,
north of State Route 820 FL 113,369 172,857 1.12 1.71
11 I‐75 south of I‐595 FL 111,352 169,781 0.80 1.15
12 US Route 192 west of I‐95 FL 5,775 8,805 0.12 0.22
Case 1:15-cv-00632-CRC Document 21-2 Filed 05/28/15 Page 32 of 154

All Aboard Florida Ridership and Revenue Study
May 7, 2015
Page 16
Use of public transportation in the study area increased since 1982. In Southeast Florida (including bus service, Metrorail, and Tri‐Rail) public transportation has also grown in the past 20 years, doubling since 1990 and reaching a peak of one million annual passenger miles just prior to the last recession (see Figure 2.2‐6). The average annual rate of growth for transit passenger miles since 1982 is 3.5 percent. In Central Florida, annual public transportation passenger miles increased from 61,000 miles in 1982 to 167,000 miles in 2008 and were at 159,000 miles in 2010. The average annual growth rate in Central Florida was also 3.5 percent.
Figure 2.2‐6: Annual Public Transportation Passenger Miles, 1982‐2010
Source: Texas Transportation Institute, Annual Urban Mobility Report, Miami, 2010
‐
0.2
0.4
0.6
0.8
1.0
1.2
millions
Southeast Florida Central Florida
Case 1:15-cv-00632-CRC Document 21-2 Filed 05/28/15 Page 33 of 154

All Aboard Florida Ridership and Revenue Study
May 7, 2015
Page 17
In Southeast Florida, intercity commuter rail service offered by Tri‐Rail has also posted substantial gains with an average annual rate of growth of 3.5 percent since 1997. It is important to note that Tri‐Rail ridership steadily increased through the recession, declining somewhat in 2010 after gaining over one million passengers. The rapid changes in ridership during a period of decline in freeway use, correspond with a sharp increase in the frequency of service (move to 20 minute headways during rush hour) with the completion of the SFRTA Segment 5 capital program. The ridership increase also corresponded with a period of volatility in gas prices. Overall, the trend demonstrates strong demand for public transportation is possible when alternatives meet traveler needs.
Figure 2.2‐7: Tri‐Rail Annual Ridership, 1982‐2010
Source: SFRTA Annual Reports, 2006‐2011
Between Southeast Florida and Central Florida the three main modes of travel (auto via the Turnpike, airline travel, and existing Amtrak service) have exhibited growth since 2000, as follows.
Mainline Turnpike ‐ The Ticket and Northern and Southern Coin sections of the Turnpike,
accounting for travel within and between Central Florida and Southeast Florida have seen an
average rate of growth of 3.6% per year from 2000 to 2011 (see Figure 2.2‐8, below). Although
traffic declined during the recent recession by about 9 percent from the highpoint in 2007 to a
low in 2009, it has seen steady recovery since 2009 with average annual growth of 1.6% from
2009 to 2011.
Orlando‐Miami Air Travel – Air passenger volumes between Orlando and Miami (origin and
destination passengers only—no connection passengers), have seen some volatility over the last
decade but have experienced an overall annual average growth of 3.2%. Volumes declined
about 20 percent in the recent recession from 2008 to 2009 but have increased substantial in
2010, reaching a new high in 2011. Historical volumes for the Orlando to Fort Lauderdale route
were not available.
‐
500,000
1,000,000
1,500,000
2,000,000
2,500,000
3,000,000
3,500,000
4,000,000
4,500,000
1997 1999 2001 2003 2005 2007 2009 2011
Tri Rail Annual Ridership
Case 1:15-cv-00632-CRC Document 21-2 Filed 05/28/15 Page 34 of 154

All Aboard Florida Ridership and Revenue Study
May 7, 2015
Page 18
Figure 2.2‐8: Annual Toll Transactions Florida Turnpike, 2000‐2011 (in millions)
Source: Florida Turnpike Enterprise, 2012. Source: FAA 10% Sample Data, 2012.
Amtrak ‐ Although ridership on Amtrak includes travel to points on the East Coast beyond
Central and Southeast Florida, this rail service has seen substantial growth despite a low
frequency schedule (two trains per day in addition to the auto train boarding at Sanford) and
substantial travel time (3 hours 45 minutes to 5 hours 45 minutes between Southeast and
Central Florida). Amtrak boardings at all stations in the state have grown at an average annual
rate of 1.8 percent since 2000, with a steady growth (over 8 percent compound average annual)
since 2006. Amtrak service in Florida saw steady growth through the recession.
Figure 2.2‐8: Amtrak Florida Station Boardings, 2000‐2011
Source: Amtrak, 2012.
0
50,000
100,000
150,000
200,000
250,000
300,000
2000
2001
2002
2003
2004
2005
2006
2007
2008
2009
2010
2011
Mainline Turnpike Transactions
0
200,000
400,000
600,000
800,000
1,000,000
1,200,000
1,400,000
Amtrak Florida Boardings
Figure 2.2‐9: Annual Airline Passenger Volume,Orlando‐Miami, 2000‐2011
‐
20,000
40,000
60,000
80,000
100,000
120,000
140,000
2000
2001
2002
2003
2004
2005
2006
2007
2008
2009
2010
2011
Annual Passenger Count
Case 1:15-cv-00632-CRC Document 21-2 Filed 05/28/15 Page 35 of 154

All Aboard Florida Ridership and Revenue Study
May 7, 2015
Page 19
2.3 StationAreaSocioeconomicConditions
A key advantage to the FECR corridor in the development of new intercity passenger service in Southeast Florida is that the right‐of‐way passes through the most densely populated and highest growing areas in the region. Table 2.3‐1 demonstrates that the station areas in Miami, Fort Lauderdale, and West Palm Beach are well placed to provide access to potential passengers. Over 1 million people live within a 5‐mile radius of the stations, nearly one‐half million in Miami alone. The number of households in that area stood at approximately 401,000 in 2010. Including vacant and seasonally occupied units, there were over 499,000 housing units within 5‐miles of the proposed station.
Table 2.3‐1: Population and Households within 5‐mile Radius of AAF Stations (2010)
West Palm Beach
Fort Lauderdale Miami
Orlando Airport
Total Population 170,944 232,800 469,842 58,439
Total Households 67,702 95,996 185,966 20,917
Total Housing Units 88,427 119,422 228,669 14,493 Source: ESRI Business Analyst, 2012
Although suburban portions of the three Southeast Florida counties have grown more quickly during the last decade than the urban core, the immediate areas around the proposed AAF station locations did see substantial growth and development from 2000 to 2010. Table 2.3‐2 presents data indicating that although population in the 5‐mile buffer area as a whole was level or slow growing (average of less than 1 percent per year), within a one‐mile distance of the Southeast stations average annual population growth ranged from 1.9 percent in Fort Lauderdale to 5.6 percent in Miami. Overall, an additional 20,500 persons moved into the Southeast station areas within 1‐mile of the station locations from 2000 to 2010.
Table 2.3‐2: Average Annual Growth in Population, 2000‐2010 by Radius around AAF Stations
5‐mile 3‐mile 1‐mile
West Palm Beach 0.60% 0.50% 3.30%
Fort Lauderdale ‐0.10% ‐0.30% 1.90%
Miami 0.90% 1.50% 5.60%
Orlando Airport 5.10% 0.61% N/A
Source: ESRI Business Analyst, 2012
The maps displayed in Figures 2.3‐1 to 2.3‐6 on the following pages depict population density in the vicinity of the station locations.
Case 1:15-cv-00632-CRC Document 21-2 Filed 05/28/15 Page 36 of 154
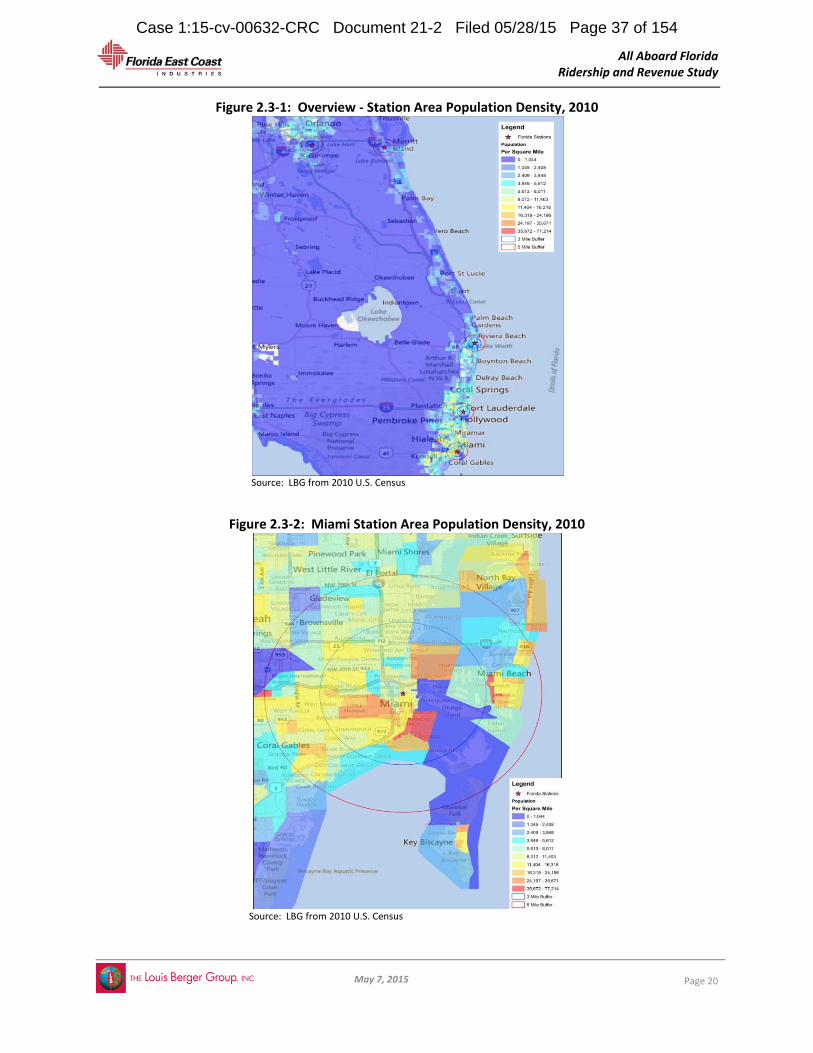
All Aboard Florida Ridership and Revenue Study
May 7, 2015
Page 20
Figure 2.3‐1: Overview ‐ Station Area Population Density, 2010
Source: LBG from 2010 U.S. Census
Figure 2.3‐2: Miami Station Area Population Density, 2010
Source: LBG from 2010 U.S. Census
Case 1:15-cv-00632-CRC Document 21-2 Filed 05/28/15 Page 37 of 154

All Aboard Florida Ridership and Revenue Study
May 7, 2015
Page 21
Figure 2.3‐3: Fort Lauderdale Station Area Population Density, 2010
Source: LBG from 2010 U.S. Census
Figure 2.3‐4: West Palm Beach Station Area Population Density, 2010
Source: LBG from 2010 U.S. Census
Case 1:15-cv-00632-CRC Document 21-2 Filed 05/28/15 Page 38 of 154

All Aboard Florida Ridership and Revenue Study
May 7, 2015
Page 22
Figure 2.3‐5: Orlando Airport Station Area Population Density, 2010
Source: LBG from 2010 U.S. Census
Along with the residential population, the economic composition of the area will be a significant driver of the demand for the rail service. Table 2.3‐3 below presents the employment makeup of the areas within five miles of the three Southeast Florida stations.
Case 1:15-cv-00632-CRC Document 21-2 Filed 05/28/15 Page 39 of 154

All Aboard Florida Ridership and Revenue Study
May 7, 2015
Page 23
Table 2.3‐3: Employment by Industry, 5‐mile Station Area Radius, 2010
Industry Description West Palm Beach
Fort Lauderdale Miami
Agriculture, Fishing & Hunting 0.1% 0.1% 0.0%
Mining 0.0% 0.0% 0.0%
Utilities 0.1% 0.1% 0.0%
Construction 4.4% 5.0% 2.4%
Manufacturing 3.2% 3.7% 4.2%
Wholesale Trade 4.7% 3.7% 4.6%
Retail Trade 11.1% 12.3% 9.0%
Transportation & Warehousing 3.9% 3.9% 2.3%
Information 3.2% 1.9% 2.6%
Finance & Insurance 7.3% 6.4% 5.4%
Real Estate, Rental & Leasing 3.7% 4.8% 4.8%
Professional, Scientific & Tech Services 8.2% 8.8% 11.1%
Management of Companies 0.0% 0.0% 0.4%
Administrative & Waste Management 3.8% 5.3% 4.0%
Educational Services 3.7% 5.2% 4.8%
Health Care & Social Assistance 12.6% 9.2% 13.6%
Arts, Entertainment & Recreation 4.4% 2.6% 2.2%
Accommodation & Food Services 7.0% 9.6% 12.7%
Accommodation 1.4% 3.4% 5.2%
Food Services & Drinking Places 5.6% 6.2% 7.5%
Other Services (ex‐Public Administration) 7.6% 5.5% 5.1%
Public Administration 10.8% 11.1% 9.8%
Unclassified Establishments 0.3% 0.6% 0.9%
Total Employment 132,923 190,198 281,309Source: Business data provided by Infogroup, Omaha NE Copyright 2010.
The industry composition of the areas surrounding each station location is varied. Fort Lauderdale’s composition is more diverse with a small retail industry leading the employment makeup. Both West Palm Beach and Miami have a high proportion of health care. Miami has a high proportion of professional services employment. The industry composition for the areas can also provide an indication of the business travel market. Although there are no readily available statistics for this market, review of the Bureau of Economic Analysis’s 2002 Industry Make‐Use tables provides insight into which industries use travel reservation (agent) services. This is a proxy for inter‐regional trips made by either the industry’s employees during their course of work or potential clients. Table 2.3‐4 provides the top 15 industries that use travel reservation and travel agent services.
Case 1:15-cv-00632-CRC Document 21-2 Filed 05/28/15 Page 40 of 154

All Aboard Florida Ridership and Revenue Study
May 7, 2015
Page 24
Table 2.3‐4: Industries Utilizing Travel Services
Rank NAICS15 Name % use of travel
services
1 541800 Advertising and related services 18.4%
2 531000 Real estate 8.3%
3 518200 Data processing, hosting, and related services 5.5%
4 517000 Telecommunications 4.9%
5 521100 Monetary authorities and depository credit intermediation 4.2%
6 550000 Management of companies and enterprises 4.0%
7 334610 Software, audio, and video media 3.9%
8 323110 Printing 3.6%
9 533000 Lessors of nonfinancial intangible assets 3.0%
10 524100 Insurance carriers 2.5%
11 561300 Employment services 2.4%
12 523000 Securities, commodity contracts, investments, and related activities 2.1%
13 541200 Accounting, tax preparation, bookkeeping, and payroll services 2.0%
14 541610 Management, scientific, and technical consulting services 1.8%
15 541100 Legal services 1.8% Source: US Bureau of Economic Analysis, 2002. As noted in Table 2.3‐4 above, a majority of the industries that use traveling services are service oriented industries that require traveling to site locations and clients. Figure 2.3‐6 provides a depiction number of the establishments of these industries and their relation to the proposed stations. As reflected in the map, the West Palm Beach, Fort Lauderdale, and Miami station areas have high concentrations of travel‐generating businesses.
15 North American Industry Classification System
Case 1:15-cv-00632-CRC Document 21-2 Filed 05/28/15 Page 41 of 154
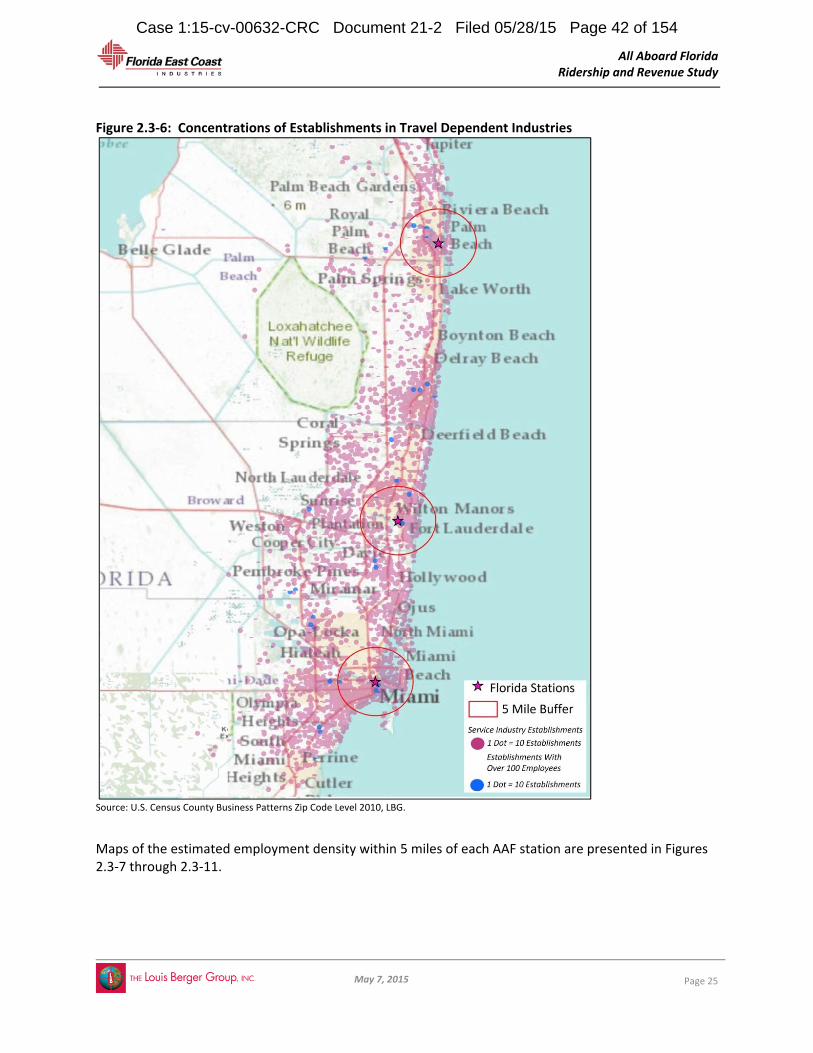
All Aboard Florida Ridership and Revenue Study
May 7, 2015
Page 25
Figure 2.3‐6: Concentrations of Establishments in Travel Dependent Industries
Source: U.S. Census County Business Patterns Zip Code Level 2010, LBG.
Maps of the estimated employment density within 5 miles of each AAF station are presented in Figures 2.3‐7 through 2.3‐11.
Case 1:15-cv-00632-CRC Document 21-2 Filed 05/28/15 Page 42 of 154

All Aboard Florida Ridership and Revenue Study
May 7, 2015
Page 26
Figure 2.3‐7: Overview of Station Area Employment Density, 2010
Source: LBG from 2010 U.S. County Business Patterns (Zip Code Level)
Figure 2.3‐8: Miami Station Area Employment Density, 2010
Source: LBG from 2010 U.S. County Business Patterns (Zip Code Level)
Case 1:15-cv-00632-CRC Document 21-2 Filed 05/28/15 Page 43 of 154
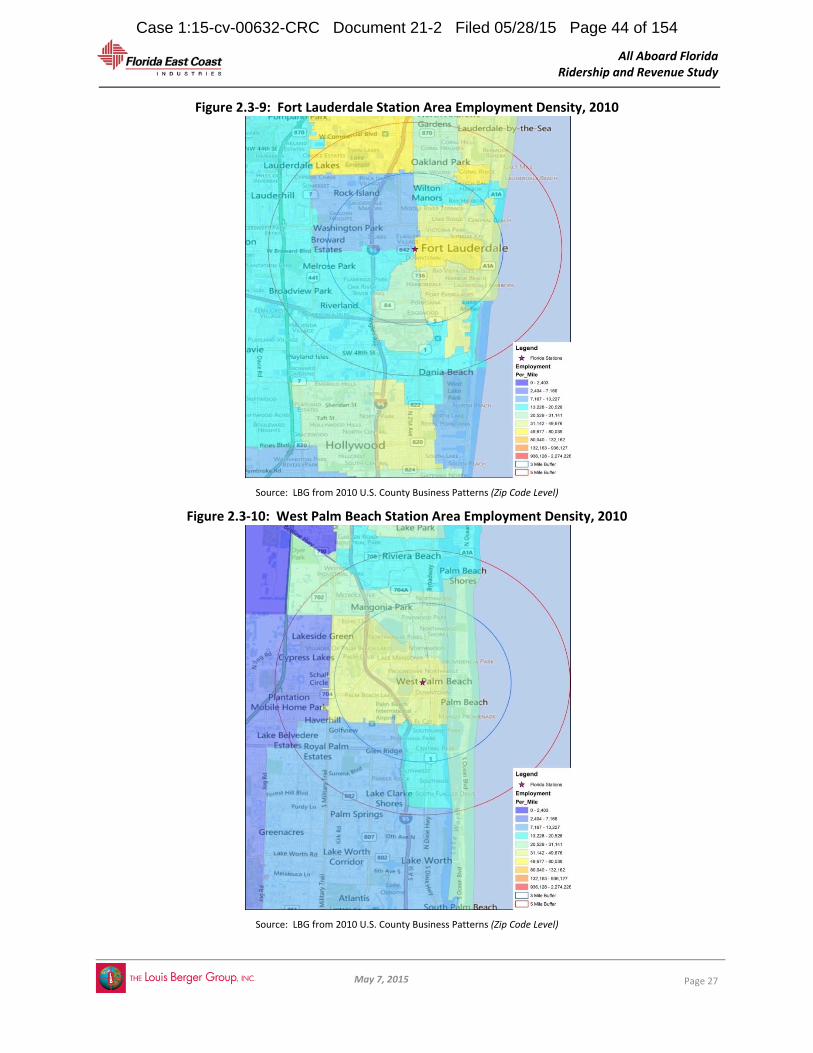
All Aboard Florida Ridership and Revenue Study
May 7, 2015
Page 27
Figure 2.3‐9: Fort Lauderdale Station Area Employment Density, 2010
Source: LBG from 2010 U.S. County Business Patterns (Zip Code Level)
Figure 2.3‐10: West Palm Beach Station Area Employment Density, 2010
Source: LBG from 2010 U.S. County Business Patterns (Zip Code Level)
Case 1:15-cv-00632-CRC Document 21-2 Filed 05/28/15 Page 44 of 154
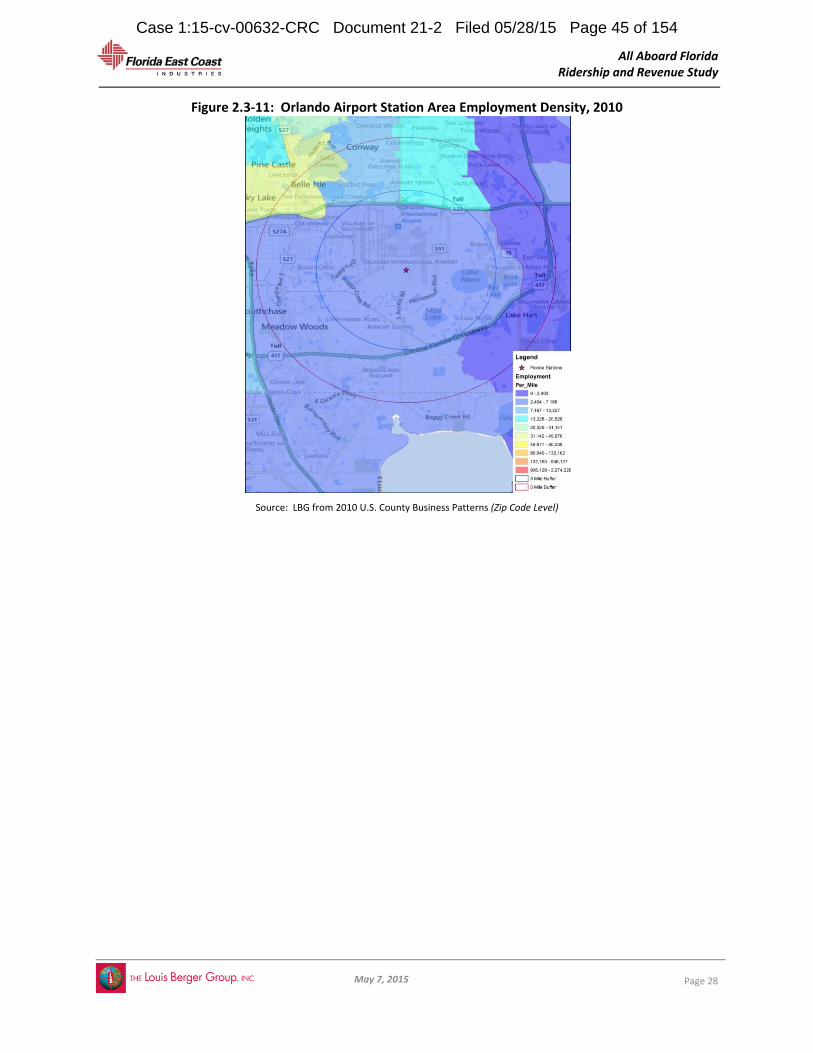
All Aboard Florida Ridership and Revenue Study
May 7, 2015
Page 28
Figure 2.3‐11: Orlando Airport Station Area Employment Density, 2010
Source: LBG from 2010 U.S. County Business Patterns (Zip Code Level)
Case 1:15-cv-00632-CRC Document 21-2 Filed 05/28/15 Page 45 of 154

All Aboard Florida Ridership and Revenue Study
May 7, 2015
Page 29
2.4 FutureSocioeconomicandTravelConditions
As outlined in Section 2.2, the study area has a large base of population and employment and has experienced substantial socioeconomic growth in the last 40 years. This growth has placed a strain on the roadway transportation infrastructure resulting in substantial congestion and travel delays. Public transportation usage has increased as new services have been provided, but transit remains a small portion of the overall travel market.
Recent leveling in transportation demand attributable in part to a slowdown in job growth and sustained downturn in the housing market may signal a break in the trend of travel growth that outpaces population and employment. State and local planning agencies agree, however, that regional socioeconomic growth will continue, accompanied by high levels of transportation demand and continued challenges to surface transportation capacity.
2.4.1 PopulationForecasts In Southeast Florida the MPOs collaborate on regular updates to a long‐range transportation plan for the three county urbanized area through the South East Florida Transportation Council (SEFTC). The plan includes updates to the outlook on the socioeconomic factors that underpin travel demand. The Plan, adopted in 2010, includes official forecasts for population through 2035 from a base year of 2005. In Central Florida, MetroPlan Orlando is the MPO for Orange, Osceola and Seminole County. The MPO’s 2030 Long Range Transportation Plan includes population projections for 2030. Figure 2.4‐1 shows the levels and rates of growth expected by county.
Figure 2.4‐1: MPO Population Forecast by County, 2005‐2035 (in thousands)
Source: LBG, 2012 from South East Florida Transportation Council, Southeast Florida Regional Transportation Plan, 2010 and from MetroPlan Orlando, 2030 Long Range Transportation Plan. Note: 2005 through 2010 actual, 2015‐2030 interpolated from 2035 forecast. Central Florida is composed of Orange, Osceola, and Seminole counties.
2005 2010 2015 2020 2025 2030 2035
Central Florida 1,688 1,843 2,105 2,366 2,628 2,890
Palm Beach 1,278 1,323 1,417 1,510 1,603 1,696 1,789
Broward 1,747 1,754 1,853 1,952 2,052 2,151 2,251
Miami‐Dade 2,386 2,505 2,661 2,816 2,971 3,127 3,282
‐
500
1,000
1,500
2,000
2,500
3,000
3,500
Case 1:15-cv-00632-CRC Document 21-2 Filed 05/28/15 Page 46 of 154

All Aboard Florida Ridership and Revenue Study
May 7, 2015
Page 30
The Southeast Florida forecast calls for the region to experience more moderate levels of increase than in the past, growing at an average annual rate of 0.9 percent from the 2010 Census population count. Regional population is expected to reach 7.3 million in 2035, with over 3.2 million residents in Miami‐Dade. In Central Florida the average annual growth rate between 2010 and 2030 is 2.3 percent leading to 2.9 million residents in 2030.
The population forecasts adopted by SEFTC represent the results of a collaborative forecasting process conducted by the MPOs in coordination with state and local agencies and neighboring regional planning authorities. The forecasts are updated on a five‐year cycle during the reexamination of the long range transportation plan.
To ensure that these forecasts represent reasonable levels of growth when compared to more recent projections, LBG undertook a review of alternative population forecast sources.
Two alternative sources were available at the county level. The Bureau of Economic and Business Research (BEBR) at the University of Florida produces population projections based on forecasts of natural increase and net migration flows. These projections are updated annually. Table 2.4‐1 displays the latest 2012 outlook (Florida Population Studies Bulletin 162 (revised), BEBR, March 2012).
LBG also obtained projections developed by Woods & Poole Economics, Inc., a private consulting firm that maintains and annually updates county‐level projections for the U.S. (CEDDS ‐ Complete Economic and Demographic Data Source, 2012). With its detail and frequent updates, this source is often used for comparison with official estimates in demand forecasts and due diligence studies.
Table 2.4‐1: Alternative Population Forecast Sources, 2035 (in thousands) MPO Forecasts BEBR Medium Projections Woods & Poole
County 2005 2035 CAGR 2005 2035 CAGR 2005 2035 CAGR
Central Florida 1,688 2,890^ 2.2% 2,486 3,879 1.49% 2,486 4,036 1.6%
Palm Beach 1,278 1,789 1.1% 1,278 1,661 0.9% 1,278 2,029 1.6%
Broward 1,747 2,251 0.8% 1,747 1,990 0.4% 1,747 2,440 1.1%
Miami‐Dade 2,386 3,282 1.1% 2,386 3,159 0.9% 2,386 3,078 0.9%
SEF Region 5,411 7,322 1.0% 5,411 6,810 0.8% 5,411 7,546 1.1%
Source: BEBR, FPS 168, April 2014; Woods & Poole CEDDS, 2012. Notes: ^2030 projections. Counties included in Central Florida MPO forecast are Orange, Osceola, and Seminole. Counties included in Central Florida BEBR projections and Woods & Poole projections are Brevard, Lake, Orange, Osceola, and Seminole.
The latest BEBR “medium” projections factor in the 2011 U.S. Census estimates which show a continuation in the slow rate of growth seen in the latter part of the last decade. Their outlook for the state as a whole is summarized as follows in the earlier version of the Florida Population Studies Bulletin 162 (revised), BEBR, March 2014:
The collapse of the housing market and the lingering effects of the worst economic crisis since the 1930s are likely to keep the state’s population growth at relatively low levels for another year or two. We expect growth to increase thereafter, reaching levels more in line with historical patterns by the middle of the decade. For many counties, however, future increases are likely to be smaller than those occurring during the last several decades.
Case 1:15-cv-00632-CRC Document 21-2 Filed 05/28/15 Page 47 of 154

All Aboard Florida Ridership and Revenue Study
May 7, 2015
Page 31
For Southeast Florida, BEBR is projecting a slower rate of growth for the region overall, and for Broward in particular. The overall population level in 2035 is 9 percent lower than the MPO forecast. It is important to note that the MPO forecasts for all three counties fall within the “high” case projections provided by BEBR. At the time they were assembled, the MPO forecasts were consistent with the BEBR medium projections.
Woods and Poole see higher prospects for growth for the region in general, but with a forecast for 2035 for Miami‐Dade slightly lower (6 percent) than the adopted 2035 MPO forecast.
Variations in long‐term population forecasts are not uncommon, especially during periods of volatility in economic conditions that affect the job and housing markets and influence net migration patterns.
With the BEBR estimate tracking slightly lower, it is reasonable to expect small downward adjustments in the next MPO forecasts. This review suggests that we should exercise caution in our assumption for future growth in travel to ensure a conservative outlook as the basis for the forecast.
For Central Florida, the BEBR projection is also more conservative than Woods & Poole in terms of total population count but similar in terms of average annual growth rate. The MPO 2030 forecast is 8 percent lower than the Woods & Poole 2030 forecast (2.6 million) for the three Central Florida counties that are part of MetroOrlando and fall between the medium and high BEBR 2030 projections for those three counties (2.6‐3.0 million).
Case 1:15-cv-00632-CRC Document 21-2 Filed 05/28/15 Page 48 of 154

All Aboard Florida Ridership and Revenue Study
May 7, 2015
Page 32
2.4.2 EmploymentForecasts In keeping with the population outlook, the MPO forecasts for employment show moderate growth in line with rates observed in the last decade. In Southeast Florida, regional employment is expected to reach 3.8 million in 2035, with nearly 2 million jobs in Miami‐Dade. In Central Florida, employment is to grow at 2.7 percent annually, reaching 1.9 million jobs in 2030.
Figure 2.4‐2: MPO Employment Forecast by County, 2005‐2035 (in thousands)
Source: LBG, 2012 from South East Florida Transportation Council, Southeast Florida Regional Transportation Plan, 2010 and from MetroPlan Orlando, 2030 Long Range Transportation Plan Note: 2005 through 2010 actual, 2015‐2030 interpolated from 2035 forecast. Central Florida is composed of Orange, Osceola, and Seminole counties.
To ensure that these forecasts represent reasonable levels of growth when compared to more recent projections, LBG undertook a review of alternative employment forecast sources.
Two alternative sources were available at the county level. The Florida Department of Economic Opportunity produces industry and occupation projections for an eight year forecast period. Their projections for 2011‐2019 (released in October 2011) are presented in Table 2.4‐2. Since the base year for this forecast is 2011 and the out‐year is 2019, this source is only appropriate for comparison of the average annual growth rate and benchmarking of current employment levels.
LBG also obtained employment projections developed by Woods & Poole (CEDDS ‐ Complete Economic and Demographic Data Source, 2012). This forecast includes a projection for 2035.
2005 2010 2015 2020 2025 2030 2035
Central Florida 1,124 1,118 1,312 1,506 1,700 1,894
Palm Beach 544 719 735 751 768 784 800
Broward 736 976 983 990 997 1,004 1,011
Miami‐Dade 1,388 1,392 1,513 1,634 1,754 1,875 1,996
‐
500
1,000
1,500
2,000
2,500
Case 1:15-cv-00632-CRC Document 21-2 Filed 05/28/15 Page 49 of 154

All Aboard Florida Ridership and Revenue Study
May 7, 2015
Page 33
Table 2.4‐2: Alternative Employment Forecast Sources, 2035 (in thousands) MPO Forecasts Current FDEO Projections Woods & Poole
County 2005 2035 CAGR 2013 2021 CAGR 2005 2035 CAGR
Central Florida 1,124 1,894^ 2.1% 996 1,145 1.8% 1,512 2,359 1.5%
Palm Beach 544 800 1.3% 589 674 1.8% 767 1,238 1.6%
Broward 736 1,011 1.1% 814 892 1.4% 1,000 1,527 1.4%
Miami‐Dade 1,388 1,996 1.2% 1,138 1,244 1.2% 1,388 1,921 1.1%
SEF Region 2,668 3,807 1.2% 2,542 2,810 1.3% 3,155 4,686 1.3%
Source: DEO, October 2013; Woods & Poole CEDDS, 2012. Notes: ^2030 projections. Counties included in Central Florida MPO forecast are Orange, Osceola, and Seminole. Counties included in Central Florida FDEO projections are Orange and Seminole counties. Counties included in Central Florida Woods & Poole projections are Brevard, Lake, Orange, Osceola, and Seminole.
Although the forecast term only extends to 2019, the FDEO projections are generally consistent with the MPO forecasts in terms of the overall rate of growth. In Southeast Florida, the agency sees a higher rate of growth for Palm Beach and Broward and an equivalent level for Miami Dade. It is important to note that the level of employment given by DEO for 2013 for the region is lower than that noted for the base year in the MPO forecasts. This difference is attributable to a loss in employment in Miami‐Dade following the recent recession. Given the lower base, a substantially higher rate of growth (averaging approximately 3 percent per year) would be required to achieve the MPO level in 2035. This suggests that future MPO forecasts may adjust the outlook for Miami‐Dade downward. Additional study would be required to confirm that the definition of employment used in the two forecasts is comparable and to determine if historic rates of growth following a sustained downturn support the forecast target for 2035.
Woods and Poole see higher prospects for growth for the region in general, but with a forecast for 2035 for Miami‐Dade slightly lower (4 percent) than the adopted 2035 MPO forecast. There is a substantial difference in the 2005 base for both Broward and Palm Beach counties, however, suggesting difference is the measurement of employment for the base year, and indicating that comparisons should be limited to the growth rates.
With no Census 100% Count available for employment, variations in long‐term employment forecasts and base year measurements are not uncommon, especially during periods of volatility in economic conditions.
For Central Florida, Woods & Poole is less optimistic than FDEO and the MPO, projecting an average annual growth rate of 1.5 percent compared to 2.1 percent and 2.0 percent, respectively.
Case 1:15-cv-00632-CRC Document 21-2 Filed 05/28/15 Page 50 of 154

All Aboard Florida Ridership and Revenue Study
May 7, 2015
Page 34
2.4.3 TravelForecasts In Southeast Florida, the MPOs arrive at forecasts of future trip making and travel by mode by updating regional travel models with the socioeconomic assumptions outlined above and the attributes of the planned future transportation network. Table 2.4‐3 displays the growth in total daily person trips and person trips by transit for the three‐county region from 2005 to the Plan for 2030 as depicted in version 6.5 of the Southeast Regional Planning Model (SERPM) maintained by the MPOs. The travel forecast estimates a 1.2 percent average annual growth for all trips, in line with the level of growth forecast for employment in the region. Growth in public transit is expected to outstrip population and employment growth as planned expansions add capacity. The 2030 SERPM indicates a 2.6 percent average annual growth in trips by bus, metro, and commuter rail transit as noted in Table 2.4‐3.
Table 2.4‐3: SERPM 6.5 Daily Person Trips, 2005 and 2030 (in thousands)
All Person Trips Person Trips by Transit
Time of Day 2005 2030 CAGR 2005 2030 CAGR
Peak 8,325 11,163 1.2% 161
301 2.5%
Off‐Peak 10,973 14,812 1.2% 148
279 2.6%
Total 19,298 25,975 1.2% 309
580 2.6% Source: FDOT District IV, SERPM 6.5 Model Data, Calibration, and Validation, 2008.
The 2030 forecast for Tri‐Rail calls for an average annual growth in ridership of 3.5%, in line with the growth rate observed to date on the system.
Table 2.4‐4: SERPM 6.5 Mainline Tri‐Rail Ridership
2005 2030 CAGR
Avg. Daily Riders 11,386 27,181 3.5%
Source: FDOT District IV, SERPM 6.5 Model Data, Calibration, and Validation, 2008.
In Central Florida, FDOT maintains the Central Florida Regional Travel Model version 5 (CFRPM v5 ). The CFRPM study area includes five MPOs: MetroPlan Orlando, Ocal/Maraion County TPO, Lake‐Sumter MPO, Volusia TPO and Space Coast TPO. It is the adopted travel demand model by FDOT region 5. The CFRPM will also be used by the MPOs to update their Long Range Transportation Plan with the exception of MetroPlan Orlando, which uses the Orlando Urban Area Transportation Study (OUATS) travel demand forecasting model.
Case 1:15-cv-00632-CRC Document 21-2 Filed 05/28/15 Page 51 of 154
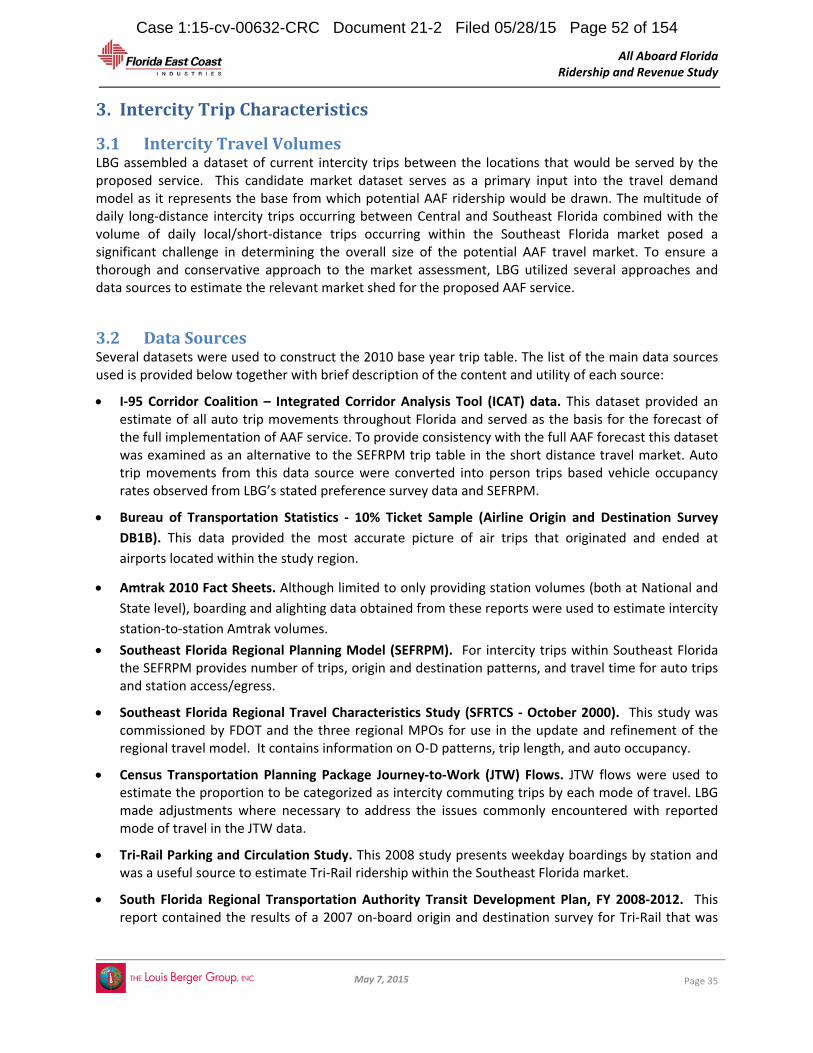
All Aboard Florida Ridership and Revenue Study
May 7, 2015
Page 35
3. IntercityTripCharacteristics
3.1 IntercityTravelVolumesLBG assembled a dataset of current intercity trips between the locations that would be served by the proposed service. This candidate market dataset serves as a primary input into the travel demand model as it represents the base from which potential AAF ridership would be drawn. The multitude of daily long‐distance intercity trips occurring between Central and Southeast Florida combined with the volume of daily local/short‐distance trips occurring within the Southeast Florida market posed a significant challenge in determining the overall size of the potential AAF travel market. To ensure a thorough and conservative approach to the market assessment, LBG utilized several approaches and data sources to estimate the relevant market shed for the proposed AAF service.
3.2 DataSourcesSeveral datasets were used to construct the 2010 base year trip table. The list of the main data sources used is provided below together with brief description of the content and utility of each source:
I‐95 Corridor Coalition – Integrated Corridor Analysis Tool (ICAT) data. This dataset provided an estimate of all auto trip movements throughout Florida and served as the basis for the forecast of the full implementation of AAF service. To provide consistency with the full AAF forecast this dataset was examined as an alternative to the SEFRPM trip table in the short distance travel market. Auto trip movements from this data source were converted into person trips based vehicle occupancy rates observed from LBG’s stated preference survey data and SEFRPM.
Bureau of Transportation Statistics ‐ 10% Ticket Sample (Airline Origin and Destination Survey
DB1B). This data provided the most accurate picture of air trips that originated and ended at
airports located within the study region.
Amtrak 2010 Fact Sheets. Although limited to only providing station volumes (both at National and
State level), boarding and alighting data obtained from these reports were used to estimate intercity
station‐to‐station Amtrak volumes.
Southeast Florida Regional Planning Model (SEFRPM). For intercity trips within Southeast Florida the SEFRPM provides number of trips, origin and destination patterns, and travel time for auto trips and station access/egress.
Southeast Florida Regional Travel Characteristics Study (SFRTCS ‐ October 2000). This study was commissioned by FDOT and the three regional MPOs for use in the update and refinement of the regional travel model. It contains information on O‐D patterns, trip length, and auto occupancy.
Census Transportation Planning Package Journey‐to‐Work (JTW) Flows. JTW flows were used to estimate the proportion to be categorized as intercity commuting trips by each mode of travel. LBG made adjustments where necessary to address the issues commonly encountered with reported mode of travel in the JTW data.
Tri‐Rail Parking and Circulation Study. This 2008 study presents weekday boardings by station and was a useful source to estimate Tri‐Rail ridership within the Southeast Florida market.
South Florida Regional Transportation Authority Transit Development Plan, FY 2008‐2012. This report contained the results of a 2007 on‐board origin and destination survey for Tri‐Rail that was
Case 1:15-cv-00632-CRC Document 21-2 Filed 05/28/15 Page 52 of 154

All Aboard Florida Ridership and Revenue Study
May 7, 2015
Page 36
used to determine the portion of Tri‐Rail ridership traveling between the three cities to be served by AAF.
LBG Origin and Destination Survey. An origin and destination survey was administered to provide an additional check of the trip table.
LBG Stated Preference Survey Data. Although not designed to provide accurate O‐D patterns, data from LBG’s SP survey was also used to occasionally fill gaps in the data sources listed above. Respondents provided information on both the intercity travel destinations within the corridor, and the general frequency of each trip together with the typical mode of travel.
3.3 TripPurposeandModesofTravel
Several market segments were evaluated during the mode choice model estimation process including business, non‐business, resident, non‐resident, and commuter travelers. Through an analysis of survey responses (see Section 4) on value of time, preference for mode, response to frequency of service, and other variables, LBG identified two primary market segments for application of the mode choice model:
Business Travelers
Non‐Business Travelers
The mix of travel modes operating between each individual intercity travel pair varied depending on the travel distance classification (long or short distance). The list of modes available for each travel distance classification includes:
Long Distance o Auto o Air o Intercity Bus o Rail (Amtrak)
Short Distance o Auto o Intercity Bus o Commuter Rail (Tri‐Rail)
3.4 MarketGeography The catchment area for the proposed All Aboard Florida service was determined based on the proposed station locations, which are Miami, Fort Lauderdale, West Palm Beach and Orlando. The study area (Figure 3.4.‐1) consists of following counties or groups of counties:
Miami‐Dade County (Southeast Florida)
Broward County (Southeast Florida)
Palm Beach County (Southeast Florida)
Greater Orlando – includes Lake, Orange, Osceola, Seminole and Brevard Counties (Central
Florida)
Case 1:15-cv-00632-CRC Document 21-2 Filed 05/28/15 Page 53 of 154
All Aboard Florida Ridership and Revenue Study
May 7, 2015
Page 37
Catchment areas for the long distance market were developed at the ICAT Traffic Analysis Zone (TAZ) level depicted in Figure 3.4‐1.
A higher degree of geographic resolution was applied to the analysis of the short‐distance travel market and the catchment areas defined for these trips are presented in Figure 3.4‐2. The methodology used to develop the catchment areas for the short distance market is outlined below:
Short‐distance catchment areas are based on 20 to 30 minute travel time to the station locations.
o Travel times are based on a trip‐weighted average composite of peak and off‐peak travel times as represented in the 2010 base year of the Southeast Florida Regional Planning Model (SERPM) version 6.7.
o Catchment area boundaries reflect SERPM traffic analysis zones (TAZs) and districts (higher level aggregation of TAZs) falling within the 20 to 30 minute station access travel shed.
Short‐distance catchment areas were divided into forecast analysis zones representing a level of geography more detailed than the district level, but still more aggregate than the SERPM TAZ‐level.
o Depending on size, districts were divided into 5 to 10 zones. On average zones are comprised of 10 to 12 TAZs.
o There are 234 AAF analysis zones across the three catchment areas
58 in Palm Beach County
120 in Broward County
56 in Miami‐Dade County
Case 1:15-cv-00632-CRC Document 21-2 Filed 05/28/15 Page 54 of 154

All Aboard Florida Ridership and Revenue Study
May 7, 2015
Page 38
Figure 3.4‐1: Zone Structure for the Long‐Distance Intercity Travel Evaluation
Source: LBG, 2012.
Case 1:15-cv-00632-CRC Document 21-2 Filed 05/28/15 Page 55 of 154

All Aboard Florida Ridership and Revenue Study
May 7, 2015
Page 39
Figure 3.4‐2: Zone Structure for Southeast Florida Intercity Travel Evaluation
Source: LBG, 2012.
Case 1:15-cv-00632-CRC Document 21-2 Filed 05/28/15 Page 56 of 154

All Aboard Florida Ridership and Revenue Study
May 7, 2015
Page 40
3.5 IntercityTravelVolumesApplication of the mode choice model began with development of a trip table representing origins and destinations for intercity travelers. The trip table matrix was designed to provide a full accounting of daily intercity travel volumes to and from each zone by mode. Separate trip tables were developed for each mode and market segment. The process of trip table development and data sources we employed are outlined in the following sections. In most cases trips are presented as daily trips to document the assumptions employed in the travel demand model which is based on daily person trip volumes. Even though the first year of revenue service for AAF will be in 2016, the base year for forecasting and benchmarking purposes is 2015 given the majority of public sources provide five year forecasts (2010, 2015, 2020, etc) for data.
3.5.1 AutosThe study team conducted a thorough investigation to determine the level of intercity auto travel in both long and short distance travel markets, together with the distribution among the key origin and destination pairs. LBG evaluated several independent sources of travel data including: ICAT auto trip data, regional travel demand models, and data collected from an O‐D survey implemented for this AAF study. The following sections outline the process used to derive the auto volumes of the long distance travel market – a detailed discussion of the short distance trip table development is provided in the appendices of this report.
3.5.1.1 I‐95CorridorCoalitionTripData
The LBG forecast model for full implementation of AAF service from Miami to Orlando utilizes trip tables produced by the I‐95 Corridor Coalition to profile the volume of long‐distance auto travel. The coalition is an organization comprised of state departments of transportation and other stakeholders in the states on the eastern seaboard that are connected by Interstate 95. To aid in planning for intercity travel infrastructure in the corridor, the coalition commissioned the Integrated Corridor Analysis Tool (ICAT), a dataset containing trip tables and full highway networks for each of the states in the corridor, including Florida.
Unlike the travel data typically obtained from localized travel demand models, the ICAT dataset, developed by Cambridge Systematics, Inc. for the Coalition, is one of the few transportation data sources that provides origin and destination patterns for the types of long‐distance intercity trips of interest to this study. The ICAT trip tables have been calibrated to match 2005 base year traffic counts observed on I‐95 and other major interstates and arterial roadways throughout the defined corridor. Table 3.5‐1 presents the ICAT long‐distance auto trip volumes for the AAF market area defined in Figure 3.4‐1. The predicted change in the volume of auto vehicle trips implies a growth rate of approximately 9% between 2010 and 2015.
Table 3.5‐1: Long Distance Daily Auto Vehicle Trips, ICAT
City Pair Auto Trips
2010 2015
Central Florida to Miami 5,810 6,471
Central Florida to Fort Lauderdale 6,225 6,805
Central Florida to West Palm Beach 6,468 6,978
TOTAL 18,503 20,254
Case 1:15-cv-00632-CRC Document 21-2 Filed 05/28/15 Page 57 of 154
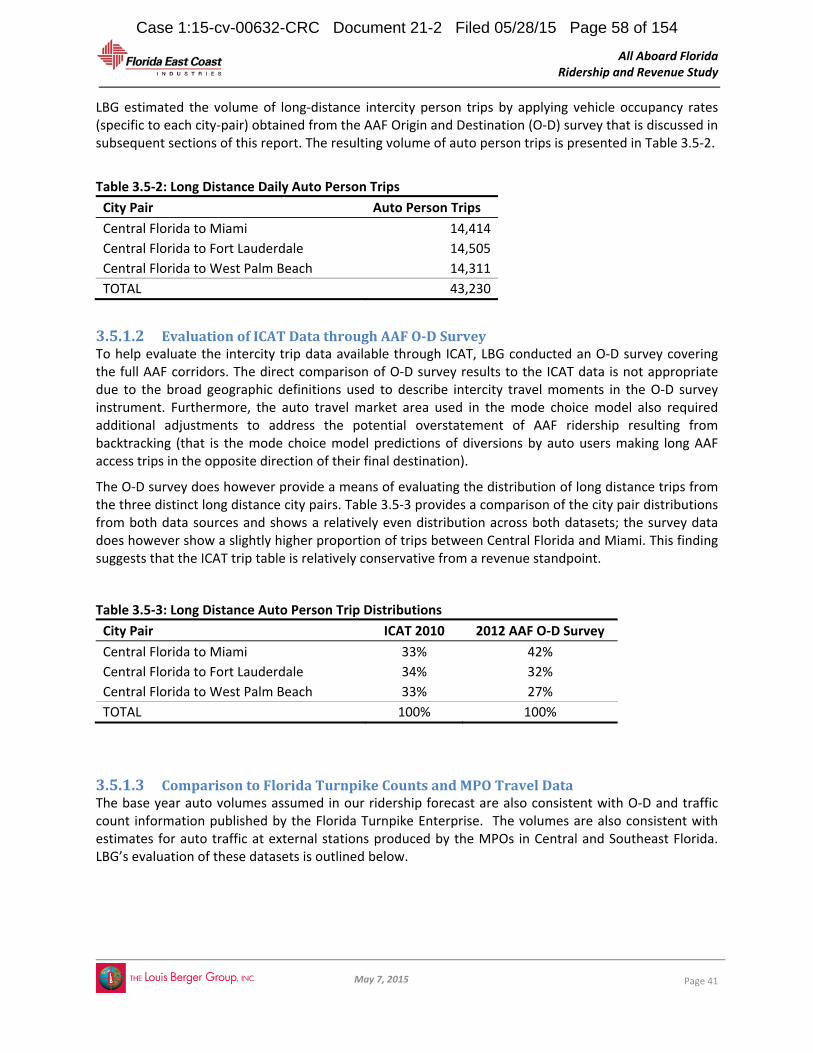
All Aboard Florida Ridership and Revenue Study
May 7, 2015
Page 41
LBG estimated the volume of long‐distance intercity person trips by applying vehicle occupancy rates (specific to each city‐pair) obtained from the AAF Origin and Destination (O‐D) survey that is discussed in subsequent sections of this report. The resulting volume of auto person trips is presented in Table 3.5‐2.
Table 3.5‐2: Long Distance Daily Auto Person Trips
City Pair Auto Person Trips
Central Florida to Miami 14,414
Central Florida to Fort Lauderdale 14,505
Central Florida to West Palm Beach 14,311
TOTAL 43,230
3.5.1.2 EvaluationofICATDatathroughAAFO‐DSurveyTo help evaluate the intercity trip data available through ICAT, LBG conducted an O‐D survey covering the full AAF corridors. The direct comparison of O‐D survey results to the ICAT data is not appropriate due to the broad geographic definitions used to describe intercity travel moments in the O‐D survey instrument. Furthermore, the auto travel market area used in the mode choice model also required additional adjustments to address the potential overstatement of AAF ridership resulting from backtracking (that is the mode choice model predictions of diversions by auto users making long AAF access trips in the opposite direction of their final destination).
The O‐D survey does however provide a means of evaluating the distribution of long distance trips from the three distinct long distance city pairs. Table 3.5‐3 provides a comparison of the city pair distributions from both data sources and shows a relatively even distribution across both datasets; the survey data does however show a slightly higher proportion of trips between Central Florida and Miami. This finding suggests that the ICAT trip table is relatively conservative from a revenue standpoint.
Table 3.5‐3: Long Distance Auto Person Trip Distributions
City Pair ICAT 2010 2012 AAF O‐D Survey
Central Florida to Miami 33% 42%
Central Florida to Fort Lauderdale 34% 32%
Central Florida to West Palm Beach 33% 27%
TOTAL 100% 100%
3.5.1.3 ComparisontoFloridaTurnpikeCountsandMPOTravelDataThe base year auto volumes assumed in our ridership forecast are also consistent with O‐D and traffic count information published by the Florida Turnpike Enterprise. The volumes are also consistent with estimates for auto traffic at external stations produced by the MPOs in Central and Southeast Florida. LBG’s evaluation of these datasets is outlined below.
Case 1:15-cv-00632-CRC Document 21-2 Filed 05/28/15 Page 58 of 154

All Aboard Florida Ridership and Revenue Study
May 7, 2015
Page 42
As outlined in Table 3.5.4, the number of daily auto vehicle trips between Southeast Florida and Central Florida taking the Turnpike is expected to be around 12,197 vehicles (trips originating from or destined to portions of our study area in Orange, Osceola, Seminole or Lake counties). The most direct route for the 6,306 trips to/from the portion of the study area in Brevard County is I‐95.
Table 3.5‐4: ICAT Daily Auto Vehicle Trips Central Florida – SEF, 2010
To/From Central Florida Counties: Daily Auto
Vehicle Trips Most Direct
Route
Orange, Osceola, Seminole, Lake 12,197 Turnpike
Brevard 6,306 I‐95
Total 18,503
At the southern boundary of the Central Florida region, the CFRPM shows over 29,000 trips on the Turnpike and nearly 33,000 trips on I‐95 (Table 3.5‐5). Of these total vehicle trips, 15,871 of the Turnpike trips are estimated to originate from or be destined to Central Florida (External to Internal (EI) or Internal to External (IE)). The remainder are through trips (External to External (EE)). On I‐95 the number of EI/IE trips is 20,439. When allowing for trips to or from St. Lucie and Martin counties which are excluded from our evaluation, the ICAT data are consistent with these EI/IE assumptions.
Table 3.5‐5: CFRPM External Station Counts, Daily Vehicle Trips, 2005
External Station (Sta. Num.) Daily Vehicle
Trips EE Trips EI/IE Trips
Turnpike (4509) 29,167 13,296 15,871
I‐95 (4506)
32,967
12,528
20,439
The Florida Turnpike Ticket System, which runs from Central Florida to Palm Beach County (where the Southern Coin System begins), provides toll plaza entry and exit counts for autos. Table 3.5‐6 displays the two‐way counts between Three Lakes Plaza at the southern end of the Central Florida Region, to key plazas through Lantana Plaza south of West Palm Beach. Between June 2009 and June 2010, the number of autos traveling daily on the Turnpike between Three Lakes Plaza and exits in Palm Beach and points south was 14,451. Of these auto trips, approximately 30% originated from or were destined to the Palm Beach exits with the remainder destined for points south. This distribution of trips is consistent with the ICAT data and AAF O‐D survey findings displayed in Table 3.5‐3.
Case 1:15-cv-00632-CRC Document 21-2 Filed 05/28/15 Page 59 of 154

All Aboard Florida Ridership and Revenue Study
May 7, 2015
Page 43
Table 3.5‐6: Turnpike Ticket System Daily Plaza Entry and Exit Counts, June 2009 ‐ June 2010
Daily Auto
Vehicle Trips % Location of Toll Plaza Pairs
Three Lakes Plaza ‐ Yehaw Jct. 2,312 11% Within CF region
Three Lakes Plaza ‐ St. Lucie/Martin Exits
4,987 23% Outside of CF and SEF Regions
Three Lakes Plaza ‐ Palm Beach Exits
4,362 20% CF‐SEF Intercity
Three Lakes Plaza ‐ Lantana and South
10,089 46% CF‐SEF Intercity
Total 21,750 100%
Total CF‐SEF Intercity 14,451 76%
Overall the traffic count and origin and destination data available from the MPOs and the Florida Turnpike Enterprise are consistent with the volume of auto trips assumed in the AAF trip table as well as the distribution of trips between Central Florida, West Palm Beach and points south.
3.5.2 Air
Air travel volumes for the long distance travel market were derived using data obtained from both the FAA 10% sample of tickets, as well as Orlando International Airport (IATA airport code MCO) air traffic reports published by Greater Orlando Aviation Authority (GOAA). Data from the 2010 FAA 10% Sample (Table 3.5‐4) shows the Orlando‐Miami (IATA airport code MIA) and the Orlando‐Fort Lauderdale (IATA airport code FLL) to be the primary air travel routes between Central and Southeast Florida; a negligible volume of travel is observed between Orlando and West Palm Beach airport (IATA airport code PBI). The 2011 GOAA data (Table 3.5‐5) provided a similar overall volume of long distance air travel, but also presented a more balanced picture of travel between the two key airport pairs. LBG adopted the more recent 2011 GOAA data for the air travel trip tables.
Table 3.5‐4: Annual Air Passenger Volumes, FAA 10% Ticket Sample 2010
Airport Pair (Both Directions) Air Passengers
Annual Daily
Orlando (MCO) ‐ Palm Beach (PBI) 40 <1
Orlando (MCO) ‐ Fort Lauderdale (FLL) 163,500 448
Orlando (MCO) ‐ Miami (MIA) 88,900 244
TOTAL 252,440 692
Case 1:15-cv-00632-CRC Document 21-2 Filed 05/28/15 Page 60 of 154

All Aboard Florida Ridership and Revenue Study
May 7, 2015
Page 44
Table 3.5‐5: Daily Air Passenger Volumes, GOAA 2011
Airport Pair (Both Directions) 2010 2015
Orlando (MCO) ‐ Palm Beach (PBI) 0 0
Orlando (MCO) ‐ Fort Lauderdale (FLL) 350 382
Orlando (MCO) ‐ Miami (MIA) 302 330
TOTAL 652 712
3.5.3 Rail
The rail travel market analyzed in this study distinguished between the long and short distance markets. Amtrak travel volumes were used to estimate the size of the existing long‐distance rail travel market, while Tri‐Rail volumes provided the basis from which the short distance market was estimated.
3.5.3.1 LongDistanceRail(Amtrak)The 2010 Amtrak state fact sheet reported 159,000 boardings and alightings at Amtrak’s Orlando train station. This volume of travel reflects all trips to and from Orlando. LBG estimated that approximately a third of all Orlando boardings and alightings accrue to Southeast Florida travel based on the proportional distribution of boarding/alighting data from other Amtrak stations within the state of Florida. The 53,000 annual Central‐Southeast Florida trips were also distributed to each of the three Southeast Florida AAF stops on the proportional basis of boarding/alighting data. The resulting estimates of daily Amtrak rail volume in the 2010 AAF travel market are presented in Table 3.5‐6. The relatively small long‐distance rail travel market is most likely a function of Amtrak’s long travel times (6‐7 hours from Orlando to Miami). Table 3.5‐6: Estimated Daily Long‐Distance Rail Trips
City Pair 2010 2015
Orlando ‐ Miami 64 70
Orlando ‐ Fort Lauderdale 38 42
Orlando ‐ West Palm 43 47
TOTAL 145 159
Source: LBG (2012)
3.5.3.2 CommuterRail(Tri‐Rail)Tri‐Rail service covers a 72‐mile corridor from Miami to West Palm Beach with 18 station stops (5 stations in Miami‐Dade, 7 in Broward, and 6 in Palm Beach County). Primary stations covering the three city market area, are Mangonia Park Station and West Palm Beach Station, Fort Lauderdale downtown and FLL airport, and Metrorail Transfer Station, Hialeah Market, and Miami Airport Station. Because of its broad station coverage of the three‐county Southeast Florida region, not all Tri‐Rail locations will be directly competitive with AAF and so only a portion of the Tri‐Rail ridership was
Case 1:15-cv-00632-CRC Document 21-2 Filed 05/28/15 Page 61 of 154

All Aboard Florida Ridership and Revenue Study
May 7, 2015
Page 45
included in the candidate market for AAF service. To determine this proportion, LBG examined the South Florida Regional Transportation Authority Transit Development Plan, FY 2008‐2012. This report contained the results of a 2007 on‐board origin and destination survey for Tri‐Rail that can be used to determine the portion of Tri‐Rail ridership traveling between the three cities to be served by AAF. The survey indicated that approximately 20 percent of total ridership has both an origin and destination in the central city locations to be served by AAF. With an average annual daily ridership of approximately 10,400 in 2010, LBG estimated 2,050 commuter rail person trips in 2010 and included 2,250 in the trip table for the 2015 base year. Table 3.5‐7 displays the assumptions for daily ridership by city pair.
Table 3.5‐7: Estimated Daily Short‐Distance Rail Trips
City Pair Rail Person Trips
Miami ‐ West Palm 503
Miami ‐ Fort Lauderdale 1,114
Fort Lauderdale ‐ West Palm 636
TOTAL 2,253
Source: LBG (2012)
3.5.4 BusTrips
The bus travel market analyzed in this study distinguished between the long and short distance markets. Published bus schedules were used to estimate the size of both markets. The intercity bus operators serving the Central‐Southeast Florida market include; Florida Express, Greyhound, Florida Sunshine, Red Coach, Orlando‐Miami Bus Company. LBG estimated an average of 20 daily departures between Central and Southeast Florida in 2010 based on published bus schedules of all the operators listed above. Assuming an average of 25 passengers per vehicle and an O‐D distribution pattern similar to the rail travel market, LBG estimated the 2010 daily volumes presented in Table 3.5‐8 – growth factors were applied to derive a 2015 bus trip volume.
Table 3.5‐8: Estimated Daily Intercity Long Distance Bus Trips
City Pair Bus Person Trips
2010 2015
Central Florida to Miami 212 263
Central Florida to Fort Lauderdale 126 176
Central Florida to West Palm Beach 145 195
TOTAL 483 634
Source: LBG (2012)
The number of intercity bus connections in Southeast Florida is limited to one public agency and a small number of privately operated services. The key services are as follows.
Broward County Transit – The 95Express and 595Express services each offer approximately 12 busses per day and attract a total of approximate 1,000 riders per day (average annual daily basis from BCT reports). The full one‐way fare is $2.35.
Case 1:15-cv-00632-CRC Document 21-2 Filed 05/28/15 Page 62 of 154

All Aboard Florida Ridership and Revenue Study
May 7, 2015
Page 46
Greyhound – This private provider offers about 12 trips per day from Miami to Fort Lauderdale and 5 from Miami through to West Palm Beach. One‐way cost is approximately $10 to $25.
Florida Sunshine – This private provider offers about 5 trips per day from Miami to West Palm Beach with a stop in Fort Lauderdale.
Red Coach ‐ This private provider offers about 3 trips per day from Miami to West Palm Beach with a stop in Fort Lauderdale.
Where ridership estimates are not published, the number of daily riders was estimated from daily trips with a load factor of 60 percent. Table 3.5‐9 shows the number of bus riders assumed for the base year forecast.
Table 3.5‐9: Estimated Intercity Daily Short Distance Bus Trips, 2015
City Pair Bus Person Trips
Miami ‐ West Palm Beach 360
Miami ‐ Fort Lauderdale 1,940
Fort Lauderdale ‐ West Palm Beach 160
Total 2,460 Source: LBG (2012)
3.5.5 Annualization
The trip table was developed using daily estimates of travel by mode as outlined in the sections above. To arrive at the annual forecast of travel by mode detailed in Section 6, LBG used an annualization factor of 365. Given the attributes of the daily traffic estimates used in the trip table and plans for marketing and implementation this is an appropriate assumption. Factors supporting the annualization assumption include the following.
Daily trips for the public modes of travel are based on average annual daily observations. For example, ridership estimates for existing Amtrak and Tri‐Rail services are based on total annual volumes divided by 365 to represent average annual daily travel. Base year air trips were estimated on a similar basis.
Intercity auto travel on the Turnpike is comprised of substantial weekend travel volumes which in some cases exceed average daily weekday volumes. For example, traffic on a weekend day is 1.06x AADT at the Three Lakes plaza near Yehaw junction between Orlando and SEF, where weekday traffic is 0.98x AADT (Florida Turnpike Mainline Customer Mix Report, 2010). In 2010, annualization factors for toll plazas within and between Central and Southeast Florida ranged from 362 to 367.
A large portion of the AAF market will be leisure travelers making trips between Central and Southeast Florida and within Southeast Florida. Given the observed weekend intercity travel volumes, AAF plans to offer the same frequency of service on weekend days to best serve this market.
Case 1:15-cv-00632-CRC Document 21-2 Filed 05/28/15 Page 63 of 154
All Aboard Florida Ridership and Revenue Study
May 7, 2015
Page 47
3.5.6 ConsiderationofAutoCaptives The data used to estimate the number of trips in the total auto travel market does not provide any indication of auto dependency at the trip destination, nor the amount of intermediate stops made between each origin and destination zone. These auto captive effects may have the potential to overstate AAF ridership if left unaddressed in the forecast. LBG estimated the likely impact of auto‐captive travelers in order to provide an AAF ridership risk adjustment factor that accounts for the auto captive phenomenon. Data from LBG’s stated preference survey indicated that approximately 30% of auto travelers required a vehicle at their trip destination (destination captives), while approximately 12% of auto travelers made intermediate stops enroute to their final destination (enroute captives).
As expected, statistical tests of the SP data showed that the inclusion of captive traveler responses in the SP data drives up the predicted mode share of long distance auto travel. LBG elected to focus its analysis on enroute captives with the assumption that even though destination captives were less likely to opt for public modes of travel, they could still use AAF service and rely on rental cars at their long distance trip destination. The destination auto‐dependent preferences are reflected in the mode constant (modal bias component) of the mode choice utility equations applied to all auto trips and therefore the AAF forecast incorporates this consideration. Enroute captives would be less likely to use AAF service under any circumstances. Given that enroute captive travelers were already embedded in the ICAT auto travel volumes and their travel preferences reflected in higher auto mode constants, LBG developed a single adjustment factor that would account for the counter‐directional impacts of both effects: excluding enroute captive travelers from the auto trip table; removing the incremental auto bias from the mode choice equations. The exclusion of enroute captives from the trip table we use to develop the forecast reduces the auto trip table volume by 12 percent while simultaneously raising the AAF mode share by about 5 percent. This results in net effect to AAF of approximately 7 percent, overall. This effect is accounted for in our forecast to ensure a conservative assumption regarding the capture rate of AAF service.
Case 1:15-cv-00632-CRC Document 21-2 Filed 05/28/15 Page 64 of 154
All Aboard Florida Ridership and Revenue Study
May 7, 2015
Page 48
4. PrimaryMarketResearchandAnalysis The primary market research for the All Aboard Florida Ridership Study consisted of a stated preference (SP) mode choice survey that supports the ridership forecast model and an Origin‐Destination (O‐D) survey used to confirm the validity of the trip table.
4.1 OverviewofMarketResearchObjectives Stated Preference Mode Choice Survey ‐ All Aboard Florida system is an entirely new type of service whose unique features can only be tested in hypothetical scenarios that pit All Aboard Florida against other competing modes. The current state‐of‐the‐practice uses mode choice stated preference surveys as the basis for understanding how individuals (or groups of individuals) value individual attributes, such as access time, in‐vehicle travel time, headways, and cost ‐ of a transportation choice. SP survey data was used to develop estimates of the All Aboard Florida market share and is the basis of the All Aboard Florida ridership forecast. The data provides insights into current travel habits and preferences that will be useful for marketing the new service. User benefit metrics such as the value‐of‐time (VOT) that reflect the rate at which an individual substitutes additional travel costs in exchange for travel time savings, have also been derived from the SP survey findings. VOT measures comprise a key input to the measurement of economic benefits accruing from the project. Origin and Destination Survey ‐ A trip table that presents the number of intercity trips between Southeast Florida and Central Florida as well as between the main cities of Southeast Florida is a key input to the ridership forecast. The development of an accurate trip table remains one of the most critical challenges in the development of an intercity rail forecast. This is attributable to the fact that in the US, travel behavior research is most often focused on regional travel patterns with emphasis on journey‐to‐work trips by auto and intra‐city transit. Trips between major metropolitan areas are not well studied and data for these movements is more limited. To provide a comprehensive basis for the intercity travel forecast, an intercity O‐D survey was designed and implemented. The data was weighted and expanded and provided an additional check of the trip table that was used for the development of the ridership forecast in Section 5.
4.2 Origin‐DestinationSurvey
4.2.1 OverviewofMethodsAn O‐D survey was designed to support the development of an intercity trip table that details the number of trips by purpose and mode. The survey collected information about intercity trips between Central Florida and Southeast Florida as well as within Southeast Florida. Analytical weights were developed and applied to the survey results to inform the O‐D trip table that forms the basis of the ridership forecast.
Case 1:15-cv-00632-CRC Document 21-2 Filed 05/28/15 Page 65 of 154

All Aboard Florida Ridership and Revenue Study
May 7, 2015
Page 49
4.2.2 SurveyDesign
The survey has four distinct sections:
Screening Questions – Screening questions determine whether a person is qualified to participate in the survey. Only residents of the market area who are 18 year or older were qualified to participate.
Intercity trips – Respondents were asked whether they made any intercity trip between the O‐D pairs of interest in the past month (2 months for respondents with zero trips in the past month). Respondents who reported zero trips were routed to the demographic questions at the end of the survey.
Trip Information – For every trip they made within the reference period, respondents were asked to provide the start location, end location, mode and purpose.
Demographic information ‐ The final section of the survey collected data on the respondent’s demographic characteristics.
4.2.3 SamplingPlanandAdministration
The total sample size for this study was 8,000 completes, including both respondents who made a qualifying trip and respondents who did not. Two minimum targets were defined for the O‐D survey. The first was to obtain a minimum of 400 respondents from each of the following regions: (1) Greater Orlando; (2) Brevard County; (3) Palm Beach County; (4) Broward County; (5) Miami‐Dade County; (6) Atlanta metro area; (7) Chicago metro area; (8) New York metro area; (9) Philadelphia metro area; and (10) Washington, DC metro area. The second goal was to obtain for each of the twenty intercity O‐D pairs, at least 100 respondents who made at least one trip between the pair. The survey was administered using an e‐panel in May 2012. The LBG team closely monitored the incidence of the reported trips per respondent, the respondent place of residence, and respondent age to ensure the study resulted in a representative dataset. A total of 10,874 respondents completed the survey and reported an average of 1.6 trips within the past 2 month recall period. Among Florida residents, 61.9 percent made at least one trip within the recall period while only 8.6 percent of the non‐residents reported a trip during the recall period.
Case 1:15-cv-00632-CRC Document 21-2 Filed 05/28/15 Page 66 of 154

All Aboard Florida Ridership and Revenue Study
May 7, 2015
Page 50
4.2.4 DataOverview
An overview of key socioeconomic characteristics of respondents is presented in the tables below. Table 4.2‐1 shows that younger persons are more likely to report at least one trip between study area OD pairs than older persons.
Table 4.2‐1: Age
Total
Number of Respondents
Percent of Total
Respondents
Percent of Respondents with at least
1 Trip
Residents
18‐24 247 5.8% 67.2%
25‐34 677 15.9% 65.7%
35‐44 785 18.4% 64.1%
45‐54 785 18.4% 62.5%
55‐64 906 21.3% 61.6%
65+ 859 20.2% 53.8%
Total 4259 100% 61.6%
Non Residents
18‐24 524 9.5% 12.8%
25‐34 893 16.2% 12.0%
35‐44 948 17.2% 10.2%
45‐54 1008 18.3% 7.8%
55‐64 985 17.9% 8.0%
65+ 1153 20.9% 5.7%
Total 5511 100% 9.0%
Source: LBG (2012)
Men are more likely than woman to have made at least one trip during the recall period (Table 4.2‐2).
Table 4.2‐2: Gender
Total Number of Respondents
Percent of Total
Respondents
Percent of Respondents with at least
1 Trip
Residents Male 1,649 38.7% 63.8%
Female 2,610 61.3% 60.3%
Non Residents Male 2,556 46.4% 9.9%
Female 2,955 53.6% 8.2%Source: LBG (2012)
Case 1:15-cv-00632-CRC Document 21-2 Filed 05/28/15 Page 67 of 154

All Aboard Florida Ridership and Revenue Study
May 7, 2015
Page 51
Persons residing in households with three or more persons are more likely to have made a trip within the reference period than those living alone or in a two‐person household (Table 4.2‐3).
Table 4.2‐3: Household size
Total Number of Respondents
Percent of Total
Respondents
Percent of Respondents with at least
1 Trip
Residents
One person 822 19.3% 57.5%
Two person household 2002 47.0% 61.3%
Three person household 693 16.3% 64.8%
Four person household 478 11.2% 64.0%
Five or more person household 264 6.2% 64.4%
Non Residents
One person 1047 19.0% 7.4%
Two person household 2346 42.6% 9.2%
Three person household 928 16.8% 9.7%
Four person household 771 14.0% 9.9%
Five or more person household 419 7.6% 8.8%
Source: LBG (2012)
Persons residing in households without any vehicles are less likely to report a trip than those with vehicles (Table 4.2‐4).
Table 4.2‐4: Vehicles per Household
Total Number of Respondents
Percent of Total
Respondents
Percent of Respondents with at least
1 Trip
Residents
Zero vehicle 54 1.3% 40.7%
One vehicle 1358 31.9% 55.9%
Two vehicles 2058 48.3% 64.1%
Three or more vehicles 789 18.5% 66.4%
Non Residents
Zero vehicle 344 6.2% 4.1%
One vehicle 1464 26.6% 10.0%
Two vehicles 2367 43.0% 8.1%
Three or more vehicles 1336 24.2% 10.7%
Source: LBG (2012)
Case 1:15-cv-00632-CRC Document 21-2 Filed 05/28/15 Page 68 of 154

All Aboard Florida Ridership and Revenue Study
May 7, 2015
Page 52
Residents with higher household incomes are more likely to have made at least one trip between a study area OD pair than those with lower household incomes (Table 4.2‐5). Among non‐residents, the high proportion of low‐income persons who made at least one trip are likely to be college students who may have additional sources of income beyond the income that they report.
Table 4.2 ‐5: Household Income
Total Number of
Respondents
Percent of Total
Respondents
Percent of Respondents with at least 1
Trip
Residents
Less than $25,000 277 7.7% 50.9%
$25,000 to $49,999 819 22.8% 56.5%
$50,000 to $74,999 795 22.2% 60.6%
$75,000 to $99,000 686 19.1% 67.9%
$100,000 to $149,999 625 17.4% 66.1%
$150,000 to $199,999 233 6.5% 72.1%
$200,000 or more 152 4.2% 73.0%
Non Residents
Less than $25,000 234 5.2% 12.0%
$25,000 to $49,999 645 14.4% 7.9%
$50,000 to $74,999 803 17.9% 7.7%
$75,000 to $99,000 859 19.2% 8.7%
$100,000 to $149,999 1080 24.1% 10.6%
$150,000 to $199,999 478 10.7% 11.3%
$200,000 or more 385 8.6% 10.6%
Source: LBG (2012)
The socioeconomic data presented above allowed the study team to track the performance of the survey against benchmarks for the region available through the American Community Survey. We have included this information here to provide full transparency on the basis of the survey sample. Overall, the study team found the administration of the survey to be in line with the sampling plan and the sample to be representative of the regional population as a whole. The process of data preparation for deriving regional trip information from the sample was also informed by this socio‐demographic information. The data preparation process is described below.
4.2.5 DataPreparation
Before the OD survey data was used to inform trip table development, the data was corrected, weighted and expanded.
The following adjustments were made:
Non‐reported trip correction: In origin and destination surveys, respondents typically underestimate non‐mandatory trips and adjustments need to be made to account for these non‐reported trips. Specific problems encountered in this survey included cases where the respondents omitted to enter
Case 1:15-cv-00632-CRC Document 21-2 Filed 05/28/15 Page 69 of 154

All Aboard Florida Ridership and Revenue Study
May 7, 2015
Page 53
the return trip and reported multiple outbound trips without corresponding inbound trips or reported loop trips (i.e., trips with the same origin and destination) instead of two one‐way trips. These trips were added to the dataset as part of the data correction process. Table 4.2‐6 presents an overview of the reported trips by purpose after the missing trips were added. Business trips account for 14.5 percent of long distance trips while personal trips, defined as a combination of personal business and leisure/ recreation/ social trips account for 74.0 percent of trips in the OD survey. This distribution is similar to the national distribution estimated based on the National Household Transportation Survey (NHTS) 2001, which includes 15.9 percent business trips and 68 percent personal trips (i.e., personal business and leisure/recreation/social).
Table 4.2‐6: Trips by purpose
Trip Purpose Short
Distance Long
Distance
Long Distance NHTS
Leisure/recreation/social 39.2% 46.8% 55.5%Personal business (trip made for personal, family, religious or medical reasons)
22.7% 27.2% 12.6%
Company business 12.6% 14.5% 15.9%
Go to/from work or school 11.6% 3.3% 12.7%
Go to/from an airport 7.3% 1.3%
Combination of business or leisure 3.4% 4.6%
Other (specify) 3.1% 2.3% 3.4%
Total 100.0% 100.0% 100.0%
Source: LBG (2012); NHTS (2001)
Other instances of non‐ reported trips occurred when respondents did not complete the survey. Some respondents provided a count of the total number of qualified trips they made within the recall period at the start of the survey and did not continue to provide the required information for each individual trip. As expected, the problem occurred more frequently with respondents who took many trips within the recall period. The issue was addressed by multiplying the number of reported trips by a trip adjustment factor that was based on the relationship between the average number of trips reported by respondents who completed the survey and the number of trips reported by those who did not complete the survey.
Socio‐demographic correction: While the study team attempted to collect a sample with an age and gender distribution equal to the population’s age and gender distribution, adjustments were made during the data preparation phase to ensure that each region’s sample mirrored the distribution of the region’s population as reported by the American Community Survey. As part of this process, each respondent was assigned a weight based upon its age, gender and residential location.
Expansion: After the data corrections were made the data was expanded to represent the total population of in the study region. The expanded data provides an estimate of the number of trips by the study area population within the recall period.
Annual Estimate: To develop an annual estimate, the following assumptions were used to convert the reported trips during the recall period into annual trips.
For non‐residents, it was conservatively assumed that the number of reported trips equals the number of annual trips.
Case 1:15-cv-00632-CRC Document 21-2 Filed 05/28/15 Page 70 of 154

All Aboard Florida Ridership and Revenue Study
May 7, 2015
Page 54
For trips between Southeast Florida and Central Florida (long distance trips) made by residents, the number of reported trips was converted into annual trips using an average of 3.4 long distance trips per person per year, which the average annual number of trips of a distance similar to the distance between Central and Southeast Florida (120 to 280 miles) made by Central and Southeast Florida residents as reported by the 2009 National Household Travel Survey (NHTS).
For trips within Southeast Florida (short distance trips) made by residents, the number of reported trips was converted into annual trips as follows: the number of reported trips was multiplied by 12 if the recall period was 1 month and by 6 if the recall period was 2 months, unless the trip purpose was commute or business. In the latter cases, the number of reported trips was multiplied by 11.3 if the recall period was 1 month and by 5.7 if the recall period was 2 months, which is based on 49 work weeks a year. The resulting number of trips was further adjusted using an average of 90 trips per year for Southeast Florida residents and an average of 35 trips per year for Orlando residents, which is the average number of trips of similar distance made by Central and Southeast Florida residents as reported by the 2009 National Household Travel Survey (NHTS).
Table 4.2‐7 presents the resulting trip table with the auto trips based on the survey and the non‐auto trips based on the sources identified in Section 3.3.
Table 4.2‐7: Trips by Mode, 2012
Car Air Train Bus Total
Long Distance Trips:
Miami ‐ Orlando 9,333,230 88,900 23,300 77,555 9,522,985
Miami ‐ Cocoa 1,430,996 39,785 ‐ 20,075 1,490,856
Fort Lauderdale ‐ Orlando 6,499,459 163,500 13,826 46,022 6,722,807
Fort Lauderdale ‐ Cocoa 1,654,088 12,077 ‐ 20,075 1,686,241
West Palm ‐ Orlando 5,126,739 ‐ 15,874 52,840 5,195,453
West Palm ‐ Cocoa 1,699,570 ‐ ‐ 20,075 1,719,645
Subtotal Long Distance 25,744,083 304,262 53,000 236,642 26,337,987
Short Distance Trips:
Miami ‐ West Palm 57,590,850 ‐ 572,690 53,690 58,217,229
Miami ‐ Fort Lauderdale 253,289,824 ‐ 814,263 644,625 254,748,711
Fort Lauderdale ‐ West Palm 101,064,336 ‐ 931,418 121,489 102,117,243
Orlando ‐ Cocoa 73,001,937 ‐ ‐ ‐ 73,001,937
Subtotal Short Distance 484,946,947 ‐ 2,318,370 819,803 488,085,121
Grand Total 510,691,031 304,262 2,371,370 1,056,445 514,423,108Source: LBG (2012)
The resulting trip volumes were compared with the ICAT data that were used to develop the initial trip table developed for the ridership forecast.
Case 1:15-cv-00632-CRC Document 21-2 Filed 05/28/15 Page 71 of 154

All Aboard Florida Ridership and Revenue Study
May 7, 2015
Page 55
Table 4.2‐8: Comparison of Auto Trip Volumes
Survey, 2012 ICAT, 2010
Long Distance Trips 25,744,083
26,010,726
Short Distance Trips 484,946,947
466,127,972
Source: LBG (2012)
The review led to the following adjustments to the initial trip table to create the final version:
For short distance trips, the OD survey demonstrates a breakdown of auto trips between OD pairs that is similar to the distribution shown by ICAT but different from the breakdown by the SEFTPM. The OD questions in the mode choice SP survey, which were intended to provide a general idea of trip distribution and presented below in Section 4.3.5.4, show a distribution similar to that of the OD survey. While the total volume of short distance trips in the final version of the trip table remains based on SEFTPM skims, the breakdown of trips between the three OD pairs was adjusted in the final trip table to match the ICAT data.
Table 4.2‐9: Distribution of Short Distance Trips by OD pair
OD pair OD
Survey
OD in Mode Choice Survey
ICAT SEFTPM
Miami ‐ West Palm 14% 16% 12% 2.5%
Fort Lauderdale ‐ West Palm 25% 26% 30% 34.6%
Miami ‐ Fort Lauderdale 61% 58% 58% 62.9%
Source: LBG (2012)
For long distance trips, the breakdown of auto trips between OD pairs in the OD survey is different from the ICAT data, which shows a more equal distribution between the three OD pairs (4.2‐10). The OD questions in the mode choice SP survey (Section 4.3.5.4) showed an even larger proportion of trips in the Miami‐Central Florida pair than the OD survey. Simple gravity models that take into account population size, employment size and distance confirm the distribution between OD pairs shown by the ICAT data. In the final trip table the total volume of long distance trips and the distribution by OD pair remains based on the ICAT data, as it was in the initial trip table.
Case 1:15-cv-00632-CRC Document 21-2 Filed 05/28/15 Page 72 of 154

All Aboard Florida Ridership and Revenue Study
May 7, 2015
Page 56
Table 4.2‐10: Distribution of Long Distance Trips by OD pair
Source
OD pair OD
Survey
OD in Mode Choice Survey
ICAT Population‐based gravity equation^
Employment‐ based gravity equation^^
Miami ‐ Central Florida 42% 46% 35% 34% 35%
Fort Lauderdale ‐ Central Florida 32% 32% 32% 30% 30%
West Palm Beach ‐ Central Florida 26% 21% 33% 36% 34%
Source: LBG (2012)
^ The distribution of trips between OD pairs is based on the relative magnitude of the results of the following equation for each OD pair: the product of the population of the origin and the population of the destination divided by the distance between the origin and the destination squared.
^^ The distribution of trips between OD pairs is based the relative magnitude of the result of the following equation for each OD pair: the product of the employment of the origin and the employment of the destination divided by the distance between the origin and the destination squared.
4.3 StatedPreferenceSurvey
4.3.1 OverviewofMethods
The exploration of expressed preferences for a hypothetical new service presents several challenges in survey design, administration and analysis, but has the potential to supply essential market research insights into the elasticity of such items as fare and service plan options. The survey instrument was designed using conjoint analysis techniques to record a respondent’s stated preference for the travel modes presented in six to eight hypothetical experiments.
Conjoint analysis techniques are used in market research to determine the value that different individuals place on the disaggregate attributes comprising a product or service. In the case of mode choice, a trip could be disaggregated into a number of different components such as access time, in‐vehicle time, frequency of service, cost of trip etc.
4.3.2 SurveyDesign
The survey instrument included the following types of questions.
Screening Questions – Screening questions determine whether a person is qualified to participate in the survey.
Reference trip – Data were collected to characterize the respondent’s most recent or typical intercity trip with the study area.
Stated Preference Section – As the All Aboard Florida service does not currently exist, respondents were asked to choose between hypothetical scenarios that describe different mode options for intercity travel with the study area, including the proposed All Aboard Florida service. The reference trip described in previous questions frames the choice experiment in the stated preference section.
Case 1:15-cv-00632-CRC Document 21-2 Filed 05/28/15 Page 73 of 154

All Aboard Florida Ridership and Revenue Study
May 7, 2015
Page 57
SP Debrief ‐ The survey also directly asked respondents if they would have taken the All Aboard Florida service if it would have been available for their reference trip and to rate potential reasons for that decision.
Station characteristics ‐ Respondents who indicated that they would take the new service are asked to rate a series of station characteristics, including accessibility, based on their importance in the decision to use the new service.
Travel patterns – As an additional check of the accuracy of the trip table, respondents were asked to quantify their intercity travel within the study area in the past month.
Demographics – The final section of the survey collected data on the respondent’s demographic characteristics.
Other questions – Respondents were asked to give their opinion about the new service and were also asked about their familiarity with intercity rail. Both questions aim at identifying respondents whose responses may be biased.
4.3.2.1 ScreeningTo be qualified to participate in the survey, potential respondents must meet the following three requirements:
Age – Respondents must be at least 18 years old.
Place of residence – Respondents must currently reside within the study area described in Section 3.1.
Travel within the past year – Within the past year, respondent must have traveled at least once between an origin and a destination pair that would be served by the proposed All Aboard Florida service.
4.3.2.2 ReferenceTripTo provide context for the SP experiment, respondents were asked to select the study market area to which they traveled most frequently in the past 6 or 12 month. Depending on how often the respondent traveled to this destination, following questions concerned the respondent’s most recent trip (for occasional travelers) or typical trip (for frequent travelers) to that destination.
Questions regarding the most recent or typical trip:
Destination
Origin
Frequency of travel to destination
Type of origin (home, work, other)
Number of persons in travel party
Persons in travel party needing additional time
Number of checked baggage and large/heavy carry‐on items
Main mode of transportation between origin and destination
Those who didn’t drive were asked if they had access to a car
Case 1:15-cv-00632-CRC Document 21-2 Filed 05/28/15 Page 74 of 154

All Aboard Florida Ridership and Revenue Study
May 7, 2015
Page 58
To assess car dependency, car users were asked reasons for car use and which, if any, alternative modes they would consider if a car would not have been available.
Mode(s) used at destination
4.3.2.3 ChoiceExperimentsThe stated preference section explored the survey respondent’s interest in various travel mode options including the proposed All Aboard Florida service. Each respondent was presented with an experiment that includes six to eight choice sets, with four mode options presented in each choice set. The information about the typical or most recent trip was used to frame the experiment. More specifically, the experiment was conducted for the same origin and destination pair as the reference trip and respondents were asked to assume similar circumstances as that trip when choosing between hypothetical scenarios for travel between their selected O‐D pair.
Figure 4.3‐1: All Aboard Florida Introduction
Source: LBG (2012)
Case 1:15-cv-00632-CRC Document 21-2 Filed 05/28/15 Page 75 of 154
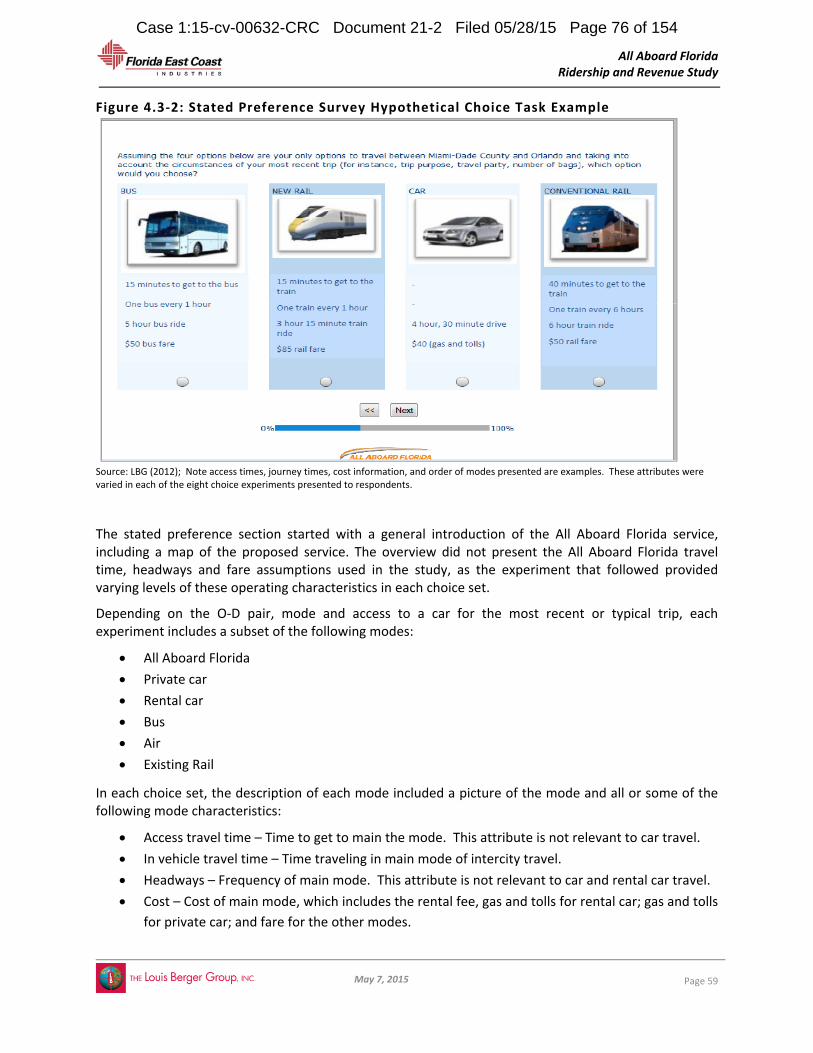
All Aboard Florida Ridership and Revenue Study
May 7, 2015
Page 59
Figure 4.3‐2: Stated Preference Survey Hypothetical Choice Task Example
Source: LBG (2012); Note access times, journey times, cost information, and order of modes presented are examples. These attributes were varied in each of the eight choice experiments presented to respondents.
The stated preference section started with a general introduction of the All Aboard Florida service, including a map of the proposed service. The overview did not present the All Aboard Florida travel time, headways and fare assumptions used in the study, as the experiment that followed provided varying levels of these operating characteristics in each choice set.
Depending on the O‐D pair, mode and access to a car for the most recent or typical trip, each experiment includes a subset of the following modes:
All Aboard Florida
Private car
Rental car
Bus
Air
Existing Rail
In each choice set, the description of each mode included a picture of the mode and all or some of the following mode characteristics:
Access travel time – Time to get to main the mode. This attribute is not relevant to car travel.
In vehicle travel time – Time traveling in main mode of intercity travel.
Headways – Frequency of main mode. This attribute is not relevant to car and rental car travel.
Cost – Cost of main mode, which includes the rental fee, gas and tolls for rental car; gas and tolls
for private car; and fare for the other modes.
Case 1:15-cv-00632-CRC Document 21-2 Filed 05/28/15 Page 76 of 154

All Aboard Florida Ridership and Revenue Study
May 7, 2015
Page 60
Each attribute had five levels with the base level reflecting the typical researched travel time, headways, and cost associated with the origin and destination pair for each existing mode. For each attribute, the experiment included one base level, 2 levels that were higher than base level, and 2 levels that were lower than the base level. Online research of public transit schedules and fares, airline schedules and fares and typical driving times and driving costs was conducted to develop attribute base levels. For the All Aboard Florida service, base values of the operational characteristics were based on the operating assumptions. The other four levels pivot around the base level with the lowest level typically no more than 60 percent of the base value and the highest level typically more than 140 percent of the base level.
Six of the eight choice sets presented to respondents were randomly generated to increase variation in the collected sample. The randomization process applies to both the modes offered in each question, as well as to the attribute levels associated with each mode option. The random design of the experiment is intended to mitigate ordered effects that could bias coefficient estimates, as well as to counter learning biases that could affect model estimation results. The remaining two choice tasks have been developed using a fixed design that presents the same four hypothetical scenarios to all respondents with the similar origin and destination pair.
Attribute Research
LBG used several data sources to develop trip attribute base levels for the SP survey design. The remaining section is a brief overview of data sources consulted for each mode of travel and the resulting base values determined. Tables 4.3‐1 and 4.3‐2 provide a summary of these research effort’s findings.
Table 4.3‐1 Intercity Travel Time, Cost and Headways – Long Distance
City Pair Rail
(Amtrak) Bus Air Car
In‐Vehicle Travel Time (min)
Miami ‐ Orlando 360 300 60 285
Fort Lauderdale ‐ Orlando 300 270 60 255
West Palm Beach ‐ Orlando 225 235 60 220
Travel Cost
Miami ‐ Orlando $ 55 $ 50 $ 150 $ 50
Fort Lauderdale ‐ Orlando $ 50 $ 50 $ 100 $ 45
West Palm Beach ‐ Orlando $ 40 $ 45 $ 100 $ 40
Daily Frequency
Miami ‐ Orlando 240 120 90
Fort Lauderdale ‐ Orlando 240 120 180
West Palm Beach ‐ Orlando 240 300 180
Source: LBG (2012)
Case 1:15-cv-00632-CRC Document 21-2 Filed 05/28/15 Page 77 of 154

All Aboard Florida Ridership and Revenue Study
May 7, 2015
Page 61
Table 4.3‐2: Intercity Travel Time, Cost and Headways – Short Distance
City Pair Rail (Tri Rail) Bus Car
In‐Vehicle Travel Time (min)
Miami – Fort Lauderdale 45 55 50
Miami – West Palm Beach 105 115 105
Fort Lauderdale – West Palm Beach 60 85 75
Travel Cost
Miami – Fort Lauderdale $ 5 $ 10 $ 10
Miami – West Palm Beach $ 10 $ 15 $ 20
Fort Lauderdale – West Palm Beach $ 10 $ 15 $ 10
Daily Frequency
Miami – Fort Lauderdale 45 90
Miami – West Palm Beach 45 180
Fort Lauderdale – West Palm Beach 45 180
Source: LBG (2012)
Highway Modes (Private and Rental Cars)
The cost of intercity travel by private vehicle was developed to reflect the costs of fuel and tolls for all vehicles, plus the additional rental fees in the case of travelers with no access to private auto vehicles for intercity trips. The average mileage cost was determined using American Automobile Association’s (AAA) 2011 standards with an average cost of gas per mile traveled ($0.12/mile). Rental costs were identified using rates provided by Avis. Other sources used for highway travel by private car and rental car included the following:
AAA’s Driving Costs in 2011 for average mileage costs
Google Maps for driving distances and travel times
Air Travel
LBG relied on data from the FAA 10% Sample to provide a range of recent air fares paid by travelers making trips within the study area. Trip attributes were only evaluated for the following intercity pairs:
Miami (MIA) – Orlando (MCO)
Fort Lauderdale (FLL) – Orlando (MCO)
Case 1:15-cv-00632-CRC Document 21-2 Filed 05/28/15 Page 78 of 154

All Aboard Florida Ridership and Revenue Study
May 7, 2015
Page 62
Bus
LBG reviewed the travel patterns of a number bus companies operating within the study corridor. Data on travel distances, average travel times, daily service frequency, and costs were compiled using each operator’s company website. Bus operators covered in this study include:
Florida Express
Greyhound
OrlandoMiami.com and Florida Sunshine Shuttle
Red Coach
Operating Assumptions
Table 4.3‐3 summarizes in‐vehicle travel time and fare test levels by major city pair.
Table 4.3‐3: Operating Test Assumptions
City Pair In Vehicle Travel Time (minutes) Fare
Miami ‐ Orlando 180 $70 Fort Lauderdale ‐ Orlando 150 $65 West Palm Beach ‐ Orlando 105 $50 Miami – Fort Lauderdale 35 $5 Miami – West Palm Beach 75 $15 Fort Lauderdale – West Palm Beach 40 $10
Source: LBG (2012)
4.3.2.4 SPDebriefFollowing the stated preference exercise, respondents were presented with a profile of the All Aboard Florida service and asked to directly state their willingness to use the planned service under the conditions of the service profile presented. The profile included access time, All Aboard Florida in‐vehicle travel time, and fare using base levels. Respondents who stated that they would not take the All Aboard Florida were asked to rate a number of potential reasons on a 5‐point scale, ranging from Strongly Agree to Strongly Disagree. Similarly, those who stated that they would take the service were asked to rate a number of potential reasons using the same response scale.
Potential reasons for not taking the new rail service that were presented include:
Access to All Aboard Florida station
Frequency
Fare
Trip length
Need for car at destination
General public transit dislike
Case 1:15-cv-00632-CRC Document 21-2 Filed 05/28/15 Page 79 of 154

All Aboard Florida Ridership and Revenue Study
May 7, 2015
Page 63
Potential reasons for taking the All Aboard Florida include:
Access to All Aboard Florida station
Frequency
Affordable fare
Trip length
Safety
Comfort
General preference for mass transit
4.3.2.5 StationAccessCharacteristicsRespondents who indicated that they would have taken the All Aboard Florida service were asked whether, and to which degree, each of a series of station characteristics influenced that decision. Respondents were presented with the following scale:
Very important
Important
Moderately important
Of little importance
Unimportant
The following characteristics were presented for the station of departure:
Station location (airport vs downtown)
Park and ride lot with free parking for customers
Kiss and ride
Bicycle storage
Shuttle service from key locations
Connection to existing transit service
Secure waiting area with restroom facilities
Real time information on train arrivals and departures
Restaurant in station
Convenience store in station
The following characteristics were presented for the station of arrival:
Station location (airport vs downtown)
Shuttle service to key destinations
Connection to local transit
Bicycle rental
Car rental
Maps of surrounding neighborhood
Case 1:15-cv-00632-CRC Document 21-2 Filed 05/28/15 Page 80 of 154

All Aboard Florida Ridership and Revenue Study
May 7, 2015
Page 64
4.3.2.6 TravelPatternsRespondents were asked to report the number of trips they made from the geographic segment in which they reside to each of the other segments in the past month – as well as the mode of travel that they typically use to make those trips. These questions provided a first check of the accuracy of the trip tables used to develop the ridership forecasts.
4.3.2.7 SocioeconomicCharacteristicsFinally, respondents were asked to report socioeconomic and demographic characteristics. Characteristics included in the survey are as follows:
Age
Gender
Household size
Household income
Number of working adults in household
Number of motor vehicles in household
4.3.3 SurveyTestingThe survey was piloted on April 4, 2012. A total of 3,500 invitations were sent to members of the same web‐based panel that was later used for the full implementation of the survey. Overall response rate of 12 percent was in‐line with expectation of 10 percent based on weekday responses in similarly composed e‐panels. Data collection went quickly and 66 percent of persons accessing the survey made at least one trip between study area cities within the past 12 months and therefore qualified for participation. A total of 298 respondents qualified and completed the survey. Half of the respondents completed the survey in 13 minutes of less. One of the main objectives of the pilot survey was to test if the attribute levels allow respondents to make realistic trade‐offs. Based on preliminary modeling of the pilot data, attribute levels were adjusted prior to inclusion in the final survey instrument.
4.3.4 SamplingPlanandSurveyAdministration
SamplingPlanThe survey instrument was targeted at intercity travelers residing within one of the three following segments:
Greater Orlando residents
Southeast Florida residents
Non‐residents
The data was collected with a web survey and an intercept survey using tablet computers. The web survey was sent solely to residents of Greater Orlando and Southeast Florida. All non‐resident data was collected with the intercept survey.
Case 1:15-cv-00632-CRC Document 21-2 Filed 05/28/15 Page 81 of 154

All Aboard Florida Ridership and Revenue Study
May 7, 2015
Page 65
The total sample size target was 1,400, with specific targets by geographic segment and mode (Table 4.3‐4). Quotas were incorporated in the web survey instrument in an attempt to obtain sufficient records from non‐auto modes.
Table 4.3‐4: Sample Size Targets
Geographic Segment Auto Air Train Bus Total Southeast Florida 550 50 100 100 800
Greater Orlando 50 50 50 50 200
Non-residents 100 100 100 100 400
Total 700 200 250 250 1,400
Source: LBG (2012)
The overall target was exceeded (Table 4.3‐5). While geographic and mode specific targets (non‐residents and bus users) were not met, we still collected a sufficient number of records for these segments. Table 4.3‐5: Comparison of targets with number of completed surveys
Target Actual
Geographic Segment
Southeast Florida 800 1,251
Greater Orlando 200 338
Non-residents 400 271
Mode
Auto 700 1,256
Air 200 196
Train 250 224
Bus 250 157
Total 1,400 1,860
Source: LBG (2012)
WebSurveyThe web survey was conducted from April 14, 2012 to April 21, 2012. An invitation to the web survey was sent to 65,301 e‐panel members, 5,100 of which responded, which is a response rate of 8 percent. One quarter of respondents (1,261) were qualified and completed the survey.
InterceptSurveyAn intercept survey was conducted from April 10, 2012 to April 15, 2012 at the following locations:
Miami Airport
Miami Airport Car rental facility & people mover
Tri‐Rail Miami Airport
Fort Lauderdale Airport
Tri‐Rail Fort Lauderdale
Case 1:15-cv-00632-CRC Document 21-2 Filed 05/28/15 Page 82 of 154
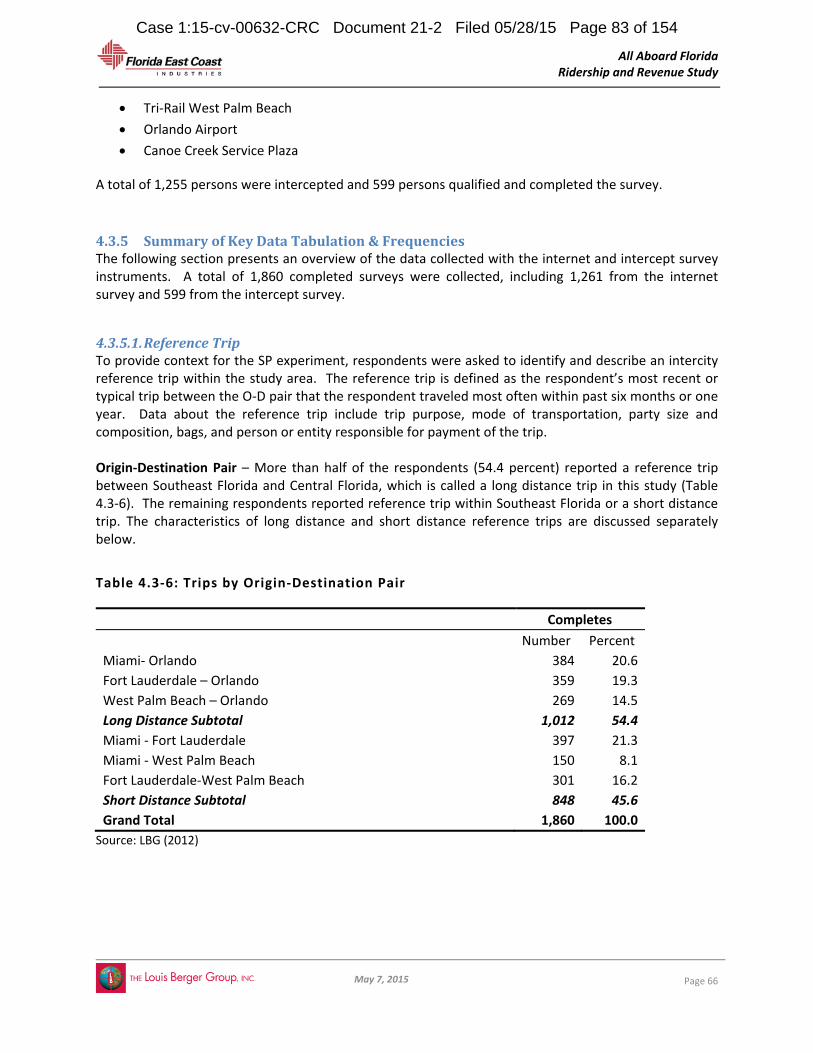
All Aboard Florida Ridership and Revenue Study
May 7, 2015
Page 66
Tri‐Rail West Palm Beach
Orlando Airport
Canoe Creek Service Plaza
A total of 1,255 persons were intercepted and 599 persons qualified and completed the survey.
4.3.5 SummaryofKeyDataTabulation&FrequenciesThe following section presents an overview of the data collected with the internet and intercept survey instruments. A total of 1,860 completed surveys were collected, including 1,261 from the internet survey and 599 from the intercept survey.
4.3.5.1. ReferenceTripTo provide context for the SP experiment, respondents were asked to identify and describe an intercity reference trip within the study area. The reference trip is defined as the respondent’s most recent or typical trip between the O‐D pair that the respondent traveled most often within past six months or one year. Data about the reference trip include trip purpose, mode of transportation, party size and composition, bags, and person or entity responsible for payment of the trip. Origin‐Destination Pair – More than half of the respondents (54.4 percent) reported a reference trip between Southeast Florida and Central Florida, which is called a long distance trip in this study (Table 4.3‐6). The remaining respondents reported reference trip within Southeast Florida or a short distance trip. The characteristics of long distance and short distance reference trips are discussed separately below.
Table 4.3‐6: Trips by Origin‐Destination Pair
Completes
Number Percent
Miami‐ Orlando 384 20.6
Fort Lauderdale – Orlando 359 19.3
West Palm Beach – Orlando 269 14.5
Long Distance Subtotal 1,012 54.4
Miami ‐ Fort Lauderdale 397 21.3
Miami ‐ West Palm Beach 150 8.1
Fort Lauderdale‐West Palm Beach 301 16.2
Short Distance Subtotal 848 45.6
Grand Total 1,860 100.0
Source: LBG (2012)
Case 1:15-cv-00632-CRC Document 21-2 Filed 05/28/15 Page 83 of 154

All Aboard Florida Ridership and Revenue Study
May 7, 2015
Page 67
Long Distance Trips – Trips between Southeast Florida and Central Florida
Trip purpose – Leisure trips account for the majority (69.3 percent) of the reference trips while business trips account for 14.9 percent (Figure 4.3‐3). The proportion of business travelers in the sample is similar to the proportion of business travelers National Household Travel Survey (2001), which is 15.9 percent. Figure 4.3‐3: Long Distance Trips by Purpose
Source: LBG (2012)
Trip Payment ‐ Most respondents traveling for leisure or other non‐business purposes are responsible for the payment of their transportation cost while those traveling for business purposes or for a combination of business and leisure are more likely to make a trip that is paid by their employer or their business.
Table 4.3‐7: Trip Payment, Long Distance Trips
Business
Non Business
All Respondents
Household 48.0% 96.2% 83.8%
Employer 34.4% 2.7% 10.8%
Business 17.6% 1.1% 5.3%
Other 3.6% 3.4% 3.5%
Source: LBG (2012)
Leisure69.3%
Business14.9%
Combination of business and
leisure10.7%
Other4.3%
Commute0.8%
Case 1:15-cv-00632-CRC Document 21-2 Filed 05/28/15 Page 84 of 154

All Aboard Florida Ridership and Revenue Study
May 7, 2015
Page 68
Mode of transportation – While auto is the dominant mode used for trips between Southeast and Central Florida, with the help of quotas the LBG team was able to collect information on a large number of non‐auto reference trips. The number of trips made by private car accounted for 44.4 percent of business trips, which include trips for business purposes only as well as trips with a combined business and leisure purpose (Table 4.3‐8). Rental car accounted for an additional 16.2 percent of non‐business trips. Among non‐business trips, which is the residual category, private car trips accounted for 44.4 percent of trips and rental car trips for 9.7 percent. Air accounts for a larger proportion of business trips (20.9 percent) than of non‐business trips (17.9 percent) while train and bus (including shared passenger van) account for a larger proportion of non‐business trips (21.3 percent) than business trips (16.1 percent).
Table 4.3‐8: Long Distance Trips by Mode
% of
Business
% of Non‐
Business
% of Total
Private car (not a rental) 44.4 49.4 48.1
Rental car 16.2 9.7 11.4
Air 20.9 17.9 18.7
Train 6.1 8.1 7.6
Bus 6.9 8.9 8.4
Shared passenger van 3.1 4.3 4.0
Other 2.4 1.7 1.9
Total 100.0 100.0 100.0
Source: LBG (2012)
Case 1:15-cv-00632-CRC Document 21-2 Filed 05/28/15 Page 85 of 154

All Aboard Florida Ridership and Revenue Study
May 7, 2015
Page 69
Party size and composition – Less than one third of all reference trips (29.4 percent) were made by solo travelers (Table 4.3‐9). The average party size was 2.7. Among parties of two or more, 39.6 percent were families traveling with children younger than 18.
Table 4.3‐9: Long Distance Trips by Party Size
Number of Respondents
Percent of Respondents
Party of one 297 29.4
Party of two 253 25.0
Party of three 214 21.2
Party of more than three 248 24.5
Composition parties of two or more:
Family with children (younger than 18) 283 39.6
Couple, living in the same household; no children on the trip 137 19.2
Colleagues/business partners; no children on the trip 133 18.6
Organized group travel 33 4.6
Other 129 18.0
Total 715 100
Average party size
All modes/All purposes 2.71
Car only/All purposes 2.66
Car only / Business 1.99
Car only / Non‐Business 2.87
Source: LBG (2012)
Reasons for auto use – Half of the respondents (50.2 percent) who used a car for their long distance reference trip indicated that they needed a private vehicle at their destination. The second most selected reason for driving was cost (38.9 percent). Another commonly selected reason was enjoying driving (41 percent of business travelers and 27.9 percent of non‐business travelers). A relatively large share (28.4 percent) of business travelers also indicated that non‐auto modes would take too long.
Case 1:15-cv-00632-CRC Document 21-2 Filed 05/28/15 Page 86 of 154
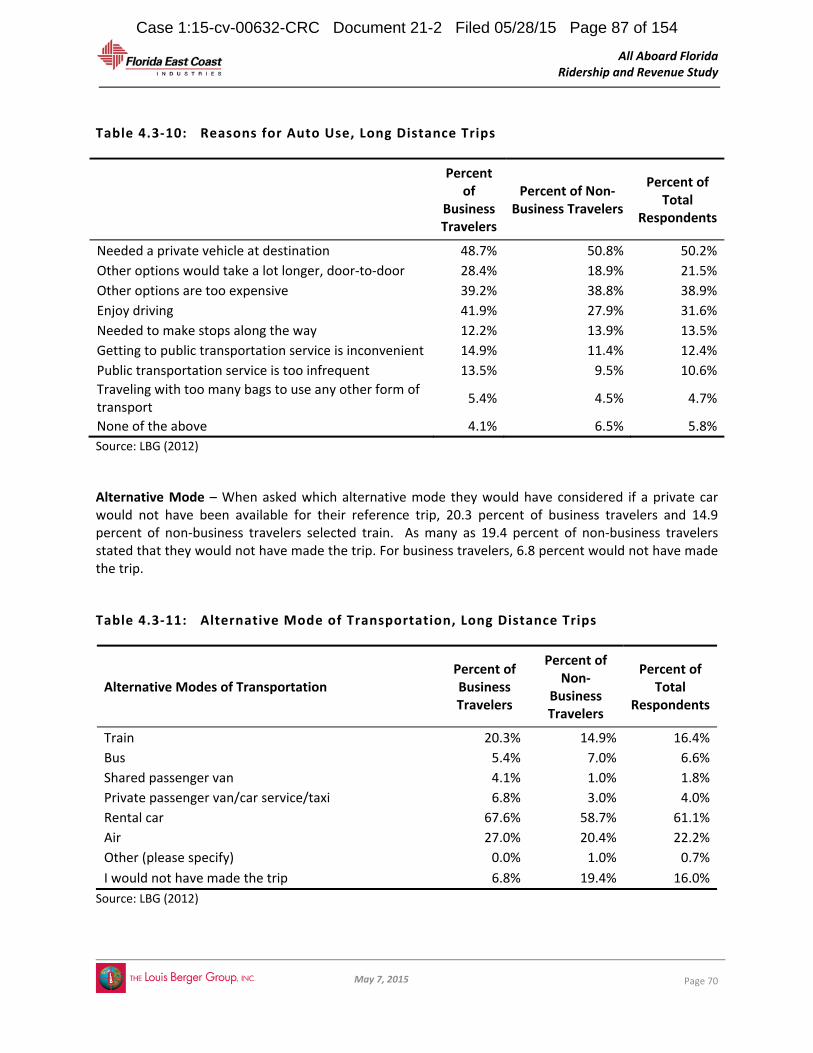
All Aboard Florida Ridership and Revenue Study
May 7, 2015
Page 70
Table 4.3‐10: Reasons for Auto Use, Long Distance Trips
Percent of
Business Travelers
Percent of Non‐Business Travelers
Percent of Total
Respondents
Needed a private vehicle at destination 48.7% 50.8% 50.2%
Other options would take a lot longer, door‐to‐door 28.4% 18.9% 21.5%
Other options are too expensive 39.2% 38.8% 38.9%
Enjoy driving 41.9% 27.9% 31.6%
Needed to make stops along the way 12.2% 13.9% 13.5%
Getting to public transportation service is inconvenient 14.9% 11.4% 12.4%
Public transportation service is too infrequent 13.5% 9.5% 10.6%
Traveling with too many bags to use any other form of transport
5.4% 4.5% 4.7%
None of the above 4.1% 6.5% 5.8%
Source: LBG (2012)
Alternative Mode – When asked which alternative mode they would have considered if a private car would not have been available for their reference trip, 20.3 percent of business travelers and 14.9 percent of non‐business travelers selected train. As many as 19.4 percent of non‐business travelers stated that they would not have made the trip. For business travelers, 6.8 percent would not have made the trip.
Table 4.3‐11: Alternative Mode of Transportation, Long Distance Trips
Alternative Modes of Transportation Percent of Business Travelers
Percent of Non‐
Business Travelers
Percent of Total
Respondents
Train 20.3% 14.9% 16.4%
Bus 5.4% 7.0% 6.6%
Shared passenger van 4.1% 1.0% 1.8%
Private passenger van/car service/taxi 6.8% 3.0% 4.0%
Rental car 67.6% 58.7% 61.1%
Air 27.0% 20.4% 22.2%
Other (please specify) 0.0% 1.0% 0.7%
I would not have made the trip 6.8% 19.4% 16.0%
Source: LBG (2012)
Case 1:15-cv-00632-CRC Document 21-2 Filed 05/28/15 Page 87 of 154

All Aboard Florida Ridership and Revenue Study
May 7, 2015
Page 71
Short Distance Trips ‐ Trips within Southeast Florida
Trip Purpose – More than half (56.7 percent) of reference trips within Southeast Florida are leisure trips. Business (14.4 percent) and a combination or business and leisure (7.8 percent) account for 22.2 percent of all reference trips.
Figure 4.3‐4: Short Distance Trips by Purpose
Source: LBG (2012)
Trip Payment – As with long distance trips, most short distance travelers who travel for leisure or other non‐business purposes are responsible for the payment of their transportation cost. Those traveling for business purposes or for a combination of business and leisure are more likely to make a trip that is paid by their employer or their business.
Table 4.3‐12: Trip Payment, Short Distance Trips
Business
Non Business
All Respondents
Household 55.3% 92.9% 84.6%
Employer 27.7% 1.5% 7.3%
Business 12.8% 1.2% 3.8%
Other 4.3% 4.4% 4.4%
Source: LBG (2012)
Leisure56.7%
Other15.9%
Business14.4%
Combination of business and
leisure7.8%
Commute5.2%
Case 1:15-cv-00632-CRC Document 21-2 Filed 05/28/15 Page 88 of 154
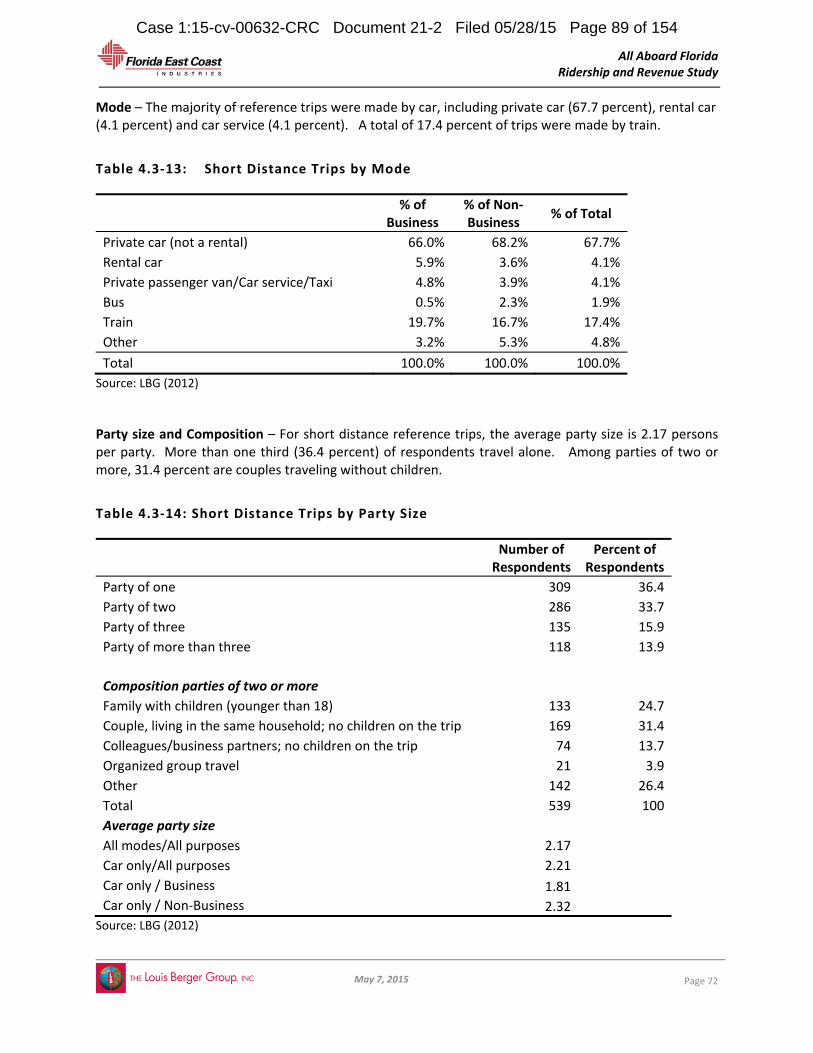
All Aboard Florida Ridership and Revenue Study
May 7, 2015
Page 72
Mode – The majority of reference trips were made by car, including private car (67.7 percent), rental car (4.1 percent) and car service (4.1 percent). A total of 17.4 percent of trips were made by train.
Table 4.3‐13: Short Distance Trips by Mode
% of
Business % of Non‐Business
% of Total
Private car (not a rental) 66.0% 68.2% 67.7%
Rental car 5.9% 3.6% 4.1%
Private passenger van/Car service/Taxi 4.8% 3.9% 4.1%
Bus 0.5% 2.3% 1.9%
Train 19.7% 16.7% 17.4%
Other 3.2% 5.3% 4.8%
Total 100.0% 100.0% 100.0%
Source: LBG (2012)
Party size and Composition – For short distance reference trips, the average party size is 2.17 persons per party. More than one third (36.4 percent) of respondents travel alone. Among parties of two or more, 31.4 percent are couples traveling without children.
Table 4.3‐14: Short Distance Trips by Party Size
Number of Respondents
Percent of Respondents
Party of one 309 36.4
Party of two 286 33.7
Party of three 135 15.9
Party of more than three 118 13.9
Composition parties of two or more
Family with children (younger than 18) 133 24.7
Couple, living in the same household; no children on the trip 169 31.4
Colleagues/business partners; no children on the trip 74 13.7
Organized group travel 21 3.9
Other 142 26.4
Total 539 100
Average party size
All modes/All purposes 2.17
Car only/All purposes 2.21
Car only / Business 1.81
Car only / Non‐Business 2.32
Source: LBG (2012)
Case 1:15-cv-00632-CRC Document 21-2 Filed 05/28/15 Page 89 of 154

All Aboard Florida Ridership and Revenue Study
May 7, 2015
Page 73
Reasons for auto use – One quarter of respondents (24.6 percent) who used a car for their short distance reference trip indicated that they needed a private vehicle at their destination (Table 4.3‐15). The results indicate that short distance travelers are less likely to be auto‐captive than long distance travelers. As shown in Table 4.3‐10 above, half of respondents who made their long distance reference trip by car need a private vehicle at their destination.
Table 4.3‐15: Reasons for Auto Use, Short Distance Trips
Percent of Business Travelers
Percent of Non‐
Business Travelers
Percent of Total
Respondents
Needed a private vehicle at destination 28.2% 23.6% 24.6%
Other options would take a lot longer, door‐to‐door 29.9% 25.5% 26.4%
Other options are too expensive 23.1% 24.5% 24.2%
Enjoy driving 16.2% 25.9% 23.9%
Needed to make stops along the way 17.1% 9.6% 11.2%
Getting to public transportation service is inconvenient
23.9% 19.6% 20.6%
Public transportation service is too infrequent 16.2% 14.3% 14.7%
Traveling with too many bags to use any other form of transport
2.6% 3.0% 2.9%
None of the above 16.2% 18.2% 17.8%
Source: LBG (2012)
Case 1:15-cv-00632-CRC Document 21-2 Filed 05/28/15 Page 90 of 154
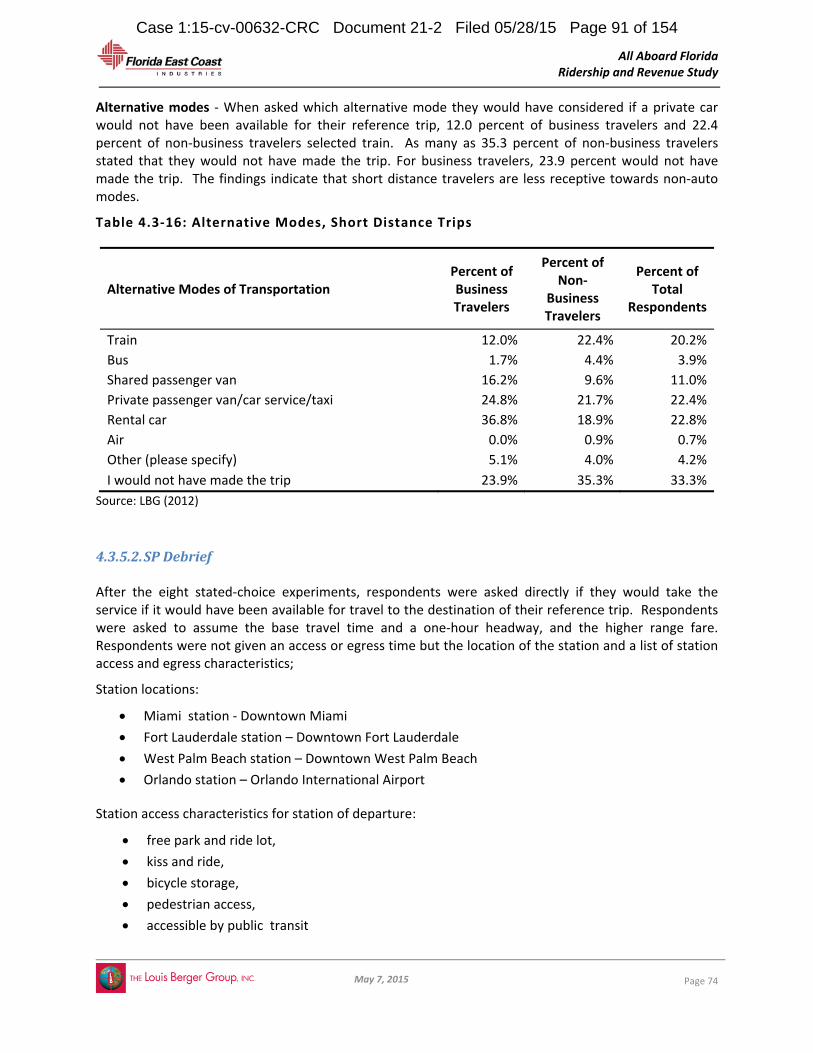
All Aboard Florida Ridership and Revenue Study
May 7, 2015
Page 74
Alternative modes ‐ When asked which alternative mode they would have considered if a private car would not have been available for their reference trip, 12.0 percent of business travelers and 22.4 percent of non‐business travelers selected train. As many as 35.3 percent of non‐business travelers stated that they would not have made the trip. For business travelers, 23.9 percent would not have made the trip. The findings indicate that short distance travelers are less receptive towards non‐auto modes.
Table 4.3‐16: Alternative Modes, Short Distance Trips
Alternative Modes of Transportation Percent of Business Travelers
Percent of Non‐
Business Travelers
Percent of Total
Respondents
Train 12.0% 22.4% 20.2%
Bus 1.7% 4.4% 3.9%
Shared passenger van 16.2% 9.6% 11.0%
Private passenger van/car service/taxi 24.8% 21.7% 22.4%
Rental car 36.8% 18.9% 22.8%
Air 0.0% 0.9% 0.7%
Other (please specify) 5.1% 4.0% 4.2%
I would not have made the trip 23.9% 35.3% 33.3%
Source: LBG (2012)
4.3.5.2. SPDebrief After the eight stated‐choice experiments, respondents were asked directly if they would take the service if it would have been available for travel to the destination of their reference trip. Respondents were asked to assume the base travel time and a one‐hour headway, and the higher range fare. Respondents were not given an access or egress time but the location of the station and a list of station access and egress characteristics;
Station locations:
Miami station ‐ Downtown Miami
Fort Lauderdale station – Downtown Fort Lauderdale
West Palm Beach station – Downtown West Palm Beach
Orlando station – Orlando International Airport
Station access characteristics for station of departure:
free park and ride lot,
kiss and ride,
bicycle storage,
pedestrian access,
accessible by public transit
Case 1:15-cv-00632-CRC Document 21-2 Filed 05/28/15 Page 91 of 154

All Aboard Florida Ridership and Revenue Study
May 7, 2015
Page 75
Station egress characteristics for station of arrival:
Miami station – shuttles to Miami Beach and Miami International Airport with a shuttle,
connections to Metrorail and local bus service; rental car agencies
Fort Lauderdale ‐ shuttle service to downtown Fort Lauderdale, connections to local transit;
rental car agencies
West Palm Beach station ‐ Shuttle service to Palm Beach International Airport; connections to
local transit; rental car agencies
Orlando station ‐ Taxi stand; rental car agencies; shuttles to downtown, convention center,
resort area/theme parks; connections to local transit
Respondents who declined to take the service at the higher range fare were asked whether they would take the service at the base fare.
Most business (78.3 percent) and non‐business (69.7 percent) travelers expressed an interest in the All Aboard Florida service for travel between Southeast and Central Florida at the proposed base fare level or higher (Table 4.3‐17). Business travelers were more likely to respond positively than non‐business travelers to the highest fare level.
Also for trips within Southeast Florida, most business (57.6 percent) and non‐business (55.1 percent) travelers expressed interest in the All Aboard Florida service at the proposed base fare level or higher. However, as many 22.6 percent of non‐business travelers and 18.1 percent of business travelers state that they would not take the service at any fare.
Table 4.3‐17: Interest in All Aboard Florida service
Business Non‐
Business Total
Long Distance Travelers
Would take the service at the highest fare 60.8% 47.7% 51.1%
Would take the service only at the base fare 17.5% 22.0% 20.8%
Would take the service only for a lower fare 19.0% 28.4% 25.7%
Would not take the service at any fare 2.7% 2.0% 2.4%
Short Distance Travelers
Would take the service at the highest fare 50.7% 47.9% 48.5%
Would take the service only at the base fare 6.9% 7.2% 7.1%
Would take the service only for a lower fare 24.4% 22.3% 21.9%
Would not take the service at any fare 18.1% 22.6% 22.5%
Source: LBG (2012)
Case 1:15-cv-00632-CRC Document 21-2 Filed 05/28/15 Page 92 of 154

All Aboard Florida Ridership and Revenue Study
May 7, 2015
Page 76
The most common reason for not taking the All Aboard Florida service for travel between Southeast and Central Florida is the need for a car at the destination (Figure 4.3‐5). Half of travelers strongly agreed that car dependency was one of the reasons that they would not choose to take the All Aboard Florida service at the base fare. For trips within Southeast Florida, the most common reason for not taking the new service was access time. More than half (52.8%) of travelers strongly agree that based on the station location that they were provided, it would take too long to get to the All Aboard Florida service. Car dependency was the second most common selected reason for not taking the new service for travel within Southeast Florida (i.e., 46.9 percent strongly agree). Almost half of business travelers traveling within Southeast Florida indicated (i.e., agree or strongly agree) that the train’s presented frequency – one train per hour – was (one of) the reason(s) for not taking the new service.
Figure 4.3‐5: Reasons for not taking All Aboard Florida, Long Distance trips
Source: LBG (2012)
0% 10% 20% 30% 40% 50% 60% 70% 80% 90% 100%
All
Biz
NonBiz
All
Biz
NonBiz
All
Biz
NonBiz
All
Biz
NonBiz
All
Biz
NonBiz
All
Biz
NonBiz
Access
Dislike
transit
Fare
Car
Dep
enden
cyDuration
Freq
uen
cy
Strongly Agree Agree Neutral Disagree Strongly Disagree
Case 1:15-cv-00632-CRC Document 21-2 Filed 05/28/15 Page 93 of 154

All Aboard Florida Ridership and Revenue Study
May 7, 2015
Page 77
Figure 4.3‐6: Reasons for not taking All Aboard Florida, Short Distance trips
Source: LBG (2012)
4.3.5.3. Stationcharacteristics
Respondents who indicated that they would take the All Aboard Florida service at the base fare level or higher were asked to rate a list of station characteristics based on their importance in taking the service. Among characteristics related to departure station access, free parking was the most popular, followed by shuttle service from key locations (Figure 4.3‐7). In terms of other departure station characteristics, real time information on departures and arrival as well secure waiting rooms ranked highly (Figure 4.3‐8).
0% 10% 20% 30% 40% 50% 60% 70% 80% 90% 100%
All
Biz
NonBiz
All
Biz
NonBiz
All
Biz
NonBiz
All
Biz
NonBiz
All
Biz
NonBiz
All
Biz
NonBiz
Access time
Car
dep
enden
cy
Duration
Fare
Freq
uen
cyTransit
dislike
All Strongly Agree All Agree All Neutral All Disagree All Strongly Disagree
Case 1:15-cv-00632-CRC Document 21-2 Filed 05/28/15 Page 94 of 154

All Aboard Florida Ridership and Revenue Study
May 7, 2015
Page 78
Figure 4.3‐7: Station of Departure, Access Characteristics
Source: LBG (2012)
0%
10%
20%
30%
40%
50%
60%
70%
80%
90%
100%Miami
Ft. Laud.
WPB
Orl.
Miami
Ft. Laud.
WPB
Orl.
Miami
Ft. Laud.
WPB
Orl.
Miami
Ft. Laud.
WPB
Orl.
Miami
Ft. Laud.
WPB
Orl.
Miami
Ft. Laud.
WPB
Orl.
Bicycle storage Connection toexisting transit
service
Easy pedestrianaccess
Kiss and ride Park and ride lotw/ free parkingfor customers
Shuttle servicefrom keylocations
Very Important Important Moderately Important Of Little Importance Unimportant
Case 1:15-cv-00632-CRC Document 21-2 Filed 05/28/15 Page 95 of 154

All Aboard Florida Ridership and Revenue Study
May 7, 2015
Page 79
Figure 4.3‐8: Station of Departure, Other Characteristics
Source: LBG (2012)
Station of Arrival
In terms of egress options, shuttle service to key destinations was found to be very important or important by about 90 percent of respondents who indicated interest in the new service. About 80 percent selected connections to local transit as important or very important. Car rental facilities are less valued by travelers to Miami, Fort Lauderdale and West Palm Beach but are considered important or very important by more than 70 percent of travelers to Orlando.
0%
10%
20%
30%
40%
50%
60%
70%
80%
90%
100%
Miami
Ft. Laud.
WPB
Orl.
Miami
Ft. Laud.
WPB
Orl.
Miami
Ft. Laud.
WPB
Orl.
Miami
Ft. Laud.
WPB
Orl.
Miami
Ft. Laud.
WPB
Orl.
Convenience storein station
Real timeinformation ontrain arrivals and
departures
Restaurant instation
Secure waiting areaw/ restroomfacilities
Station location
Very Important Important Moderately Important Of Little Importance Unimportant
Case 1:15-cv-00632-CRC Document 21-2 Filed 05/28/15 Page 96 of 154

All Aboard Florida Ridership and Revenue Study
May 7, 2015
Page 80
Figure 4.3‐9: Station of Arrival, Egress Characteristics
Source: LBG (2012)
The proposed station locations – Downtown Miami, Downtown, Adjacent to the Fort Lauderdale – Hollywood International Airport, West Palm Beach, Orlando International Airport ‐ were considered important or very important by about 80 percent of respondents.
0%
10%
20%
30%
40%
50%
60%
70%
80%
90%
100%
Miami
Ft. Laud.
WPB
Orl.
Miami
Ft. Laud.
WPB
Orl.
Miami
Ft. Laud.
WPB
Orl.
Miami
Ft. Laud.
WPB
Orl.
Bicycle rental Car rental Connection to localtransit
Shuttle service to keydestinations
Very Important Important Moderately Important Of Little Importance Unimportant
Case 1:15-cv-00632-CRC Document 21-2 Filed 05/28/15 Page 97 of 154

All Aboard Florida Ridership and Revenue Study
May 7, 2015
Page 81
Figure 4.3‐10: Station of Arrival, Other Characteristics
Source: LBG (2012)
4.3.5.4. RecentTravel
About three quarters of respondent residing in Miami traveled at least once to Fort Lauderdale in the previous four weeks. Similarly, about three quarters of Fort Lauderdale residents traveled at least once to Miami and three quarters of West Palm Beach residents traveled at least once to Fort Lauderdale in the past previous weeks. The average number of trips per resident between each of these three city pairs in the four week recall period equals 3.6, 4.7, and 3.1, respectively. Taking into account population size, this translates into a trip distribution of 16 percent Miami‐West Palm Beach, 26 percent Fort Lauderdale – West Palm Beach and 58 percent Miami‐ Fort Lauderdale as shown above in Section 4.2.3.
For trips between Southeast Florida and Central Florida, Miami residents traveled more to Orlando (0.76 trips per respondent) than Fort Lauderdale residents (0.59 trips per respondent), who traveled more to Orlando than West Palm Beach residents (0.49 trips per respondent). Orlando residents travel to more to Miami (1.11) than to Fort Lauderdale (0.91) and to West Palm Beach (0.60). Taking into account
0%
10%
20%
30%
40%
50%
60%
70%
80%
90%
100%Miami
Ft. Laud.
WPB
Orl.
Miami
Ft. Laud.
WPB
Orl.
Station location Maps of surrounding neighbhorhood
Very Important Important Moderately Important Of Little Importance Unimportant
Case 1:15-cv-00632-CRC Document 21-2 Filed 05/28/15 Page 98 of 154

All Aboard Florida Ridership and Revenue Study
May 7, 2015
Page 82
population size, this translates into a trip distribution of 46 percent Miami‐Orlando, 32 percent Fort Lauderdale – Orlando and 21 percent West Palm Beach‐Orlando as shown above in Section 4.2.
Table 4.3‐18: Recent Travel (within last 4 weeks)
Number of Trips per Respondent
Place of Residence
OD Pair Average No trips
1 to 2 trips
3 to 5 trips
6 to 10 trips
More than 10 trips
Miami Miami ‐ Orlando 0.76 64.8% 29.9% 4.2% 0.4% 0.8%
Miami Miami ‐ West Palm Beach 1.23 60.2% 29.2% 8.3% 0.4% 1.9%
Miami Miami ‐ Fort Lauderdale 3.62 22.7% 39.8% 20.5% 9.5% 7.6%
Fort Lauderdale Fort Lauderdale ‐ Orlando 0.59 70.8% 25.7% 2.9% 0.4% 0.2%
Fort Lauderdale Fort Lauderdale ‐ West Palm Beach
2.08 39.5% 43.3% 9.6% 3.1% 4.5%
Fort Lauderdale Fort Lauderdale ‐ Miami 4.70 24.6% 40.0% 15.4% 6.7% 13.4%
West Palm Beach West Palm Beach ‐ Orlando 0.49 72.4% 25.4% 1.9% 0.0% 0.3%
West Palm Beach West Palm Beach ‐ Fort Lauderdale
3.11 27.9% 42.1% 17.2% 6.6% 6.0%
West Palm Beach West Palm Beach ‐ Miami 1.31 50.3% 36.9% 10.4% 1.6% 0.8%
Orlando Orlando ‐ West Palm Beach 0.60 70.8% 26.0% 1.6% 1.2% 0.4%
Orlando Orlando ‐ Fort Lauderdale 0.91 64.0% 28.4% 5.6% 0.8% 1.2%
Orlando Orlando ‐ Miami 1.11 62.0% 27.6% 6.8% 2.0% 1.6%
Source: LBG (2012)
Case 1:15-cv-00632-CRC Document 21-2 Filed 05/28/15 Page 99 of 154

All Aboard Florida Ridership and Revenue Study
May 7, 2015
Page 83
4.3.5.5. OtherQuestions Respondents were asked the following question: “What is your opinion about the new rail service that would serve the Miami‐Orlando Corridor based on everything you know about the project?” More than half of the respondents (51.3 percent) indicated that they strongly favor the All Aboard Florida service. Only 6.3 percent oppose the project (i.e., somewhat opposed and strongly opposed).
Figure 4.3‐11: Opinion about All Aboard Florida Service
Source: LBG (2012)
It is likely that a respondent’s past experience with intercity rail service, or with what the respondent considers intercity rail, influences his/her opinion about the proposed service. To assess their previous experience, respondents were asked the following question: “Is there any intercity rail system in the US or around the world on which you have traveled multiple times?” More than half (52 percent) stated that they did and 54 percent of those stated that they used the system last within the past year. However, the majority (84 percent) of those who indicated that they are familiar with intercity rail specified that the system that they were referring to is a subway system or a commuter rail system.
Table 4.3‐19: Familiarity with Intercity Rail
Last Used Intercity rail Percent of
Respondents
In the last month 15.91In the last 6 months 18.08In the last year 20.14In the last 2 years 13.84More than 2 years ago 29.55Don't know 2.48
Source: LBG (2012)
0%
10%
20%
30%
40%
50%
60%
Strongly favor Somewhatfavor
Neutral/ noopinion
Somewhatopposed
Stronglyopposed
Case 1:15-cv-00632-CRC Document 21-2 Filed 05/28/15 Page 100 of 154

All Aboard Florida Ridership and Revenue Study
May 7, 2015
Page 84
4.3.5.6. Socioeconomics
Table 4.3‐20 provides an overview of the socioeconomic characteristics of the respondents. Respondents are older, more likely to be female, and live in higher income household than the average study area resident.
Both the median and average age of respondents was 47. The study area’s median age is 39.
Women account for 54.3 percent of total respondents in the sample while they account for 52.8
percent of the study area population.
Median household income of the sample was $77,000, compared to $46,000 in the study area.
Table 4.3‐20: Socioeconomic characteristics
Age Average 47 25th percentile 32 Median 47 75th percentile 62 Gender Male (%) 45.8 Female (%) 54.3 Household size Average 2.5 Workers Average per household 1.5 Households without workers (%) 15.7 Household Income Average $ 90,284 25th percentile $ 47,500 Median $ 77,500 75th percentile $ 112,500 Vehicles Zero‐vehicle households (%) 4.2 Average per household 1.87 Average per worker 1.25
Source: LBG (2012)
4.3.6 TradingAnalysis An analysis of the trading behavior of survey respondents during the mode choice experiments was conducted to confirm that respondents understood the choices and reacted to the proposed trade‐offs in a reasonable way. Trading analysis tracks the willingness to shift from one’s usual mode (reference trip) of travel to a new mode of travel in the choice experiments. Each respondent was presented with a set of 8 choice experiments in which they were requested to choose between four modes. To evaluate trading behavior, LBG counted the number of modes a respondent choose during the choice
Case 1:15-cv-00632-CRC Document 21-2 Filed 05/28/15 Page 101 of 154

All Aboard Florida Ridership and Revenue Study
May 7, 2015
Page 85
experiments. Levels of trading observed in the SP survey are consistent with the study team’s expectations and the literature on best practices for SP surveys. For trips between Miami and Orlando, 68 percent of respondents switched (when presented with differences in travel time or cost) from their current mode of travel to two or more different modes over the course of the eight experiments (Table 4.3‐21).
Table 4.3‐21: Trading Evaluation – Long Distance
Number of Modes Chosen in Addition to Current Mode (Modes Traded To in 8 experiments)
Count of Responses
Percentage of Total
0 11 1.8%
1 180 29.9%
2 259 43.0%
3 126 20.9%
4 25 4.2%
5 1 0.2%
Total 602 100.0%
Traders 411 68.3%
As expected, trading was less frequent for the shorter distance trips in the initial operating segment where travel time and cost are less important in choice of mode. For trips between Miami and West Palm Beach, 32 percent of respondents switched (when presented with differences in travel time or cost) from their current mode of travel to two or more different modes over the course of the eight experiments (Table 4.3‐22). Over 38 percent did not trade from their current mode at all.
Table 4.3‐22: Trading Evaluation – Short Distance
Number of Modes Chosen in Addition to Current Mode (Modes Traded To in 8 experiments)
Count of Responses
Percentage of Total
0 286 39.6%
1 206 28.5%
2 193 26.7%
3 35 4.8%
4 3 0.4%
5 ‐ 0.0%
Total 723 100.0%
Traders 231 32.0%
Case 1:15-cv-00632-CRC Document 21-2 Filed 05/28/15 Page 102 of 154

All Aboard Florida Ridership and Revenue Study
May 7, 2015
Page 86
5. TravelDemandModelDevelopment
Upon completion of the primary data collection effort, the LBG team analyzed the SP data following best practice in discrete choice analysis. Several mode choice models were developed and evaluated for suitability in forecasting travel demand for the AAF initial operating segment. Best performing nested logit models were chosen for mode choice analysis of the business and non‐business market segments. This section describes the development of the mode choice models and the steps and assumptions necessary in the application of those models in ridership and revenue forecasting.
5.1 DiscreteChoiceAnalysis/ModelEstimation
The selections respondents made in the hypothetical choice scenarios presented in the survey were evaluated using discrete choice analysis techniques to determine the factors driving mode choice decisions. The anticipated differences in travel behavior distinguished by travel distance (long and short distance travel) and by trip purpose (business/non‐business travel) required the iterative development and testing of four separate mode choice models. LBG elected to segment both the long and short distance models on the basis of trip purpose rather than on the basis of current mode use due to the anticipated limitations of mode segmented models. Although mode segmented models provide one avenue of determining diversions from existing modes to the newly introduced service, this binary diversion framework typically does not capture the shifts between existing modes that may result from level of service (LoS) changes of those modes. This binary framework therefore essentially relies on the assumption that current and projected LoS profiles for each existing mode are fixed such that current and future market shares of existing modes remain unchanged. This limits the ability to perform rigorous scenario analysis of future conditions that may differ significantly from current assumptions.
5.1.1 ConceptualOverview The basic concept driving discrete choice analysis is the idea of utility maximization. Utility in economics is described as the satisfaction an individual gains from the consumption of goods or services. Each alternative in a decision maker’s choice set provides a level of utility that is both a function of the attributes specific to that alternative, as well as the decision maker’s own characteristics. The logit model’s mathematical form has been found to most closely articulate a number of the theoretical principles of utility theory maximization. It has been deployed in various forms as the basis for the development of several discrete choice models used in analyzing transportation mode choice. The utility of a given alternative is assumed to comprise a deterministic portion that is a function of measurable characteristics, as well an error term that accounts for the portion of an individual’s utility derived from a given mode that cannot be observed or measured by an analyst.
Case 1:15-cv-00632-CRC Document 21-2 Filed 05/28/15 Page 103 of 154

All Aboard Florida Ridership and Revenue Study
May 7, 2015
Page 87
Ui = Vi + ε
Where: Ui = represents the utility accruing to individual i
Vi = represents the deterministic portion of utility accruing to individual i
ε = represents the error term
The deterministic component of the utility function derived for each alternative in a choice set is
typically characterized by a linear combination of explanatory variables as shown below and will also
generally comprise a constant term, often termed the alternative specific constant (ASC) or mode
constant. The mode constant reflects the relative preference towards a given alternative among the set
of choices available, after accounting for and holding the effects of the other variables in the utility
function fixed.
Utility FECR = ASC FECR + (β1* IVTT FECR) + (β2 * OVTT FECR) + (β3* Cost FECR) + … (1)
Utility auto = ASC auto + (β1* IVTT auto) + (β2 * OVTT auto) + (β3* Cost auto) +… (2)
Utility bus = ASCbus + (β1* IVTT bus) + (β2 * OVTT bus) + (β3* Cost bus) + … (3)
Where:
IVTT = In‐Vehicle Travel Time
OVTT = Out‐of‐Vehicle Travel Time
The multinomial logit model (MNL) that forms the basis of discrete choice models calculates the
probability of selecting a given alternative by comparing the utility of that mode against the total
utilities of all mode alternatives in a choice set. Formally it is expressed as:
Uj
Jj
Ui
(i)e
eP
(4)
Where:
i and j are alternatives in a choice set,
P(i) is the probability of choosing Mode i,
J is the set of all alternatives available to the individual (including modes i and j),
U is the utility associated with a given mode (as shown above)
For example, using the three alternatives presented above (FECR, auto, and bus), the probability of
choosing the rail (FECR) over the auto or bus is the ratio of the exponentiated utility derived from the
rail against the sum of all exponentiated utilities in the choice set as expressed in the equation below.
)exp(U)exp(U)exp(U
)exp(UP(FECR)
FECRbusauto
FECR
(5)
Case 1:15-cv-00632-CRC Document 21-2 Filed 05/28/15 Page 104 of 154
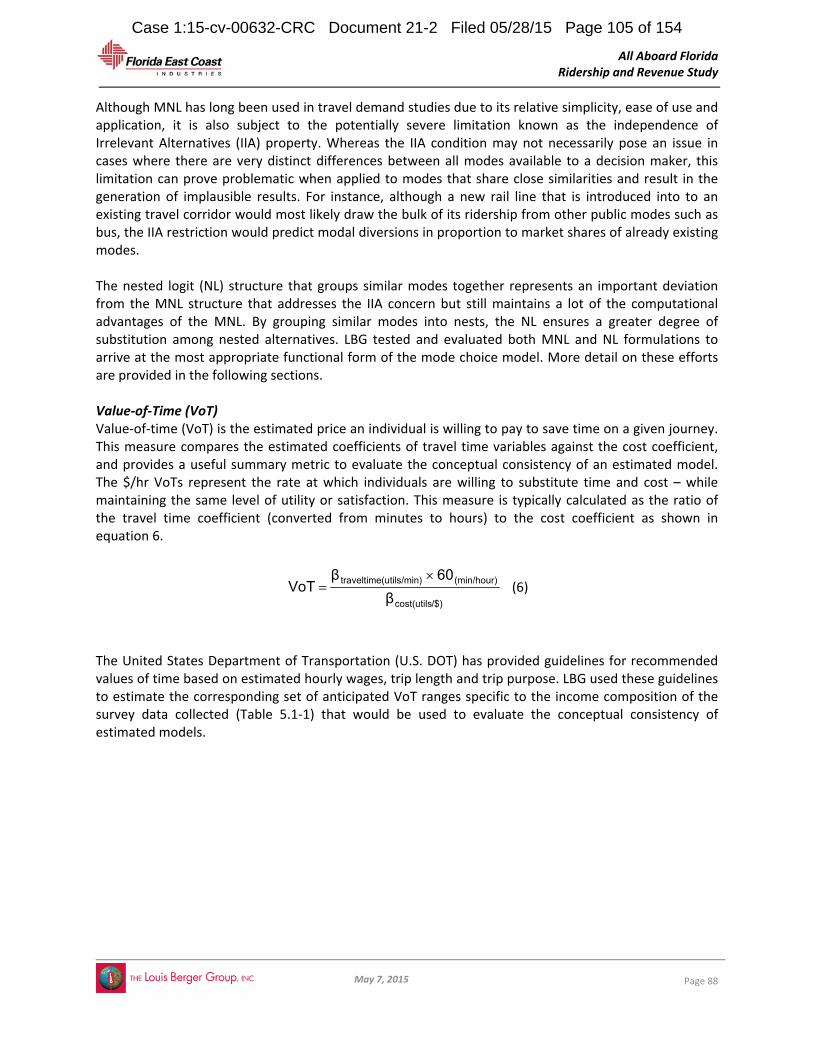
All Aboard Florida Ridership and Revenue Study
May 7, 2015
Page 88
Although MNL has long been used in travel demand studies due to its relative simplicity, ease of use and application, it is also subject to the potentially severe limitation known as the independence of Irrelevant Alternatives (IIA) property. Whereas the IIA condition may not necessarily pose an issue in cases where there are very distinct differences between all modes available to a decision maker, this limitation can prove problematic when applied to modes that share close similarities and result in the generation of implausible results. For instance, although a new rail line that is introduced into to an existing travel corridor would most likely draw the bulk of its ridership from other public modes such as bus, the IIA restriction would predict modal diversions in proportion to market shares of already existing modes. The nested logit (NL) structure that groups similar modes together represents an important deviation from the MNL structure that addresses the IIA concern but still maintains a lot of the computational advantages of the MNL. By grouping similar modes into nests, the NL ensures a greater degree of substitution among nested alternatives. LBG tested and evaluated both MNL and NL formulations to arrive at the most appropriate functional form of the mode choice model. More detail on these efforts are provided in the following sections. Value‐of‐Time (VoT) Value‐of‐time (VoT) is the estimated price an individual is willing to pay to save time on a given journey. This measure compares the estimated coefficients of travel time variables against the cost coefficient, and provides a useful summary metric to evaluate the conceptual consistency of an estimated model. The $/hr VoTs represent the rate at which individuals are willing to substitute time and cost – while maintaining the same level of utility or satisfaction. This measure is typically calculated as the ratio of the travel time coefficient (converted from minutes to hours) to the cost coefficient as shown in equation 6.
/$)cost(utils
(min/hour))(utils/mintraveltime
β
60βVoT
(6)
The United States Department of Transportation (U.S. DOT) has provided guidelines for recommended values of time based on estimated hourly wages, trip length and trip purpose. LBG used these guidelines to estimate the corresponding set of anticipated VoT ranges specific to the income composition of the survey data collected (Table 5.1‐1) that would be used to evaluate the conceptual consistency of estimated models.
Case 1:15-cv-00632-CRC Document 21-2 Filed 05/28/15 Page 105 of 154

All Aboard Florida Ridership and Revenue Study
May 7, 2015
Page 89
Table 5.1‐1: US DOT Guidelines for Value‐of‐Time (VoT) Ranges
Value of Time Ranges (2009 U.S. $ Per Person‐Hour)
Category
Surface Modes (Except HSR)
Air & HSR
Low High Low High
Local Travel
Personal $8.40 $14.30 ‐‐ ‐‐
Business $18.30 $27.50 ‐‐ ‐‐
All Trips $8.90 $14.90 ‐‐ ‐‐
Intercity Travel
Personal $8.40 $21.50 $27.40 $41.00
Business $18.30 $27.50 $45.80 $68.60
All Trips $15.20 $22.80 $34.80 $52.20
5.1.2 SummaryofModelEstimationProcess
The US DOT guidelines above point to distinct travel behaviors based on travel distance and LBG therefore estimated two separate sets of models for both the long and short distance markets. Respondents who traveled from Central Florida (the region around Orlando) to Southeast Florida (West Palm Beach, Fort Lauderdale, or Miami) were categorized as long distance travelers while respondents traveling within the Southeast Florida area were categorized as short distance travelers.
5.1.2.1 LongDistanceModel
LBG estimated a general MNL base model using data of respondents making long distance trips. The time and cost coefficients from the base model generated an in‐vehicle travel time (IVTT) VoT of $21.45/hr which fell within the anticipated target range prescribed in the US DOT guidelines for all intercity trips by surface modes (over 95% of long distance travel in the Central to Southeast Florida market is made by private auto vehicle). LBG estimated three separate long distance base models segmented by the respondents reported mode of most recent or typical intercity travel. Travelers were grouped into three broad classifications; air travelers, public surface mode users (rail, bus, etc.), and private surface mode users (private auto vehicle, rental cars etc.). VoTs obtained from this process are presented in Table 5.1‐2 and are consistent with the US DOT guidelines. Air travelers, as expected, have the highest VoT. Both private and public surface mode users have VoTs that are generally equal to the upper and lower boundaries prescribed by the US DOT guidelines. The overall pattern observed in these findings provided assurances that the SP data collected was well conditioned for use in determining the likely responses of travelers to the proposed new service.
Case 1:15-cv-00632-CRC Document 21-2 Filed 05/28/15 Page 106 of 154
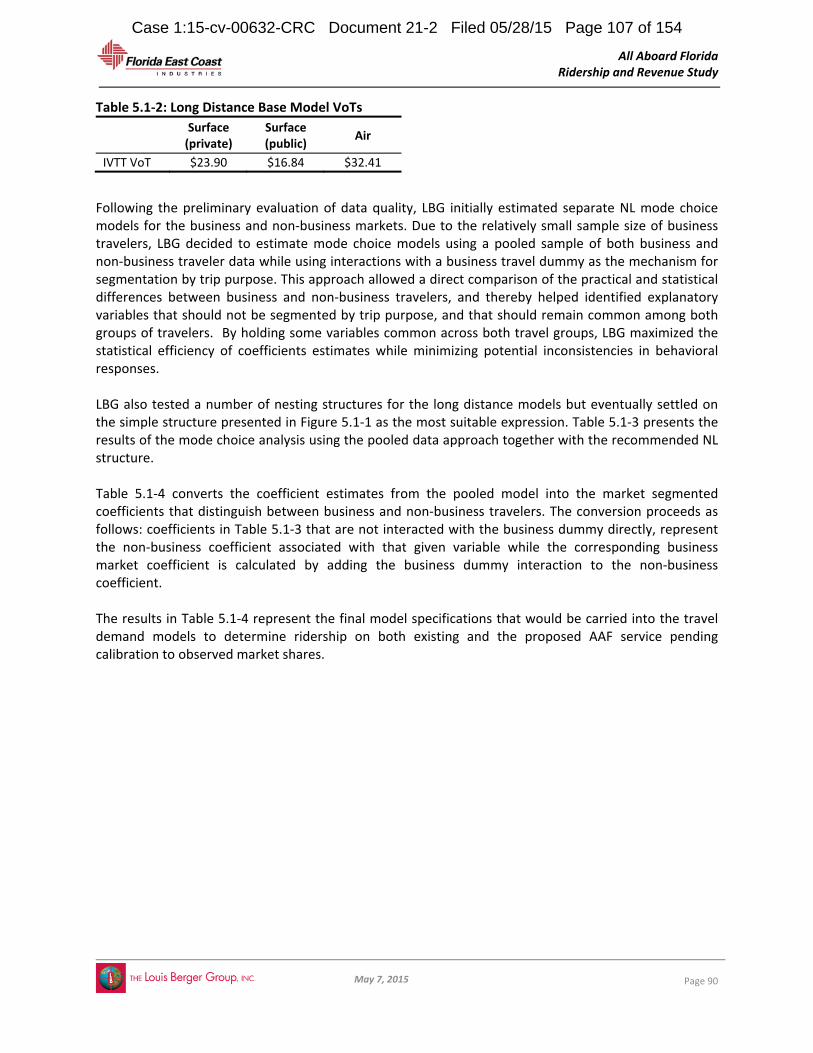
All Aboard Florida Ridership and Revenue Study
May 7, 2015
Page 90
Table 5.1‐2: Long Distance Base Model VoTs
Surface (private)
Surface (public)
Air
IVTT VoT $23.90 $16.84 $32.41
Following the preliminary evaluation of data quality, LBG initially estimated separate NL mode choice models for the business and non‐business markets. Due to the relatively small sample size of business travelers, LBG decided to estimate mode choice models using a pooled sample of both business and non‐business traveler data while using interactions with a business travel dummy as the mechanism for segmentation by trip purpose. This approach allowed a direct comparison of the practical and statistical differences between business and non‐business travelers, and thereby helped identified explanatory variables that should not be segmented by trip purpose, and that should remain common among both groups of travelers. By holding some variables common across both travel groups, LBG maximized the statistical efficiency of coefficients estimates while minimizing potential inconsistencies in behavioral responses. LBG also tested a number of nesting structures for the long distance models but eventually settled on the simple structure presented in Figure 5.1‐1 as the most suitable expression. Table 5.1‐3 presents the results of the mode choice analysis using the pooled data approach together with the recommended NL structure. Table 5.1‐4 converts the coefficient estimates from the pooled model into the market segmented coefficients that distinguish between business and non‐business travelers. The conversion proceeds as follows: coefficients in Table 5.1‐3 that are not interacted with the business dummy directly, represent the non‐business coefficient associated with that given variable while the corresponding business market coefficient is calculated by adding the business dummy interaction to the non‐business coefficient. The results in Table 5.1‐4 represent the final model specifications that would be carried into the travel demand models to determine ridership on both existing and the proposed AAF service pending calibration to observed market shares.
Case 1:15-cv-00632-CRC Document 21-2 Filed 05/28/15 Page 107 of 154

All Aboard Florida Ridership and Revenue Study
May 7, 2015
Page 91
Figure 5.1‐1: Long Distance Mode Choice Model Nested Logit Structure
Table 5.1‐3: Mode Choice Model Estimation Results
Variable Coef. Std. Err. Z‐Stat P‐value
Alternative Specific Constants (ASC) Air ‐0.45441 0.08804 ‐5.16 0.000 Air‐Business 0.29149 0.15886 1.83 0.067 Rail ‐0.42960 0.09559 ‐4.49 0.000 Rail‐Business 0.18660 0.10643 1.75 0.080 Bus ‐0.93531 0.10369 ‐9.02 0.000 Bus‐Business ‐0.19932 0.16521 ‐1.21 0.228 Private Auto ‐0.23238 0.08354 ‐2.78 0.005 Private Auto‐Business 0.17276 0.16180 1.07 0.286 Rental Car ‐1.95726 0.14552 ‐13.45 0.000 Rental Car‐Business 0.82783 0.28554 2.90 0.004
LOS Variables Access Time ‐0.00431 0.00083 ‐5.19 0.000 Access Time‐Business ‐0.00227 0.00201 ‐1.13 0.259 Headways ‐0.00129 0.00044 ‐2.95 0.003 In‐Vehicle Travel Time (IVTT) ‐0.00428 0.00046 ‐9.32 0.000 Cost ‐0.01377 0.00124 ‐11.13 0.000 Cost‐Business 0.00568 0.00176 3.23 0.001
Nesting Coefficient θ 0.56701 0.05051
Trip
Private Auto Public Nest
Rail (AAF) Air Rail (Amtrak) Bus
Case 1:15-cv-00632-CRC Document 21-2 Filed 05/28/15 Page 108 of 154

All Aboard Florida Ridership and Revenue Study
May 7, 2015
Page 92
Table 5.1‐4: Market Segmented Long Distance Travel Market
Mode Choice Model Estimation Results
Variable Non‐Business Business
Alternative Specific Constants (ASC) AAF 0.00000 0.00000Air ‐0.45441 ‐0.16293Rail ‐0.42960 ‐0.24300Bus ‐0.93531 ‐1.13464Private Auto ‐0.23238 ‐0.05962Rental Car ‐1.95726 ‐1.12943
LOS Variables
Access Time ‐0.00431 ‐0.00658
Headways ‐0.00129 ‐0.00129In‐Vehicle Travel Time (IVTT) ‐0.00428 ‐0.00428Cost ‐0.01377 ‐0.00809
Nesting Coefficient θ 0.56701 0.56701
Implied VOT ($/Hr) Access Time $18.77 $48.76IVTT $18.67 $31.77Headways $5.63 $9.58
Case 1:15-cv-00632-CRC Document 21-2 Filed 05/28/15 Page 109 of 154

All Aboard Florida Ridership and Revenue Study
May 7, 2015
Page 93
5.1.2.2 ShortDistanceModel
The short distance models were estimated using a slightly different process from than that used to generate the long distance models. Given the exclusion of air as a mode option in the short distance travel market, LBG estimated three MNL base models (all trips, business trips, and non‐business trips) to
be evaluated against the US DOT value‐of‐time guidelines. VoTs obtained from this process are presented in Table 4.4‐5 where each VoT value appears consistent with the broad US DOT expectations. The overall pattern observed in these findings once again provides assurances that the SP data collected was well conditioned for use in determining the likely responses of travelers to the proposed new service.
Table 5.1‐5: Short Distance Base Model VoTs
All
Travelers Business Travelers
Non‐Business Travelers
IVTT VoT $14.18 $19.52 $12.65
The pooled data approach used to estimate the long distance models did not generate similar analytical advantages for the short distance travel market and LBG therefore elected to estimate separate NL mode choice models for the business and non‐business markets. Figure 5.1‐2: Short Distance Mode Choice Model Nested Logit Structure
Trip
Private Auto Public Nest
Rail (AAF) Rail (Tri‐Rail) Bus
Case 1:15-cv-00632-CRC Document 21-2 Filed 05/28/15 Page 110 of 154

All Aboard Florida Ridership and Revenue Study
May 7, 2015
Page 94
LBG also tested a fewer number of nesting structures for the short distance models due to the exclusion of air travel options and the resulting smaller number of public mode combinations possible. LBG eventually settled on the simple structure presented in Figure 5.1‐2 as the most suitable expression. Table 5.1‐6 presents the results of the short distance market mode choice analysis.
Table 5.1‐6: Market Segmented Short Distance Travel Market Mode Choice Model
Estimation Results
Variable Non‐Business Business
Alternative Specific Constants (ASC) AAF 0.00000 0.00000Rail ‐0.22068 ‐0.20234Bus ‐0.66591 ‐0.67202Private Auto 0.42213 0.68430Rental Car ‐2.74710 ‐0.36674
LOS Variables Access Time ‐0.01009 ‐0.01189Headways ‐0.00184 ‐0.00350In‐Vehicle Travel Time (IVTT) ‐0.00736 ‐0.01146Cost ‐0.04126 ‐0.05006
Nesting Coefficient θ 0.34970 0.47176
Implied VOT ($/Hr) Access Time $14.67 $14.25IVTT $10.71 $13.74Headways $2.68 $4.19
5.1.3 ModelEstimationResults
A statistical analysis of the business dummy interaction during the long distance model estimation process indicated that the coefficients on headways and IVTT should be common across both market segments hence the single measures for each in Table 5.1‐3. The statistical and practical similarities in IVTT coefficients across both travel segments comports with structural rationale that both sets of travelers have similar disutility of additional travel time but vary in their means or willingness to pay for a faster mode of travel. The results in Table 5.1‐4 show that long distance business travelers have a higher disutility of access time relative to the non‐business market segment. Business travelers also have a lower disutility of travel costs and this results in higher values of both access and in‐vehicle travel time when compared to the long distance non‐business travel market.
Case 1:15-cv-00632-CRC Document 21-2 Filed 05/28/15 Page 111 of 154
All Aboard Florida Ridership and Revenue Study
May 7, 2015
Page 95
Although the AAF mode constant in both long distance travel markets is ranked highest among the six modes available including private auto, it should be noted that the constants only models that were specified in the initial stages of model estimation generated mode constant values that ranked private auto as the most preferred mode; thus the mode constant values in Table 5.1‐4 from the long distance travel market represent the preference towards AAF only after the effects of access time, service frequency, line‐haul time and travel cost have been taken into account and are held fixed. The constant values obtained from the SP data were adjusted during the model calibration process that attempted to match market shares of existing modes. The divergence in business and non‐business VoT estimates observed from the base model estimation of the short distance travel market (Table 5.1‐5) narrowed significantly after nesting structures were imposed on the mode choice models. Nonetheless, VoT estimates of business travelers were still observed to be higher than non‐business travelers in the short distance market – this time however, the difference in VoT is driven more by greater disutility to travel time. The mode constants in the short distance market rank AAF as the second most preferred mode after private auto once LoS variables have been accounted for and are held fixed. AAF displays a modal preference advantage over existing Tri‐Rail (that has a more robust ridership profile in the SE Florida market than Amtrak does in the long distance travel market) and implies that this would be the preferred public mode of travel in the SE Florida region. The results in Tables 5.1‐4 and 5.1‐6 represent the final model specifications that would be carried into the travel demand models that would inform the ridership estimates of the proposed AAF service pending calibration to match observed market shares of existing modes of travel.
5.2 ModelApplicationOverview To apply the mode choice model to the candidate travel market and develop a forecast for AAF service, LBG assembled a database of level of service information for each mode of travel, as described below. In‐vehicle travel times, operating costs, fare costs, and station access times were developed for each origin and destination pair for each mode of travel. Using this level of service data, the nested mode choice model representing the travel behavior of each market segment was applied to the corresponding trip table to derive travel utilities and implied mode shares between the three catchment areas for each of the 234 analysis zones. Adjustments to the mode constants were made to match predicted shares against the targets implied by trip table mode split. Once calibrated, the adjusted model specifications were applied to a build scenario that included the AAF service as an additional travel alternative. The difference between the build and no‐build scenarios was used to estimate the diversions from existing modes and arrive at a forecast for AAF ridership.
Case 1:15-cv-00632-CRC Document 21-2 Filed 05/28/15 Page 112 of 154
All Aboard Florida Ridership and Revenue Study
May 7, 2015
Page 96
5.3 LevelofServiceAssumptions The LBG team developed service profiles for each of the intercity travel modes considered in this study. As outlined above, these LOS variables would be applied to the mode choice model equations described in Section 5.1 to estimate travel utilities for each available mode. Given the structure of LBG’s mode choice models, the LOS variables of interest include the following:
Private auto
In‐Vehicle Travel Time
Out‐of‐pocket travel cost – includes cost of gas and tolls and is divided by number of
vehicle occupants
Public modes
Service headways (minutes)
Out‐of‐Vehicle Travel Time (OVTT) – includes access and egress travel time from stations
and terminal time
In‐Vehicle Travel Time (IVTT)
Fares
Access/egress costs
5.3.1 Auto Auto is the predominant mode of travel in the corridor and the level of service variables describe the trip lengths and costs that travelers typically encounter. Knowledge of typical travel times and costs is a factor in the traveler’s choice of modes. Because of the relatively short distances involved in the Southeast Florida market and the dominant position of this mode in the candidate travel market, LBG took care to develop conservative assumptions for the level of service parameters so as not to overestimate the willingness of current auto travelers to switch to AAF service.
5.3.1.1 HighwayTravelTimes For the short distance Southeast Florida market, LBG utilized travel time data extracted from the SERPM 6.7 model for the 2010 base year. The following steps were employed in the development of the travel time estimates.
Zone‐to‐zone travel times for each of the 4,106 TAZs in the SERPM 6.7 were assembled for all
trip purposes for peak and off‐peak periods.
The TAZ data base was clipped to exclude zones outside the catchment areas and limit the
evaluation to only those trips and travel times between the catchment areas.
SERPM TAZs were aggregated to the 234 AAF analysis zones described in Section 3.3.
Case 1:15-cv-00632-CRC Document 21-2 Filed 05/28/15 Page 113 of 154

All Aboard Florida Ridership and Revenue Study
May 7, 2015
Page 97
Average (trip‐weighted) zone‐to‐zone times were calculated for peak and off‐peak periods for
intercity journeys among the 234 zones.
Using trip weights, a composite all‐day (peak and off‐peak) travel time was estimated for each
zone pair. This composite time was used in the application of the mode choice model.
Table 5.3‐1 shows an example of the estimated travel times for each city pair. The sample is for travel between zones at the center of each city. The table shows that the off‐peak uncongested times derived from SERPM are consistent with off‐peak travel times from the Google Maps service; and that the composite times fall between the map service estimates for peak and off‐peak travel times. LBG performed other spot checks of travel times and distances and found the dataset to be generally consistent with published map service estimates.
Table 5.3‐1: Example Highway Travel Times
City Pair Distance
Off‐Peak(Uncongested)
Travel Time
Composite Peak/OP
Time
Map Service
Estimate Off‐Peak
Map Service
EstimatePeak
West Palm Beach ‐ Miami 69 mi 68 89 72 102
West Palm Beach ‐ Fort Lauderdale 45 mi 45 58 51 70
Fort Lauderdale ‐ Miami 27 mi 30 38 36 41 Source: LBG, 2012. Map service estimate from Google Maps for an off‐peak time and morning peak period.
The Southeast Florida MPOs anticipated that congestion will increase substantially through 2030 as growth in vehicle miles traveled continues to outpace programmed improvements in the transportation network. This increased roadway congestion would increase auto IVTT in the future and make AAF a more attractive alternative to auto travel, especially in peak periods. To ensure a conservative estimate of AAF ridership, however, we have not factored in growth in highway congestion and auto travel times. For purposes of the forecast, we assume that future travel times are fixed at current levels.
For the long‐distance Southeast Florida to Central Florida market, LBG extracted zone to zone travel times from Google Maps using Google Maps API. These travel times were then evaluated against uncongested and congested times extracted from the Central Florida Regional Planning Model (CERPM) and the SERPM for validation.
5.3.1.2 HighwayTravelCosts
Given the large size of the intercity auto market, an important aspect in the development of the forecast is the identification of a sound, conservative assumption for out‐of‐pocket auto operating costs, which are based in large part on fuel prices. Although fuel prices have been rising overall and have been subject to a large degree of volatility in recent years, long‐term trends are based on a consideration of future demand, opportunities for new sources of supply, and technological advances and regulations that reduce dependence on petroleum or increase the efficiency of gasoline‐powered vehicles. To arrive at a conservative assumption, LBG reviewed the latest EIA Annual Energy Outlook (2014)16. This outlook provides the latest U.S. average gasoline pump price projection. Figure 5.3‐1 shows the 2014 projection
16 EIA Annual Energy Outlook 2014 (http://www.eia.gov/forecasts/aeo/index.cfm).
Case 1:15-cv-00632-CRC Document 21-2 Filed 05/28/15 Page 114 of 154

All Aboard Florida Ridership and Revenue Study
May 7, 2015
Page 98
for long term gas prices most appropriate for use in the model. The 2040 projections are $3.90 for the reference case, $2.61 for the low case, and $5.04 for the high case.
Figure 5.3‐1: 2014 EIA Gas Price Projection (2012 $ per Gallon)
Source: EIA Annual Energy Outlook 2014.
Given current and forecast fuel prices and other out‐of‐pocket operating costs, we assume an auto operating cost of $0.18 (2012 $) per mile for the 2016 base year forecast. For purposes of the 2030 horizon‐year forecast, we assume that prices remain fixed at this level.
5.3.2 Bus
As noted in Section 3.4.2, travel by bus constitutes a small segment of the overall travel market in the corridor. There are private services, such as Greyhound that that offer intercity trips. To represent the current bus market in our mode choice model, we examined published schedules and assumed the service parameters for each city pair presented in Table 5.3‐1.
Table 5.3‐2: Long‐Distance Bus Level of Service Parameters
Level of Service Parameter Orlando– Miami
Orlando –Fort
Lauderdale
Orlando –West Palm Beach
In Vehicle Travel Time (minutes) 255 225 195
Fare Cost (2012 $) $52.00 $52.00 $46.00
Headway (minutes) 127 141 187
Case 1:15-cv-00632-CRC Document 21-2 Filed 05/28/15 Page 115 of 154
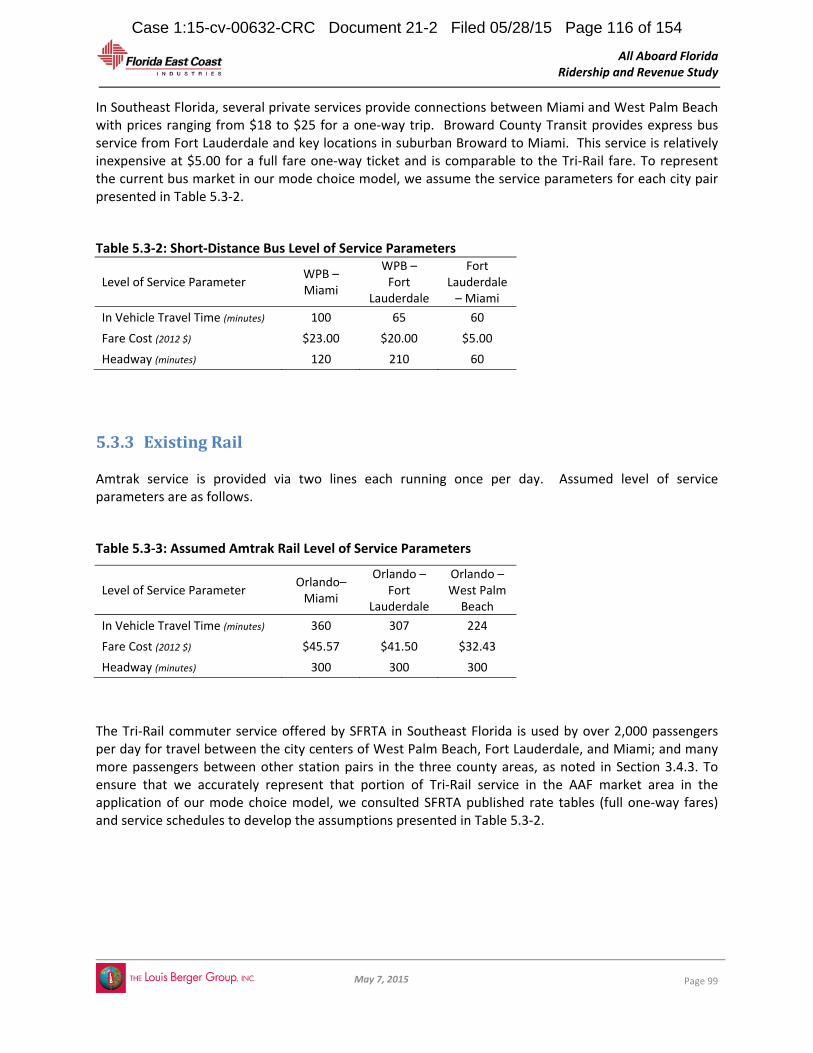
All Aboard Florida Ridership and Revenue Study
May 7, 2015
Page 99
In Southeast Florida, several private services provide connections between Miami and West Palm Beach with prices ranging from $18 to $25 for a one‐way trip. Broward County Transit provides express bus service from Fort Lauderdale and key locations in suburban Broward to Miami. This service is relatively inexpensive at $5.00 for a full fare one‐way ticket and is comparable to the Tri‐Rail fare. To represent the current bus market in our mode choice model, we assume the service parameters for each city pair presented in Table 5.3‐2.
Table 5.3‐2: Short‐Distance Bus Level of Service Parameters
Level of Service Parameter WPB – Miami
WPB –Fort
Lauderdale
Fort Lauderdale – Miami
In Vehicle Travel Time (minutes) 100 65 60
Fare Cost (2012 $) $23.00 $20.00 $5.00
Headway (minutes) 120 210 60
5.3.3 ExistingRail Amtrak service is provided via two lines each running once per day. Assumed level of service parameters are as follows.
Table 5.3‐3: Assumed Amtrak Rail Level of Service Parameters
Level of Service Parameter Orlando– Miami
Orlando –Fort
Lauderdale
Orlando –West Palm Beach
In Vehicle Travel Time (minutes) 360 307 224
Fare Cost (2012 $) $45.57 $41.50 $32.43
Headway (minutes) 300 300 300
The Tri‐Rail commuter service offered by SFRTA in Southeast Florida is used by over 2,000 passengers per day for travel between the city centers of West Palm Beach, Fort Lauderdale, and Miami; and many more passengers between other station pairs in the three county areas, as noted in Section 3.4.3. To ensure that we accurately represent that portion of Tri‐Rail service in the AAF market area in the application of our mode choice model, we consulted SFRTA published rate tables (full one‐way fares) and service schedules to develop the assumptions presented in Table 5.3‐2.
Case 1:15-cv-00632-CRC Document 21-2 Filed 05/28/15 Page 116 of 154

All Aboard Florida Ridership and Revenue Study
May 7, 2015
Page 100
Table 5.3‐4: Assumed Commuter Rail Level of Service Parameters
Level of Service Parameter WPB – Miami
WPB –Fort
Lauderdale
Fort Lauderdale – Miami
In Vehicle Travel Time (minutes) 98 60 43
Fare Cost (2012 $) $6.90 $6.25 $5.00
Headway (minutes) 120 210 60
5.3.4 AirTravel Air travel between Orlando and Fort Lauderdale and Miami is a small but active component of the travel market. To determine level of service parameters, we evaluated published schedules and fare quotes. Table 5.3‐5: Assumed Airline Level of Service Parameters
Level of Service Parameter Orlando– Miami
Orlando –Fort
Lauderdale
Orlando –West Palm Beach
In Vehicle Travel Time (minutes) 60 60 N/A
Fare Cost (2012 $) $150 $100 ‐
Headway (minutes) 98 203 ‐
5.3.5 AAFservice AAF will offer hourly service, daily, between Miami and Orlando with 14 roundtrips in all per day. Trains will run from 5am to 7pm. Scheduled travel times from Miami to Orlando will be 3 hours 15 minutes. From Miami to Fort Lauderdale the assumed travel time is 31 minutes, and the journey time from Miami to West Palm Beach will be 67 minutes. Tables 5.3‐6 and 5.3‐7 outline the level of service assumptions for AAF. The assumed fare prices were based on an evaluation of traveler willingness to pay derived from the SP survey. See section 6.7 for a discussion on the fare optimization analysis and the basis for ticket prices assumed in this ridership and revenue forecast.
Table 5.3‐3: Assumed AAF Level of Service Parameters – Long Distance
Level of Service Parameter Orlando– Miami
Orlando –Fort
Lauderdale
Orlando –West Palm Beach
In Vehicle Travel Time (minutes) 195 164 128
Fare Cost – Business (2012 $) $130 $115 $90
Fare Cost – Non‐Business (2012 $) $85 $75 $60
Headway (minutes) 60 60 60 Source: LBG, 2012.
Case 1:15-cv-00632-CRC Document 21-2 Filed 05/28/15 Page 117 of 154

All Aboard Florida Ridership and Revenue Study
May 7, 2015
Page 101
Table 5.3‐3: Assumed AAF Level of Service Parameters – Short Distance
Level of Service Parameter WPB – Miami
WPB –Fort
Lauderdale
FortLauderdale – Miami
In Vehicle Travel Time (minutes) 67 36 31
Fare Cost – Business (2012 $) $21.00 $18.00 $15.00
Fare Cost – Non‐Business (2012 $) $16.00 $14.00 $11.00
Headway (minutes) 60 60 60 Source: LBG, 2012.
5.3.6 StationAccessandEgress
To provide the input parameters necessary for implementation of the mode choice model, LBG developed estimates for station access and egress travel time and cost for AAF and the other public modes of travel serving the Southeast Florida market. This section outlines the assumptions and the basis for their development.
5.3.6.1 AccessandEgressTravelTime
Through our analysis of relevant data from the SP survey (see Section 5.1 on mode choice model development), LBG confirmed that travelers in Central and Southeast Florida place a higher value on the time it takes to access a public mode of travel (out of vehicle travel time ‐OVTT) than an equivalent amount of time spend traveling on board that mode (in‐vehicle travel time ‐ IVTT). In calculating OVTT we must also consider the time it takes to get from a station at the end of a trip to a traveler’s ultimate destination. Because OVTT is an important parameter in mode choice, LBG took care in developing assumptions for access and egress from AAF stations and other public modes of transport in the region. The steps LBG used in determining OVTT estimates for AAF, commuter rail, and bus are outlined below along with key assumptions.
Consistent with the process for developing zone‐to‐zone times for highway auto travel (see Section 5.3.1.1) in the Short‐Distance Market, LBG assembled travel times from each of the 4,106 TAZs in the SERPM 6.7 to each TAZ containing a proposed AAF Station or existing Tri‐Rail Station. Bus locations were assumed to be the same as AAF station zones and Tri‐Rail station zones. This data extraction was done for peak and off‐peak time periods.
As with the highway dataset, the TAZ data base was clipped to exclude zones outside the catchment areas and then SERPM TAZs were aggregated to the 234 AAF analysis zones.
LBG then developed a composite of peak and off‐peak travel times by weighting for the number of trips—also consistent with the method employed for highway time estimation. The resulting matrix provided an auto access travel time, appropriate for our all‐day model, from each of the 234 AAF zones to a station location.
We assumed a terminal time of 15 minutes for AAF and other modes.
Egress times, representing the journey from the arrival station to the ultimate destination zone were also estimated and a single parameter representing access time, terminal time, and egress time was calculated for each zone pair.
Case 1:15-cv-00632-CRC Document 21-2 Filed 05/28/15 Page 118 of 154

All Aboard Florida Ridership and Revenue Study
May 7, 2015
Page 102
The overall average (weighted by estimated AAF trips) for the access/egress parameter is 50.1 minutes. This represents an average of approximately 18 minutes of access time, 15 minutes of terminal time, and 18 minutes of egress time. This is consistent with the assumptions LBG employed in developing the catchment areas (see Section 3.3), where we limited the overall station access travel shed to 20 to 30 minutes.
5.3.6.2 AccessandEgressCost
Travelers also consider the cost involved in station access and egress in their choice of a public mode of travel. In the mode choice model we apply a cost of $0.18 per mile for station access and egress. This is the same cost that is applied to highway auto travel between the cities and represents out of pocket cost for auto vehicle use. To account for the variations in cost for all modes of access to stations, we apply this rate to all travelers (for AAF and other public mode access and egress the cost is not discounted for auto occupancy). With average auto occupancy of 2.37 for long‐distance intercity travel between Orlando and Southeast Florida, this amounts to an access/egress cost of $0.43 per mile per travel party. In the Short Distance market, where the average auto occupancy is 2.21, the access/egress cost amounts to $0.40 per mile per travel party. Although pegged to the expenses associated with auto travel, this cost assumption accommodates the full range of station access modes that are likely to be used by AAF travelers, including auto drop‐off, taxi, transit, shuttle and walking, as outlined below. In Table 5.3‐4, we show an example of station access modes and the associated cost that can be accommodated in our access/egress cost assumption for Long Distance service. The example outlines the travel party costs for the average station access distance for Long Distance travelers, which is 25 miles at each end or 50 miles for both access and egress. As shown in the table, costs can be expected to differ by mode of access. Auto access includes the $0.18 per mile for auto operating costs, with an allowance of $15 for parking. This parking allowance is based on an average parking charge of $15.00 per day (equivalent to average charges for long‐term and deck parking at Orlando Airport) and an average of 25 mile trip for access. These assumptions produce a total allowance for auto access of $8.40. Drop‐off (kiss and ride) is assumed to be free to the travel party along with walk access. Transit access is assumed at a $2.00 fare for a 2.37 person travel party. Taxi is set at $2.40 per mile that is the standard in Orlando and Miami. When these access costs are combined and weighted to reflect the access proportions expected, 17 the total weighted cost equals the $21.35 total for the average travel party cost in the application of the mode choice model for Long Distance service.
Table 5.3‐5 shows an example for the Short Distance market. The example outlines the travel party costs for the average station access distance for Short Distance travelers, which is 11 miles at each end or 22.5 miles overall for both access and egress. In this example, auto operating costs are the same as for the Long Distance example. Parking costs are set at $10 reflecting the average daily cost for lot parking in Southeast Florida. Taxi costs are set to the average per mile fare for Southeast Florida.
17 Assumed mode shares for station access for Long Distance travelers is based on a review of long‐distance access/egress
characteristics presented in the California High Speed Rail Authority, EIR/EIS Ridership and Revenue Review, June 2011. The review considered access/egress mode share data for U.S. airports (conducted by the Metropolitan Transportation Commission, 2002), the 1995 American Travel Survey, and Amtrak station data. The average mode shares combined access/egress for center city and urban activity center stations, (business and non‐business trip purposes) are: 32% drive access; 28% pick‐up/drop‐off; 7% taxi; 19% transit; and 14% walk/other.
Case 1:15-cv-00632-CRC Document 21-2 Filed 05/28/15 Page 119 of 154

All Aboard Florida Ridership and Revenue Study
May 7, 2015
Page 103
Transit costs are set to a $2.00 fare for a 2.2 person travel party. For Short Distance travel we have assumed a slightly lower share of taxi access and higher share of transit access, given the greater level of
transit service. The overall weighted cost18 is just below the $8.95 cost for an average trip represented
in the Short Distance mode choice model.
Table 5.3‐4: Sample of Access/Egress Costs by Mode – Long Distance Market
Station Access/Egress Mode % Utilization Cost
Weighted Cost (per travel
party)
Private Auto (Operating Cost) 35% $9.00 $3.15
Private Auto (Parking Cost) 35% $15.00 $5.25
Private Auto (Total Cost) 35% $24.00 $8.40
Drop‐off by Private Auto 25% $ ‐ $0.00
Taxi 10% $120.00 $12.00
Transit 20% $4.74 $0.95
Walk / AAF Shuttle / Other 10% $ ‐ $0.00
Total 100% $21.35 Source: LBG, 2014.
Table 5.3‐5: Sample of Access/Egress Costs by Mode – Short Distance Market
Station Access Mode % Utilization
Cost Weighted
Cost (per travel party)
Private Auto (Operating Cost) 35% $4.05 $1.42
Private Auto (Parking Cost) 35% $11.00 $3.85
Private Auto (Total Cost) 35% $15.05 $5.27
Drop‐off by Private Auto 15% $ ‐ $0.00
Taxi 5% $54.00 $2.70
Transit 20% $4.42 $0.88
Walk / AAF Shuttle / Other 25% $ ‐ $0.00
Total 100% $8.85
Source: LBG, 2014.
The utilization rate for each mode reflects both access and egress (e.g., using auto to access a station from home and walking to access the station at destination for the return trip home). Although these auto access shares and costs are reasonable for the station locations and service planned, actual access
18 Assumed mode shares for station access for Short Distance travelers is based on data for “urban neighborhood stations with
parking” and “medium density urban commuter rail stations” as presented in Transit Cooperative Research Report 153: Guidelines for Providing Access to Public Transportation Stations, 2012. Mode splits are also similar to system wide Tri‐Rail survey findings for 2008: 32% park and ride; 22% drop‐off; 2% Taxi; 16% bus and metrorail; 28% other (including walk/bike and Tri‐Rail shuttle) – Tri‐Rail Parking and Circulation Study, SFRTA, 2008.
Case 1:15-cv-00632-CRC Document 21-2 Filed 05/28/15 Page 120 of 154
All Aboard Florida Ridership and Revenue Study
May 7, 2015
Page 104
mode shares and costs could vary from the assumptions outlined here. To determine the effect of this uncertainty we include an examination of the sensitivity of forecast findings to increases or decreases in access/egress costs in Section 6.8. It should be noted that the AAF project development team has planned shuttle service to connect station locations with key activity centers. In the forecast, we assume no charge for shuttle service. A sensitivity test for shuttle add‐on fare is presented in Section 6.8. Plans for AAF shuttle service in the initial operating segment are as follows:
Miami AAF station to Miami Beach (shuttle meets each arriving train)
Miami AAF station to Key West (2 shuttle per day)
Fort Lauderdale AAF station to Fort Lauderdale Airport (shuttle meets each arriving train)
Orlando AAF station shuttle to Convention Center area (shuttle meets each arriving train)
The location of the AAF stations offers good opportunities for connection to local transit services. Key service connection opportunities are as follows.
Orlando AAF Station – FDOT is moving forward with Phase 3 of the Sunrail project which would extend service to the Orlando Airport South Terminal Intermodal Center and AAF station. The Intermodal Terminal would include connections to local bus service, the Airport automated people mover and, and taxis.
West Palm Beach AAF Station – Close proximity to PalmTran bus routes 1 (Gardens Mall to Boca Raton via Route 1) and 41 (Tri‐Rail Intermodal and Palm Beach Inlet via Ocean Blvd.)
Fort Lauderdale AAF Station – Close proximity to Broward Central Terminal which serves as a hub to over 15 Broward County bus lines providing direct or connecting access to most bus service in the county.
Miami AAF Station – Close proximity to Overtown/Lyric Theater Station (Metrorail); the Wilkie D. Furgurson, Jr. Station (Metromover); and bus routes 107, 108, 595M and local routes 2, 6, and 7.
5.4 ModelCalibration The coefficients in Tables 5.1‐4 and 5.1‐6 represent the statistical estimates of mode choice behavior recorded from the SP survey, but still require calibration to observed mode‐choice behavior before they can be used to predict expected AAF ridership. The trip attribute data for each individual mode described in Section 5.3 was applied to the mode choice model’s level‐of‐service variable coefficients (e.g in‐vehicle travel time, access/egress travel time, total trip costs etc.) for the 2016 base year and the resulting mode splits were compared against expected estimates based on current observed mode choice behavior. In keeping with best practice in mode choice forecasting, adjustments were made to the Alternative Specific Constants (referred to commonly as ASC or mode constants) of existing modes of travel (Auto, Rail, Bus, and Air) in order to align the predicted and observed mode shares—calibrating the model. The ASCs reflect a preference for a mode of travel not explained by the other level‐of‐service variables
Case 1:15-cv-00632-CRC Document 21-2 Filed 05/28/15 Page 121 of 154

All Aboard Florida Ridership and Revenue Study
May 7, 2015
Page 105
in the forecast such a IVTT, OVTT, service frequency, and cost. No adjustments were made to the coefficients for these variables during calibration. Once the predicted and observed mode shares were achieved for existing modes of travel by calibrating the ASC portion of the mode choice model for existing modes, the study team also found it necessary to make an adjustment to the ASC for AAF in the models. The decision to adjust AAF mode constants was made for two primary reasons: to ensure a reasonable ordinal ranking of mode constant preferences across all modes available (i.e., maintain the preference for AAF expressed in the survey relative to the existing modes); and also to ensure reasonable rates of AAF market capture based on examination of other similar intercity travel systems and markets in the United States as described in Section 5.4.2, below. A review of the literature on calibration reveals varying treatments for the adjustment of mode constants for future but currently non‐existent modes – including benchmarking to comparable modes
and making no change at all.19
5.4.1 LongDistanceModelCalibration
Forecasts for new rail service in the U.S. and abroad often seek to benchmark the rail service against air travel given the amenities, similarities in access/egress attributes, and overall travel time (factoring in the security and terminal wait time of modern air travel). When making adjustments to the AAF mode constant during the calibration process, the study team took special care to use the ASC for Air as a benchmark to ensure that the preference for AAF relative to air travel that was observed in the responses to the SP survey was preserved through the calibration process. During calibration, the magnitude of the AAF mode constant adjustment in the non‐business mode choice model was made in direct proportion to the calibration adjustment for the Air ASC. For business travel mode constant adjustment for business travel was set at approximately 60 percent the adjustment applied to calibrate business market air travel volumes, so as to maintain the relationship with the other modes of travel. Both of these ASC adjustments maintained the relationships observed in the SP survey: namely that all else equal, the respondents indicated a preference for AAF service over air travel in this corridor. Overall, the calibration process resulted in a small increase in the preference for auto travel relative to the other modes, and decreases in the preference existing public modes: Air, Bus, and existing Rail. By benchmarking the adjustment in AAF mode constant to that for existing air travel, a comparable premium travel mode, the overall preference for auto versus public modes in the mode choice model is preserved. This maintains consistency with the findings of the survey, which indicates that although AAF will be an attractive choice for many travelers, and a complementary addition to the air travel option, automobiles will continue to be the predominant mode for long distance intercity travel into the future.
5.4.2 ShortDistanceModelCalibration
As indicated in the introduction to this section, there are a range of approaches in forecasting practice with respect to calibration of the ASC for a new mode of travel. In the forecast for AAF, LBG found it necessary to lower the preference bias for AAF (making it somewhat less preferred when compared to existing modes such as auto) to preserve the relative position of AAF with respect to existing modes of travel after the ASCs for those modes were adjusted to calibrate to observed mode choice. In contrast to the calibration approach applied for the long distance market, the premium service features of AAF in the short distance travel market (Miami to West Palm Beach) have no similar comparable competing
19 D. A. Hensher, J. M. Rose, W. H. Greene, Applied Choice Analysis, Cambridge University Press, 2005
Case 1:15-cv-00632-CRC Document 21-2 Filed 05/28/15 Page 122 of 154

All Aboard Florida Ridership and Revenue Study
May 7, 2015
Page 106
mode of travel to benchmark against. To ensure the resulting AAF mode constants were in line with a benchmark for a known travel mode, LBG evaluated the share of AAF usage resulting from the AAF calibration adjustment against comparable levels of market capture for rail service in the United States such as estimates of Amtrak’s market share in the shorter distance segments of the Northeast Corridor (Baltimore‐Washington, Philadelphia‐Wilmington, Wilmington‐Baltimore).20
Similar to the long distance market, the ASC calibration adjustments result in an increase in the preference for auto travel relative to other existing modes, when compared to levels derived from the survey. In the Short Distance market, the calibration procedure indicates that the auto mode of travel is still preferable to AAF for many travelers, all other factors being equal.
20 Amtrak, Summary of Amtrak Travel Demand Forecasting Models, April 2010.
Case 1:15-cv-00632-CRC Document 21-2 Filed 05/28/15 Page 123 of 154

All Aboard Florida Ridership and Revenue Study
May 7, 2015
Page 107
6.0 RidershipandRevenueForecastFindings
The significant time savings, frequent service, and reliability that AAF provides have substantial potential to generate ridership and fare revenue. To determine the overall level of this potential, the study team prepared annual Base Case forecasts for future operations with a focus on three time periods: 2017, the first year of revenue service; 2020, the first stabilized year after ramp‐up; and 2030, the forecast horizon year. This section presents the results of these forecasts with reporting on market share, source of AAF ridership, segment loading and other performance metrics. Forecast results are benchmarked to previous study efforts where possible, and the findings of the revenue optimization and forecast sensitivity analysis are also presented.
6.1 OverallLevelofRidershipandRevenue The mode choice modeling tool and network information described in Section 5, allow the study team to compare the travel time, access, and cost attributes of competing modes of travel against the origin and destination patterns of travelers. Responses to the stated preference survey indicate travelers’ willingness to pay for travel time savings and their overall preference for mode of travel. This information formed the basis for a mode choice model which was calibrated to existing patterns of travel behavior without AAF. Further analysis of the survey data allowed us to account for AAF as a new mode of travel and recognize the premium level of service it will provide relative to the existing modes. Given the known attributes of the existing modes serving the corridor, the size of the overall travel market, and the attributes of service to be offered by AAF, the study team used the mode choice model to estimate the proportion of travelers that will choose AAF for trips between Southeast Florida and Orlando, as well as for trips within Southeast Florida. The forecast also includes an estimate of the extent to which AAF will generate new travel demand based on the new level of connectivity it provides and the marketing efforts to be conducted by the operators. Figure 6.1‐1 displays the forecast ridership results, in aggregate annual values, for AAF service. Riders represent passengers making a one‐way trip on AAF, with a round trip generating two riders. In 2020, the number of riders on AAF is expected to total approximately 5.35 million. This volume of riders, about 14,650 per day, includes riders who now travel by other modes, but would find AAF more desirable than auto, rail, and bus services now connecting the cities. As travel demand in the corridor grows, LBG projects that ridership will grow to over 7.07 million riders in 2030. Due to the various components of the ridership forecast, the overall growth in the number of riders on AAF is expected to average 2.8 percent per year, ahead of the growth in population and employment within Southeast Florida and Central Florida, but slower than the anticipated growth in airline and turnpike trips between the two regions.
Case 1:15-cv-00632-CRC Document 21-2 Filed 05/28/15 Page 124 of 154

All Aboard Florida Ridership and Revenue Study
May 7, 2015
Page 108
Figure 6.1‐1: AAF Annual Ridership Forecast – Base Case
Source: LBG, 2012.
Fares applied in the ridership revenue calculation are distinguished by station origin and destination pair and market segment (business and non‐business). Depending upon the destination, this distance‐based fare assumption yields ticket prices ranging between $65 and $145 (2012 dollars) for long distance trips between Central and Southeast Florida; and prices ranging between $18 and $33 for short distance trips within Southeast Florida. The fare assumptions and the revenue optimization analysis on which they are based, are outlined later in this section. AAF operations can be expected to generate total farebox revenues just over $293 million (in 2012 dollars) in the years following the ramp‐up period as indicated in Figure 6.1‐2. Figure 6.1‐2: AAF Annual Revenue Forecast – Base Case
Source: LBG, 2012.
Case 1:15-cv-00632-CRC Document 21-2 Filed 05/28/15 Page 125 of 154

All Aboard Florida Ridership and Revenue Study
May 7, 2015
Page 109
6.1.1 Ramp‐Up
As shown in the forecast charts presented above, we expect ridership and revenue for the initial years of AAF to start at relatively low levels and grow to a stabilized volume after three years. This reflects LBG’s “ramp‐up” assumption, a period of time during which ridership is building up to long‐term forecast levels as travelers become acquainted with the new rail service and adjust their trip‐making habits. There are no set standards for ramp‐up assumptions in passenger rail forecasting and few direct comparables in the U.S. to the AAF service. However, the Acela and the Euro Star, both comparable systems to AAF, experienced higher adoption levels in their first three years of operation than the ramp‐up assumed for AAF, as shown in Table 6.1.3 below. The Euro Star was slightly below the ramp‐up assumption for AAF in its second year, at 53%. Table 6.1‐1: Ramp‐up Comparisons
Ramp‐up Period Eurostar Amtrak Acela AAF
Year 1 32% 52% 30%
Year 2 53% 72% 60%
Year3 88% 92% 80% Source: Global Mass Transit Research, Eurostar: Restructuring, expansion and rolling stock procurement, December 1, 2014; Amtrak Annual Reports and Consolidated Financial Statements, FY 2000‐2012. LBG has assumed a three year ramp‐up period for overall service: the first year of revenue service at 30 percent of forecasted volumes, second year at 60 percent, and third year at 80 percent of the forecast. The forecasts include the assumption that Short Distance rail service will not be fully operational until the second quarter of 2017 (first year of revenue service), and Long Distance revenue service will begin during the fourth quarter of 2017. This assumption is comparable to previous rail service forecasts which show a 2 to 3 year ramp up period. FOX Florida High Speed Rail Ridership study (1998), for example assumed a three‐year ramp‐up at 40 percent, 60 percent, and 90 percent. The Florida High Speed Rail Authority Orlando‐Miami Planning Study (2002) assumed a two year ramp‐up at 50 percent and 75 percent of forecasted volumes.
6.1.2 MethodologicalOverview
As indicated in the introduction to this section, the ridership and revenue forecasts are based on a combination of state‐of‐the‐practice mode choice modeling techniques to evaluate how the introduction of AAF service will influence the travel choices in the market, along with additional estimation techniques to identify and enumerate new sources of ridership and expansion of the travel market made possible by the introduction of AAF service. The mode choice tool and network information described in Section 5, allow the study team to develop a head‐to‐head comparison of AAF with existing modes of travel based on travel time, access, cost a of each mode and the origin and destination patterns of travelers. Given the location and preference of travelers, the forecast estimates AAF’s capture of the overall travel market, which is a key element of overall ridership and revenue potential. With its focus on current travel market patterns and attributes, the network model framework, by design, does not account for an overall increase in the number, frequency, and purpose of trips that could be made in the future. This increased level of travel would be based on the improvement in connectivity that AAF offers visitors, special event attendees, and others who may travel more often
Case 1:15-cv-00632-CRC Document 21-2 Filed 05/28/15 Page 126 of 154

All Aboard Florida Ridership and Revenue Study
May 7, 2015
Page 110
given the new access and convenience that AAF provides. It is also related to the strategic marketing plans of the AAF Management Team to secure arrangements with various regional travel arrangers, providers, and businesses. The study team therefore also conducted additional analysis of potential AAF ridership based on a combination of special event ridership assessments, and the anticipated impacts of AAF arrangements with potential future business partners and aggressive marketing strategies. The ridership results presented were developed through three distinct analysis phases:
Identifying revenue optimizing fare levels for proposed service using the mode choice/network
model framework – including adjustments to the model parameters to calibrate to known
traveler behavior and account for AAF premium service features not reflected in the SP survey
Evaluating the travel demand market in the Central to Southeast Florida market using the
network model and subsequently generating estimates of future ridership by applying revenue
optimized fare levels
Developing separate estimates of alternative ridership and revenue sources based on special
events and potential business partnering agreements initiated by the AAF Management Team.
Subsequent subsections of this report will address each of these distinct elements as well as other relevant details regarding the forecasts presented.
6.2 FareRevenueEstimationandOptimization The identification of appropriate AAF service fares for each of the six city pairs contained within Central to Southeast Florida travel market was conducted in two phases. The first phase evaluated anticipated passenger sensitivity to price, while the second phase accounted for the pricing effect of AAF’s premium service features.
6.2.1 FareSensitivityAnalysis
Consideration of the elasticity of travel demand to fare price is an important element of a thorough ridership and revenue evaluation. To examine opportunities to properly balance fare price, ridership demand, and revenue generation, LBG conducted several ridership forecast simulations, varying the per‐mile fare price in $0.05 increments from $0.10 per mile through $0.75 per mile. The price response for ridership and revenue is discussed below for long distance travel between Southeast Florida and Central Florida. The price‐revenue response curves are displayed on the graphs in Figures 6.2‐1 and 6.2‐2 that distinguish optimized fare levels by both travel distance and trip purpose.
Business Travelers – The optimized fare for business travel in the long distance travel market is $0.55 per mile. An increase from $0.40 to $0.43 (a 6 percent increase) yields a 4 percent decline in ridership for an elasticity response of ‐0.69. An increase from $0.45 to $0.48 yields an elasticity response of ‐0.79. These point elasticities are comparable to the elasticity reported by Amtrak for Acela Business Class (‐0.65) and Regional Business Class (‐0.60) in the Northeast
Case 1:15-cv-00632-CRC Document 21-2 Filed 05/28/15 Page 127 of 154

All Aboard Florida Ridership and Revenue Study
May 7, 2015
Page 111
Corridor21. Figure 6.2‐1 displays the ridership and revenue response for the business segment in the long distance travel market.
Non‐Business Travelers – The optimized fare for leisure travelers in the long distance travel market is $0.35 per mile. An increase from $0.25 to $0.28 yields an elasticity response of ‐0.71; from $0.30 to $0.33 is ‐0.86. As would be expected, potential AAF non‐business travelers are more sensitive to price than travelers on business. This price response is similar to that reported for Amtrak Coach Class (Northeast Regional) which the railroad indicates is ‐0.85. Figure 6.2‐1 displays the ridership and revenue response for the non‐business segment in the long distance travel market.
Figure 6.2‐1: Revenue Optimization Evaluation, Long Distance Market, 2017 Base Year (2012 $)
Source: LBG, 2012.
Business Travelers – The optimized fare for business travel in the short distance travel market is between $0.30 and $0.35 per mile. An increase from $0.25 to $0.28 (a 9 percent increase) yields a 6 percent decline in ridership for an elasticity response of ‐0.65. An increase from $0.30 to $0.35 yields an elasticity response of ‐0.78. These point elasticities are also comparable to the elasticity reported by Amtrak for Acela Business Class (‐0.65) and Regional Business Class (‐0.60) in the Northeast Corridor. Figure 6.2‐2 displays the ridership and revenue response for the business segment in the short distance travel market.
21 Amtrak, Ridership Forecast Assumptions, 2010.
Case 1:15-cv-00632-CRC Document 21-2 Filed 05/28/15 Page 128 of 154

All Aboard Florida Ridership and Revenue Study
May 7, 2015
Page 112
Non Business Travelers – The optimized fare for leisure travelers in the short distance is between $0.25 and $0.30 per mile. An increase from $0.25 to $0.28 yields an elasticity response of ‐0.76; from $0.30 to $0.33 is ‐0.95. As would be expected, potential AAF non‐business travelers are more sensitive to price than travelers on business. This price response is similar to that reported for Amtrak Coach Class (Northeast Regional) which the railroad indicates is ‐0.85. Figure 6.2‐2 displays the ridership and revenue response for the non‐business segment in the short distance travel market.
Figure 6.2‐2: Revenue Optimization Evaluation, Short Distance Market, 2017 Base Year (2012 $)
Source: LBG, 2012.
As would be expected in a shorter distance market where travel by auto is more competitive and Tri‐Rail also offers price competitive (if not time competitive) service, optimal fares are lower and travelers are more sensitive to price overall.
The fare sensitivity evaluation establishes the balance between fares and ridership that optimizes revenue with a distance‐based fare. We also conducted an evaluation of fare adjustments by city‐pair (e.g. to/from Miami‐Fort Lauderdale) to evaluate the effect of fare policy on ridership on shorter and longer distance links. This is of particular importance in the initial operating segment, where the AAF operator may seek to balance ridership between station pairs by placing a higher fare on shorter distance city pairs and lower fare on the longer segment. In this way vehicle and station loadings can be more balanced and emphasis can be placed on serving longer distance travelers. Table 6.2‐1 displays the evaluation. The fare assumptions for the Market Segment are set on a per‐mile basis for business and non‐business travelers as outlined above. The City‐Pair optimization sets fares at levels that will promote longer distance travel.
Case 1:15-cv-00632-CRC Document 21-2 Filed 05/28/15 Page 129 of 154

All Aboard Florida Ridership and Revenue Study
May 7, 2015
Page 113
The evaluation shows that overall revenues can be increased by nearly $2 million, with ridership decreasing by 1,300 per day, by implementing higher prices on the shortest segments and apply a slight discount to the Miami to West Palm Beach trip. This results in a more balanced distribution of trips between stations and optimizes revenue overall, as follows.
Distribution with per‐mile pricing: Miami – West Palm Beach: 30%; Fort Lauderdale – West
Palm Beach: 32%; Miami to Fort Lauderdale: 37%
Distribution with city‐pair pricing: Miami – West Palm Beach: 38%; Fort Lauderdale – West
Palm Beach: 32%; Miami to Fort Lauderdale: 29%
Given the more favorable distribution these are the City Pair Pricing is utilized in the Base Case forecast.
Table 6.2‐1 Fare Optimization Assumptions (2017 Base Year, 2012 $)
The fare optimization evaluation provides an indication of the flexibility of the operator increase farebox revenue. At the assumed fare levels there is some additional flexibility to raise overall fares by 10 to 20 percent, especially on the Miami to West Palm Beach segment, without producing a substantial decline in revenue. Beyond those levels, percentage declines in ridership will outpace percentage increases in revenue.
6.2.2 PremiumServiceAmenityPricing
The fare sensitivity evaluation establishes the balance between fares and ridership that optimizes revenue with a distance‐based fare. These optimized fare levels for both the long and short distance travel markets, however, do not account for the potential of impact AAF premium service amenities on the willingness‐to‐pay. The hypothetical choice tasks that SP survey respondents participated in for the AAF study, purposely did not include detailed descriptions of the proposed AAF service amenities such as spacious seating, Wi‐Fi, dining services, etc. These types of details are typically excluded from SP survey designs so as to minimize potential biased responses. Studies however show that premium service features are
Business Non‐Business Business Non‐Business
Miami ‐ Fort Lauderdale $8.25 $6.25 $15.00 $11.00
Fort Lauderdale ‐ West Palm Beach $14.00 $10.50 $18.00 $14.00
Miami ‐ West Palm Beach $22.00 $17.00 $21.00 $16.00
Total Ridership (2016 ‐ w/o Ramp‐up)
Total Revenue (2016 ‐ w/o Ramp‐up)
Per‐Mile Pricing
(Optimized by Market Segment)
City‐Pair Pricing
(Optimized by City‐Pair
and Market Segment)
6,400 5,100
$ 27.5 million $ 29.3 million
Case 1:15-cv-00632-CRC Document 21-2 Filed 05/28/15 Page 130 of 154

All Aboard Florida Ridership and Revenue Study
May 7, 2015
Page 114
important determinants of mode choice and should be accounted for in travel demand modeling.22 Based on these findings, and the responses received on other survey questions posed after the hypothetical choice experiments, the LBG Team sought to ‘price in’ the incremental willingness‐to‐pay for premium service into the model framework. These literature review findings on the willingness‐to‐pay for premium features are also consistent with respondent feedback from the AAF SP survey regarding pricing and amenities. A section of LBG’s survey (following the series of hypothetical choice experiment questions) provided a more detailed description of the future AAF service including amenities. The results of an open‐ended question regarding willingness‐to‐pay for amenities found that approximately half of the potential AAF travelers would be willing to pay a premium (ranging between 36 percent and 122 percent) for additional comfort and safety features proposed for the future AAF service. Caution however, should always be exercised in making inferences from this type of direct solicitation of willingness‐to‐pay – especially given policy response biases that are often encountered when respondents do not take all choice considerations into account when presented with such scenarios. In the case of the long distance travel market, previous high speed rail feasibility studies for proposed service in the Texas Triangle (Dallas‐Houston‐San Antonio) found that quality of service (QoS) amenities such as more luggage space and spacious seating can positively increase mode constant (ASC) measure of preference by 20‐30 percent of the value of time.23 Given the wider array anticipated service amenities on the AAF, the study team increased AAF mode constants by 40 percent of the respective business and non‐business values of time. This mode constant adjustment still maintains the conservative calibration adjustment discussed in Section 5.4 – i.e. the non‐business AAF calibration is then 92 percent (100 percent previously) of the negative air calibration adjustment, while the business AAF calibration is then equal to 55 percent (60 percent previously). Both the initial optimized fare assumption and the subsequent premium service optimization are presented in Table 6.2‐2. Table 6.2‐2 Fare Optimization Assumptions, Long Distance Travel Market (SEF to Central Florida – 2012 $)
Assumed Business Travel Fare Assumed Non‐Business Travel Fare
Station Pairs Initial $/Mile Optimized $/Mile Initial $/Mile Optimized $/Mile
Miami / Orlando $130.00 $0.55 $143.46 $0.61 $85.00 $0.35 $93.80 $0.40
Fort Lauderdale / Orlando $115.00 $0.54 $126.91 $0.60 $75.00 $0.35 $82.76 $0.39
West Palm Beach / Orlando $90.00 $0.55 $99.32 $0.60 $60.00 $0.35 $66.21 $0.40
Source: LBG, 2012.
In comparison to other fares from Amtrak’s Northeast Corridor, the premium service optimized AAF per mile rates for the long distance market are noticeably lower than comparable Amtrak fares for similar travel distances. Figure 6.2‐3 plots both the AAF Business and Non‐Business per mile fares against and shows that the AAF fares for business travel lie close to the Amtrak Regional Service fares over comparable distances, and are far lower than the fares observed on Amtrak Acela service that offers amenities that more closely correspond to the premium service features envisioned for AAF service.
22 Transit Cooperative Research Program (TCRP) Report 166
23 Charles River Associates (CRA), Independent Ridership and Passenger Revenue Projections for the Texas TGV Corporation High Speed Rail System in Texas, 1993
Case 1:15-cv-00632-CRC Document 21-2 Filed 05/28/15 Page 131 of 154

All Aboard Florida Ridership and Revenue Study
May 7, 2015
Page 115
Figure 6.2‐3: Comparison: AAF Long Distance Fares to Amtrak Northeast Corridor Fare Rates
For the short distance travel market that pits AAF service against other short distance transit alternatives, LBG assessed the premium service features based on guidelines provided by the Transit Research Cooperative Program (TCRP). TCRP research shows that quality of service (QoS) amenities such as station security and amenities, seat availability, productivity features (WiFi), etc., can positively increase mode constant (ASC) measure of preference by a value equivalent to 13‐29 minutes of in‐vehicle travel time.24 Similar to the long distance scenario, the wider array anticipated service amenities on the AAF prompted the study team to increase AAF mode constants by between 35 and 40 minutes of in‐vehicle travel time. This mode constant adjustment still maintains the conservative calibration adjustment discussed in Section 5.4. Both the initial optimized fare assumption and the subsequent premium service optimization are presented in Table 6.2‐3.
In comparison to other fares from Amtrak’s Northeast Corridor, the AAF per mile rates for the short distance travel market are noticeably lower than comparable Amtrak fares for similar travel distances. Figure 6.2‐4 plots both the AAF Business and Non‐Business per mile fares against a set of Amtrak fares in the Northeast Corridor. This figure shows that the AAF fares for business travel lie close to the Amtrak Regional Service fares over comparable distances, and are far lower than the fares observed on Amtrak Acela service that offers amenities that more closely correspond to the premium service features envisioned for AAF service.
24 Transit Cooperative Research Program (TCRP) Report 166
WPB ‐ Orlan
do
Ft. Lau
derdale ‐ Orlan
do
Miami ‐ Orlan
do
Case 1:15-cv-00632-CRC Document 21-2 Filed 05/28/15 Page 132 of 154
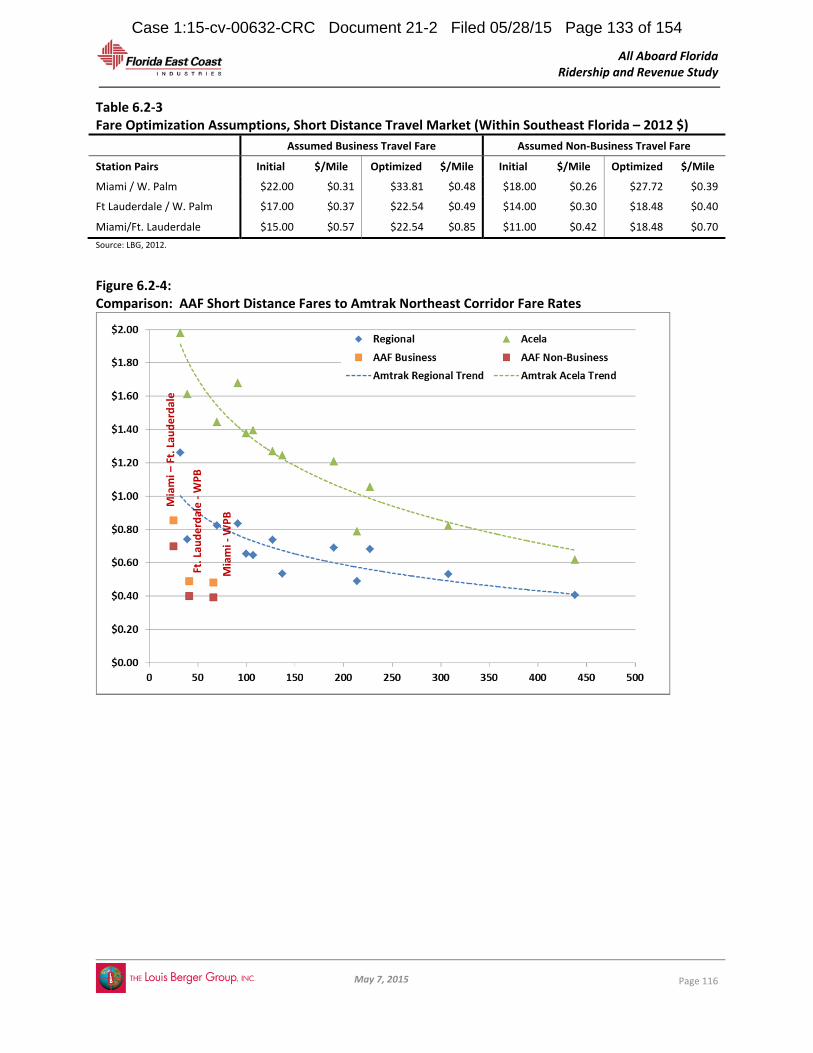
All Aboard Florida Ridership and Revenue Study
May 7, 2015
Page 116
Table 6.2‐3 Fare Optimization Assumptions, Short Distance Travel Market (Within Southeast Florida – 2012 $)
Assumed Business Travel Fare Assumed Non‐Business Travel Fare
Station Pairs Initial $/Mile Optimized $/Mile Initial $/Mile Optimized $/Mile
Miami / W. Palm $22.00 $0.31 $33.81 $0.48 $18.00 $0.26 $27.72 $0.39
Ft Lauderdale / W. Palm $17.00 $0.37 $22.54 $0.49 $14.00 $0.30 $18.48 $0.40
Miami/Ft. Lauderdale $15.00 $0.57 $22.54 $0.85 $11.00 $0.42 $18.48 $0.70
Source: LBG, 2012.
Figure 6.2‐4: Comparison: AAF Short Distance Fares to Amtrak Northeast Corridor Fare Rates
Miami – Ft. Lau
derdale
Ft. Lau
derdale ‐ W
PB
Miami ‐ W
PB
Case 1:15-cv-00632-CRC Document 21-2 Filed 05/28/15 Page 133 of 154
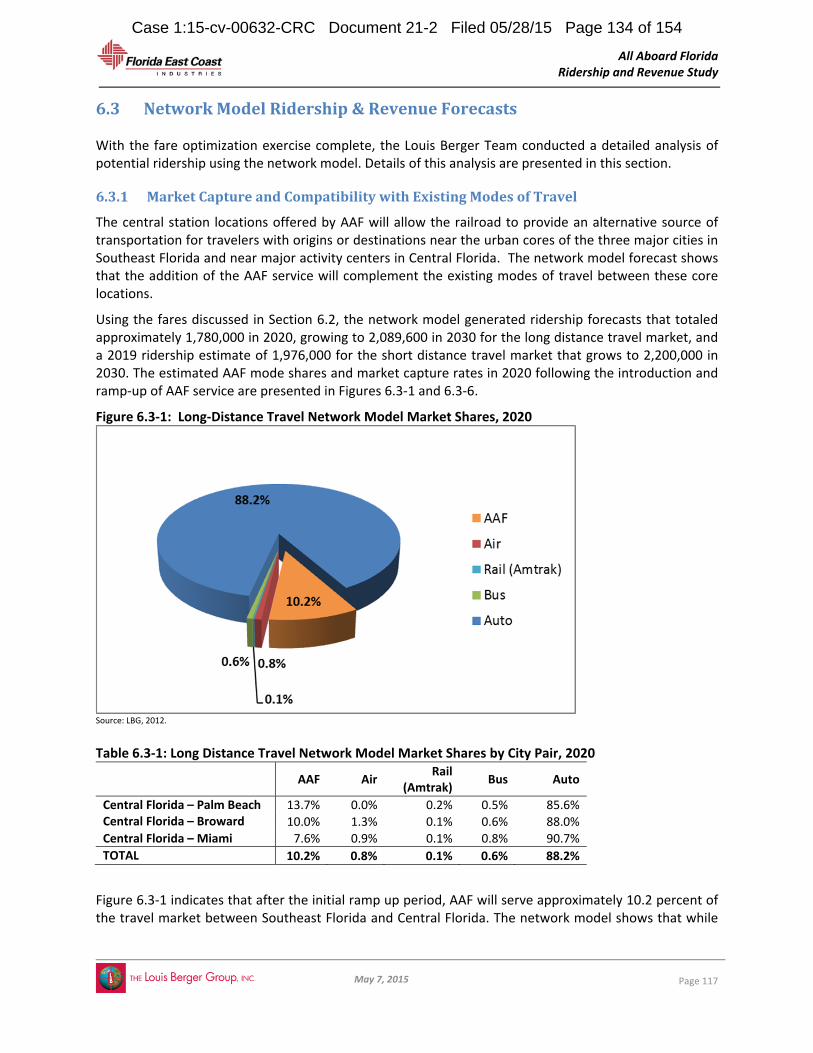
All Aboard Florida Ridership and Revenue Study
May 7, 2015
Page 117
6.3 NetworkModelRidership&RevenueForecasts With the fare optimization exercise complete, the Louis Berger Team conducted a detailed analysis of potential ridership using the network model. Details of this analysis are presented in this section.
6.3.1 MarketCaptureandCompatibilitywithExistingModesofTravel
The central station locations offered by AAF will allow the railroad to provide an alternative source of transportation for travelers with origins or destinations near the urban cores of the three major cities in Southeast Florida and near major activity centers in Central Florida. The network model forecast shows that the addition of the AAF service will complement the existing modes of travel between these core locations.
Using the fares discussed in Section 6.2, the network model generated ridership forecasts that totaled approximately 1,780,000 in 2020, growing to 2,089,600 in 2030 for the long distance travel market, and a 2019 ridership estimate of 1,976,000 for the short distance travel market that grows to 2,200,000 in 2030. The estimated AAF mode shares and market capture rates in 2020 following the introduction and ramp‐up of AAF service are presented in Figures 6.3‐1 and 6.3‐6.
Figure 6.3‐1: Long‐Distance Travel Network Model Market Shares, 2020
Source: LBG, 2012. Table 6.3‐1: Long Distance Travel Network Model Market Shares by City Pair, 2020
AAF Air Rail
(Amtrak) Bus Auto
Central Florida – Palm Beach 13.7% 0.0% 0.2% 0.5% 85.6% Central Florida – Broward 10.0% 1.3% 0.1% 0.6% 88.0%
Central Florida – Miami 7.6% 0.9% 0.1% 0.8% 90.7%
TOTAL 10.2% 0.8% 0.1% 0.6% 88.2%
Figure 6.3‐1 indicates that after the initial ramp up period, AAF will serve approximately 10.2 percent of the travel market between Southeast Florida and Central Florida. The network model shows that while
Case 1:15-cv-00632-CRC Document 21-2 Filed 05/28/15 Page 134 of 154

All Aboard Florida Ridership and Revenue Study
May 7, 2015
Page 118
auto travel along the turnpike and I‐95 will be the predominant mode used by many travelers given their origin and destinations, preferences, or need for a vehicle en route or at their destination, AAF will provide a convenient and attractive alternative for a key segment of the market.
AAF service will provide a particularly vital addition to the public modes of travel (air, bus, and rail) which currently do not offer the frequency or capacity that AAF will provide. Before the introduction of AAF service the public modes of travel accounted for less than 3.4 percent of the overall travel market between Southeast Florida and Central Florida, with auto travel accounting for the remaining 96.6 percent. After AAF achieves its stabilized ridership pattern, the public share of the market is expected to rise to 11.8 percent, reducing the auto share to 88.2 percent.
AAF is expected to attract between 52 percent and 63 percent of users currently traveling by air, rail, or bus (see Figure 6.3.3). When added together, travelers drawn from public modes of travel will account for 19.5 percent of AAF ridership (8.3 percent Air, 2.3 percent existing rail, and 8.9 percent bus, see Figure 6.3‐2). AAF will attract about 6 percent of travelers who would otherwise have used private autos. These former auto users are expected to make up 60 percent of total AAF long distance ridership.
As shown in Figure 6.3‐2, AAF service linking Southeast Florida and Central Florida will draw most of its ridership from travelers that would have otherwise used a private auto or existing public modes of travel for their trip. New trips, prompted by the convenience and travel time savings that AAF will introduce to the market will make up 20.6 percent of total AAF ridership after ramp‐up. The sources and characteristics of induced travel are described in more detail in Section 6.8.
Figure 6.3‐2: Share of AAF Ridership by Source (Long Distance)
Source: LBG, 2012. Figure 6.3‐4 indicates AAF will again contribute to the public modes of travel (bus and rail service currently provided by Tri‐Rail). After the initial ramp up period, AAF will serve approximately 1.2 percent of the travel market within Southeast Florida – bringing the total market share served by public transit to 2.1 percent. Table 6.3‐2 shows that AAF market share is anticipated to be highest for travel between Miami and West Palm Beach, approximately 3 percent, and lowest for Miami to Fort Lauderdale, where
Figure 6.3‐3: AAF Ridership Market Draw by Source (Long Distance)
Case 1:15-cv-00632-CRC Document 21-2 Filed 05/28/15 Page 135 of 154

All Aboard Florida Ridership and Revenue Study
May 7, 2015
Page 119
the short distances involved favor auto travel. Prior to the introduction of AAF service, public transit will comprise approximately one percent of the total travel market within Southeast Florida. The smaller AAF market share keeps in line with expectations of public transit market share over short distances.
Figures 6.3‐5 and 6.3‐6 shows that the largest proportion of AAF riders in the Short Distance travel market will be drawn from auto travelers. LBG anticipates that in 2020, 73 percent of AAF riders traveling between Miami, Fort Lauderdale, and West Palm Beach will be travelers who, without the AAF service, would have made their journey by car. Although auto is substantial source of AAF ridership, only 1 percent of overall auto volume traveling between the three key cities in SEF is diverted to AAF. This is consistent with the limited number of station locations and the focus of AAF service on capturing city center to city center travel.
Figure 6.3‐4: Short‐Distance Travel Network Model Market Shares, 2020
Source: LBG, 2012. Table 6.3‐2: Short Distance Travel Network Model Market Shares by City Pair, 2020
AAF Rail
(Tri‐Rail) Bus Auto
Miami – Ft. Lauderdale 0.6% 0.4% 0.5% 98.5% Miami – Palm Beach 3.0% 0.9% 0.1% 95.9%
Ft. Lauderdale – Palm Beach 1.8% 0.5% 0.0% 97.7%
TOTAL 1.2% 0.5% 0.3% 97.9%
Case 1:15-cv-00632-CRC Document 21-2 Filed 05/28/15 Page 136 of 154

All Aboard Florida Ridership and Revenue Study
May 7, 2015
Page 120
Figure 6.3‐5: Share of AAF Ridership by Source (Short Distance)
Source: LBG, 2012. The proportion of riders on AAF drawn from bus services is expected to amount to approximately 17 percent. This represents a diversion of 38 percent of bus travel serving the centers of the three cities.
AAF service is expected to draw a minimal portion of its ridership from existing Tri‐Rail service. With Tri‐Rail serving numerous locations in Southeast Florida, most Tri‐Rail riders (80 percent in SFRTA surveys—see Section 3.5.3.2, above) have origins and destinations in locations that will not be served by AAF. Current Tri‐Rail riders are also likely to be captive to that particular service because of its low cost and monthly commuter pass offering, parking availability, and transit connections. AAF service will be marketed and priced for business and leisure travelers whose trip intercity trip is not part of a daily commute. To account for these factors, this forecast assumes no ridership from existing Tri‐Rail service.
6.3.2 AutoCaptivesRidershipAdjustment
Section 3.5.6 of this report briefly addressed the auto (en‐route) captive adjustments implied from an analysis of the survey data. Based on LBG’s analysis described in that section, the 12 percent trip table reduction implied by the survey data is counteracted by an offsetting 5 percent AAF ridership boost required to account for the effect of auto captive biases captured in the survey sample. The net 7 percent ridership adjustment was applied to the results of network model diversion model discussed in the preceding section.
6.3.3 AdditionalSensitivityTests
In addition to the fare sensitivity evaluation in Section 6.2, LBG conducted several additional simulations to determine the sensitivity of the network/mode choice model forecast outputs to changes in key input parameters. The findings of these tests are outlined below along with a discussion on the implications for validation of the forecast and for risk of forecast error.
6.3.3.1In‐VehicleTravelTime
Travelers will choose the AAF service, in part, because it offers time savings when compared to other modes of travel. The discrete choice analysis of the SP survey provides an indication of how business
Figure 6.3‐6: AAF Ridership Market Draw by Source (Short Distance)
Case 1:15-cv-00632-CRC Document 21-2 Filed 05/28/15 Page 137 of 154

All Aboard Florida Ridership and Revenue Study
May 7, 2015
Page 121
and non‐business travelers value the duration of the trip on board the train, referred to as in‐vehicle travel time (IVTT). In tests where the duration of the AAF trip between destinations was varied, we found that travelers are somewhat less sensitive to IVTT than they are to fare price, as follows.
In the long distance market Business travelers have an elasticity response to IVTT of ‐0.73 (with a range of ‐0.67 to ‐0.75 depending on the magnitude of the change in IVTT). In the short distance market Business travelers have a lower elasticity response to IVTT of ‐0.56 (with a range of ‐0.52 to ‐0.57 depending on the magnitude of the change in IVTT).
The elasticity response for Non‐Business travelers is lower than for Business, as would be expected: ‐0.68 (with a range of ‐0.63 to ‐0.70) for long distance; ‐0.50 (with a range of ‐0.47 to ‐0.51) for trips within SEF.
Overall, a decrease in AAF running time of 10 percent (i.e., a reduction of 20 minutes in the running time from Miami to Orlando) could be expected to result in an increase of just over 7 percent in ridership. Should the running time need to be increased from the levels assumed in this study, a similar magnitude of decrease in ridership could be expected. In the SEF market a similar decrease of 10 percent in run time (7 minutes) would result in a 5 percent increase in ridership.
6.3.3.2FrequencyofService
Travelers also place a value on the frequency of service, or headway. With intercity rail service, as opposed to intracity transit, travelers tend to time their arrivals to the station closely with scheduled departures and frequency of service is less important than running time or cost. Sensitivity tests for headway found this to be the case as follows.
Business travelers in the long distance market have a low sensitivity to changes in headway with an elasticity response of ‐.08 (range of ‐.07 to ‐.09). In the short‐distance market with the much shorter journey times, frequency of service is more important to travelers. Elasticities in this market are ‐0.27 (with a range of ‐0.25 to ‐0.29 depending on the magnitude of the change).
The elasticity response for Non‐Business travelers is somewhat lower in both markets, as would be expected: ‐0.07 (with a range of ‐0.70 to ‐0.085) for long distance; and‐0.24 (with a range of ‐0.22 to ‐0.26) for short distance.
An increase in the frequency of service by 20 percent (over the one departure per hour base assumption) would be expected to result in a 5.4 percent increase in ridership in the Miami to West Palm Beach short distance market, and a 1.4 percent increase for the longer distance city pairs.
6.3.3.3Access/EgressTravelTime
The time taken to access an AAF station for departure and to get from the AAF station on the other end of the trip to a final destination is also part of a traveler’s decision on choice of mode. In general, travelers place a higher value on this access‐egress time than they do on IVTT. Our sensitivity tests showed that both business and non‐business travelers are more sensitive to access‐egress time.
Business travelers in the long distance market have an elasticity response to access‐egress time of ‐0.54 (with a range of ‐0.50 to ‐0.55 depending on the magnitude of the change). With shorter journey times, travelers moving between stations in SEF are more sensitive to the time it takes to get to and from the stations with an elasticity of ‐0.69 (range: ‐0.64 to ‐0.71).
Case 1:15-cv-00632-CRC Document 21-2 Filed 05/28/15 Page 138 of 154

All Aboard Florida Ridership and Revenue Study
May 7, 2015
Page 122
The elasticity response for Non‐Business travelers is lower, as would be expected: ‐0.35 (range: ‐0.34 to ‐0.36) for long distance trips; and ‐0.67 (with a range of ‐0.62 to ‐0.69) for trips within SEF.
An increase in the amount of time to access an AAF station by 20 percent for long distance travel (due, for example, to congestion on local roadways) would be expected to result in an 8 percent decrease in ridership. For travelers making trips on AAF within Southeast Florida the impact would be greater: a 13 percent decrease in ridership.
6.3.3.4Access‐EgressCost
Our mode choice models assume that passengers also consider the cost of accessing or exiting an AAF station. We assume that they value this cost at the same rate as other costs such as fare or out‐of‐pocket vehicle operating costs. Because they represent a lower proportion of the overall cost of the trip, travelers are less sensitive to these costs than fare prices. As would be expected, long‐distance travelers are less sensitive to these costs because they represent a lower proportion of their overall journey cost.
Business travelers have an elasticity response to access‐egress cost of ‐0.09 for long distance intercity trips. For trips within SEF, the elasticity response is much higher ‐0.28 (with a range of ‐0.27 to ‐0.29 depending on the magnitude of the change).
The elasticity response for Non‐Business travelers is higher in both markets, as would be expected: ‐0.15 (range of ‐0.14 to 0.15) for travel from Southeast Florida to Central Florida; and ‐0.39 (with a range of ‐0.37 to ‐0.40).
For long distance intercity travel an increase in the cost of accessing an AAF station by 20 percent (attributable to an increase in gas prices or feeder transit fares) would be expected to result in a 2.5 percent decrease in ridership. Access cost is more important for short distance travelers and a similar increase in access cost would result in a 7 percent decrease in ridership.
6.3.3.5AutoIVTT
An increase in auto travel time as roadway congestion increases in the region would be expected to make the AAF service more competitive (a cross‐elasticity response). This effect is offset, however, by a corresponding change in the level of station access/egress time.
Long Distance Business travelers have a cross‐elasticity response to auto IVTT of 0.34 (with a range of 0.32 to 0.38 depending on the magnitude of the change). If only intercity auto travel were affected the cross‐elasticity response would be 0.83. In the short distance market the response is slightly higher at 0.39 (with a range of 0.38 to 0.44). If only intercity auto travel were affected the cross‐elasticity response would be 0.83 for both markets.
The cross‐elasticity response is slightly higher (at 0.45) in the long distance Non‐Business market attributable primarily to their lower sensitivity in station access time, resulting in less of an offsetting effect. If only intercity auto travel were affected the cross‐elasticity response would be lower for Non‐Business travel (0.79). The elasticity response for short distance Non‐Business travelers is lower, as would be expected: 0.09 (with a range of 0.085 to 0.10). If only intercity auto travel were affected the cross‐elasticity response would be 0.56.
Case 1:15-cv-00632-CRC Document 21-2 Filed 05/28/15 Page 139 of 154

All Aboard Florida Ridership and Revenue Study
May 7, 2015
Page 123
For long distance travel, an increase in auto travel time of 20 percent (attributable to an increase in intercity and intracity roadway congestion in the region) would be expected to result in an 8 percent increase in AAF ridership. For the short distance market where journey times are lower, the increase in AAF ridership would be 4 percent. If the increase in travel time were only to apply to intercity auto travel (in a scenario with heavy congestion on freeways but with little change in access times to stations via local roadways, for example), the increase in AAF ridership would be 16 percent in the long distance market and 12 percent for short distance riders.
6.3.3.6AutoFuelPrices
An increase in gas prices would also be expected to make the AAF service more competitive. This effect is offset, however, by a corresponding change in cost of accessing the stations (e.g. by private auto or taxi/bus transit where fuel costs are passed on in fare prices). It should be noted that this evaluation does not include a change in the cost of AAF fuel prices that would be passed on in higher fares.
Business travelers have a cross‐elasticity response to fuel prices that is similar in both markets: 0.12 for long distance and 0.14 for short distance travel.
The elasticity response for Non‐Business travelers is lower: 0.04 (with a range of 0.03 to 0.04). Although non‐business travelers would be expected to have a higher sensitivity to travel costs than business travelers, the lower response here is attributable to two factors: 1) we divide auto operating costs by the party size which is higher for non‐business travelers; 2) non‐business travelers have a lower propensity to choose transit (lower nesting coefficient).
An increase in fuel prices of 20 percent would be expected to result in a 1.4 percent increase in AAF ridership for both long and short distance markets. Should AAF fares also increase to pass on the cost of higher AAF fuel related operating costs there would likely be no net increase in ridership.
6.3.3.7AirFares
As with costs in the auto mode of travel, an increase in airline fares could also be expected to make the AAF service relatively more competitive for travel between Southeast Florida and Central Florida. This effect is expected to be small, however, given that air travel is a small part of the intercity travel market when compared to autos. Response of our sensitivity test is as follows.
Business travelers have a cross‐elasticity response to air fares of 0.075.
The elasticity response for Non‐Business travelers is higher as would be expected: 0.09.
An increase in air fares of 20 percent would be expected to result in a 1.7 percent increase in AAF ridership. Should air fares decrease by a similar magnitude, a decrease in AAF ridership of 2.6 percent would be expected.
6.3.3.8ParkingandShuttleFees
The forecast assumes that the per‐mile cost applied to access and egress incorporates the cost of parking at the stations (see discussion in Section 5.3.6.2). Our forecast does not assume any additional cost associated with use of the AAF provided shuttle services at the station. To test the impact of additional charges associated with this amenity we evaluated the effect of a shuttle charge of $2 per person. Findings of this sensitivity test indicated that for the long distance market, additional charges related to access and egress are a small portion of the overall travel cost and the effect on ridership is minimal. A $2.00 fee per person for a shuttle to or from an AAF station would result in a 3 percent
Case 1:15-cv-00632-CRC Document 21-2 Filed 05/28/15 Page 140 of 154

All Aboard Florida Ridership and Revenue Study
May 7, 2015
Page 124
reduction in ridership with less than 1 percent decline in revenue. For short distance trips between stations in Southeast Florida, the additional charge would constitute a larger proportion of the travel cost (and larger difference with respect to competing modes) and would have a more substantial impact on ridership. A $2.00 per person fee for shuttle service would result in a 15 percent decline in ridership and 1 percent decline in revenue.
6.3.4 RidershipForecastLevel‐of‐ServiceAssumptions
The network model was also used to assess the importance of two level‐of‐service assumptions that would be incorporated into the ridership forecast:
Alternative levels of highway congestion growth. Investment in new highway capacity is expected to be limited in the future due to financial and physical constraints resulting in increased congestion on the highway and arterial network between Central Florida and Southeast Florida that will likely result in a substantial net positive effect on AAF ridership.
Future connections to other transit service that would enhance AAF ridership. New and
proposed transit services in Orlando (SunRail) and Fort Lauderdale WAVE Street Car.
6.3.4.1HighwayCongestionGrowth
Investment in new highway capacity is expected to be limited in the future, due to financial and physical constraints, resulting in increased congestion on the highway and arterial network within and between Central Florida and Southeast Florida. An increase in travel time for autos and bus service would make AAF more attractive as a travel alternative. Although future congestion would also affect access to AAF stations by auto and bus, on balance it would be expected to result in a substantial net effect on AAF ridership. To estimate this effect, LBG evaluated the congested travel times on key network links as estimated in the regional travel demand forecast models for Central Florida (CFRPM) and Southeast Florida (SERPM). The team also evaluated Florida Turnpike volume in the future to estimate the potential for congestion during long distance travel. On average, travel times are expected to increase by 30 percent through 2030 over current 2010 conditions. Of particular relevance to long distance travel, although the Turnpike currently operates at free flow condition on segments between Central Florida and Southeast Florida with a volume to capacity‐ratio below 0.70, volumes are expected to increase to 2030 bringing the V/C ratio closer to 1.0 and resulting in lower average speeds. By adjusting zone to zone travel times as appropriate in the 2030 forecast year, we estimate the effect of increased congestion on AAF ridership and revenue to be as follows:
Assuming no congestion effects prior to 2020 due to the generally free flow conditions on long
distance travel, LBG estimates the effect of increased future congestion on AAF long distance
ridership and revenue to result in a 14.3 percent increase in AAF ridership and revenue for these
trips in 2030: corresponding to an addition of over 280,000 annual riders, and approximately
23.8 million in revenues.
For short distance trips within Southeast Florida the increase in travel time has less of an effect, amounting to a 4.3 percent change in 2030. Annual ridership would increase of approximately 90,000, and yielding an additional $2 million in revenue.
Case 1:15-cv-00632-CRC Document 21-2 Filed 05/28/15 Page 141 of 154

All Aboard Florida Ridership and Revenue Study
May 7, 2015
Page 125
6.3.4.2TransitConnectivityImpacts
There are several improvements to the transit network that are currently in planning or development by local and regional agencies that could work to enhance AAF ridership. In Fort Lauderdale, the route of the proposed WAVE Streetcar system would offer the possibility for a direct connection to the AAF station. The WAVE system was recently awarded a TIGER grant by FTA, allowing project development to proceed. This WAVE station would serve the Broward Intermodal Center and is anticipated to have daily boardings of over 1,300 passengers per day (Downtown Transit Circulator Project Alternatives Analysis /Environmental Assessment, 2012). The service would extend north to NW 6th Street and south to SE 17th Street along Andrews Avenue with a proposed extension to Fort Lauderdale Airport. The WAVE System is currently projected to be in service in 2017. In Orlando, the SunRail commuter rail project which opened in May 2014 and has already transitioned towards the second and third phases that would also offer the potential for a connection to the AAF station at MCO. The first phase would connect with key locations including downtown Orlando, Florida Hospital Health Village and Sanford. The second phase would extend the system south to Poinciana and north to DeLand. The timing of the SunRail link to Orlando airport is uncertain however press releases indicate that airport service could be operational in five to six years. Both these projects expand the catchment area for non‐motorized access for AAF, offering convenience and the potential for travel time savings and avoidance of congested roadways when traveling to or from AAF stations. Assuming both systems are operational by 2020, LBG estimates a 12 percent increase in the market capture for AAF long distance trips that equates to approximately 234,000 additional riders in 2030, and a corresponding increase of about 20 million dollars in revenue. The short distance AAF ridership would experience a 2 percent increase that amounts to 42,000 additional riders in 2030 and approximately one million dollars in revenue.
6.3.5 InducedRidership
Introduction of a new mode of travel, particularly premium rail service which is more convenient and improves travel time, can often encourage travelers to make trips they may not have made in the absence of the new service. Previous studies have found that the introduction of intercity rail service can result in levels of induced travel ranging from 5 percent to 30 percent.25 The highest levels of induced travel have been observed on high speed rail services serving multiple markets over distances of 200 to 500 miles.
With the full implementation of AAF from Miami to Orlando, LBG expects substantial opportunity for induced travel. The full service will result in a measurable reduction in the overall generalized time/cost of travel, and plans for AAF operation involve close coordination with resorts, cruise lines, airlines, and travel arrangers to expand the market for travel between Central and Southeast Florida.
LBG used the general cost of travel principle to estimate the change in travel impedances that result from the introduction of the AAF service between Miami and Orlando. Variants of the generalized cost
25 Chicago to St. Louis 220 mph High Speed Rail Alternative Corridor Study, Volume 2‐Ridership & Benefits, October 2009
Case 1:15-cv-00632-CRC Document 21-2 Filed 05/28/15 Page 142 of 154
All Aboard Florida Ridership and Revenue Study
May 7, 2015
Page 126
approach are often used for induced travel estimates including a recent study of proposed high‐speed rail conducted for the State of California.
Assuming the total number of trips (T) generated between a given O‐D pair is a function of both socioeconomic/demographic factors (SED), as well as a measure of travel impedance – characterized by the generalized cost or utility of travel (U), as shown in the equation 2:
T = SED * Ucomp (1)
Where: SED = the socioeconomic/demographic factors characterizing both the origin and destination Ucomp = generalized utility of travel between the origin and destination And:
Ucomp = LN(expUauto + expUair + expUrail + expUbus + …) (2)
Induced Trips = Total Trips with AAF (TA) – Total Trips before AAF (TB) (3)
This induced trip methodology generates an incremental change in trip volumes that applies to all modes available. Based on equation 1, the total travel before and after AAF introduction are estimated as follows:
TB = SED * UcompB TA = SED * UcompA
Holding the SED factors constant, the percentage increase induced demand in travel can therefore be expresses entirely in terms of changes in the generalized cost as shown in equation 4.
Induced Demand % = (UcompA – UcompB)/UcompB (4)
This induced ridership calculation generates an induced ridership volume that is equal to approximately 20 percent of the long distance AAF ridership and approximately 10 percent of the short distance travel market.
6.4 AdditionalRidershipSources In addition to the network/mode choice model estimates, the Study Team evaluated additional sources of ridership that are not easily accommodated within the network/mode choice model framework. The AAF Management Team has plans for implementation of the service that could result in substantial additions to ridership and revenue due to concentrated marketing initiatives and cooperative arrangements with resorts and travel arrangers to access the broader recreational travel market and expand the travel market between Central and Southeast Florida, taking full advantage of station locations at Orlando International Airport and central locations in key Southeast Florida travel destinations.
Case 1:15-cv-00632-CRC Document 21-2 Filed 05/28/15 Page 143 of 154

All Aboard Florida Ridership and Revenue Study
May 7, 2015
Page 127
It is important to note that the network/mode choice model framework is limited in its ability include the impact of certain other items and strategies that are commonly employed by management of similar consumer‐oriented rail operating companies and that could potentially further increase ridership and/or revenue such as (i) revenue yield management strategies; (ii) frequent rider loyalty programs; and (iii) dedicated or chartered train services outside of regularly scheduled service.
By connecting key resort and business activity centers in Orlando and Southeast Florida, AAF offers the opportunity for partnerships with resorts and travel arrangers to include AAF tickets in travel arrangements or to market AAF service to expand the travel market overall. To investigate the potential for these initiatives, both LBG and AAF Management held discussions with select resort operators in Central Florida and with convention and visitors bureaus in both regions. Following these initial assessments, four specific sources of additional ridership were evaluated as part of this phase of the ridership forecast.
Cooperative Air‐Rail Ticket Sharing Packages. Because AAF service will operate from Orlando International Airport (MCO), AAF will pursue synergistic opportunities for cooperative air‐rail ticket packages with air carriers serving the Orlando‐Miami city pair. Based on LBG’s assessment of Miami‐bound air passengers connecting through MCO, there was a potential addressable market of approximately 560,000 annual trips in 2010 that could be candidates for a cooperative air‐rail ticket sharing program. LBG estimates that such a program could result in a corresponding ridership boost of approximately 188,000 riders in 2019 growing to 267,000 by 2030.
Expanded South American Tourism Market. Central Florida resorts see opportunities for connections to cruise ports in Southeast Florida and the appeal of multi‐destination packages for international travelers who have familiarity with rail travel and extended multi‐destination trips when traveling abroad.
The AAF management team has engaged in some preliminary discussions with major theme parks in Orlando to target and expand the growing South American tourism market by providing discounted travel options between Orlando and Miami.
Based on tourism and travel data obtained from Visit Florida, Visit Orlando and the FAA DB1B 10% ticket survey database, LBG estimates that an additional 220,000 trips could be generated in 2019 through targeted discounts employed in conjunction with tourist attraction sites in both Miami and Orlando. This volume grows is expected to grow to approximately 313,000 by the 2030 forecast horizon.
University of Central Florida (UCF) Shuttle & Student Packages. The AAF management team has also engaged with discussions with University of Central Florida (UCF) that is located in the Orlando Metropolitan area and that was home to an estimated 9,500 students from Southeast Florida in 2011. The volume of Southeast Florida students is expected to grow to approximately 10,600 students in 2019 and 12,500 by 2030.
Based on UCF’s expressed commitment to AAF to provide dedicated shuttle bus service from campus to the Orlando AAF terminal, the AAF team estimates a 48,000 increase in ridership assuming that: students generate six home return trips on average per year; each trip involves 1.5 passengers due to friends and family groups; and students receive discounted AAF fares that result in market penetration rates of 25 percent.
Case 1:15-cv-00632-CRC Document 21-2 Filed 05/28/15 Page 144 of 154

All Aboard Florida Ridership and Revenue Study
May 7, 2015
Page 128
Southeast Florida Travel Market Growth Rates. The travel market growth rate assumptions applied in the short distance model covering Southeast Florida were based on assumptions obtained from the SERPM regional travel demand model of 1.1 percent per year. Data available from the I‐95 Corridor Coalition (ICAT trip tables) suggest that growth in long‐distance intercity travel within Southeast Florida from 2015 to 2030 will be 1.7 percent per year. This higher growth outlook more closely aligns with the growth in intercity travel between Southeast Florida and Central Florida and the forecasts of the Florida Turnpike. Adoption of this assumption in the short distance travel market in Southeast Florida results in an additional 62,000 AAF riders in 2019 growing to 233,000 by 2030.
Special Event Ridership. Because trips associated with special events (such as the Sonny Ericson Golf Open, and the Boat Shows in Miami and Fort Lauderdale) are not really subject to the traditional trip generation calculations based on socioeconomic data, and are therefore believed to be unaccounted for in the network/mode choice model trip table.
Based on a detailed investigation of annual events in each of the four AAF station cities, LBG estimates that a total of 437,000 annual trips will be attributable to long distance special event ridership in 2030, while the corresponding volume of short distance special event ridership will reach 858,000 in 2030.
6.5 OverallForecastSummary Figures 6.5‐1 to 6.5‐4 provide a graphical representation of the various components of the ridership and revenue forecasts, and their overall contribution to the overall totals. It should be noted although various discounts are assumed in the cooperative market agreements, the volumes in Figures 6.5‐2 and 6.5‐4 represents revenues calculated using the appropriate full city‐city fares. The forecasts include the assumption that Short Distance revenue service will commence in the second quarter of 2017, and Long Distance service will commence in the fourth quarter of 2017.
Case 1:15-cv-00632-CRC Document 21-2 Filed 05/28/15 Page 145 of 154
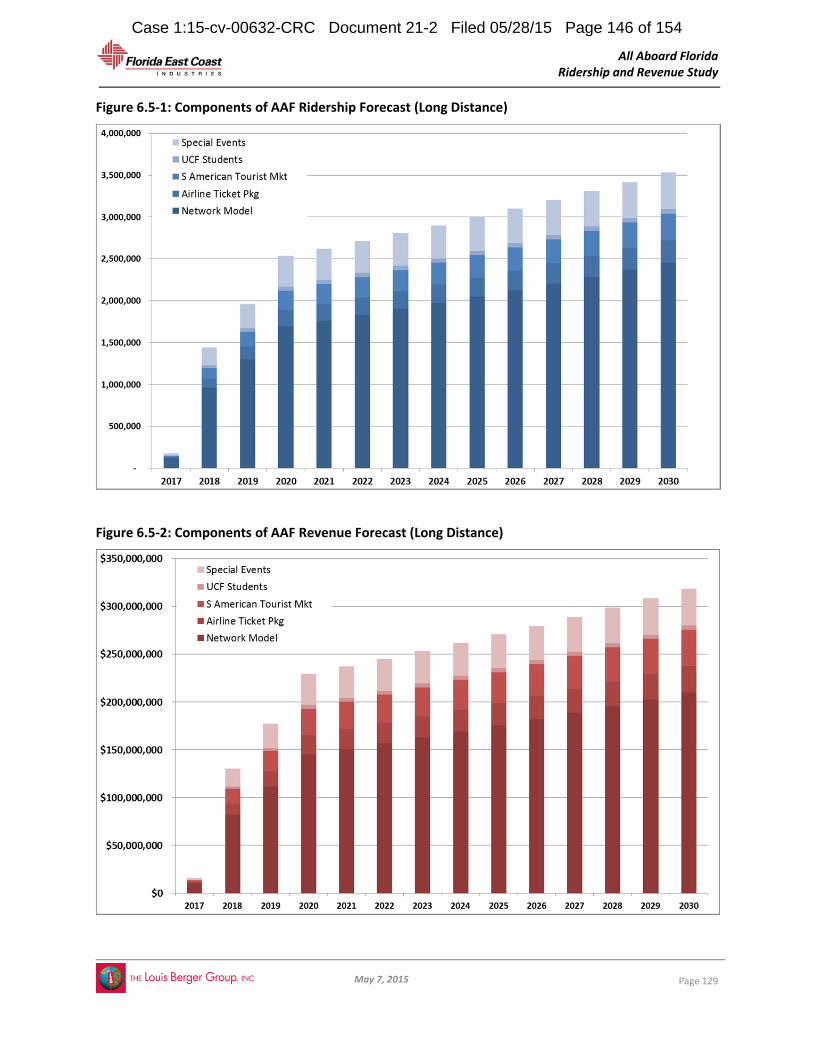
All Aboard Florida Ridership and Revenue Study
May 7, 2015
Page 129
Figure 6.5‐1: Components of AAF Ridership Forecast (Long Distance)
Figure 6.5‐2: Components of AAF Revenue Forecast (Long Distance)
Case 1:15-cv-00632-CRC Document 21-2 Filed 05/28/15 Page 146 of 154

All Aboard Florida Ridership and Revenue Study
May 7, 2015
Page 130
Figure 6.5‐3: Components of AAF Ridership Forecast (Short Distance)
Figure 6.5‐4: Components of AAF Revenue Forecast (Short Distance)
‐
500,000
1,000,000
1,500,000
2,000,000
2,500,000
3,000,000
3,500,000
4,000,000
2016 2017 2018 2019 2020 2021 2022 2023 2024 2025 2026 2027 2028 2029 2030
Special Event
Traffic Growth
Network Model
$0
$10,000,000
$20,000,000
$30,000,000
$40,000,000
$50,000,000
$60,000,000
$70,000,000
$80,000,000
$90,000,000
2016 2017 2018 2019 2020 2021 2022 2023 2024 2025 2026 2027 2028 2029 2030
Special Event
Traffic Growth
Network Model
Case 1:15-cv-00632-CRC Document 21-2 Filed 05/28/15 Page 147 of 154

All Aboard Florida Ridership and Revenue Study
May 7, 2015
Page 131
6.5.1 ForecastGrowthComparison
AAF Ridership performance into the future was estimated by determining the outlook for growth in the intercity travel market between Central and Southeast Florida.
LBG utilized growth assumptions appropriate for each mode of travel. The growth in auto traffic was based on the I‐95 Corridor Coalition long‐distance travel trip tables, but also recognized the effect of growth in roadway traffic congestion on auto travel times and how that may make AAF more competitive with future auto travel. Air travel growth was linked to FAA enplanement forecasts for the study area.
The average annual forecast growth rate for AAF ridership from the beginning of revenue service through 2030 is 2.8 percent. This level of growth is higher than growth in population and employment observed in from 2000 to 2010 (at 1.4 percent and 1.2 percent per year respectively), but is also lower than the corresponding estimates of growth in both turnpike auto trips and air passenger traffic. Figure 6.5‐5 shows that both the Florida Turnpike and travel by air which saw growth above 3 percent per year in the last ten years.
Figure 6.5‐5: Comparison of AAF Forecast Growth Rates
Figure 6.5‐4 plots the AAF forecast growth rates against forecasts for population, employment, and household income as determined by regional planning agencies in Central and Southeast Florida (see Section 2.2 for detailed discussion). AAF growth lies above the demographic variable growth rates but below the growth estimated by the Florida Turnpike Enterprise for long‐distance travel (3.2% per year through 2022) and the FAA for enplanements at Orlando International Airport and Miami International Airport (3.0% through 2040). The higher growth trajectory relative to the demographic variables partially reflects the additional marketing efforts envisioned for the AAF Service.
Case 1:15-cv-00632-CRC Document 21-2 Filed 05/28/15 Page 148 of 154
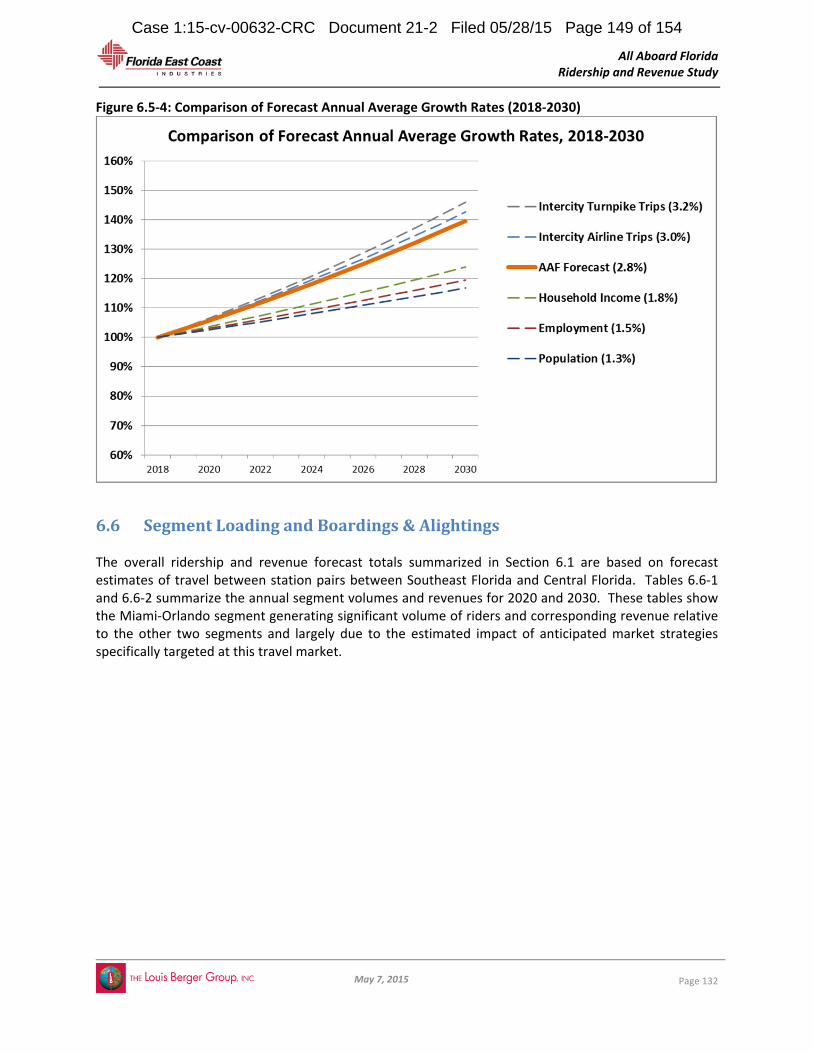
All Aboard Florida Ridership and Revenue Study
May 7, 2015
Page 132
Figure 6.5‐4: Comparison of Forecast Annual Average Growth Rates (2018‐2030)
6.6 SegmentLoadingandBoardings&Alightings The overall ridership and revenue forecast totals summarized in Section 6.1 are based on forecast estimates of travel between station pairs between Southeast Florida and Central Florida. Tables 6.6‐1 and 6.6‐2 summarize the annual segment volumes and revenues for 2020 and 2030. These tables show the Miami‐Orlando segment generating significant volume of riders and corresponding revenue relative to the other two segments and largely due to the estimated impact of anticipated market strategies specifically targeted at this travel market.
Case 1:15-cv-00632-CRC Document 21-2 Filed 05/28/15 Page 149 of 154

All Aboard Florida Ridership and Revenue Study
May 7, 2015
Page 133
Table 6.6‐1 Forecast Summary – All Aboard Florida Annual Segment Volumes and Revenues, 2020 (First Stabilized Year Following Ramp‐up) (2012 $)
Source: LBG, 2012. Table 6.6‐2 Forecast Summary – All Aboard Florida Annual Segment Volumes and Revenues, 2030 (2012 $)
Source: LBG, 2012. The annual city pair segment volumes presented above allow for estimation of daily boardings and alightings at the four station locations. These estimates are presented in Tables 6.6‐3 and 6.6‐4. As expected, Orlando generates the highest count of forecasted boardings and alightings when AAF ridership is isolated to long distance trips only. The larger volume of boardings and alightings in Miami relative to the rest of Southeast travel market reflects the results of the preceding segment loading tabulations.
Station Pairs
Northbound
Volume
Southbound
Volume
Total
Volume
Segment
Fare
Estimated
Revenue
Short Distance
Miami / West Palm Beach 447,100 491,200 938,300 $28.89 $27,103,500
Fort Lauderdale / West Palm Be 488,600 518,800 1,007,400 $19.66 $19,806,800
Fort Lauderdale / Miami 428,000 439,500 867,500 $19.87 $17,233,100
Subtotal 1,363,700 1,449,500 2,813,200 $22.80 $64,143,400
Long Distance
Miami / Orlando 565,900 563,600 1,129,500 $105.27 $118,903,400
Fort Lauderdale / Orlando 313,100 340,700 653,800 $89.01 $58,196,800
West Palm Beach / Orlando 366,400 384,400 750,800 $69.71 $52,336,100
Subtotal 1,245,400 1,288,700 2,534,100 $90.54 $229,436,300
Grand Total 2,609,100 2,738,200 5,347,300 $54.90 $293,579,700
Station Pairs
Northbound
Volume
Southbound
Volume
Total
Volume
Segment
Fare
Estimated
Revenue
Short Distance
Miami / West Palm Beach 571,800 628,300 1,200,100 $28.82 $34,581,000
Fort Lauderdale / West Palm Be 597,500 634,400 1,231,900 $19.64 $24,193,400
Fort Lauderdale / Miami 545,500 560,300 1,105,800 $19.78 $21,877,700
Subtotal 1,714,800 1,823,000 3,537,800 $22.80 $80,652,100
Long Distance
Miami / Orlando 758,000 754,900 1,512,900 $105.60 $159,762,800
Fort Lauderdale / Orlando 443,300 482,500 925,800 $89.15 $82,530,800
West Palm Beach / Orlando 532,800 558,900 1,091,700 $69.78 $76,181,800
Subtotal 1,734,100 1,796,300 3,530,400 $90.21 $318,475,400
Grand Total 3,448,900 3,619,300 7,068,200 $56.47 $399,127,500
Case 1:15-cv-00632-CRC Document 21-2 Filed 05/28/15 Page 150 of 154

All Aboard Florida Ridership and Revenue Study
May 7, 2015
Page 134
Table 6.6‐3 AAF Daily Boardings and Alightings, 2020
Source: LBG, 2012. Table 6.6‐4 AAF Daily Boardings and Alightings, 2030
Source: LBG, 2012.
6.8 UncertaintyandForecastRisk Uncertainty in input assumptions is inherent in any forecast of traveler behavior. Trends in the size of the overall travel market and assumptions on the cost and time of travel are subject to uncertainty over a thirty to forty year forecast term. An important aspect of a ridership and revenue forecast is the thorough identification of elements of forecast risk and an approach that adopts assumptions that do not put unreasonable upward bias on AAF ridership or revenue projections wherever appropriate. LBG prepared sensitivity tests to evaluate these key assumptions (section 6.3.3).
The forecast team has utilized a base year and future year auto travel trip table prepared on behalf of a third party for general application in the study of interregional projects in the I‐95 corridor including Florida. The study team has evaluated the trip table to ensure that it is consistent with the origin and destination patterns and assumptions for trip growth used by the MPOs in the corridor. The table was confirmed with a survey administered by LBG and also compared to traffic counts information maintained by Florida Turnpike Enterprise and Florida Department of Transportation. Trips tables for other modes of travel were based on information obtained from MPOs and other relevant planning agencies and operators.
To ensure that the mode choice market was not applied to an overly broad market of candidate riders LBG developed station area catchment areas and trip distance filters to define the addressable market for AAF.
The forecast excluded travelers that have indicated a need for stops at intermediate destinations during their journey, this “en‐route captive” adjustment accounted for a 7 percent decrease in overall ridership.
LBG utilized the findings of its Stated Preference survey to determine the size of the travel party and auto occupancy for intercity travel. The resulting party size/auto occupancy levels are consistent with other studies and surveys of long‐distance travel.
Station Boardings Alightings
Orlando 3,531 3,412
West Palm Beach 3,771 3,617
Fort Lauderdale 3,400 3,527
Miami 3,948 4,094
TOTAL 14,650 14,650
Station Boardings Alightings
Orlando 4,921 4,751
West Palm Beach 4,919 4,735
Fort Lauderdale 4,387 4,555
Miami 5,138 5,325
TOTAL 19,365 19,365
Case 1:15-cv-00632-CRC Document 21-2 Filed 05/28/15 Page 151 of 154
All Aboard Florida Ridership and Revenue Study
May 7, 2015
Page 135
LBG utilized an annualization factor of 365‐days for the estimation of annual volumes from daily trip levels. While some rail forecasts utilize lower annualization factors, LBG has adopted this assumption because the input data employed is consistent with annual average daily travel (365 day year) and traffic data suggests levels of weekend day travel at or above weekday travel.
Growth in future travel volumes for air travel and airport access are based on accepted federal and local sources.
LBG utilized accepted federal government forecasts for vehicle fuel prices that incorporate assumptions for fuel efficiency and improvements in technology.
7.0 Conclusion
With frequent service between city centers in the corridor, AAF offers the prospect of substantial time savings to current users of auto, bus, traditional rail, and even air. To determine how these time savings would alter travel behavior and generate ridership and revenue for AAF, LBG undertook a detailed examination of current travel behavior, and conducted surveys that determined traveler preferences and willingness to pay. Best practices in discrete choice analysis and travel network modeling were employed and findings were tested and referenced to previous studies. The analysis revealed that introduction of AAF service would complement existing modes of travel and draw substantial number of business and non‐business travelers. The analysis also identified several areas of focus already under consideration in AAF business planning that would broaden the size and scope of the AAF market.
Case 1:15-cv-00632-CRC Document 21-2 Filed 05/28/15 Page 152 of 154

All Aboard Florida Ridership and Revenue Study
May 7, 2015
Page 136
ListofAcronyms
AAA – American Automobile Association
AADT – Average Annual Daily Traffic
AAF – All Aboard Florida
ASC – Alternative Specific Constants
BCT – Broward County Transit
BEBR – Bureau of Economic and Business Research at the University of Florida
BTS – Bureau of Transportation Statistics
CF – Central Florida
CFRPM – Central Florida Regional Planning Model
DB1B – Airline Origin and Destination Survey 10% Ticket Sample
EIA – U.S. Energy Information Administration
FAA – Federal Aviation Administration
FDEO – Florida Department of Economic Opportunity
FDOT – Florida Department of Transportation
FECI – Florida East Coast Industries
FECR – Florida East Coast Railway
FHSR – Florida High Speed Rail
FLL – Fort Lauderdale Airport (International Air Transportation Association airport code)
FOX – Florida Overland Express
GHG – Green House Gasses
GOAA – Greater Orlando Aviation Authority
HSRA – Florida High Speed Rail Authority
IATA ‐ International Air Transportation Association
ICAT – Integrated Corridor Analysis Tool (I‐95 Corridor Coalition)
IVTT – In‐Vehicle Travel Time
JTW – Journey to Work
LBG – The Louis Berger Group, Inc.
LOS – Level of Service
MCO – Orlando International Airport (International Air Transportation Association airport code)
MIA – Miami International Airport (International Air Transportation Association airport code)
MNL – Multinomial Logit
MPO – Metropolitan Planning Organization
NAICS – North American Industry Classification System
NHTS – National Household Travel Survey
NL – Nested Logit
Case 1:15-cv-00632-CRC Document 21-2 Filed 05/28/15 Page 153 of 154

All Aboard Florida Ridership and Revenue Study
May 7, 2015
Page 137
OD – Origin‐Destination
OVTT – Out‐of‐Vehicle Travel Time
PBI – West Palm Beach Airport (International Air Transportation Association airport code)
QoS – Quality of Service
SED – Socio‐Economic Demographic factors
SEF – South East Florida
SEFTC – Southeast Florida Transportation Council
SERPM – Southeast Regional Planning Model
SFRTA – South Florida Regional Transportation Authority
SFRTCS – Southeast Florida Regional Travel Characteristics Survey
SP – Stated Preference
TAZ – Traffic Analysis Zone
TCRP – Transit Cooperative Research Program
TOD – Transit Oriented Development
UCF – University of Central Florida
USDOT – United States Department of Transportation
V/C – Volume to Capacity
VMT – Vehicle Miles Travelled
VOT – Value of Time
Case 1:15-cv-00632-CRC Document 21-2 Filed 05/28/15 Page 154 of 154