aligning work, workers and outcomes using awps …rakoff.net/workforce_planning_files/awps...
TRANSCRIPT

Aligning Work, Workers and Outcomes Using AWPS Workplace
Management Tools
December 2008 The Army Workload & Performance
System (AWPS)

AWPS Guidebook 2
1 Introduction
We can only manage what we can measure.
Successful management requires that decision‐makers use the best available data describing resources consumed and outcomes produced.
For many years engineering‐based organizations have used earned value methodologies to plan and monitor the workforce and work accomplished. These workforce and work planning systems typically are based upon detailed plans for using resources to produce products or services. They accumulate data on hours worked, resources consumed, and outputs produced by specific task and use a variety of forecasting models to analyze that data and produce forecasts and support scenario‐planning capabilities.
Navy shipyards and Army depots employ a family of workforce planning tools called NWPS (Navy Workforce and Performance System) or AWPS (Army Workforce and Performance System) that assist managers to perform these planning and oversight functions. These software tools have been developed and are maintained and supported through a unique cooperative arrangement between the Navy Sea Logistics Center Pacific and the Army Data Center‐Fairfield (ADC‐F) co‐located at Fairfield, California.
Most government organizations, however, lack the detailed planning and work data that make these earned value approaches attractive. In many organizations work is “level of effort” rather than project based and employees do not report time spent by task but simply attendance and leave hours. As a result, managers lack consistent and verifiable labor and production data on which to base planning and resource allocation decisions. But recent emphasis on improving management through application of LEAN and SixSigma approaches, value stream analysis and National Security Personnel System (NSPS) focus linking organization and individual performance, has made rigorous data and tools even more important.
Recognizing that growing requirement, and with the encouragement of the tri‐service MOA on workforce planning, ADC‐F has modified the rigorous engineering‐based AWPS tools into a more streamlined set of tools and analyses better aligned
to the needs and capabilities of white collar or non‐project‐based, organizations. The Army Workload and Performance System (AWPS) has been applied to a variety of organizations in Army and Navy including contracting offices, human resources regional centers, disability processing centers, and IT project management organizations with striking success.
AWPS has been designed to enable organizations to clearly identify their workload and the resources necessary to accomplish that work, allowing more accurate forecasts of future workload and resource requirements. With minimal effort, AWPS enables managers to build work breakdown structures that describe their major activities, institute daily time‐to‐task data collection from all employees (including military and contractors), and apply earned value analyses to management and forecasting.
The AWPS toolset is a turnkey package of software modules already owned and operated by the US Government, along with tested organization and consulting services to facilitate adoption of the tools and processes. The AWPS software includes these basic modules:
• Work Mapping Tool (WMT) ‐ enables organization managers and supervisors to assign approved work tasks to individual employees, and to monitor patterns of employee charges. Managers also use WMT to enter expected and actual budget and production data.
• Time Collection Tool (TCT) ‐ a simple web‐based tool that allows employees to enter their time‐to‐task daily and passes that data to the AWPS analytic engine and database. TCT can also be configured to pass employee time data directly to many payroll systems.
• Performance Management and Control (PMC) – this tool contains the earned value algorithms, collecting and comparing planned and actual hours and resources expended to work completed.
• Strategic Planning and Forecasting Tool (SPF) ‐ applies simulation modeling and system dynamics models to project future

AWPS Guidebook 3
outcomes as user varies inputs of work or workforce measures. Normally at least a solid year of data is required to ensure reliable SPF analyses.
This guidebook presents an overview of the AWPS process and tool set applied to a typical white‐collar government organization. Four major steps are outlined:
• Initial analysis – define organization mission and broad processes, build work breakdown structure, build strategy for success
• Time to task data collection using the Work Mapping Tool (WMT) Time Collection application
• Development of strategy for collecting data on work progress and completion, which
may include tapping into existing management systems or establishing manual updating
• Tailoring reporting and analyses to provide ongoing data to management – may include simulation or systems dynamic models, downloadable reports, “what‐if” budget analyses.
In most cases it will take a year or more of data collection to capture seasonal variations in hours worked and outputs produced before useful forecasts can be produced. But actionable data describing how labor dollars are being spent and products produced will be available after only a few months of data collection.
2 Getting Started
Energy and attention invested at the start of a project pays substantial dividends in the long run, so the AWPS implementation process devotes special effort to prepare the organization for introduction of these new business management tools. The AWPS process includes the services of a team of skilled and experienced trainers and consultants who will work on the ground with your organization to implement the workforce performance capabilities. These up front activities include:
• Meet with senior leaders in the organization to solicit full understanding and commitment to the change process. Use that initial contact to identify potential issues that might affect progress, including employee and labor‐relations issues.
• Establish initial roadmap, strategic communications plan, and timeframe for the project.
• Work with managers to build a high‐level process map of major functions. Use that process map as the basis of an initial work breakdown structure (WBS) against which
time‐to‐task will be collected. This initial high‐level WBS can usually be designed in a single meeting ‐ it is easily modified going forward.
• Draft all‐hands memo to employees describing AWPS project and its positive impact on the organization, and direct all staff to the AWPS web site to sign up for accounts.
• Hold initial training for managers and supervisors ‐ no more than 1 hour required. Instruct them on how to assign work to individual employees using WMT.
• Hold initial training for employees on how to use the Time Collection Tool on a daily basis.
• Provide ongoing support and training as the new tools are becoming part of the organization’s routine.
It is critical at this initial stage that management be fully committed to the AWPS effort and makes successful implementation and use of AWPS a major organizational objective.

AWPS Guidebook 4
3 Initiating Time to Task Collection
For many organizations adopting time‐to‐task data collection will be the highest barrier to achieving better management as described here. Employees may be suspicious of being asked to account for their time in more rigorous fashion. Some organizations may argue that their work “Can not be quantified.” But if leaders are determined and steady, these objections can be overcome and employees will come to appreciate that improved performance that can result from the applications described here as workforce planning. Some of the benefits of instituting time‐to‐task data collection are:
• Enhanced accountability • Improved budgeting • Strengthened ability to optimize workforce
mix • Improved communication and management
across the enterprise • Better planning and ability to adjust to
changing environments • Support for other initiatives such as Lean or
SixSigma Once employees have registered and received AWPS accounts, and managers have assigned each employee the tasks they can charge to, time collection can begin. At the end of each workday, each employee logs into the secure AWPS portal and calls up the time keeping application. Experience suggests that entering time takes about 1‐2 minutes each day. Each employee will be verified against the PKI certificate embedded within his or her CAC card, further simplifying the daily update process.
After signing into the AWPS portal, the employee will be taken to the application screen and will select the time collection option. (Figure 1)
Figure 1: AWPS Applications
Selecting the time collection option brings up the time sheet screen (Figure 2). The time sheet lists all the tasks that the employee has charged in past time periods. Buttons at the top of the screen allow the employee to add tasks to the time sheet or to remove tasks no longer being worked. Below the orange line on the time sheet are lines for employees to charge to various leave categories, including annual, sick, holiday and family leave categories recognized by the agency. Each day the employee enters the time worked by task – in increments no smaller than ¼ hour, and then saves the time sheet. At the end of the pay period the employee simply hits the submit button to send the data to the AWPS database. If desired, copies of the attendance and leave data can be sent to the organization’s payroll timekeeper. Data can also be sent directly to some government pay systems to remove the need for duplicate data entry. Once entered into AWPS, the charged time data are available for review by supervisors and managers using the capabilities in the Work Mapping Tool
.

AWPS Guidebook 5
Figure 2: Time Sheet
As the time‐to‐task data collection proceeds, the AWPS analytic team will be monitoring the results looking for patterns that suggest issues with employee entry or with the organization of work in
the WBS. The AWPS team will meet regularly with managers and leadership to review the accumulating data and to make adjustments in the WBS.
4 Collecting Production and Output Data
While time‐to‐task data accumulates, the AWPS team will assist managers to measure production or outputs. Even if initially hard to define and measure, experience strongly suggests that every organization has quantifiable program or project outputs that can be captured and used along with labor inputs in earned value applications. The AWPS team is skilled at eliciting appropriate information and data sources from managers and leaders, and establishing linkages to existing automated systems to capture available output data for use in management and forecasting.
White‐collar work generally falls into two categories – projects and level of effort. Project work has a start and stop date, a plan, committed or projected resources, and expected or projected outcomes. A
ship overhaul at a Naval Shipyard is an example of a very large project; activity to prepare a legislative proposal is an example of a small project. Each has start and stop dates, and probably milestone dates in between. Each has a final product – the ship returns to service or the report is published. Each can be broken down into a series of more discrete steps or tasks ‐ engineering, trades, refitting and similar sets of activities for the ship overhaul; literature review, interviews, drafting and editing for the legislative proposal. In the case of the ship overhaul there is no doubt a very detailed engineering project plan that describes step by step how the overhaul will take place ‐ probably only a notional project plan will be developed for the smaller legislative project.
AWPS Guidebook 6
Progress on project‐type work is generally measured against a formal or notional timeline that is embedded in the plan. If detailed project plans exist and are maintained in electronic form, the AWPS team will make arrangements to tap into this data source to capture performance information and upload it to the Work Mapping Tool. If project plans are held in other forms, AWPS allows project managers to establish and update project progress in the Work Mapping Tool.
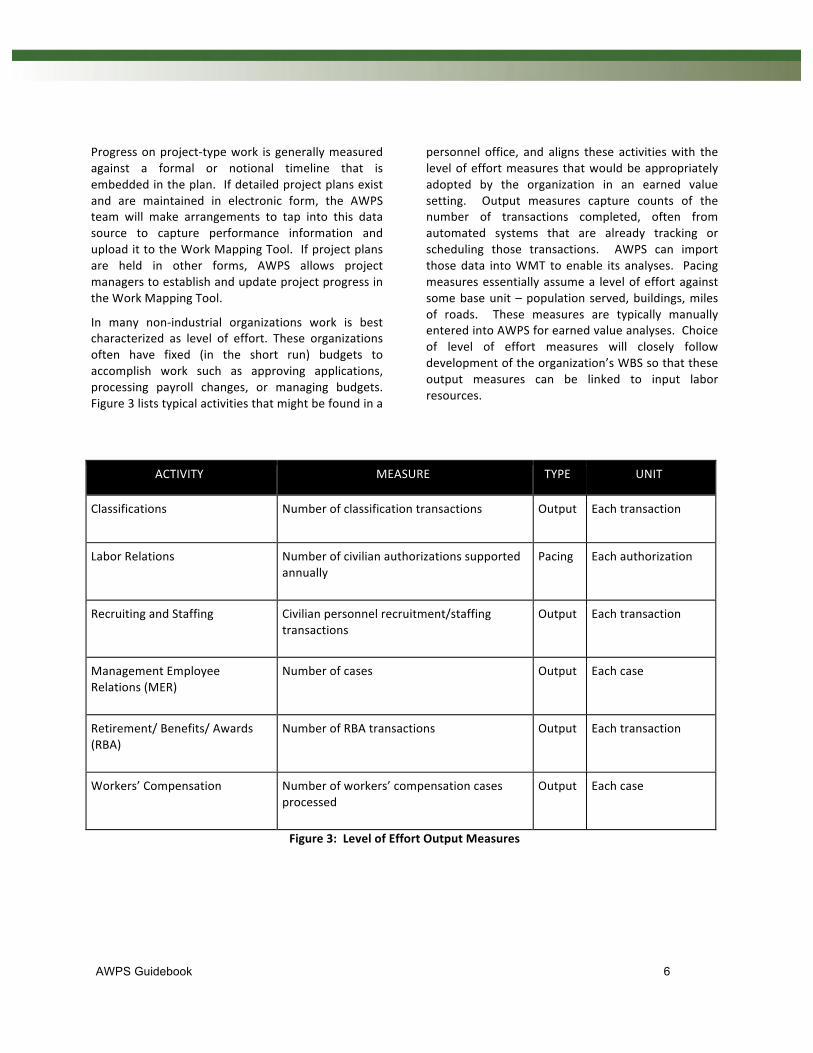
In many non‐industrial organizations work is best characterized as level of effort. These organizations often have fixed (in the short run) budgets to accomplish work such as approving applications, processing payroll changes, or managing budgets. Figure 3 lists typical activities that might be found in a
personnel office, and aligns these activities with the level of effort measures that would be appropriately adopted by the organization in an earned value setting. Output measures capture counts of the number of transactions completed, often from automated systems that are already tracking or scheduling those transactions. AWPS can import those data into WMT to enable its analyses. Pacing measures essentially assume a level of effort against some base unit – population served, buildings, miles of roads. These measures are typically manually entered into AWPS for earned value analyses. Choice of level of effort measures will closely follow development of the organization’s WBS so that these output measures can be linked to input labor resources.
ACTIVITY MEASURE TYPE UNIT
Classifications Number of classification transactions Output Each transaction
Labor Relations Number of civilian authorizations supported annually
Pacing Each authorization
Recruiting and Staffing Civilian personnel recruitment/staffing transactions
Output Each transaction
Management Employee Relations (MER)
Number of cases Output Each case
Retirement/ Benefits/ Awards (RBA)
Number of RBA transactions Output Each transaction
Workers’ Compensation Number of workers’ compensation cases processed
Output Each case
Figure 3: Level of Effort Output Measures

AWPS Guidebook 7
5 Establish Budget and Production Plans
As time‐to‐task data is being accumulated from daily employee updates, and production or output measures have been defined, the AWPS team will work with the organization to define budget and performance data for use in earned value analyses. In the initial year the budget and completion estimates may be simply straight‐lined – once more longitudinal data becomes available these estimates can be better tuned to account for seasonal or other variation.
Figure 4 presents an example of an AWPS WMT screen in which the manager or supervisor can enter and update data on the work to be performed by the organization. At the left of the screen is the nested work breakdown structure, with the lowest level being the tasks to which employees can be assigned and charge time. The main window on the screen contains information on the task selected from the WBS, including planned and actual start and end
dates and program type ‐ level of effort, percent complete, or count.
In the middle of the screen is a section that allows the user to enter program and budget information for each task. Data can be entered and accessed as hours or dollars for each category of expense – government civilians, military, and contractors. These budget entries for dollars and hours (Budget at Completion – BAC and Quantity at Completion –QAC) can be updated as events dictate – the system keeps track of these changes and displays them in the analysis charts.
Supervisors and managers use the bottom section of this screen to assign personnel to each task. This enables those employees to select those tasks from the TCT and actually charge their time to those tasks.
Figure 4: WMT Data Entry Screen
AWPS Guidebook 8
6 Managing With Earned Value Analysis
AWPS uses the Performance Measurement and Control tool (PMC) to provide managers with current data showing program and budget status throughout the year. Typically hours worked and work accomplished are updated at the end of each pay period, but this updating can be adjusted to monthly if that is more useful in a specific setting.
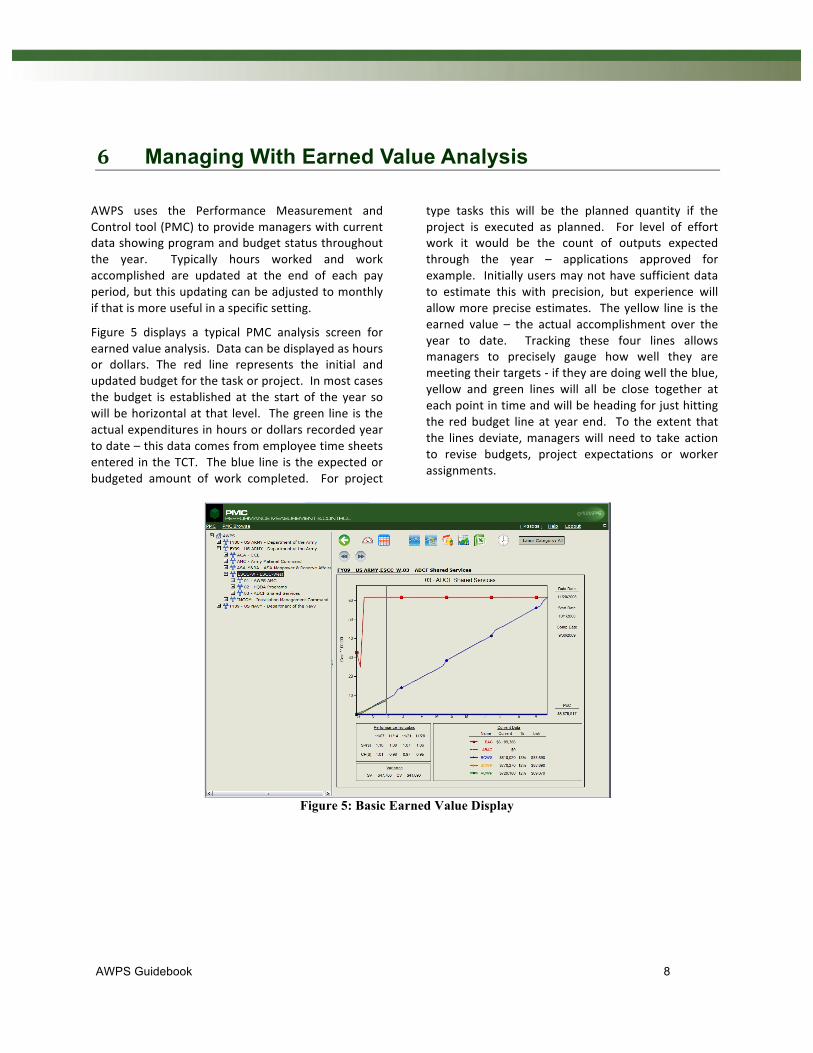
Figure 5 displays a typical PMC analysis screen for earned value analysis. Data can be displayed as hours or dollars. The red line represents the initial and updated budget for the task or project. In most cases the budget is established at the start of the year so will be horizontal at that level. The green line is the actual expenditures in hours or dollars recorded year to date – this data comes from employee time sheets entered in the TCT. The blue line is the expected or budgeted amount of work completed. For project
type tasks this will be the planned quantity if the project is executed as planned. For level of effort work it would be the count of outputs expected through the year – applications approved for example. Initially users may not have sufficient data to estimate this with precision, but experience will allow more precise estimates. The yellow line is the earned value – the actual accomplishment over the year to date. Tracking these four lines allows managers to precisely gauge how well they are meeting their targets ‐ if they are doing well the blue, yellow and green lines will all be close together at each point in time and will be heading for just hitting the red budget line at year end. To the extent that the lines deviate, managers will need to take action to revise budgets, project expectations or worker assignments.
Figure 5: Basic Earned Value Display
AWPS Guidebook 9
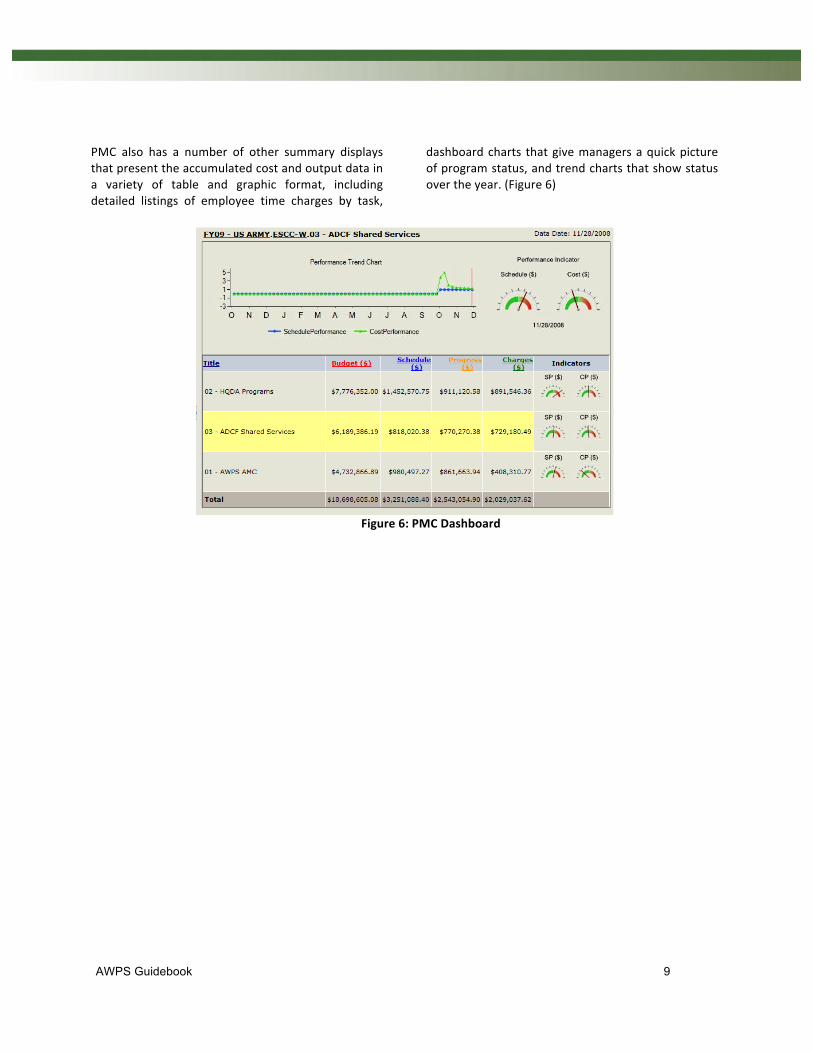
PMC also has a number of other summary displays that present the accumulated cost and output data in a variety of table and graphic format, including detailed listings of employee time charges by task,
dashboard charts that give managers a quick picture of program status, and trend charts that show status over the year. (Figure 6)
Figure 6: PMC Dashboard
AWPS Guidebook 10
7 Strategic Planning and Forecasting
While using the PMC tools to monitor current year expenses and production is an important benefit for leaders and managers, the real power of the AWPS family of Strategic Planning and Forecasting (SPF) tools is the ability to forecast and test future scenarios and develop responses to changing environments and requirements. For example:
• If you were asked to absorb a 15% budget cut ‐ how would your ability to produce required outcomes be affected? Could you realign staff to get required work done?
• You expect that current customers will now require 30% more production from your organization – how many additional resources will you require to get the work done. If you cannot secure additional resources, how will the additional workload affect production schedules and accomplishments?
• A significant portion of your workforce is eligible to retire. How likely are they to leave and what impacts will that have on your organization’s ability to meet its production targets?
• New policies will require substantial change to the way your organization does business. Can you estimate the impact the change will have on your required workforce and ability to meet previous targets?
Once the time collection and production capture modules have been in place long enough to establish a workable baseline, the AWPS tool box includes a number of powerful forecasting and simulation tools that enable users to answer these and similar questions from a powerful, data‐rich position. The tools are collected in an AWPS analytic library and allow real time testing of “what‐if” scenarios to enable prompt responses to short fused budget and other requests. Among the available tools are:
• A workforce‐aging model that applies constantly updated rates to age your workforce and estimate likely attrition.
• Analytic routines that allow users to project from current data to future states in which key input or process variables are allowed to change. These routines have been developed over the years to meet users’ needs and are available for all AWPS users to deploy.
• Systems Dynamics models that enable users to specify processes in detail, load data from AWPS data bases, and test alternative polices and processes for feasibility, costs and effectiveness.
These strategic planning and forecasting tools and capabilities provide the linkage from the day‐to‐day data on process and work to broader considerations of human capital strategy – and they do so from a solid basis in real data and verifiable analytic models – not just back of envelope swags.
The following three figures present examples of the analytic possibilities from the SPF capabilities. Figure 7 is a tabular view of the reported time charged that allows managers to identify resources consumed by tasks that do not directly contribute to accomplishing the mission work ‐ leave, vacation, training, meetings etc. In many organizations as much as 30% of the available work hours are devoted to these overhead tasks – focusing attention on these allocations can help organizations reprioritize and reorient work and workers.
Figure 8 is a “layer cake” display that presents work accomplished and planned by major category ‐ the categories could be customer, type of process, appropriation type or many others chosen by the user. The display quickly allows managers to gauge how they are doing meeting their objectives and how they might be challenged in the future, as the forecast becomes reality.

AWPS Guidebook 11
Figure 7: Workforce Composition Report
Figure 8: Layer Cake Report

AWPS Guidebook 12
Finally, Figure 9 is the wiring diagram for a systems dynamics model, in this case used to predict how the processing of recruiting actions will change as variables such as volume, available workforce, and overtime are controlled or allowed to vary. These
system dynamics models process data from AWPS in a powerful modeling context that allows users to quickly test for alternative future policies or circumstances.
Figure 9: Systems Dynamic Model
AWPS Guidebook 13
8 How Your Organization Can Have the Benefits of AWPS
This short paper cannot provide all the information you may need to make a decision to implement AWPS. But as you think about the human capital and workforce planning challenges facing your organization, as well as the possibility of major realignments and changes in budget priorities, the capabilities and tools described here may well be a useful addition to your management capabilities.
Consider these arguments:
• The AWPS set of tools and applications is already government developed, owned, tested and operated ‐ no need to deal with transition problems converting COTS products or writing new applications from scratch. These tools and data systems have been evolving over the past 15 years and are well tested in government (especially DoD) environments. They meet or exceed all security requirements.
• Initial timekeeping can begin in a matter of weeks – no waiting for a lengthy contracting process.
• All data is processed and stored on government‐owned and managed computer systems. Users need make no investment in hardware or software – all that is required is a secure Internet connection from a CAC‐enabled desktop. Users pay annual support costs based on the size of the workforce/volume of data.
• As more and more users adopt the AWPS system, the results of their experiences and the specific analytic tools they build are available for new users – you become part of a community of workforce planning users who share ideas and solutions to common problems.
For more information on how you can join the growing family of AWPS users, please contact:
Mr. Dan Jensen, Army Data Center, Fairfield
Or
Dr. Stuart Rakoff, Rakoff & Associates LLC