alibaba jan 2015 cs
DESCRIPTION
alibaba credit suissealpha generativeTRANSCRIPT

DISCLOSURE APPENDIX AT THE BACK OF THIS REPORT CONTAINS IMPORTANT DISCLOSURES, ANALYST CERTIFICATIONS, AND THE STATUS OF NON-US ANALYSTS. US Disclosure: Credit Suisse does and seeks to do business with companies covered in its research reports. As a result, investors should be aware that the Firm may have a conflict of interest that could affect the objectivity of this report. Investors should consider this report as only a single factor in making their investment decision.
CREDIT SUISSE SECURITIES RESEARCH & ANALYTICS BEYOND INFORMATION®
Client-Driven Solutions, Insights, and Access
30 January 2015
Asia Pacific/China
Equity Research
Consumer Internet
Alibaba Group Holding Limited
(BABA.N / BABA US) DECREASE TARGET PRICE
Monetization adjustments should lead to
stronger ecosystem in long-term
■ Alibaba reported CY4Q14 revenue of Rmb26.2Bn (up 55.6% QoQ and up 39.7% YoY), missing consensus of Rmb27.6Bn, and CSe of Rmb28.7Bn. Non-GAAP NI of Rmb13.1Bn (up 93.5% QoQ, up 46.4% YoY), beat our forecast of Rmb11.2Bn and estimates of Rmb11.7Bn.
■ Structural decline in take rate? Or short-term issue. While China retail GMV surprised on the upside with 49% YoY growth, China retail revenue lacks (with 32% YoY), given: (1) higher mobile penetration, (2) lower PC take-rate (down to 3.2% from 3.5% a year ago) due ad system changes, and (3) TMall GMV growth slower than expected. Alibaba has been changing its P4P ad system with (1) higher focus on search quality (rather than keyword pricing), and (2) introducing long-tail, but lower-price keywords. These changes bring better buyer experience and higher ROI for merchants, but lead to near-term decrease in monetization rate. The new system should be positive for Alibaba's ecosystem in the long-term. We expect negative impacts could last for another 1-2 quarters become normalizing at a higher level.
■ Good operating metrics in CY4Q14: Mobile accounts for 42% of GMV.
Active buyers reach new high of 334Mn, with 265Mn on mobile. Margins improved QoQ with better seasonality.
■ Maintain OUTPERFORM, TP US$113 (down from US$118). We revise down FY16E earnings by 0.6%. We turn more conservative in near-term take-rate assumptions, but maintain our view that monetization rate continue to increase with better buyer experience and mobile ad roll-out. We see weakness as good buying opportunity. Our DCF-based valuation of US$113 implies 43.8x CY15E, 33.5x CY16E, and 26.8x CY17E dil adj EPS.
Share price performance
80
100
120
140
80
90
100
110
120
Sep-14 Dec-14
Price (LHS) Rebased Rel (RHS)
The price relative chart measures performance against the
MSCI CHINA F IDX which closed at 6930.22 on 29-01-15
On 29-01-15 the spot exchange rate was US$1./US$1
Performance Over 1M 3M 12M Absolute (%) -6.9 -0.2 — — Relative (%) -10.6 -5.7 — —
Financial and valuation metrics
Year 3/14A 3/15E 3/16E 3/17E Revenue (Rmb mn) 52,504.0 76,041.0 105,012.7 135,089.2 EBITDA (Rmb mn) 26,259.0 25,720.7 34,841.3 49,521.9 EBIT (Rmb mn) 24,920.0 23,361.0 30,877.6 43,666.2 Net profit (Rmb mn) 27,278.0 34,035.1 45,610.4 59,844.7 EPS (CS adj.) (Rmb) 11.52 13.33 17.31 22.27 Change from previous EPS (%) n.a. 6.2 -0.6 2.0 Consensus EPS (Rmb) n.a. 13.4 18.8 25.3 EPS growth (%) 94.1 15.8 29.9 28.6 P/E (x) 53.4 46.1 35.5 27.6 Dividend yield (%) 0 0 0 0 EV/EBITDA (x) 58.5 59.0 42.4 28.7 P/B (x) 49.7 10.9 8.7 6.8 ROE (%) 186.1 39.4 27.6 27.9 Net debt/equity (%) net cash net cash net cash net cash
Source: Company data, Thomson Reuters, Credit Suisse estimates.
Rating OUTPERFORM Price (29 Jan 15, US$) 98.45 Target price (US$) (from 118.00) 113.00¹ Upside/downside (%) 14.8 Mkt cap (US$ mn) 247,407 (US$
247,407) Enterprise value (Rmb mn)
1,517,208 Number of shares (mn) 2,513.02 Free float (%) 13.0 52-week price range 119.2 - 85.0 ADTO - 6M (US$ mn) 470.5
*Stock ratings are relative to the coverage universe in each
analyst's or each team's respective sector.
¹Target price is for 12 months.
[V] = Stock considered volatile (see Disclosure Appendix).
Research Analysts
Dick Wei
852 2101 7339
Evan Zhou
852 2101 6745
Jialong Shi
852 2101 7437

30 January 2015
Alibaba Group Holding Limited (BABA.N / BABA US) 2
Focus charts Figure 1: Blended monetisation on Alibaba's China retail
marketplaces
Figure 2: Monetisation rate – PC vs mobile
8.7 8.6
16.1
9.4
12.6 12.8
21.3
14.7
19.7 20.8
32.7
22.7
2.51%2.31%
3.05%
2.18%
2.52%
2.30%
2.70%
2.28%
2.67%
2.65%
3.10%
2.83%
0.0%
0.5%
1.0%
1.5%
2.0%
2.5%
3.0%
3.5%
-
5.0
10.0
15.0
20.0
25.0
30.0
35.0
Total revenue (Rmb in billions) Blended monetisation rate
2.77%2.61%
3.53%
2.63%
3.03%
2.54%
3.23%
2.70%
3.15%3.05%
3.70%
3.30%
0.58%0.61%
1.12%0.98%
1.49%
1.87%1.96%
1.70%
2.10%2.20%
2.50%2.40%
0.0%
0.5%
1.0%
1.5%
2.0%
2.5%
3.0%
3.5%
4.0%
Blended monetisation rate PC Mobile
Source: Company data Source: Company data
Figure 3: GMV generated by mobile on Alibaba's China
retail marketplaces
Figure 4: Mobile revenue on Alibaba's China retail
marketplaces
41 55
104 118
164199
327
274
335374
527417
12.0%14.7%
19.7%
27.4%
32.8%35.8%
41.6%42.5%45.5%
47.5%50.0%
52.0%
0.0%
10.0%
20.0%
30.0%
40.0%
50.0%
60.0%
-
100.0
200.0
300.0
400.0
500.0
600.0
Mobile GMV (Rmb in billions) Mobile as % of total GMV
0.2 0.3
1.2 1.2
2.5
3.7
6.4
4.7
7.0
8.2
13.2
10.0
2.8%3.8%7.3%
12.4%
19.4%
29.1%30.2%
31.8%
35.8%
39.5%
40.3%
44.1%
0.0%
5.0%
10.0%
15.0%
20.0%
25.0%
30.0%
35.0%
40.0%
45.0%
50.0%
(1.0)
1.0
3.0
5.0
7.0
9.0
11.0
13.0
15.0
Mobile revenue (Rmb in billions)Mobile as % of total revenue
Source: Company data Source: Company data
Figure 5: GMV mix in Alibaba's China retail marketplaces
257 275 346 295 342 380
494 434 493 523
632 505
88 99
183
135 159
176
293
211
243 264
423
296
25.5% 26.5%
34.6%
31.4% 31.7% 31.7%
37.2%
32.7% 33.0% 33.6%
40.1%
36.9%
0.0%
5.0%
10.0%
15.0%
20.0%
25.0%
30.0%
35.0%
40.0%
45.0%
-
200
400
600
800
1,000
1,200
Toabao GMV Tmall GMV Tmall GMV as % of Total GMV
Source: Company data
30 January 2015
Alibaba Group Holding Limited (BABA.N / BABA US) 3
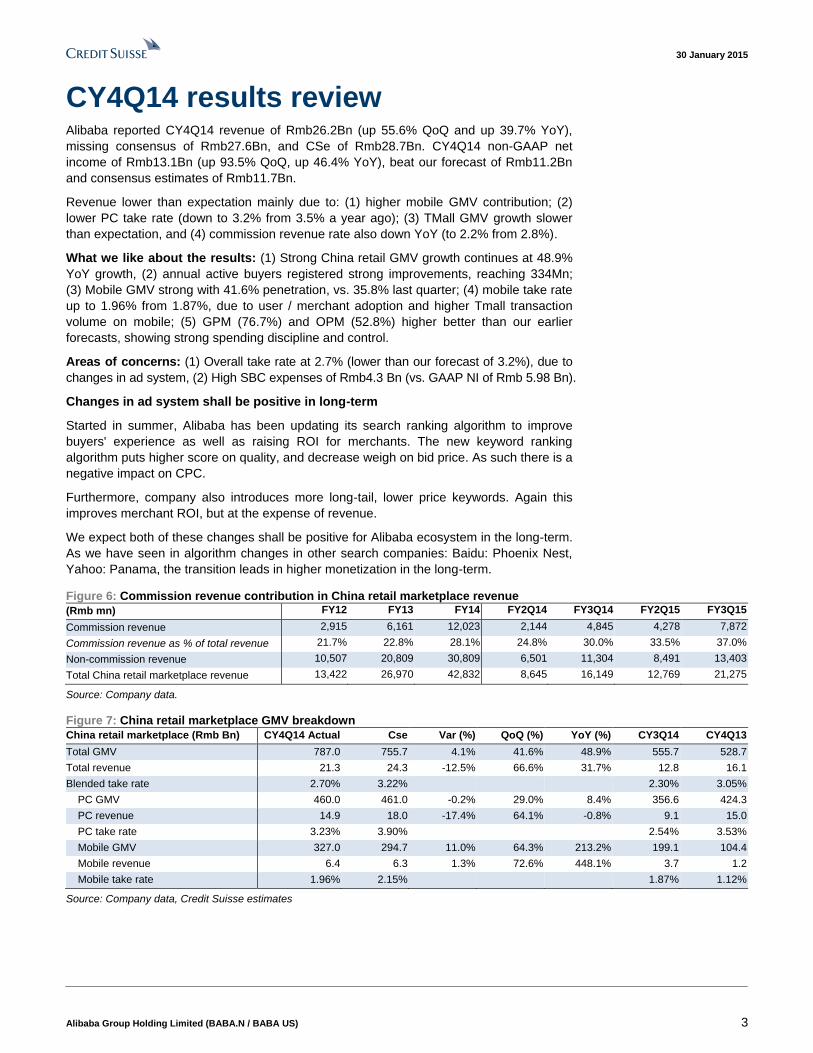
CY4Q14 results review Alibaba reported CY4Q14 revenue of Rmb26.2Bn (up 55.6% QoQ and up 39.7% YoY),
missing consensus of Rmb27.6Bn, and CSe of Rmb28.7Bn. CY4Q14 non-GAAP net
income of Rmb13.1Bn (up 93.5% QoQ, up 46.4% YoY), beat our forecast of Rmb11.2Bn
and consensus estimates of Rmb11.7Bn.
Revenue lower than expectation mainly due to: (1) higher mobile GMV contribution; (2)
lower PC take rate (down to 3.2% from 3.5% a year ago); (3) TMall GMV growth slower
than expectation, and (4) commission revenue rate also down YoY (to 2.2% from 2.8%).
What we like about the results: (1) Strong China retail GMV growth continues at 48.9%
YoY growth, (2) annual active buyers registered strong improvements, reaching 334Mn;
(3) Mobile GMV strong with 41.6% penetration, vs. 35.8% last quarter; (4) mobile take rate
up to 1.96% from 1.87%, due to user / merchant adoption and higher Tmall transaction
volume on mobile; (5) GPM (76.7%) and OPM (52.8%) higher better than our earlier
forecasts, showing strong spending discipline and control.
Areas of concerns: (1) Overall take rate at 2.7% (lower than our forecast of 3.2%), due to
changes in ad system, (2) High SBC expenses of Rmb4.3 Bn (vs. GAAP NI of Rmb 5.98 Bn).
Changes in ad system shall be positive in long-term
Started in summer, Alibaba has been updating its search ranking algorithm to improve
buyers' experience as well as raising ROI for merchants. The new keyword ranking
algorithm puts higher score on quality, and decrease weigh on bid price. As such there is a
negative impact on CPC.
Furthermore, company also introduces more long-tail, lower price keywords. Again this
improves merchant ROI, but at the expense of revenue.
We expect both of these changes shall be positive for Alibaba ecosystem in the long-term.
As we have seen in algorithm changes in other search companies: Baidu: Phoenix Nest,
Yahoo: Panama, the transition leads in higher monetization in the long-term.
Figure 6: Commission revenue contribution in China retail marketplace revenue
(Rmb mn) FY12 FY13 FY14 FY2Q14 FY3Q14 FY2Q15 FY3Q15
Commission revenue 2,915 6,161 12,023 2,144 4,845 4,278 7,872
Commission revenue as % of total revenue 21.7% 22.8% 28.1% 24.8% 30.0% 33.5% 37.0%
Non-commission revenue 10,507 20,809 30,809 6,501 11,304 8,491 13,403
Total China retail marketplace revenue 13,422 26,970 42,832 8,645 16,149 12,769 21,275
Source: Company data.
Figure 7: China retail marketplace GMV breakdown
China retail marketplace (Rmb Bn) CY4Q14 Actual Cse Var (%) QoQ (%) YoY (%) CY3Q14 CY4Q13
Total GMV 787.0 755.7 4.1% 41.6% 48.9% 555.7 528.7
Total revenue 21.3 24.3 -12.5% 66.6% 31.7% 12.8 16.1
Blended take rate 2.70% 3.22% 2.30% 3.05%
PC GMV 460.0 461.0 -0.2% 29.0% 8.4% 356.6 424.3
PC revenue 14.9 18.0 -17.4% 64.1% -0.8% 9.1 15.0
PC take rate 3.23% 3.90% 2.54% 3.53%
Mobile GMV 327.0 294.7 11.0% 64.3% 213.2% 199.1 104.4
Mobile revenue 6.4 6.3 1.3% 72.6% 448.1% 3.7 1.2
Mobile take rate 1.96% 2.15% 1.87% 1.12%
Source: Company data, Credit Suisse estimates

30 January 2015
Alibaba Group Holding Limited (BABA.N / BABA US) 4
Figure 8: Monetisation rate revision
Revised Prior
FY15E FY16E FY17E FY15E FY16E FY17E
Blended monetisation rate 2.42% 2.68% 2.91% 2.62% 2.84% 2.94%
PC monetisation rate 2.82% 3.07% 3.24% 3.10% 3.33% 3.30%
Mobile monetisation rate 1.79% 2.28% 2.66% 1.84% 2.33% 2.66%
Source: Company data, Credit Suisse estimates

30 January 2015
Alibaba Group Holding Limited (BABA.N / BABA US) 5
Maintain OUTPERFORM and new target price of US$113 Earnings revision
We revised up our FY15 by 6.2%, mainly due to stronger than expected CY4Q14 results.
For FY16, we revise down diluted EPS by 0.6%.
The revision is mainly driven by ~4% decline in revenue (with lower take rate) with slightly
higher overall GMV assumptions, driven by strong users growth in CY4Q14.
We also assumed better GPM and OPM. We expect the company to be more conservative
in spending than what we had previously expected.
Figure 9: Earnings revision
Revised Changes
Rmb Bn FY4Q15E FY1Q16E FY2015E FY2016E FY4Q15E FY1Q16E FY2015E FY2016E
Total Revenue 17.3 22.7 76.0 105.0 -5.4% -1.2% -4.4% -4.3%
Gross profit 12.0 16.2 56.2 74.9 -4.1% 0.2% -2.1% -3.1%
GPM (%) 69.5% 71.5% 74.0% 71.3%
Adj. Op Profit 7.1 10.4 36.2 48.8 -7.5% -0.7% -0.4% -4.9%
Adj. OPM (%) 41.3% 46.0% 47.6% 46.4%
Adj. EBITDA 8.5 11.9 40.7 55.4 -6.4% -0.4% -0.3% -3.9%
Adj. EBITDA (%) 49.1% 52.4% 53.5% 52.7%
Net Income (GAAP) 2.1 4.9 23.3 25.1 -60.2% -34.4% -19.8% -31.4%
NPM (%) 12.0% 21.4% 30.7% 23.9%
Adj. NI (ex-SBC) 7.0 9.8 34.0 45.6 -1.8% 2.5% 5.5% -2.0%
Adj. NPM (%) 40.5% 43.2% 44.8% 43.4%
Dil. EPS (Rmb) 0.80 1.86 9.11 9.51 -59.7% -33.5% -19.1% -30.4%
Dil. adj. EPS (Rmb) 2.69 3.75 13.33 17.31 -0.4% 3.9% 6.2% -0.6%
Source: Company data, Credit Suisse estimates
DCF valuation: New TP of US$113
We use DCF valuation as the key valuation methodology, as we see DCF captures the
longer-term growth opportunities of Alibaba. We assume ~20% growth over 2020-25, a
WACC of 11% and a 3% terminal growth rate. Our base-case DCF valuation yields a
target price of US$106 of its core business. By considering the value from Ant Financial
Services Company (US$17.5Bn) or US$6.7per share, we arrive at our final target price of
US$114 for the whole Alibaba business.
Our TP of US$113, implies 43.8x CY15E, 33.5x CY16E, and 26.8x CY17E dil adj EPS,
and market cap of US$338Bn.
Figure 10: Alibaba core business DCF model assumptions (base-case scenario)
Drivers FY15 FY16 FY17 FY18 FY19 FY20 FY21 FY22 FY23 FY24 FY25 FY26
Sales Growth 44.8% 38.1% 28.6% 22.9% 23.3% 20.7% 21.9% 20.7% 20.0% 19.5% 19.0% 19.0%
EBIT Margin 47.6% 46.4% 47.7% 49.1% 50.7% 51.7% 53.0% 54.2% 54.4% 54.7% 54.0% 54.0%
NOPAT Margin 22.2% 20.3% 22.6% 24.1% 26.3% 27.3% 28.8% 30.3% 30.7% 31.0% 31.3% 39.4%
Year end net fixed assets turns 6.0 6.3 6.6 7.0 7.7 8.5 9.7 11.3 13.4 16.5 20.9 20.0
Year end net working capital turns -32.7 -32.7 -30.1 -29.4 -33.7 -31.9 -30.0 -30.0 -29.9 -29.7 -29.5 (8.0)
Year end net other assets turns 0.8 1.2 1.5 1.8 2.3 2.7 3.3 4.0 4.8 5.7 6.8 11.0
Cash operating taxes as as % of EBIT 27.7% 30.8% 30.1% 30.6% 29.4% 29.9% 29.8% 29.0% 29.3% 29.6% 29.9% 27.0%
Source: Company data, Credit Suisse estimates

30 January 2015
Alibaba Group Holding Limited (BABA.N / BABA US) 6
Figure 11: Alibaba core business DCF sensitivity analysis
Terminal growth rate
Target price in US$ 0.0% 1% 2% 3.0% 4.0% 5% 6%
WACC (%)
8.0% 162.0 169.8 180.2 194.7 216.5 252.9 325.7
9.0% 136.0 140.7 146.8 154.8 166.1 183.0 211.2
10.0% 115.9 118.7 122.3 126.8 132.9 141.4 154.1
11.0% 99.9 101.6 103.6 106.2 109.5 113.9 120.0
12.0% 87.0 88.0 89.1 90.5 92.3 94.5 97.5
13.0% 76.5 77.0 77.5 78.2 79.1 80.1 81.5
Source: Company data, Credit Suisse estimates

30 January 2015
Alibaba Group Holding Limited (BABA.N / BABA US) 7
CY4Q14 earnings call summary Prepared remarks
SAIC white paper
Alibaba is a company with strong value and highest standard of ethics. We believed the
report was flawed, and incorrect. The "white paper" was unfair, and we prepared a formal
complaint against the SAIC. We still have a zero-tolerance policy on fake products. SAIC
has removed the "white paper" from the website now. Alibaba has never requested the
SAIC to delay the publication of any report.
GMV
GMV grew 49% YoY to Rmb787Bn and was up 42% QoQ. Active buyers in the last 12
months grew to 334Mn, up 45% YoY. Mobile MAUs grew to 265Mn in the month ended
December, a record high, net adds of 48Mn MAUs in two months' time.
Revenue
Revenue grew 40% YoY to Rmb26.2Bn and was up 56% QoQ. Non-GAAP EBITDA
margin was 58%, down from 60% in the year-ago period and up from 51% in the previous
quarter.
Take-rate:
Mobile monetization rate has continued to improve, but may not always be linear given the
seasonality and other factors that change each quarter. We continue to strongly believe
that the longer-term trend in mobile monetization is possible.
Discretionary spending on new initiatives will likely continue at similar or greater levels in
the following quarters.
OPEX:
R&D: we stopped paying royalty fees to Yahoo after our IPO in mid-September.
S&M: 1) consolidation of investee companies, such as UC and AutoNavi, 2) increase
spending in lower tier cities, 3) promotions of new business initiatives.
G&A: YoY decrease was mainly due to one-time equity-settled donation expense of
Rmb1.3Bn made in quarter ended December 31, 2013
CAPEX:
1) We incurred lower real estate related CapEx in this quarter; 2) non-real estate CapEx
decreased sequentially as we invested last quarter to build our infrastructure ahead the
peak shopping season of the year.
Q&A
Q: On take-rate, what is the driving factor? What was the rationale for the system
changes during the quarter?
A: 1) mobile shift; 2) PC P4P ranking mechanism changes to improve user experience.
Q: For the commission revenue, seems to come down as well YoY? Any category
changes?
A: Commission revenue weakness is due to some category mix changes.
Q: On SAIC, any impact on 1Q/near term?
A: We think the report is based on faulty methodology, so we're prepared to file official
complaint.
30 January 2015
Alibaba Group Holding Limited (BABA.N / BABA US) 8
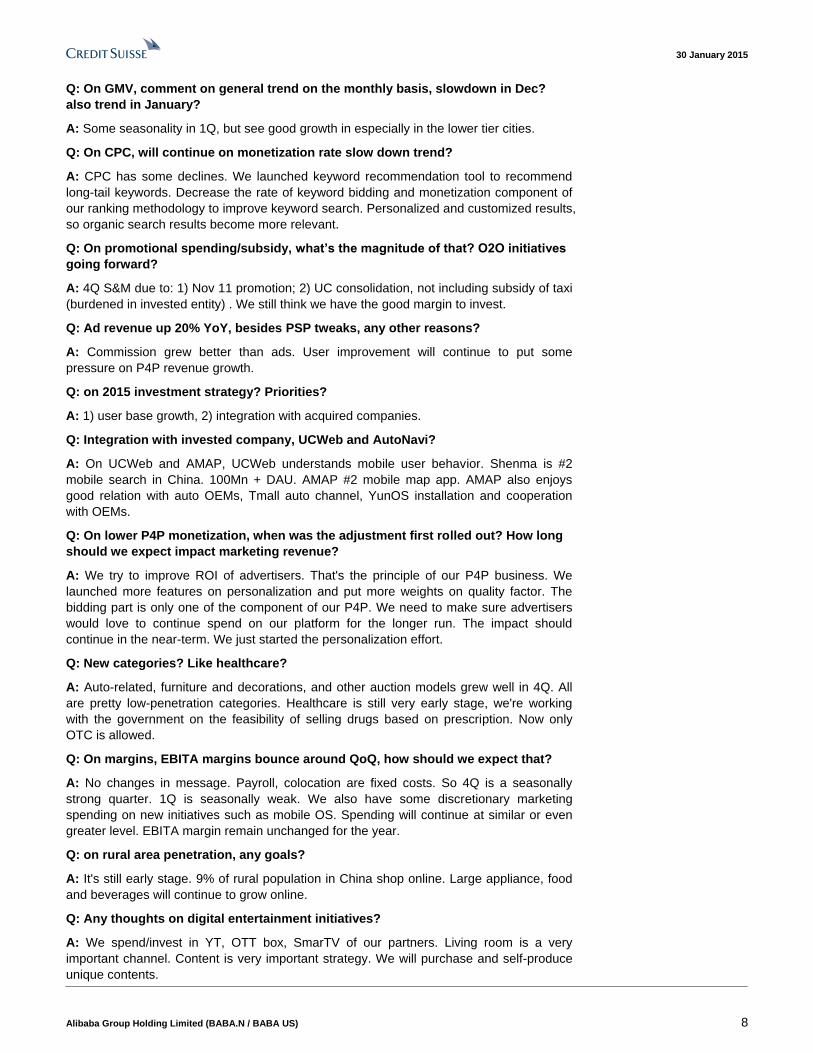
Q: On GMV, comment on general trend on the monthly basis, slowdown in Dec?
also trend in January?
A: Some seasonality in 1Q, but see good growth in especially in the lower tier cities.
Q: On CPC, will continue on monetization rate slow down trend?
A: CPC has some declines. We launched keyword recommendation tool to recommend
long-tail keywords. Decrease the rate of keyword bidding and monetization component of
our ranking methodology to improve keyword search. Personalized and customized results,
so organic search results become more relevant.
Q: On promotional spending/subsidy, what’s the magnitude of that? O2O initiatives
going forward?
A: 4Q S&M due to: 1) Nov 11 promotion; 2) UC consolidation, not including subsidy of taxi
(burdened in invested entity) . We still think we have the good margin to invest.
Q: Ad revenue up 20% YoY, besides PSP tweaks, any other reasons?
A: Commission grew better than ads. User improvement will continue to put some
pressure on P4P revenue growth.
Q: on 2015 investment strategy? Priorities?
A: 1) user base growth, 2) integration with acquired companies.
Q: Integration with invested company, UCWeb and AutoNavi?
A: On UCWeb and AMAP, UCWeb understands mobile user behavior. Shenma is #2
mobile search in China. 100Mn + DAU. AMAP #2 mobile map app. AMAP also enjoys
good relation with auto OEMs, Tmall auto channel, YunOS installation and cooperation
with OEMs.
Q: On lower P4P monetization, when was the adjustment first rolled out? How long
should we expect impact marketing revenue?
A: We try to improve ROI of advertisers. That's the principle of our P4P business. We
launched more features on personalization and put more weights on quality factor. The
bidding part is only one of the component of our P4P. We need to make sure advertisers
would love to continue spend on our platform for the longer run. The impact should
continue in the near-term. We just started the personalization effort.
Q: New categories? Like healthcare?
A: Auto-related, furniture and decorations, and other auction models grew well in 4Q. All
are pretty low-penetration categories. Healthcare is still very early stage, we're working
with the government on the feasibility of selling drugs based on prescription. Now only
OTC is allowed.
Q: On margins, EBITA margins bounce around QoQ, how should we expect that?
A: No changes in message. Payroll, colocation are fixed costs. So 4Q is a seasonally
strong quarter. 1Q is seasonally weak. We also have some discretionary marketing
spending on new initiatives such as mobile OS. Spending will continue at similar or even
greater level. EBITA margin remain unchanged for the year.
Q: on rural area penetration, any goals?
A: It's still early stage. 9% of rural population in China shop online. Large appliance, food
and beverages will continue to grow online.
Q: Any thoughts on digital entertainment initiatives?
A: We spend/invest in YT, OTT box, SmarTV of our partners. Living room is a very
important channel. Content is very important strategy. We will purchase and self-produce
unique contents.
30 January 2015
Alibaba Group Holding Limited (BABA.N / BABA US) 9
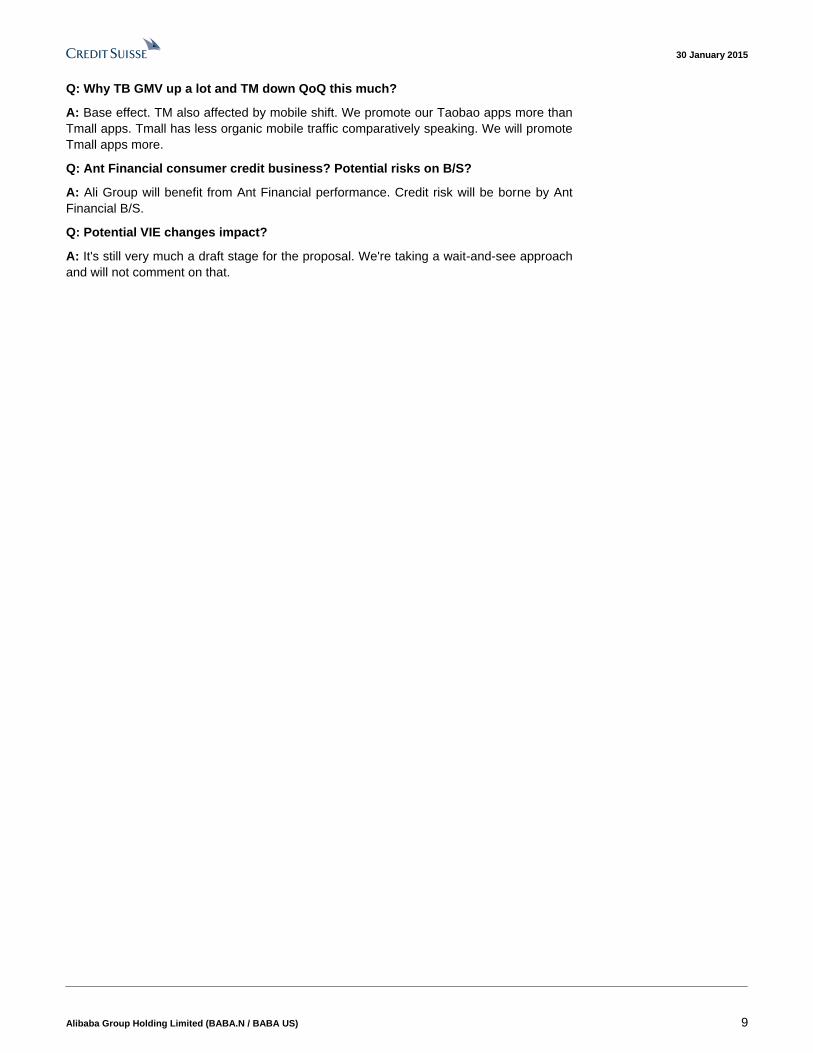
Q: Why TB GMV up a lot and TM down QoQ this much?
A: Base effect. TM also affected by mobile shift. We promote our Taobao apps more than
Tmall apps. Tmall has less organic mobile traffic comparatively speaking. We will promote
Tmall apps more.
Q: Ant Financial consumer credit business? Potential risks on B/S?
A: Ali Group will benefit from Ant Financial performance. Credit risk will be borne by Ant
Financial B/S.
Q: Potential VIE changes impact?
A: It's still very much a draft stage for the proposal. We're taking a wait-and-see approach
and will not comment on that.

30 January 2015
Alibaba Group Holding Limited (BABA.N / BABA US) 10
China SAIC blames Alibaba for failing to curb fakes According to people.com.cn and Bloomberg, Alibaba is blamed for failing to curb fakes on
its domestic online retail platform by SAIC of China in a white paper released on
Wednesday.
SAIC pointed out five major issues in the operation of Alibaba’s China online retail
platform:
1) Alibaba failed to employ strict entry qualification checking of retailers on its
platform;
2) Alibaba was unable to provide comprehensive anti-fake control on the products
sold on its platform;
3) Alibaba didn’t successfully manage to eliminate inappropriate sales and
advertisements on its platform;
4) Deficiencies in Alibaba’s credit rating system lead to fake transactions, lack of
faithful review, and potential issues in after-sales services;
5) Alibaba didn’t conduct effective internal control to avoid information leaking in the
quality inspection by government agencies.
Local SAIC agencies also commented that Alibaba should strictly comply with regulations,
and maintain normal order in its online retail platform.
Alibaba are required by SAIC to:
1) Cooperate with government agencies to enhance market supervision and improve
internal control;
2) Being practical in solving existing problems;
3) Proactive in information sharing, and build open, competitive and orderly online
platform;
4) Stick to principles and avoid being arrogant;
5) Keep honesty and self-disciplined in business operation;
6) Improve efficiency in internal management by leveraging information technology
Initial feedback from related parties in Alibaba are:
1) Alibaba has its own difficulties in anti-fake and credit control due to large in scale
and open platform;
2) Alibaba will proactively cooperate with government agencies to solve the existing
problems by enhancing internal control, building sample products inventory, and
strengthening anti-fake criteria;
3) Alibaba will enhance its management quality and provide support to the
supervision by government agencies.
4) Alibaba will strictly comply with regulations, and actively look for better solutions
on anti-fake and credit control issues.
5) Alibaba will establish effective communication channel with SAIC and its local
agencies in quality inspection.
Original report on people.com.cn (in Chinese):
http://finance.people.com.cn/n/2015/0128/c1004-26463776.html
30 January 2015
Alibaba Group Holding Limited (BABA.N / BABA US) 11
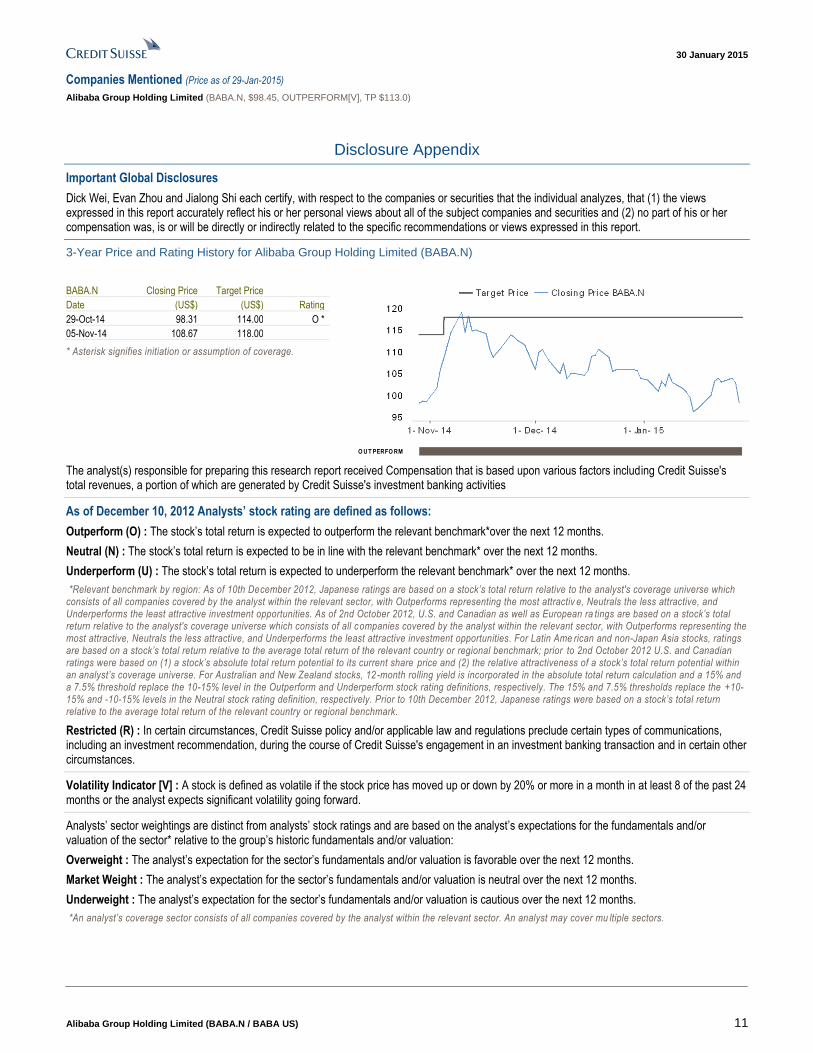
Companies Mentioned (Price as of 29-Jan-2015)
Alibaba Group Holding Limited (BABA.N, $98.45, OUTPERFORM[V], TP $113.0)
Disclosure Appendix
Important Global Disclosures
Dick Wei, Evan Zhou and Jialong Shi each certify, with respect to the companies or securities that the individual analyzes, that (1) the views expressed in this report accurately reflect his or her personal views about all of the subject companies and securities and (2) no part of his or her compensation was, is or will be directly or indirectly related to the specific recommendations or views expressed in this report.
3-Year Price and Rating History for Alibaba Group Holding Limited (BABA.N)
BABA.N Closing Price Target Price
Date (US$) (US$) Rating
29-Oct-14 98.31 114.00 O *
05-Nov-14 108.67 118.00
* Asterisk signifies initiation or assumption of coverage.
O U T PERFO RM
The analyst(s) responsible for preparing this research report received Compensation that is based upon various factors including Credit Suisse's total revenues, a portion of which are generated by Credit Suisse's investment banking activities
As of December 10, 2012 Analysts’ stock rating are defined as follows:
Outperform (O) : The stock’s total return is expected to outperform the relevant benchmark*over the next 12 months.
Neutral (N) : The stock’s total return is expected to be in line with the relevant benchmark* over the next 12 months.
Underperform (U) : The stock’s total return is expected to underperform the relevant benchmark* over the next 12 months.
*Relevant benchmark by region: As of 10th December 2012, Japanese ratings are based on a stock’s total return relative to the analyst's coverage universe which consists of all companies covered by the analyst within the relevant sector, with Outperforms representing the most attractiv e, Neutrals the less attractive, and Underperforms the least attractive investment opportunities. As of 2nd October 2012, U.S. and Canadian as well as European ra tings are based on a stock’s total return relative to the analyst's coverage universe which consists of all companies covered by the analyst within the relevant sector, with Outperforms representing the most attractive, Neutrals the less attractive, and Underperforms the least attractive investment opportunities. For Latin Ame rican and non-Japan Asia stocks, ratings are based on a stock’s total return relative to the average total return of the relevant country or regional benchmark; prior to 2nd October 2012 U.S. and Canadian ratings were based on (1) a stock’s absolute total return potential to its current share price and (2) the relative attractiveness of a stock’s total return potential within an analyst’s coverage universe. For Australian and New Zealand stocks, 12 -month rolling yield is incorporated in the absolute total return calculation and a 15% and a 7.5% threshold replace the 10-15% level in the Outperform and Underperform stock rating definitions, respectively. The 15% and 7.5% thresholds replace the +10-15% and -10-15% levels in the Neutral stock rating definition, respectively. Prior to 10th December 2012, Japanese ratings were based on a stock’s total return relative to the average total return of the relevant country or regional benchmark.
Restricted (R) : In certain circumstances, Credit Suisse policy and/or applicable law and regulations preclude certain types of communications, including an investment recommendation, during the course of Credit Suisse's engagement in an investment banking transaction and in certain other circumstances.
Volatility Indicator [V] : A stock is defined as volatile if the stock price has moved up or down by 20% or more in a month in at least 8 of the past 24 months or the analyst expects significant volatility going forward.
Analysts’ sector weightings are distinct from analysts’ stock ratings and are based on the analyst’s expectations for the fundamentals and/or valuation of the sector* relative to the group’s historic fundamentals and/or valuation:
Overweight : The analyst’s expectation for the sector’s fundamentals and/or valuation is favorable over the next 12 months.
Market Weight : The analyst’s expectation for the sector’s fundamentals and/or valuation is neutral over the next 12 months.
Underweight : The analyst’s expectation for the sector’s fundamentals and/or valuation is cautious over the next 12 months.
*An analyst’s coverage sector consists of all companies covered by the analyst within the relevant sector. An analyst may cover mu ltiple sectors.

30 January 2015
Alibaba Group Holding Limited (BABA.N / BABA US) 12
Credit Suisse's distribution of stock ratings (and banking clients) is:
Global Ratings Distribution
Rating Versus universe (%) Of which banking clients (%)
Outperform/Buy* 46% (54% banking clients)
Neutral/Hold* 38% (50% banking clients)
Underperform/Sell* 14% (44% banking clients)
Restricted 2%
*For purposes of the NYSE and NASD ratings distribution disclosure requirements, our stock ratings of Outperform, Neutral, and Underperform most closely correspond to Buy, Hold, and Sell, respectively; however, the meanings are not the same, as our stock ratings are determined on a relative basis. (Please refer to definitions above.) An investor's decision to buy or sell a security should be based on investment objectives, current holdings, and other individual factors.
Credit Suisse’s policy is to update research reports as it deems appropriate, based on developments with the subject company, the sector or the market that may have a material impact on the research views or opinions stated herein.
Credit Suisse's policy is only to publish investment research that is impartial, independent, clear, fair and not misleading. For more detail please refer to Credit Suisse's Policies for Managing Conflicts of Interest in connection with Investment Research: http://www.csfb.com/research-and-analytics/disclaimer/managing_conflicts_disclaimer.html
Credit Suisse does not provide any tax advice. Any statement herein regarding any US federal tax is not intended or written to be used, and cannot be used, by any taxpayer for the purposes of avoiding any penalties.
Price Target: (12 months) for Alibaba Group Holding Limited (BABA.N)
Method: We use DCF valuation as the key valuation methodology, as we see DCF captures the longer-term growth opportunities of Alibaba. We assume mid-teens growth rate from 2020- 2025, WACC of 11% and 3% terminal growth rate. Our base-case DCF valuation yields a target price of US$106 of its core business. By considering the potential upside from Ant Financial Services Company (US$17.5Bn), we arrive at our final target price of US$113 for the whole Alibaba business.
Risk: Risks that could impede achievement of our US$113 target price for Alibaba Group Holding Limited include: (1) Macro slowdown; (2) Slower-than-expected category expansion (medical, O2O local services) due to execution or competition; (3) Slower mobile traffic growth and monetization; and (4) Higher-than-expected investments in business initiatives.
Please refer to the firm's disclosure website at https://rave.credit-suisse.com/disclosures for the definitions of abbreviations typically used in the target price method and risk sections.
See the Companies Mentioned section for full company names
The subject company (BABA.N) currently is, or was during the 12-month period preceding the date of distribution of this report, a client of Credit Suisse.
Credit Suisse provided investment banking services to the subject company (BABA.N) within the past 12 months.
Credit Suisse has managed or co-managed a public offering of securities for the subject company (BABA.N) within the past 12 months.
Credit Suisse has received investment banking related compensation from the subject company (BABA.N) within the past 12 months
Credit Suisse expects to receive or intends to seek investment banking related compensation from the subject company (BABA.N) within the next 3 months.
As of the date of this report, Credit Suisse makes a market in the following subject companies (BABA.N).
Important Regional Disclosures
Singapore recipients should contact Credit Suisse AG, Singapore Branch for any matters arising from this research report.
The analyst(s) involved in the preparation of this report have not visited the material operations of the subject company (BABA.N) within the past 12 months
Restrictions on certain Canadian securities are indicated by the following abbreviations: NVS--Non-Voting shares; RVS--Restricted Voting Shares; SVS--Subordinate Voting Shares.
Individuals receiving this report from a Canadian investment dealer that is not affiliated with Credit Suisse should be advised that this report may not contain regulatory disclosures the non-affiliated Canadian investment dealer would be required to make if this were its own report.
For Credit Suisse Securities (Canada), Inc.'s policies and procedures regarding the dissemination of equity research, please visit http://www.csfb.com/legal_terms/canada_research_policy.shtml.
Credit Suisse has acted as lead manager or syndicate member in a public offering of securities for the subject company (BABA.N) within the past 3 years.
30 January 2015
Alibaba Group Holding Limited (BABA.N / BABA US) 13
As of the date of this report, Credit Suisse acts as a market maker or liquidity provider in the equities securities that are the subject of this report.
Principal is not guaranteed in the case of equities because equity prices are variable.
Commission is the commission rate or the amount agreed with a customer when setting up an account or at any time after that.
To the extent this is a report authored in whole or in part by a non-U.S. analyst and is made available in the U.S., the following are important disclosures regarding any non-U.S. analyst contributors: The non-U.S. research analysts listed below (if any) are not registered/qualified as research analysts with FINRA. The non-U.S. research analysts listed below may not be associated persons of CSSU and therefore may not be subject to the NASD Rule 2711 and NYSE Rule 472 restrictions on communications with a subject company, public appearances and trading securities held by a research analyst account.
Credit Suisse (Hong Kong) Limited .................................................................................................................... Dick Wei ; Evan Zhou ; Jialong Shi
For Credit Suisse disclosure information on other companies mentioned in this report, please visit the website at https://rave.credit-suisse.com/disclosures or call +1 (877) 291-2683.

30 January 2015
Alibaba Group Holding Limited (BABA.N / BABA US) 14
References in this report to Credit Suisse include all of the subsidiaries and affiliates of Credit Suisse operating under its investment banking division. For more information on our structure, please use the following link: https://www.credit-suisse.com/who_we_are/en/This report may contain material that is not directed to, or intended for distribution to or use by, any person or entity who is a citizen or resident of or located in any locality, state, country or other jurisdiction where such distribution, publication, availability or use would be contrary to law or regulation or which would subject Credit Suisse AG or its affiliates ("CS") to any registration or licensing requirement within such jurisdiction. All material presented in this report, unless specifically indicated otherwise, is under copyright to CS. None of the material, nor its content, nor any copy of it, may be altered in any way, transmitted to, copied or distributed to any other party, without the prior express written permission of CS. All trademarks, service marks and logos used in this report are trademarks or service marks or registered trademarks or service marks of CS or its affiliates. The information, tools and material presented in this report are provided to you for information purposes only and are not to be used or considered as an offer or the solicitation of an offer to sell or to buy or subscribe for securities or other financial instruments. CS may not have taken any steps to ensure that the securities referred to in this report are suitable for any particular investor. CS will not treat recipients of this report as its customers by virtue of their receiving this report. The investments and services contained or referred to in this report may not be suitable for you and it is recommended that you consult an independent investment advisor if you are in doubt about such investments or investment services. Nothing in this report constitutes investment, legal, accounting or tax advice, or a representation that any investment or strategy is suitable or appropriate to your individual circumstances, or otherwise constitutes a personal recommendation to you. CS does not advise on the tax consequences of investments and you are advised to contact an independent tax adviser. Please note in particular that the bases and levels of taxation may change. Information and opinions presented in this report have been obtained or derived from sources believed by CS to be reliable, but CS makes no representation as to their accuracy or completeness. CS accepts no liability for loss arising from the use of the material presented in this report, except that this exclusion of liability does not apply to the extent that such liability arises under specific statutes or regulations applicable to CS. This report is not to be relied upon in substitution for the exercise of independent judgment. CS may have issued, and may in the future issue, other communications that are inconsistent with, and reach different conclusions from, the information presented in this report. Those communications reflect the different assumptions, views and analytical methods of the analysts who prepared them and CS is under no obligation to ensure that such other communications are brought to the attention of any recipient of this report. Some investments referred to in this report will be offered solely by a single entity and in the case of some investments solely by CS, or an associate of CS or CS may be the only market maker in such investments. Past performance should not be taken as an indication or guarantee of future performance, and no representation or warranty, express or implied, is made regarding future performance. Information, opinions and estimates contained in this report reflect a judgment at its original date of publication by CS and are subject to change without notice. The price, value of and income from any of the securities or financial instruments mentioned in this report can fall as well as rise. The value of securities and financial instruments is subject to exchange rate fluctuation that may have a positive or adverse effect on the price or income of such securities or financial instruments. Investors in securities such as ADR's, the values of which are influenced by currency volatility, effectively assume this risk. Structured securities are complex instruments, typically involve a high degree of risk and are intended for sale only to sophisticated investors who are capable of understanding and assuming the risks involved. The market value of any structured security may be affected by changes in economic, financial and political factors (including, but not limited to, spot and forward interest and exchange rates), time to maturity, market conditions and volatility, and the credit quality of any issuer or reference issuer. Any investor interested in purchasing a structured product should conduct their own investigation and analysis of the product and consult with their own professional advisers as to the risks involved in making such a purchase. Some investments discussed in this report may have a high level of volatility. High volatility investments may experience sudden and large falls in their value causing losses when that investment is realised. Those losses may equal your original investment. Indeed, in the case of some investments the potential losses may exceed the amount of initial investment and, in such circumstances, you may be required to pay more money to support those losses. Income yields from investments may fluctuate and, in consequence, initial capital paid to make the investment may be used as part of that income yield. Some investments may not be readily realisable and it may be difficult to sell or realise those investments, similarly it may prove difficult for you to obtain reliable information about the value, or risks, to which such an investment is exposed. This report may provide the addresses of, or contain hyperlinks to, websites. Except to the extent to which the report refers to website material of CS, CS has not reviewed any such site and takes no responsibility for the content contained therein. Such address or hyperlink (including addresses or hyperlinks to CS's own website material) is provided solely for your convenience and information and the content of any such website does not in any way form part of this document. Accessing such website or following such link through this report or CS's website shall be at your own risk. This report is issued and distributed in Europe (except Switzerland) by Credit Suisse Securities (Europe) Limited, One Cabot Square, London E14 4QJ, England, which is authorised by the Prudential Regulation Authority and regulated by the Financial Conduct Authority and the Prudential Regulation Authority. This report is being distributed in Germany by Credit Suisse Securities (Europe) Limited Niederlassung Frankfurt am Main regulated by the Bundesanstalt fuer Finanzdienstleistungsaufsicht ("BaFin"). This report is being distributed in the United States and Canada by Credit Suisse Securities (USA) LLC; in Switzerland by Credit Suisse AG; in Brazil by Banco de Investimentos Credit Suisse (Brasil) S.A or its affiliates; in Mexico by Banco Credit Suisse (México), S.A. (transactions related to the securities mentioned in this report will only be effected in compliance with applicable regulation); in Japan by Credit Suisse Securities (Japan) Limited, Financial Instruments Firm, Director-General of Kanto Local Finance Bureau (Kinsho) No. 66, a member of Japan Securities Dealers Association, The Financial Futures Association of Japan, Japan Investment Advisers Association, Type II Financial Instruments Firms Association; elsewhere in Asia/ Pacific by whichever of the following is the appropriately authorised entity in the relevant jurisdiction: Credit Suisse (Hong Kong) Limited, Credit Suisse Equities (Australia) Limited, Credit Suisse Securities (Thailand) Limited, regulated by the Office of the Securities and Exchange Commission, Thailand, having registered address at 990 Abdulrahim Place, 27th Floor, Unit 2701, Rama IV Road, Silom, Bangrak, Bangkok 10500, Thailand, Tel. +66 2614 6000, Credit Suisse Securities (Malaysia) Sdn Bhd, Credit Suisse AG, Singapore Branch, Credit Suisse Securities (India) Private Limited (CIN no. U67120MH1996PTC104392) regulated by the Securities and Exchange Board of India (registration Nos. INB230970637; INF230970637; INB010970631; INF010970631), having registered address at 9th Floor, Ceejay House, Dr.A.B. Road, Worli, Mumbai - 18, India, T- +91-22 6777 3777, Credit Suisse Securities (Europe) Limited, Seoul Branch, Credit Suisse AG, Taipei Securities Branch, PT Credit Suisse Securities Indonesia, Credit Suisse Securities (Philippines ) Inc., and elsewhere in the world by the relevant authorised affiliate of the above. Research on Taiwanese securities produced by Credit Suisse AG, Taipei Securities Branch has been prepared by a registered Senior Business Person. Research provided to residents of Malaysia is authorised by the Head of Research for Credit Suisse Securities (Malaysia) Sdn Bhd, to whom they should direct any queries on +603 2723 2020. This report has been prepared and issued for distribution in Singapore to institutional investors, accredited investors and expert investors (each as defined under the Financial Advisers Regulations) only, and is also distributed by Credit Suisse AG, Singapore branch to overseas investors (as defined under the Financial Advisers Regulations). By virtue of your status as an institutional investor, accredited investor, expert investor or overseas investor, Credit Suisse AG, Singapore branch is exempted from complying with certain compliance requirements under the Financial Advisers Act, Chapter 110 of Singapore (the "FAA"), the Financial Advisers Regulations and the relevant Notices and Guidelines issued thereunder, in respect of any financial advisory service which Credit Suisse AG, Singapore branch may provide to you. This information is being distributed by Credit Suisse AG, Dubai Branch, duly licensed and regulated by the Dubai Financial Services Authority (DFSA), and is directed at Professional Clients or Market Counterparties only, as defined by the DFSA. The financial products or financial services to which the information relates will only be made available to a client who meets the regulatory criteria to be a Professional Client or Market Counterparty only, as defined by the DFSA, and is not intended for any other person. This research may not conform to Canadian disclosure requirements. In jurisdictions where CS is not already registered or licensed to trade in securities, transactions will only be effected in accordance with applicable securities legislation, which will vary from jurisdiction to jurisdiction and may require that the trade be made in accordance with applicable exemptions from registration or licensing requirements. Non-U.S. customers wishing to effect a transaction should contact a CS entity in their local jurisdiction unless governing law permits otherwise. U.S. customers wishing to effect a transaction should do so only by contacting a representative at Credit Suisse Securities (USA) LLC in the U.S. Please note that this research was originally prepared and issued by CS for distribution to their market professional and institutional investor customers. Recipients who are not market professional or institutional investor customers of CS should seek the advice of their independent financial advisor prior to taking any investment decision based on this report or for any necessary explanation of its contents. This research may relate to investments or services of a person outside of the UK or to other matters which are not authorised by the Prudential Regulation Authority and regulated by the Financial Conduct Authority and the Prudential Regulation Authority or in respect of which the protections of the Prudential Regulation Authority and Financial Conduct Authority for private customers and/or the UK compensation scheme may not be available, and further details as to where this may be the case are available upon request in respect of this report. CS may provide various services to US municipal entities or obligated persons ("municipalities"), including suggesting individual transactions or trades and entering into such transactions. Any services CS provides to municipalities are not viewed as "advice" within the meaning of Section 975 of the Dodd-Frank Wall Street Reform and Consumer Protection Act. CS is providing any such services and related information solely on an arm's length basis and not as an advisor or fiduciary to the municipality. In connection with the provision of the any such services, there is no agreement, direct or indirect, between any municipality (including the officials, management, employees or agents thereof) and CS for CS to provide advice to the municipality. Municipalities should consult with their financial, accounting and legal advisors regarding any such services provided by CS. In addition, CS is not acting for direct or indirect compensation to solicit the municipality on behalf of an unaffiliated broker, dealer, municipal securities dealer, municipal advisor, or investment adviser for the purpose of obtaining or retaining an engagement by the municipality for or in connection with Municipal Financial Products, the issuance of municipal securities, or of an investment adviser to provide investment advisory services to or on behalf of the municipality. If this report is being distributed by a financial institution other than Credit Suisse AG, or its affiliates, that financial institution is solely responsible for distribution. Clients of that institution should contact that institution to effect a transaction in the securities mentioned in this report or require further information. This report does not constitute investment advice by Credit Suisse to the clients of the distributing financial institution, and neither Credit Suisse AG, its affiliates, and their respective officers, directors and employees accept any liability whatsoever for any direct or consequential loss arising from their use of this report or its content. Principal is not guaranteed. Commission is the commission rate or the amount agreed with a customer when setting up an account or at any time after that.
Copyright © 2015 CREDIT SUISSE AG and/or its affiliates. All rights reserved.
Investment principal on bonds can be eroded depending on sale price or market price. In addition, there are bonds on which investment principal can be eroded due to changes in redemption amounts. Care is required when investing in such instruments. When you purchase non-listed Japanese fixed income securities (Japanese government bonds, Japanese municipal bonds, Japanese government guaranteed bonds, Japanese corporate bonds) from CS as a seller, you will be requested to pay the purchase price only.
IT0347.doc