a–liated firms and financial support: evidence from indian
TRANSCRIPT

Affiliated Firms and Financial Support: Evidence
from Indian Business Groups∗
Radhakrishnan Gopalan
Vikram Nanda
Amit Seru
September, 2006
∗Acknowledgements: We thank Marianne Bertrand, Sreedhar Bharath, Sugato Bhattacharyya, Anusha Chari,
Sandeep Dahiya, John DiNardo, Serdar Dinc, Mara Faccio, Lily Fang, Florian Heider, Marcin Kacperczyk, Ronald
Masulis, Atif Mian, Sendhil Mullainathan, S. Abraham Ravid, Tyler Shumway, Jan Svejnar, Anjan Thakor, Luigi
Zingales, an anonymous referee and the seminar participants at EFA 2004 Meeting in Maastricht, EFMA 2004
Meeting in Basel, FMA 2004 Meeting in New Orleans, Financial Market Development in Emerging and Transition
Economies 2003 Conference in India, Global Finance 2004 Conference in Las Vegas, WFA 2005 meetings in
Portland, HKUST 2005 Finance Symposium in Hong Kong, FIRS 2006 Conference in China and the Ross School of
Business at the University of Michigan for helpful comments and suggestions. The first and the third authors thank
Mitsui Life Finance Center for financial support. We also thank the William Davidson Institute and the Center
for International Business Education at the University of Michigan for acquiring the Prowess data set. The first
and third authors are from Ross School of Business at the University of Michigan; e-mail: [email protected],
[email protected]. The second author is from W.P. Carey School of Business at Arizona State University; email:
[email protected]. Contact Address: W.P. Carey School of Business, Arizona State University, Tempe,
AZ 85287, USA. Phone: 480.965.8299. This is a substantially revised version of the paper circulated previously
with title “Reputation and Spillovers: Evidence from Indian Business Groups”. All remaining errors are our
responsibility.

Affiliated Firms and Financial Support: Evidencefrom Indian Business Groups
Abstract
We investigate the functioning of internal capital markets in Indian Business Groups. We document that
intra-group loans are an important means of transferring cash across group firms and that such transfers
are typically used to support the financially weaker firms. Groups significantly increase the extent of
loans when member firms are hit with a negative earnings shock. Consistent with a support motive,
loans tend to be made on favorable terms – typically at zero interest – and loan inflows significantly
reduce the bankruptcy probability. Loans are not, in general, used to fund investment opportunities or
to tunnel resources. Evidence suggests that an important reason for support may be to avoid group firm
default and consequent negative spillovers to the group. The first bankruptcy in a group is followed by a
significant drop in the amount of external finance raised, a discontinuous drop in investments and profits,
and an increase in the bankruptcy probability of other healthy firms in the group. Moreover, consistent
with spillovers on account of negative information, we find that consequences are more severe for firms
with closer managerial links to the bankrupt firm.
1

I. Introduction
The legal systems in emerging economies are weak and ineffectual in protecting investor rights.
Evidence suggests that the absence of adequate legal safeguards makes it more onerous for firms
to raise external financing (La Porta et al., 1998). In such environments, it is observed that
firms are often organized into business groups, which comprise of a set of firms managed by
a common group of insiders. These groups typically have significant operational and financial
inter-linkages. Prior research on groups has highlighted their role in sharing risk among member
firms (Khanna and Yafeh, 2004) and in helping member firms overcome constraints on raising
external capital (Hoshi, Kashyap and Scharfstein, 1991). Research on financial linkages among
group firms – a type of internal capital market – has, however, been hampered because of the
difficulty in observing the flows between firms. We contribute to this literature by analyzing the
nature and rationale for the flow of funds across Indian business group firms.
Our use of Indian business group data is motivated by two important considerations. First,
the Indian accounting standards specifically require firms to provide details about funds flow
among group firms and this enables us to directly observe the functioning of the internal capital
market. Our analysis indicates that intra-group flows are significant among Indian business
groups and intra-group loans are an important means of such flows. For instance, group loan
inflows, on average, constitute 59% of operating profits in the year a firm receives loans. This is
in line with prior literature which suggests that these loans are the dominant observable channel
through which Indian groups transfer cash across member firms (Khanna and Palepu, 2000).
In our empirical analysis, we attempt to understand the working of the internal capital market
by analyzing these intra-group loans. Second, we have detailed hand collected data on firm
bankruptcies from India. This provides us a proxy for default by a group firm and allows us to
investigate the importance of intra group flows in avoiding default. The bankruptcy data also
allows us to investigate the impact of default by a group firm on the rest of the group.
In general, there are three broad, non-mutually exclusive, motives for the transfer of resources
across group firms. First, groups may use the cash for financing profitable new investment
opportunities. As has been argued in the case of diversified, multi-division firms in the U.S., an
internal capital market can economize on the costs of raising external capital (see Stein, 2003
and cites therein). Second, intra-group flows may be used to support member firms in financial
difficulty so as to avoid default. Business group insiders may seek to protect the value of their
equity stake in the firm. They may be loath to lose their private control benefits from the firm
that becomes bankrupt. They may also be concerned about the negative signal about the group
from the default by a member firm. Finally, a third use of intra-group flows may be to enable
2

the insider to steal resources from outside investors by tunneling cash out of firms with low
insider holding and into firms with high insider holding. Bertrand et. al., 2001 provide indirect
evidence of such tunneling in business groups.
In our empirical analysis we carry out a number of tests to examine the extent to which these
different motives account for the pattern of intra-group loans in Indian business groups. For this
purpose we study the characteristics of firms that provide and receive group loans and examine
the time series variation in loans. The main providers of group loans, as we might expect, are
firms that are larger, more profitable and with more tangible assets. External borrowing is
the dominant source of financing for intra-group loans. The recipients of group loans tend to
be firms that have lower profitability, higher leverage, lower asset tangibility and high insider
holding.
Our evidence indicates that groups extend loans to financially weaker firms and significantly
increase the extent of loans when member firms are hit with a negative earnings shock. More-
over, groups provide more loans to firms with higher insider holding. On the other hand, there
is little evidence for group loans being a means of financing investment opportunities. Large
recipients of group loans significantly under perform – in terms of both stock returns and operat-
ing performance – after receiving group loans. This casts further doubt on whether group loans
are used to finance profitable investment opportunities on a stand alone basis. There is little
evidence in favor of tunneling either. There is, for instance, no increase in group loan outflows
from low insider ownership firms that experience a positive earnings shock – which would be
expected to occur if group loans were being used to tunnel cash.
If group support is effective in preventing firm default, then group firms are likely to have
lower bankruptcy probability than stand alone firms. Consistent with this prediction, we find
a significant difference in the failure rates of stand alone firms and firms from groups with no
prior bankruptcy (henceforth, solvent groups) – the difference arising primarily on account of
intra-group loan inflows. Specifically, a solvent group firm with sample mean characteristics has
a 34.5% lower probability of becoming bankrupt in the following year, compared to a stand alone
firm. Our analysis indicates that the first firm in a group becomes bankrupt when it experiences
severe negative shocks to its profitability – shocks large in comparison to the total equity value
of the other firms in the group.
To provide some direct evidence on the support motive of group loans, we analyze the
terms for a random sub-sample of group loans. We find that the loans are made on terms more
favorable than those of comparable market loans – consistent with the loans being used to provide
subsidized support. On average, firms receive group loans at 10% below the corresponding
3

market borrowing rate. Further, a large proportion of loans (>80%) have no stipulated interest
payment at all.
We also examine why groups provide support to weak member firms. As noted earlier,
there are different (non-mutually exclusive) motives for group support. One motive influencing
support might be group insiders’ equity stake. We find evidence consistent with this motive –
groups tend to provide greater support to firms with larger insider ownership and, controlling
for firm financials, firms with higher insider ownership are less likely to go bankrupt. A second
reason for insiders to provide support might be concern about a dilution in private benefits
after firm bankruptcy, on account of increased monitoring by lenders. A caveat here is that the
bankruptcy regime in India during the sample period favored management over creditors – with
cessation of payments to lenders and restrictions on lenders in taking possession of collateral
(Goswami, 1996).1 Hence, bankruptcy may only moderately curb the ability of insiders to derive
private benefits.
A third reason is that groups may provide support if they are concerned about revealing
negative information about the group, especially to external capital providers. The informa-
tion may be about the group insider’s unobserved wealth, the group’s future growth prospects
and/or about the group’s reputation of being a reliable, high quality borrower. Such negative
information may make it difficult for other firms in the group to raise subsequent external capi-
tal, further damaging the group’s investment prospects and the solvency of the remaining firms.
Our evidence shows that there are significant negative spillovers after the first bankruptcy in the
group. We find strong evidence of credit rationing after the first bankruptcy. In particular, our
estimates indicate that the outside debt financing to the healthy firms in the group is reduced by
at least 21%. There is also a discontinuous fall – beyond any expected decline based on industry
performance or past performance – in investments (45%) and profitability (32%) of group firms
after the first bankruptcy. The level of group support drops and, controlling for financials, there
is a significant increase (53%) in the bankruptcy probability of the other firms in the group. Our
tests indicate that non-information related factors such as geographic and/or industry proximity
of a firm to the bankrupt firm and customer-supplier relationships between the bankrupt firm
and other group firms are unlikely to explain the negative spillovers. A caveat to note is that
while our evidence is generally consistent with external financiers rationing credit to the group
and the consequent adverse effects, they are only suggestive in nature as we cannot rule out
the possibility of the insider declaring bankruptcy when he expects the group performance to
decline.1Interestingly, in an attempt to make bankruptcy less attractive for management, a new law was introduced
in 2002, making it easier for lenders to take possession of the collateral.
4

We also investigate some specific predictions about the nature of the spillover costs. First,
using detailed data on the board of directors of individual firms to identify firms with direct
managerial links to the bankrupt firm, we find that the spillovers are significantly stronger for
group firms that have closer managerial connections – and, hence, a firmer connection in terms
of economic prospects and reputation – to the bankrupt firm. Second, consistent with spillovers
arising due to credit rationing, we find that these effects are stronger in firms that depend more
on external finance – as identified by an exogenous measure of financial dependence (Rajan and
Zingales, 1998).
Our paper contributes to different strands of the literature. First, it contributes to the
literature on business groups by documenting certain benefits and costs of the group structure.
Existing research on business groups documents a number of benefits and costs of the group
structure. Khanna and Palepu, 2000, Van der Molen and Gangopadhyay, 2003 and Shin and
Park, 1999 examine the role of the group internal capital markets in improving group firms’
access to external finance. The literature also discusses risk sharing across group firms (Khanna
and Yafeh, 2004; Kali, 2003). For instance, Khanna and Yafeh, 2004 show that Indian business
groups use intra-group loans to smooth liquidity across firms. Our paper suggests that providing
support to member firms is the primary motivation for these loan transfers. More broadly, it
contributes to the literature on benefits of internal capital markets. However, in contrast to
conglomerates in the U.S (e.g., Shin and Stulz, 1999) or Japanese Kereitsus (Hoshi, Kayshap
and Scharfstein, 1991), we find that internal capital markets in our sample are largely used to
support member firms in trouble. An advantage of our analysis is that we rely on direct internal
transactions rather than indirectly relying on an investment-cash flow sensitivity approach (e.g,
Hoshi, Kayshap and Scharfstein, 1991) about which some doubts have been raised (Kaplan and
Zingales, 2000).
On the negative side, the group structure has been argued to exacerbate agency conflicts
between insiders and minority shareholders (Claessens et al., 2000 show this for group firms
in East Asia). Johnson et al., 2000 and Bertrand et al., 2002 similarly view groups as poorly
protecting property rights and facilitating ‘tunneling’ of funds from minority shareholders to the
group insiders. In a paper related to our study, Friedman, Johnson, and Mitton, 2003 argue that
group insiders may “prop” member firms in distress so as to tunnel their resources in better
times.2 Similar to Friedman, Johnson, and Mitton, 2003, we also argue that group insiders
support member firms in times of distress – but the incentives of insiders to support is different
in our case. Our analysis suggests that the group supports member firms, at least in part, out2A similar point is also made by La Porta, Lopez-de-Silanes, and Zamarripa, 2003, who study loans made by
banks to firms affiliated with their owners.
5

of concern about negative spillovers on the rest of the group. Finally, our paper also contributes
to the nascent literature on bankruptcy in emerging economies and documents the importance
of insider cash flow rights and group affiliation in predicting firm bankruptcy.
The rest of the paper is organized as follows: In Section II we discuss our data and present
descriptive statistics. In Section III, we analyze the motives for group loan flow while in Sec-
tion IV, we investigate the potential reasons for groups to support member firms. Section V
concludes.
II. Data and Summary Statistics
II.A Data
We use two main sources of data for our empirical analysis. Our first source of data is Prowess, a
database maintained by CMIE, Center for Monitoring the Indian Economy. Prowess has annual
financial data of private and public Indian firms starting from 1989. While the coverage for
public firms is comprehensive (due to reporting requirements), the coverage for private firms is
limited. We collect information under five broad categories from Prowess: Financials from the
annual reports, insider cashflow rights from the latest company disclosure filing, group affiliation,
industry affiliation and share price. We adopt Prowess’s group classification for identifying group
affiliation. This group affiliation has been previously used in Khanna & Palepu, 2000, Bertrand
et al., 2002 and other papers. Prowess’s classification is based on a continuous monitoring of
company announcements and qualitative understanding of group wise behavior of individual
firms and is not solely based on equity ownership. Such broad based classification, as against a
narrow equity centered classification, is intended to be more representative of group affiliation.
For identifying industry affiliation, we use information on the principal line of activity of the
firm. We then classify firms into industries at a level equivalent to 4 digit SIC. Our classification
yields data on firms from 95 industries. Based on the identity of controlling shareholder, Prowess
classifies firms into: (i) Indian Private Sector, (ii) Government Sector and (iii) Foreign and Joint
Ventures. Indian private sector firms are further categorized into stand alone and group firms.
For our analysis we use an (un-balanced) panel of all Indian private sector firms in Prowess, with
positive sales during any of the years 1989-2001. For the empirical analysis requiring market
values, the sample is restricted to 1992-2001 since the market price data in Prowess starts in
1992.
Our second source of data is a unique hand-collected list of all Indian firms that sought
bankruptcy protection from the Board of Industrial and Financial Reconstruction (BIFR) during
6

the 1989-2001 period. BIFR is a quasi-judicial authority and functions as the official bankruptcy
court. A brief write-up of the Indian bankruptcy regime in effect over the sample period is
provided in Appendix B. Our list from BIFR contains information on the name of the firm and
the date it was referred to the bankruptcy court. To construct our sample from this population,
we do a time intensive name match of firms in the BIFR list with the list of Indian private sector
firms in Prowess. Our final sample includes 266 group (24% of all group firms) and 558 stand
alone firms (19.1% of all standalone firms) that become bankrupt during the sample period.
The bankruptcy code in India permits firm managers to stay in control of their firms during
the bankruptcy process and the firms continue to operate and release audited results. Thus,
financial data on the bankrupt firms is available even after they are referred to the bankruptcy
court. It is worth noting that the number of bankrupt firms in our study is greater than most
studies on firm bankruptcies in the US or in other emerging markets.
II.B Summary Statistics
In Table I, we provide the descriptive statistics for our sample. All the nominal values are
deflated by the Consumer Price Index values provided on a Government of India web-site.
Column (1) gives the summary statistics for the full sample while Columns (2) and (3) provide
similar statistics for group firms and bankrupt firms in the sample respectively. Columns (1)
and (2) indicate that, on average, group firms are larger, more profitable and older than stand-
alone firms.3 Comparing Columns (1) and (3), we observe that the average bankrupt firm is
considerably smaller and less profitable than an average sample firm. Not surprisingly, the
debt to total assets ratio is much higher for the bankrupt firms than for the non-bankrupt
firms. Prowess does not provide a direct measure of insider holding and in our analysis we rely
primarily on the percentage shareholding of all the directors of the firm (Director) as the proxy
for insider cash flow rights. Bertrand et al., 2002 use the same measure and we draw attention
to their detailed discussion about this measure.4 An important caveat, as noted in Bertrand et
al., 2002, is that this measure of insider holding is likely to be noisy. To moderate the influence
of noise, in some regression specifications – instead of the continuous measure – we employ a
dummy variable Low Director to identify firms with below median director holding in a group.3This follows from the fact that Column (1) reports medians for the combined sample of group and stand
alone firms. In unreported tests we find that the differences in characteristics between group and stand alone
firms highlighted here are robust to controlling for industry and time effects.4Prowess has the following classification of shareholders: Directors, Indian Financial Institutions, Other Cor-
porates, Foreign Institutional Investors and Other Public. Another proxy for insider cash flow rights used by
Bertrand et al., 2002 is the shareholding of Other Public Shareholders. We repeat our analysis using this measure
and obtain results that are qualitatively similar to the ones reported.
7

Table I shows that the median director holding in bankrupt firms is much lower than in group
firms overall. Our sample has about 40, 500 firm-year observations with 28, 500 stand alone
firm-year observations and 12, 000 group firm-year observations.5 The number of observations
for the different tests vary due to missing data.
III. Internal Capital Markets in Business Groups
In this section, we discuss the main results of our paper. The discussion is divided into four
subsections. In subsection A, we discuss the importance and significance of intra-group loans
among Indian Business Groups. Subsection B, examines the use of group loans by analyzing
providers and receivers of loans and the flow of group loans in response to earnings shocks. Sub-
section C investigates the role of group loans in alleviating bankruptcy risk while, in subsection
D, the terms of a random sample of group loans are analyzed.
III.A Intra-Group Loans: Importance and Possible Uses
While groups can use either equity or debt to transfer funds across group firms, Indian business
groups typically use subordinated intra-group loans as a means of intra-group transfer (Khanna
and Palepu, 2000).6 Descriptive statistics about group loans in our sample shows that there is a
significant transfer of resources across group firms through these loans. Note that since Indian
accounting standards require firms to provide details of both the inflow and outflow of group
loans from each firm, we are able to observe direct data on internal transactions. Specifically,
Table II provides information on loans made to and received by group firms in our sample.
As indicated, the magnitude of group loans is economically significant, with group loan inflows
constituting 59% of EBIDTA and 86% of the interest payments on average for receiving firms
(in the year a firm receives loans). On average about 13% of the firms in a group are net
receivers of group loans (i.e., net intra-group loans are positive) while 35% are net providers. In
our empirical analysis, we will attempt to understand the working of the internal capital market
inside Indian business groups by analyzing the pattern, characteristics and impact of intra-group
loan flows.5Note that the fraction of group firms that become bankrupt is higher than the fraction of stand alone firms
that become bankrupt. As we show later, this unconditional comparison of bankruptcy probability between group
and stand alone firms masks the dynamic nature of the bankruptcy risk of group firms.6In the data we also observe intra-group equity outflows. Since these are smaller in comparison to intra-group
loan flows, in our analysis, we add them to the group loan outflows and refer to the composite measure as group
loan outflows.
8

In general, there are three broad, non-exclusive, motives for the transfer of resources among
group firms: (i) Financing profitable new investment opportunities within the group; (ii) Sup-
porting member firms in financial difficulty and/or (iii) Diversion of resources by tunneling funds
out of firms with low insider holding into firms with high insider holding as has been suggested
by Bertrand et al., 2002. We now elaborate on the first two motives in more detail.
The first motive refers to the usual rationale for internal capital markets, such as in the case
of multi-divisional firms in the U.S. It has been argued that a significant benefit of a diversified,
multi-division firm is that it economizes on the costs of raising external capital (for an extensive
survey see Stein, 2003 and cites therein). The reason is that, relative to an external market,
corporate headquarters may more efficiently re-allocate resources internally between the firm’s
divisions in response to investment opportunities.7 In less developed financial markets, the
cost of accessing external capital may be relatively high, suggesting the possibility of significant
benefits from relying on internal capital markets to fund investment opportunities within the
group.
The second motive may be driven by the unwillingness of groups to let a member firm go
bankrupt – even when support is costly. There may be several reasons for this. Group insiders
may provide subsidized support to save their equity stake in the firm. For instance, even if
group loans are negative NPV in isolation, they may be positive NPV for the group insiders on
account of the benefit to their equity stake. A default could also increase the monitoring of the
firm by lenders and thereby, hamper the ability of insiders to obtain private benefits, such as
perquisite consumption. This would incentivize insiders to support weaker member firms and
prevent their default. Finally, group insiders may wish to avoid the negative signal about future
prospects and/or damage to their reputation – especially to providers of external capital– that
may result from a group firm default.8
In our empirical analysis we will carry out a number of tests to examine the extent to which
these three motives – investments, support and tunneling – account for the pattern of intra-
group loans in business groups. Overall, as we will see, the evidence indicates that not only are
intra-group loans used to provide support – but, interestingly, this appears to be the primary
function of these loans.7Evidence suggests that U.S. conglomerates move resources among divisions in response to investment oppor-
tunities, though there are questions about the efficiency of internal resource allocations.8See, for example, the borrower reputation model developed in Diamond, 1989
9

III.B What Are Group Loans Used For?
In this section, we study the characteristics of firms that provide and receive group loans and
examine the time series variation in the loans in response to earnings shocks. These tests help
us identify the main purpose of group loans.
III.B.1 Providers and Receivers of Group Loans
To understand the use of intra group loans, we first examine the characteristics of firms that are
the largest providers of loans within a group. Specifically, in Panel A of Table III, we estimate
the following model:
Prob (Providerit = 1) = Φ
(γFirm Financialsit−1 + Group Fixed Effects
+ Industry Fixed Effects + Time Fixed Effects
), (E-1)
where Φ denotes the logit distribution function and the dependent variable is Providerit. This
variable takes a value 1 for firm i at time t if that firm falls within the top 75th percentile in
terms of the amount of group loans provided to other firms in the group, and 0 otherwise. Firm
financials are Size in Column (1), EBIDTA/TA in Column (2), Tangibility in Column (3) and
Low Director in Column (4). In Column (5), we include all the financials together. Size is the
log of book value of total assets and Low Director is a dummy variable that identifies firms with
below median insider holding in the group. We use Low Director to reduce the noise in our
insider holding measure. The standard errors reported in the table are robust.9 All regressions
are estimated with group, industry and time fixed effects. For convenience, the definitions of
the variables used in our analysis are provided in Appendix A.
Our estimates show that intra-group loans are provided by firms that are larger, more prof-
itable, and have more tangible assets. These results are consistent with group loans serving to
transfer cash from firms that are doing well and are in a better position to borrow from external
markets. The coefficient estimate on Low Director is insignificant and suggests that low insider
holding firms are typically not the large providers of group loans – as one might suspect if the
main purpose of group loans is to transfer cash from out of low insider holding firms (Bertrand
et al., 2002).
In unreported tests, we attempt to identify how the providers finance loans. To finance
group loans, providers can rely on either external borrowing, external equity or internal cash
that they generate. Identifying the dominant source, while interesting in itself, can also help us9Unless mentioned, we correct the standard errors for heteroscedasticity and autocorrelation in the panel in
all subsequent OLS regressions.
10

understand how the flow of intra-group loans might be affected by a potential loss of access to
external sources of finance. In particular, if group loans are primarily financed using external
sources, then a loss of access to these sources – say, because of a negative signal about group
prospects – could adversely affect the provision of intra-group loans. On the other hand, if
internal cash is the primary means of financing, then a lost of access to external sources of
finance may not significantly impact group loan activity. Our regression results (not reported)
indicate that though all the three sources contribute to the funding of intra-group loans, external
borrowing is, by far, the dominant source. It is estimated that a $1 increase in gross loan outflows
is financed by $0.76 of external debt, $0.08 of outside equity and the remainder by internal cash.
In the next set of tests, we identify the characteristics of firms that receive group loans.
If intra-group loans are used as a means of support, then we expect greater loan provision to
the less profitable and high leverage firms in a group – since these firms are likely to be at a
greater risk of bankruptcy. Group firms with more tangible assets are in a better position to
raise external finance and may, therefore, require and receive fewer group loans. Alternatively,
if an important use of group loans is to exploit profitable investment opportunities (motive (i)),
we would expect greater loan inflow to firms with more investment opportunities and to firms
with investment expenditures that are large in comparison to internal cash generated. If groups
are more likely to finance investments or provide support to high insider holding firms (motives
(i) and (ii)), or to tunnel resources into firms with high insider holdings (motive (iii)), then we
expect net loan inflow to be positively related to insider holding in the firm. We now test for
the existence of such intra-group loan patterns.
To identify the characteristics of group loan receivers, in Panel B of Table III, we examine
the variation of net intra-group loans with firm characteristics. Specifically, we estimate the
following model for group firms:
yit =
(α0 + β1Xit + γControlsit + Group Fixed Effects
+ Industry Fixed Effects + Time Fixed Effects
), (E-2)
where the dependent variable y is the ratio of net intra-group loans received to total assets
(Group Loans/TA). X is EBIDTA/TA in Column (1), Debt/TA in Column (2), Tangibility in
Column (3), Market to Book in Column (4), Investment/Cash Flow in Column (5) and Low
Director in Column (6). Tangibility is a measure of the firm’s tangible assets and is measured
as the ratio of book value of net property plant and equipment to the book value of total assets.
Market to Book is a measure of investment opportunities and is the ratio of market value of
total assets to the book value of total assets. Investment/Cash Flow is a measure of firm’s
investments relative to the amount of internal cash generated and is equal to the ratio of the
annual investment in fixed assets to the total cash flow from operations. Other controls include
11

Size, and Age, measured as the firm’s age since incorporation. The standard errors are corrected
for heteroscedasticity and autocorrelation (AR-1) in the panel. To control for any time invariant
group characteristics, we estimate our regressions with group fixed effects besides industry and
time fixed effects. We are unable to use firm fixed effects since Prowess provides only the most
recent information on Director.
From Panel B in Table III it is clear that, consistent with group loans being a means of
supporting the weak firms in the group, groups provide more loans to member firms that have
higher leverage and lower profitability. Firms with higher asset tangibility receive less in loans
from the group. In unreported regressions we find that firms with more tangible assets receive
more external debt financing, suggesting that group loans may be a substitute when external fi-
nancing is more difficult to obtain. For robustness, in Column (7), we include all the explanatory
variables and get consistent results. Examining the estimates on Market to Book and Invest-
ment/Cash Flow, it is clear that group loans are not likely to be a major source of financing
for investment opportunities. The negative coefficient on Low Director indicates that insiders
provide less loans to firms in which they have lower stake.
Our estimates in Column (1) indicate that a firm with operating profits 1 standard deviation
(SD henceforth) below the sample mean gets 6.8% more group loans as compared to the average
group firm. The estimates in Column (2) indicate that a firm with leverage 1 SD above the
sample mean gets 5.1% more group loans as compared to the average group firm. Finally, the
estimates in Column (6) indicate that a firm with above median director holding in the group
receives 0.2% more group loans than a firm with below median director holding. Though the
impact of insider holding on the flow of group loans does not appear economically significant,
this could be because of the noise in the insider holding measure. As discussed earlier, we
only measure the holding of all the board of directors in the firm and not the total insider
holding. We have further discussion on the impact of insider holding on the flow of group loans
in Section III.B.2 where we examine the time series variation of group loans.
In unreported regressions, we include additional controls to measure the extent of geographic
and industry proximity of firms within the group. We do this to ensure that our results are not
driven by greater support provided by groups which are more clustered on these dimensions –
higher clustering possibly indicating the extent of integration or coordination within the group.
To measure industry and geographic proximity, we construct Industryclose (Geographyclose) for
each group-year as the Herfindahl index of the distribution of net profits of the firms in the
group across 95 industries (27 geographical states). In these tests we obtain results similar to
the ones reported here.
12

Overall, our findings show that the main providers of group loans are firms that are larger,
more profitable and with more tangible assets. External borrowing is the dominant source of
financing for intra-group loans. Groups provide more loans to member firms that have lower
profitability, higher leverage, lower asset tangibility and high insider holding. Our results are
broadly consistent with the principal function of intra-group loans being to provide support to
member firms in poorer financial condition. We find little support for loans being used to finance
profitable investment opportunities (motive (i)). There is some evidence for group loans being
associated with high insider holding firms. In the following section we investigate in more detail
the support and other motives for group loans by examining the timing pattern of intra-group
loans.
III.B.2 Time-series Variation of Group Loans
If group loans are mainly used for supporting weak firms, we would expect both net flow and
gross inflow of loans to be positively associated with negative earnings shock to firm profitability.
However, if intra-group loans are mainly used to tunnel cash between firms (motive (iii)), we
expect loan outflows to be associated with positive earning shocks.
To examine the response of group loans to earnings shock, we estimate the following model
on group firms:
yit =
(α0 + β1Shock−it + β2Shock+
it + γControlsit
+ Firm Fixed Effects + Time Fixed Effects
), (E-3)
where the dependent variable yit in Column (1) is the percentage change in net group loans
extended to firm i at time t. We also include control variables used in the estimation in Panel A
of Table IV. Shock− is a dummy variable which indicates a negative shock to firm profitability
that year. It takes a value 1 if there is a fall in EBIDTA of more than 10% in year t for firm i
relative to the previous year and 0 otherwise. Shock+, is analogous to Shock− and takes a value
1 if there is a positive shock of 10% or more to a firm’s profitability and 0 otherwise. If group
loans are mainly used for tunneling then we expect a negative coefficient on Shock+. On the
other hand if loans increase mainly in firms hit with negative earning shocks, then we expect a
positive coefficient on Shock−. There is no support for motive (iii) as our results in Column (1)
show that the coefficient on Shock+ is insignificant. We also find that the coefficient on Shock−
is positive and significant indicating that the flow of group loans is consistent with loans being
used to support the poorly performing firms in the group.
For robustness, we also use gross loan flows as the dependent variable and repeat the estima-
tion. If group loans are a means of support, then we expect the gross loan inflows to be positively
13

related to negative shock to firm profitability. On the other hand if loans are used to tunnel
cash out of firms, then we expect gross loan outflows to be positively related to positive shocks
to firm profitability. In Column (2), the dependent variable is percentage change in gross loan
inflows and in Column (3) it is percentage change in gross loan outflows. Our results show that
while gross inflows are positively associated with negative shocks to firm earnings, gross outflows
are not significantly associated with positive shocks to firm earnings. Overall, our results are
suggestive of intra-group loans being used as a means of support for firms in distress – and not
primarily for moving cash out of cash surplus firms.10
If group support is motivated by the insider’s concern to save his equity stake, then it would
imply that support through group loans in response to a negative earnings shock should vary
with insider holding. To test this, we re-estimate equation {E-3} after including an interaction
term between Shock and Low Director. Our results in Column (4) show that the coefficient on the
interaction term is negative and statistically significant. However, the effect is not economically
large, with the estimate indicating that group support for firms with below median insider
holding is lower by 3.8%. As noted earlier, this could be a result of the noise in the measure of
insider holding.
Next, we examine if group insiders use group loans to finance profitable investment opportu-
nities. In particular, we argue that in this scenario, recipient firms should perform better in the
period after they receive the loans. This would reflect the profitable investment opportunities
in these firms. To test this, we examine the subsequent performance of firms that receive group
loans. For every year of our sample, we sort firms based on the amount of net group loans re-
ceived as a percentage of total assets. We then measure the performance of receivers in the top
quartile. Panel B of Table IV provides the abnormal operating performance and abnormal stock
return of the firms in the first quartile in the subsequent one and two year period after receiving
group loans. We measure abnormal operating performance (investments) as the difference be-
tween EBDIDTA/TA (Investment/TA) of the firm and median EBDIDTA/TA (Investment/TA)
of all firms in the same industry. We measure abnormal stock return as the difference between
the firm’s return and the return of the market index, proxied by the BSE-200 index. The results
indicate that the firms which receive group loans significantly underperform benchmarks in the
subsequent two year period (Columns (1) and (2)). Also notice that the performance deterio-
rates over the two year period. This casts doubt on the investment motive and the likelihood10To contrast group loans with external financing, we repeat our regressions replacing intra-group loans with
loans from banks and financial institutions. The results (unreported) show that external loans are sensitive to
Investment/Cash Flow, Sales Growth and Market to Book. We also find that external loans are not responsive
to transient negative shocks to firm profitability. This further highlights the unique nature of group loans as a
support mechanism.
14

that groups are extending loans because, for instance, they have positive information about the
firm’s future prospects.11
In conclusion, the cross-sectional and timing pattern suggests that group loans are used
to provide support to member firms. There is also evidence of marginally greater support for
high insider holding firms in a group. The evidence does not support investment and tunneling
motives of group loans. Groups extend loans to firms that are performing poorly. The loans are
not directed toward investments and recipients continue to perform poorly after infusion of the
loans.
III.C Bankruptcy Probabilities of Solvent Group and Stand Alone Firms
In this section, we examine whether loans have real effects that are consistent with groups pro-
viding support. More specifically, we examine the role of group loans on bankruptcy probability
of group firms. If groups support member firms so as to prevent their default, then we expect
group firms, ceteris paribus, to have a lower bankruptcy probability in comparison to stand
alone firms, with the difference arising because of group loan flow. To test this prediction, we
compare the bankruptcy probability of solvent group firms with the bankruptcy probability of
stand alone firms.
Before testing this prediction, we provide some indirect summary evidence of the impact of
group support on bankruptcy probability. If group support prevents group firms from becoming
bankrupt, then the performance of the group firms prior to an actual bankruptcy should be
substantially worse than that of stand-alone firms before bankruptcy. In other words, group
support will enable group firms with poorer operating performance to fend off bankruptcy. We
examine this prediction by doing univariate comparisons of EBIDTA/Total Assets, Cash/Total
Assets and Current Assets/Current Liabilities for stand-alone bankrupt firms and the first group
firm that becomes bankrupt for four years preceding their bankruptcy. A lower value of these
variables indicates a poorer financial position. In Figures 1, 2 and 3, we plot the mean value
of these variables on the vertical-axis for the stand-alone and group firms. The figures show
that in each of the four years before declaring bankruptcy – while both types are performing
poorly – stand-alone firms are in a better financial position than group firms. These differences
are statistically significant at 1% level.12
11We would like to note that this evidence cannot be used to claim that loans are not used by insiders to benefit
from their stake since we are unable to measure the performance of firms receiving loans in the absence of group
loans. Moreover, simply comparing the change in performance relative to troubled group firms who do not receive
group loans would also not be a valid test since the decision to support might be endogenous.12Other variables such as Net Income/Total Assets and Retained Earnings/Total Assets are highly correlated
15

We now proceed to formally compare the bankruptcy probability of solvent group and stand
alone firms using standard techniques developed in the bankruptcy prediction literature (e.g.,
Altman, 1968; Shumway, 2001). We compare the one year ahead bankruptcy probabilities using
a static bankruptcy prediction model. Following the bankruptcy prediction literature, we use
one year lagged values of the financial ratios that are intended to capture firm profitability,
liquidity and market values as controls. To test our prediction we use a dummy variable Group
indicating group affiliated firms. Specifically, we estimate the following model and report our
results in Table V:
Prob (Bankruptcyit = 1) = Φ
(γFirm Financialsit−1 + β1Directori + β2Groupi
+ Industry Fixed Effects + Time Fixed Effects
), (E-4)
where Φ denotes the logit distribution function; Bankruptcy is a dummy, which takes a value 1
if a firm becomes bankrupt in the year. The one year lagged firm financial ratios we use are:
Net Income/TA, Working Capital /TA, and Market Value of Equity/Total Liabilities.13 We also
include Size, and leverage, as measured by Debt/TA. To compare the bankruptcy probability of
a firm belonging to a solvent group and a stand alone firm, we drop all firm year observations of
a group after the first year in which one or more of its member firms become bankrupt. Apart
from dropping firm year observations after the first bankruptcy in a group, we treat all group
and stand alone firms equivalently and estimate the regressions at firm level.14 All regressions
are estimated with industry and time fixed effects and the standard errors reported in the table
are robust and clustered at group level. Since Group does not vary across time or within a
group, we are unable to use firm or group fixed effects in Column (1).
The results in Column (1) indicate that the various financial ratios are strong predictors of
bankruptcy and are estimated with the expected negative sign – suggesting that firms in poor
financial health are more likely to go bankrupt. The coefficient estimate on Size is negative and
marginally significant, indicating that larger firms are less likely to fail. The co-efficient on Group
is negative and significant suggesting that firms belonging to solvent groups have significantly
with EBIDTA/Total Assets in our sample and exhibit a similar pattern. In unreported tests, we also find that
the differences highlighted in the figures are robust to controlling for industry and time effects.13In choosing these financial ratios, we began by including the ratios used in the prior bankruptcy literature
(Altman, 1968; Shumway, 2001). Of these we found Net Income/TA, Retained Earnings/TA and EBIDTA/TA
to be highly correlated in our sample. Hence, we only retained Net Income/TA. We also dropped Net Sales/TA,
Total Liabilities/TA and Current Assets/Current Liabilities as they were insignificant and including them had
little effect on other coefficient estimates.14An alternative estimation method would involve including all firm year observations along with a dummy
variable that identifies firm years after the first bankruptcy in the group. We employ this alternative estimation
method in Table VIII and get results consistent to those reported here. Also note that our specification is
equivalent to a dynamic hazard model as has been shown in Shumway, 2001.
16

lower bankruptcy probability than stand alone firms. Our estimates are economically significant
and indicate that a solvent group firm with sample mean characteristics has a 34.5% lower
probability of becoming bankrupt in the following year, compared to a stand alone firm.15 We
also find that Director is negative and highly significant, indicating that both group and stand
alone firms with a lower insider holding are more likely to become bankrupt.16
Next, we examine if, consistent with a support motive, the lower bankruptcy probability for
solvent group firms is on account of the loans they receive. Specifically, we re-estimate equation
{E-4} after including the percentage change in net group loans extended to firm i between
periods t − 1 and t − 2, %∆Group Loansit−1. For stand-alone firms this variable takes a value
of 0. If group support is a significant reason for the lower bankruptcy probability of solvent
group firms, as compared to stand alone firms, then we expect this coefficient to be negative and
significant. Indeed, in Column (2), we find the estimate on %∆Group Loansit−1 to be negative
and significant and find that the inclusion of this variable significantly reduces the size and
statistical significance of the coefficient on Group. This suggests that the support provided by
group loans is likely to be an important factor in reducing the bankruptcy probability of solvent
group firms. For robustness, we re-estimate the model using only group firms and including group
fixed effects to control for time invariant group unobservables. The results, reported in Column
(3), indicate that the coefficient on %∆Group Loans continues to be negative and significant.
This suggests that group loans not only explain the cross-sectional difference in bankruptcy
probability between solvent group and stand alone firms but also among solvent group firms.
Our estimates in Column (3) are economically significant. In particular, an increase in %∆Group
Loans from 25th to 75th percentile, keeping other variables at their mean levels, would lower the
bankruptcy probability of a group firm by 25.1%.
If groups always support member firms in distress, then a reasonable question to ask is why
group firms ever become bankrupt? We expect group support to fall and a solvent group firm
to become bankrupt when it experiences severe negative shocks to its profitability – shocks that15For robustness, we estimated our logit model separately for each year. We find that the coefficient estimate
on Group is negative for each of the years and the time series average value of the coefficient estimate on Group
is (−1.8), lower than our panel estimated coefficient of (−0.52). We also re-estimate our model after including
other firm financial variables like operating cash and profits but find that our estimates are unaffected.16To examine, whether insider holding has an incremental impact on the bankruptcy probability of solvent
group firms, we re-estimate equation {E-4} after including an interaction term between Group and Director. The
coefficient estimate was insignificant. This indicates that the greater support provided by groups to high insider
holding firms does not have an impact on the bankruptcy probability of solvent group firms. For robustness, we
re-estimate our model after including interaction between all the firm financial variables and Group. We find that
these interaction terms are insignificant, indicating that the sensitivity of these variables does not differ between
group and stand-alone firms.
17

are large in comparison to the total value of equity of the other firms in the group. To test this
prediction, we construct an exogenous measure of the negative shock impacting a group firm. To
do this, we first calculate the predicted profitability of firm i, Predicted it, as the product of firm
i’s total assets and EBIDTA/TA of firm i’s industry, where EBIDTA/TA of firm i’s industry is
measured as the asset weighted mean EBIDTA/TA of all firms in the industry (excluding firm i).
Next, we take the % change in Predicted (∆Predicted it−1) between t−1 and t−2 as an exogenous
measure of the shock impacting firm i’s profitability. We also construct Relative Shock i, as the
ratio of ∆Predicted i and NetWorth−i. Here, NetWorth−i is the sum of the book value of net
worth of all firms in the group excluding firm i, and is a measure of the equity value of the
group. We interpret this ratio as capturing the cost of providing support (measured by minus
∆Predicted i) relative to the potential resources of the group (proxied by NetWorth−i). We use
book equity value instead of market value because, any anticipated negative spillovers might be
impounded in the market prices and this might bias our estimates. We re-estimate equation
{E-4} in Column (4) after including both ∆Predicted i and Relative Shock i. Our results indicate
that the coefficient estimate on Relative Shock is negative and significant. This supports the
notion that the first firm in the group becomes bankrupt when the negative shock impacting its
profitability is severe in comparison to the resources of the group. Since we include ∆Predicted i
in our estimation, the results suggest that the likelihood of bankruptcy of a group firm is not
just driven by the drop in expected profitability of the firm.17
To summarize, the results in this section show that, controlling for various financial variables,
solvent group firms are less likely to become bankrupt than stand alone firms. A primary reason
for the lower bankruptcy probability appears to be the support extended by other group firms
through group loans. Higher insider holding lowers the bankruptcy probability of both group
and stand alone firms. Finally, the first firm in the group becomes bankrupt when the firm is hit
by a negative shock that is large in comparison to the total value of equity in the other firms of
the group. These results show that the support provided by the group has real effects in terms
of reducing the bankruptcy probability.17In unreported tests, we also include other group level explanatory variables which may affect the bankruptcy
probability of a group firm – Industryclose, Geographyclose, and debt and cash in other firms in the group. We also
control for group diversification using the Herfindahl index as a measure of group diversification (Khanna and
Palepu, 2000). We construct the Herfindahl index for each group using the group firm’s distribution of net sales
across industries. Using this index we construct two dummies (High Diversified and Low Diversified) indicating
the top 33 and bottom 33 percentile of diversified groups. Our estimates are unaffected by the inclusion of these
variables.
18

III.D More Evidence on Support: Terms of Intra-Group Loans
To examine further if group loans are extended with a support motive, we analyze the terms for
a random sub-sample of group loans. Specifically, we examine if the terms on which loans are
provided are more favorable than comparable market terms – consistent with the loans being
used to provide subsidy and support to weaker firms in the group. To do so, we take a random
sample of 100 firms from the top quartile of receivers. This constitutes roughly 15% of the total
firms in that quartile. Using this random sample, we search the annual reports in Prowess for
the terms on the intra group loans. These terms usually appear in either the footnotes to the
annual report or in the auditor’s notes. We would like to note that since the annual report
coverage in Prowess starts in 1999, our analysis of loan terms is limited to the period after that.
We find that, on average, firms receive group loans at an interest rate that is significantly
below the corresponding borrowing rate in the market. To calculate the market rate for a given
year, we collect the minimum commercial lending rate of the market during the relevant period.
This information is obtained from the Reserve Bank of India website (www.rbi.org.in). Our
analysis suggests that the group loans are below the market rates by around 10% (significant
at 1% level). We also find that a large proportion of cases (more than 80%) have no interest
obligations at all. For instance Consolidated Fibres & Chemicals Ltd. in 1999, took an unsecured
loan of Rs. 287.2 million from firms in its group with no interest accrued or repayable (i.e.,
effective interest rate of 0%). During the same time period the commercial lending rate was
12.25%. Moreover, in a significant number of cases loans have clauses that prevent any payment
on the loans, till the loans from financial institutions are fully repaid. In effect, the loans are
zero coupon for an initial period. This evidence is consistent with group loans being a means
of subsidy and support. The detailed terms of 34 such group loans (30 firms) is provided in
Table VI. In unreported analysis, we also find that the terms of loans are not related to insider
holding in these firms – i.e., both high and low insider holding firms are equally likely to receive
subsidized loans.18
To summarize, our analysis in Section III has thus far established that groups support the
financially troubled member firms in the group through group loans. Moreover, loans have a
real effect in terms of reducing the bankruptcy probability of group firms when compared to
financially similar stand alone firms. We find that loans tend to be made on favorable terms
indicating a support motive. Having established that groups support member firms, we now18Also note that while the evidence in this subsection is consistent with these loans being negative NPV for the
firms that provide them, these loans could be still positive NPV for the insider on account of his equity stake or
the private benefits he derives from control. We discuss this in more detail in the context of why groups provide
support in Section IV.
19

turn to the analysis of what motivates group insiders to provide support to weaker firms.
IV. Why Do Groups Support Weak Firms?
In this section we explore further the motivation for groups to support the weaker member firms.
As we have noted, group insiders may support member firms to protect their equity stake. Thus,
even though support may be negative NPV in isolation, it may be positive NPV on account of
group insider’s equity stake. This is supported by the evidence in the last section that shows that
groups tend to provide greater support in the form of group loans to firms with larger insider
ownership. Further, controlling for financials, firms with higher insider ownership are less likely
to go bankrupt. Although the economic significance of insider ownership on the provision of
loans is small – as is suggested by coefficient estimates – this may be a consequence of the noise
in the insider holding measure.
Another reason for support may be that group insiders are likely to derive private benefits
from their control of firms. To the extent firm bankruptcy dilutes such benefits, we would
expect insiders to seek to provide support and avoid bankruptcy. The very nature of private
benefits, however, makes it difficult to estimate the extent to which their consumption is affected
by firm bankruptcy.19 As we have noted earlier, the legal impediments on creditors during the
bankruptcy process in India – such as cessation of payments to lenders and restrictions on lenders
in taking possession of collateral – may result in only moderately curbing the ability of insiders
to derive private benefits, even after bankruptcy.20
There is, however, another important reason for groups to support weak member firms –
concern about the negative signal that might be sent by the group firm default to outsiders,
especially external capital providers. The signal may be about the group insider’s unobserved19In an effort to examine if group insiders support firms to preserve their private control benefits, in unreported
regressions, we conduct an additional test to examine if intra-group support tends to be lower in firms that
have higher institutional and bank ownership. The notion being that institutional shareholding may control
the insider’s benefit consumption and hence insiders may have lesser incentives to support firms with higher
institutional holding. We do this by estimating ({E-2} and {E-3}) after including a variable that measures the
aggregate percentage shareholding of banks, financial institutions and mutual funds in a firm. The results indicate
that institutional ownership has an insignificant impact on group loan flow. Though this test is admittedly noisy,
it casts some doubt on whether preserving benefits consumption is an important motive for insiders to support
member firms.20The relevant law is succinctly summarized in Goswami, 1996, a corporate governance report prepared for the
Government of India :“...From the time a company is registered as bankrupt until the case is disposed, the BIFR
[the bankruptcy court] does not allow creditors to exercise any claims....Once the case is registered, promoters are
protected from creditors claims for at least four years.”
20

wealth, the group’s future growth prospects and/or about the group’s reputation of being a
reliable, high quality borrower. Such a negative signal may make it difficult for other firms in
the group to raise external capital, further damaging the group’s investment prospects and the
solvency of its remaining firms. We refer to this hypothesis as the “negative spillover hypothesis”.
The notion is that default by a group firm might trigger significant negative spillovers – hence
providing a strong motive for the group to support its member firms in financial trouble.
We examine the evidence on whether there are significant negative spillovers by analyzing the
impact of the first bankruptcy in the group on the other healthy firms in the group. The negative
signal associated with the first bankruptcy in a group is likely to be most informative and
damaging. Hence, we might expect solvent groups to be especially concerned about preventing
their first bankruptcy. After the first bankruptcy – to the extent negative information is revealed
about the group and its prospects – we would expect the group’s remaining firms to have
a significantly diminished ability to raise external capital. This, in turn, may impact their
performance and survival. In our analysis we focus on whether there is evidence of such capital
rationing – and negative consequences for the group’s firms.21
Negative spillovers may occur for reasons other than due to a negative perception about
the group’s prospects and/or loss of reputation among providers of external capital. The first
bankruptcy in the group may lead to negative spillovers because of other linkages (henceforth
‘non-information based factors’) across the group firms. In particular, observable linkages be-
tween firms such as the presence of internal capital markets in the form of intra group loans,
geographic or industry proximity of group firms and existence of customer-supplier relationship
among group firms can account for such spillovers. The existence of intra-group loans can lead
to negative spillovers if, for instance, the bankruptcy of a recipient group firm causes a loss to the
loan provider or if an important provider of group loans becomes bankrupt. Alternatively, when
a group’s firms are clustered in a few states or industries, group firms may receive correlated
shocks – that have little to do with negative signal or loss of reputation. Similarly, if group firms
are linked by supplier-customer relationships, firm bankruptcy can lead to spillovers as well.
In our analysis, we adopt two approaches to argue that a significant portion of the nega-
tive spillover effects we document may be attributable to a negative signal about the group’s
prospects. First, we examine if observable factors such as group loans, geographic and/or in-21An alternative view could be that the predominantly state owned banks in India (La Porta et al., 2002), do
not follow a ‘cut-throat’ strategy of credit rationing after the bankruptcy in the group, but renegotiate and extend
further credit to the firms. According to this view, there should not be any significant reduction in the extent of
external financing raised by group firms after the first bankruptcy. Our tests measuring the impact of group firm
bankruptcy on the amount of external finance raised by the other firms will be able to differentiate between the
two views.
21

dustry proximity of a firm to the bankrupt firm and customer-supplier relationships between
the bankrupt firm and other group firms are able to explain the observed pattern of spillovers.
Second, we investigate some specific predictions about the nature of the spillover costs. In
particular, if the spillovers arise due to credit rationing following negative information about
the group – then we expect the consequences to be more severe for firms which depend more
on external financing. Moreover, we expect spillovers to be more severe for firms that have
closer managerial links – and, hence, a firmer connection in terms of economic prospects and/or
reputation – to the bankrupt firm. We now further elaborate on this issue.
A business group may have its own “sub-groups”, with the bankrupt firm being more closely
associated with particular firms in the group. For instance, it is not uncommon for business
groups to have segments more closely aligned with a particular branch of the founder’s family. To
identify these firms, we construct a new dummy variable Chairman. To construct this variable,
we first identify the chairmen of all the group firms that become bankrupt during our sample
period. Next, we identify all the groups’ firms in which the identified chairmen are members of
the Board of Directors. Finally, for each year following the first bankruptcy, we code Chairman
equal to 1 for all the firms in which the Board of Directors includes chairman of the bankrupt firm
and 0 otherwise. We use the latest information on the board of directors of firms to construct
Chairman. Hence, Chairman is not time varying for an individual firm.
Before proceeding with the tests, we outline sample characteristics of firms with close man-
agerial linkages. In the sample, on average, a chairman of a bankrupt firm is on the board of
directors of 4 other firms. Firms with close managerial linkage to the bankrupt firm, are also
likely to be close to the bankrupt firm in other respects such as sharing internal capital markets
and being clustered in a few geographic locations, or industries. To examine the extent to which
Chairman captures closeness along these dimensions, we relate different characteristics of the
bankrupt firm to the firms in its chairman cohort. Our results (unreported) indicate that firms
in the Chairman cohort are not closer to the bankrupt firm in terms of geography or industry
than other firms in the group. However, these firms do have closer linkage in terms of sharing
internal capital markets through group loans. In particular, firms in the cohort extend more
intra-group loans to the bankrupt firm. To account for this, in our analysis we control for the
amount of the group loans provided by a firm.22 Therefore, any additional variation in spillovers22More specifically, besides examining whether firms in the chairman cohort extend more intra-group loans to
the bankrupt firm, we also investigate if the first bankruptcy impacts the firms in the chairman cohort because
the bankrupt firm represents the loss of a potential source of funds. We relate the inflows to the firms in the
cohort to gross outflows of group loans from the bankrupt firm and to the outflows from the other group firms.
We find that the bankrupt firm does not contribute significantly to the loan inflow into the Chairman cohort
firms. Thus, it is unlikely that firms in the chairman cohort are affected negatively after the first bankruptcy
22

captured by Chairman is less likely to be on account of the amount of group loans provided to
the bankrupt firm by cohort firms.
Thus, in the analysis that follows, we investigate whether the first bankruptcy in the group
is followed by negative consequences for the rest of the group and if the negative consequences
are more severe for firms which depend on external finance and which have managerial linkages
to the bankrupt firm. Our argument is that such evidence is consistent with groups providing
support to avoid such negative consequences. However, it is important to note that such evidence
can only be suggestive of negative spillovers. Despite our attempts to control for firm financials
and other factors, we cannot rule out the possibility that insiders declare bankruptcy when
the performance of much of the group is expected to decline precipitously – and that the first
bankruptcy of a group firm does not, per se, make it harder for the rest of the group’s firms
to raise external financing. Such a pattern would be observed if insiders support firms only
till the expected benefits, such as those from preserving the ongoing enterprise value of group
firms, are large enough. Consequently, when they expect the performance of the member firms
to deteriorate significantly in the future, it is optimal for them to declare bankruptcy.
IV.A Credit Rationing and Group Support
We begin by examining if there is any evidence of rationing of external financing after the first
bankruptcy in a group. If the bankruptcy reveals significant negative information about the
group and its prospects, we expect bankruptcy of a group firm to lead to a reduction in the
external financing of member firms – after controlling for firm financials and other characteristics.
Specifically, we estimate the following model on all healthy group firms and present the results
in Panel A of Table VII:
yit =
(α0 + β1Preit + β2Post Bankruptcyit + γControlsit
+ Firm Fixed Effects + Time Fixed Effects
), (E-5)
where yit is Debt it, the external borrowing by firm i in year t, in Columns (1) and (3) and
Equity it, the external equity raised by firm i in year t, in Columns (2) and (4). Pre is a dummy
variable which takes a value 1 for the two year period before bankruptcy of the first firm in
a group and 0 otherwise. Post Bankruptcy, is a dummy variable equal to 1 for all the firms
in the group in the years in which at least one of the firms in the group is bankrupt and 0
otherwise. We code Post Bankruptcy equal to 1 for all the firms in a bankrupt group in order to
test for whether their level of external financing is affected by the first bankruptcy in the group.
The regressions are estimated with firm and time fixed effects to control for unobserved firm
because they lost an important source of funds.
23

characteristics and time trends.23 Columns (1) and (2) are estimated without any controls. Our
results in Columns (1) and (2) indicate that there is strong evidence of a reduction in the total
external financing obtained, both debt and equity, by the healthy firms in bankrupt groups.
In Columns (3) and (4), we examine if the reduction in external financing is greater for firms
that have direct managerial linkages with the bankrupt firm. As discussed, we would expect the
bankruptcy to have stronger information and reputation implications for these group firms. To
examine this, we include an interaction between Post Bankruptcy and Chairman in Columns
(3) and (4). In Columns (3) and (4) other controls such as Size, EBIDTA/TA and Sales Growth
are also included. As explained earlier, to examine if non-information based reasons account
for spillovers, we include Post Bankruptcy*Provider, Post Bankruptcy*Same Industry and Post
Bankruptcy*Same State.24 Same Industry is a dummy variable which takes a value 1 for firms
in the group which are in the same industry as the bankrupt firm and 0 otherwise; Same State
is a dummy variable that takes a value 1 for firms that are in the same state as the bankrupt
firm and 0 otherwise. Consistent with more credit rationing in firms with close managerial links
with the firm going bankrupt, the coefficient estimate on the term Post Bankruptcy*Chairman is
negative and significant. We also find that non-information based factors that might contribute
to spillovers are not significant. In particular, F-test results reject the joint significance of
Post Bankruptcy*Provider, Post Bankruptcy*Same Industry and Post Bankruptcy*Same State
in Column (3) and (4).25
The effects we document are economically significant. The estimate of β2 in Columns (3) and
(4) indicates that subsequent to the first bankruptcy in the group, the incremental borrowing by
the member firms falls by at least 21.7% and the incremental equity raised falls by at least 5.6%.
The estimates on the interaction term Chairman*Post Bankruptcy suggests that incremental
borrowing and equity fall by an additional 17.1% and 4.1% respectively, for firms more closely
identified with the bankrupt firm.26 These findings are consistent with lenders and outside23In all the subsequent tests in the negative spillover section (except the bankruptcy tests), we exclude the
bankrupt firms from our estimation. Including the bankrupt firms in our tests increases the economic magnitude
of our results.24Inclusion of Post Bankruptcy*Provider will ensure that we control for the spillovers arising due to group loans
provided by a firm. The notion here is that while we do not know the exact loan linkage between firms (we have
only aggregate data on the group loans received and provided by firms), inclusion of this interaction term ensures
that Chairman does not capture the spillover effects due to the firm being a significant provider of loans to the
bankrupt firm.25Also note that R2 with and without Post Bankruptcy*Provider, Post Bankruptcy*Same Industry and Post
Bankruptcy*Same State in Column (3) is 71% and 70% respectively.26Our results are unaffected when we re-estimate our regressions after including other group level variables like
group investments, group size and group profits. We also repeat the analysis at a group level using the aggregate
debt and equity raised by the group and find that our estimates are similar to those reported.
24

investors curtailing their financing to the group because of the negative signal about the group.27
As discussed earlier in Section III.B, external borrowing appears to be the main source of
funds for group loans. Hence, with the reduction in external borrowing after the first bankruptcy
in a group, we can expect the flow of group loans to decrease as well. Furthermore, group insiders
may have little incentive to support member firms – since the negative information about the
group has already been revealed after its first bankruptcy. To examine this, we evaluate the
impact of firm bankruptcy on the extent of group loan flow. In Panel B, we re-estimate equation
{E-3} after including an interaction between Shock− and Post Bankruptcy. Our results in
Column (1) indicate that after the first bankruptcy in a group, intra-group loan flow decreases
by as much as 37%. To examine if the reduction in loan flow is more severe for groups which
depend more on external finance, we use the Rajan and Zingales, 1998 industry index (RZ Index )
as our measure.28 Specifically, we include Shock−*Post Bankruptcy *GroupRZ to examine if
the reduction in loan flow is more severe for groups which depend more on external finance. To
examine if there might be non-information based factors that might lead to spillovers, we include
Shock−*Post Bankruptcy*Same State and Shock−*Post Bankruptcy*Same Industry. Consistent
with our prediction, we find a greater reduction in group loan flow in groups that are more
dependent on external finance. Our results also indicate that there is no evidence that state or
industry proximity to the bankrupt firm has any significant effect.
In Column (3), we re-estimate our model after including Shock−*Post Bankruptcy*Chairman
to evaluate if the reduction in group loan flow after the first bankruptcy is stronger for firms with
managerial linkages to the bankrupt firm. Our results show that there is a greater reduction
in support for firms with managerial links with the bankrupt firm – consistent with these firms
suffering a greater reduction in external financing. Another possible reason for this reduction
may be a fall in transfers from the rest of the group firms, those without close managerial links,
attempting to distance themselves from the bankruptcy.27In principle, our results can arise either due to curtailment in financing for group firms or due to lower demand
of funds by these firms on account of worse investment opportunities. However, our results later show that firms
that rely more on external financing – identified by an exogenous measure (RZ Index ) – experience a greater
reduction in investment and performance and a greater increase in the bankruptcy probability. We believe that
these results are suggestive of curtailment in financing. There is little reason to expect these results to arise if the
cut back in external borrowing was reflective only of reduced investment opportunities.28For a detailed discussion on this measure, see Rajan and Zingales, 1998. In particular, they compute the
external financing needs (i.e., amount of desired investments that cannot be financed through internal cash
generated by the same business) of U.S. companies over the 1980’s. The index goes from -0.45 to 1.49 with higher
value signifying higher dependence. To obtain the RZ Index for a industry in our sample, we first map the RZ
industries to our 95 industry classification. In our analysis, we use the firm’s industry RZ index to proxy for the
firm’s dependence on external financing. We then calculate the weighted average RZ Index for all the firms in
the group using the book value of total assets as weights to obtain GroupRZ.
25

IV.B Investment and Performance Levels
If external financiers ration credit to group firms after the first bankruptcy in the group, then
this is likely to reduce investment levels and the profitability of the group firms. In unreported
tests, we document that negative spillovers lead to an investment and performance drop in
healthy group firms after the group’s first bankruptcy. In particular, we examine the trend
in investments (Investment) and operating performance (EBITDA/TA) for the group firms
relative to the industry they are operating in after the first firm in the group becomes bankrupt
– controlling for firm financials and time fixed effects.
We find that the first bankruptcy in the group is followed by a fall in the investments
(performance) of the healthy firms in the group. Our estimates are economically significant
and indicate a more than 45% (32%) drop in investments (performance) after the group’s first
bankruptcy. We also find that the reduction in investment (performance) is more severe in firms
with closer managerial links to the bankrupt firm and for firms that are more dependent on
external finance. Moreover, non-information based factors are not important in explaining the
investment (performance) drop of bankrupt group firms.29
Our results are generally consistent with external financiers rationing credit to group firms
after the first bankruptcy in the group. As we have noted, the results are suggestive in nature
since we cannot claim that it is the first bankruptcy in the group that causes the drop in
performance and investments. Our tests cannot rule out the possibility that insiders declare
bankruptcy when they expect a large drop in the investments (performance) than would be
predicted by industry investment (performance).
IV.C Bankruptcy Probabilities
In this section, we examine if the first bankruptcy in a group is associated with an increase in
the bankruptcy probability of other member firms. Presence of negative spillovers would predict29For robustness, we also conduct tests to examine whether the spillovers are on account of vertical relationships
among these firms. We use the methodology in Fan and Goyal, 2006 to derive a measure of the extent of vertical
relatedness among the firms in the bankrupt group Vij . To do this, we map our industry classification to 4-digit
SIC codes and use the Table of Benchmark Input-Output Accounts for the U.S. Economy in 1992 to construct the
vertical relatedness measure. We refer to Fan and Goyal, 2006 for details about the methodology. We repeat the
negative spillover regressions after including an interaction term Post Bankruptcy*Vij and find that our results
are unchanged. This suggests that negative spillovers in firms with close managerial linkages are not likely on
account of vertical relatedness. Furthermore, we also include other possible variables that may affect investment
inside the firm like three year average sales growth, firm profits, age of the firm, borrowing of the group and group
profits. We re-estimate our model including all the variables together and find that our results are unaffected.
26

an increase in the bankruptcy probability for the healthy firms in the group than would be
predicted on the basis of financials. The reason would be a fall in the availability of external
credit, as well as a decline in group’s incentives to avoid bankruptcy. In this regard, it is worth
examining some overall numbers of group firm bankruptcy in the sample. Among the groups that
experience their first bankruptcy before the year 2000 (64 groups), 56% (36 groups) experience
more than one bankruptcy and 30% (19 groups) have all their firms become bankrupt during
the sample period.30 Such correlated bankruptcies among firms in the group is suggestive of
negative spillovers. As before, in our analysis we will control for various non-reputation factors
such as geographic and industry linkages that could lead to correlation in bankruptcy among
group firms.
To formally test our prediction, we use a model similar to that in Table V. Specifically, we
estimate equation {E-4} after including Post Bankruptcy. Note that we have a number of groups
that experience their first bankruptcy in 2000. Thus, these groups have just one year of data
after the first bankruptcy in their group. Since there may not have been sufficient time for the
negative spillovers to have impacted the bankruptcy probability of the groups’ healthy firms, we
code Post Bankruptcy= 0 for these groups.31 All regressions are estimated with industry and
time fixed effects and the standard errors are robust and clustered at group level.
In Column (1) of Table VIII, we provide estimates of the model on the full sample of group
and stand alone firms.32 The coefficient on Group is negative while that on Post Bankruptcy
is positive and both are significant. The coefficient on Group indicates that an average group
firm has a 37% lower probability of bankruptcy than a stand alone firm. On the other hand,
the coefficient on Post Bankruptcy indicates that once a group firm becomes bankrupt, the
other members of the group tend to experience a 53% increase in bankruptcy probability. These
results, indicate that prior to the first bankruptcy in the group, the bankruptcy probability
of a group firm is lower than that of a stand alone firm. However, the probability significantly
increases and is actually higher than that of a stand alone firm (by 16%) once a group experiences
its first bankruptcy.
To evaluate differences between group firms in solvent and bankrupt groups, we re-estimate
{E-4} only for group firms. We also employ group fixed effects to ensure that time invariant
unobservable group characteristics do not affect our estimates. The estimates in Column (2)30We have one instance where all 10 firms belonging to a group became bankrupt. See Appendix C for an
example of bankruptcies within a group.31We re-estimate the regressions after coding Post Bankruptcy= 1 for these groups and find that our results
are qualitatively similar.32We estimate the regression on the full sample of group and stand alone firms to enable comparison with the
results in Table V.
27

indicate that a healthy firm, after the first bankruptcy in the group, tends to have about a 20.6%
greater probability of becoming bankrupt than a similar firm from the solvent group.
Finally, to examine if these spillovers are larger for firms in the group that are more closely
linked to the bankrupt firm and those that are more reliant on external financing, we re-
estimate our model after including Post Bankruptcy*Chairman and Post Bankruptcy*RZ In-
dex. We also include Post Bankruptcy*Provider, Post Bankruptcy*Same State and Post Bank-
ruptcy*Same Industry as controls. Our results reported in Column (3) show that both Post
Bankruptcy*Chairman and Post Bankruptcy*RZ Index are positive and significant. The esti-
mates are also economically significant. The coefficient on Post Bankruptcy*Chairman indicates
that once a group firm becomes bankrupt, group firms with close managerial links experience a
36.7% increase in bankruptcy probability.33 Hence, the evidence is supportive of an increase in
bankruptcy probability, on account of negative spillovers.
Summarizing, our findings show significant negative spillovers in the form of diminished ac-
cess to external financing and deterioration in investment and performance for the whole group
following the first bankruptcy. This evidence suggests that one important reason for group sup-
port may be to prevent default by weak firms and avoid such negative spillovers. Moreover,
consistent with spillovers on account of negative information, we find that consequences are
more severe for firms with closer managerial links to the bankrupt firm and for firms that are
more reliant on external financing. A caveat to note is that we cannot rule out the possibil-
ity that insiders declare bankruptcy precisely when they expect a significant decline in group
performance, and hence a decline in the benefit from supporting group firms. In this sense our
evidence should be viewed as only suggestive in nature.
V. Concluding Remarks
In the paper we investigate the use of internal capital markets by Indian business groups, where
intra-group loans serve as the dominant observable means of fund transfer between group firms.
We examine the extent to which group loans serve three, non-mutually exclusive, functions:
First, to fund investment opportunities across business group firms; second, as a way to provide
support for financially troubled firms and, third, as way to tunnel resources toward group firms33Similarly, the coefficient on Post Bankruptcy*RZ indicates that once a group firm becomes bankrupt, member
firms which are in the 75th RZ percentile experience a 22.5% increase in bankruptcy probability as compared to
firms that are in the 25th RZ percentile, keeping other variables at their mean levels. For robustness, we re-
estimate equation {E-4} after including other variables like Size, Cash, Debt/TA, Age, borrowing of the group,
group profits, and Post Bankruptcy*Vij and find that our results are unchanged.
28

with higher insider ownership.
From the cross-sectional and time-series patterns of the group loan flows, we find that group
loans are primarily used by groups to support member firms that are in financial distress. On
average, there is no evidence of group loans being used to fund investment opportunities or to
tunnel cash. An examination of the evidence of bankruptcy among group firms indicates that
the support provided in the form of group loans is associated with a significant decrease in the
bankruptcy probability of group firms. The subsidy and support nature of group loans is also
indicated by the very favorable terms on which the group loans tend to be made, with either no
or below market interest rates being charged.
We investigate possible motives for the group to extend support for member firms. Group
insiders may support member firms on account of their equity stake in the firm or because they
expect private benefits. We argue that another motive may be to avoid default and consequent
negative spillovers on the rest of the group on account of the negative information revealed about
the group and damage to its reputation. Evidence suggestive of such negative spillovers is that
the first bankruptcy of a group firm is associated with a significant and discontinuous drop in
the external financing raised, and in the investments and profitability of the remaining healthy
firms in the group. The negative spillovers tend to be stronger for firms with closer managerial
links to the bankrupt firm and for firms that are more reliant on external financing. After the
first bankruptcy, there is also a large increase in the bankruptcy probability of the remaining
group firms after controlling for their financials.
Our finding that solvent business groups support their member firms and reduce their bank-
ruptcy probability suggests that one of the advantages of belonging to business group is easier
access to capital markets. The reason is that external capital providers will be more willing
to provide financing if they expect solvent business groups to provide support to their member
firms. An implicit guarantee of support by firm’s group is likely to be especially valuable in
emerging economies with poor protection for creditor rights. Hence, our evidence on the sup-
port role of intra-group loans agrees well with the observation that groups constitute a large
fraction of the corporate sector in many emerging economies – unlike in economies with more
efficient and developed financial markets.
29

Appendix A: Variable Description
1. Ageit: Firm i’s age since incorporation in year t.
2. Bankruptcyit: A dummy, which takes a value 1 if firm i becomes bankrupt in year t and 0 otherwise.
3. Chairmani: We construct this variable as follows. First, we identify the chairmen of all the group firms that became
bankrupt during our sample period. Next, we identify all the firms in the group whose Board of Directors include
the identified chairmen. Finally, we construct a new variable Chairman which takes a value 1 after the group’s first
bankruptcy for firm i whose Board of Directors include the chairmen of the bankrupt firm and 0 otherwise.
4. Debtit: Total outstanding debt from bank and institutions of firm i in year t.
5. Director i: Percentage shareholding held by the directors of firm i. Proxy for insider cash flow rights.
6. EBIDTAit: Earnings Before Interest, Depreciation, Taxes, and Amortization of firm i in year t. This variable
measures firm profitability.
7. Equityit: Measured as the external equity raised by firm i in year t. Calculated as the change in net worth less
retained earnings in year t.
8. Firm Financial Ratios: We choose these variables based on the existing bankruptcy prediction literature (Altman
1968; Shumway, 2001). The ratios include: Net Income/Total Assets, Working Capital/Total Assets and Market
Value of Equity/Total Liabilities.
9. Geographyclosejt : Herfindahl index for group j in year t based on the group’s distribution of profits across 27 states.
Proxy for geographic clustering of profits in the group – a higher number signifying more clustering.
10. Groupi: A dummy variable which takes a value of 1 if firm i is a group firm and 0 otherwise. For consistency in
defining a group firm in all our tests, we ensure that there are at least 3 firms in a group.
11. Group Loans/TAit: Ratio of net group loans extended to firm i at time t to the total assets of firm i at time t.
12. %∆Group Loansit−1: Measured as the percentage change in net group loans extended to firm i between periods
t− 1 and t− 2. For stand-alone firms this variable takes the value of 0.
13. High Diversifiedjt and Low Diversifiedjt: Dummies indicating the top 33 and bottom 33 percentile of diversified
groups respectively as measured by the Herfindahl index. Herfindahl index for group j in year t is calculated on the
group’s distribution of sales across industries.
14. Industryclosejt : Herfindahl index for group j in year t based on the group’s distribution of profits across 95 industries.
Proxy for clustering of group profits in industries – a higher number signifying more clustering.
15. IndInvestmentit: Measured as the median growth rate in total assets of firms in industry of firm i in year t (excluding
firm i).
16. Investmentit: Measured as the growth in gross total assets of firm i, in year t (calculated as Log(Total Assetsit/Total
Assetsit−1)).
17. Investment/Cash Flow it: Ratio of the annual investment in fixed assets to the total cash flow from operations of
firm i in year t.
18. Low Director ij : A dummy variable that takes a value 1 if firm i has below median insider holding in group j and
zero otherwise.
19. Market to Book it: Ratio of market value of total assets to the book value of total assets of firm i in year t.
30

20. Net Group Loansit: Difference between intra-group loans received and loans provided by firm i in year t.
21. Post Bankruptcyjt: A dummy variable equal to 1 for all the firms in group j in the years in which at least one of
the firms in the group is bankrupt and 0 otherwise.
22. Preit: A dummy variable which takes a value 1 for all the firms in group j in the two year period before bankruptcy
of the first firm in the group and 0 otherwise.
23. Predictedijt: Predicted profitability of firm i in year t based on its industry j. Measured as the product of firm i’s
total assets and EBIDTA/TA of firm i’s industry, where EBIDTA/TA of firm i’s industry is measured as the asset
weighted mean EBIDTA/TA of all firms in the industry (excluding firm i).
24. ∆Predictedit−1: Measured as the % change in Predicted between t− 1 and t− 2. Proxies for an exogenous measure
of the shock impacting firm i’s profitability.
25. Provider it: A dummy variable that takes a value of 1 for firm i if it is in the top 75th percentile in terms of the
amount of group loans provided to other firms in the group in year t, and 0 otherwise.
26. Relative Shock it: Ratio of ∆Predictedi and NetWorth−i in year t, where we measure NetWorth−i by the total book
value of equity of all firms in the group, excluding firm i.
27. RetEarningsit: Measured as the total retained earnings of firm i in year t.
28. RZ Index i and Group RZ j : An exogenous measure of a firm’s dependence on external finance. It is based on the
Rajan and Zingales, 1998 industry index (RZ Index). We map the RZ industries to our 95 industry classification
and employ the extent to which the firms in firm i’s industry depend on external capital to proxy for it’s reliance
on external financing. We then aggregate this measure across firms in the group to get a measure of the group’s
dependence on external finance. Specifically, we calculate the weighted average RZ Index for all the firms in the
group using the book value of total assets as weights to get Group RZ.
29. Sales Growthit: Measured as the annual growth rate of sales of firm i in year t.
30. Same Industryit and Same Stateit: Dummy variables that take a value 1 for a group firm i in year t if the firm is
in the same industry and state as the first bankrupt firm in the group respectively and 0 otherwise.
31. Shock−it : A dummy variable that takes a value 1 if there is a fall in EBIDTA of more than 10% in year t for firm i
relative to the previous year and 0 otherwise. This variable indicates a negative shock to firm profitability in that
year.
32. Shock+it: A dummy variable that takes a value 1 if there is a increase in EBIDTA of more than 10% in year t for
firm i relative to the previous year and 0 otherwise. This variable indicates a positive shock to firm profitability in
that year.
33. Sizeit: Measured as the log of book value of total assets of firm i in year t.
34. Tangibilityit: Measured by expenditure in net plant, property and equipment normalized by total assets of firm i in
year t.
35. Total Assetsit: Total Book Assets of firm i in year t.
Appendix B: A Note on the Board for Industrial and Financial Reconstruction
31

In wake of financial woes of the country’s industrial sector in the eighties, the Government of India in 1981, set up a committee
of experts to examine the matter and recommend suitable remedies. Based on the recommendations of the Committee, the
Government of India enacted a special legislation namely, the Sick Industrial Companies (Special Provisions) Act, 1985 (1
of 1986) commonly known as the SICA. A Board of experts, named the Board for Industrial and Financial Reconstruction
(BIFR) was set up in January, 1987. SICA applies to companies both in public and private sectors satisfying certain criteria.
As per SICA the board of directors or other interested parties like lenders have the right to register a company with BIFR.
Once registered, BIFR uses the following criteria to determine the sickness of a firm:
• Accumulated losses of the company to be equal to or more than its net worth i.e., its paid up capital plus free
reserves.
• The company should have completed five years after incorporation under the Companies Act, 1956 and should have
a factory license.
• It should have 50 or more workers on any day of the 12 months preceding the end of the financial year with reference
to which sickness is claimed.
The key features of the re-organization process are (for more details on BIFR refer to the home page \\ www.bifr.nic.in.):
1. The board of directors remain in control of the firm during the re-organization process.
2. All legal proceedings initiated by creditors (including those against guarantors) for recovery of dues are halted till
completion of the re-organization process.
3. The firm need not pay any interest or repay the principal on its debt during the re-organization process.
4. The firm’s managers get to propose the initial restructuring package which is then negotiated with the lenders.
Appendix C: Examples of “Solvent” and “Bankrupt” Groups in the Sample
This table reports company name, industry affiliation, insider holding and the year of bankruptcy for two representative
groups in our sample. Panel A reports the data for M.P. Birla group (“Solvent” Group). None of the eight firms of this
group went bankrupt over the sample period. Panel B reports the data for Kilachand group (“Bankrupt” Group). Four
out of the seven firms in the group became bankrupt during the sample period (all of them after 1997). Industry affiliation
and insider holding data comes from Prowess. In some cases there is no director ownership reported for a group firm (e.g.,
Assam Jute Supply Company Ltd.) in Prowess. For these firms the insider ownership is taken to be missing. Information on
year of bankruptcy is based on hand collected data from the Indian bankruptcy court. In the ‘year of bankruptcy column’,
s indicates that the firm was solvent over the sample period. Our sample period is 1989 to 2001.
32
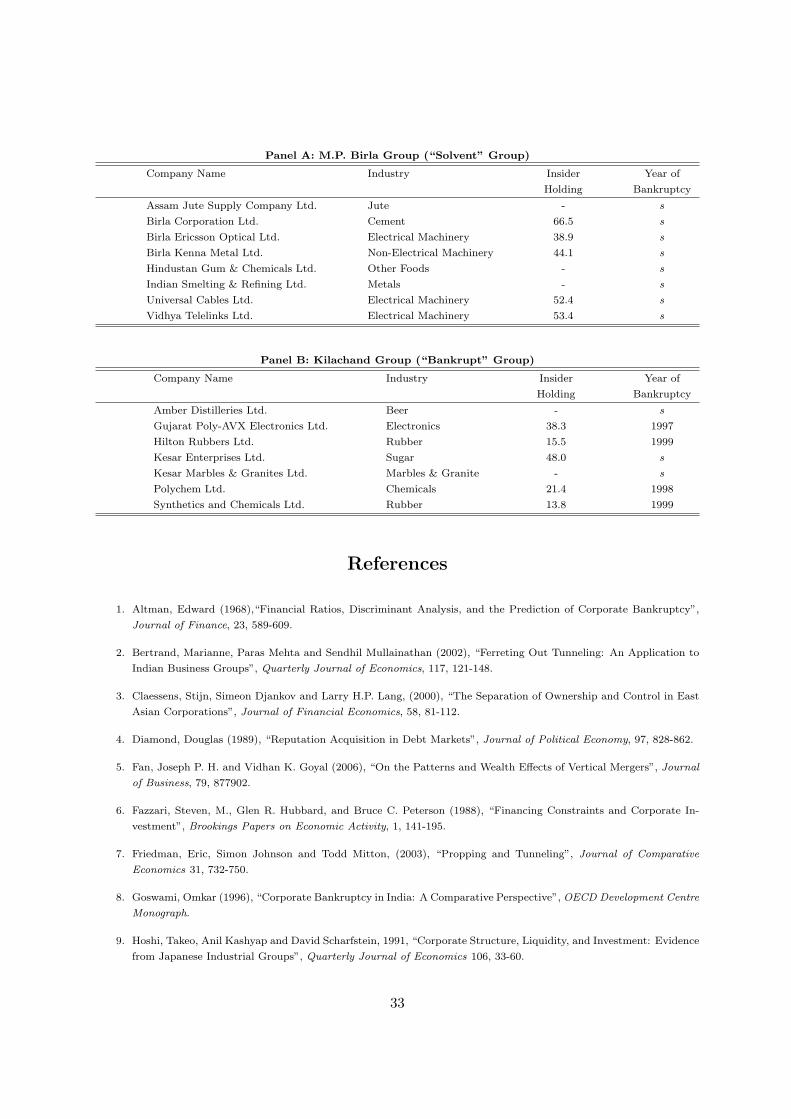
Panel A: M.P. Birla Group (“Solvent” Group)
Company Name Industry Insider Year of
Holding Bankruptcy
Assam Jute Supply Company Ltd. Jute - s
Birla Corporation Ltd. Cement 66.5 s
Birla Ericsson Optical Ltd. Electrical Machinery 38.9 s
Birla Kenna Metal Ltd. Non-Electrical Machinery 44.1 s
Hindustan Gum & Chemicals Ltd. Other Foods - s
Indian Smelting & Refining Ltd. Metals - s
Universal Cables Ltd. Electrical Machinery 52.4 s
Vidhya Telelinks Ltd. Electrical Machinery 53.4 s
Panel B: Kilachand Group (“Bankrupt” Group)
Company Name Industry Insider Year of
Holding Bankruptcy
Amber Distilleries Ltd. Beer - s
Gujarat Poly-AVX Electronics Ltd. Electronics 38.3 1997
Hilton Rubbers Ltd. Rubber 15.5 1999
Kesar Enterprises Ltd. Sugar 48.0 s
Kesar Marbles & Granites Ltd. Marbles & Granite - s
Polychem Ltd. Chemicals 21.4 1998
Synthetics and Chemicals Ltd. Rubber 13.8 1999
References
1. Altman, Edward (1968),“Financial Ratios, Discriminant Analysis, and the Prediction of Corporate Bankruptcy”,
Journal of Finance, 23, 589-609.
2. Bertrand, Marianne, Paras Mehta and Sendhil Mullainathan (2002), “Ferreting Out Tunneling: An Application to
Indian Business Groups”, Quarterly Journal of Economics, 117, 121-148.
3. Claessens, Stijn, Simeon Djankov and Larry H.P. Lang, (2000), “The Separation of Ownership and Control in East
Asian Corporations”, Journal of Financial Economics, 58, 81-112.
4. Diamond, Douglas (1989), “Reputation Acquisition in Debt Markets”, Journal of Political Economy, 97, 828-862.
5. Fan, Joseph P. H. and Vidhan K. Goyal (2006), “On the Patterns and Wealth Effects of Vertical Mergers”, Journal
of Business, 79, 877902.
6. Fazzari, Steven, M., Glen R. Hubbard, and Bruce C. Peterson (1988), “Financing Constraints and Corporate In-
vestment”, Brookings Papers on Economic Activity, 1, 141-195.
7. Friedman, Eric, Simon Johnson and Todd Mitton, (2003), “Propping and Tunneling”, Journal of Comparative
Economics 31, 732-750.
8. Goswami, Omkar (1996), “Corporate Bankruptcy in India: A Comparative Perspective”, OECD Development Centre
Monograph.
9. Hoshi, Takeo, Anil Kashyap and David Scharfstein, 1991, “Corporate Structure, Liquidity, and Investment: Evidence
from Japanese Industrial Groups”, Quarterly Journal of Economics 106, 33-60.
33

10. Johnson, Simon, Rafael La Porta, Florencio Lopez-de-Silanes and Andrie Shleifer (2000), “Tunneling”, American
Economic Review, 90, 22-27.
11. Kali, Raja (2003), “Business Groups, the Financial Market and Modernization”, Economics of Transition, 11,
671-696.
12. Kaplan, Steven, N., Luigi Zingales, “Do Investment-Cashflow Sensitivities Provide Useful Measures of Financing
Constraints?” Quarterly Journal of Economics 112, 169-215.
13. Khanna, Tarun and Yishay Yafeh (2005),“Business Groups and Risk Sharing Around the World”, Journal of Busi-
ness, forthcoming.
14. Khanna, Tarun, and Krishna Palepu (2000), “Is Group Affiliation Profitable in Emerging Markets ? An Analysis of
Diversified Indian Business Groups”, Journal of Finance, 55, 867-891.
15. La Porta Rafael, Florencio Lopez-de-Silanes, Andrei Shleifer and Robert W. Vishny (1997), “Legal Determinants of
External Finance”, Journal of Finance, 52, 1131-1150.
16. La Porta Rafael, Florencio Lopez-de-Silanes, Andrei Shleifer and Robert W. Vishny (1998), “Law and Finance”,
Journal of Political Economy, 106, 1113-1155.
17. La Porta Rafael, Florencio Lopez-de-Silanes, Andrei Shleifer and Robert W. Vishny (2000) “Agency Problems and
Dividend Policies Around the World”, Journal of Finance, 55, 1-33.
18. La Porta Rafael, Florencio Lopez-de-Silanes and Andrei Shleifer (2002) “Government Ownership of Banks”, Journal
of Finance, 57, 265-301.
19. La Porta Rafael, Florencio Lopez-de-Silanes and Guillermo Zamarripa (2003), “Related Lending”, Quarterly Journal
of Economics, 118, 231 - 268.
20. Rajan, Raghuram and Luigi Zingales (1998), “Financial Dependence and Growth”, American Economic Review, 88,
559-586.
21. Shin, Hyun-Han and Young S. Park, (1999) “Financing Constraints and Internal Capital Markets: Evidence from
Korean Chaebols”, Journal of Corporate Finance, 5, 169 - 191.
22. Shin, Hyun-Han and Rene Stulz, (1998), “Is the Internal Capital Market Efficient?”, Quarterly Journal of Economics,
108, 531-552.
23. Shleifer, Andrei and Robert W. Vishny (1997) “A Survey of Corporate Governance”, Journal of Finance, 52, 737-783.
24. Shumway, Tyler (2001), “Forecasting Bankruptcy More Accurately: A Simple Hazard Model”, Journal of Business,
74, 101-124.
25. Stein, Jeremy (2003) “Agency, Information and Corporate Investment,” in Handbook of the Economics of Finance,
edited by George Constantinides, Milton Harris and Ren Stulz, Elsevier 2003, 111-165.
26. Titman, Sheridan and Roberto Wessels (1988), “The Determinants of Capital Structure Choice”, Journal of Finance,
43, 1-19.
27. Van der Molen, R. Lensink and S. Gangopadhyay (2003), “ Business Groups, Financing Constraints and Investment:
The Case of India”, Journal of Development Studies, 40, 93-119.
34

Figure 1: EBIDTA/Total Assets Figure 2: Cash/Total Assets
Figure 3: Current Assets/Current Liabilities
Figures 1, 2 and 3: The figures above depict the mean value of EBIDTA/Total Assets, Cash/Total Assets and
Current Assets/Current Liabilities respectively for stand-alone and group firms. We depict the values of these
financial variables for each of the four years before these firms declare bankruptcy. The differences between the
ratios’ of stand-alone and group firms for each of the four years is statistically significant at 1% level.
35

Table I:
Summary Financials of All Firms, Group Firms and Bankrupt Firms
This table reports the median values of the summary financials of all the firms in the sample. All the nominal values are
deflated by the Consumer Price Index (CPI) values provided on the Government of India website (www.goidirectory.nic.in).
For definitions of the variables please refer to Appendix A. All values are based on book values from Prowess (2001 edition), a
database maintained by CMIE, Center for Monitoring the Indian Economy. Prowess has annual financial data of private and
public Indian firms starting from 1989. While the coverage for public firms is comprehensive (due to reporting requirements),
the coverage for private firms is limited. We collect information under five broad categories from Prowess: Financials from
the annual reports, insider cashflow rights from the latest company disclosure filing, group affiliation, industry affiliation
and share price. We adopt Prowess’s group classification for identifying group affiliation. The identity of bankrupt firms is
based on the hand collected data from the Indian bankruptcy court. The information collected from the court includes the
company name and the year the firm was referred to the bankruptcy court. Data is for the period 1989 to 2001.
Summary Financials (Medians) of All Firms, Group Firms and Bankrupt FirmsSample
All Firms Group Firms Bankrupt Firms
(Standalone & Group) (GF) (Standalone & Group)
(1) (2) (3)
Total Assets (TA) (in Million Rupees) 1,307 2,656 668
EBIDTA (in Million Rupees) 122 255 24
Debt/TA 0.26 0.27 0.38
Director (in %) 36.7% 37.9% 29.8%
Age (in yrs) 20.1 27.1 20.5
Investments (growth rate of log assets in %) 10.0% 12.2% 6.2%
Fraction of Bankrupt Firms (in %) 20.5% 24.0% -
Number of Firm Years 40,406 11,988 7,237
36

Table II:
Summary Intra-Group Loan Characteristics For Group Firms
This table reports the details on the intra-group loans for group firms in our sample. All the nominal values are deflated
by the Consumer Price Index (CPI) values provided on the Government of India website (www.goidirectory.nic.in). For
definitions of the variables please refer to Appendix A. All values are based on book values from Prowess (2001 edition), a
database maintained by CMIE, Center for Monitoring the Indian Economy. Prowess has annual financial data of private and
public Indian firms starting from 1989. While the coverage for public firms is comprehensive (due to reporting requirements),
the coverage for private firms is limited. We collect information under five broad categories from Prowess: Financials from
the annual reports, insider cashflow rights from the latest company disclosure filing, group affiliation, industry affiliation
and share price. We adopt Prowess’s group classification for identifying group affiliation. Data is for the period 1989 to
2001.
Summary Intra-Group Loan Characteristics For Group FirmsSample: Group Firms
Mean Median Min Max
(1) (2) (3) (4)
Gross Group Loan Inflows (in Million Rupees) 295.2 279.1 0 669.1
Gross Group Loan Outflows (in Million Rupees) 55.6 47.3 0 377.6
Net Group Loans (in Million Rupees) 242.2 229.5 -372.1 663.1
Fraction of net receiversa in the Group (in %) 13% 11% 4% 19%
Fraction of net providersb in the Group (in %) 35% 28% 10% 42%
Group Loan Inflow/EBIDTA (in %) 59% 56% 0% 72.0%
Group Loans Inflow/Interest Payment (in %) 86% 85% 0% 94%
[a] net receivers : net intra-group loans are positive
[b] net providers : net intra-group loans are negative
37

Table III:
Group Support: Providers and Receivers of Intra-Group Loans
In Panel A, we estimate the following logit model on group firms: Prob (Providerit = 1) = Φ(γFirm Financialsit−1 +
Group F.E. + Industry F.E. + Time F.E.), where Φ denotes the logit distribution function. The standard errors reported
are robust. Data in this table (both the panels) is from Prowess for the period 1989 to 2001 (except when market to book
is used in which case the data is for the period 1992 to 2001). ***, ** and * denote significance at 1%, 5% and 10%
respectively.
Panel A: Characteristics of Providers of Group LoansDependent Variable: Providerit
(1) (2) (3) (4) (5)
Sizeit .36∗∗∗ .35∗∗(.012) (.012)
EBIDTA/TAit 2.54∗∗∗ 2.53∗∗∗(.52) (.53)
Tangibilityit .53∗∗∗ .51∗∗∗(.07) (.06)
Low Directori .008 .008(.006) (.006)
Number of Observations 7,520 7,520 7,520 7,520 7,520
Group Fixed Effects Yes Yes Yes Yes Yes
Industry Fixed Effects Yes Yes Yes Yes Yes
Time Fixed Effects Yes Yes Yes Yes Yes
Log-likelihood -693.7 -671.2 -651.3 -643.7 -712.3
p-value, χ2 test 0.00 0.00 0.00 0.00 0.00
38

In Panel B, we estimate the following regression on group firms: yit = α0+β1Xit +Group F.E.+Industry F.E.+Time F.E..
Other control variables include Size, Age and Sales Growth. The standard errors are corrected for heteroscedasticity and
autocorrelation (AR-1) in the panel.
Panel B: Characteristics of Firms Receiving Group LoansDependent Variable: Net Group Loans “to” Firm i/ Total Assets of i in year t
(1) (2) (3) (4) (5) (6) (7)
EBIDTA/TAit -.14∗∗∗ -.12∗∗∗(.03) (.02)
Debt/TAit .11∗∗∗ .12∗∗∗(.004) (.005)
Tangibilityit -.006∗∗ -.006∗∗(.003) (.003)
Market to Bookit .008 .008(.012) (.011)
Investment/Cash Flowit -.013 -.011(.024) (.023)
Low Directori -.0001∗ -.0001∗(.00006) (.00005)
Number of Observations 7,520 7,520 7,520 6,500 7,520 7,520 6,500
Group Fixed Effects Yes Yes Yes Yes Yes Yes Yes
Industry Fixed Effects Yes Yes Yes Yes Yes Yes Yes
Time Fixed Effects Yes Yes Yes Yes Yes Yes Yes
R2 0.35 0.36 0.35 0.33 0.29 0.33 0.38
39

Table IV:
Group Support: Response of Intra-Group Loans to Earning Shocks andPerformance of Receivers
In Panel A, we estimate the following model on group firms: yit = α0 + β1Shock−it + γControlsit + Firm F.E. + Time F.E..
Standard errors reported are corrected for heteroscedasticity and autocorrelation (AR-1) in the panel. Data in this table is
from Prowess for the period 1989 to 2001. ***, ** and * denote significance at 1%, 5% and 10% respectively.
Panel A: Response of Intra-Group Loans to Negative Earning ShocksGroup Firms
% ∆ in Net % ∆ in Gross % ∆ in Gross % ∆ in Net
loans “to” i loans “to” i loans “from” i loans “to” i
(1) (2) (3) (4)
Shock−it 2.270∗∗∗ 2.012∗∗∗ 2.071∗∗∗(.930) (.730) (.751)
Shock+it .462 .1471
(.927) (2.87)
Shock−it * Low Directori -.081∗∗∗(.035)
Number of Observations 7,390 7,390 7,390 7,390
Firm Fixed Effects Yes Yes Yes Yes
Time Fixed Effects Yes Yes Yes Yes
R2 0.51 0.50 0.22 0.51
In Panel B, we report the abnormal operating performance and abnormal stock return of the firms in the first quartile
sorted by group loans in the subsequent 1 and 2 year period after receiving group loans. We measure abnormal operating
performance as the difference between EBIDTA/TA of the firm i and median EBIDTA/TA of all firms in the same industry
j. We measure abnormal stock return as the difference between the firm i’s stock return and the return of the market index
(Rm), proxied by the BSE-200 index.
Panel B: Abnormal Operating and Stock Return Performance of ReceiversLoan Year: t0
t0 + 1 t0 + 2
(1) (2)
Performance of i adjusted for industry
{EBIDTATA
}i -11.32∗∗∗ -22.10∗∗∗
(in %) (1.39) (6.37)
Investment of i adjusted for industry
Investmenti -14.29∗∗∗ -19.07∗∗∗
(in %) (4.00) (3.74)
Stock Returns of i adjusted for market index
Ri-Rm -8.29∗∗ -17.31∗∗∗
(in %) (4.21) (3.44)
40

Table V:
Comparing Firm Level Bankruptcy Probabilities of Solvent Group andStandalone Firms
In this table we estimate the following model: Prob (Bankruptcyit = 1) = Φ(γFirm Financialsit−1+β1Directori+β2Groupi+
Industry F.E. + Time F.E.), where Φ denotes the logit distribution function. Other control variable used in the estimation
is Debt/TA. To compare the bankruptcy probability of a firm belonging to a solvent group and a stand alone firm, we drop
all firm year observations of a group after the first year in which one or more of its member firms become bankrupt. The
standard errors reported are robust and clustered at group level. Data in this table is from Prowess for the period 1992 to
2001. ***, ** and * denote significance at 1%, 5% and 10% respectively.
Dependent Variable: Bankruptcyit
All Firms All Firms Group Firms Group Firms
(1) (2) (3) (4)
Net Income/TAit−1 -1.37∗∗∗ -2.73∗∗∗ -2.03∗∗∗ -2.08∗∗∗(.247) (.327) (.787) (.789)
Working Capital/TAit−1 -1.29∗∗∗ -1.15∗∗∗ -1.20∗∗∗ -1.22∗∗∗(.180) (.256) (.37) (.40)
Market Value of Equity/Total Liabilitiesit−1 -.203∗∗∗ -.128∗∗∗ -.22∗∗∗ -.24∗∗∗(.038) (.034) (.09) (.10)
Sizeit−1 -.001∗ -.001∗ -.001 -.001(.0006) (.0007) (.008) (.009)
Directori -.015∗∗∗ -.016∗∗∗ -.019∗∗∗ -.015∗∗∗(.003) (.004) (.003) (.003)
Directori*Groupi -.001(.003)
Groupi -.515∗∗∗ -.216∗(.165) (.132)
%∆Group Loansit−1 -.101∗∗∗ -.97∗∗∗ -.92∗∗∗(.033) (.022) (.023)
%∆Predictedit−1 -1.32∗(.68)
Relative Shockit−1 -.94∗∗∗(.23)
Number of Observations 12,337 12,337 5,335 5,335
Group Fixed Effects No No Yes Yes
Industry Fixed Effects Yes Yes Yes Yes
Time Fixed Effects Yes Yes Yes Yes
Log-likelihood -1233.7 -1273.2 -553.1 -543.7
p-value, χ2 test 0.00 0.00 0.00 0.00
41

Table VI:
Terms of Intra-Group Loans for a Random Sample
This table presents the loan terms obtained from the annual reports for a random sample of 30 firms from the top quartile
of receivers in our sample. Since the annual report coverage in Prowess starts in 1999, terms on group loans before this
period are unavailable. The last column provides the minimum commercial lending rate of the market during the relevant
period. This information is obtained from the Reserve Bank of India website (www.rbi.org.in).
# Company Name Year Terms of Intra-Group Loan Market Rate
1. Consolidated Fibres & Chemicals Ltd.
1999
Unsecured loans of Rs. 287.2 million from as-
sociate companies and no interest accrued or re-
payable (interest rate: 0%)
12.25%
2000-2001
Unsecured loans of Rs. 369.7 million from as-
sociate companies and no interest accrued or re-
payable (interest rate: 0%)
11.50%
2004
Unsecured loans of Rs. 488.2 million from as-
sociate companies and no interest accrued or re-
payable (interest rate: 0%)
10.50%
2. India Seamless 1999
The Company, during this period has not pro-
vided for interest on loans from companies
amounting to Rs. 44.14 million and moreover
interest payable & provided for in earlier years
amounting to Rs. 15.14 million has been writ-
ten back and grouped under ‘Provision no longer
required’ (interest rate: 0%)
12.25%
3. Modi Alkalies & Chemicals Ltd.
2000-2002
As per past practice, the Company has not pro-
vided for interest liability of Rs. 26.63 million
on certain unsecured loans from Promoter com-
panies (interest rate: 0%)
11.50%
2003
As per past practice, the Company has not pro-
vided for interest liability of Rs. 28.92 million
on certain unsecured loans from Promoter com-
panies (interest rate: 0%)
11.00%
4. Nesco Ltd. 2004
The Company had taken unsecured intra group
loan of Rs. 40.99 million and the interest accrued
is Rs. 2.38 million (interest rate: 5.8%)
10.50%
5. Welspun 2002
The Company had taken interest free unsecured
intra group loan of Rs. 20.10 million (interest
rate: 0%)
11.12%
6. Balaji Industrial Corpn. Ltd.
2001-2002
The Company had taken interest free unsecured
intra-group loan of Rs. 39.20 million (interest
rate: 0%)
2003-2004
The Company had taken interest free unsecured
intra-group loan of Rs. 143.92 million (interest
rate: 0%)
10.66%
7. Tata Construction and Projects Ltd. 2000-2001
The Company has taken interest free intra-group
loan of Rs. 3.50 million in each of the years (in-
terest rate: 0%)
11.50%
42

# Company Name Year Terms of Intra-Group Loan Market Rate
8. DCM Silk Mills. 2001-2004
The Company has received interest free intra-
group loans of Rs. 232.49 million. Ultimate loss
may arise on these accounts (interest rate: 0%)11.00%
9. Indital Tintoria Ltd. 1999-2001
The Company has been granted interest free
intra-group loans of Rs. 248.96 million. Ulti-
mate loss may arise on these accounts (interest
rate: 0%)
12.00%
10. Hindustan Foods Ltd. 2003-2004
The Company has taken interest free loan from
its Holding Company in respect of which there is
no stipulation as to repayment. The amount is
57.48 million (interest rate: 0%)
10.66%
11. Visaka Industry Ltd. 2002-2004The Company has taken interest free group loan
of 25.80 million (interest rate: 0%)11.25%
12. ISPL Industries Ltd. 2001-2004
Intra corporate loans include an amount of Rs.
18.18 million (interest free) extended to compa-
nies in which the management of the Company
has active participation. The said loans have
been considered doubtful (interest rate: 0%)
11.00%
13. Jaypee Cement Ltd. 2000-2002Company has received interest-free group loans
of Rs. 22.90 million (interest rate: 0%)11.50%
14. Jaiprakash Power Ventures Ltd. 2000-2002The Company has been given interest-free group
loans of Rs. 29.70 million (interest rate: 0%)11.50%
15. Kinetic Engineering Ltd. 2002-2004
The Company has taken unsecured loans from
two group companies. Total loans: Rs. 263.50
million (interest rate: 6.00%)
11.25%
16. Madras Chipboard Ltd. 2002-2004
The Company has been granted interest free
group loans aggregating to Rs. 1500 million. (in-
terest rate: 0%)
11.25%
17. McDowell Alcobev Ltd. 2001-2004
The Company has been granted interest free
group loan of Rs. 691.3 million. (interest rate:
0%)
11.00%
18. McDowell International Brands Ltd. 2003-2004
The Company has been granted interest free
group loan of Rs. 20.91 million. (interest rate:
0%)
10.66%
19. Milkfood Ltd. 2004
The Company has taken interest free loans from
group companies and, year end balance of such
loans aggregate to Rs. 7.00 million. (interest
rate: 0%)
10.50%
20. Nilachal Refractories Ltd. 2001-2005
The Company has taken interest free loans from
group companies aggregating to Rs. 13.22 million
(interest rate: 0%)
10.90%
21. Omax Auto Ltd. 2004-2005
The Company has taken interest free loans from
group companies interest free unsecured loan
amounting to Rs. 54.79 million (interest rate:
0%)
10.50%
43

# Company Name Year Terms of Intra-Group Loan Market Rate
22. Rama Pulp & Papers Ltd. 2000-2004
Interest free loan of Rs. 36.18 million has been ex-
tended by companies in the group (interest rate:
0%)
11.50%
23. Premier Lighting Industries Ltd. 2000-2004
Interest free loan of Rs. 10.21 million has been ex-
tended by companies in the group (interest rate:
0%)
11.50%
24. Nirmal Plastic Industries 2000-2004
Interest free loan of Rs. 5.23 million has been ex-
tended by companies in the group (interest rate:
0%)
11.50%
25. Supreme Management Ltd. 2002-2004
Interest free loan of Rs. 38.61 million has been ex-
tended by companies in the group (interest rate:
0%)
11.25%
26. National Plywood Industries Ltd. 2000-2004
Interest free loan of Rs. 2.50 million has been
extended by companies in the group for each year
(interest rate: 0%)
11.50%
27. Atlanta Super Computers Pvt. Ltd. 2000-2003
Interest free loan of Rs. 2.00 million has been
extended by companies in the group for each year
(interest rate: 0%)
11.50%
28. Carbon Everflow Ltd. 2004
The Company has been granted interest free loan
aggregating to Rs.20 million by companies in the
group (interest rate: 0%)
10.50%
29. Steel Tubes of India Ltd. 2003-2004
The Company has not provided interest amount-
ing to Rs. 28.78 million on unsecured loans. The
accumulated losses on these loans is Rs. 51.24
million (interest rate: 5.4%)
10.66%
30. Punjab Chemicals & Pharmaceuticals Ltd. 2004
The Company has taken interest free loan from
group firms worth Rs. 14 million (interest rate:
0%)
10.50%
44

Table VII:
External Financing and Group Support after the First Bankruptcy in aGroup
In Panel A, we estimate the following model on all healthy group firms: yit = α0 + β1Preit + β2Post Bankruptcyit +
γControlsit+Firm F.E.+Time F.E.. Other control variables in Columns (3) and (4) are Provider, Post Bankruptcy*Provider,
Post Bankruptcy*Same Industry and Post Bankruptcy*Same State. The standard errors in all the regressions are corrected
for heteroscedasticity and autocorrelation (AR-1) in the panel. Data in this table is from Prowess for the period 1989 to
2001. We exclude the bankrupt firms from our estimation. ***, ** and * denote significance at 1%, 5% and 10% respectively.
Panel A: External Financing to Group Firm i Beforeand After the First Bankruptcy in its Group
Dependent Variable
Debti Equityi Debti Equityi
(1) (2) (3) (4)
Preit -7.49 -11.96 -7.77 -11.68(12.70) (13.41) (12.81) (13.77)
Post Bankruptcyit -17.64∗∗∗ -13.81∗∗ -16.76∗∗∗ -9.88∗∗(5.33) (6.64) (4.30) (5.27)
Sizeit 86.70∗∗∗ 48.06∗∗∗(17.65) (19.50)
EBIDTA/TAit 29.36∗∗ 31.06∗(14.90) (18.69)
Sales Growthit .72∗∗ 1.48∗∗(.28) (.48)
Post Bankruptcyit*Chairmani -13.20∗∗∗ -7.34∗(3.39) (3.75)
Number of Observations 6,855 6,855 6,855 6,855
Firm Fixed Effects Yes Yes Yes Yes
Time Fixed Effects Yes Yes Yes Yes
Post Bankruptcyit*Providerit No No Yes Yes
Post Bankruptcyit*Same Statei No No Yes Yes
Post Bankruptcyit*Same Industryi No No Yes Yes
R2 0.66 0.59 0.71 0.63
45

In Panel B, we estimate the following model on group firms: yit = α0 + β1Shock−it + β2Shock−it ∗ Post Bankruptcyit +
γControlsit +Firm F.E.+Time F.E.. Other control variables include Post Bankruptcy and in Columns (2) and (3) include
Provider and Post Bankruptcy*Provider. Standard errors reported are corrected for heteroscedasticity and autocorrelation
(AR-1) in the panel.
Panel B: Intra-Group Support Before and After Bankruptcy in a GroupDependent Variable: % Change in Net Group Loans “to” Firm i
(1) (2) (3)
Shock−it 2.513∗∗∗ 2.023∗∗∗ 2.421∗∗∗(.77) (.86) (.76)
Shock−it * Post Bankruptcyit -.911∗∗ -.603∗∗ -.610∗∗(.453) (.327) (.330)
Shock−it * Group RZi .321∗∗∗(.117)
Shock−it * Group RZi*Post Bankruptcyit -.127∗∗(.63)
Shock−it * Post Bankruptcyit*Same Industryi .015 .014(.121) (.120)
Shock−it * Post Bankruptcyit*Same Statei .011 .013(.37) (.33)
Shock−it * Post Bankruptcyit*Chairmani -.206∗∗(.103)
Number of Observations 6,855 6,855 6,855
Firm Fixed Effects Yes Yes Yes
Time Fixed Effects Yes Yes Yes
Post Bankruptcyit*Providerit No Yes Yes
R2 0.53 0.55 0.58
46

Table VIII:
Negative Spillovers: The Impact of Firm Bankruptcy on the BankruptcyProbability of Other Firms in the Group
This table reports the results of the following logit regression: Prob(Bankruptcyit = 1) = Φ(γFirm Financialsit−1 +
β1Directori + β2Groupi + β3Post Bankruptcyit + Industry F.E. + Time F.E.). Other control variables used in this estima-
tion are Size, Relative Shock and Debt/TA. In Column (3), we also include %∆Predicted, RZ Index, Provider and Post
Bankruptcy*Provider. The standard errors reported are robust and clustered at group level. Data in this table is from
Prowess for the period 1992 to 2001. We drop the bankrupt firms after they become bankrupt from our estimation. ***,
** and * denote significance at 1%, 5% and 10% respectively.
Dependent Variable: Bankruptcyit
All Firms Group Firms Group Firms
(1) (2) (3)
Net Income/Total Assetsit−1 -1.18∗∗∗ -1.28∗∗∗ -1.26∗∗∗(.236) (.235) (.235)
Working Capital/Total Assetsit−1 -1.35∗∗∗ -1.36∗∗∗ -1.35∗∗∗(.172) (.170) (.170)
Market Value of Equity/Total Liabilitiesit−1 -.205∗∗∗ -.232∗∗∗ -.228∗∗∗(.040) (.041) (.041)
Directori -.019∗∗∗ -.018∗∗∗ -.017∗∗∗(.003) (.003) (.004)
Groupi -.535∗∗∗(.172)
%∆Group Loansit−1 -.97∗∗∗ -.96∗∗∗(.026) (.025)
Post Bankruptcyit .592∗∗∗ .371∗∗∗ .290∗∗(.237) (.162) (.147)
Post Bankruptcyit*Chairmani 1.12∗∗∗(.320)
Post Bankruptcyit*RZ Indexi .81∗∗(.42)
Post Bankruptcyit*Same Industryi .001∗(.0006)
Post Bankruptcyit*Same Statei .002(.025)
Number of Observations 12,900 5,890 5,890
Group Fixed Effects No Yes Yes
Industry Fixed Effects Yes Yes Yes
Time Fixed Effects Yes Yes Yes
Post Bankruptcyit*Providerit No No Yes
Log-likelihood -1223.7 -592.1 -598.3
p-value, χ2 test 0.00 0.00 0.00
47