algebris ucits funds plc (an umbrella fund with ......london sw1y 4ah united kingdom sub investment...
TRANSCRIPT

ALGEBRIS UCITS FUNDS PLC
(an umbrella fund with segregated liability between Sub-Funds)
ANNUAL REPORT & AUDITED FINANCIAL STATEMENTS
FOR THE FINANCIAL YEAR ENDED 31 DECEMBER 2019

ALGEBRIS UCITS FUNDS PLC
Contents
1
Management and Administration 2-3
Investment Manager’s Report 4-11
Directors’ Report 12-15
Report of the Depositary to the Shareholders 16
Independent Auditor’s Report to the members of Algebris UCITS Funds plc 17-19
Statement of Financial Position 20-23
Statement of Comprehensive Income 24-31
Statement of Changes in Net Assets Attributable to Holders of Redeemable
Participating Shares 32-35
Statement of Cash Flows 36-39
Notes to the Financial Statements 40-215
Schedule of Investments 216-269
Schedule of Significant Changes in Investments (Unaudited) 270-283
Other Additional Disclosures (Unaudited) 284-296
ALGEBRIS UCITS FUNDS PLC
Management and Administration
2
Registered Office 33 Sir John Rogerson’s Quay
Dublin 2
Ireland
Directors* Alexander Lasagna
Carl O’Sullivan**
Desmond Quigley**
Investment Manager, Distributor
and Promoter
Algebris (UK) Limited
1 St James’s Market
London
SW1Y 4AH
United Kingdom
Sub Investment Managers Algebris Investments (Asia) Pte Limited
9 Straits View
#05-08 Marina One West Tower
Singapore 018937
Algebris Investments (US) Inc.
1209 Orange Street
Wilmington
New Castle County
Delaware 19801
USA
Depositary Prior to 1 April 2019
HSBC Institutional Trust Services (Ireland) DAC
1 Grand Canal Square
Grand Canal Harbour
Dublin 2
Ireland From 1 April 2019
HSBC France, Dublin Branch
1 Grand Canal Square
Grand Canal Harbour
Dublin 2
Ireland Administrator, Registrar and
Transfer Agent
HSBC Securities Services (Ireland) DAC
1 Grand Canal Square
Grand Canal Harbour
Dublin 2
Ireland
Independent Auditor
KPMG
1 Harbourmaster Place
IFSC
Dublin 1
Ireland

ALGEBRIS UCITS FUNDS PLC
Management and Administration (continued)
3
Legal Adviser Dillon Eustace
33 Sir John Rogerson’s Quay
Dublin 2
Ireland
Company Secretary Tudor Trust Limited
33 Sir John Rogerson’s Quay
Dublin 2
Ireland
Representative in Switzerland ACOLIN Fund Services AG
Leutschenbachstrasse 50
CH-8050 Zurich
Switzerland
Paying Agent in Switzerland Bank Vontobel Limited
43 Gotthardstrasse
CH-8022 Zurich
Switzerland
* All directors are non-executive
** Independent director
ALGEBRIS UCITS FUNDS PLC
Algebris Financial Credit Fund
Investment Manager’s Report
for the financial year ended 31 December 2019
4
2019 started on a positive note for risk assets as recessionary concerns reversed. The combination of favourable
market conditions and improved technical backdrop was positive for financial hybrids (particularly for those issued
by high beta and periphery names), whose spreads moved tighter across segments and geographies and recovered the
losses suffered in Q4 2018.
In March, the dovish twist from the main Central Banks took the spotlight and fuelled the credit markets in the
following months. The Fed made clear there wouldn’t be more raises in 2019 and even discussed the possibility of
cuts in the second semester, while the ECB announced downgrades that drove rates lower, and committed to a new
TLTRO3 (Targeted longer- term refinancing operations). This dovish rhetoric was one of the main drivers of
performance for our asset class. On the other hand, a marked increase in headlines around AML issues in March put
significant pressure on spreads, mostly in Northern and Eastern European names.
Meanwhile, fundamentals remained solid, particularly on the core names in the portfolio. The full 2018 year results
showed good resiliency of balance sheet and capital buffers to the recent volatility.
The second quarter started with resilient economic data, low volatility and positive developments in trade
negotiations, all contributing to a positive backdrop for risk assets. Italian names also benefitted from S&P’s decision
to affirm its BBB rating for Italy. April also marked the kick-off of the Q1 earnings season, with banks reporting
pressure on interest margins and an increase in Risk weighted assets, due to the much-anticipated introduction of
IFRS16 and TRIM. RWA inflation however was offset by strong organic capital generation, leaving capital ratios
broadly unchanged.
Confirmation of ongoing dovish rhetoric by key Central Banks in June pushed the markets again, with rates
tightening, curves bull flattening, credit indices rallying, and broader equity indices back to historic highs.
Performance across the financials’ capital structure was mixed, with a significant decoupling between the deeper
subordinated parts of credit and equities, which in effect pushed the average AT1 yields through the respective
European GSIFIs’ dividend yields. German banks were in the spotlight this time due to the ongoing media coverage
of the sector’s potential restructuring plans.
Central banks were once again firmly in the spotlight in July, as markets eagerly anticipated their course of action to
wrestle with stubbornly low inflation. In the US, the Fed delivered its first rate cut in over 10 years and terminated its
balance sheet reduction a couple of months earlier than expected. August was dominated by an increase in global
volatility due to the habitual Summer drop in market liquidity as well as a broader risk-off sentiment across higher
beta assets, resulting from the combination of ongoing global geopolitical uncertainties, weakening macroeconomic
trends, and potential inflection points in monetary policy. As a result, pricing action for the month saw a significant
outperformance of rates and credit over equities.
Third quarter results season started with a modestly constructive, yet mixed geographical tone as globally diversified
banks demonstrated their ability to mitigate margin and cost pressures in their home market whereas their more
domestically focused peers faced adverse headwinds. Despite regulatory headwinds, mainly related to adjustment of
internal models (‘TRIM’), net capital generation continued to be broadly positive.
The Fund continued to show strong performance in the last quarter of 2019. December was a robust risk-on month
across most assets driven mainly by constructive Central Banks’ actions, positive developments on the global trade
front, and encouraging events across European banks. In rates, duration sold off with curves steepening while across
Europe there was compression between periphery and core. Credit spreads tightened by approximately 7%, broadly
offsetting the rates move, with Financials outperforming the broader market also thanks to the approximate 4% gain
in their respective equity indices.
ALGEBRIS UCITS FUNDS PLC
Algebris Financial Income Fund
Investment Manager’s Report
for the financial year ended 31 December 2019
5
2019 started on a positive note for risk assets as recessionary concerns reversed. The combination of favourable
market conditions and improved technical backdrop was positive for financials. On the Equity side, bank indices
recovered a good part of the losses posted in December. Our portfolio did particularly well in January and February,
as we started the year with a bank sector trading at historic lows while most of the significant and persistent drags
kept falling away (deleveraging, restructuring costs, capital increases, provisions…). Q4 2018 earnings appeared to
confirm our view that the December swoon was not driven by fundamental factors. In fact, fundamentals remained
quite strong across regions, while valuations were highly attractive and estimates looked achievable. On the credit
side, spreads moved tighter across segments and geographies and recovered the losses suffered in Q4 2018.
In March, dovish commentary from both the ECB and the Fed sparked a sell off of financials stocks relative to the
market. On the other hand however, this triggered a positive repricing in credit markets. The ECB also announced a
new round of TLTRO (Targeted longer-term refinancing operations), which was positive for bank credit too.
In the meantime, bank fundamentals remained solid during the first quarter, particularly on the core names in the
portfolio. The full year results showed good resiliency of balance sheet and capital buffers to the recent volatility.
The second quarter started with a continuation of dovish statements from the central banks, resilient economic data,
low volatility and trade developments all contributing to a positive backdrop. The strong market and technical
backdrops, combined with the ECB’s renewed commitment to TLTRO3 continued to drive gains in the sector and
particularly in peripherals, with Italian names further benefitting from S&P’s decision to affirm its BBB rating for
Italy. In Europe, Q1 earnings results confirmed the market had grown overly bearish with respect to capital and
earnings generation. In the US, we had a positive upside catalyst in the Alts as Blackstone and Apollo announced
they will convert C-Corp from a publicly traded partnership (PTP), opening the door to a wider investor base and
index inclusion.
Central banks were once again firmly in the spotlight in July, as markets eagerly anticipated their course of action to
wrestle with stubbornly low inflation. In the US, the Fed delivered its first rate cut in over 10 years and terminated its
balance sheet reduction a couple of months earlier than expected. In Europe, the ECB fell short of direct action but
left a strong signal that it intends to engage in another round of easing measures after the Summer, which could entail
more QE, a tiered system for banks’ reserves, or more forceful forward guidance.
With the end of blackout period for third quarter results, European banks’ issuance picked up again with the volume
of new deals in November almost twice as much as the same month last year. Subordinated issuance was on par with
the highest months this year at just under EUR10bn, driven by issuers accessing the junior subordinated part of the
capital structure for the first time.
The Fund continued to show strong performance in the last quarter of 2019. December was a robust risk-on month
across most assets driven mainly by constructive Central Banks’ actions, positive developments on the global trade
front, and encouraging events across European banks. In rates, duration sold off with curves steepening while across
Europe there was compression between periphery and core. Credit spreads tightened by approximately 7%, broadly
offsetting the rates move, with Financials outperforming the broader market also thanks to the approximate 4% gain
in their respective equity indices.
ALGEBRIS UCITS FUNDS PLC
Algebris Allocation Fund (formerly Algebris Asset Allocation Fund)
Investment Manager’s Report
for the financial year ended 31 December 2019
6
At the beginning of January 2019 investors in the fund received a notification of proposed changes to the investment
objective and policy for the Algebris Asset Allocation Fund. After obtaining shareholder and regulatory approvals in
February, the fund transitioned to a new investment process, which is implemented mainly via investments in other
Algebris funds, and, to a lesser extent, direct investments in eligible assets. The fund name also changed to “Algebris
Allocation Fund”.
In January 2019 both equity and credit positions recovered a big part of the losses suffered in Q4 2018, as
recessionary concerns sharply reversed and economic growth consolidated across the US, Eurozone and China. The
combination of favourable market conditions and improved technical was positive for financial assets, particularly
for high beta and periphery names where the fund was overweight.
In February the fund transitioned to the new investment strategy, allocating assets to four Algebris funds: the
Algebris Financial Income Fund, Algebris Financial Credit Fund, Algebris Macro Credit Fund and Algebris Core
Italy Fund. Allocation to cash remained relatively high until April month end in order to reduce market risk,
particularly ahead of the scheduled UK departure from the EU. Despite the conservative positioning, the fund
benefited from the positive repricing in global markets in April as resilient economic data, low volatility and trade
developments created a favourable backdrop across sectors and geographies.
In May the fund made its first allocation to the recently launched Algebris Quant Arbitrage Fund, a quant driven
strategy that intends to benefit from changes in the volatility regime. The spike in tensions between US and China
jumped back and the renewed uncertainty around central banks’ monetary policy brought the monthly return of the
fund into negative territory. Confirmation of ongoing dovish rhetoric by key Central Banks fuelled the markets again
in June, with rates tightening, curves bull flattening, credit indices rallying, and broader equity indices back to
historic highs. Overall this benefitted the fund, reversing most of the negative performance in May.
The third quarter was again positive for the fund, with all underlying funds posting positive returns. The decrease in
cash exposure earlier in the year benefitted performance towards the end of the third and further into the fourth
quarter, as financial equities and credit picked up. Following September’s rally, the fund continued to post strong
performance until year-end, as all underlying funds performed well in the backdrop of constructive Central Banks’
actions, positive developments on the global trade front, and encouraging events across European banks.
In December the fund increased its allocation to the Algebris Macro Credit Fund and opened a position in the new
Algebris IG Financial Credit Fund, further decreasing cash allocation to 10%.
ALGEBRIS UCITS FUNDS PLC
Algebris Financial Equity Fund
Investment Manager’s Report
for the financial year ended 31 December 2019
7
2019 was a strong year for the funds performance. The year started on a positive note with bank indices recovering a
good part of the losses made in December 2018. We started the year with the bank sector trading at historic lows
while most of the significant and persistent drags kept falling away (deleveraging, restructuring costs, capital
increases, provisions…). In March, dovish commentary from both the ECB and the Fed sparked a sell-off of
financials stocks relative to the market. In the US, Chairman Powell once again surprised markets with a marked shift
in sentiment, causing rates to rally and the yield curve to invert.
Q2 saw volatility due to market sentiments and uncertainty around interest rates. April was a robust month for
financials and the fund had phenomenal performance. In Europe, Q1 earnings results confirmed the market had
grown overly bearish with respect to capital and earnings generation. In the US, we had a positive upside catalyst in
the Alts as Blackstone and Apollo announced they will convert C-Corp from a publicly traded partnership (PTP),
opening the door to a wider investor base and index inclusion. Following these positive developments in both Europe
and the US, we significantly reduced our overall gross and net exposures. Despite our more conservative positioning,
the magnitude of the sell-off in May pressured our long book and the fund gave back some of April’s strong
performance. June was again positive for the fund, but financials significantly lagged the broader indices. We were
mindful of an increasingly uncertain backdrop around rates and trade and had somewhat increased the size of our
hedge book to protect against further volatility.
In July, financials slightly underperformed the broader markets outside the US where banks rallied on a better than
feared earnings season. We continued to see value in some of our long positions including the alternative asset
manager and selective insurance stocks in the US at the back of their phenomenal business models. Meanwhile in
Europe, we continued to find compelling opportunities across various banks. In August, European banks fell 6.4% on
renewed trade-driven fears about slowing economic growth. As the ECB looked to cut rates further into negative
territory, the resulting risk to bank profitability remained at the top of mind for investors. However, in September, the
fund performance bounced back with the Fed cut rates whilst the ECB delivered both a small 10bp rate cut and an
open-ended package of stimulus, which was more dovish than expected. For the first time in this easing cycle, the
ECB attempted to offset the negative consequence on the banks by tiering deposits (i.e. not charging negative rates
for a large proportion of excess reserves held with the ECB) and providing better terms for the TLTROs. It seemed
the ECB realised that cutting rates is rather self-defeating if they hurt the main transmission mechanism i.e. banks’
lending to the real economy each time they cut.
In Q4 the fund saw a strong performance. ECB approved the first major buyback over the last decade in the banking
sector which was seen as a major positive step for bank equity specially following the rate cut and an attempt to
compensate banks, towards the end of Q3. In addition to this, the worries of low and negative interest rates were
reduced and seen more in context by the market, further supporting the upward trend.
ALGEBRIS UCITS FUNDS PLC
Algebris Macro Credit Fund
Investment Manager’s Report
for the financial year ended 31 December 2019
8
In 2019, the Algebris Macro Credit Fund returned over 20% gross. Around 40-50% of the return was generated from
alpha/idiosyncratic opportunities, and the remainder came from strong beta/ market performance. Across the different
asset classes, bond positions were the main contributors to the yearly performance, followed by credit and rates
derivatives.
The fund posted strong performance in the first quarter amid a rebound in risk assets from the December trough. The
broad selloff in risk that characterized 2018 reversed on the back of central banks guidance. Both the Fed and the
ECB signalled more easing, following weaker growth and choppy markets. In February, our bond portfolio continued
to benefit from the tightening in corporate spreads, as well as from the stabilisation in global PMIs. The release of its
updated “dot plots” by the Fed in March communicated no hikes expected in 2019 and only 1 in 2020. The dovish
turn continued to support risk-assets, particularly in Emerging Markets, where we had added exposure.
In April, risk assets continued to perform as global growth data showed signs of stabilisation and trade-war risks
remained low. Those risks re-emerged in May, however, bringing prices of risky assets down in what was the worst
month of 2019 for the fund. Anticipating a market correction ahead of the summer, we kept increasing the hedges for
our long credit portfolio with rate duration longs and equity put options.
After the small risk-off in May, June saw strong performance for risk-assets as central bankers broadly capitulated,
notably with Fed Chairman Powell discussing the possibility of rate cuts as early as July. We took profits from our
long positions in rates, but maintained exposure to credits, which further benefitted the fund in June. We further de-
risked the portfolio in July, increasing cash balances and solid liquid positions, mindful of the typical poor summer
liquidity.
In August as risk started to move weaker, we added long positions in credit and European government bonds. In
Italy, we saw the political developments as an opportunity for BTPs (Italian government bonds) to reconcile with the
rest of periphery so added risk into the political crisis. In Emerging Markets our book benefited from a small net
short in Argentina. Going into September, we remained focused on names with high fundamental quality, which
could benefit from a low rates environment. Given the strong bond market rally, we moved the emphasis from
market beta and focused on more idiosyncratic investments across HY credit and EM.
In September our views materialised as the ECB announced open-ended QE and political risks subsided in Europe,
notably with a change in Italy’s government. We took profits across assets as growth data showed little signs of
stabilisation. Into the last quarter we remained more positive on sovereign and bank debt than corporates, where we
saw weak balance sheets under pressure in a slow growth environment. We maintained long rates positions as a
hedge to the portfolio. The year finished with an improvement in macro data in assets with upside, like local
emerging market debt and equities.

ALGEBRIS UCITS FUNDS PLC
Algebris Core Italy Fund
Investment Manager’s Report
for the financial year ended 31 December 2019
9
The new year started on a positive note for the Italian stock market as well as for the global markets, after the
downturn in 2018. Q1 was a positive month for the fund performance. We continued to add names that had de-rated
significantly in the recent sell-off but had substantial revenue growth strategies. We also added some high-quality
names where we expected positive news flows. For the rest of the first quarter, our fund continued its upward trend
as Italian stock markets continued to rally thanks to well-received progress in the US-China negotiations and the
results of Italian local elections. Our credit portfolio rallied on the back of the ECB’s decision of postponing a
potential interest rate hike and the launch of a new round of TLTRO (Targeted longer-term refinancing operations).
After three months of straight positive performance, and with Italian company valuations reaching fair levels, we
started to sell some of the best performing stocks to add lower risk names with higher visibility and good dividend
yield.
The strong market and technical backdrops combined with the ECB’s renewed commitment to TLTRO3 continued to
drive gains in the space. In addition to this, S&P’s decision to affirm its BBB rating on Italy, led to a positive
performance of the fund in April. May was a turbulent month for the Italian stock market. Italian companies reported
weaker than expected Q1 results. At a macro level, poor results from domestic consumption and investments
negatively contributed to the market confidence amid an unstable domestic political situation. Responding to the
uncertainties, we kept on hedging the portfolio on both equity and credit, reducing our overall net exposure to the
market. Despite positive performance of the Italian assets in June, the Italian companies were still facing
uncertainties in the domestic political scenario due to prolonged tensions within the coalition government. However,
the positive resolution of the negotiations with the EU on excessive deficit, as well as a continued dovish approach of
the ECB on interest rates benefited the market and held investor confidence.
Q3 was volatile but ended with a strong performance in September. The volatility in the beginning of the quarter was
driven mostly by the global macro environment. In July tensions in HK grew with thousands of protesters attending
anti-government march and thus putting pressure over consumer spending in that area. Moreover, there was
continuous and growing tensions on trade war between the US and China. The month of August was dominated by
an increase in global volatility due to the habitual Summer drop in market liquidity. However, the market benefited
from the stimulus package of the ECB, which had a positive impact on the BTP-BUND spread as well. This trend has
favoured large caps more than mid-cap and small-cap names, and financial stocks were the main beneficiaries. The
Fed cut rates whilst the ECB delivered both a small 10bp rate cut and an open-ended package of stimulus, which was
more dovish than expected. Perhaps the more important point is that the ECB indicated they are very close to the
lower bound and that governments need to take over stimulating the economy with fiscal policy.
In Q4 the fund had a very strong performance. The Italian macro environment benefited from a slightly higher GDP
growth forecast for 2020 (+0.5/+0.6% YoY). Good news came also from the 2020 Budget Law approval, which
avoided implementing the VAT hike and the new PIR normative. On the political side, the scenario remained stable,
with minor internal tensions. December was a robust risk-on month across most assets driven mainly by constructive
Central Banks’ actions, positive developments on the global trade front, and encouraging events across European
banks. Agreement on a phase-one trade deal between the US and China was also a key driver of performance in
December.
ALGEBRIS UCITS FUNDS PLC
Algebris Quant Arbitrage Fund (formerly Algebris Tail Risk Fund)
Investment Manager’s Report
for the financial year ended 31 December 2019
10
On 10th of May 2019 the former Algebris Tail Risk Fund was restructured and renamed to the Algebris Quant
Arbitrage Fund, which follows a quantitative arbitrage investment strategy, with close to zero correlation to the
overall market behaviour. Until May 2019, while the fund was transitioning to the new strategy, the portfolio was
mostly held in cash and equivalent securities.
In May, equity markets had a partial retracement globally after four positive months of double-digit performance. In
Q2 and early Q3 2019 our indicators showed little signs of dispersion within equity indices or structural change in
volatility, despite sporadic increases in overall market volatility. The low dispersion resulted in fewer arbitrage
opportunities and relatively low gross exposure in the portfolio. June was a positive month, despite a market scenario
that was far from ideal for our strategy in terms of volatility and market dynamics. Performance was flat in July, in a
market environment with almost absent volatility.
During the month of August, the renewed escalation of trade tensions triggered profit taking in global equity markets,
resulting in a downward movement in both the US and in Europe. Equity market volatility indices also increased at
the beginning of the month, however due to the low liquidity this gentle spike of volatility did not translate into much
dispersion within global equities. Fund performance was negative, mainly due to the stretching of newly opened pairs
that had not reverted yet because of the lack of trading volumes.
In September our European and US portfolios benefited from the dispersion in global equity markets, triggered by
one of the biggest sector rotations out of relatively expensive stocks and into cheaper unloved sectors. In addition,
tensions in the US treasuries repo market gave rise to a second and more lingering wave of volatility that benefited
the fund. October was another positive month, with European and US equity indices trending higher and the volatility
gauges, VIX and V2X, moving consistently in the opposite direction. We saw some degree of dispersion on the
market, though well below the one in September. Dispersion at single share level was more pronounced in Europe
than in the US, with the former contributing most of the monthly profits in the portfolio.
Market volatility decreased both in European and US equity markets in November. This movement was forecasted by
our proprietary indicators both at single share and at index level. We took the opportunity to refresh our investable
universe, i.e. the list of stocks we select from to build our pairs. In order to complete the transition to the new
universe in a controlled manner, we decided to close all positions in December (traditionally a month of low
volatility and trading volumes) and started investing in pairs from the new investable universe at the beginning of
January 2020. The new investable universe consists of four different portfolios - US Large Cap, US Mid Cap,
European Large Cap and European Mid cap - traded separately but with the same strategy and methodology.
ALGEBRIS UCITS FUNDS PLC
Algebris IG Financial Credit Fund
Investment Manager’s Report
for the period from 5 November 2019 to 31 December 2019
11
The Fund was launched on 4 November 2019. This was a strong month for financial credit with a more mixed picture
across other risk assets. Perceived progress on an “Phase I” trade deal between the US and China combined with
better than expected economic data drove global equity markets broadly higher, banks performed well in November
across the capital structure and geographies.
December was a robust risk on month across most assets driven mainly by constructive Central Banks’ actions,
positive developments on the global trade front, and encouraging events across European banks. In rates, duration
sold off with curves steepening while across Europe there was compression between periphery and core. Credit
spreads tightened by approximately 7% broadly offsetting the rates move, with Financials outperforming the broader
market also thanks to the approximate 4% gain in their respective equity indices.

ALGEBRIS UCITS FUNDS PLC
Directors’ Report
12
The Directors present their annual report and the audited financial statements for the year ended 31 December 2019.
Activities, business review and future prospects
Algebris UCITS Funds plc (the “Company”) was incorporated on 17 February 2012 as an umbrella fund with
segregated liability between Sub-Funds pursuant to the Companies Act 2014 and the Central Bank (Supervision
and Enforcement Act 2013 (Section 48(1)) (Undertakings for Collective Investment in Transferable Securities)
Regulations 2015 (the "Central Bank UCITS Regulations"). The assets of each Sub-Fund will be invested
separately on behalf of each Sub-Fund in accordance with the investment objective and policies of each Sub-Fund.
As at the date of this report the Company comprised of eight Sub-Funds: Algebris Financial Credit Fund, Algebris
Financial Income Fund, Algebris Allocation Fund (formerly known as Algebris Asset Allocation Fund), Algebris
Financial Equity Fund, Algebris Macro Credit Fund, Algebris Core Italy Fund, Algebris Quant Arbitrage Fund
(formerly known as Algebris Tail Risk Fund) and Algebris IG Financial Credit Fund (launched on 5 November
2019).
A detailed business review is outlined in the Investment Manager’s Reports on pages 4-11.
Principal risks and uncertainties
The Company is an umbrella fund with segregated liability between Sub-Funds. The principal risks facing the
Company relate primarily to the holding of financial instruments and markets in which it invests. The most
significant types of financial risk to which the Company is exposed are market risk, credit risk and liquidity risk.
Market risk includes other price risk, currency risk and interest rate risk. Details of the risks associated with
financial instruments are included in Note 14 to the financial statements.
Investment in the Sub-Funds carries with it a degree of risk including, but not limited to, the risks referred to in the
prospectus and relevant supplements and Note 14 of these financial statements.
On 31 January 2020, the United Kingdom (the “UK”) officially withdrew from the European Union (the “EU”).
This was subsequent to the UK and EU having agreed the wider terms of the UK’s withdrawal from the EU
pursuant to the Agreement on the Withdrawal of the United Kingdom of Great Britain and Northern Ireland from
the European Union and the European Atomic Energy Community (2020), which provides for a period from 1
February 2020 until 31 December 2020, during which EU law continues to apply in the UK (the “Transitional
Period”).
During the Transitional Period, the UK and the EU will enter negotiations with respect to the UK’s future
relationship with the EU.
During and possibly after the Transitional Period, there is likely to be uncertainty as to the position of the UK and
the arrangements that will apply to its relationships with the EU and other countries following the end of the
Transitional Period. This uncertainty may lead to volatility in the financial markets of the UK and more broadly
across Europe and may also lead to weakening in consumer, corporate and financial confidence in such markets.
There is also likely to be changes to laws and regulations in the UK. The impact of such events on the Fund and on
the position of shareholders/investors is difficult to predict but they may adversely affect the return on the Fund and
its investments.
Each of the Administrator, Depository, Investment Manager, Sub-Investment Manager and other service providers
to the Company and their delegates may be affected by force majeure events (i.e., events beyond the control of the
party claiming that the event has occurred, including, without limitation, acts of God, fire, flood, earthquakes,
outbreaks of an infectious disease, pandemic or any other serious public health concern, war, terrorism and labour
strikes, major plant breakdowns, pipeline or electricity line ruptures, failure of technology, defective design and
construction, accidents, demographic changes, government macroeconomic policies and social instability). Some
force majeure events may adversely affect the ability of any such parties to perform their obligations to the
Company until they are able to remedy the force majeure event. While it is expected that such service providers
will implement contingency plans for addressing force majeure events it is possible that such force majeure events
exceed the assumptions of such plans.
ALGEBRIS UCITS FUNDS PLC
Directors’ Report (continued)
13
Principal risks and uncertainties (continued)
Certain force majeure events (such as war or an outbreak of an infectious disease) may also have a broader negative
impact on the world economy and international business activity generally, or in any of the countries in which the
Funds may invest specifically. Since late 2019, several countries have experienced outbreaks of a novel
coronavirus (nCoV) which is from a family of viruses that cause illnesses ranging from the common cold to more
severe diseases. Any spread of an infectious illness or similar public health threat could reduce consumer demand
or economic output, impact on the market value of investments, result in market closures, travel restrictions or
quarantines, and generally have a significant impact on the world economy and disrupt markets. The nature and
extent of the impact of such events is difficult to predict but they may adversely affect the return on each Fund and
its investments. Market disruptions or closures may result in the Investment Manager being unable to accurately
value the assets of a Fund, or in the event of high levels of redemption, the Company may use certain liquidity
management tools permitted by the Central Bank, including deferred redemptions, the implementation of fair value
pricing or temporarily suspension of a Fund.
Results and dividends
The results for the financial year are shown in the Statement of Comprehensive Income on pages 24-31. Dividends
amounting to EUR 108,518,718 were declared during the financial year ended 31 December 2019 for the Algebris
Financial Credit Fund, EUR 486,565 for the Algebris Financial Equity Fund, EUR 9,945,988 for the Algebris
Financial Income Fund and EUR 11,681,381 for the Algebris Macro Credit Fund. No dividends were declared for
the Algebris Allocation Fund, Algebris Core Italy Fund, Algebris Quant Arbitrage Fund and Algebris IG Financial
Credit Fund.
Directors
The directors that served at any time during the financial year and up to the date of approval of the financial
statements are listed below –
- Alexander Lasagna - Carl O’Sullivan - Desmond Quigley
All directors served for the entire year unless otherwise indicated.
Directors’ and secretary’s interests
Alexander Lasagna, Director of the Company, holds 31,796 shares in Algebris Financial Equity Fund. None of the
other Directors nor the Company Secretary held any interest, beneficial or otherwise, in the share capital of the
Company during or at the end of the financial year.
ALGEBRIS UCITS FUNDS PLC
Directors’ Report (continued)
14
Statement of Directors’ responsibilities
The Directors are responsible for preparing the financial statements in accordance with applicable Irish law and
International Financial Reporting Standards (“IFRS”) as adopted by the European Union (“EU”).
Irish company law requires the Directors to prepare financial statements for each financial year, which give a true
and fair view of the assets, liabilities and financial position and profit or loss of Algebris UCITS Funds plc for that
financial year. In preparing these financial statements, the Directors are required to:
select suitable accounting policies and then apply them consistently;
make judgements and estimates that are reasonable and prudent;
state whether applicable Accounting Standards have been followed, subject to any material departures
disclosed and explained in the financial statements;
assess the Company’s ability to continue as a going concern;
use the going concern basis of accounting unless they either intend to liquidate the Company or to cease
operations, or have no realistic alternative but to do so.
The directors are responsible for keeping adequate accounting records with reasonable accuracy at any time the
assets, liabilities, financial position and profit or loss of the Company and enable them to ensure that its financial
statements comply with the Companies Act 2014, the European Communities (Undertakings for Collective
Investments in Transferrable Securities) Regulations 2011 and the Central Bank (Supervision and Enforcement)
Act 2013 (Section 48 (1)) (Undertakings for Collective Investments in Transferrable Securities) Regulations 2019.
They have general responsibility for taking such steps as are reasonably open to them to safeguard the assets of the
Company. In this regard they have entrusted the assets of the Company to a trustee for safe-keeping. They are
responsible for such internal controls as they determine is necessary to enable the preparation of financial
statements that are free from material misstatement, whether due to fraud or error, and to prevent and detect fraud
and other irregularities. The directors are also responsible for preparing a Director's Report that complies with the
requirements of the Companies Act 2014.
Under the Central Bank UCITS Regulations, the Directors are required to entrust the assets of the Company to the Depositary for safe-keeping. In carrying out this duty, the Directors have delegated custody of the Company’s assets to HSBC France, Dublin Branch, 1 Grand Canal Square, Grand Canal Harbour, Dublin 2.
Accounting Records The measures taken by the Directors to secure compliance with the Company’s obligation to keep adequate accounting records are the use of appropriate systems and procedures through the employment of competent service providers. The accounting records are kept at HSBC Securities Services (Ireland) DAC, 1 Grand Canal Square, Grand Canal Harbour, Dublin 2. Connected Persons Transactions In accordance with the requirements of the Central Bank UCITS Regulations, all transactions carried out with the Company by the management company or depositary of a UCITS, and the delegate or sub-delegates of such a management company or depositary (excluding any non-group company sub-depositaries appointed by a depositary), and any associated or group companies of such a management company, depositary, delegate or sub-delegate (“connected parties”) must be carried out as if negotiated at arm’s length and be in the best interests of shareholders. The Directors are satisfied that there are arrangements (evidenced by written procedures) in place to ensure that the obligations set out in the Central Bank UCITS Regulations are applied to all transactions with connected persons and transactions with connected persons entered into during the period complied with the obligations set out in the Central Bank UCITS Regulations.
ALGEBRIS UCITS FUNDS PLC
Directors’ Report (continued)
15
Corporate Governance Code
The Board of Directors has assessed the measures included in the voluntary Corporate Governance Code for
Collective Investment Schemes and Management Companies as published by Irish Funds in December 2011 (the
“IF Code”). The Board has adopted all corporate governance practices and procedures in the IF Code with effect
from 19 October 2012.
Significant events during the financial year
Significant events during the financial year are disclosed in Note 20.
Subsequent events
Significant events since the financial year end are disclosed in Note 21.
Independent auditor
The independent auditor, KPMG, have indicated their willingness to remain in office in accordance with the
provisions of section 383(2) of the Companies Act 2014.
Directors Compliance Statement
The Directors confirm, in accordance with Section 225 of the Companies Act 2014, that the following has been
completed:
- produced a compliance policy statement setting out the Company's compliance policies;
- established arrangements/structures sufficient to “secure material compliance” with the Company's “relevant
obligations”; and
- conducted a review of these arrangements/structures during the financial year ended 31 December 2019.
Audit Committee
Section 167 (2) of the Companies Act 2014 requires the Board of Directors to either establish an audit committee
or decide not to establish such a committee. The Directors believe that there is no requirement to form an audit
committee as:
- the Board is comprised of non-executive Directors and two independent Directors;
- the Company complies with the provisions of the Irish Funds’ Corporate Governance Code;
Audit Information Statement
As per Section 330 of the Companies Act 2014,
- so far as the Directors are aware, there is no relevant audit information of which the Company’s statutory
auditor is unaware; and
- the Directors have taken all the steps that they ought to have taken as a Director in order to make themselves
aware of any relevant audit information and to establish that the Company’s statutory auditor is aware of that
information.
On behalf of the Board
Director: Desmond Quigley Director: Carl O’Sullivan 22 April 2020

INDEPENDENT AUDITOR’S REPORT TO THE MEMBERS OF ALGEBRIS UCITS FUNDS PLC
Report on the audit of the financial statements
Opinion We have audited the financial statements of Algebris UCITS Funds plc (‘the Company’) for the year ended 31 December 2019 set out on pages 20 to 269, which comprise the Statement of Financial Position, Statement of Comprehensive Income, Statement of Changes in Net Assets Attributable to Holders of Redeemable Participating Shares, Statement of Cash Flows and related notes, including the summary of significant accounting policies set out in note 2.The financial reporting framework that has been applied in their preparation is Irish Law and International Financial Reporting Standards (IFRS) as adopted by the European Union.
Opinion under International Standards on Auditing (Ireland) (ISAs (Ireland))
In our opinion, the accompanying financial statements:
• give a true and fair view of the assets, liabilities and financial position of the Company as at 31December 2019 and of its increase in net assets attributable to holders of redeemable participatingshares for the year then ended;
• have been properly prepared in accordance with IFRS as adopted by the European Union; and
• have been properly prepared in accordance with the requirements of the Companies Act 2014, theEuropean Communities (Undertakings for Collective Investment in Transferable Securities)Regulations 2011 and the Central Bank (Supervision and Enforcement) Act 2013 (Section 48(1))(Undertakings for Collective Investment in Transferable Securities) Regulations 2019.
Opinion under generally accepted auditing standards in the United States of America (‘U.S. GAAS’)
In our opinion, the financial statements present fairly, in all material respects, the financial position of the Company at 31 December 2019 and the results of its operations and its cash flows for the year then ended in accordance with IFRS as adopted by EU and applicable law.
Basis for opinion We conducted our audit in accordance with International Standards on Auditing (Ireland) (ISAs (Ireland)) and applicable law and in accordance with US GAAS. Our responsibilities under those standards are further described in the Auditor's responsibilities for the audit of the financial statements section of our report. We are independent of the Company in accordance with ethical requirements that are relevant to our audit of financial statements in Ireland, including the Ethical Standard issued by the Irish Auditing and Accounting Supervisory Authority (IAASA), together with the American Institute of Certified Public Accountants (AICPA) Code of Professional Conduct and we have fulfilled our other ethical responsibilities in accordance with these requirements.
We believe that the audit evidence we have obtained is sufficient and appropriate to provide a basis for our opinion.
INDEPENDENT AUDITOR’S REPORT TO THE MEMBERS OF ALGEBRIS UCITS FUNDS PLC (continued) We have nothing to report on going concern We are required to report to you if we have concluded that the use of the going concern basis of accounting is inappropriate or there is an undisclosed material uncertainty that may cast significant doubt over the use of that basis for a period of at least twelve months from the date of approval of the financial statements. We have nothing to report in these respects. Other information The directors are responsible for the other information presented in the Annual Report together with the financial statements. The other information comprises the information included in the directors’ report, the investment manager’s report, the report of the depositary to the shareholders, the schedule of significant changes in investments and the other additional disclosures. The financial statements and our auditor’s report thereon do not comprise part of the other information. Our opinion on the financial statements does not cover the other information and, accordingly, we do not express an audit opinion or, except as explicitly stated below, any form of assurance conclusion thereon. Our responsibility is to read the other information and, in doing so, consider whether, based on our financial statements audit work, the information therein is materially misstated or inconsistent with the financial statements or our audit knowledge. Based solely on that work we have not identified material misstatements in the other information. Based solely on our work on the other information, we report that: • we have not identified material misstatements in the directors’ report; • in our opinion, the information given in the directors’ report is consistent with the financial statements; • in our opinion, the directors’ report has been prepared in accordance with the Companies Act 2014. Opinions on other matters prescribed by the Companies Act 2014 We have obtained all the information and explanations which we consider necessary for the purposes of our audit. In our opinion the accounting records of the Company were sufficient to permit the financial statements to be readily and properly audited and the financial statements are in agreement with the accounting records. Matters on which we are required to report by exception The Companies Act 2014 requires us to report to you if, in our opinion, the disclosures of directors’ remuneration and transactions required by Sections 305 to 312 of the Act are not made. We have nothing to report in this regard. Respective responsibilities and restrictions on use Responsibilities of directors for the financial statements As explained more fully in the directors’ responsibilities statement set out on page 14, the directors are responsible for: the preparation of the financial statements including being satisfied that they give a true and fair view; such internal control as they determine is necessary to enable the preparation of financial statements that are free from material misstatement, whether due to fraud or error; assessing the Company’s ability to continue as a going concern, disclosing, as applicable, matters related to going concern; and using the going concern basis of accounting unless liquidation is imminent, except for a liquidation plan that was specified in the entity's governing documents at the entity's inception.
INDEPENDENT AUDITOR’S REPORT TO THE MEMBERS OF ALGEBRIS UCITS FUNDS PLC (continued) Director’s responsibilities for the financial statements in accordance with US GAAS The directors are responsible for the preparation and fair presentation of the financial statements in accordance with the applicable financial reporting framework, including the design, implementation and maintenance of internal control relevant to the preparation and fair presentation of financial statements that are free from material misstatement, whether due to fraud or error. Auditor’s responsibilities for the audit of the financial statements Our objectives are to obtain reasonable assurance about whether the financial statements as a whole are free from material misstatement, whether due to fraud or error, and to issue an auditor's report that includes our opinion. Reasonable assurance is a high level of assurance, but is not a guarantee that an audit conducted in accordance with ISAs (Ireland) will always detect a material misstatement when it exists. Misstatements can arise from fraud or error and are considered material if, individually or in the aggregate, they could reasonably be expected to influence the economic decisions of users taken on the basis of these financial statements. A fuller description of our responsibilities is provided on IAASA’s website at https://www.iaasa.ie/getmedia/b2389013-1cf6-458b-9b8f-a98202dc9c3a/Description_of_auditors_responsiblities_for_audit.pdf. Auditor’s responsibilities in accordance with US GAAS Our responsibility is to express an opinion on these financial statements based on our audit. We conducted our audit in accordance with U.S. GAAS. Those standards require that we plan and perform the audit to obtain reasonable assurance about whether the financial statements are free of material misstatement. An audit performed in accordance with U.S. GAAS involves performing procedures to obtain audit evidence about the amounts and disclosures in the financial statements. The procedures selected depend on the auditors’ judgment, including the assessment of the risks of material misstatement of the financial statements, whether due to fraud or error. In making those risk assessments, the auditor considers internal control relevant to the entity’s preparation and fair presentation of the financial statements in order to design audit procedures that are appropriate in the circumstances, but not for the purpose of expressing an opinion on the effectiveness of the entity’s internal control. Accordingly, we express no such opinion. An audit also includes evaluating the appropriateness of accounting policies used and the reasonableness of significant accounting estimates made by management, as well as evaluating the overall presentation of the financial statements. The purpose of our audit work and to whom we owe our responsibilities Our report is made solely to the Company’s members, as a body, in accordance with Section 391 of the Companies Act 2014. Our audit work has been undertaken so that we might state to the Company’s members those matters we are required to state to them in an auditor’s report and for no other purpose. To the fullest extent permitted by law, we do not accept or assume responsibility to anyone other than the Company and the Company’s members, as a body, for our audit work, for this report, or for the opinions we have formed.
Brian Clavin 22 April 2020 for and on behalf of KPMG Chartered Accountants, Statutory Audit Firm 1 Harbourmaster Place, IFSC, Dublin 1
ALGEBRIS UCITS FUNDS PLC
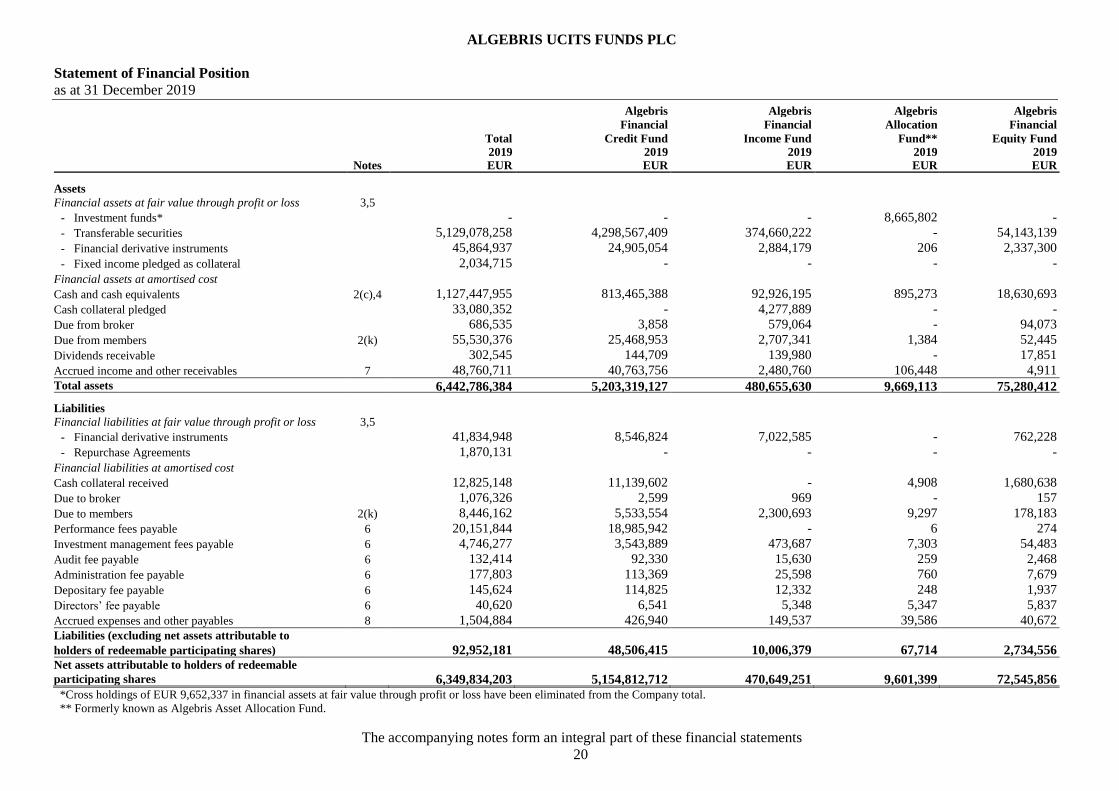
Statement of Financial Position
as at 31 December 2019
The accompanying notes form an integral part of these financial statements
20
Algebris Algebris Algebris Algebris
Financial Financial Allocation Financial
Total Credit Fund Income Fund Fund** Equity Fund 2019 2019 2019 2019 2019
Notes EUR EUR EUR EUR EUR
Assets
Financial assets at fair value through profit or loss 3,5
- Investment funds* - - - 8,665,802 -
- Transferable securities 5,129,078,258 4,298,567,409 374,660,222 - 54,143,139
- Financial derivative instruments 45,864,937 24,905,054 2,884,179 206 2,337,300
- Fixed income pledged as collateral 2,034,715 - - - -
Financial assets at amortised cost
Cash and cash equivalents 2(c),4 1,127,447,955 813,465,388 92,926,195 895,273 18,630,693
Cash collateral pledged 33,080,352 - 4,277,889 - -
Due from broker 686,535 3,858 579,064 - 94,073
Due from members 2(k) 55,530,376 25,468,953 2,707,341 1,384 52,445
Dividends receivable 302,545 144,709 139,980 - 17,851
Accrued income and other receivables 7 48,760,711 40,763,756 2,480,760 106,448 4,911 Total assets 6,442,786,384 5,203,319,127 480,655,630 9,669,113 75,280,412 Liabilities
Financial liabilities at fair value through profit or loss 3,5
- Financial derivative instruments 41,834,948 8,546,824 7,022,585 - 762,228
- Repurchase Agreements 1,870,131 - - - -
Financial liabilities at amortised cost
Cash collateral received 12,825,148 11,139,602 - 4,908 1,680,638
Due to broker 1,076,326 2,599 969 - 157
Due to members 2(k) 8,446,162 5,533,554 2,300,693 9,297 178,183
Performance fees payable 6 20,151,844 18,985,942 - 6 274
Investment management fees payable 6 4,746,277 3,543,889 473,687 7,303 54,483
Audit fee payable 6 132,414 92,330 15,630 259 2,468
Administration fee payable 6 177,803 113,369 25,598 760 7,679
Depositary fee payable 6 145,624 114,825 12,332 248 1,937
Directors’ fee payable 6 40,620 6,541 5,348 5,347 5,837
Accrued expenses and other payables 8 1,504,884 426,940 149,537 39,586 40,672 Liabilities (excluding net assets attributable to
holders of redeemable participating shares) 92,952,181 48,506,415 10,006,379 67,714 2,734,556 Net assets attributable to holders of redeemable
participating shares 6,349,834,203 5,154,812,712 470,649,251 9,601,399 72,545,856
*Cross holdings of EUR 9,652,337 in financial assets at fair value through profit or loss have been eliminated from the Company total. ** Formerly known as Algebris Asset Allocation Fund.

ALGEBRIS UCITS FUNDS PLC
Statement of Financial Position (continued)
as at 31 December 2019
The accompanying notes form an integral part of these financial statements
21
Algebris Algebris Algebris Algebris
Macro Credit Core Italy Quant Arbitrage IG Financial
Fund Fund Fund*** Credit Fund 2019 2019 2019 2019
Notes EUR EUR EUR EUR Assets
Financial assets at fair value through profit or loss 3,5
- Investment funds* - - - 986,535
- Transferable securities 325,850,177 46,536,520 23,314,279 6,006,512
- Financial derivative instruments 15,408,842 308,993 2 20,361
- Fixed income pledged as collateral 2,034,715 - - -
Financial assets at amortized cost
Cash and cash equivalents 2(c),4 179,923,539 2,053,033 11,914,445 7,639,389
Cash collateral pledged 28,799,775 - 2,688 -
Due from broker 135 - 9,405 -
Due from members 2(k) 2,190,738 20,014 43,280 25,046,221
Dividends receivable - - 5 -
Accrued income and other receivables 7 5,190,943 36,121 104,485 73,287 Total assets 559,398,864 48,954,681 35,388,589 39,772,305 Liabilities Financial liabilities at fair value through profit or loss 3,5
- Financial derivative instruments 25,486,416 345 485 16,065
- Repurchase Agreements 1,870,131 - - -
Financial liabilities at amortized cost
Cash collateral received - - - -
Due to broker 16 - 9,059 1,063,526
Due to members 2(k) 406,760 11,943 5,732 -
Performance fees payable 6 1,160,038 2,464 3,120 -
Investment management fees payable 6 643,944 11,259 8,947 2,765
Audit fee payable 6 16,235 4,150 1,302 40
Administration fee payable 6 24,438 2,470 2,672 817
Depositary fee payable 6 13,688 1,273 831 490
Directors’ fee payable 6 5,347 5,348 5,681 1,171
Accrued expenses and other payables 8 811,676 16,933 13,000 6,540
Liabilities (excluding net assets attributable to
holders of redeemable participating shares) 30,438,689 56,185 50,829 1,091,414
Net assets attributable to holders of redeemable participating shares 528,960,175 48,898,496 35,337,760 38,680,891
*** Formerly known as Algebris Tail Risk Fund.
Approved on behalf of the Board
Director: Carl O’Sullivan Director: Desmond Quigley 22 April 2020
ALGEBRIS UCITS FUNDS PLC
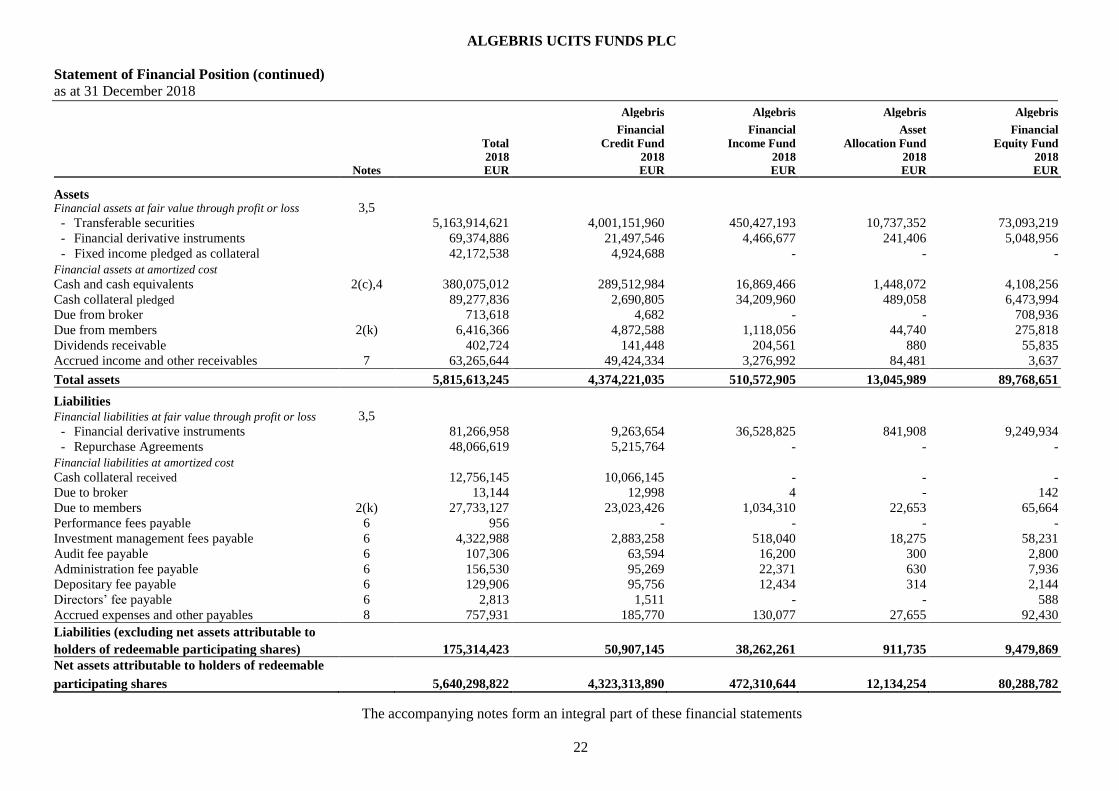
Statement of Financial Position (continued)
as at 31 December 2018
The accompanying notes form an integral part of these financial statements
22
Algebris Algebris Algebris Algebris
Financial Financial Asset Financial
Total Credit Fund Income Fund Allocation Fund Equity Fund 2018 2018 2018 2018 2018
Notes EUR EUR EUR EUR EUR
Assets Financial assets at fair value through profit or loss 3,5
- Transferable securities 5,163,914,621 4,001,151,960 450,427,193 10,737,352 73,093,219
- Financial derivative instruments 69,374,886 21,497,546 4,466,677 241,406 5,048,956
- Fixed income pledged as collateral 42,172,538 4,924,688 - - -
Financial assets at amortized cost
Cash and cash equivalents 2(c),4 380,075,012 289,512,984 16,869,466 1,448,072 4,108,256
Cash collateral pledged 89,277,836 2,690,805 34,209,960 489,058 6,473,994
Due from broker 713,618 4,682 - - 708,936
Due from members 2(k) 6,416,366 4,872,588 1,118,056 44,740 275,818
Dividends receivable 402,724 141,448 204,561 880 55,835
Accrued income and other receivables 7 63,265,644 49,424,334 3,276,992 84,481 3,637
Total assets 5,815,613,245 4,374,221,035 510,572,905 13,045,989 89,768,651
Liabilities
Financial liabilities at fair value through profit or loss 3,5
- Financial derivative instruments 81,266,958 9,263,654 36,528,825 841,908 9,249,934
- Repurchase Agreements 48,066,619 5,215,764 - - -
Financial liabilities at amortized cost
Cash collateral received 12,756,145 10,066,145 - - -
Due to broker 13,144 12,998 4 - 142
Due to members 2(k) 27,733,127 23,023,426 1,034,310 22,653 65,664
Performance fees payable 6 956 - - - -
Investment management fees payable 6 4,322,988 2,883,258 518,040 18,275 58,231
Audit fee payable 6 107,306 63,594 16,200 300 2,800
Administration fee payable 6 156,530 95,269 22,371 630 7,936
Depositary fee payable 6 129,906 95,756 12,434 314 2,144
Directors’ fee payable 6 2,813 1,511 - - 588
Accrued expenses and other payables 8 757,931 185,770 130,077 27,655 92,430
Liabilities (excluding net assets attributable to
holders of redeemable participating shares) 175,314,423 50,907,145 38,262,261 911,735 9,479,869
Net assets attributable to holders of redeemable
participating shares 5,640,298,822 4,323,313,890 472,310,644 12,134,254 80,288,782

ALGEBRIS UCITS FUNDS PLC
Statement of Financial Position (continued)
as at 31 December 2018
The accompanying notes form an integral part of these financial statements
23
Algebris Algebris Algebris
Macro Credit Core Italy Tail Risk
Fund Fund Fund 2018 2018 2018 Notes EUR EUR EUR Assets Financial assets at fair value through profit or loss 3,5
- Transferable securities 585,164,807 35,063,798 8,276,292
- Financial derivative instruments 37,976,122 58,576 85,603
- Fixed income pledged as collateral 37,215,337 32,513 -
Financial assets at amortized cost
Cash and cash equivalents 2(c),4 63,624,139 794,750 3,717,345
Cash collateral pledged 45,324,019 - 90,000
Due from broker - - -
Due from members 2(k) 75,833 29,331 -
Dividends receivable - - -
Accrued income and other receivables 7 10,128,360 323,018 24,822
Total assets 779,508,617 36,301,986 12,194,062
Liabilities
Financial liabilities at fair value through profit or loss 3,5
- Financial derivative instruments 25,380,059 279 2,299
- Repurchase Agreements 42,579,231 271,624 -
Financial liabilities at amortized cost
Cash collateral received 2,690,000 - -
Due to broker - - -
Due to members 2(k) 3,587,074 - -
Performance fees payable 6 - - 956
Investment management fees payable 6 835,705 7,935 1,544
Audit fee payable 6 19,000 4,357 1,055
Administration fee payable 6 27,641 1,644 1,039
Depositary fee payable 6 17,837 922 499
Directors’ fee payable 6 - - 714
Accrued expenses and other payables 8 276,742 19,715 25,542
Liabilities (excluding net assets attributable to
holders of redeemable participating shares) 75,413,289 306,476 33,648
Net assets attributable to holders of redeemable
participating shares 704,095,328 35,995,510 12,160,414

ALGEBRIS UCITS FUNDS PLC
Statement of Comprehensive Income
for the financial year ended 31 December 2019
The accompanying notes form an integral part of these financial statements
24
Algebris
Financial
Algebris
Financial
Algebris
Allocation
Algebris
Financial
Total Credit Fund Income Fund Fund** Equity Fund
2019 2019 2019 2019 2019
Notes EUR EUR EUR EUR EUR
Investment income
Interest income 2(e)
- Financial assets measured at amortised cost 444,292 98,115 90,361 2,855 33,186
Dividend income 9,478,242 820,704 6,486,110 13,559 1,605,908
Other income 6,249,864 4,972,340 602,694 106,060 5,878
Net gain on financial assets and liabilities
at fair value through profit or loss* 1,066,618,806 795,488,570 112,744,223 1,251,513 19,959,672
Net (loss)/gain on foreign exchange 2(d) (145,929) (238,324) (87,228) 4,782 (6,654)
Total investment income 1,082,645,275 801,141,405 119,836,160 1,378,769 21,597,990
Operating expenses
Performance fees 6 38,922,052 36,458,027 - 13 274
Preliminary expense 10,736 - - - -
Investment management fees 6 51,020,347 35,951,011 5,734,190 89,792 664,369
Administration fees 6 2,641,173 1,716,062 365,982 16,782 119,957
Directors’ fees 6 71,025 10,317 10,003 10,002 9,904
Dividend expense 48,221 - - - 19,032
Depositary fees 6 1,539,406 1,172,508 144,901 3,169 24,272
Audit fees 6 139,237 107,715 12,036 283 1,810
Transaction cost 6 1,306,920 42,356 387,390 6,130 375,055
Other expenses 9 4,623,556 2,727,631 329,733 125,191 154,103
Total operating expenses 100,322,673 78,185,627 6,984,235 251,362 1,368,776
Net investment income 982,322,602 722,955,778 112,851,925 1,127,407 20,229,214
* Net gain on financial assets and liabilities at fair value through profit & loss of EUR 804,902 due to cross holdings have been eliminated from the Company total.
** Formerly known as Algebris Asset Allocation Fund.

ALGEBRIS UCITS FUNDS PLC
Statement of Comprehensive Income (continued)
for the financial year ended 31 December 2019
The accompanying notes form an integral part of these financial statements
25
Algebris
Financial
Algebris
Financial
Algebris
Allocation
Algebris
Financial
Total Credit Fund Income Fund Fund** Equity Fund
2019 2019 2019 2019 2019
Notes EUR EUR EUR EUR EUR
Finance costs
Distributions to holders of redeemable
participating shares 11 130,632,652 108,518,718 9,945,988 - 486,565
Interest expense 2(e)
- Financial liabilities measured at FVTPL 1,616,487 451,840 6,012 - -
- Financial liabilities measured at amortised
cost 4,242,848 2,821,198 473,305 8,084 145,952
Total finance costs 136,491,987 111,791,756 10,425,305 8,084 632,517
Profit before tax 845,830,615 611,164,022 102,426,620 1,119,323 19,596,697
Withholding tax on dividends 2(j) 2,369,670 246,211 1,481,480 2,611 333,607
Withholding tax on interest 790,890 642,321 7,001 - -
Increase in net assets attributable to holders
of redeemable participating shares from
operations 842,670,055 610,275,490 100,938,139 1,116,712 19,263,090
** Formerly known as Algebris Asset Allocation Fund.

ALGEBRIS UCITS FUNDS PLC
Statement of Comprehensive Income (continued)
for the financial year ended 31 December 2019
The accompanying notes form an integral part of these financial statements
26
Algebris
Macro Credit
Algebris
Core Italy
Algebris
Quant Arbitrage
Algebris
IG Financial
Fund Fund Fund** Credit Fund***
2019 2019 2019 2019
Notes EUR EUR EUR EUR
Investment income
Interest income 2(e)
- Financial assets measured at amortised cost 218,617 168 990 -
Dividend income 157 551,804 - -
Other income 481,310 17,148 41,776 22,658
Net gain on financial assets and liabilities
at fair value through profit or loss* 127,583,986 9,632,355 700,957 62,432
Net (loss)/gain on foreign exchange 2(d) 183,419 8,734 (881) (9,777)
Total investment income 128,467,489 10,210,209 742,842 75,313
Operating expenses
Performance fees 6 2,457,131 2,628 3,979 -
Preliminary expense - 726 2,528 7,482
Investment management fees 6 8,428,396 111,476 38,338 2,775
Administration fees 6 367,305 29,611 24,313 1,161
Directors’ fees 6 10,003 10,003 9,622 1,171
Dividend expense - 29,189 - -
Depositary fees 6 175,535 12,742 5,582 697
Audit fees 6 16,027 754 572 40
Transaction cost 6 349,816 146,169 4 -
Other expenses 9 1,024,965 146,967 108,020 6,946
Total operating expenses 12,829,178 490,265 192,958 20,272
Net investment income 115,638,311 9,719,944 549,884 55,041
** Formerly known as Algebris Tail Risk Fund.
*** For the period from 05 November 2019 (date of launch) to 31 December 2019.

ALGEBRIS UCITS FUNDS PLC
Statement of Comprehensive Income (continued)
for the financial year ended 31 December 2019
The accompanying notes form an integral part of these financial statements
27
Algebris
Macro Credit
Algebris
Core Italy
Algebris
Quant Arbitrage
Algebris
IG Financial
Fund Fund Fund** Credit Fund***
2019 2019 2019 2019
Notes EUR EUR EUR EUR
Finance costs
Distributions to holders of redeemable
participating shares 11 11,681,381 - - -
Interest expense 2(e)
- Financial liabilities measured at FVTPL 1,149,128 9,507 - -
- Financial liabilities measured at amortised
cost 749,444 18,960 25,905 -
Total finance costs 13,579,953 28,467 25,905 -
Profit before tax 102,058,358 9,691,477 523,979 55,041
Withholding tax on dividends 2(j) 209,095 96,666 - -
Withholding tax on interest 141,568 - - -
Increase in net assets attributable to holders
of redeemable participating shares from
operations 101,707,695 9,594,811 523,979 55,041
** Formerly known as Algebris Tail Risk Fund.
*** For the period from 05 November 2019 (date of launch) to 31 December 2019.

ALGEBRIS UCITS FUNDS PLC
Statement of Comprehensive Income (continued)
for the financial year ended 31 December 2018
The accompanying notes form an integral part of these financial statements
28
Algebris
Financial
Algebris
Financial
Algebris
Allocation
Algebris
Financial
Total Credit Fund Income Fund Fund** Equity Fund
2018 2018 2018 2018 2018
Notes EUR EUR EUR EUR EUR
Investment income
Interest income 2(e)
- Financial assets measured at amortised cost 514,454 228,304 21,894 7,687 6,353
Dividend income 13,665,524 1,070,652 9,494,664 171,838 2,114,940
Other income 9,734,495 7,350,631 1,224,301 10,793 185,254
Net loss on financial assets and liabilities
at fair value through profit or loss (495,044,085) (250,727,727) (99,189,830) (1,976,589) (28,432,509)
Net (loss)/gain on foreign exchange 2(d) (1,309,741) (627,070) (85,031) 2,667 (64,112)
Total investment expense (472,439,353) (242,705,210) (88,534,002) (1,783,604) (26,190,074)
Operating expenses
Performance fees 6 552,961 350,872 - 360 53,849
Preliminary expense 66,770 - - - -
Investment management fees 6 57,275,933 37,578,909 6,790,703 113,444 776,493
Administration fees 6 2,881,750 1,820,319 390,368 34,696 136,285
Directors’ fees 6 63,631 11,735 9,286 10,740 9,873
Dividend expense 44,702 - 17,864 2,112 4,134
Depositary fees 6 1,751,009 1,262,735 165,075 13,714 30,609
Audit fees 6 118,820 74,737 11,200 104 2,000
Transaction cost 6 4,535,455 572,588 641,123 14,960 698,851
Other expenses 9 4,422,566 2,741,808 270,279 96,847 164,998
Total operating expenses 71,713,597 44,413,703 8,295,898 286,977 1,877,092
Net investment expenses (544,152,950) (287,118,913) (96,829,900) (2,070,581) (28,067,166)
** Formerly known as Algebris Asset Allocation Fund.

ALGEBRIS UCITS FUNDS PLC
Statement of Comprehensive Income (continued)
for the financial year ended 31 December 2018
The accompanying notes form an integral part of these financial statements
29
Algebris
Financial
Algebris
Financial
Algebris
Allocation
Algebris
Financial
Total Credit Fund Income Fund Fund** Equity Fund
2018 2018 2018 2018 2018
Notes EUR EUR EUR EUR EUR
Finance costs
Distributions to holders of redeemable
participating shares 11 124,024,145 102,354,931 10,305,947 - 618,324
Interest expense 2(e)
- Financial liabilities measured at FVTPL 188,920 95,146 1,809 - -
- Financial liabilities measured at amortised
cost 6,567,239 2,958,199 474,056 20,973 94,009
Total finance costs 130,780,304 105,408,276 10,781,812 20,973 712,333
Loss before tax (674,933,254) (392,527,189) (107,611,712) (2,091,554) (28,779,499)
Withholding tax on dividends 2(k) 2,795,999 321,196 1,840,158 34,452 425,781
Withholding tax on interest 2,280,835 1,956,688 221,947 - -
Decrease in net assets attributable to holders
of redeemable participating shares from
operations (680,010,088) (394,805,073) (109,673,817) (2,126,006) (29,205,280)
** Formerly known as Algebris Asset Allocation Fund.
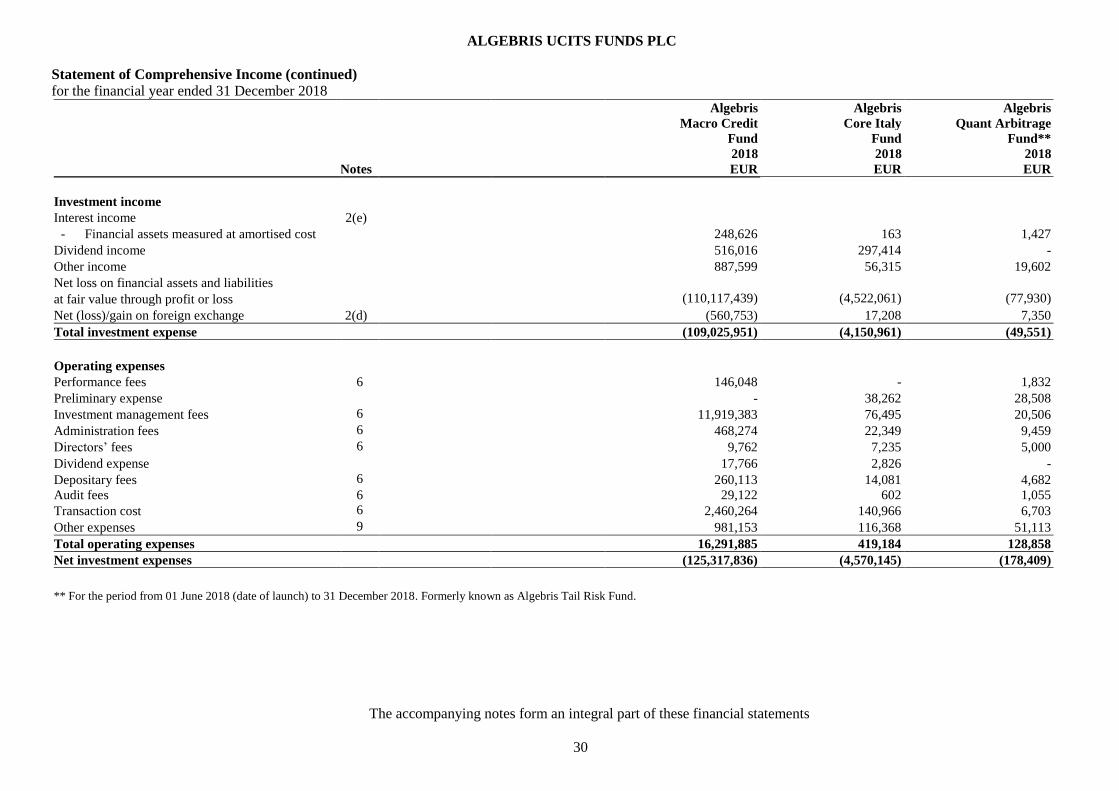
ALGEBRIS UCITS FUNDS PLC
Statement of Comprehensive Income (continued)
for the financial year ended 31 December 2018
The accompanying notes form an integral part of these financial statements
30
Algebris
Macro Credit
Algebris
Core Italy
Algebris
Quant Arbitrage
Fund Fund Fund**
2018 2018 2018
Notes EUR EUR EUR
Investment income
Interest income 2(e)
- Financial assets measured at amortised cost 248,626 163 1,427
Dividend income 516,016 297,414 -
Other income 887,599 56,315 19,602
Net loss on financial assets and liabilities
at fair value through profit or loss (110,117,439) (4,522,061) (77,930)
Net (loss)/gain on foreign exchange 2(d) (560,753) 17,208 7,350
Total investment expense (109,025,951) (4,150,961) (49,551)
Operating expenses
Performance fees 6 146,048 - 1,832
Preliminary expense - 38,262 28,508
Investment management fees 6 11,919,383 76,495 20,506
Administration fees 6 468,274 22,349 9,459
Directors’ fees 6 9,762 7,235 5,000
Dividend expense 17,766 2,826 -
Depositary fees 6 260,113 14,081 4,682
Audit fees 6 29,122 602 1,055
Transaction cost 6 2,460,264 140,966 6,703
Other expenses 9 981,153 116,368 51,113
Total operating expenses 16,291,885 419,184 128,858
Net investment expenses (125,317,836) (4,570,145) (178,409)
** For the period from 01 June 2018 (date of launch) to 31 December 2018. Formerly known as Algebris Tail Risk Fund.
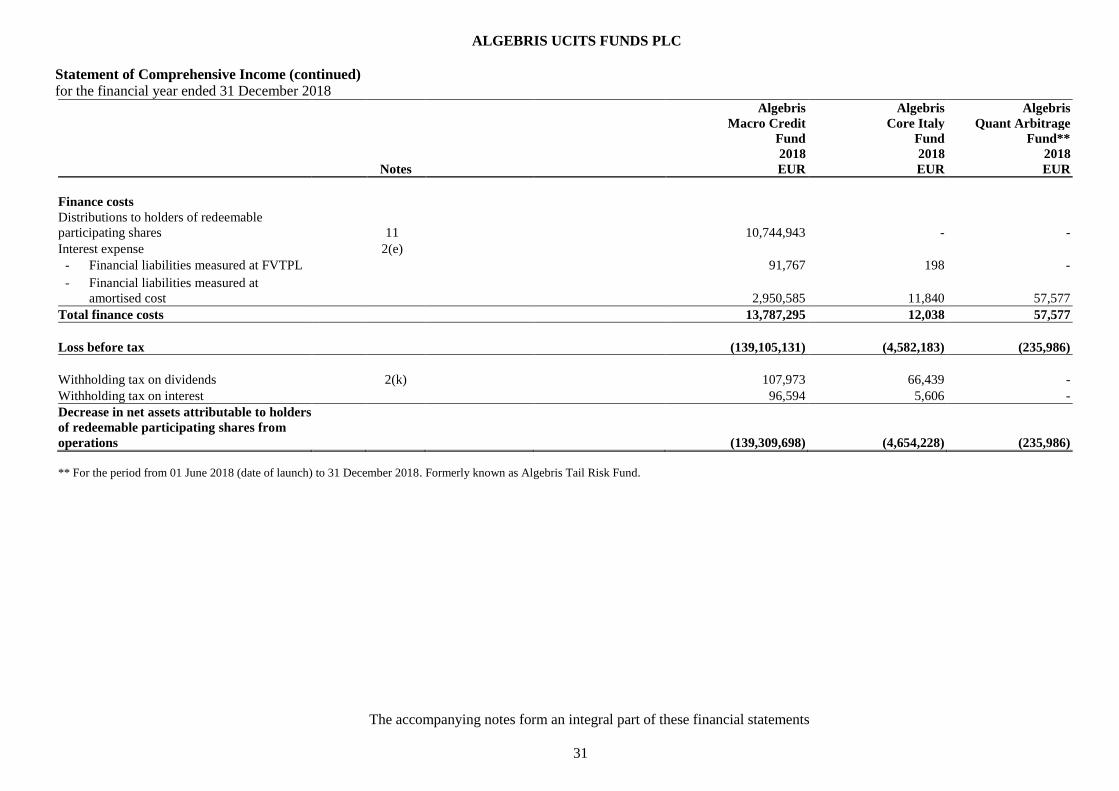
ALGEBRIS UCITS FUNDS PLC
Statement of Comprehensive Income (continued)
for the financial year ended 31 December 2018
The accompanying notes form an integral part of these financial statements
31
Algebris
Macro Credit
Algebris
Core Italy
Algebris
Quant Arbitrage
Fund Fund Fund**
2018 2018 2018
Notes EUR EUR EUR
Finance costs
Distributions to holders of redeemable
participating shares
11 10,744,943 - -
Interest expense 2(e)
- Financial liabilities measured at FVTPL 91,767 198 -
- Financial liabilities measured at
amortised cost
2,950,585 11,840 57,577
Total finance costs 13,787,295 12,038 57,577
Loss before tax (139,105,131) (4,582,183) (235,986)
Withholding tax on dividends 2(k) 107,973 66,439 -
Withholding tax on interest 96,594 5,606 -
Decrease in net assets attributable to holders
of redeemable participating shares from
operations
(139,309,698) (4,654,228) (235,986)
** For the period from 01 June 2018 (date of launch) to 31 December 2018. Formerly known as Algebris Tail Risk Fund.

ALGEBRIS UCITS FUNDS PLC
Statement of Changes in Net Assets Attributable to Holders of Redeemable Participating Shares
for the financial year ended 31 December 2019
The accompanying notes form an integral part of these financial statements
32
Algebris Algebris Algebris Algebris
Financial Financial Allocation Financial
Total Credit Fund Income Fund Fund** Equity Fund
2019 2019 2019 2019 2019
EUR EUR EUR EUR EUR
Net assets attributable to holders of redeemable
participating shares at beginning of financial year/period 5,640,298,822 4,323,313,890 472,310,644 12,134,254 80,288,782
Increase in net assets attributable to holders
of redeemable participating shares from operations*** 842,670,055 610,275,490 100,938,139 1,116,712 19,263,090
Proceeds from redeemable participating shares issued*
issued
2,452,326,102 2,115,743,914 201,165,669 2,163,891 17,566,416
Payment on redemption of redeemable participating shares
issued* (2,585,460,776) (1,894,520,582) (303,765,201) (5,813,458) (44,572,432)
Net assets attributable to holders of redeemable
participating shares at end of financial year/period 6,349,834,203 5,154,812,712 470,649,251 9,601,399 72,545,856
*Share transactions of EUR 9,652,337 due to cross holdings have been eliminated from the Company total.
** Formerly known as Algebris Asset Allocation Fund.
*** Investment income of EUR 804,902 due to income earned from cross holdings have been eliminated from the Company total.
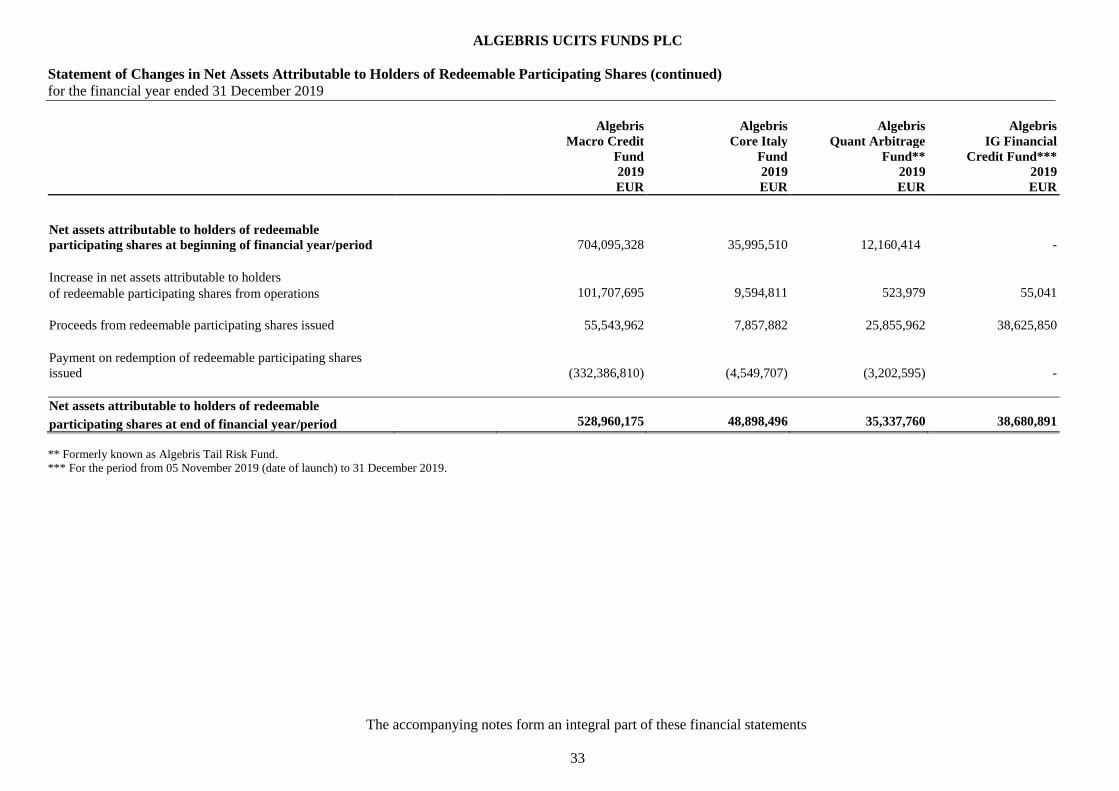
ALGEBRIS UCITS FUNDS PLC
Statement of Changes in Net Assets Attributable to Holders of Redeemable Participating Shares (continued)
for the financial year ended 31 December 2019
The accompanying notes form an integral part of these financial statements
33
Algebris Algebris Algebris Algebris
Macro Credit Core Italy Quant Arbitrage IG Financial
Fund Fund Fund** Credit Fund***
2019 2019 2019 2019
EUR EUR EUR EUR
Net assets attributable to holders of redeemable
participating shares at beginning of financial year/period 704,095,328 35,995,510 12,160,414
-
Increase in net assets attributable to holders
of redeemable participating shares from operations 101,707,695 9,594,811 523,979 55,041
Proceeds from redeemable participating shares issued
issued
55,543,962 7,857,882 25,855,962 38,625,850
Payment on redemption of redeemable participating shares
issued (332,386,810) (4,549,707) (3,202,595) -
Net assets attributable to holders of redeemable
participating shares at end of financial year/period 528,960,175 48,898,496 35,337,760 38,680,891
** Formerly known as Algebris Tail Risk Fund.
*** For the period from 05 November 2019 (date of launch) to 31 December 2019.

ALGEBRIS UCITS FUNDS PLC
Statement of Changes in Net Assets Attributable to Holders of Redeemable Participating Shares (continued)
for the financial year ended 31 December 2018
The accompanying notes form an integral part of these financial statements
34
Algebris Algebris Algebris Algebris
Financial Financial Allocation Financial
Total Credit Fund Income Fund Fund** Equity Fund
2018 2018 2018 2018 2018
EUR EUR EUR EUR EUR
Net assets attributable to holders of redeemable
participating shares at beginning of financial year/period 5,833,557,561 4,710,036,848 220,919,587 9,474,984 70,484,955
Decrease in net assets attributable to holders
of redeemable participating shares from operations (680,010,088) (394,805,073) (109,673,817) (2,126,006) (29,205,280)
Proceeds from redeemable participating shares issued
issued
3,465,470,360 2,321,944,140 627,371,629 7,082,829 56,037,589
Payment on redemption of redeemable participating shares
issued (2,978,719,011) (2,313,862,025) (266,306,755) (2,297,553) (17,028,482)
Net assets attributable to holders of redeemable
participating shares at end of financial year/period 5,640,298,822 4,323,313,890 472,310,644 12,134,254 80,288,782
** Formerly known as Algebris Asset Allocation Fund.
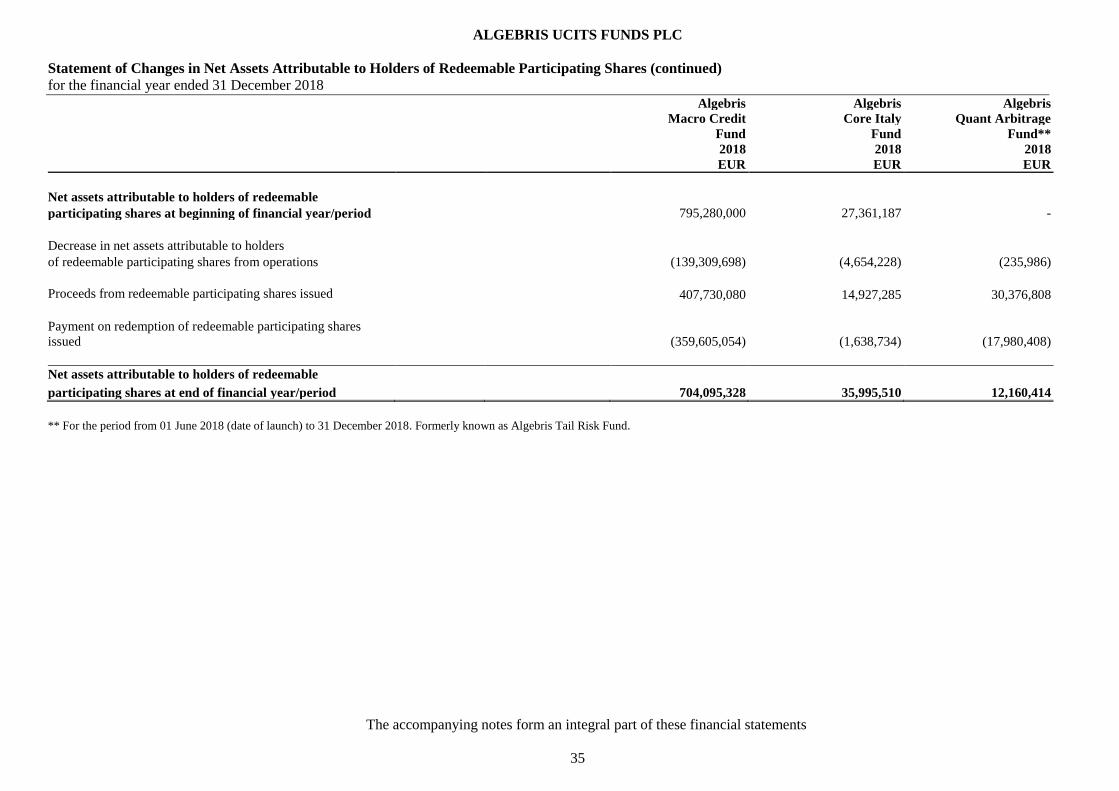
ALGEBRIS UCITS FUNDS PLC
Statement of Changes in Net Assets Attributable to Holders of Redeemable Participating Shares (continued)
for the financial year ended 31 December 2018
The accompanying notes form an integral part of these financial statements
35
Algebris Algebris Algebris
Macro Credit Core Italy Quant Arbitrage
Fund Fund Fund**
2018 2018 2018
EUR EUR EUR
Net assets attributable to holders of redeemable
participating shares at beginning of financial year/period 795,280,000 27,361,187 -
Decrease in net assets attributable to holders
of redeemable participating shares from operations (139,309,698) (4,654,228) (235,986)
Proceeds from redeemable participating shares issued
issued
407,730,080 14,927,285 30,376,808
Payment on redemption of redeemable participating shares
issued (359,605,054) (1,638,734) (17,980,408)
Net assets attributable to holders of redeemable
participating shares at end of financial year/period 704,095,328 35,995,510 12,160,414
** For the period from 01 June 2018 (date of launch) to 31 December 2018. Formerly known as Algebris Tail Risk Fund.

ALGEBRIS UCITS FUNDS PLC
Statement of Cash Flows
for the financial year ended 31 December 2019
The accompanying notes form an integral part of these financial statements
36
Algebris Algebris Algebris Algebris
Financial Financial Allocation Financial Total Credit Fund Income Fund Fund* Equity Fund 2019 2019 2019 2019 2019 EUR EUR EUR EUR EUR
Cash flows from operating activities
Increase in net assets attributable to holders of redeemable participating shares from operations
before dividend distribution 974,107,609 718,794,208 110,884,127 1,116,712 19,749,655 Purchase of financial assets and settlement of financial liabilities (2,298,804,420) (865,168,312) (243,493,307) (27,681,778) (132,491,253)
Proceeds from sale of financial assets and of financial liabilities 3,158,985,595 1,181,668,322 390,935,795 30,422,007 164,487,726
Realised and unrealised (loss)
(856,950,792) (618,330,049) (100,178,323) (1,269,387) (18,207,580) Decrease in interest receivable 14,612,593 8,663,982 795,067 38,885 - Decrease/(increase) in dividend receivable 100,179 (3,261) 64,581 880 37,984 (Increase)/decrease in other receivables (107,660) (3,404) 1,165 (60,852) (1,274) Increase/(decrease) in other payables 22,484,218 19,948,279 (16,025) 6,335 (50,764)
Net cash provided by operating activities 1,014,427,322 445,569,765 158,993,080 2,572,802 33,524,494
Cash flows from financing activities
Receipts from subscriptions 2,415,409,536 2,095,147,549 199,576,384 2,207,247 17,789,789
Payments for redemptions (2,608,097,750) (1,912,010,454) (302,498,818) (5,826,814) (44,459,913)
Distributions to holders of redeemable participating shares (130,632,652) (108,518,718) (9,945,988) - (486,565)
Net cash used in/(provided by) financing activities (323,320,866) 74,618,377 (112,868,422) (3,619,567) (27,156,689) Net increase/(decrease) in cash and cash equivalents 691,106,456 520,188,142 46,124,658 (1,046,765) 6,367,805
Cash and cash equivalents at beginning of the financial year/period 456,596,703 282,137,644 51,079,426 1,937,130 10,582,250
Cash and cash equivalents at end of the financial year/period 1,147,703,159 802,325,786 97,204,084 890,365 16,950,055
Supplemental disclosures of cash flow information
Interest received 323,048,523 265,436,408 16,433,778 69,289 56,864 Interest paid (5,419,852) (3,273,038) (479,317) (8,084) (145,952) Dividend received 9,578,426 817,443 6,550,691 14,439 1,643,892
Dividends paid (130,680,873) (108,518,718) (9,945,988) - (505,597)
* Formerly known as Algebris Asset Allocation Fund.
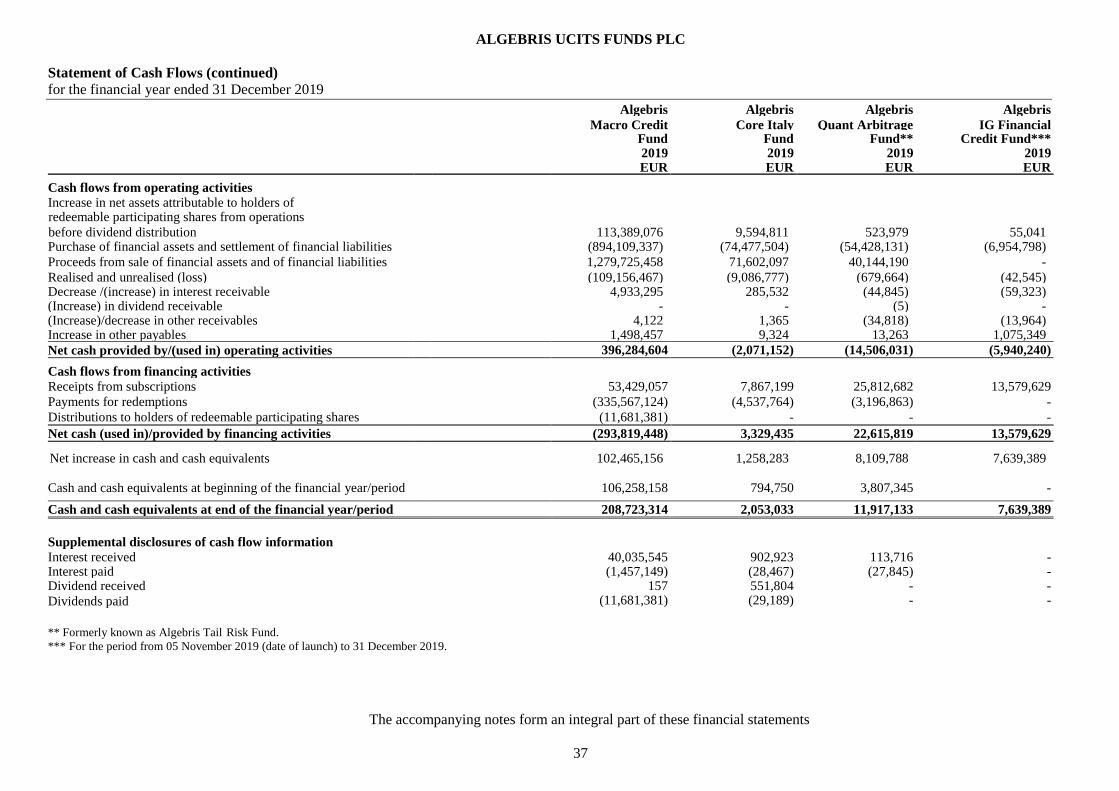
ALGEBRIS UCITS FUNDS PLC
Statement of Cash Flows (continued)
for the financial year ended 31 December 2019
The accompanying notes form an integral part of these financial statements
37
Algebris Algebris Algebris Algebris
Macro Credit Core Italy Quant Arbitrage IG Financial Fund Fund Fund** Credit Fund*** 2019 2019 2019 2019 EUR EUR EUR EUR
Cash flows from operating activities
Increase in net assets attributable to holders of redeemable participating shares from operations
before dividend distribution 113,389,076 9,594,811 523,979 55,041 Purchase of financial assets and settlement of financial liabilities (894,109,337) (74,477,504) (54,428,131) (6,954,798)
Proceeds from sale of financial assets and of financial liabilities 1,279,725,458 71,602,097 40,144,190 -
Realised and unrealised (loss)
(109,156,467) (9,086,777) (679,664) (42,545) Decrease /(increase) in interest receivable 4,933,295 285,532 (44,845) (59,323) (Increase) in dividend receivable - - (5) - (Increase)/decrease in other receivables 4,122 1,365 (34,818) (13,964) Increase in other payables 1,498,457 9,324 13,263 1,075,349
Net cash provided by/(used in) operating activities 396,284,604 (2,071,152) (14,506,031) (5,940,240)
Cash flows from financing activities
Receipts from subscriptions 53,429,057 7,867,199 25,812,682 13,579,629
Payments for redemptions (335,567,124) (4,537,764) (3,196,863) -
Distributions to holders of redeemable participating shares (11,681,381) - - -
Net cash (used in)/provided by financing activities
(293,819,448) 3,329,435 22,615,819 13,579,629 Net increase in cash and cash equivalents 102,465,156 1,258,283 8,109,788 7,639,389
Cash and cash equivalents at beginning of the financial year/period 106,258,158 794,750 3,807,345 -
Cash and cash equivalents at end of the financial year/period 208,723,314 2,053,033 11,917,133 7,639,389
Supplemental disclosures of cash flow information
Interest received 40,035,545 902,923 113,716 - Interest paid (1,457,149) (28,467) (27,845) - Dividend received 157 551,804 - -
Dividends paid (11,681,381) (29,189) - -
** Formerly known as Algebris Tail Risk Fund.
*** For the period from 05 November 2019 (date of launch) to 31 December 2019.

ALGEBRIS UCITS FUNDS PLC
Statement of Cash Flows (continued)
for the financial year ended 31 December 2018
The accompanying notes form an integral part of these financial statements
38
Algebris Algebris Algebris Algebris
Financial Financial Allocation Financial Total Credit Fund Income Fund Fund** Equity Fund 2018 2018 2018 2018 2018 EUR EUR EUR EUR EUR
Cash flows from operating activities
Decrease in net assets attributable to holders of redeemable participating shares from operations
before dividend distribution (555,985,943) (292,450,142) (99,367,870) (2,126,006) (28,586,956) Purchase of financial assets and settlement of financial liabilities (5,349,827,951) (1,897,153,604) (856,201,570) (21,095,506) (319,885,013)
Proceeds from sale of financial assets and of financial liabilities 4,360,473,019 1,474,050,374 508,678,620 17,201,196 279,250,626
Realised and unrealised gain
712,251,011 415,714,684 115,701,075 1,872,129 26,752,581 (Increase)/decrease in interest receivable (7,620,461) (4,213,534) (1,999,772) 6,437 4,133 (Increase)/decrease in dividend receivable (178,761) 11,438 (169,002) 29 (26,692) (Increase)/decrease in other receivables 354,043 (26,109) 128,749 100,767 139,007 (Decrease)/increase in other payables (22,381,363) (9,686,987) (5,229,299) (193,781) (1,242,053)
Net cash used in operating activities (862,916,406) (313,753,880 (338,459,069) (4,234,735) (43,594,367)
Cash flows from financing activities
Receipts from subscriptions 3,523,471,085 2,347,708,631 629,037,861 7,071,323 60,387,021
Payments for redemptions (2,962,649,388) (2,298,899,807) (265,592,318) (2,278,355) (16,976,880)
Distributions to holders of redeemable participating shares (124,024,145) (102,354,931) (10,305,947) - (618,324)
Net cash provided by/(used in) financing activities 436,797,552 (53,546,107) 353,139,596 4,792,968 42,791,817 Net (decrease)/increase in cash and cash equivalents (426,118,854) (367,299,987) 14,680,527 558,233 (802,550)
Cash and cash equivalents at beginning of the financial year/period 882,715,557 649,437,631 36,398,899 1,378,897 11,384,800
Cash and cash equivalents at end of the financial year/period 456,596,703 282,137,644 51,079,426 1,937,130 10,582,250
Supplemental disclosures of cash flow information
Interest received 335,620,807 282,154,209 12,437,982 215,568 64,044 Interest paid (6,741,763) (3,053,345) (475,865) (20,973) (94,022)
Dividend received 13,486,763 1,082,090 9,325,662 171,867 2,088,248
Dividends paid (124,068,847) (102,354,931) (10,323,811) (2,112) (622,458)
** Formerly known as Algebris Asset Allocation Fund.
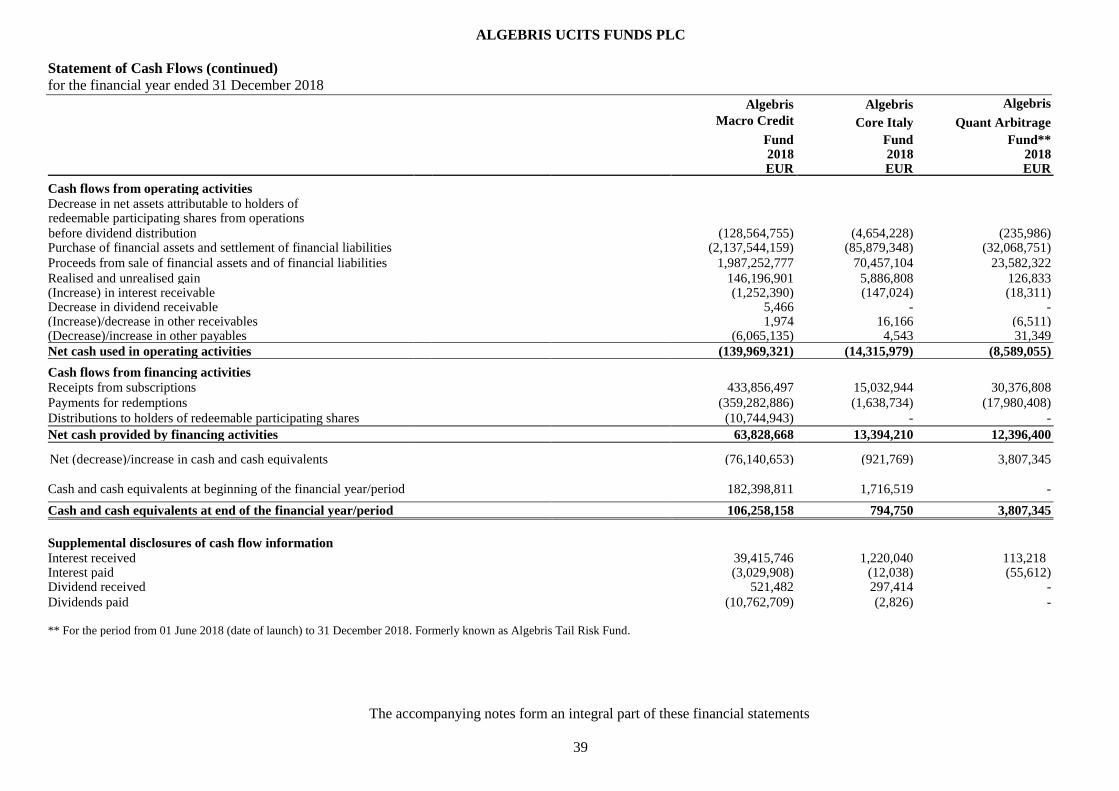
ALGEBRIS UCITS FUNDS PLC
Statement of Cash Flows (continued)
for the financial year ended 31 December 2018
The accompanying notes form an integral part of these financial statements
39
Algebris Algebris Algebris
Macro Credit
Core Italy Quant Arbitrage
Fund Fund Fund** 2018 2018 2018 EUR EUR EUR
Cash flows from operating activities
Decrease in net assets attributable to holders of redeemable participating shares from operations
before dividend distribution (128,564,755) (4,654,228) (235,986) Purchase of financial assets and settlement of financial liabilities (2,137,544,159) (85,879,348) (32,068,751)
Proceeds from sale of financial assets and of financial liabilities 1,987,252,777 70,457,104 23,582,322
Realised and unrealised gain
146,196,901 5,886,808 126,833 (Increase) in interest receivable (1,252,390) (147,024) (18,311) Decrease in dividend receivable 5,466 - - (Increase)/decrease in other receivables 1,974 16,166 (6,511) (Decrease)/increase in other payables (6,065,135) 4,543 31,349
Net cash used in operating activities (139,969,321) (14,315,979) (8,589,055)
Cash flows from financing activities
Receipts from subscriptions 433,856,497 15,032,944 30,376,808
Payments for redemptions (359,282,886) (1,638,734) (17,980,408)
Distributions to holders of redeemable participating shares (10,744,943) - -
Net cash provided by financing activities
63,828,668 13,394,210 12,396,400 Net (decrease)/increase in cash and cash equivalents (76,140,653) (921,769) 3,807,345
Cash and cash equivalents at beginning of the financial year/period 182,398,811 1,716,519 -
Cash and cash equivalents at end of the financial year/period 106,258,158 794,750 3,807,345
Supplemental disclosures of cash flow information
Interest received 39,415,746 1,220,040 113,218 Interest paid (3,029,908) (12,038) (55,612) Dividend received 521,482 297,414 -
Dividends paid (10,762,709) (2,826) -
** For the period from 01 June 2018 (date of launch) to 31 December 2018. Formerly known as Algebris Tail Risk Fund.

ALGEBRIS UCITS FUNDS PLC
Notes to the Financial Statements
for the financial year ended 31 December 2019
40
1. General
The Company was incorporated on 17 February 2012 as a variable capital open-ended umbrella investment company
with segregated liability between Sub-Funds under the Companies Act 2014 and the Central Bank (Supervision and
Enforcement Act 2013 (Section 48(1)) (Undertakings for Collective Investment in Transferable Securities) Regulations
2015 (the “Central Bank UCITS Regulations”) with registration number 509801 and was authorised by the Central
Bank of Ireland (“the Central Bank”) on 9 August 2012. The Company was incorporated as an umbrella fund with
segregated liability between Sub-Funds in accordance with Irish law and as such, the assets of each Sub-Fund will not
be exposed to the liabilities of the Company’s other Sub-Funds. Each Sub-Fund of the Company will be responsible
for paying its fees and expenses regardless of the level of its profitability. Notwithstanding the foregoing, there can be
no assurance that, should an action be brought against the Company in the courts of another jurisdiction, the segregated
nature of the Sub-Funds would necessarily be upheld. Further Sub-Funds may be established with the prior approval of
the Central Bank.
2. Principal accounting policies
The principal accounting policies adopted by the Company in the preparation of these financial statements are set out
below.
(a) Basis of preparation
The financial statements have been prepared in accordance with International Financial Reporting Standards (“IFRS”)
as adopted for use in the European Union, Irish statute comprising the Companies Act 2014 and the Central Bank
UCITS Regulations. The financial statements have been prepared on the going concern basis and under the historical
cost convention as modified by the revaluation of financial assets and liabilities held at fair value through profit or loss.
Use of estimates and judgements
The preparation of financial statements in conformity with IFRS as adopted by the EU requires management to make
estimates and assumptions that affect the reported amounts of assets and liabilities and disclosure of contingent assets
and liabilities at the date of the financial statements and the reported amounts of revenues and expenses during the
financial year. Actual results could differ from those estimates. The estimates and underlying assumptions are
reviewed on an ongoing basis. The key judgments and estimates relate to investments and further information on this
is disclosed in Note 14.
(b) Financial assets and liabilities at fair value through profit or loss
(i) Classification
The Company has classified its investments into three categories for financial assets: measured at amortised cost, Fair value
through other comprehensive income (FVOCI) and Fair value through profit or loss (FVTPL) in accordance with IFRS 9
Financial Instruments.
On initial recognition, the Company classifies financial assets measured at amortised cost or FVTPL. The financial asset
which are not designated as FVTPL are measured at amortised cost if the objective is to hold assets to collect contractual
cash flow and its contractual terms on specified dates give rise to cash flows that are solely payments of principal and
interest.
A financial liability is classified as FVTPL if it is classified as held-for-trading and it is a derivative or it is designated as
such on initial recognition. Financial liabilities at FVTPL are measured at fair value and net gains and losses, including any
interest expense, are recognised in profit or loss. Any gain or loss on derecognition is also recognised in profit or loss.
ALGEBRIS UCITS FUNDS PLC
Notes to the Financial Statements (continued)
for the financial year ended 31 December 2019
41
2. Principal accounting policies (continued)
(b) Financial assets and liabilities at fair value through profit or loss (continued)
(ii) Business model assessment
In making an assessment of the objective of the business model in which a financial asset is held, the Company
considers all of the relevant information about how the business is managed, including:
The documented investment strategy and the execution of this strategy in practice. This includes whether the
investment strategy focuses on earning contractual interest income or realising cash flows through the sale of
the assets;
How the performance of the portfolio is evaluated and reported to the Company’s management;
The risks that affect the performance of the business model (and the financial assets held within that business
model) and how those risks are managed;
The frequency, volume and timing of sales of financial assets in prior periods, the reasons for such sales and
expectations about future sales activity.
The Company has determined that it has two business models.
Held-to-collect business model: this includes cash and cash equivalents, balances due from brokers and
receivables from reverse repurchase and repurchase agreements. These financial assets are held to collect
contractual cash flow.
Other business model: this includes debt securities, equity investments, investments in unlisted open-ended
investment funds and derivatives. These financial assets are managed and their performance is evaluated,
on a fair value basis, with frequent sales taking place.
(iii) Recognition
Financial assets and liabilities at fair value through profit and loss are recognised initially on the trade date at which the
Company becomes a party to contracted provisions of the instruments. Other financial assets and liabilities are recognised on
the date they are originated.
(iv) Derecognition
A financial asset is derecognised when the Company no longer has control over the contractual rights that comprise that
asset. This occurs when the rights are realised, expire or are surrendered. A financial liability is derecognised when it is
extinguished or when the obligation specified in the contract is discharged, cancelled or expired. Assets held for trading that
are sold are derecognised and corresponding receivables from the buyer for the payment are recognised as of the date the
Company commits to sell the assets.
On derecognition of a financial asset, the difference between the carrying amount of the asset (or the carrying amount
allocated to the portion of the asset derecognised) and consideration received (including any new asset obtained less any
new liability assumed) is recognised in the Statement of Comprehensive Income. Any interest in such transferred financial
assets that is created or retained by the Company is recognised as a separate asset or liability.
The fund enters into transactions whereby it transfers assets recognised on its statement of financial position, but retains
either all or substantially all of the risks and rewards of the transferred assets or a portion of them. If all or substantially all
of the risks and rewards are retained, then the transferred assets are not derecognised. Transfers of assets with retention of
all or substantially all of the risks and rewards include sale and repurchase transactions.

ALGEBRIS UCITS FUNDS PLC
Notes to the Financial Statements (continued)
for the financial year ended 31 December 2019
42
2. Principal accounting policies (continued)
(b) Financial assets and liabilities at fair value through profit or loss (continued)
(iv) Derecognition (continued)
The Company derecognises a financial liability when its contractual obligations are discharged or cancelled, or expire.
On derecognition of a financial liability, the difference between the carrying amount extinguished and the consideration
paid (including any non-cash assets transferred or liabilities assumed) is recognised in the Statement of Comprehensive
Income.
The Fund derecognises a derivative only when it meets the derecognition criteria for both financial assets and financial
liabilities. Where the payment or receipt of variation margin represents settlement of a derivative, the derivative, or the
settled portion, is derecognised.
(v) Initial measurement
Financial instruments categorised at fair value through profit or loss are recognised initially at fair value, which is
usually the purchase price, with transaction costs for such instruments being recognised directly in the Statement of
Comprehensive Income. Financial liabilities, other than those at fair value through the profit or loss, are recognised
initially at fair value plus transaction costs that are directly attributable to their acquisition or issue.
(vi) Subsequent measurement
After initial measurement, the Company measures financial assets and liabilities which are classified as at fair value
through profit or loss, at their fair values. Fair value is the amount for which an asset could be exchanged, or a liability
settled, between knowledgeable, willing parties in an arm’s length transaction. Fair value is defined as the closing price, or
latest available trading price.
If a quoted market price is not available on a recognised stock exchange or from a reputable broker/counterparty, the fair
value of the financial instruments may be estimated by the Directors using valuation techniques, including the following:
use of recent arm’s length market transactions, reference to the current fair value of another instrument that is substantially
the same, discounted cash flow techniques, option pricing models or any other valuation technique that provides a reliable
estimate of prices obtained in actual market transactions.
Where discounted cash flow techniques are used, estimated future cash flows are based on the Directors’ best estimates and
the discount rate used is a market rate at the Statement of Financial Position date applicable for an instrument with similar
terms and conditions. Where other pricing models are used, inputs are based on market data available at the Statement of
Financial Position date. Fair values for unquoted equity investments are estimated, if possible, using price/earnings ratios
for similar listed companies adjusted to reflect the specific circumstances of the issuer.
Financial assets at amortised cost are subsequently measured using the effective interest method. Interest income is
recognised in 'interest income calculated using the effective interest method', foreign exchange gains and losses are
recognised in 'net foreign exchange loss' and impairment is recognised in 'impairment losses on financial instruments' in the
statement of comprehensive income. Any gain or loss on derecognition is also recognised in profit or loss.
Cash and cash equivalents, balances due from brokers and receivables from reverse sale repurchase agreements are
included in this category.
Other financial liabilities are subsequently measured at amortised cost using the effective interest method. Interest expense
and foreign exchange gains and losses are recognised in profit or loss. Any gain or loss on derecognition is also recognised
in profit or loss.

ALGEBRIS UCITS FUNDS PLC
Notes to the Financial Statements (continued)
for the financial year ended 31 December 2019
43
2. Principal accounting policies (continued)
(b) Financial assets and liabilities at fair value through profit or loss (continued)
(vi) Subsequent measurement (continued)
Gains and losses arising from changes in the fair value of financial assets and liabilities including financial derivative
instruments at fair value through profit or loss are included in the Statement of Comprehensive Income in the financial year
in which they arise.
(vii) Derivative financial instruments
Forward foreign exchange contracts A forward foreign currency contract involves an obligation to purchase or sell a specific currency at a future date, at a price
set at the time the contract is made. Forward foreign currency contracts are valued by reference to the forward price at
which a new forward foreign currency contract of the same size and maturity could be undertaken at the valuation date. The
unrealised gain or loss on open forward foreign currency contracts is calculated as the difference between the contract rate
and the forward price and is recognised in the Statement of Financial Position and the Statement of Comprehensive Income.
Realised and change in unrealised gains or losses on forward contracts are recognised in the Statement of Comprehensive
Income. Where a forward foreign currency contract is purchased to hedge the currency risk of a specific class which is
issued in a currency other than the measurement currency of the Company, all gains and losses on that forward foreign
currency contract are allocated to that class.
Contracts for difference Contracts for difference are agreements between the Company and third parties, which allow the Company to acquire an
exposure to the price movement of specific securities without actually purchasing the securities. The changes in contract
values are recorded as unrealised gains or losses and the Company recognises a realised gain or loss when the contract is
closed. Realised and unrealised gains and losses on contracts for difference are recognised in the Statement of
Comprehensive Income. At each valuation point the difference in price between the contract price of the contracts for
difference and the market price of the underlying equity is recorded as the fair value (unrealised gain or loss) of the
contracts for difference. When a contracts for difference is closed the difference between the contract price of the contracts
for difference and the market price is recorded as a realised fair value gain or loss in the Statement of Comprehensive
Income.
Futures Futures are contracts for delayed delivery of commodities in which the seller agrees to make delivery at a specific future
date of a specific commodity, at a specified price or yield. Gains and losses on futures are recorded by the Sub-Funds based
on market fluctuations and are recorded as realised or unrealised gains/(losses) or other income dependent upon settlement
terms of the contracts held.
Futures are valued at fair value based on the settlement price on the relevant valuation date.
Options An option is a financial contract that gives an investor the right, but not the obligation, to either buy or sell an asset at a pre-determined price (known as the strike price) by a specified date (known as the expiration date). Options are valued at fair value based on the closing price on the relevant valuation date provided by the relevant counterparty.
The premium on written call options exercised is added to the proceeds from the sale of the underlying security or foreign currency in determining the realised gain or loss. The premium on written put options exercised is subtracted from the cost of the securities or foreign currencies purchased. Premiums received from written options, which expire unexercised, are treated as realised gains. For unsettled positions, unrealised gains or losses are recognised in the Statement of Comprehensive Income.

ALGEBRIS UCITS FUNDS PLC
Notes to the Financial Statements (continued)
for the financial year ended 31 December 2019
44
2. Principal accounting policies (continued)
(b) Financial assets and liabilities at fair value through profit or loss (continued)
(vii) Derivative financial instruments (continued) Swaps Generally, a swap contract is an agreement that obligates two parties to exchange a series of cash flows at specified intervals based upon or calculated by reference to changes in specified prices or rates for a specified notional amount of the underlying assets. The payment flows are usually netted against each other, with the difference being paid by one party to the other. Equity swaps are valued based on the underlying security. OTC swaps are valued at fair value by an external vendor Markit. Repurchase agreements When a Fund sells a Financial asset and simultaneously enters into an agreement to repurchase the same or a similar asset at a fixed price on a future date (sale and repurchase agreement), the arrangement is accounted for as borrowing and is recognised in the statement of financial position as a payable under a sale and repurchase agreement, and the underlying asset is reclassified in the Fund’s statement of financial position to pledged financial assets at FVTPL. A repurchase agreement (repos) is when a fund sells the financial assets and enters into an agreement with a counterparty to lend them a specific investment in exchange for cash as collateral. The Company values repurchase agreements at fair value. Equity Warrants Warrants are recorded as an asset or liability at their fair value on the Statement of Financial Position. Fair value as
determined by the Administrator is the quoted market price as provided by electronic feed from one or more reputable price
vendors. The change in fair value, if any, is recorded as an unrealised gain or loss in the Statement of Comprehensive
Income. Realised gains or losses on warrants are shown in the Statement of Comprehensive Income. On the expiry of a
warrant the amount previously recognised in the Statement of Financial Position is recognised in the Statement of
Comprehensive Income as a realised gain or loss. Realised and unrealised gains and losses on all derivative contracts are recognised in the Statement of Comprehensive Income.
(viii) Impairment of financial assets
The Company assesses at each Statement of Financial Position date whether there is any objective evidence that a
financial asset or group of financial assets is impaired. A financial asset or group of financial assets is deemed to be
impaired if, and only if, there is objective evidence of impairment as a result of one or more events that has occurred
after the initial recognition of the asset.
IFRS 9 requires the Company to record ECLs on all of its debt securities, due from broker and trade receivables,
either on a 12-month or lifetime basis. Given the limited exposure of the Company to credit risk, this amendment has
not had a material impact on the financial statements. The Company only holds receivables with no financing
component and which have maturities of less than 12 months at amortised cost and therefore has adopted an approach
similar to the simplified approach to ECLs.
ALGEBRIS UCITS FUNDS PLC
Notes to the Financial Statements (continued)
for the financial year ended 31 December 2019
45
2. Principal accounting policies (continued)
(b) Financial assets and liabilities at fair value through profit or loss (continued)
(ix) Offsetting financial instruments
Financial assets and liabilities are offset and the net amount is reported in Note 14 when there is a legally enforceable
right to set off the recognised amounts and there is an intention to settle on a net basis, or realise the asset and settle
the liability simultaneously.
The Company holds master netting or similar agreements with HSBC Bank plc, Bank of America Merrill Lynch,
BNP Paribas, Goldman Sachs, Citi Bank, JP Morgan, Morgan Stanley and Merrill Lynch International Bank. The
Company considers that it has a current legally enforceable right to set off the recognised amounts as further
described in Note 14 to the financial statements, however is not expected to realise the relevant assets and settle the
liabilities simultaneously and therefore has not offset the relevant financial assets and liabilities under such
agreements.
(x) Transaction costs Transaction costs are incremental costs, which are directly attributable to the acquisition, issue or disposal of a financial asset or financial liability. An incremental cost is one that would not have been incurred if the entity had not acquired, issued or disposed of the financial instrument. When a financial asset or financial liability is recognised initially, an entity shall measure it at its fair value through profit or loss.
Transaction costs on the purchase of fixed income securities and forwards are included on the purchase and sale price of the investment. They cannot be practically or reliably gathered as they are embedded in the cost of the investment and cannot be separately verified or disclosed.
Transaction costs on purchases and sales of equities, swaps, options and contracts for difference are included in net gains/(losses) on financial assets and liabilities in the Statement of Comprehensive Income for each Sub-Fund. Custody transactions costs are included in Depositary fees in the Statement of Comprehensive Income (see Note 6). (c) Cash and cash equivalents Cash comprises of cash held with HSBC Bank Plc, Morgan Stanley, Merrill Lynch, BNP Paribas, Goldman Sachs, Bank of America, Citi Bank and JP Morgan. Cash is valued at its face value with interest accrued, where applicable, recorded as interest receivable. Cash equivalents are short-term highly liquid investments that are readily convertible to known amounts of cash, are subject to an insignificant risk of changes in value, with original maturities of three months or less, and are held for the purpose of meeting short-term cash commitments rather than for investments or other purposes. At financial year end, the Company held cash as collateral with HSBC Prime. (d) Foreign currency translation (i) Functional and presentation currency Items included in the Company’s financial statements are measured using the currency of the primary economic environment in which they operate (the “functional currency”). As the Company’s redeemable non-participating shares are issued in Euro, the Directors have determined that the functional and presentational currency is Euro (“EUR”). (ii) Foreign currency transactions Transactions in foreign currencies are translated into Euro at the exchange rate prevailing on the transaction date. All assets and liabilities denominated in foreign currencies at the reporting date are retranslated into Euro at the exchange rate at that date. The realised and unrealised gains/losses on foreign currency transactions are accounted for in the Statement of Comprehensive Income.
ALGEBRIS UCITS FUNDS PLC
Notes to the Financial Statements (continued)
for the financial year ended 31 December 2019
46
2. Principal accounting policies (continued) (e) Interest income and interest expense Interest income and interest expense are recognised in the Statement of Comprehensive Income on an effective interest rate basis. The effective interest rate is the rate that exactly discounts the future cash payments and receipts through the expected life of the financial instrument (or, when appropriate, a shorter period) to the carrying amount of the financial instrument on initial recognition. When calculating the effective interest rate, the Company estimates the future cash flows considering all contractual terms of the financial instrument, but not future credit losses. Interest received, and interest paid, are recognized in profit or loss as interest income on financial assets and interest expense on financial liabilities at amortised, respectively. (f) Expenses All expenses, including management fees and performance fees, are recognised in the Statement of Comprehensive Income on an accruals basis. (g) Dividend income Dividends are credited to the Statement of Comprehensive Income on the dates on which the relevant securities are listed as “ex-dividend”. Income is shown gross of any non-recoverable withholding taxes, which are disclosed separately in the Statement of Comprehensive Income, and net of any tax credits. (h) Redeemable participating shares Redeemable participating shares are redeemable at the shareholder’s option and are classified as financial liabilities. The participating shares can be put back to the Sub-Funds on any dealing day for cash equal to a proportionate share of the relevant Sub-Fund’s Net Asset Value.
(i) Due from/to brokers
Amounts due from/to brokers represent payables for securities purchased and receivables for securities sold that have
been contracted for but not yet delivered by the end of the year.
(j) Taxation
Dividends, interest and capital gains (if any) received on investments made by the Company may be subject to
withholding taxes imposed by the country from which the investment income/gains are received and such taxes may
not be recoverable by the Company or its shareholders. Income that is subject to such tax is recognised gross of taxes and the corresponding withholding tax is recognised as
a tax expense.
(k) Due from/to members Amounts due from/to members represent payables for shares purchased and receivables for shares sold that have been
contracted for but not yet delivered by the end of the year.
ALGEBRIS UCITS FUNDS PLC
Notes to the Financial Statements (continued)
for the financial year ended 31 December 2019
47
2. Principal accounting policies (continued)
(l) Elimination of cross holdings
Algebris Allocation Fund, a Sub-Fund of the Company holds investments in Class M Accumulating Shares of
Algebris Financial Income Fund, Algebris Financial Credit Fund, Algebris Macro Credit Fund, Algebris Core Italy
Fund and Algebris Quant Arbitrage Fund, all of which are also Sub-Funds of the Company.
Algebris IG Financial Credit Fund, a Sub-Fund of the Company holds investments in Algebris Financial Credit Fund
Class M Accumulating which is also a Sub-Fund of the Company.
For the purposes of determining the net assets and results of the Company, these cross holdings are eliminated so that
the total amounts only reflect external assets and liabilities of the Company as a whole.
This elimination for the purpose of ascertaining the total Company results and net assets does not have any effect on
the results and net assets of any individual Sub-Fund.
(m) Changes to the accounting policies
Interpretation 23 – Uncertainty over Income Tax Treatments The interpretation explains how to recognise and measure deferred and current income tax assets and liabilities where there is uncertainty over a tax treatment. In particular, it discusses:(a) how to determine the appropriate unit of account, and that each uncertain tax treatment should be considered separately or together as a group, depending on which approach better predicts the resolution of the uncertainty. (b) That the Company should assume a tax authority will examine the uncertain tax treatments and have full knowledge of all related information (c) that the Company should reflect the effect of the uncertainty in its income tax accounting when it is not probable that the tax authorities will accept the treatment. (d) that the impact of the uncertainty should be measured using either the most likely amount or the expected value method, depending on which method better predicts the resolution of the uncertainty, and (e) that the judgements and estimates made must be reassessed whenever circumstances have changed or there is new information that affects the judgements. The interpretation did not have a significant impact on the financial statements of the Company. Changes to the accounting policies not yet effective
Amendments to IAS 1 and IAS 8: Definition of Material On 31 October 2018, the International Accounting Standards Board (“IASB”) issued amendments to IAS 1 Presentation of Financial Statements and IAS 8 to align the definition of ‘material’ across the standards and to clarify certain aspects of the definition. The new definition states that, ’Information is material if omitting, misstating or obscuring it could reasonably be expected to influence decisions that the primary users of general purpose financial statements make on the basis of those financial statements, which provide financial information about a specific reporting entity’. This amendment is effective for annual periods beginning on or after 1 January 2020. Early application of the amendments is permitted and must be disclosed. The Company adopted this amendment and the measurement and classification requirements did not have a significant impact on the financial statements of the Company. While there are no new disclosure requirements, Company is reminded of the general requirement to provide information about judgements and estimates made in preparing the financial statements. The Company adopted this amendment and the measurement and classification requirements did not have a significant impact on the Company’s financial statements.

ALGEBRIS UCITS FUNDS PLC
Notes to the Financial Statements (continued)
for the financial year ended 31 December 2019
48
3. Financial assets and liabilities at fair value through profit or loss Algebris Algebris Algebris Algebris
Financial Financial Allocation Financial
Total Credit Fund Income Fund Fund Equity Fund
2019 2019 2019 2019 2019
EUR EUR EUR EUR EUR
Financial assets at fair value through profit or loss
Investment funds** - - - 8,665,802 -
Transferable securities
- Equity securities* 231,468,139 15,922,486 127,699,080 - 41,430,615
- Fixed income 4,897,610,119 4,282,644,923 246,961,142 - 12,712,524
- Fixed income pledged as collateral 2,034,715 - - - -
Financial derivatives
- Contracts for difference 2,940,421 - 853,717 - 2,086,704
- Equity warrants 386,400 - 104,257 - -
- Forward foreign exchange contracts 19,581,319 17,582,294 1,235,363 206 146,068
- Futures 5,727,971 5,639,701 85,330 - 2,940
- Options 6,797,937 1,683,059 605,512 - 101,588
- Swaps 10,430,889 - - - -
Total financial assets at fair value through profit or loss 5,176,977,910 4,323,472,463 377,544,401 8,666,008 56,480,439
Financial liabilities at fair value through profit or loss
Financial derivatives
- Contracts for difference (7,025,931) - (5,986,717) - (473,765)
- Forward foreign exchange contracts (9,838,864) (8,538,624) (848,085) - (229,034)
- Futures (874,206) (8,200) (3,200) - (28,988)
- Options (2,059,584) - (184,583) - (30,441)
- Swaps (22,036,363) - - - -
Repurchase Agreements (1,870,131) - - - -
Total financial liabilities at fair value through profit or loss (43,705,079) (8,546,824) (7,022,585) - (762,228)
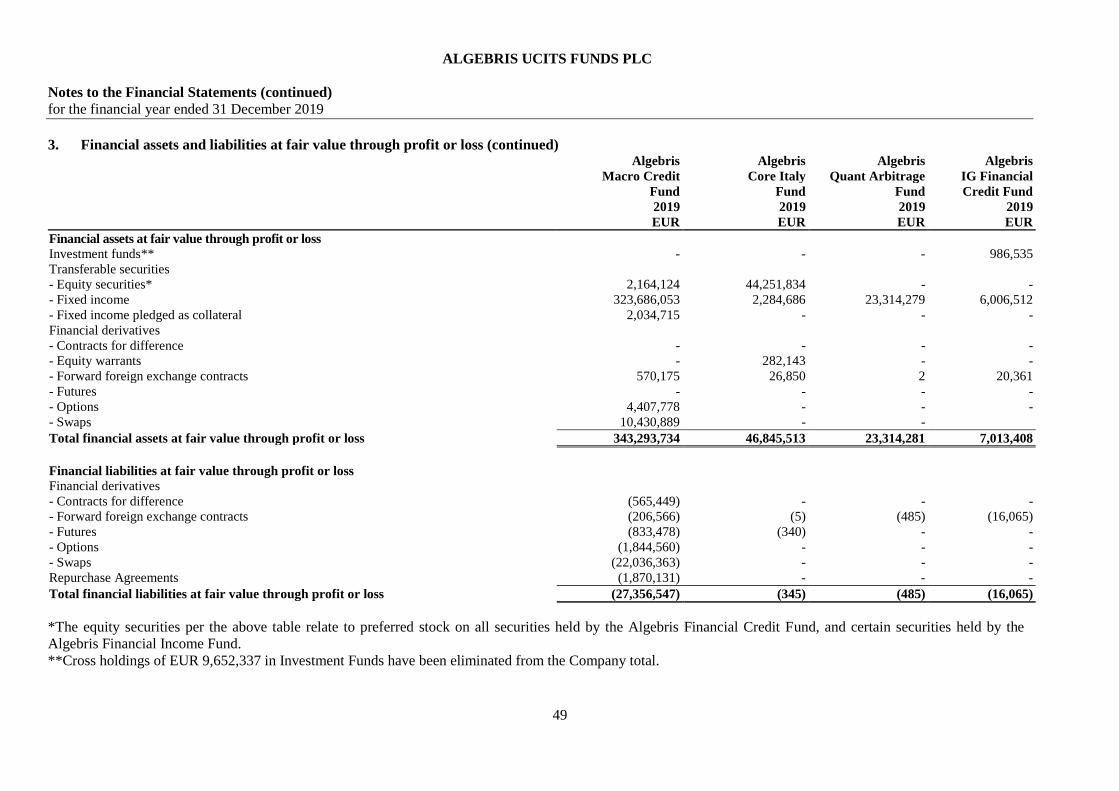
ALGEBRIS UCITS FUNDS PLC
Notes to the Financial Statements (continued)
for the financial year ended 31 December 2019
49
3. Financial assets and liabilities at fair value through profit or loss (continued) Algebris Algebris Algebris Algebris
Macro Credit Core Italy Quant Arbitrage IG Financial
Fund Fund Fund Credit Fund
2019 2019 2019 2019
EUR EUR EUR EUR
Financial assets at fair value through profit or loss
Investment funds** - - - 986,535
Transferable securities
- Equity securities* 2,164,124 44,251,834 - -
- Fixed income 323,686,053 2,284,686 23,314,279 6,006,512
- Fixed income pledged as collateral 2,034,715 - - -
Financial derivatives
- Contracts for difference - - - -
- Equity warrants - 282,143 - -
- Forward foreign exchange contracts 570,175 26,850 2 20,361
- Futures - - - -
- Options 4,407,778 - - -
- Swaps 10,430,889 - -
Total financial assets at fair value through profit or loss 343,293,734 46,845,513 23,314,281 7,013,408
Financial liabilities at fair value through profit or loss
Financial derivatives
- Contracts for difference (565,449) - - -
- Forward foreign exchange contracts (206,566) (5) (485) (16,065)
- Futures (833,478) (340) - -
- Options (1,844,560) - - -
- Swaps (22,036,363) - - -
Repurchase Agreements (1,870,131) - - -
Total financial liabilities at fair value through profit or loss (27,356,547) (345) (485) (16,065)
*The equity securities per the above table relate to preferred stock on all securities held by the Algebris Financial Credit Fund, and certain securities held by the
Algebris Financial Income Fund.
**Cross holdings of EUR 9,652,337 in Investment Funds have been eliminated from the Company total.
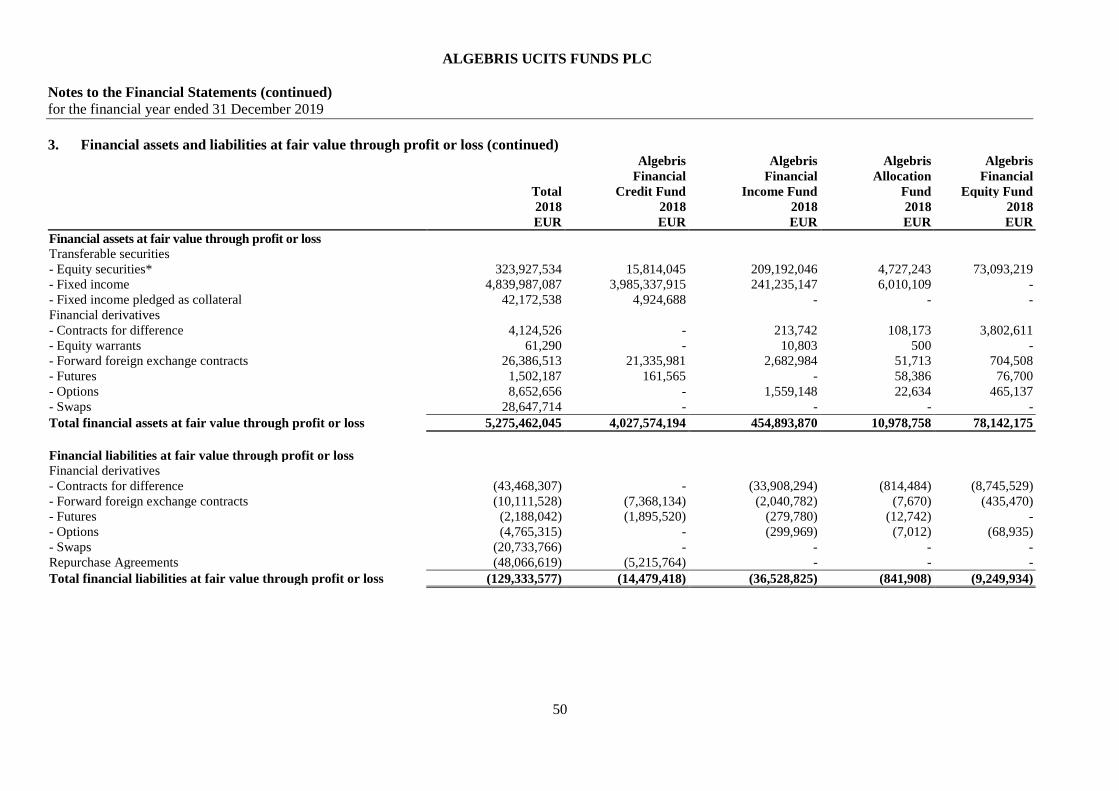
ALGEBRIS UCITS FUNDS PLC
Notes to the Financial Statements (continued)
for the financial year ended 31 December 2019
50
3. Financial assets and liabilities at fair value through profit or loss (continued) Algebris Algebris Algebris Algebris
Financial Financial Allocation Financial
Total Credit Fund Income Fund Fund Equity Fund
2018 2018 2018 2018 2018
EUR EUR EUR EUR EUR
Financial assets at fair value through profit or loss
Transferable securities
- Equity securities* 323,927,534 15,814,045 209,192,046 4,727,243 73,093,219
- Fixed income 4,839,987,087 3,985,337,915 241,235,147 6,010,109 -
- Fixed income pledged as collateral 42,172,538 4,924,688 - - -
Financial derivatives
- Contracts for difference 4,124,526 - 213,742 108,173 3,802,611
- Equity warrants 61,290 - 10,803 500 -
- Forward foreign exchange contracts 26,386,513 21,335,981 2,682,984 51,713 704,508
- Futures 1,502,187 161,565 - 58,386 76,700
- Options 8,652,656 - 1,559,148 22,634 465,137
- Swaps 28,647,714 - - - -
Total financial assets at fair value through profit or loss 5,275,462,045 4,027,574,194 454,893,870 10,978,758 78,142,175
Financial liabilities at fair value through profit or loss
Financial derivatives
- Contracts for difference (43,468,307) - (33,908,294) (814,484) (8,745,529)
- Forward foreign exchange contracts (10,111,528) (7,368,134) (2,040,782) (7,670) (435,470)
- Futures (2,188,042) (1,895,520) (279,780) (12,742) -
- Options (4,765,315) - (299,969) (7,012) (68,935)
- Swaps (20,733,766) - - - -
Repurchase Agreements (48,066,619) (5,215,764) - - -
Total financial liabilities at fair value through profit or loss (129,333,577) (14,479,418) (36,528,825) (841,908) (9,249,934)
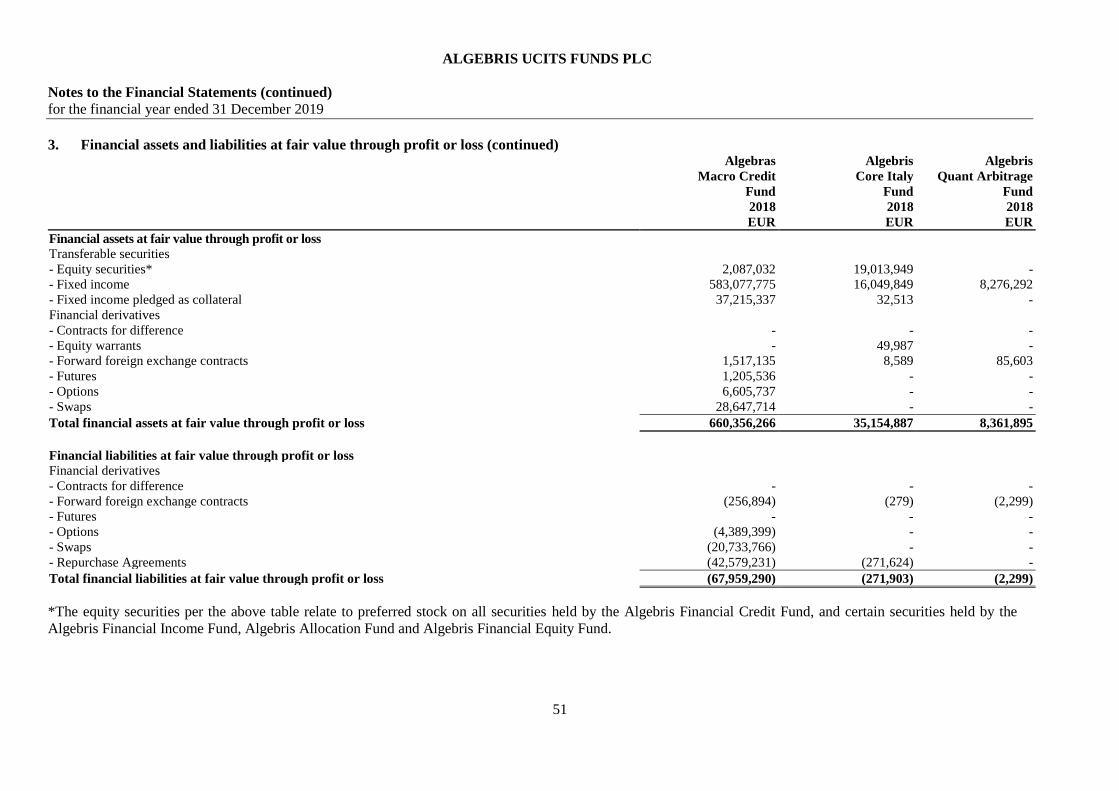
ALGEBRIS UCITS FUNDS PLC
Notes to the Financial Statements (continued)
for the financial year ended 31 December 2019
51
3. Financial assets and liabilities at fair value through profit or loss (continued) Algebras Algebris Algebris
Macro Credit Core Italy Quant Arbitrage
Fund Fund Fund
2018 2018 2018
EUR EUR EUR
Financial assets at fair value through profit or loss
Transferable securities
- Equity securities* 2,087,032 19,013,949 -
- Fixed income 583,077,775 16,049,849 8,276,292
- Fixed income pledged as collateral 37,215,337 32,513 -
Financial derivatives
- Contracts for difference - - -
- Equity warrants - 49,987 -
- Forward foreign exchange contracts 1,517,135 8,589 85,603
- Futures 1,205,536 - -
- Options 6,605,737 - -
- Swaps 28,647,714 - -
Total financial assets at fair value through profit or loss 660,356,266 35,154,887 8,361,895
Financial liabilities at fair value through profit or loss
Financial derivatives
- Contracts for difference - - -
- Forward foreign exchange contracts (256,894) (279) (2,299)
- Futures - - -
- Options (4,389,399) - -
- Swaps (20,733,766) - -
- Repurchase Agreements (42,579,231) (271,624) -
Total financial liabilities at fair value through profit or loss (67,959,290) (271,903) (2,299)
*The equity securities per the above table relate to preferred stock on all securities held by the Algebris Financial Credit Fund, and certain securities held by the
Algebris Financial Income Fund, Algebris Allocation Fund and Algebris Financial Equity Fund.
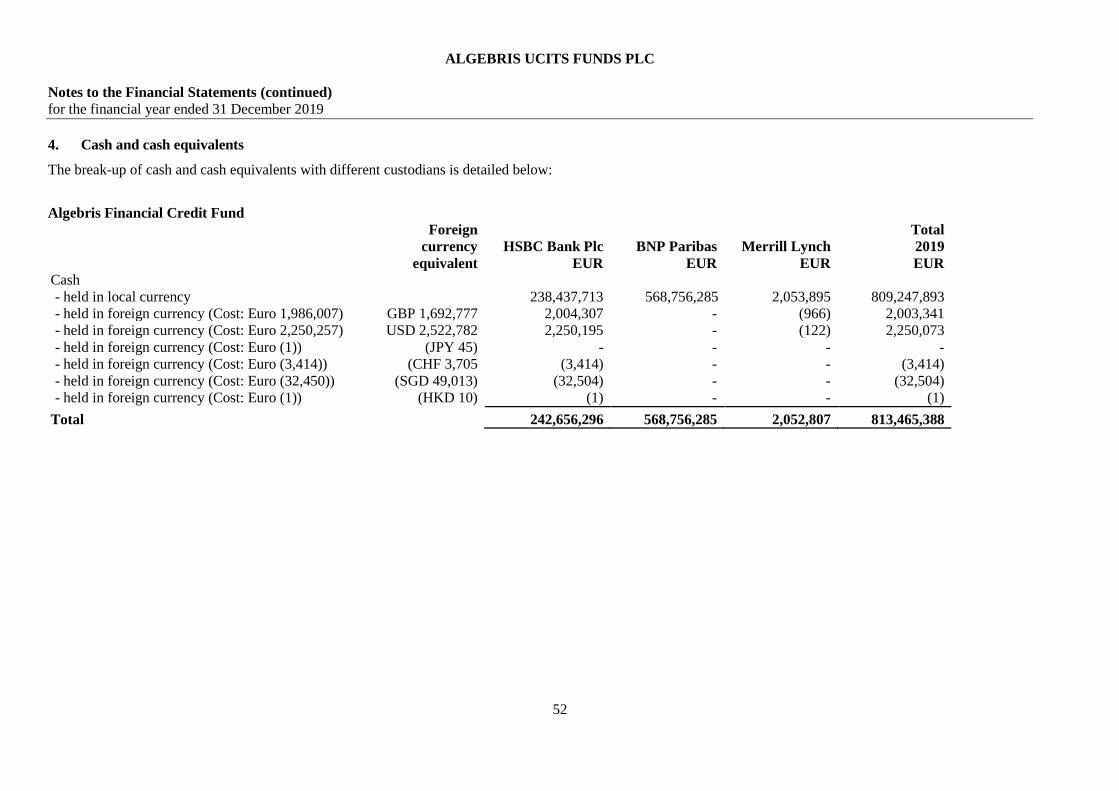
ALGEBRIS UCITS FUNDS PLC
Notes to the Financial Statements (continued)
for the financial year ended 31 December 2019
52
4. Cash and cash equivalents
The break-up of cash and cash equivalents with different custodians is detailed below:
Algebris Financial Credit Fund
Foreign
currency
equivalent
HSBC Bank Plc
EUR
BNP Paribas
EUR
Merrill Lynch
EUR
Total
2019
EUR
Cash
- held in local currency 238,437,713 568,756,285 2,053,895 809,247,893
- held in foreign currency (Cost: Euro 1,986,007) GBP 1,692,777 2,004,307 - (966) 2,003,341
- held in foreign currency (Cost: Euro 2,250,257) USD 2,522,782 2,250,195 - (122) 2,250,073
- held in foreign currency (Cost: Euro (1)) (JPY 45) - - - -
- held in foreign currency (Cost: Euro (3,414)) (CHF 3,705 (3,414) - - (3,414)
- held in foreign currency (Cost: Euro (32,450)) (SGD 49,013) (32,504) - - (32,504)
- held in foreign currency (Cost: Euro (1)) (HKD 10) (1) - - (1)
Total 242,656,296 568,756,285 2,052,807 813,465,388
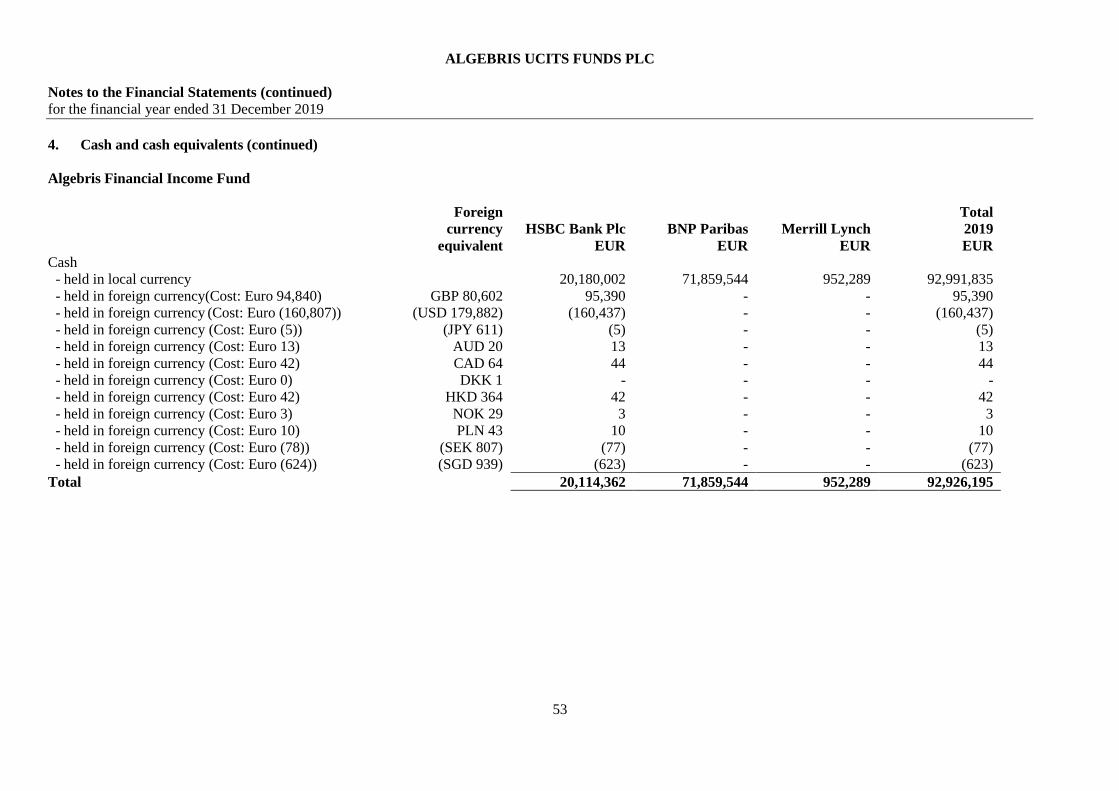
ALGEBRIS UCITS FUNDS PLC
Notes to the Financial Statements (continued)
for the financial year ended 31 December 2019
53
4. Cash and cash equivalents (continued)
Algebris Financial Income Fund
Foreign
currency
equivalent
HSBC Bank Plc
EUR
BNP Paribas
EUR
Merrill Lynch
EUR
Total
2019
EUR
Cash
- held in local currency 20,180,002 71,859,544 952,289 92,991,835
- held in foreign currency(Cost: Euro 94,840) GBP 80,602 95,390 - - 95,390
- held in foreign currency (Cost: Euro (160,807)) (USD 179,882) (160,437) - - (160,437)
- held in foreign currency (Cost: Euro (5)) (JPY 611) (5) - - (5)
- held in foreign currency (Cost: Euro 13) AUD 20 13 - - 13
- held in foreign currency (Cost: Euro 42) CAD 64 44 - - 44
- held in foreign currency (Cost: Euro 0) DKK 1 - - - -
- held in foreign currency (Cost: Euro 42) HKD 364 42 - - 42
- held in foreign currency (Cost: Euro 3) NOK 29 3 - - 3
- held in foreign currency (Cost: Euro 10) PLN 43 10 - - 10
- held in foreign currency (Cost: Euro (78)) (SEK 807) (77) - - (77)
- held in foreign currency (Cost: Euro (624)) (SGD 939) (623) - - (623)
Total 20,114,362 71,859,544 952,289 92,926,195

ALGEBRIS UCITS FUNDS PLC
Notes to the Financial Statements (continued)
for the financial year ended 31 December 2019
54
4. Cash and cash equivalents (continued)
Algebris Allocation Fund
Foreign
currency
equivalent
HSBC Bank
Plc
EUR
Total
2019
EUR
Cash
- held in local currency 894,579 894,579
- held in foreign currency (Cost: Euro (1)) (GBP 1) (1) (1)
- held in foreign currency (Cost: Euro 725) USD 804 717 717
- held in foreign currency (Cost: Euro (6)) (JPY 694) (6) (6)
- held in foreign currency (Cost: Euro (2)) (AUD 2) (2) (2)
- held in foreign currency (Cost: Euro 57) CAD 87 60 60
- held in foreign currency (Cost: Euro (3)) (DKK 22) (3) (3)
- held in foreign currency (Cost: Euro 7) HKD 59 7 7
- held in foreign currency (Cost: Euro (1)) (MXN 15) (1) (1)
- held in foreign currency (Cost: Euro 8) NOK 79 8 8
- held in foreign currency (Cost: Euro (10)) (SGD 15) (10) (10)
- held in foreign currency (Cost: Euro (77)) (SEK 803) (76) (76)
- held in foreign currency (Cost: Euro 0) ZAR 7 1 1
Total 895,273 895,273
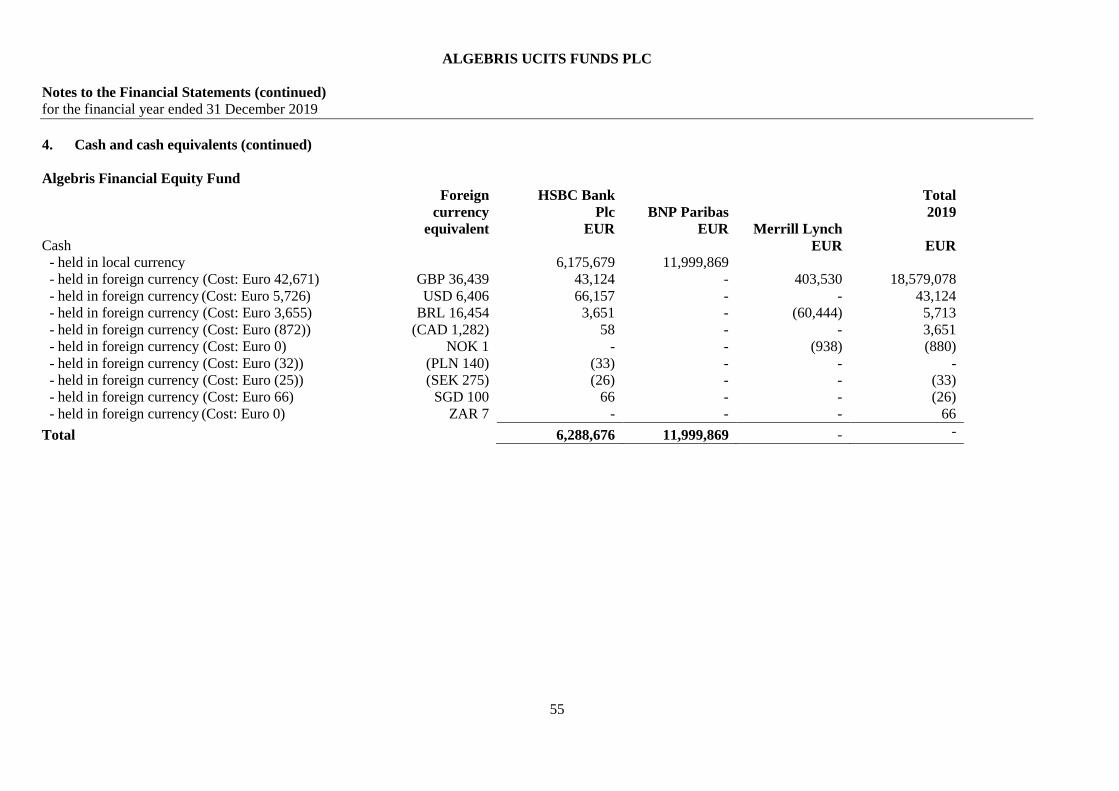
ALGEBRIS UCITS FUNDS PLC
Notes to the Financial Statements (continued)
for the financial year ended 31 December 2019
55
4. Cash and cash equivalents (continued)
Algebris Financial Equity Fund
Foreign
currency
equivalent
HSBC Bank
Plc
EUR
BNP Paribas
EUR Merrill Lynch
Total
2019
Cash EUR EUR
- held in local currency 6,175,679 11,999,869
- held in foreign currency (Cost: Euro 42,671) GBP 36,439 43,124 - 403,530 18,579,078
- held in foreign currency (Cost: Euro 5,726) USD 6,406 66,157 - - 43,124
- held in foreign currency (Cost: Euro 3,655) BRL 16,454 3,651 - (60,444) 5,713
- held in foreign currency (Cost: Euro (872)) (CAD 1,282) 58 - - 3,651
- held in foreign currency (Cost: Euro 0) NOK 1 - - (938) (880)
- held in foreign currency (Cost: Euro (32)) (PLN 140) (33) - - -
- held in foreign currency (Cost: Euro (25)) (SEK 275) (26) - - (33)
- held in foreign currency (Cost: Euro 66) SGD 100 66 - - (26)
- held in foreign currency (Cost: Euro 0) ZAR 7 - - - 66
Total 6,288,676 11,999,869 - -
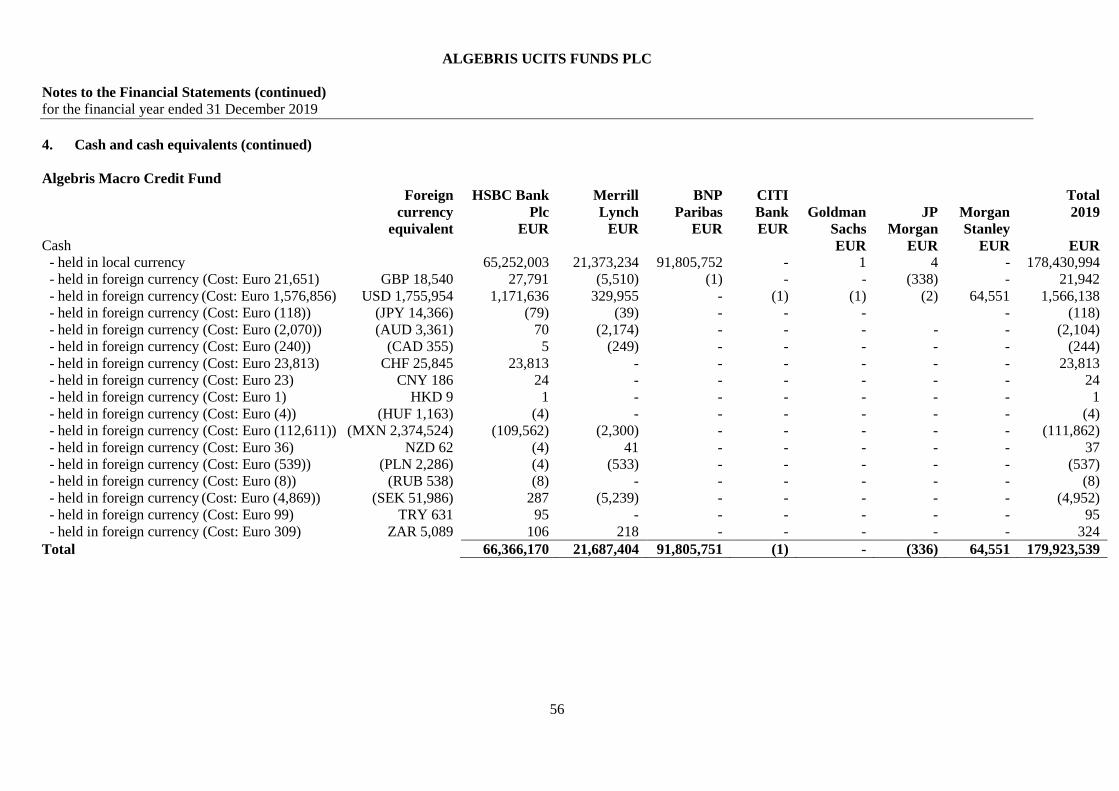
ALGEBRIS UCITS FUNDS PLC
Notes to the Financial Statements (continued)
for the financial year ended 31 December 2019
56
4. Cash and cash equivalents (continued)
Algebris Macro Credit Fund
Foreign
currency
equivalent
HSBC Bank
Plc
EUR
Merrill
Lynch
EUR
BNP
Paribas
EUR
CITI
Bank
EUR
Goldman
Sachs
JP
Morgan
Morgan
Stanley
Total
2019
Cash EUR EUR EUR EUR
- held in local currency 65,252,003 21,373,234 91,805,752 - 1 4 - 178,430,994
- held in foreign currency (Cost: Euro 21,651) GBP 18,540 27,791 (5,510) (1) - - (338) - 21,942
- held in foreign currency (Cost: Euro 1,576,856) USD 1,755,954 1,171,636 329,955 - (1) (1) (2) 64,551 1,566,138
- held in foreign currency (Cost: Euro (118)) (JPY 14,366) (79) (39) - - - - (118)
- held in foreign currency (Cost: Euro (2,070)) (AUD 3,361) 70 (2,174) - - - - - (2,104)
- held in foreign currency (Cost: Euro (240)) (CAD 355) 5 (249) - - - - - (244)
- held in foreign currency (Cost: Euro 23,813) CHF 25,845 23,813 - - - - - - 23,813
- held in foreign currency (Cost: Euro 23) CNY 186 24 - - - - - - 24
- held in foreign currency (Cost: Euro 1) HKD 9 1 - - - - - - 1
- held in foreign currency (Cost: Euro (4)) (HUF 1,163) (4) - - - - - - (4)
- held in foreign currency (Cost: Euro (112,611)) (MXN 2,374,524) (109,562) (2,300) - - - - - (111,862)
- held in foreign currency (Cost: Euro 36) NZD 62 (4) 41 - - - - - 37
- held in foreign currency (Cost: Euro (539)) (PLN 2,286) (4) (533) - - - - - (537)
- held in foreign currency (Cost: Euro (8)) (RUB 538) (8) - - - - - - (8)
- held in foreign currency (Cost: Euro (4,869)) (SEK 51,986) 287 (5,239) - - - - - (4,952)
- held in foreign currency (Cost: Euro 99) TRY 631 95 - - - - - - 95
- held in foreign currency (Cost: Euro 309) ZAR 5,089 106 218 - - - - - 324
Total 66,366,170 21,687,404 91,805,751 (1) - (336) 64,551 179,923,539
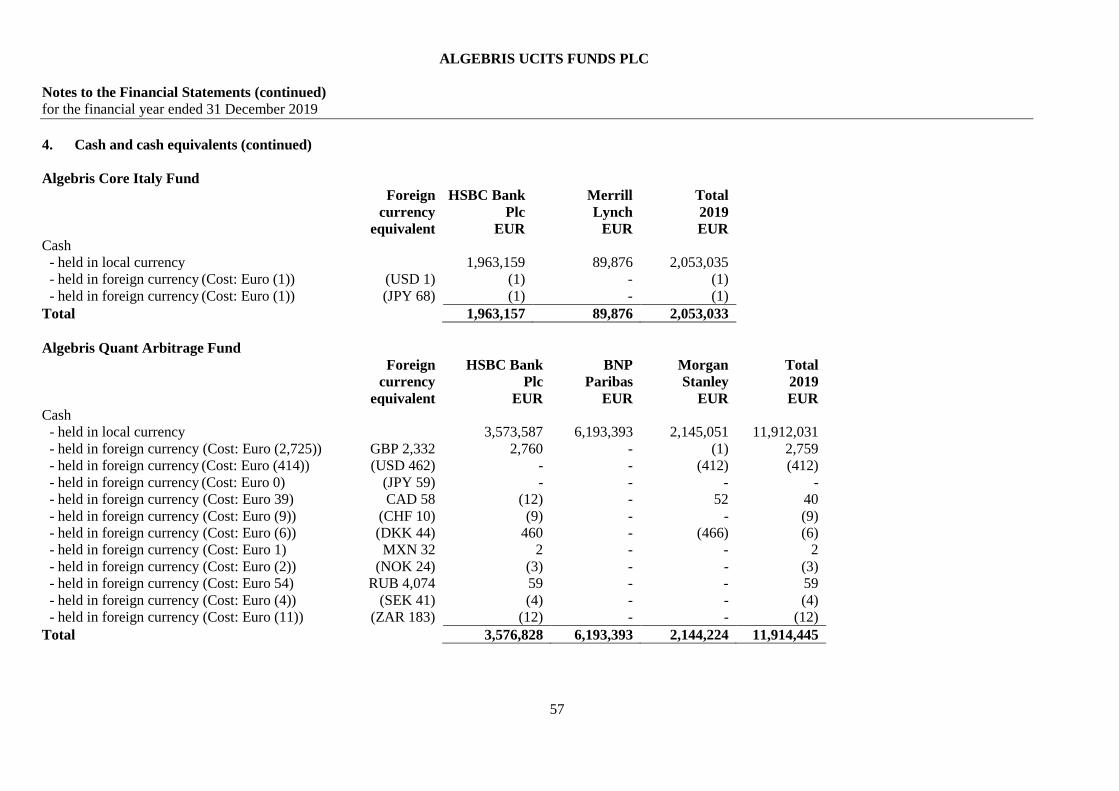
ALGEBRIS UCITS FUNDS PLC
Notes to the Financial Statements (continued)
for the financial year ended 31 December 2019
57
4. Cash and cash equivalents (continued)
Algebris Core Italy Fund
Foreign
currency
equivalent
HSBC Bank
Plc
EUR
Merrill
Lynch
EUR
Total
2019
EUR
Cash
- held in local currency 1,963,159 89,876 2,053,035
- held in foreign currency (Cost: Euro (1)) (USD 1) (1) - (1)
- held in foreign currency (Cost: Euro (1)) (JPY 68) (1) - (1)
Total 1,963,157 89,876 2,053,033
Algebris Quant Arbitrage Fund
Foreign
currency
equivalent
HSBC Bank
Plc
EUR
BNP
Paribas
EUR
Morgan
Stanley
EUR
Total
2019
EUR
Cash
- held in local currency 3,573,587 6,193,393 2,145,051 11,912,031
- held in foreign currency (Cost: Euro (2,725)) GBP 2,332 2,760 - (1) 2,759
- held in foreign currency (Cost: Euro (414)) (USD 462) - - (412) (412)
- held in foreign currency (Cost: Euro 0) (JPY 59) - - - -
- held in foreign currency (Cost: Euro 39) CAD 58 (12) - 52 40
- held in foreign currency (Cost: Euro (9)) (CHF 10) (9) - - (9)
- held in foreign currency (Cost: Euro (6)) (DKK 44) 460 - (466) (6)
- held in foreign currency (Cost: Euro 1) MXN 32 2 - - 2
- held in foreign currency (Cost: Euro (2)) (NOK 24) (3) - - (3)
- held in foreign currency (Cost: Euro 54) RUB 4,074 59 - - 59
- held in foreign currency (Cost: Euro (4)) (SEK 41) (4) - - (4)
- held in foreign currency (Cost: Euro (11)) (ZAR 183) (12) - - (12)
Total 3,576,828 6,193,393 2,144,224 11,914,445
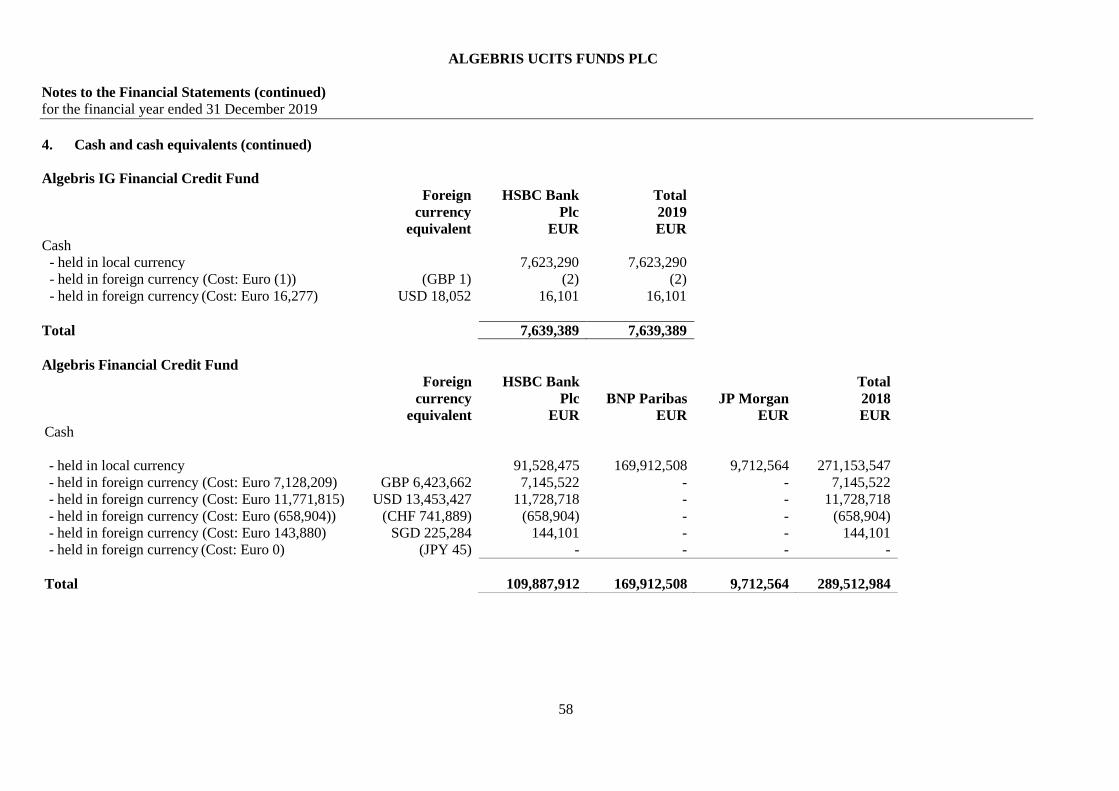
ALGEBRIS UCITS FUNDS PLC
Notes to the Financial Statements (continued)
for the financial year ended 31 December 2019
58
4. Cash and cash equivalents (continued)
Algebris IG Financial Credit Fund
Foreign
currency
equivalent
HSBC Bank
Plc
EUR
Total
2019
EUR
Cash
- held in local currency 7,623,290 7,623,290
- held in foreign currency (Cost: Euro (1)) (GBP 1) (2) (2)
- held in foreign currency (Cost: Euro 16,277) USD 18,052 16,101 16,101
Total 7,639,389 7,639,389
Algebris Financial Credit Fund
Foreign
currency
equivalent
HSBC Bank
Plc
EUR
BNP Paribas
EUR
JP Morgan
EUR
Total
2018
EUR
Cash
- held in local currency 91,528,475 169,912,508 9,712,564
271,153,547
- held in foreign currency (Cost: Euro 7,128,209) GBP 6,423,662 7,145,522 - - 7,145,522
- held in foreign currency (Cost: Euro 11,771,815) USD 13,453,427 11,728,718 - - 11,728,718
- held in foreign currency (Cost: Euro (658,904)) (CHF 741,889) (658,904) - - (658,904)
- held in foreign currency (Cost: Euro 143,880) SGD 225,284 144,101 - - 144,101
- held in foreign currency (Cost: Euro 0) (JPY 45) - - - -
Total
109,887,912 169,912,508 9,712,564
289,512,984
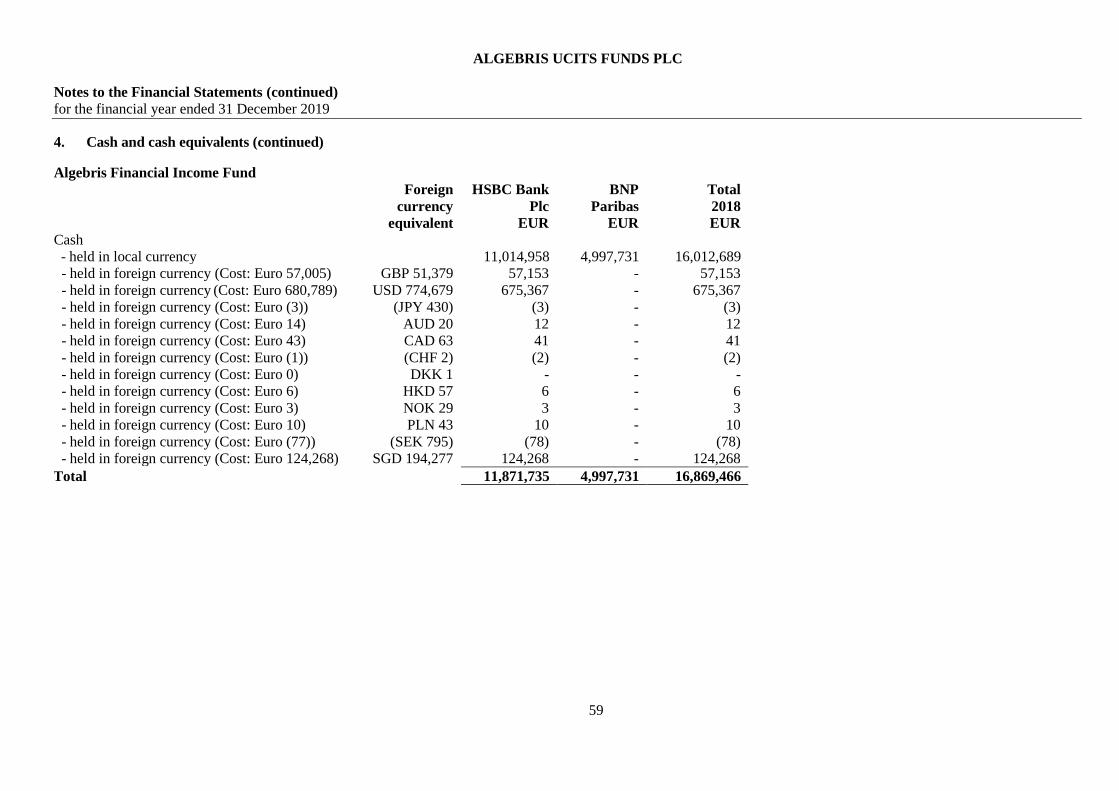
ALGEBRIS UCITS FUNDS PLC
Notes to the Financial Statements (continued)
for the financial year ended 31 December 2019
59
4. Cash and cash equivalents (continued)
Algebris Financial Income Fund
Foreign
currency
equivalent
HSBC Bank
Plc
EUR
BNP
Paribas
EUR
Total
2018
EUR
Cash
- held in local currency 11,014,958 4,997,731 16,012,689
- held in foreign currency (Cost: Euro 57,005) GBP 51,379 57,153 - 57,153
- held in foreign currency (Cost: Euro 680,789) USD 774,679 675,367 - 675,367
- held in foreign currency (Cost: Euro (3)) (JPY 430) (3) - (3)
- held in foreign currency (Cost: Euro 14) AUD 20 12 - 12
- held in foreign currency (Cost: Euro 43) CAD 63 41 - 41
- held in foreign currency (Cost: Euro (1)) (CHF 2) (2) - (2)
- held in foreign currency (Cost: Euro 0) DKK 1 - - -
- held in foreign currency (Cost: Euro 6) HKD 57 6 - 6
- held in foreign currency (Cost: Euro 3) NOK 29 3 - 3
- held in foreign currency (Cost: Euro 10) PLN 43 10 - 10
- held in foreign currency (Cost: Euro (77)) (SEK 795) (78) - (78)
- held in foreign currency (Cost: Euro 124,268) SGD 194,277 124,268 - 124,268
Total 11,871,735 4,997,731 16,869,466

ALGEBRIS UCITS FUNDS PLC
Notes to the Financial Statements (continued)
for the financial year ended 31 December 2019
60
4. Cash and cash equivalents (continued)
Algebris Allocation Fund
Foreign
currency
equivalent
HSBC Bank
Plc
EUR
Total
2018
EUR
Cash
- held in local currency 1,438,024 1,438,024
- held in foreign currency (Cost: Euro 1) GBP 1 1 1
- held in foreign currency (Cost: Euro 10,212) USD 11,663 10,168 10,168
- held in foreign currency (Cost: Euro (5)) (JPY 577) (5) (5)
- held in foreign currency (Cost: Euro 56) CAD 87 56 56
- held in foreign currency (Cost: Euro (2)) (CHF 3) (2) (2)
- held in foreign currency (Cost: Euro (3)) (DKK 22) (3) (3)
- held in foreign currency (Cost: Euro 44) HKD 392 44 44
- held in foreign currency (Cost: Euro 8) NOK 79 8 8
- held in foreign currency (Cost: Euro (10)) (SGD 16) (10) (10)
- held in foreign currency (Cost: Euro (208)) (SEK 2,113) (208) (208)
- held in foreign currency (Cost: Euro 0) ZAR 7 - -
- held in foreign currency (Cost: Euro (1)) (MXN 14) (1) (1)
Total 1,448,072 1,448,072

ALGEBRIS UCITS FUNDS PLC
Notes to the Financial Statements (continued)
for the financial year ended 31 December 2019
61
4. Cash and cash equivalents (continued)
Algebris Financial Equity Fund
Foreign
currency
equivalent
HSBC Bank
Plc
EUR
BNP Paribas
EUR
Morgan
Stanley
EUR
Total
2018
EUR
Cash
- held in local currency 2,412,777 547,019 - 2,959,796
- held in foreign currency (Cost: Euro (5,442)) (GBP 4,911) (5,463) - - (5,463)
- held in foreign currency (Cost: Euro 1,161,087) USD 1,326,447 1,826,139 - (669,740) 1,156,399
- held in foreign currency (Cost: Euro (72)) (JPY 9,079) (72) - - (72)
- held in foreign currency (Cost: Euro 1) AUD 1 1 - - 1
- held in foreign currency (Cost: Euro 246) CHF 276 245 - - 245
- held in foreign currency (Cost: Euro (54)) (DKK 406) (54) - - (54)
- held in foreign currency (Cost: Euro 463) HKD 4,124 459 - - 459
- held in foreign currency (Cost: Euro 0) NOK 1 - - - -
- held in foreign currency (Cost: Euro (31)) (PLN 136) (32) - - (32)
- held in foreign currency (Cost: Euro (2,814)) (SEK 29,082) (2,864) - - (2,864)
- held in foreign currency (Cost: Euro (160)) (SGD 249) (160) - - (160)
- held in foreign currency (Cost: Euro 0) ZAR 7 1 - - 1
Total 4,230,977 547,019 (669,740) 4,108,256
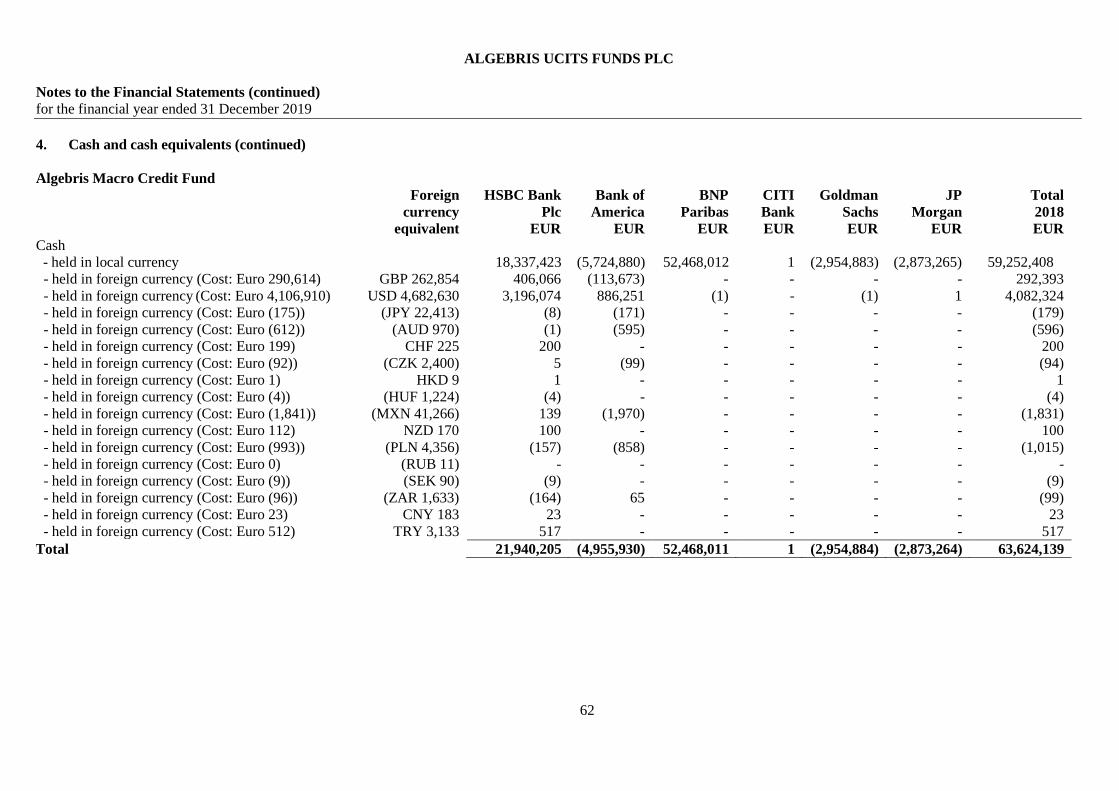
ALGEBRIS UCITS FUNDS PLC
Notes to the Financial Statements (continued)
for the financial year ended 31 December 2019
62
4. Cash and cash equivalents (continued)
Algebris Macro Credit Fund
Foreign
currency
equivalent
HSBC Bank
Plc
EUR
Bank of
America
EUR
BNP
Paribas
EUR
CITI
Bank
EUR
Goldman
Sachs
EUR
JP
Morgan
EUR
Total
2018
EUR
Cash
- held in local currency 18,337,423 (5,724,880) 52,468,012 1 (2,954,883) (2,873,265) 59,252,408
- held in foreign currency (Cost: Euro 290,614) GBP 262,854 406,066 (113,673) - - - - 292,393
- held in foreign currency (Cost: Euro 4,106,910) USD 4,682,630 3,196,074 886,251 (1) - (1) 1 4,082,324
- held in foreign currency (Cost: Euro (175)) (JPY 22,413) (8) (171) - - - - (179)
- held in foreign currency (Cost: Euro (612)) (AUD 970) (1) (595) - - - - (596)
- held in foreign currency (Cost: Euro 199) CHF 225 200 - - - - - 200
- held in foreign currency (Cost: Euro (92)) (CZK 2,400) 5 (99) - - - - (94)
- held in foreign currency (Cost: Euro 1) HKD 9 1 - - - - - 1
- held in foreign currency (Cost: Euro (4)) (HUF 1,224) (4) - - - - - (4)
- held in foreign currency (Cost: Euro (1,841)) (MXN 41,266) 139 (1,970) - - - - (1,831)
- held in foreign currency (Cost: Euro 112) NZD 170 100 - - - - - 100
- held in foreign currency (Cost: Euro (993)) (PLN 4,356) (157) (858) - - - - (1,015)
- held in foreign currency (Cost: Euro 0) (RUB 11) - - - - - - -
- held in foreign currency (Cost: Euro (9)) (SEK 90) (9) - - - - - (9)
- held in foreign currency (Cost: Euro (96)) (ZAR 1,633) (164) 65 - - - - (99)
- held in foreign currency (Cost: Euro 23) CNY 183 23 - - - - - 23
- held in foreign currency (Cost: Euro 512) TRY 3,133 517 - - - - - 517
Total 21,940,205 (4,955,930) 52,468,011 1 (2,954,884) (2,873,264) 63,624,139
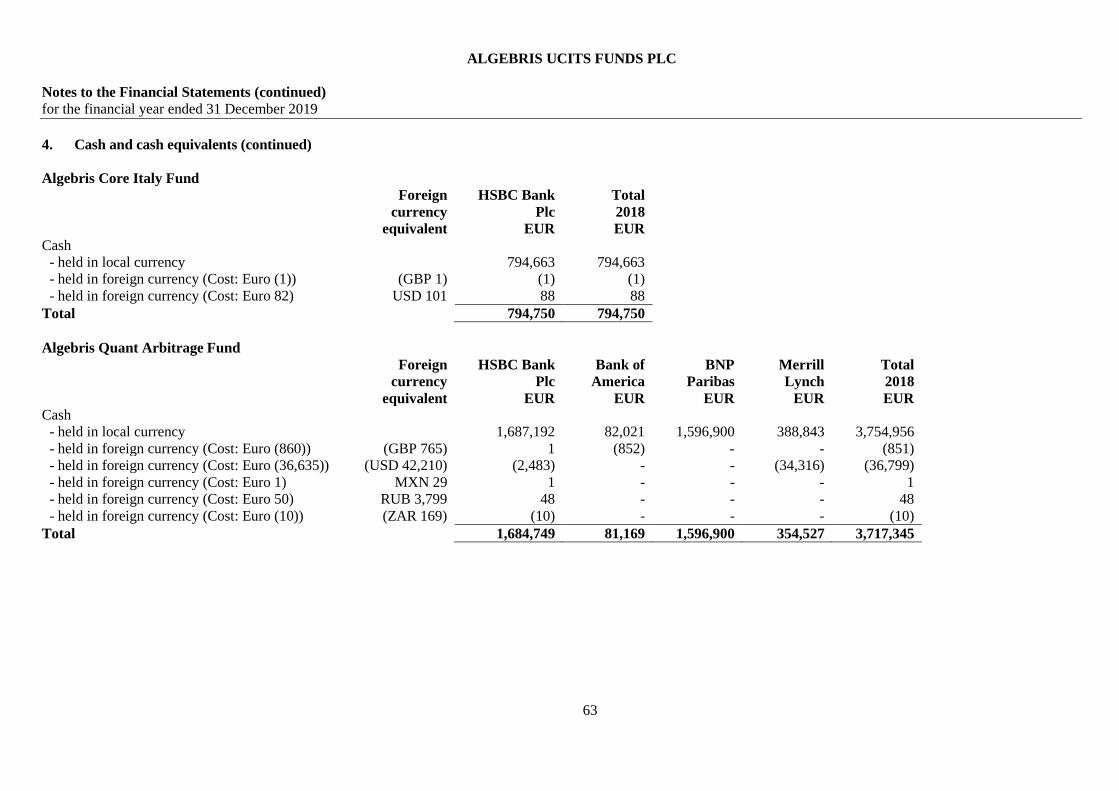
ALGEBRIS UCITS FUNDS PLC
Notes to the Financial Statements (continued)
for the financial year ended 31 December 2019
63
4. Cash and cash equivalents (continued)
Algebris Core Italy Fund
Foreign
currency
equivalent
HSBC Bank
Plc
EUR
Total
2018
EUR
Cash
- held in local currency 794,663 794,663
- held in foreign currency (Cost: Euro (1)) (GBP 1) (1) (1)
- held in foreign currency (Cost: Euro 82) USD 101 88 88
Total 794,750 794,750
Algebris Quant Arbitrage Fund
Foreign
currency
equivalent
HSBC Bank
Plc
EUR
Bank of
America
EUR
BNP
Paribas
EUR
Merrill
Lynch
EUR
Total
2018
EUR
Cash
- held in local currency 1,687,192 82,021 1,596,900 388,843 3,754,956
- held in foreign currency (Cost: Euro (860)) (GBP 765) 1 (852) - - (851)
- held in foreign currency (Cost: Euro (36,635)) (USD 42,210) (2,483) - - (34,316) (36,799)
- held in foreign currency (Cost: Euro 1) MXN 29 1 - - - 1
- held in foreign currency (Cost: Euro 50) RUB 3,799 48 - - - 48
- held in foreign currency (Cost: Euro (10)) (ZAR 169) (10) - - - (10)
Total 1,684,749 81,169 1,596,900 354,527 3,717,345
ALGEBRIS UCITS FUNDS PLC
Notes to the Financial Statements (continued)
for the financial year ended 31 December 2019
64
5. Fair value measurement
IFRS 13 establishes a fair value hierarchy that prioritises the inputs to valuation techniques used to measure fair value. The
hierarchy gives the highest priority to unadjusted quoted prices in active markets for identical assets or liabilities (Level 1
measurements) and the lowest priority to unobservable inputs (Level 3 measurements). The three levels of the fair value
hierarchy are described in the table below.
Level 1 Inputs that reflect unadjusted quoted prices in active markets for identical assets or liabilities that the
Company has the ability to access at the measurement date;
Level 2 Inputs other than quoted prices that are observable for the asset or liability either directly or indirectly,
including inputs in markets that are not considered to be active;
Level 3 Inputs that are unobservable.
Inputs are used in applying the various valuation techniques and broadly refer to the assumptions that market participants
use to make valuation decisions, including assumptions about risk. Inputs may include price information, volatility
statistics, specific and broad credit data, liquidity statistics, and other factors. A financial instrument’s level within the fair
value hierarchy is based on the lowest level of any input that is significant to the fair value measurement. However, the
determination of what constitutes “observable” requires significant judgment by the Directors. The Directors consider
observable data to be that market data which is readily available, regularly distributed or updated, reliable and verifiable,
not proprietary, and provided by independent sources that are actively involved in the relevant market. The categorisation
of a financial instrument within the hierarchy is based upon the pricing transparency of the instrument and does not
necessarily correspond to the Directors' perceived risk of that instrument.
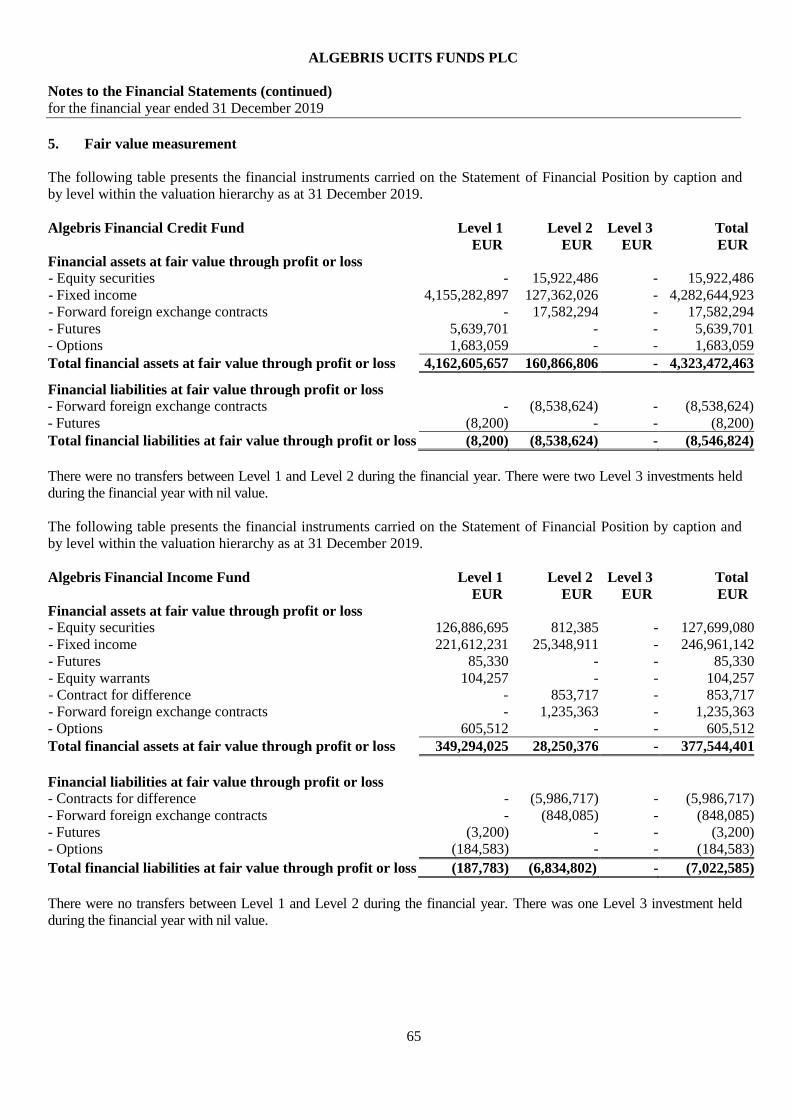
ALGEBRIS UCITS FUNDS PLC
Notes to the Financial Statements (continued)
for the financial year ended 31 December 2019
65
5. Fair value measurement
The following table presents the financial instruments carried on the Statement of Financial Position by caption and
by level within the valuation hierarchy as at 31 December 2019.
Algebris Financial Credit Fund Level 1 Level 2 Level 3 Total
EUR EUR EUR EUR
Financial assets at fair value through profit or loss
- Equity securities - 15,922,486 - 15,922,486
- Fixed income 4,155,282,897 127,362,026 - 4,282,644,923
- Forward foreign exchange contracts - 17,582,294 - 17,582,294
- Futures 5,639,701 - - 5,639,701
- Options 1,683,059 - - 1,683,059
Total financial assets at fair value through profit or loss 4,162,605,657 160,866,806 - 4,323,472,463 Financial liabilities at fair value through profit or loss
- Forward foreign exchange contracts - (8,538,624) - (8,538,624)
- Futures (8,200) - - (8,200)
Total financial liabilities at fair value through profit or loss (8,200) (8,538,624) - (8,546,824)
There were no transfers between Level 1 and Level 2 during the financial year. There were two Level 3 investments held
during the financial year with nil value.
The following table presents the financial instruments carried on the Statement of Financial Position by caption and
by level within the valuation hierarchy as at 31 December 2019.
Algebris Financial Income Fund Level 1 Level 2 Level 3 Total
EUR EUR EUR EUR
Financial assets at fair value through profit or loss
- Equity securities 126,886,695 812,385 - 127,699,080
- Fixed income 221,612,231 25,348,911 - 246,961,142
- Futures 85,330 - - 85,330
- Equity warrants 104,257 - - 104,257
- Contract for difference - 853,717 - 853,717
- Forward foreign exchange contracts - 1,235,363 - 1,235,363
- Options 605,512 - - 605,512
Total financial assets at fair value through profit or loss 349,294,025 28,250,376 - 377,544,401
Financial liabilities at fair value through profit or loss
- Contracts for difference - (5,986,717) - (5,986,717)
- Forward foreign exchange contracts - (848,085) - (848,085)
- Futures (3,200) - - (3,200)
- Options (184,583) - - (184,583)
Total financial liabilities at fair value through profit or loss (187,783) (6,834,802) - (7,022,585)
There were no transfers between Level 1 and Level 2 during the financial year. There was one Level 3 investment held
during the financial year with nil value.

ALGEBRIS UCITS FUNDS PLC
Notes to the Financial Statements (continued)
for the financial year ended 31 December 2019
66
5. Fair value measurement (continued)
The following table presents the financial instruments carried on the Statement of Financial Position by caption and
by level within the valuation hierarchy as at 31 December 2019.
Algebris Allocation Fund* Level 1 Level 2 Level 3 Total
EUR EUR EUR EUR
Financial assets at fair value through profit or loss
- Equity Security - 8,665,802 - 8,665,802
- Forward foreign exchange contracts - 206 - 206
Total financial assets at fair value through profit or loss - 8,666,008 - 8,666,008
There were no transfers between Level 1 and Level 2 during the financial year. There were no Level 3 investments held
during the financial year.
The following table presents the financial instruments carried on the Statement of Financial Position by caption and
by level within the valuation hierarchy as at 31 December 2019.
Algebris Financial Equity Fund Level 1 Level 2 Level 3 Total
EUR EUR EUR EUR
Financial assets at fair value through profit or loss
- Equity securities 41,430,615 - - 41,430,615
- Fixed income 12,712,524 - - 12,712,524
- Contracts for difference - 2,086,704 - 2,086,704
- Forward foreign exchange contracts - 146,068 - 146,068
- Futures 2,940 - - 2,940
- Options 101,588 - 101,588
Total financial assets at fair value through profit or loss 54,247,667 2,232,772 - 56,480,439
Financial liabilities at fair value through profit or loss
- Contracts for difference - (473,765) - (473,765)
- Forward foreign exchange contracts - (229,034) - (229,034)
- Futures (28,988) - - (28,988)
- Options (30,441) - - (30,441)
Total financial liabilities at fair value through profit or loss (59,429) (702,799) - (762,228)
There were no transfers between Level 1 and Level 2 during the financial year. There was one Level 3 investment held
during the financial year with nil value.
*Formerly known as Algebris Asset Allocation Fund.
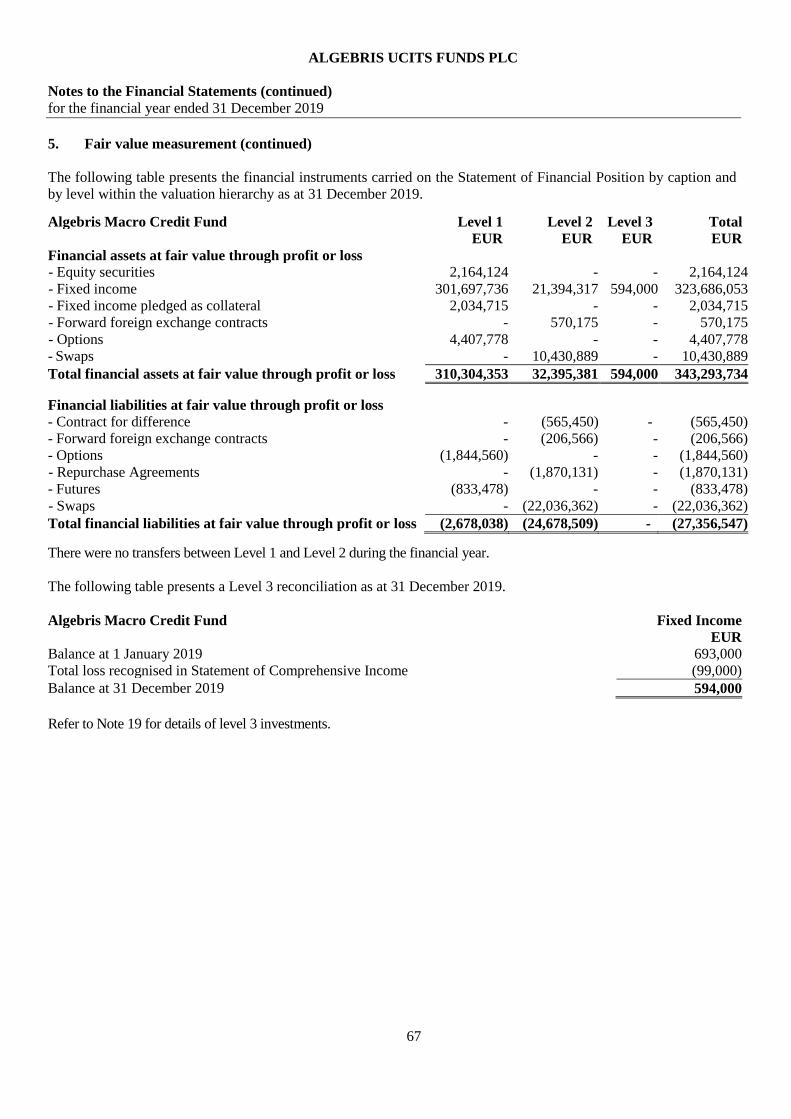
ALGEBRIS UCITS FUNDS PLC
Notes to the Financial Statements (continued)
for the financial year ended 31 December 2019
67
5. Fair value measurement (continued)
The following table presents the financial instruments carried on the Statement of Financial Position by caption and
by level within the valuation hierarchy as at 31 December 2019.
Algebris Macro Credit Fund Level 1 Level 2 Level 3 Total
EUR EUR EUR EUR
Financial assets at fair value through profit or loss
- Equity securities 2,164,124 - - 2,164,124
- Fixed income 301,697,736 21,394,317 594,000 323,686,053
- Fixed income pledged as collateral 2,034,715 - - 2,034,715
- Forward foreign exchange contracts - 570,175 - 570,175
- Options 4,407,778 - - 4,407,778
- Swaps - 10,430,889 - 10,430,889
Total financial assets at fair value through profit or loss 310,304,353 32,395,381 594,000 343,293,734
Financial liabilities at fair value through profit or loss
- Contract for difference - (565,450) - (565,450)
- Forward foreign exchange contracts - (206,566) - (206,566)
- Options (1,844,560) - - (1,844,560)
- Repurchase Agreements - (1,870,131) - (1,870,131)
- Futures (833,478) - - (833,478)
- Swaps - (22,036,362) - (22,036,362)
Total financial liabilities at fair value through profit or loss (2,678,038) (24,678,509) - (27,356,547)
There were no transfers between Level 1 and Level 2 during the financial year.
The following table presents a Level 3 reconciliation as at 31 December 2019.
Algebris Macro Credit Fund Fixed Income
EUR
Balance at 1 January 2019 693,000
Total loss recognised in Statement of Comprehensive Income (99,000)
Balance at 31 December 2019 594,000
Refer to Note 19 for details of level 3 investments.
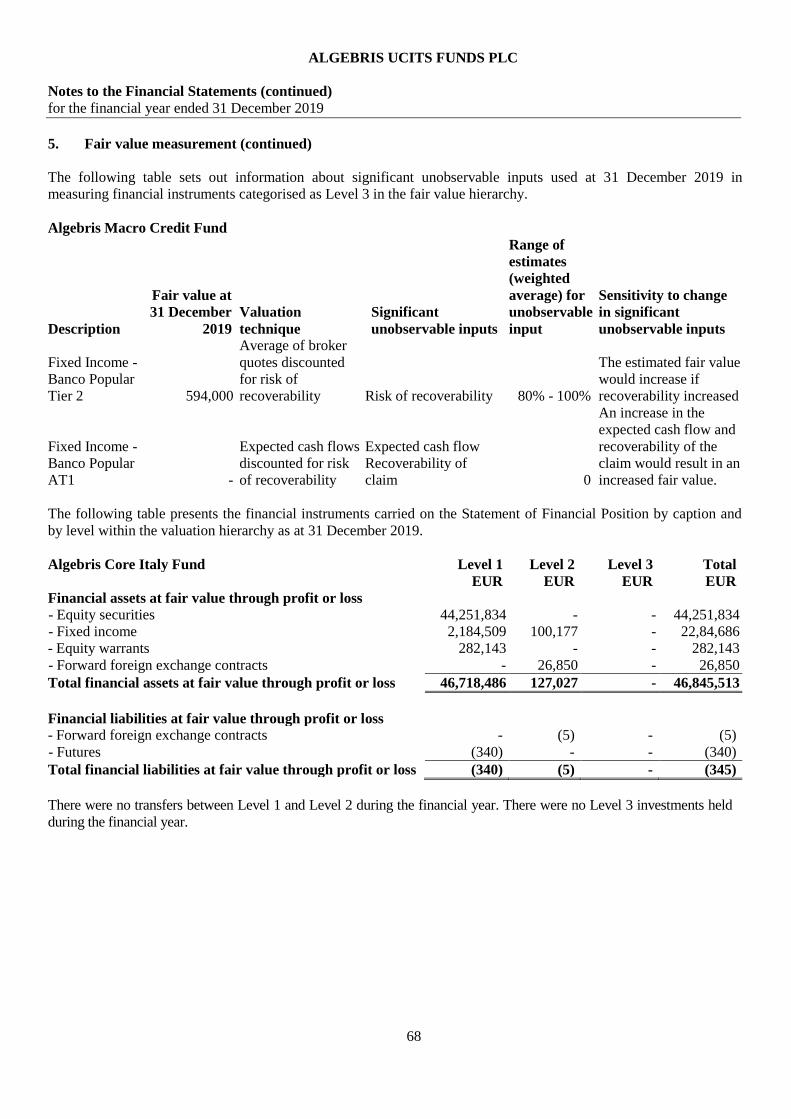
ALGEBRIS UCITS FUNDS PLC
Notes to the Financial Statements (continued)
for the financial year ended 31 December 2019
68
5. Fair value measurement (continued)
The following table sets out information about significant unobservable inputs used at 31 December 2019 in
measuring financial instruments categorised as Level 3 in the fair value hierarchy.
Algebris Macro Credit Fund
Description
Fair value at
31 December
2019
Valuation
technique
Significant
unobservable inputs
Range of
estimates
(weighted
average) for
unobservable
input
Sensitivity to change
in significant
unobservable inputs
Fixed Income -
Banco Popular
Tier 2 594,000
Average of broker
quotes discounted
for risk of
recoverability Risk of recoverability 80% - 100%
The estimated fair value
would increase if
recoverability increased
Fixed Income -
Banco Popular
AT1 -
Expected cash flows
discounted for risk
of recoverability
Expected cash flow
Recoverability of
claim 0
An increase in the
expected cash flow and
recoverability of the
claim would result in an
increased fair value.
The following table presents the financial instruments carried on the Statement of Financial Position by caption and
by level within the valuation hierarchy as at 31 December 2019.
Algebris Core Italy Fund Level 1 Level 2 Level 3 Total
EUR EUR EUR EUR
Financial assets at fair value through profit or loss
- Equity securities 44,251,834 - - 44,251,834
- Fixed income 2,184,509 100,177 - 22,84,686
- Equity warrants 282,143 - - 282,143
- Forward foreign exchange contracts - 26,850 - 26,850
Total financial assets at fair value through profit or loss 46,718,486 127,027 - 46,845,513
Financial liabilities at fair value through profit or loss
- Forward foreign exchange contracts - (5) - (5)
- Futures (340) - - (340)
Total financial liabilities at fair value through profit or loss (340) (5) - (345)
There were no transfers between Level 1 and Level 2 during the financial year. There were no Level 3 investments held
during the financial year.
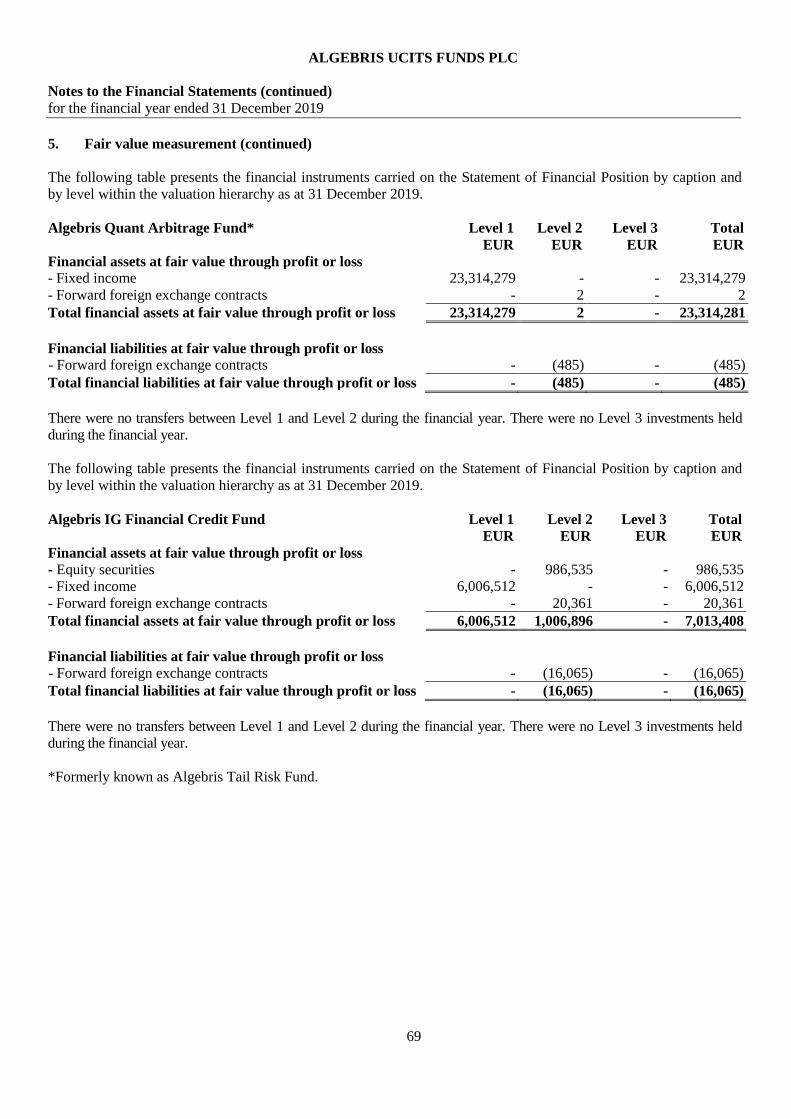
ALGEBRIS UCITS FUNDS PLC
Notes to the Financial Statements (continued)
for the financial year ended 31 December 2019
69
5. Fair value measurement (continued)
The following table presents the financial instruments carried on the Statement of Financial Position by caption and
by level within the valuation hierarchy as at 31 December 2019.
Algebris Quant Arbitrage Fund* Level 1 Level 2 Level 3 Total
EUR EUR EUR EUR
Financial assets at fair value through profit or loss
- Fixed income 23,314,279 - - 23,314,279
- Forward foreign exchange contracts - 2 - 2
Total financial assets at fair value through profit or loss 23,314,279 2 - 23,314,281
Financial liabilities at fair value through profit or loss
- Forward foreign exchange contracts - (485) - (485)
Total financial liabilities at fair value through profit or loss - (485) - (485)
There were no transfers between Level 1 and Level 2 during the financial year. There were no Level 3 investments held
during the financial year.
The following table presents the financial instruments carried on the Statement of Financial Position by caption and
by level within the valuation hierarchy as at 31 December 2019.
Algebris IG Financial Credit Fund Level 1 Level 2 Level 3 Total
EUR EUR EUR EUR
Financial assets at fair value through profit or loss
- Equity securities - 986,535 - 986,535
- Fixed income 6,006,512 - - 6,006,512
- Forward foreign exchange contracts - 20,361 - 20,361
Total financial assets at fair value through profit or loss 6,006,512 1,006,896 - 7,013,408
Financial liabilities at fair value through profit or loss
- Forward foreign exchange contracts - (16,065) - (16,065)
Total financial liabilities at fair value through profit or loss - (16,065) - (16,065)
There were no transfers between Level 1 and Level 2 during the financial year. There were no Level 3 investments held
during the financial year.
*Formerly known as Algebris Tail Risk Fund.

ALGEBRIS UCITS FUNDS PLC
Notes to the Financial Statements (continued)
for the financial year ended 31 December 2019
70
5. Fair value measurement (continued)
The following table presents the financial instruments carried on the Statement of Financial Position by caption and
by level within the valuation hierarchy as at 31 December 2018.
Algebris Financial Credit Fund Level 1 Level 2 Level 3 Total
EUR EUR EUR EUR
Financial assets at fair value through profit or loss
- Equity securities -
15,814,045 - 15,814,045
- Fixed income 3,898,006,370 87,331,545 - 3,985,337,915
- Fixed income pledged as collateral 4,924,688 - - 4,924,688
- Forward foreign exchange contracts - 21,335,981 - 21,335,981
- Futures 161,565 - - 161,565
Total financial assets at fair value through profit or loss 3,903,092,623 124,481,571 - 4,027,574,194 Financial liabilities at fair value through profit or loss
- Forward foreign exchange contracts - (7,368,134) - (7,368,134)
- Futures (1,895,520) - - (1,895,520)
- Repurchase Agreements - (5,215,764) - (5,215,764)
Total financial liabilities at fair value through profit or loss (1,895,520) (12,583,898) - (14,479,418)
There were no transfers between Level 1 and Level 2 during the financial year. There were two Level 3 investments held
during the financial year with nil Value.
The following table presents the financial instruments carried on the Statement of Financial Position by caption and by
level within the valuation hierarchy as at 31 December 2018.
Algebris Financial Income Fund Level 1 Level 2 Level 3 Total
EUR EUR EUR EUR
Financial assets at fair value through profit or loss
- Equity securities 208,385,194 806,852 - 209,192,046
- Fixed income 227,419,819 13,815,328 - 241,235,147
- Contracts for difference - 213,742 - 213,742
- Equity warrants 10,803 - - 10,803
- Forward foreign exchange contracts - 2,682,984 - 2,682,984
- Options 544,824 1,014,324 - 1,559,148
Total financial assets at fair value through profit or loss 436,360,640 18,533,230 - 454,893,870
Financial liabilities at fair value through profit or loss
- Contracts for difference - (33,908,294) - (33,908,294)
- Forward foreign exchange contracts - (2,040,782) - (2,040,782)
- Futures (279,780) - - (279,780)
- Options - (299,969) - (299,969)
Total financial liabilities at fair value through profit or loss (279,780) (36,249,045) - (36,528,825)
There were no transfers between Level 1 and Level 2 during the financial year. There was one Level 3 investments held
during the financial year with nil value.

ALGEBRIS UCITS FUNDS PLC
Notes to the Financial Statements (continued)
for the financial year ended 31 December 2019
71
5. Fair value measurement (continued) The following table presents the financial instruments carried on the Statement of Financial Position by caption and
by level within the valuation hierarchy as at 31 December 2018.
Algebris Asset Allocation Fund Level 1 Level 2 Level 3 Total
EUR EUR EUR EUR
Financial assets at fair value through profit or loss
- Equity securities 4,727,243 - - 4,727,243
- Fixed income 6,010,109 - - 6,010,109
- Contracts for difference - 108,173 - 108,173
- Equity warrants 500 - - 500
- Forward foreign exchange contracts - 51,713 - 51,713
- Futures 58,386 - - 58,386
- Options 5,922 16,712 - 22,634
Total financial assets at fair value through profit or loss 10,802,160 176,598 - 10,978,758
Financial liabilities at fair value through profit or loss
- Contracts for difference - (814,484) - (814,484)
- Forward foreign exchange contracts - (7,670) - (7,670)
- Futures (12,742) - - (12,742)
- Options - (7,012) - (7,012)
Total financial liabilities at fair value through profit or loss (12,742) (829,166) - (841,908)
There were no transfers between Level 1 and Level 2 during the financial year. There were no Level 3 investments held
during the financial year.
The following table presents the financial instruments carried on the Statement of Financial Position by caption and
by level within the valuation hierarchy as at 31 December 2018.
Algebris Financial Equity Fund Level 1 Level 2 Level 3 Total
EUR EUR EUR EUR
Financial assets at fair value through profit or loss
- Equity securities 73,093,219 - - 73,093,219
- Contracts for difference - 3,802,611 - 3,802,611
- Forward foreign exchange contracts - 704,508 - 704,508
- Futures 76,700 - - 76,700
- Options 136,947 328,190 - 465,137
Total financial assets at fair value through profit or loss 73,306,866 4,835,309 - 78,142,175
Financial liabilities at fair value through profit or loss
- Contracts for difference - (8,745,529) - (8,745,529)
- Forward foreign exchange contracts - (435,470) - (435,470)
- Options (3,818) (65,117) - (68,935)
Total financial liabilities at fair value through profit or loss (3,818) (9,246,116) - (9,249,934)
There were no transfers between Level 1 and Level 2 during the financial year. There was one Level 3 investments held
during the financial year with nil value.

ALGEBRIS UCITS FUNDS PLC
Notes to the Financial Statements (continued)
for the financial year ended 31 December 2019
72
5. Fair value measurement (continued)
The following table presents the financial instruments carried on the Statement of Financial Position by caption and
by level within the valuation hierarchy as at 31 December 2018.
Algebris Macro Credit Fund Level 1 Level 2 Level 3 Total
EUR EUR EUR EUR
Financial assets at fair value through profit or loss
- Equity securities 2,087,032 - - 2,087,032
- Fixed income 488,030,827 94,353,948 693,000 583,077,775
- Fixed income pledged as collateral 37,215,337 - - 37,215,337
- Forward foreign exchange contracts - 1,517,135 - 1,517,135
- Futures 1,205,536 - - 1,205,536
- Options 2,069,027 4,536,710 - 6,605,737
- Swaps - 28,647,714 - 28,647,714
Total financial assets at fair value through profit or loss 530,607,759 129,055,507 693,000 660,356,266
Financial liabilities at fair value through profit or loss
- Forward foreign exchange contracts - (256,894) - (256,894)
- Options (297,588) (4,091,811) - (4,389,399)
- Repurchase Agreements - (42,579,231) - (42,579,231)
- Swaps - (20,733,766) - (20,733,766)
Total financial liabilities at fair value through profit or loss (297,588) (67,661,702) - (67,959,290)
There were no transfers between Level 1 and Level 2 during the financial year.
The following table presents a Level 3 reconciliation as at 31 December 2018.
Algebris Macro Credit Fund Fixed Income
EUR
Balance at 1 January 2018 1,122,000
Total loss recognised in Statement of Comprehensive Income (429,000)
Balance at 31 December 2018 693,000
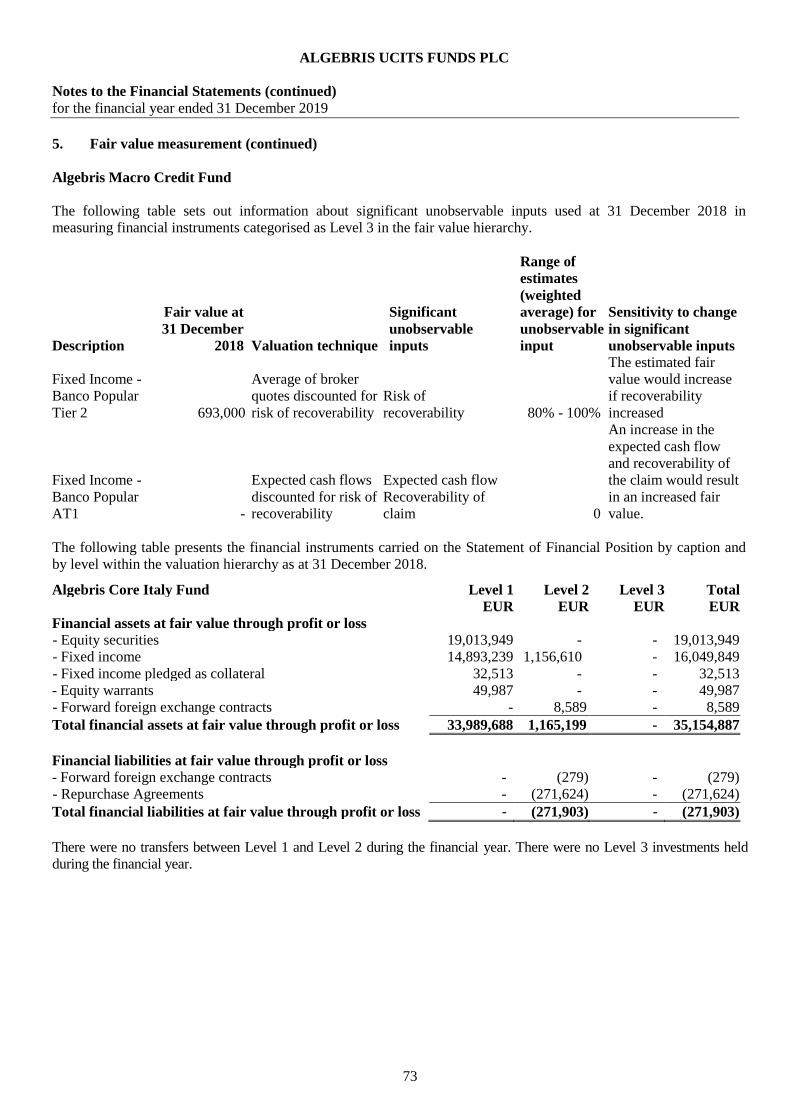
ALGEBRIS UCITS FUNDS PLC
Notes to the Financial Statements (continued)
for the financial year ended 31 December 2019
73
5. Fair value measurement (continued) Algebris Macro Credit Fund
The following table sets out information about significant unobservable inputs used at 31 December 2018 in
measuring financial instruments categorised as Level 3 in the fair value hierarchy.
Description
Fair value at
31 December
2018 Valuation technique
Significant
unobservable
inputs
Range of
estimates
(weighted
average) for
unobservable
input
Sensitivity to change
in significant
unobservable inputs
Fixed Income -
Banco Popular
Tier 2 693,000
Average of broker
quotes discounted for
risk of recoverability
Risk of
recoverability 80% - 100%
The estimated fair
value would increase
if recoverability
increased
Fixed Income -
Banco Popular
AT1 -
Expected cash flows
discounted for risk of
recoverability
Expected cash flow
Recoverability of
claim 0
An increase in the
expected cash flow
and recoverability of
the claim would result
in an increased fair
value.
The following table presents the financial instruments carried on the Statement of Financial Position by caption and
by level within the valuation hierarchy as at 31 December 2018.
Algebris Core Italy Fund Level 1 Level 2 Level 3 Total
EUR EUR EUR EUR
Financial assets at fair value through profit or loss
- Equity securities 19,013,949 - - 19,013,949
- Fixed income 14,893,239 1,156,610 - 16,049,849
- Fixed income pledged as collateral 32,513 - - 32,513
- Equity warrants 49,987 - - 49,987
- Forward foreign exchange contracts - 8,589 - 8,589
Total financial assets at fair value through profit or loss 33,989,688 1,165,199 - 35,154,887
Financial liabilities at fair value through profit or loss
- Forward foreign exchange contracts - (279) - (279)
- Repurchase Agreements - (271,624) - (271,624)
Total financial liabilities at fair value through profit or loss - (271,903) - (271,903)
There were no transfers between Level 1 and Level 2 during the financial year. There were no Level 3 investments held
during the financial year.
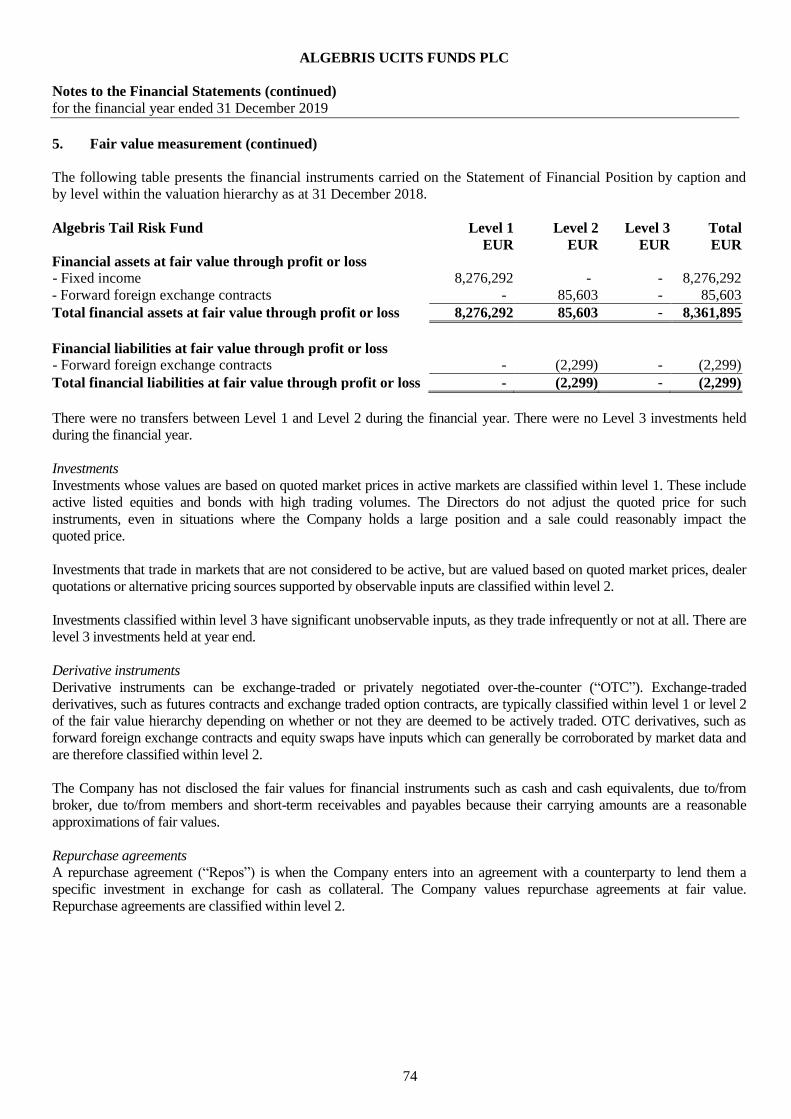
ALGEBRIS UCITS FUNDS PLC
Notes to the Financial Statements (continued)
for the financial year ended 31 December 2019
74
5. Fair value measurement (continued)
The following table presents the financial instruments carried on the Statement of Financial Position by caption and
by level within the valuation hierarchy as at 31 December 2018.
Algebris Tail Risk Fund Level 1 Level 2 Level 3 Total
EUR EUR EUR EUR
Financial assets at fair value through profit or loss
- Fixed income 8,276,292 - - 8,276,292
- Forward foreign exchange contracts - 85,603 - 85,603
Total financial assets at fair value through profit or loss 8,276,292 85,603 - 8,361,895
Financial liabilities at fair value through profit or loss
- Forward foreign exchange contracts - (2,299) - (2,299)
Total financial liabilities at fair value through profit or loss - (2,299) - (2,299)
There were no transfers between Level 1 and Level 2 during the financial year. There were no Level 3 investments held
during the financial year.
Investments
Investments whose values are based on quoted market prices in active markets are classified within level 1. These include
active listed equities and bonds with high trading volumes. The Directors do not adjust the quoted price for such
instruments, even in situations where the Company holds a large position and a sale could reasonably impact the
quoted price.
Investments that trade in markets that are not considered to be active, but are valued based on quoted market prices, dealer
quotations or alternative pricing sources supported by observable inputs are classified within level 2.
Investments classified within level 3 have significant unobservable inputs, as they trade infrequently or not at all. There are
level 3 investments held at year end.
Derivative instruments
Derivative instruments can be exchange-traded or privately negotiated over-the-counter (“OTC”). Exchange-traded
derivatives, such as futures contracts and exchange traded option contracts, are typically classified within level 1 or level 2
of the fair value hierarchy depending on whether or not they are deemed to be actively traded. OTC derivatives, such as
forward foreign exchange contracts and equity swaps have inputs which can generally be corroborated by market data and
are therefore classified within level 2.
The Company has not disclosed the fair values for financial instruments such as cash and cash equivalents, due to/from
broker, due to/from members and short-term receivables and payables because their carrying amounts are a reasonable
approximations of fair values.
Repurchase agreements
A repurchase agreement (“Repos”) is when the Company enters into an agreement with a counterparty to lend them a
specific investment in exchange for cash as collateral. The Company values repurchase agreements at fair value.
Repurchase agreements are classified within level 2.

ALGEBRIS UCITS FUNDS PLC
Notes to the Financial Statements (continued)
for the financial year ended 31 December 2019
75
6. Fees and expenses
Investment management fees
For Algebris Financial Credit Fund, the Investment Manager shall be entitled to receive an investment management fee
(the “Management Fee”) from the Sub-Fund equal to 0.50% per annum of the Net Asset Value of the Class I Shares and
Class XXL Shares, 0.79% per annum of the Net Asset Value of the Class Z Shares, 1.20% per annum of the Net Asset
Value of the Class R Shares, 1.50% per annum of the Net Asset Value of the Class W Shares and 1.00% per annum of
the Net Asset Value of the Class C Shares.
For Algebris Financial Income Fund, the Investment Manager shall be entitled to receive the Management Fee from the
Sub-Fund equal to 0.90% per annum of the Net Asset Value of the Class I Shares, 1.80% per annum of the Net Asset
Value of the Class R Shares and 0.50% per annum of the Net Asset Value of the Class B Shares and Class XXL Shares.
For Algebris Allocation Fund, the Investment Manager shall be entitled to receive the Management Fee from the Sub-
Fund equal to 0.80% per annum of the Net Asset Value of the Class I Shares, 1.60% per annum of the Net Asset Value of
the Class R Shares and 0.50% per annum of the Net Asset Value of the Class B Shares.
For Algebris Financial Equity Fund, the Investment Manager shall be entitled to receive the Management Fee from the
Sub-Fund equal to 1.25% per annum of the Net Asset Value of the Class I Shares, 2.00% per annum of the Net Asset
Value of the Class R Shares and 1.00% per annum of the Net Asset Value of the Class B Shares.
For Algebris Macro Credit Fund, the Investment Manager shall be entitled to receive the Management Fee from the Sub-
Fund equal to 0.75% per annum of the Net Asset Value of the Class B Shares, 0.90% per annum of the Net Asset Value
of the Class I Shares and 1.50% per annum of the Net Asset Value of the Class R Shares.
For Algebris Core Italy Fund, the Investment Manager shall be entitled to receive the Management Fee from the Sub-
Fund equal to 0.50% per annum of the Net Asset Value of the Class EB and Class I Shares and 1.00% per annum of the
Net Asset Value of the Class R Shares.
For Algebris Quant Arbitrage Fund, the Investment Manager shall be entitled to receive the Management Fee from the
Sub-Fund equal to 0.50% per annum of the Net Asset Value of the Class EB Shares and 0.60% per annum of the Net
Asset Value of the Class I Shares until 9 May 2019.
From 10 May 2019, for Algebris Quant Arbitrage Fund, the Investment Manager shall be entitled to receive the
Management Fee from the Sub-Fund equal to 0.50% per annum of the Net Asset Value of the Class EB Shares and
0.75% per annum of the Net Asset Value of the Class I Shares and 1.50% per annum of Net Asset Value of the Class R
Shares.
For Algebris IG Financial Credit Fund, the Investment Manager shall be entitled to receive the Management Fee from the
Sub-Fund equal to 0.40% per annum of the Net Asset Value of the Class B Shares, 0.60% per annum of the Net Asset
Value of the Class I Shares and 1.20% per annum of the Net Asset Value of the Class R Shares.
The Management Fee shall be (i) calculated and accrued daily; and (ii) is calculated by reference to the Net Asset Value
of the relevant Shares before the deduction of that days’ Management Fee and accrued Performance Fee. The
Management Fee is normally payable in arrears within 14 days of the end of the relevant month end.
No Management Fee shall be payable in respect of Class M, Class Mm or Class Md Shares.
In addition, the Investment Manager shall be entitled to be reimbursed its reasonably vouched out-of-pocket expenses.
Each Sub-Fund shall bear its pro-rata share of such out-of-pocket expenses. Investment management fees for the
financial year ended 31 December 2019 amounted to EUR 51,020,347 (31 December 2018: EUR 57,275,933) of which
EUR 4,746,277 (31 December 2018: EUR 4,322,988) was payable at financial year end.
ALGEBRIS UCITS FUNDS PLC
Notes to the Financial Statements (continued)
for the financial year ended 31 December 2019
76
6. Fees and expenses (continued)
Performance fees Algebris Financial Credit Fund
The Performance Fee in respect of the Class I and Class R Accumulating Classes is equal to 10% of the excess of the
Net Asset Value per Share of the relevant Class I Shares and Class R Shares (after the deduction of the Management Fee
and all other payments and expenses but before the deduction of any accrued Performance Fee) at the end of a
Performance Period over the High Water Mark.
The Performance Fee in respect of the Class I and Class R Distributing Classes is equal to 10% of the excess of the
Adjusted NAV over the Adjusted High Water Mark.
“Adjusted NAV” means the Net Asset Value per Share of the Class I and Class R Distributing Class after the deduction
of the Management Fee and all other payments and expenses but before the deduction of any accrued Performance Fee
at the end of a Performance Period adjusted by the aggregate amount of all distributions per Share declared in respect of
the Distributing Class since the initial issue of Shares in the Class.
“High Water Mark” means the previous highest of (i) the highest Net Asset Value per Share of the Class I and Class R
Accumulating Classes (before any accrual for the Performance Fee) at the end of any previous Performance Period
(occurring on a quarter end) on which the Performance Fee was paid; and (ii) the Initial Offer Price of the relevant Class
I and Class R Accumulating Shares.
“Performance Period” means a calendar quarter ending on 31 March, 30 June, 30 September and 31 December (each
quarter end) in each year, save that the first Performance Period will commence upon the initial issue of Shares and will
end on the following quarter end.
“Adjusted High Water Mark” means the previous highest of (i) the highest Adjusted NAV (before any accrual for the
Performance Fee) at the end of any previous Performance Period (occurring on a quarter end) on which the Performance
Fee was paid; and (ii) the Initial Offer Price of the Class I Accumulating Shares and Class R Accumulating Shares,
respectively.
The Performance Fee (if any) will accrue daily. The amount accrued on each day will be determined by calculating the
Performance Fee that would be payable if that day was the last day of the current Performance Period. The Performance
Fee will be payable by the relevant Sub-Fund to the Investment Manager quarterly in arrears normally within 14
calendar days of the end of each Performance Period.
The Performance Fee, if any, is calculated on Net Asset Value per Share (after the deduction of the Management Fee
and all other payments and expenses but before the deduction of any accrued Performance Fee) at the end of each
Performance Period (with respect to the Class I and Class R Accumulating Share Classes) and the Adjusted NAV (with
respect to the Class I and Class R Distributing Share Classes) including in each case, for the avoidance of doubt the net
realised and unrealised gains and losses. As a result, a Performance Fee may be paid on unrealised gains which may
subsequently never be realised. There is no repayment of any Performance Fee already paid if the Net Asset Value per
Share subsequently falls back below the High Water Mark or Adjusted High Water Mark, as appropriate, even if an
investor redeems its holding. Accrued Performance Fee will be crystallised upon any redemption.
The calculation of the performance fee shall be verified by the Depositary.
ALGEBRIS UCITS FUNDS PLC
Notes to the Financial Statements (continued)
for the financial year ended 31 December 2019
77
6. Fees and expenses (continued)
Performance fees (continued)
Algebris Financial Credit Fund (continued) No performance fees shall be payable in respect of Class M, Class XXL, Class W and Class Z Shares.
Performance fees for the financial year ended 31 December 2019 amounted to EUR 36,458,027 (31 December 2018:
EUR 350,872) of which EUR 18,985,942 (31 December 2018: EUR Nil) was payable at financial year end.
Algebris Financial Income Fund
There are no performance fees in respect of Algebris Financial Income Fund.
Algebris Allocation Fund
The Performance Fee in respect of the Class B, Class I and Class R Shares is equal to 10% of the excess of the Net
Asset Value per Share of the relevant Class B Shares, Class I Shares and Class R Shares (after the deduction of the
Management Fee and all other payments and expenses but before the deduction of any accrued Performance Fee) at the
end of a Performance Period over the High Water Mark.
No performance fees shall be payable in respect of Class M shares.
Performance fees for the financial year ended 31 December 2019 amounted to EUR 13 (31 December 2018: EUR 360)
of which EUR 6 (31 December 2018: EUR Nil) was payable at financial year end.
Algebris Financial Equity Fund
The Performance Fee in respect of the Class B and Class Bm Shares is equal to 10% of the excess of the Net Asset
Value per Share and Class I, Class Im, Class R and Class Rm Shares is equal to 15% of the excess of the Net Asset
Value per Share of the relevant Class B, Class Bm, Class I, Class Im, Class R and Class Rm Shares (after the deduction
of the Management Fee and all other payments and expenses but before the deduction of any accrued Performance Fee)
at the end of a Performance Period over the High Water Mark.
No performance fees shall be payable in respect of Class M, Class Mm Shares and Class Md Shares.
Performance fees for the financial year ended 31 December 2019 amounted to EUR 274 (31 December 2018: EUR
53,849) of which EUR 274 (31 December 2018: Nil) was payable at financial year end.
The Performance Fee, if any, is calculated on Net Asset Value per Share (after the deduction of the Management Fee
and all other payments and expenses but before the deduction of any accrued Performance Fee) at the end of each
Performance Period (with respect to the Class B, Class Bm, Class I, Class Im, Class R and Class Rm Shares) including
in each case, for the avoidance of doubt the net realised and unrealised gains and losses. As a result, a Performance Fee
may be paid on unrealised gains which may subsequently never be realised. There is no repayment of any Performance
Fee already paid if the Net Asset Value per Share subsequently falls back below the High Water Mark or Adjusted
High Water Mark, as appropriate, even if an investor redeems its holding. Accrued Performance Fee will be
crystallised upon any redemption.
ALGEBRIS UCITS FUNDS PLC
Notes to the Financial Statements (continued)
for the financial year ended 31 December 2019
78
6. Fees and expenses (continued)
Performance fees (continued)
Algebris Macro Credit Fund
The Performance Fee in respect of the Class I and Class R Accumulating Classes is equal to 15% of the excess of the
Net Asset Value per Share of the relevant Class I Shares and Class R Shares (after the deduction of the Management
Fee and all other payments and expenses but before the deduction of any accrued Performance Fee) at the end of a
Performance Period over the High Water Mark.
The Performance Fee in respect of the Class B Accumulating Class Shares is equal to 10% of the excess of the Net
Asset Value per Share of the Class B Accumulating Class Shares (after the deduction of the Management Fee and all
other payments and expenses but before the deduction of any accrued Performance Fee) at the end of a Performance
Period over the High Water Mark.
The Performance Fee in respect of the Class I and Class R Distributing Classes is equal to 15% of the excess of
the Adjusted NAV over the Adjusted High Water Mark.
The Performance Fee in respect of the Class B Distributing Class is equal to 10% of the excess of the Adjusted
NAV over the Adjusted High Water Mark.
The Performance Fee, if any, is calculated on Net Asset Value per Share (after the deduction of the Management Fee
and all other payments and expenses but before the deduction of any accrued Performance Fee) at the end of each
Performance Period (with respect to the Class B, Class I and Class R Accumulating Shares Classes) and the Adjusted
NAV (with respect to the Class B, Class I and Class R Distributing Share Classes) including in each case, for the
avoidance of doubt the net realised and unrealised gains and losses. As a result, a Performance Fee may be paid on
unrealised gains which may subsequently never be realised. There is no repayment of any Performance Fee already
paid if the Net Asset Value per Share subsequently falls back below the High Water Mark or Adjusted High Water
Mark, as appropriate, even if an investor redeems its holding.
The Performance Fee (if any) will accrue daily. The amount accrued on each day will be determined by calculating the
Performance Fee that would be payable if that day was the last day of the current Performance Period. The
Performance Fee will be payable by the relevant Sub-Fund to the Investment Manager quarterly in arrears normally
within 14 calendar days of the end of each Performance Period.
No performance fee shall be payable in respect of Class M and Md shares.
Performance fees for the financial year ended 31 December 2019 amounted to EUR 2,457,131 (31 December 2018:
EUR 146,048) of which EUR 1,160,038 (31 December 2018: EUR Nil) was payable at financial year end.
Algebris Core Italy Fund
The Performance Fee in respect of the Class I and Class R Accumulating Classes is equal to 10% of the excess of the
Net Asset Value per Share of the relevant Class I and Class R Shares (after the deduction of the Management Fee and
all other payments and expenses but before the deduction of any accrued Performance Fee) at the end of a Performance
Period over the High Water Mark.
ALGEBRIS UCITS FUNDS PLC
Notes to the Financial Statements (continued)
for the financial year ended 31 December 2019
79
6. Fees and expenses (continued)
Performance fees (continued)
Algebris Core Italy Fund (continued)
The Performance Fee in respect of the Class I and Class R Distributing Classes is equal to 10% of the excess of the
Adjusted NAV over the Initial Offer Price of the relevant Distributing Class Adjusted High Water Mark.
The Performance Fee (if any) will accrue daily. The amount accrued on each day will be determined by calculating the
Performance Fee that would be payable if that day was the last day of the current Performance Period. The Performance
Fee will be payable by the relevant Sub-Fund to the Investment Manager quarterly in arrears normally within 14
calendar days of the end of each Performance Period.
No performance fees shall be payable in respect of Class EB and Class M Shares.
Performance fees for the financial year ended 31 December 2019 amounted to EUR 2,628 (31 December 2018: EUR
Nil) of which EUR 2,464 (31 December 2018: EUR Nil) was payable at financial year end.
Algebris Quant Arbitrage Fund
Until 9 May 2019, the Performance Fee in respect of the Class I Accumulating Classes is equal to 10% of the excess of
the Net Asset Value per Share of the relevant Class I (after the deduction of the Management Fee and all other payments
and expenses but before the deduction of any accrued Performance Fee) at the end of a Performance Period over the
High Water Mark.
From 10 May 2019, the Performance Fee in respect of the Class I and Class R Accumulating Classes is equal to 15% of
the excess of the Net Asset Value per Share of the relevant Class I and Class R Shares (after the deduction of the
Management Fee and all other payments and expenses but before the deduction of any accrued Performance Fee) at the
end of a Performance Period over the High Water Mark.
Until 9 May 2019, the Performance Fee in respect of the Class EB Accumulating Class Shares is equal to 7.5% of the
excess of the Net Asset Value per Share of the Class EB Accumulating Class Shares (after the deduction of the
Management Fee and all other payments and expenses but before the deduction of any accrued Performance Fee) at the
end of a Performance Period over the High Water Mark.
From 10 May 2019, the Performance Fee in respect of the Class EB Accumulating Class Shares is equal to 10% of the
excess of the Net Asset Value per Share of the Class EB Accumulating Class Shares (after the deduction of the
Management Fee and all other payments and expenses but before the deduction of any accrued Performance Fee) at the
end of a Performance Period over the High Water Mark.
The Performance Fee (if any) will accrue daily. The amount accrued on each day will be determined by calculating the
Performance Fee that would be payable if that day was the last day of the current Performance Period. The Performance
Fee will be payable by the Fund to the Investment Manager quarterly in arrears normally within 14 calendar days of the
end of each Performance Period.
No performance fees shall be payable in respect of Class M Shares.
Performance fees for the financial year ended 31 December 2019 amounted to EUR 3,979 (31 December 2018: EUR
1,832) of which EUR 3,120 (31 December 2018: EUR 956) was payable at financial year end.
Algebris IG Financial Credit Fund
There are no performance fees in respect of Algebris IG Financial Credit Fund.

ALGEBRIS UCITS FUNDS PLC
Notes to the Financial Statements (continued)
for the financial year ended 31 December 2019
80
6. Fees and expenses (continued)
Administration fees
The Administrator shall be entitled to receive out of the assets of each Sub-Fund a fee, accrued and calculated daily and
payable monthly in arrears, at a rate of up to 0.05% per annum of a Sub-Fund’s Net Asset Value for the first EUR 250
million, 0.035% per annum of a Sub-Fund’s Net Asset Value between EUR 250 million and EUR 500 million and
0.02% per annum of a Sub-Fund’s Net Asset Value above EUR 500 million subject to a minimum monthly fee of up to
EUR 300 per Share Class (which shall be reduced by 50% for the first six months after the launch of a Sub-Fund). The
Administrator shall receive an annual reporting fee of EUR 3,000 per Sub-Fund.
In addition, the Company shall pay out of the assets of each Sub-Fund its portion of the Administrator’s financial
statement production fee of EUR 5,000 (per set) for the preparation of audited and unaudited financial statements for the
Company. In addition, the Administrator shall be entitled to be reimbursed its reasonable vouched out-of-pocket
expenses, transaction and account fees. Administration fees for the financial year ended 31 December 2019 amounted to
EUR 2,641,173 (31 December 2018: EUR 2,881,750) of which EUR 177,803 (31 December 2018: EUR 156,530) was
payable at financial year end.
Depositary fees
The Depositary shall be entitled to receive out of the assets of each Sub-Fund a fee, accrued and calculated daily and
payable monthly in arrears, at a rate of 0.03% per annum of a Sub-Fund’s Net Asset Value for the first EUR500 million
and 0.025% per annum of a Sub-Fund’s Net Asset Value above EUR500 million subject to a minimum annual fee of
EUR 250,000 at Algebris UCITS Funds plc umbrella level.
The Depositary shall also be entitled to receive a flat fee of USD 7,000 per annum for UCITS V related depositary
charges.
The Depositary shall also be entitled to receive transaction charges and all Sub-Custodian charges will be recovered by
the Depositary from the Company as they are incurred by the relevant sub- Custodian. All such charges shall be charged
at normal commercial rates. The Depositary is also entitled to reimbursement of its reasonable vouched out-of-pocket
expenses. Depositary fees for the financial year ended 31 December 2019 amounted to EUR 1,539,406 (31 December
2018: EUR 1,751,009) of which EUR 145,624 (31 December 2018: EUR 129,906) was payable at financial year end.
Directors’ fees and expenses
The Directors shall be entitled to be paid a fee from the assets of the Company by way of remuneration for their services
at a rate to be determined from time to time by the Directors, provided that the aggregate amount of Directors’
remuneration in any one financial year shall not exceed EUR 75,000 plus VAT or such other maximum amount as may
be determined by the Directors, notified to Shareholders in advance, and disclosed in the Prospectus or the Company’s
annual report. Mr Lasagna shall not receive a Directors’ fee. The Directors will be entitled to be reimbursed by the
Company for all reasonable disbursements and out-of-pocket expenses incurred by them. The Directors’ fees for the
financial year ended 31 December 2019 amounted to EUR 71,025 (31 December 2018: EUR 63,631) of which EUR
40,620 (31 December 2018: EUR 2,813) was payable at financial year end.
Auditors’ fees
Fees accrued for the statutory auditors, KPMG, in respect of the financial year ending 31 December 2019, relate entirely
to the audit of the financial statements and tax advisory services provided by KPMG to the Company. The Auditors’
fees accrued for the financial year ended 31 December 2019 amounted to EUR 139,237 (31 December 2018: EUR
118,820) of which EUR 132,414 (31 December 2018: EUR 107,306) was payable at financial year end. Tax advisory
fees accrued for the financial year ended 31 December 2019 amounted to EUR 128,719 (31 December 2018: EUR
36,406) of which EUR 128,719 (31 December 2018: EUR 36,406) was payable at financial year end.
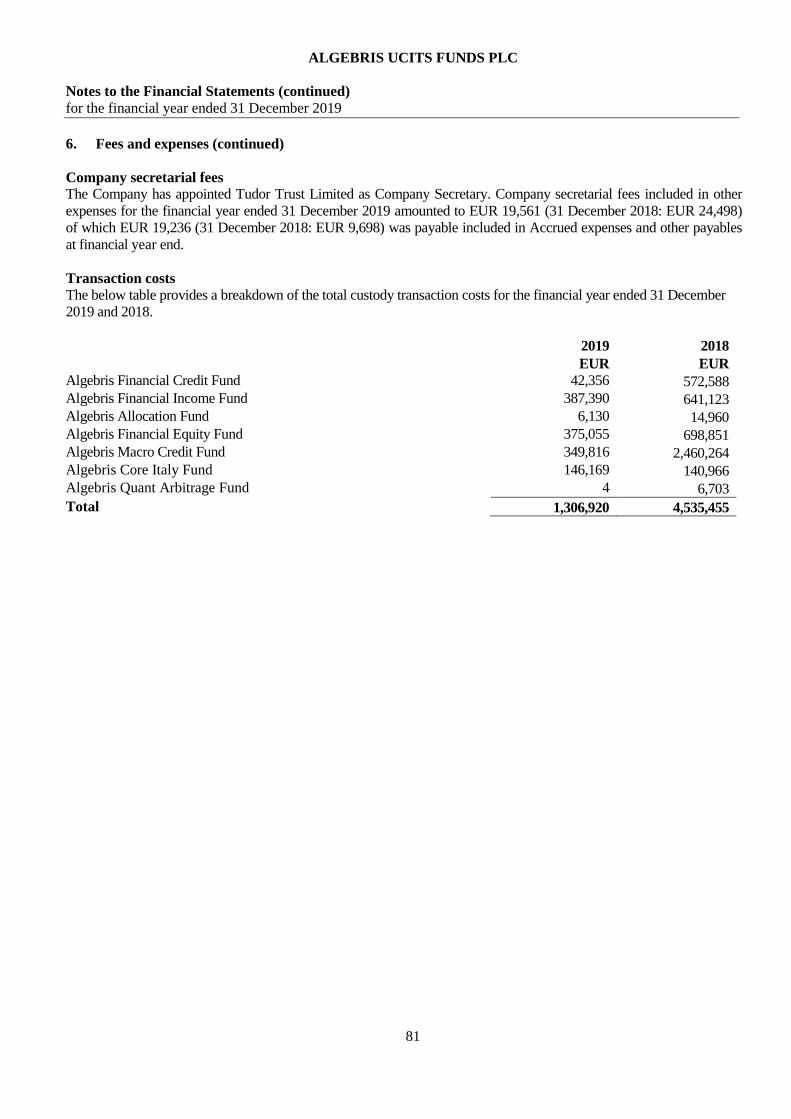
ALGEBRIS UCITS FUNDS PLC
Notes to the Financial Statements (continued)
for the financial year ended 31 December 2019
81
6. Fees and expenses (continued)
Company secretarial fees
The Company has appointed Tudor Trust Limited as Company Secretary. Company secretarial fees included in other
expenses for the financial year ended 31 December 2019 amounted to EUR 19,561 (31 December 2018: EUR 24,498)
of which EUR 19,236 (31 December 2018: EUR 9,698) was payable included in Accrued expenses and other payables
at financial year end.
Transaction costs
The below table provides a breakdown of the total custody transaction costs for the financial year ended 31 December
2019 and 2018.
2019 2018
EUR EUR
Algebris Financial Credit Fund 42,356 572,588
Algebris Financial Income Fund 387,390 641,123
Algebris Allocation Fund 6,130 14,960
Algebris Financial Equity Fund 375,055 698,851
Algebris Macro Credit Fund 349,816 2,460,264
Algebris Core Italy Fund 146,169 140,966
Algebris Quant Arbitrage Fund 4 6,703
Total 1,306,920 4,535,455

ALGEBRIS UCITS FUNDS PLC
Notes to the Financial Statements (continued)
for the financial year ended 31 December 2019
82
7. Other receivables
Algebris Algebris Algebris Algebris Algebris Algebris Algebris Algebris
Financial Financial Allocation Financial Macro Credit Core Italy Quant IG Financial
Total Credit Fund Income Fund Fund Equity Fund Fund Fund Arbitrage Fund Credit Fund
2019 2019 2019 2019 2019 2019 2019 2019 2019 EUR EUR EUR EUR EUR EUR EUR EUR EUR
Interest receivable 48,554,857 40,731,375 2,478,456 - - 5,186,837 35,710 63,156 59,323
Rebate receivable 157,237 - - 106,038 - - - 37,235 13,964
Prepaid Professional Fees 21,737 17,422 754 337 337 2,213 337 337 -
Prepaid publication fees 18,351 14,885 1,476 - 195 1,792 - 3 -
Prepaid tax advisory fees 2,731 - - - - - - 2,731 -
Other prepaid fees 5,798 74 74 73 4,379 101 74 1,023 -
48,760,711 40,763,756 2,480,760 106,448 4911 5,190,943 36,121 104,485 73,287
Algebris Algebris Algebris Algebris Algebris Algebris Algebris
Financial Financial Allocation Financial Macro Credit Core Italy Quant
Total Credit Fund Income Fund Fund Equity Fund Fund Fund Arbitrage Fund
2018 2018 2018 2018 2018 2018 2018 2018
EUR EUR EUR EUR EUR EUR EUR EUR
Interest receivable 63,167,450 49,395,357 3,273,523 38,885 - 10,120,132 321,242 18,311
Rebate receivable 42,107 - - 42,107 - - - -
Prepaid professional fees 20,802 17,454 359 380 379 1,874 - 356
Prepaid publication fees 30,906 11,523 3,110 3,109 3,258 6,354 1,776 1,776
Prepaid tax advisory fees 3,531 - - - - - - 3,531
Other prepaid fees 848 - - - - - - 848
63,265,644 49,424,334 3,276,992 84,481 3,637 10,128,360 323,018 24,822
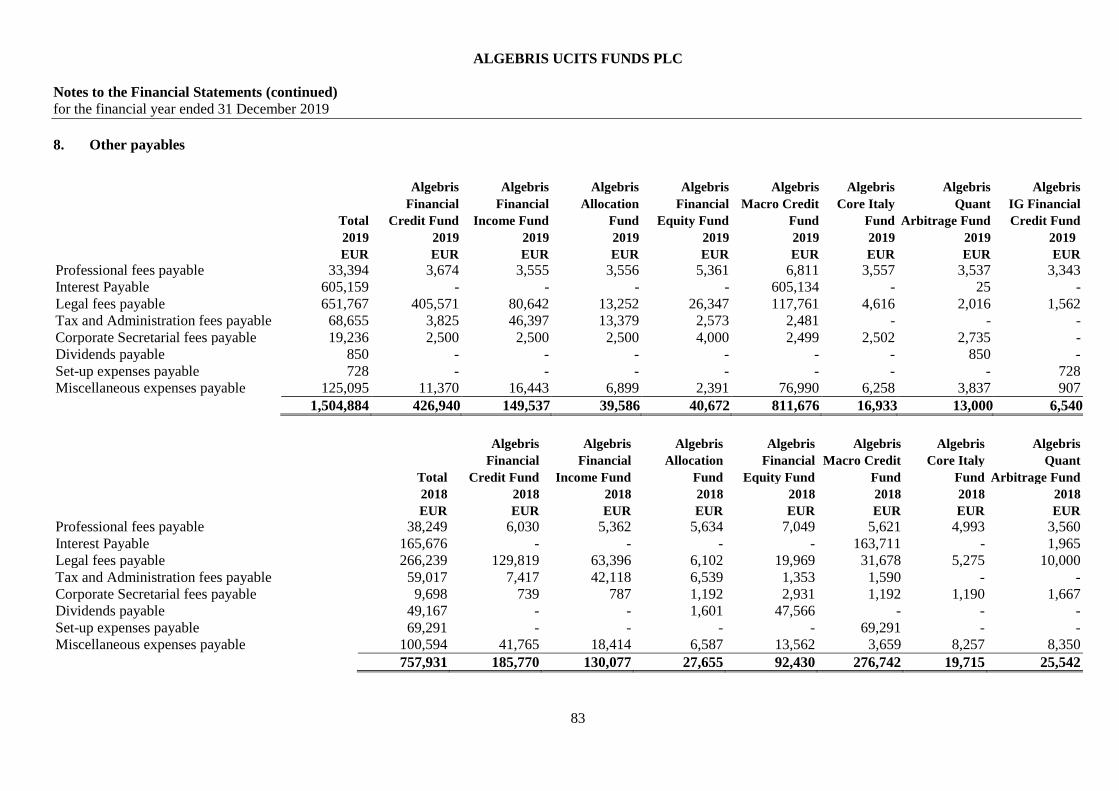
ALGEBRIS UCITS FUNDS PLC
Notes to the Financial Statements (continued)
for the financial year ended 31 December 2019
83
8. Other payables
Algebris Algebris Algebris Algebris Algebris Algebris Algebris Algebris
Financial Financial Allocation Financial Macro Credit Core Italy Quant IG Financial
Total Credit Fund Income Fund Fund Equity Fund Fund Fund Arbitrage Fund Credit Fund
2019 2019 2019 2019 2019 2019 2019 2019 2019 EUR EUR EUR EUR EUR EUR EUR EUR EUR
Professional fees payable 33,394 3,674 3,555 3,556 5,361 6,811 3,557 3,537 3,343
Interest Payable 605,159 - - - - 605,134 - 25 -
Legal fees payable 651,767 405,571 80,642 13,252 26,347 117,761 4,616 2,016 1,562
Tax and Administration fees payable 68,655 3,825 46,397 13,379 2,573 2,481 - - -
Corporate Secretarial fees payable 19,236 2,500 2,500 2,500 4,000 2,499 2,502 2,735 -
Dividends payable 850 - - - - - - 850 -
Set-up expenses payable 728 - - - - - - - 728
Miscellaneous expenses payable 125,095 11,370 16,443 6,899 2,391 76,990 6,258 3,837 907
1,504,884 426,940 149,537 39,586 40,672 811,676 16,933 13,000 6,540
Algebris Algebris Algebris Algebris Algebris Algebris Algebris
Financial Financial Allocation Financial Macro Credit Core Italy Quant
Total Credit Fund Income Fund Fund Equity Fund Fund Fund Arbitrage Fund
2018 2018 2018 2018 2018 2018 2018 2018
EUR EUR EUR EUR EUR EUR EUR EUR
Professional fees payable 38,249 6,030 5,362 5,634 7,049 5,621 4,993 3,560
Interest Payable 165,676 - - - - 163,711 - 1,965
Legal fees payable 266,239 129,819 63,396 6,102 19,969 31,678 5,275 10,000
Tax and Administration fees payable 59,017 7,417 42,118 6,539 1,353 1,590 - -
Corporate Secretarial fees payable 9,698 739 787 1,192 2,931 1,192 1,190 1,667
Dividends payable 49,167 - - 1,601 47,566 - - -
Set-up expenses payable 69,291 - - - - 69,291 - -
Miscellaneous expenses payable 100,594 41,765 18,414 6,587 13,562 3,659 8,257 8,350
757,931 185,770 130,077 27,655 92,430 276,742 19,715 25,542
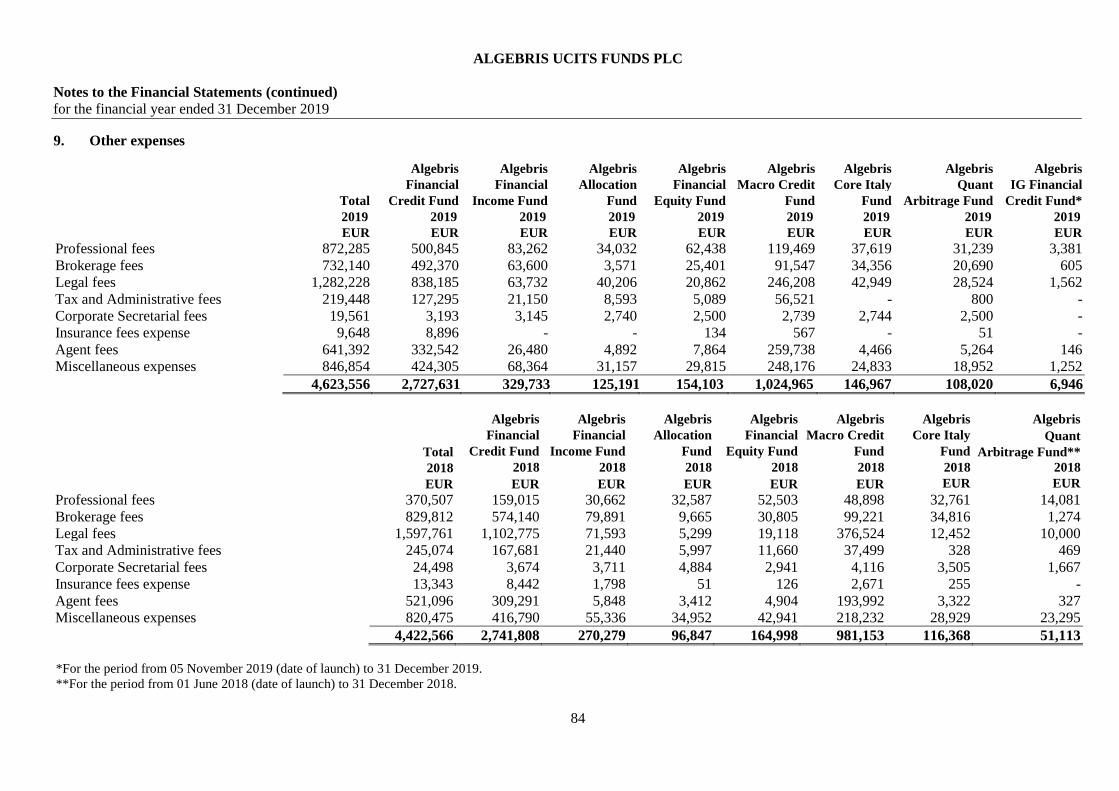
ALGEBRIS UCITS FUNDS PLC
Notes to the Financial Statements (continued)
for the financial year ended 31 December 2019
84
9. Other expenses
Algebris Algebris Algebris Algebris Algebris Algebris Algebris Algebris
Financial Financial Allocation Financial Macro Credit Core Italy Quant IG Financial
Total Credit Fund Income Fund Fund Equity Fund Fund Fund Arbitrage Fund Credit Fund*
2019 2019 2019 2019 2019 2019 2019 2019 2019 EUR EUR EUR EUR EUR EUR EUR EUR EUR
Professional fees 872,285 500,845 83,262 34,032 62,438 119,469 37,619 31,239 3,381
Brokerage fees 732,140 492,370 63,600 3,571 25,401 91,547 34,356 20,690 605
Legal fees 1,282,228 838,185 63,732 40,206 20,862 246,208 42,949 28,524 1,562
Tax and Administrative fees 219,448 127,295 21,150 8,593 5,089 56,521 - 800 -
Corporate Secretarial fees 19,561 3,193 3,145 2,740 2,500 2,739 2,744 2,500 -
Insurance fees expense 9,648 8,896 - - 134 567 - 51 -
Agent fees 641,392 332,542 26,480 4,892 7,864 259,738 4,466 5,264 146
Miscellaneous expenses 846,854 424,305 68,364 31,157 29,815 248,176 24,833 18,952 1,252
4,623,556 2,727,631 329,733 125,191 154,103 1,024,965 146,967 108,020 6,946
Algebris Algebris Algebris Algebris Algebris Algebris Algebris
Financial Financial Allocation Financial Macro Credit Core Italy Quant
Total Credit Fund Income Fund Fund Equity Fund Fund Fund Arbitrage Fund**
2018 2018 2018 2018 2018 2018 2018 2018
EUR EUR EUR EUR EUR EUR EUR EUR
Professional fees 370,507 159,015 30,662 32,587 52,503 48,898 32,761 14,081
Brokerage fees 829,812 574,140 79,891 9,665 30,805 99,221 34,816 1,274
Legal fees 1,597,761 1,102,775 71,593 5,299 19,118 376,524 12,452 10,000
Tax and Administrative fees 245,074 167,681 21,440 5,997 11,660 37,499 328 469
Corporate Secretarial fees 24,498 3,674 3,711 4,884 2,941 4,116 3,505 1,667
Insurance fees expense 13,343 8,442 1,798 51 126 2,671 255 -
Agent fees 521,096 309,291 5,848 3,412 4,904 193,992 3,322 327
Miscellaneous expenses 820,475 416,790 55,336 34,952 42,941 218,232 28,929 23,295
4,422,566 2,741,808 270,279 96,847 164,998 981,153 116,368 51,113
*For the period from 05 November 2019 (date of launch) to 31 December 2019.
**For the period from 01 June 2018 (date of launch) to 31 December 2018.

ALGEBRIS UCITS FUNDS PLC
Notes to the Financial Statements (continued)
for the financial year ended 31 December 2019
85
10. Share capital and redeemable participating shares
The maximum authorized share capital is five hundred billion shares of no par value. The Company has issued
Subscriber Shares to the value of EUR 300,000. The Subscriber Shares do not participate in the assets of the Sub-
Funds. The Company reserves the right to redeem some or all of the Subscriber Shares provided that the Company at
all times has a minimum issued share capital to the value of EUR 300,000.
The movement in the number of redeemable participating shares for the financial year ended 31 December 2019 is as
follows:
Algebris Financial Credit Fund
At the beginning of
the financial year
Shares
Issued
Shares
Redeemed
Shares Switched/
Transferred
At the end of the
financial year CHF Class I Shares 172,568 38,291 (144,883) - 65,976
CHF Class Id Shares - 500 - - 500
CHF Class R Shares 41,355 39,848 (18,282) - 62,921
CHF Class Rd Shares 17,975 23,095 (265) - 40,805
CHF Class Z Shares 262,087 85,077 (26,888) - 320,276
EUR Class Cd Shares - 2,500 - - 2,500
EUR Class I Shares 9,641,538 4,945,186 (6,254,130) 10,565 8,343,159
EUR Class Id Shares 4,507,411 2,978,699 (441,319) 1,978 7,046,769
EUR Class M Shares 45,778 22,871 (17,961) - 50,688
EUR Class Md Shares 2,188 5,262 (1,418) - 6,032
EUR Class R Shares 4,014,442 1,613,721 (1,369,336) 7,926 4,266,753
EUR Class Rd Shares 5,408,292 2,463,405 (1,298,856) (20,646) 6,552,195
EUR Class W Shares 239,469 23,119 (99,258) 363 163,693
EUR Class Wd Shares 445,686 79,956 (113,761) - 411,881
EUR Class XXLD Shares 715,357 - - - 715,357
EUR Class Z Shares 1,295,712 316,362 (504,654) (1,138) 1,106,282
EUR Class Zd Shares - 50,100 (100) - 50,000
GBP Class I Shares 49,399 41,414 (24,330) - 66,483
GBP Class Id Shares 2,966,314 814,658 (1,017,389) - 2,763,583
GBP Class M Shares 1,090 167 (358) (22) 877
GBP Class Md Shares 14,000 150 - 28 14,178
GBP Class R Shares 35,739 36,552 (18,755) (221) 53,315
GBP Class Rd Shares 112,988 84,317 (41,554) (297) 155,454
GBP Class W Shares 3,004 - - - 3,004
GBP Class Wd Shares 24,631 4,010 (1,012) - 27,629
GBP Class Z Shares 97,192 19,711 (13,898) (11,343) 91,662
GBP Class Zd Shares 114,542 68,602 (31,305) 12,796 164,635
HKD Class I Shares - 90 - - 90
HKD Class R Shares - 90 - - 90
JPY Class I Shares 5,700 - - - 5,700
SGD Class I Shares 1,016 2,460 - - 3,476
SGD Class Id Shares - 3,409 - (2,409) 1,000
SGD Class R Shares 25,824 9,355 (10,581) - 24,598
SGD Class Rd Shares 60,714 17,654 (29,809) - 48,559
SGD Class Wd Shares 4,449 30,110 - - 34,559
USD Class A Shares - 10 - - 10
USD Class C Shares - 1,500 - - 1,500
USD Class I Shares 854,488 325,187 (573,647) (10,121) 595,907
USD Class I2D Shares - 10 - - 10 USD Class Id Shares 800,076 474,740 (374,730 ) 8,006 908,092
USD Class M Shares 417 1,300 (221) - 1,496
USD Class Md Shares 29,016 4,595 (28,197) - 5,414
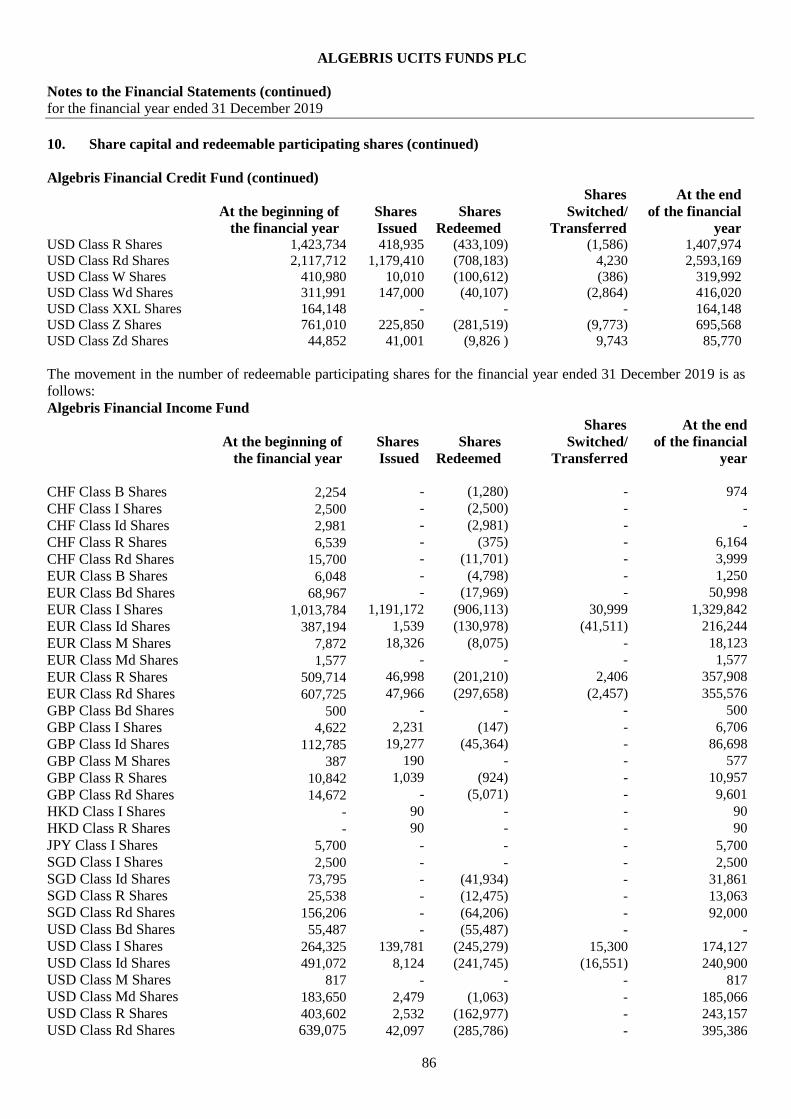
ALGEBRIS UCITS FUNDS PLC
Notes to the Financial Statements (continued)
for the financial year ended 31 December 2019
86
10. Share capital and redeemable participating shares (continued)
Algebris Financial Credit Fund (continued)
At the beginning of
the financial year
Shares
Issued
Shares
Redeemed
Shares
Switched/
Transferred
At the end
of the financial
year
USD Class R Shares 1,423,734 418,935 (433,109) (1,586) 1,407,974
USD Class Rd Shares 2,117,712 1,179,410 (708,183) 4,230 2,593,169
USD Class W Shares 410,980 10,010 (100,612) (386) 319,992
USD Class Wd Shares 311,991 147,000 (40,107) (2,864) 416,020
USD Class XXL Shares 164,148 - - - 164,148
USD Class Z Shares 761,010 225,850 (281,519) (9,773) 695,568
USD Class Zd Shares 44,852 41,001 (9,826 ) 9,743 85,770
The movement in the number of redeemable participating shares for the financial year ended 31 December 2019 is as
follows:
Algebris Financial Income Fund
At the beginning of
the financial year
Shares
Issued
Shares
Redeemed
Shares
Switched/
Transferred
At the end
of the financial
year
CHF Class B Shares 2,254 - (1,280) - 974
CHF Class I Shares 2,500 - (2,500) - -
CHF Class Id Shares 2,981 - (2,981) - -
CHF Class R Shares 6,539 - (375) - 6,164
CHF Class Rd Shares 15,700 - (11,701) - 3,999
EUR Class B Shares 6,048 - (4,798) - 1,250
EUR Class Bd Shares 68,967 - (17,969) - 50,998
EUR Class I Shares 1,013,784 1,191,172 (906,113) 30,999 1,329,842
EUR Class Id Shares 387,194 1,539 (130,978) (41,511) 216,244
EUR Class M Shares 7,872 18,326 (8,075) - 18,123
EUR Class Md Shares 1,577 - - - 1,577
EUR Class R Shares 509,714 46,998 (201,210) 2,406 357,908
EUR Class Rd Shares 607,725 47,966 (297,658) (2,457) 355,576
GBP Class Bd Shares 500 - - - 500
GBP Class I Shares 4,622 2,231 (147) - 6,706
GBP Class Id Shares 112,785 19,277 (45,364) - 86,698
GBP Class M Shares 387 190 - - 577
GBP Class R Shares 10,842 1,039 (924) - 10,957
GBP Class Rd Shares 14,672 - (5,071) - 9,601
HKD Class I Shares - 90 - - 90
HKD Class R Shares - 90 - - 90
JPY Class I Shares 5,700 - - - 5,700
SGD Class I Shares 2,500 - - - 2,500
SGD Class Id Shares 73,795 - (41,934) - 31,861
SGD Class R Shares 25,538 - (12,475) - 13,063
SGD Class Rd Shares 156,206 - (64,206) - 92,000
USD Class Bd Shares 55,487 - (55,487) - -
USD Class I Shares 264,325 139,781 (245,279) 15,300 174,127
USD Class Id Shares 491,072 8,124 (241,745) (16,551) 240,900
USD Class M Shares 817 - - - 817
USD Class Md Shares 183,650 2,479 (1,063) - 185,066
USD Class R Shares 403,602 2,532 (162,977) - 243,157
USD Class Rd Shares 639,075 42,097 (285,786) - 395,386
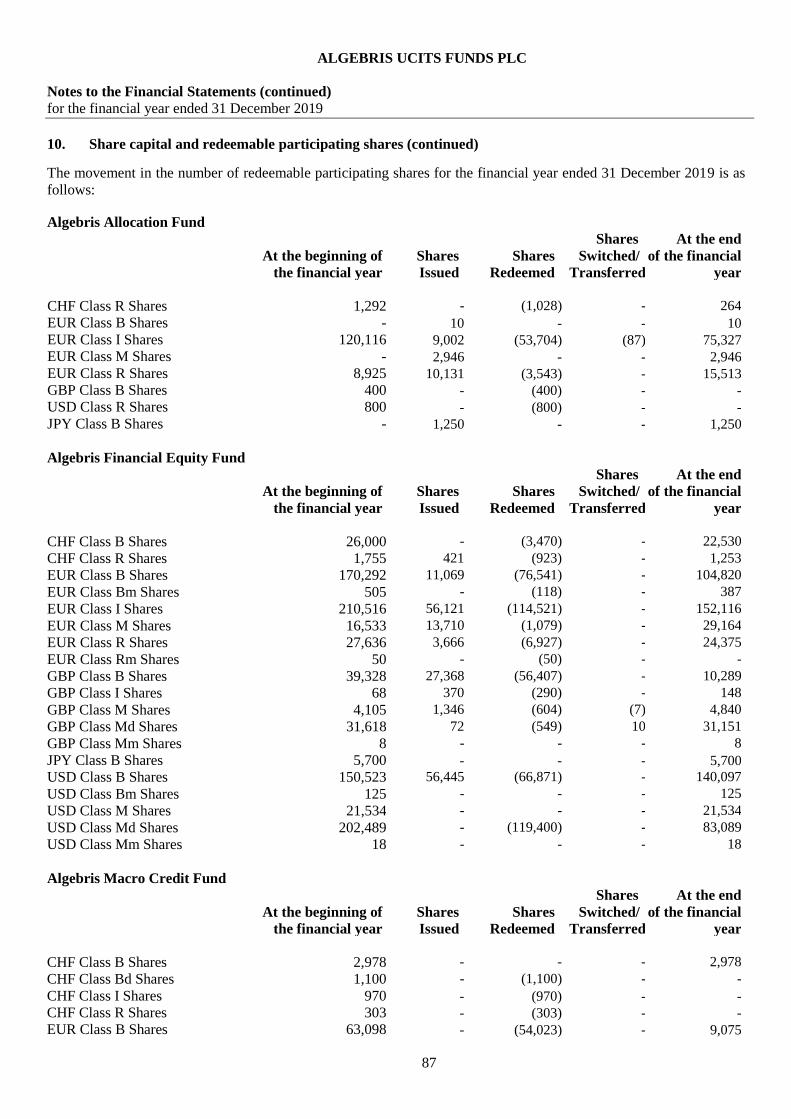
ALGEBRIS UCITS FUNDS PLC
Notes to the Financial Statements (continued)
for the financial year ended 31 December 2019
87
10. Share capital and redeemable participating shares (continued)
The movement in the number of redeemable participating shares for the financial year ended 31 December 2019 is as
follows:
Algebris Allocation Fund
At the beginning of
the financial year
Shares
Issued
Shares
Redeemed
Shares
Switched/
Transferred
At the end
of the financial
year
CHF Class R Shares 1,292 - (1,028) - 264
EUR Class B Shares - 10 - - 10
EUR Class I Shares 120,116 9,002 (53,704) (87) 75,327
EUR Class M Shares - 2,946 - - 2,946
EUR Class R Shares 8,925 10,131 (3,543) - 15,513
GBP Class B Shares 400 - (400) - -
USD Class R Shares 800 - (800) - -
JPY Class B Shares - 1,250 - - 1,250
Algebris Financial Equity Fund
At the beginning of
the financial year
Shares
Issued
Shares
Redeemed
Shares
Switched/
Transferred
At the end
of the financial
year
CHF Class B Shares 26,000 - (3,470) - 22,530
CHF Class R Shares 1,755 421 (923) - 1,253
EUR Class B Shares 170,292 11,069 (76,541) - 104,820
EUR Class Bm Shares 505 - (118) - 387
EUR Class I Shares 210,516 56,121 (114,521) - 152,116
EUR Class M Shares 16,533 13,710 (1,079) - 29,164
EUR Class R Shares 27,636 3,666 (6,927) - 24,375
EUR Class Rm Shares 50 - (50) - -
GBP Class B Shares 39,328 27,368 (56,407) - 10,289
GBP Class I Shares 68 370 (290) - 148
GBP Class M Shares 4,105 1,346 (604) (7) 4,840
GBP Class Md Shares 31,618 72 (549) 10 31,151
GBP Class Mm Shares 8 - - - 8
JPY Class B Shares 5,700 - - - 5,700
USD Class B Shares 150,523 56,445 (66,871) - 140,097
USD Class Bm Shares 125 - - - 125
USD Class M Shares 21,534 - - - 21,534
USD Class Md Shares 202,489 - (119,400) - 83,089
USD Class Mm Shares 18 - - - 18
Algebris Macro Credit Fund
At the beginning of
the financial year
Shares
Issued
Shares
Redeemed
Shares
Switched/
Transferred
At the end
of the financial
year
CHF Class B Shares 2,978 - - - 2,978
CHF Class Bd Shares 1,100 - (1,100) - -
CHF Class I Shares 970 - (970) - -
CHF Class R Shares 303 - (303) - -
EUR Class B Shares 63,098 - (54,023) - 9,075
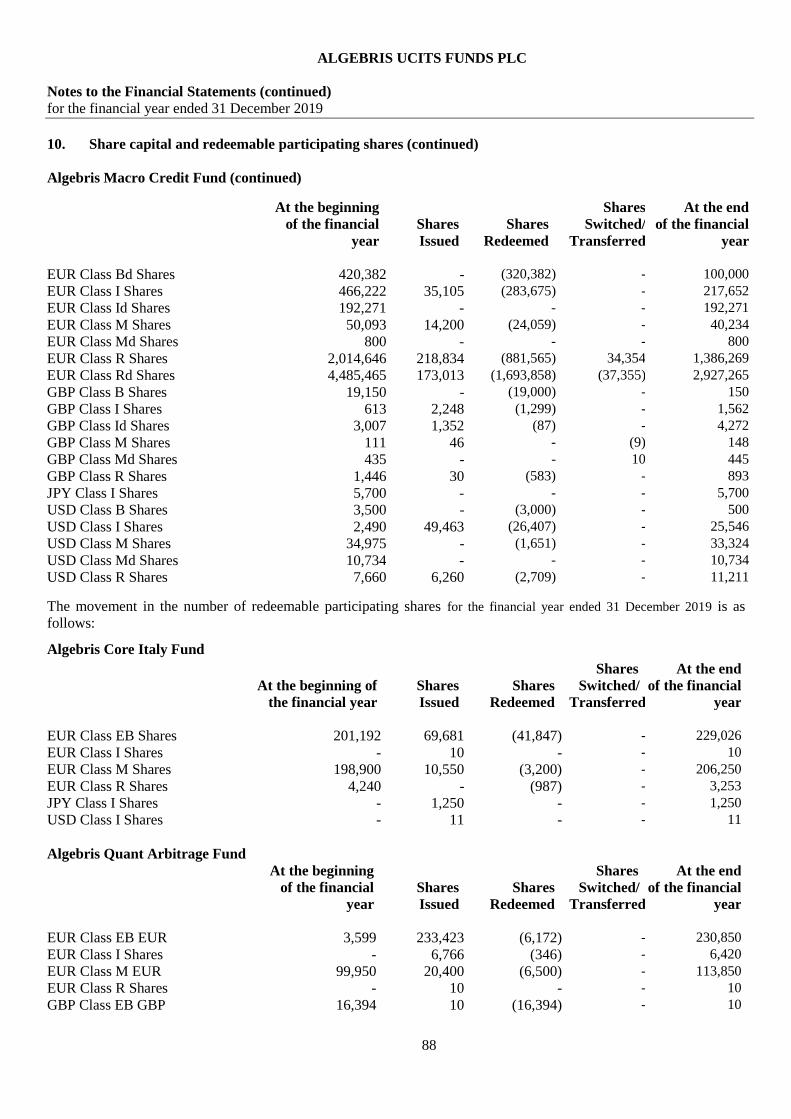
ALGEBRIS UCITS FUNDS PLC
Notes to the Financial Statements (continued)
for the financial year ended 31 December 2019
88
10. Share capital and redeemable participating shares (continued)
Algebris Macro Credit Fund (continued)
At the beginning
of the financial
year
Shares
Issued
Shares
Redeemed
Shares
Switched/
Transferred
At the end
of the financial
year
EUR Class Bd Shares 420,382 - (320,382) - 100,000
EUR Class I Shares 466,222 35,105 (283,675) - 217,652
EUR Class Id Shares 192,271 - - - 192,271
EUR Class M Shares 50,093 14,200 (24,059) - 40,234
EUR Class Md Shares 800 - - - 800
EUR Class R Shares 2,014,646 218,834 (881,565) 34,354 1,386,269
EUR Class Rd Shares 4,485,465 173,013 (1,693,858) (37,355) 2,927,265
GBP Class B Shares 19,150 - (19,000) - 150
GBP Class I Shares 613 2,248 (1,299) - 1,562
GBP Class Id Shares 3,007 1,352 (87) - 4,272
GBP Class M Shares 111 46 - (9) 148
GBP Class Md Shares 435 - - 10 445
GBP Class R Shares 1,446 30 (583) - 893
JPY Class I Shares 5,700 - - - 5,700
USD Class B Shares 3,500 - (3,000) - 500
USD Class I Shares 2,490 49,463 (26,407) - 25,546
USD Class M Shares 34,975 - (1,651) - 33,324
USD Class Md Shares 10,734 - - - 10,734
USD Class R Shares 7,660 6,260 (2,709) - 11,211
The movement in the number of redeemable participating shares for the financial year ended 31 December 2019 is as
follows:
Algebris Core Italy Fund
At the beginning of
the financial year
Shares
Issued
Shares
Redeemed
Shares
Switched/
Transferred
At the end
of the financial
year
EUR Class EB Shares 201,192 69,681 (41,847) - 229,026
EUR Class I Shares - 10 - - 10
EUR Class M Shares 198,900 10,550 (3,200) - 206,250
EUR Class R Shares 4,240 - (987) - 3,253
JPY Class I Shares - 1,250 - - 1,250
USD Class I Shares - 11 - - 11
Algebris Quant Arbitrage Fund
At the beginning
of the financial
year
Shares
Issued
Shares
Redeemed
Shares
Switched/
Transferred
At the end
of the financial
year
EUR Class EB EUR 3,599 233,423 (6,172) - 230,850
EUR Class I Shares - 6,766 (346) - 6,420
EUR Class M EUR 99,950 20,400 (6,500) - 113,850
EUR Class R Shares - 10 - - 10
GBP Class EB GBP 16,394 10 (16,394) - 10
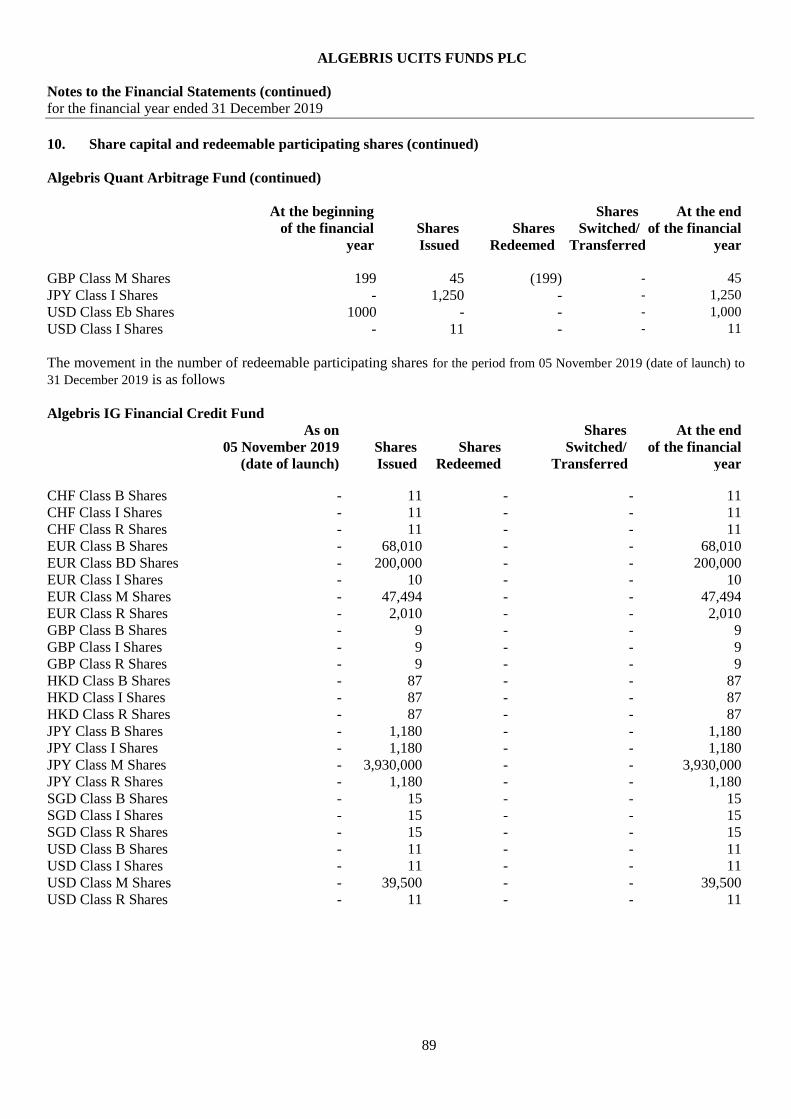
ALGEBRIS UCITS FUNDS PLC
Notes to the Financial Statements (continued)
for the financial year ended 31 December 2019
89
10. Share capital and redeemable participating shares (continued)
Algebris Quant Arbitrage Fund (continued)
At the beginning
of the financial
year
Shares
Issued
Shares
Redeemed
Shares
Switched/
Transferred
At the end
of the financial
year
GBP Class M Shares 199 45 (199) - 45
JPY Class I Shares - 1,250 - - 1,250
USD Class Eb Shares 1000 - - - 1,000
USD Class I Shares - 11 - - 11
The movement in the number of redeemable participating shares for the period from 05 November 2019 (date of launch) to
31 December 2019 is as follows
Algebris IG Financial Credit Fund
As on
05 November 2019
(date of launch)
Shares
Issued
Shares
Redeemed
Shares
Switched/
Transferred
At the end
of the financial
year CHF Class B Shares - 11 - - 11
CHF Class I Shares - 11 - - 11
CHF Class R Shares - 11 - - 11
EUR Class B Shares - 68,010 - - 68,010
EUR Class BD Shares - 200,000 - - 200,000
EUR Class I Shares - 10 - - 10
EUR Class M Shares - 47,494 - - 47,494
EUR Class R Shares - 2,010 - - 2,010
GBP Class B Shares - 9 - - 9
GBP Class I Shares - 9 - - 9
GBP Class R Shares - 9 - - 9
HKD Class B Shares - 87 - - 87
HKD Class I Shares - 87 - - 87
HKD Class R Shares - 87 - - 87
JPY Class B Shares - 1,180 - - 1,180
JPY Class I Shares - 1,180 - - 1,180
JPY Class M Shares - 3,930,000 - - 3,930,000
JPY Class R Shares - 1,180 - - 1,180
SGD Class B Shares - 15 - - 15
SGD Class I Shares - 15 - - 15
SGD Class R Shares - 15 - - 15
USD Class B Shares - 11 - - 11
USD Class I Shares - 11 - - 11
USD Class M Shares - 39,500 - - 39,500
USD Class R Shares - 11 - - 11
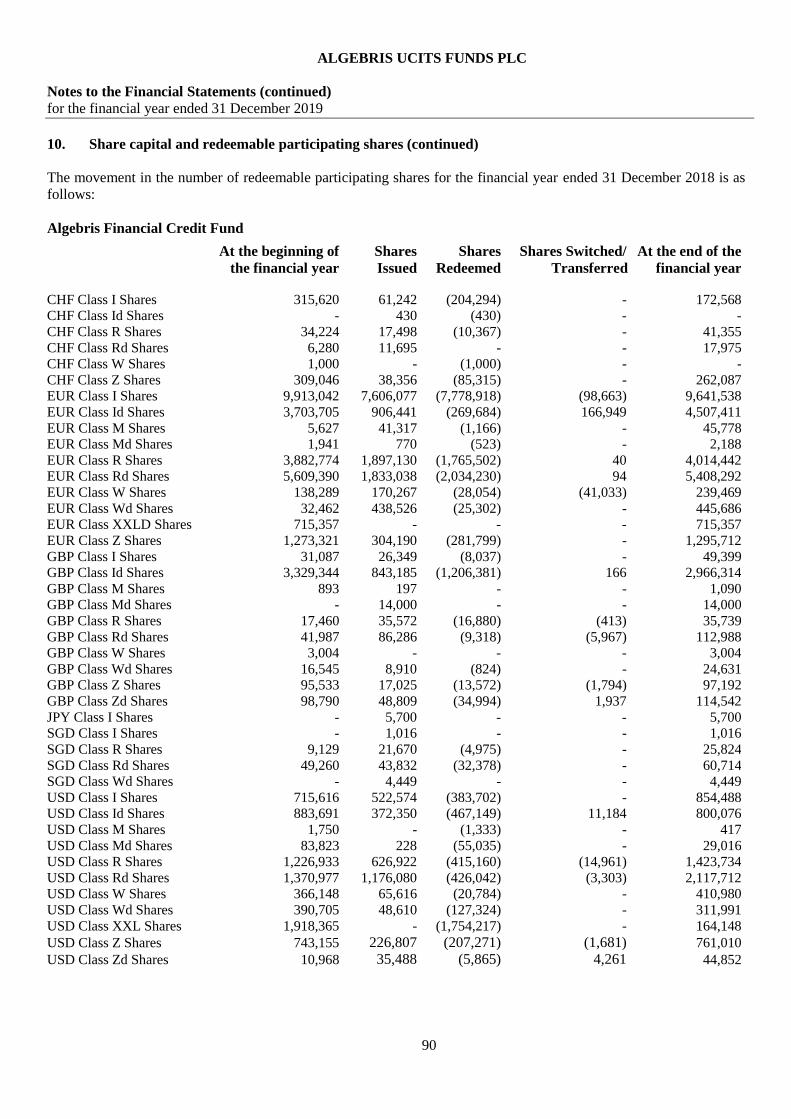
ALGEBRIS UCITS FUNDS PLC
Notes to the Financial Statements (continued)
for the financial year ended 31 December 2019
90
10. Share capital and redeemable participating shares (continued)
The movement in the number of redeemable participating shares for the financial year ended 31 December 2018 is as
follows:
Algebris Financial Credit Fund
At the beginning of
the financial year
Shares
Issued
Shares
Redeemed
Shares Switched/
Transferred
At the end of the
financial year CHF Class I Shares 315,620 61,242 (204,294) - 172,568
CHF Class Id Shares - 430 (430) - -
CHF Class R Shares 34,224 17,498 (10,367) - 41,355
CHF Class Rd Shares 6,280 11,695 - - 17,975
CHF Class W Shares 1,000 - (1,000) - -
CHF Class Z Shares 309,046 38,356 (85,315) - 262,087
EUR Class I Shares 9,913,042 7,606,077 (7,778,918) (98,663) 9,641,538
EUR Class Id Shares 3,703,705 906,441 (269,684) 166,949 4,507,411
EUR Class M Shares 5,627 41,317 (1,166) - 45,778
EUR Class Md Shares 1,941 770 (523) - 2,188
EUR Class R Shares 3,882,774 1,897,130 (1,765,502) 40 4,014,442
EUR Class Rd Shares 5,609,390 1,833,038 (2,034,230) 94 5,408,292
EUR Class W Shares 138,289 170,267 (28,054) (41,033) 239,469
EUR Class Wd Shares 32,462 438,526 (25,302) - 445,686
EUR Class XXLD Shares 715,357 - - - 715,357
EUR Class Z Shares 1,273,321 304,190 (281,799) - 1,295,712
GBP Class I Shares 31,087 26,349 (8,037) - 49,399
GBP Class Id Shares 3,329,344 843,185 (1,206,381) 166 2,966,314
GBP Class M Shares 893 197 - - 1,090
GBP Class Md Shares - 14,000 - - 14,000
GBP Class R Shares 17,460 35,572 (16,880) (413) 35,739
GBP Class Rd Shares 41,987 86,286 (9,318) (5,967) 112,988
GBP Class W Shares 3,004 - - - 3,004
GBP Class Wd Shares 16,545 8,910 (824) - 24,631
GBP Class Z Shares 95,533 17,025 (13,572) (1,794) 97,192
GBP Class Zd Shares 98,790 48,809 (34,994) 1,937 114,542
JPY Class I Shares - 5,700 - - 5,700
SGD Class I Shares - 1,016 - - 1,016
SGD Class R Shares 9,129 21,670 (4,975) - 25,824
SGD Class Rd Shares 49,260 43,832 (32,378) - 60,714
SGD Class Wd Shares - 4,449 - - 4,449
USD Class I Shares 715,616 522,574 (383,702) - 854,488
USD Class Id Shares 883,691 372,350 (467,149) 11,184 800,076
USD Class M Shares 1,750 - (1,333) - 417
USD Class Md Shares 83,823 228 (55,035) - 29,016
USD Class R Shares 1,226,933 626,922 (415,160) (14,961) 1,423,734
USD Class Rd Shares 1,370,977 1,176,080 (426,042) (3,303) 2,117,712
USD Class W Shares 366,148 65,616 (20,784) - 410,980
USD Class Wd Shares 390,705 48,610 (127,324) - 311,991
USD Class XXL Shares 1,918,365 - (1,754,217) - 164,148
USD Class Z Shares 743,155 226,807 (207,271) (1,681) 761,010
USD Class Zd Shares 10,968 35,488 (5,865) 4,261 44,852

ALGEBRIS UCITS FUNDS PLC
Notes to the Financial Statements (continued)
for the financial year ended 31 December 2019
91
10. Share capital and redeemable participating shares (continued)
The movement in the number of redeemable participating shares for the financial year ended 31 December 2018 is as
follows:
Algebris Financial Income Fund
At the beginning of
the financial year
Shares
Issued
Shares
Redeemed
Shares
Switched/
Transferred
At the end
of the financial
year
CHF Class B Shares 2,874 1,280 (400) (1,500) 2,254
CHF Class I Shares - 2,500 - - 2,500
CHF Class Id Shares - - - 2,981 2,981
CHF Class R Shares 2,750 5,058 (1,269) - 6,539
CHF Class Rd Shares - 21,808 (3,038) (3,070) 15,700
EUR Class B Shares 45,389 7,590 (48,181) 1,250 6,048
EUR Class Bd Shares 99,115 50,000 (80,148) - 68,967
EUR Class I Shares 616,173 1,193,450 (795,837) (2) 1,013,784
EUR Class Id Shares 159,320 546,119 (328,516) 10,271 387,194
EUR Class M Shares 7,121 1,461 (1,380) 670 7,872
EUR Class Md Shares 2,601 1,577 (2,601) - 1,577
EUR Class R Shares 188,243 472,341 (143,887) (6,983) 509,714
EUR Class Rd Shares 20,020 673,339 (88,424) 2,790 607,725
GBP Class Bd Shares 500 - - - 500
GBP Class I Shares - 4,622 - - 4,622
GBP Class Id Shares 145,317 22,142 (59,905) 5,231 112,785
GBP Class M Shares 183 204 - - 387
GBP Class R Shares 404 10,438 - - 10,842
GBP Class Rd Shares - 14,672 - - 14,672
JPY Class I Shares - 5,700 - - 5,700
SGD Class I Shares - 2,500 - - 2,500
SGD Class Id Shares 10,442 89,189 (31,647) 5,811 73,795
SGD Class R Shares - 25,538 - - 25,538
SGD Class Rd Shares - 185,747 (26,118) (3,423) 156,206
USD Class Bd Shares 55,487 - - - 55,487
USD Class I Shares 32,269 307,787 (75,239) (492) 264,325
USD Class Id Shares 108,800 622,569 (246,870) 6,573 491,072
USD Class M Shares 5,684 - (1,426) (3,441) 817
USD Class Md Shares 183,625 1,064 (1,039) - 183,650
USD Class R Shares 36,721 449,594 (80,538) (2,175) 403,602
USD Class Rd Shares - 933,426 (284,973) (9,378) 639,075
Algebris Allocation Fund
At the beginning of
the financial year
Shares
Issued
Shares
Redeemed
Shares
Switched/
Transferred
At the end
of the financial
year
CHF Class R Shares 264 1,241 (213) - 1,292
EUR Class I Shares 83,776 56,734 (20,394) - 120,116
EUR Class R Shares 2,402 8,037 (1,514) - 8,925
GBP Class B Shares 400 - - - 400
USD Class R Shares 800 - - - 800
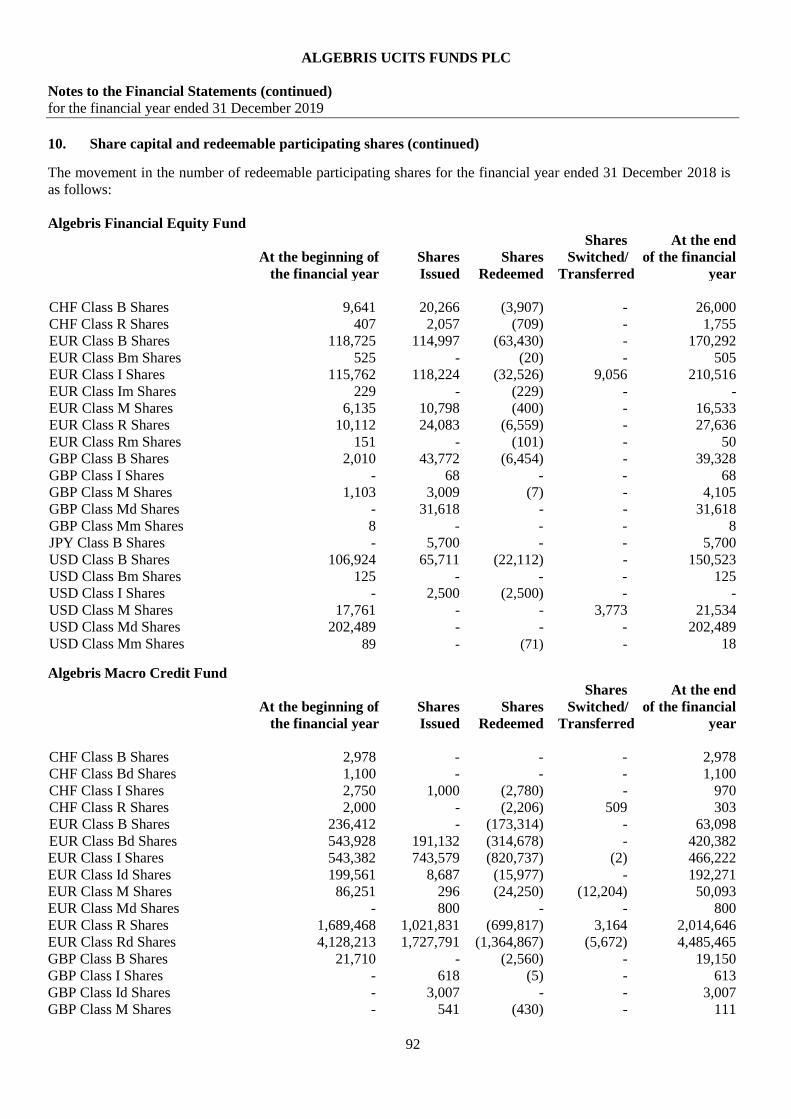
ALGEBRIS UCITS FUNDS PLC
Notes to the Financial Statements (continued)
for the financial year ended 31 December 2019
92
10. Share capital and redeemable participating shares (continued)
The movement in the number of redeemable participating shares for the financial year ended 31 December 2018 is
as follows:
Algebris Financial Equity Fund
At the beginning of
the financial year
Shares
Issued
Shares
Redeemed
Shares
Switched/
Transferred
At the end
of the financial
year
CHF Class B Shares 9,641 20,266 (3,907) - 26,000
CHF Class R Shares 407 2,057 (709) - 1,755
EUR Class B Shares 118,725 114,997 (63,430) - 170,292
EUR Class Bm Shares 525 - (20) - 505
EUR Class I Shares 115,762 118,224 (32,526) 9,056 210,516
EUR Class Im Shares 229 - (229) - -
EUR Class M Shares 6,135 10,798 (400) - 16,533
EUR Class R Shares 10,112 24,083 (6,559) - 27,636
EUR Class Rm Shares 151 - (101) - 50
GBP Class B Shares 2,010 43,772 (6,454) - 39,328
GBP Class I Shares - 68 - - 68
GBP Class M Shares 1,103 3,009 (7) - 4,105
GBP Class Md Shares - 31,618 - - 31,618
GBP Class Mm Shares 8 - - - 8
JPY Class B Shares - 5,700 - - 5,700
USD Class B Shares 106,924 65,711 (22,112) - 150,523
USD Class Bm Shares 125 - - - 125
USD Class I Shares - 2,500 (2,500) - -
USD Class M Shares 17,761 - - 3,773 21,534
USD Class Md Shares 202,489 - - - 202,489
USD Class Mm Shares 89 - (71) - 18
Algebris Macro Credit Fund
At the beginning of
the financial year
Shares
Issued
Shares
Redeemed
Shares
Switched/
Transferred
At the end
of the financial
year
CHF Class B Shares 2,978 - - - 2,978
CHF Class Bd Shares 1,100 - - - 1,100
CHF Class I Shares 2,750 1,000 (2,780) - 970
CHF Class R Shares 2,000 - (2,206) 509 303
EUR Class B Shares 236,412 - (173,314) - 63,098
EUR Class Bd Shares 543,928 191,132 (314,678) - 420,382
EUR Class I Shares 543,382 743,579 (820,737) (2) 466,222
EUR Class Id Shares 199,561 8,687 (15,977) - 192,271
EUR Class M Shares 86,251 296 (24,250) (12,204) 50,093
EUR Class Md Shares - 800 - - 800
EUR Class R Shares 1,689,468 1,021,831 (699,817) 3,164 2,014,646
EUR Class Rd Shares 4,128,213 1,727,791 (1,364,867) (5,672) 4,485,465
GBP Class B Shares 21,710 - (2,560) - 19,150
GBP Class I Shares - 618 (5) - 613
GBP Class Id Shares - 3,007 - - 3,007
GBP Class M Shares - 541 (430) - 111

ALGEBRIS UCITS FUNDS PLC
Notes to the Financial Statements (continued)
for the financial year ended 31 December 2019
93
10. Share capital and redeemable participating shares (continued)
The movement in the number of redeemable participating shares for the financial year ended 31 December 2018 is as
follows:
Algebris Macro Credit Fund (continued)
At the beginning
of the financial
year
Shares
Issued
Shares
Redeemed
Shares
Switched/
Transferred
At the end
of the financial
year
GBP Class Md Shares 609 435 (409) (200) 435
GBP Class R Shares 84 1,363 (1) - 1,446
JPY Class I Shares - 5,700 - - 5,700
USD Class B Shares 8,533 - (5,033) - 3,500
USD Class I Shares - 109,157 (106,667) - 2,490
USD Class M Shares 780 - (780) 34,975 34,975
USD Class Md Shares 24,067 9,579 - (22,912) 10,734
USD Class R Shares 5,033 2,547 (1,954) 2,034 7,660
Algebris Core Italy Fund
At the beginning of
the financial year
Shares
Issued
Shares
Redeemed
Shares
Switched/
Transferred
At the end
of the
financial year
EUR Class EB Shares 72,091 146,851 (17,750) - 201,192
EUR Class M Shares 198,900 - - - 198,900
EUR Class R Shares 1,023 3,217 - - 4,240
The movement in the number of redeemable participating shares for the period from 1 June 2018 (date of launch) to
31 December 2018 is as follows
Algebris Quant Arbitrage Fund
As on
01 June 2018
(date of launch)
Shares
Issued
Shares
Redeemed
Shares
Switched/
Transferred
At the end
of the financial
year
EUR Class EB EUR - 3,599 - - 3,599
EUR Class M EUR - 199,900 (99,950) - 99,950
GBP Class EB GBP - 41,910 (25,516) - 16,394
GBP Class M GBP - 7,586 (7,586) 199 199
USD Class EB USD - 51,000 (50,000) - 1,000
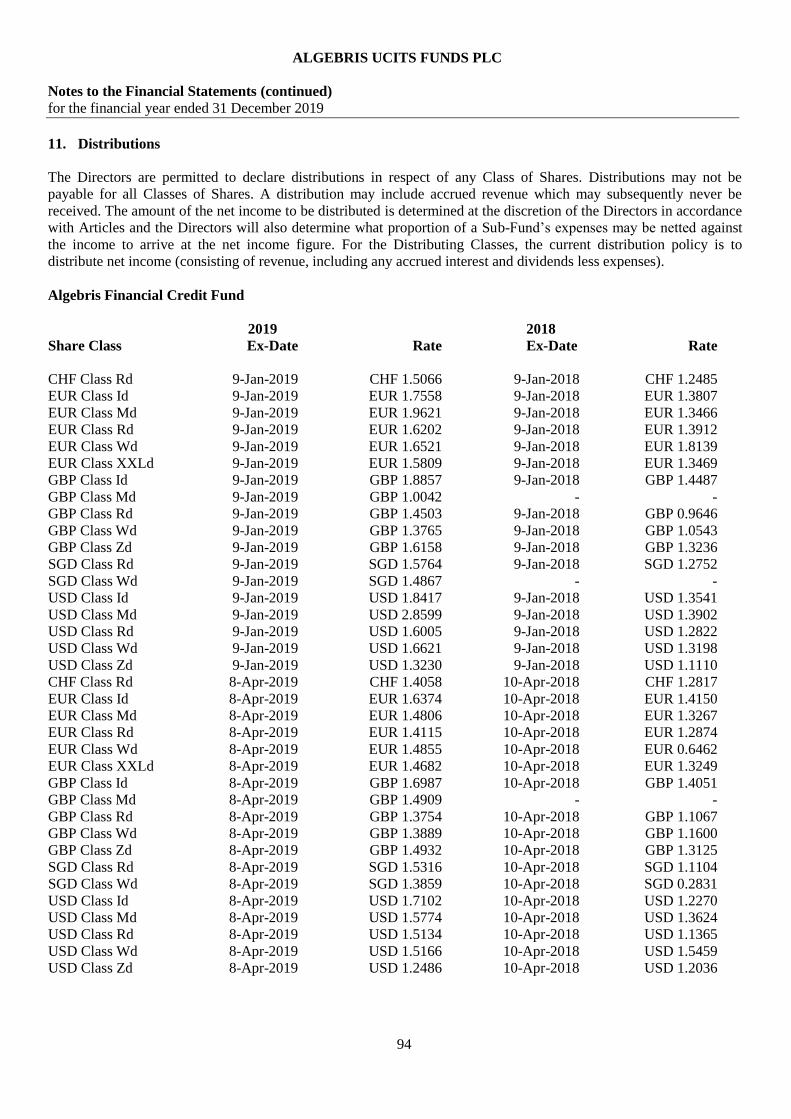
ALGEBRIS UCITS FUNDS PLC
Notes to the Financial Statements (continued)
for the financial year ended 31 December 2019
94
11. Distributions
The Directors are permitted to declare distributions in respect of any Class of Shares. Distributions may not be
payable for all Classes of Shares. A distribution may include accrued revenue which may subsequently never be
received. The amount of the net income to be distributed is determined at the discretion of the Directors in accordance
with Articles and the Directors will also determine what proportion of a Sub-Fund’s expenses may be netted against
the income to arrive at the net income figure. For the Distributing Classes, the current distribution policy is to
distribute net income (consisting of revenue, including any accrued interest and dividends less expenses).
Algebris Financial Credit Fund
2019 2018
Share Class Ex-Date Rate Ex-Date Rate
CHF Class Rd 9-Jan-2019 CHF 1.5066 9-Jan-2018 CHF 1.2485
EUR Class Id 9-Jan-2019 EUR 1.7558 9-Jan-2018 EUR 1.3807
EUR Class Md 9-Jan-2019 EUR 1.9621 9-Jan-2018 EUR 1.3466
EUR Class Rd 9-Jan-2019 EUR 1.6202 9-Jan-2018 EUR 1.3912
EUR Class Wd 9-Jan-2019 EUR 1.6521 9-Jan-2018 EUR 1.8139
EUR Class XXLd 9-Jan-2019 EUR 1.5809 9-Jan-2018 EUR 1.3469
GBP Class Id 9-Jan-2019 GBP 1.8857 9-Jan-2018 GBP 1.4487
GBP Class Md 9-Jan-2019 GBP 1.0042 - -
GBP Class Rd 9-Jan-2019 GBP 1.4503 9-Jan-2018 GBP 0.9646
GBP Class Wd 9-Jan-2019 GBP 1.3765 9-Jan-2018 GBP 1.0543
GBP Class Zd 9-Jan-2019 GBP 1.6158 9-Jan-2018 GBP 1.3236
SGD Class Rd 9-Jan-2019 SGD 1.5764 9-Jan-2018 SGD 1.2752
SGD Class Wd 9-Jan-2019 SGD 1.4867 - -
USD Class Id 9-Jan-2019 USD 1.8417 9-Jan-2018 USD 1.3541
USD Class Md 9-Jan-2019 USD 2.8599 9-Jan-2018 USD 1.3902
USD Class Rd 9-Jan-2019 USD 1.6005 9-Jan-2018 USD 1.2822
USD Class Wd 9-Jan-2019 USD 1.6621 9-Jan-2018 USD 1.3198
USD Class Zd 9-Jan-2019 USD 1.3230 9-Jan-2018 USD 1.1110
CHF Class Rd 8-Apr-2019 CHF 1.4058 10-Apr-2018 CHF 1.2817
EUR Class Id 8-Apr-2019 EUR 1.6374 10-Apr-2018 EUR 1.4150
EUR Class Md 8-Apr-2019 EUR 1.4806 10-Apr-2018 EUR 1.3267
EUR Class Rd 8-Apr-2019 EUR 1.4115 10-Apr-2018 EUR 1.2874
EUR Class Wd 8-Apr-2019 EUR 1.4855 10-Apr-2018 EUR 0.6462
EUR Class XXLd 8-Apr-2019 EUR 1.4682 10-Apr-2018 EUR 1.3249
GBP Class Id 8-Apr-2019 GBP 1.6987 10-Apr-2018 GBP 1.4051
GBP Class Md 8-Apr-2019 GBP 1.4909 - -
GBP Class Rd 8-Apr-2019 GBP 1.3754 10-Apr-2018 GBP 1.1067
GBP Class Wd 8-Apr-2019 GBP 1.3889 10-Apr-2018 GBP 1.1600
GBP Class Zd 8-Apr-2019 GBP 1.4932 10-Apr-2018 GBP 1.3125
SGD Class Rd 8-Apr-2019 SGD 1.5316 10-Apr-2018 SGD 1.1104
SGD Class Wd 8-Apr-2019 SGD 1.3859 10-Apr-2018 SGD 0.2831
USD Class Id 8-Apr-2019 USD 1.7102 10-Apr-2018 USD 1.2270
USD Class Md 8-Apr-2019 USD 1.5774 10-Apr-2018 USD 1.3624
USD Class Rd 8-Apr-2019 USD 1.5134 10-Apr-2018 USD 1.1365
USD Class Wd 8-Apr-2019 USD 1.5166 10-Apr-2018 USD 1.5459
USD Class Zd 8-Apr-2019 USD 1.2486 10-Apr-2018 USD 1.2036

ALGEBRIS UCITS FUNDS PLC
Notes to the Financial Statements (continued)
for the financial year ended 31 December 2019
95
11. Distributions (continued)
Algebris Financial Credit Fund (continued)
2019 2018
Share Class Ex-Date Rate Ex-Date Rate
CHD Class Id - - 9-Jul-2018 CHF 0.7504
CHF Class Rd 8-Jul-2019 CHF 0.9906 9-Jul-2018 CHF 1.4057
EUR Class Id 8-Jul-2019 EUR 1.4697 9-Jul-2018 EUR 1.4742
EUR Class Md 8-Jul-2019 EUR 1.3550 9-Jul-2018 EUR 1.1548
EUR Class Rd 8-Jul-2019 EUR 1.3249 9-Jul-2018 EUR 1.5048
EUR Class Wd 8-Jul-2019 EUR 1.3248 9-Jul-2018 EUR 1.4768
EUR Class XXLd 8-Jul-2019 EUR 1.3455 9-Jul-2018 EUR 1.4610
GBP Class Id 8-Jul-2019 GBP 1.3855 9-Jul-2018 GBP 1.5891
GBP Class Md 8-Jul-2019 GBP 1.3856 - -
GBP Class Rd 8-Jul-2019 GBP 0.9980 9-Jul-2018 GBP 1.3442
GBP Class Wd 8-Jul-2019 GBP 1.3207 9-Jul-2018 GBP 1.4266
GBP Class Zd 8-Jul-2019 GBP 1.3281 9-Jul-2018 GBP 1.4494
SGD Class Id 8-Jul-2019 SGD 0.3266 - -
SGD Class Rd 8-Jul-2019 SGD 1.1972 9-Jul-2018 SGD 1.4523
SGD Class Wd 8-Jul-2019 SGD 0.2124 9-Jul-2018 SGD 1.3633
USD Class Id 8-Jul-2019 USD 1.1275 9-Jul-2018 USD 1.5740
USD Class Md 8-Jul-2019 USD 1.4298 9-Jul-2018 USD 1.5307
USD Class Rd 8-Jul-2019 USD 1.2598 9-Jul-2018 USD 1.3218
USD Class Wd 8-Jul-2019 USD 1.2869 9-Jul-2018 USD 1.3920
USD Class Zd 8-Jul-2019 USD 1.4326 9-Jul-2018 USD 1.4050
CHF Class Id 8-Oct-2019 CHF 0.7966 - -
CHF Class Rd 8-Oct-2019 CHF 1.2675 8-Oct-2018 CHF 1.1579
EUR Class Id 8-Oct-2019 EUR 1.4723 8-Oct-2018 EUR 1.6473
EUR Class Md 8-Oct-2019 EUR 1.3839 8-Oct-2018 EUR 1.4596
EUR Class Rd 8-Oct-2019 EUR 1.3439 8-Oct-2018 EUR 1.5177
EUR Class Wd 8-Oct-2019 EUR 1.4778 8-Oct-2018 EUR 1.4423
EUR Class XXLd 8-Oct-2019 EUR 1.3863 8-Oct-2018 EUR 1.4541
EUR Class Zd 8-Oct-2019 EUR 0.8856 - -
GBP Class Id 8-Oct-2019 GBP 1.4945 8-Oct-2018 GBP 1.5280
GBP Class Md 8-Oct-2019 GBP 1.4321 - -
GBP Class Rd 8-Oct-2019 GBP 1.3471 8-Oct-2018 GBP 1.3521
GBP Class Wd 8-Oct-2019 GBP 1.3532 8-Oct-2018 GBP 1.4706
GBP Class Zd 8-Oct-2019 GBP 1.3586 8-Oct-2018 GBP 1.3734
SGD Class Id 8-Oct-2019 SGD 1.4058 - -
SGD Class Rd 8-Oct-2019 SGD 1.6120 8-Oct-2018 SGD 1.5932
SGD Class Wd 8-Oct-2019 SGD 1.2327 8-Oct-2018 SGD 1.3656
USD Class Id 8-Oct-2019 USD 1.4237 8-Oct-2018 USD 1.4704
USD Class Md 8-Oct-2019 USD 1.3288 8-Oct-2018 USD 1.5415
USD Class Rd 8-Oct-2019 USD 1.3966 8-Oct-2018 USD 1.3929
USD Class Wd 8-Oct-2019 USD 1.3261 8-Oct-2018 USD 1.5058
USD Class Zd 8-Oct-2019 USD 1.4881 8-Oct-2018 USD 1.0878
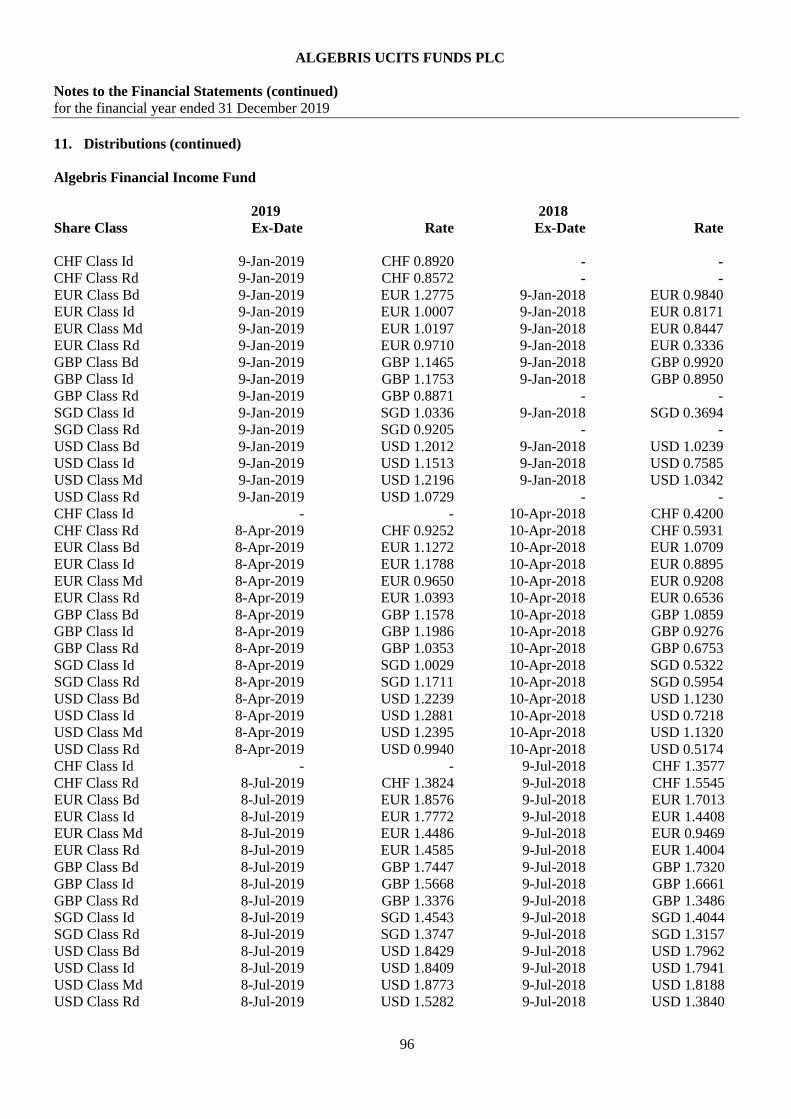
ALGEBRIS UCITS FUNDS PLC
Notes to the Financial Statements (continued)
for the financial year ended 31 December 2019
96
11. Distributions (continued)
Algebris Financial Income Fund
2019 2018
Share Class Ex-Date Rate Ex-Date Rate
CHF Class Id 9-Jan-2019 CHF 0.8920 - -
CHF Class Rd 9-Jan-2019 CHF 0.8572 - -
EUR Class Bd 9-Jan-2019 EUR 1.2775 9-Jan-2018 EUR 0.9840
EUR Class Id 9-Jan-2019 EUR 1.0007 9-Jan-2018 EUR 0.8171
EUR Class Md 9-Jan-2019 EUR 1.0197 9-Jan-2018 EUR 0.8447
EUR Class Rd 9-Jan-2019 EUR 0.9710 9-Jan-2018 EUR 0.3336
GBP Class Bd 9-Jan-2019 GBP 1.1465 9-Jan-2018 GBP 0.9920
GBP Class Id 9-Jan-2019 GBP 1.1753 9-Jan-2018 GBP 0.8950
GBP Class Rd 9-Jan-2019 GBP 0.8871 - -
SGD Class Id 9-Jan-2019 SGD 1.0336 9-Jan-2018 SGD 0.3694
SGD Class Rd 9-Jan-2019 SGD 0.9205 - -
USD Class Bd 9-Jan-2019 USD 1.2012 9-Jan-2018 USD 1.0239
USD Class Id 9-Jan-2019 USD 1.1513 9-Jan-2018 USD 0.7585
USD Class Md 9-Jan-2019 USD 1.2196 9-Jan-2018 USD 1.0342
USD Class Rd 9-Jan-2019 USD 1.0729 - -
CHF Class Id - - 10-Apr-2018 CHF 0.4200
CHF Class Rd 8-Apr-2019 CHF 0.9252 10-Apr-2018 CHF 0.5931
EUR Class Bd 8-Apr-2019 EUR 1.1272 10-Apr-2018 EUR 1.0709
EUR Class Id 8-Apr-2019 EUR 1.1788 10-Apr-2018 EUR 0.8895
EUR Class Md 8-Apr-2019 EUR 0.9650 10-Apr-2018 EUR 0.9208
EUR Class Rd 8-Apr-2019 EUR 1.0393 10-Apr-2018 EUR 0.6536
GBP Class Bd 8-Apr-2019 GBP 1.1578 10-Apr-2018 GBP 1.0859
GBP Class Id 8-Apr-2019 GBP 1.1986 10-Apr-2018 GBP 0.9276
GBP Class Rd 8-Apr-2019 GBP 1.0353 10-Apr-2018 GBP 0.6753
SGD Class Id 8-Apr-2019 SGD 1.0029 10-Apr-2018 SGD 0.5322
SGD Class Rd 8-Apr-2019 SGD 1.1711 10-Apr-2018 SGD 0.5954
USD Class Bd 8-Apr-2019 USD 1.2239 10-Apr-2018 USD 1.1230
USD Class Id 8-Apr-2019 USD 1.2881 10-Apr-2018 USD 0.7218
USD Class Md 8-Apr-2019 USD 1.2395 10-Apr-2018 USD 1.1320
USD Class Rd 8-Apr-2019 USD 0.9940 10-Apr-2018 USD 0.5174
CHF Class Id - - 9-Jul-2018 CHF 1.3577
CHF Class Rd 8-Jul-2019 CHF 1.3824 9-Jul-2018 CHF 1.5545
EUR Class Bd 8-Jul-2019 EUR 1.8576 9-Jul-2018 EUR 1.7013
EUR Class Id 8-Jul-2019 EUR 1.7772 9-Jul-2018 EUR 1.4408
EUR Class Md 8-Jul-2019 EUR 1.4486 9-Jul-2018 EUR 0.9469
EUR Class Rd 8-Jul-2019 EUR 1.4585 9-Jul-2018 EUR 1.4004
GBP Class Bd 8-Jul-2019 GBP 1.7447 9-Jul-2018 GBP 1.7320
GBP Class Id 8-Jul-2019 GBP 1.5668 9-Jul-2018 GBP 1.6661
GBP Class Rd 8-Jul-2019 GBP 1.3376 9-Jul-2018 GBP 1.3486
SGD Class Id 8-Jul-2019 SGD 1.4543 9-Jul-2018 SGD 1.4044
SGD Class Rd 8-Jul-2019 SGD 1.3747 9-Jul-2018 SGD 1.3157
USD Class Bd 8-Jul-2019 USD 1.8429 9-Jul-2018 USD 1.7962
USD Class Id 8-Jul-2019 USD 1.8409 9-Jul-2018 USD 1.7941
USD Class Md 8-Jul-2019 USD 1.8773 9-Jul-2018 USD 1.8188
USD Class Rd 8-Jul-2019 USD 1.5282 9-Jul-2018 USD 1.3840

ALGEBRIS UCITS FUNDS PLC
Notes to the Financial Statements (continued)
for the financial year ended 31 December 2019
97
11. Distributions (continued)
Algebris Financial Income Fund (continued)
2019 2018
Share Class Ex-Date Rate Ex-Date Rate
CHF Class Id - - 8-Oct-2018 CHF 0.8513
CHF Class Rd 8-Oct-2019 CHF 0.8464 8-Oct-2018 CHF 0.8207
EUR Class Bd 8-Oct-2019 EUR 1.1189 8-Oct-2018 EUR 1.0684
EUR Class Id 8-Oct-2019 EUR 1.0909 8-Oct-2018 EUR 1.0186
EUR Class Md 8-Oct-2019 EUR 0.9616 8-Oct-2018 EUR 2.4509
EUR Class Rd 8-Oct-2019 EUR 1.1011 8-Oct-2018 EUR 0.9109
GBP Class Bd 8-Oct-2019 GBP 1.1607 8-Oct-2018 GBP 1.0897
GBP Class Id 8-Oct-2019 GBP 1.0753 8-Oct-2018 GBP 1.0016
GBP Class Rd 8-Oct-2019 GBP 0.9008 8-Oct-2018 GBP 0.8458
SGD Class Id 8-Oct-2019 SGD 1.0900 8-Oct-2018 SGD 0.9771
SGD Class Rd 8-Oct-2019 SGD 0.9261 8-Oct-2018 SGD 0.8638
USD Class Bd - - 8-Oct-2018 USD 1.1354
USD Class Id 8-Oct-2019 USD 1.2169 8-Oct-2018 USD 1.2160
USD Class Md 8-Oct-2019 USD 1.2488 8-Oct-2018 USD 1.1578
USD Class Rd 8-Oct-2019 USD 0.9904 8-Oct-2018 USD 0.9285
Algebris Financial Equity Fund
2019 2018
Share Class Ex-Date Rate Ex-Date Rate
GBP Class Md 9-Jan-2019 GBP 0.2983 - -
USD Class Md 9-Jan-2019 USD 0.3960 9-Jan-2018 USD 0.1543
GBP Class Md 8-Apr-2019 GBP 0.2020 10-Apr-2018 GBP 0.3105
USD Class Md 8-Apr-2019 USD 0.2701 10-Apr-2018 USD 0.3408
GBP Class Md 8-Jul-2019 GBP 1.2899 9-Jul-2018 GBP 1.3036
USD Class Md 8-Jul-2019 USD 1.7239 9-Jul-2018 USD 2.2098
GBP Class Md 8-Oct-2019 GBP 0.2095 8-Oct-2018 GBP 0.3755
USD Class Md 8-Oct-2019 USD 0.2536 8-Oct-2018 USD 0.4925
Algebris Macro Credit Fund
2019 2018
Share Class Ex-Date Rate Ex-Date Rate
CHF Class Bd 9-Jan-2019 CHF 0.7093 9-Jan-2018 CHF 0.7278
EUR Class Bd 9-Jan-2019 EUR 0.4706 9-Jan-2018 EUR 0.9322
EUR Class Id 9-Jan-2019 EUR 0.5937 9-Jan-2018 EUR 0.4796
EUR Class Md 9-Jan-2019 EUR 0.8220 - -
EUR Class Rd 9-Jan-2019 EUR 0.4414 9-Jan-2018 EUR 0.8008
GBP Class Id 9-Jan-2019 GBP 0.5761 - -
GBP Class Md 9-Jan-2019 GBP 0.8187 9-Jan-2018 GBP 1.3026
USD Class Md 9-Jan-2019 USD 0.8377 9-Jan-2018 USD 1.3810
CHF Class Bd 8-Apr-2019 CHF 1.0581 10-Apr-2018 CHF 0.7023
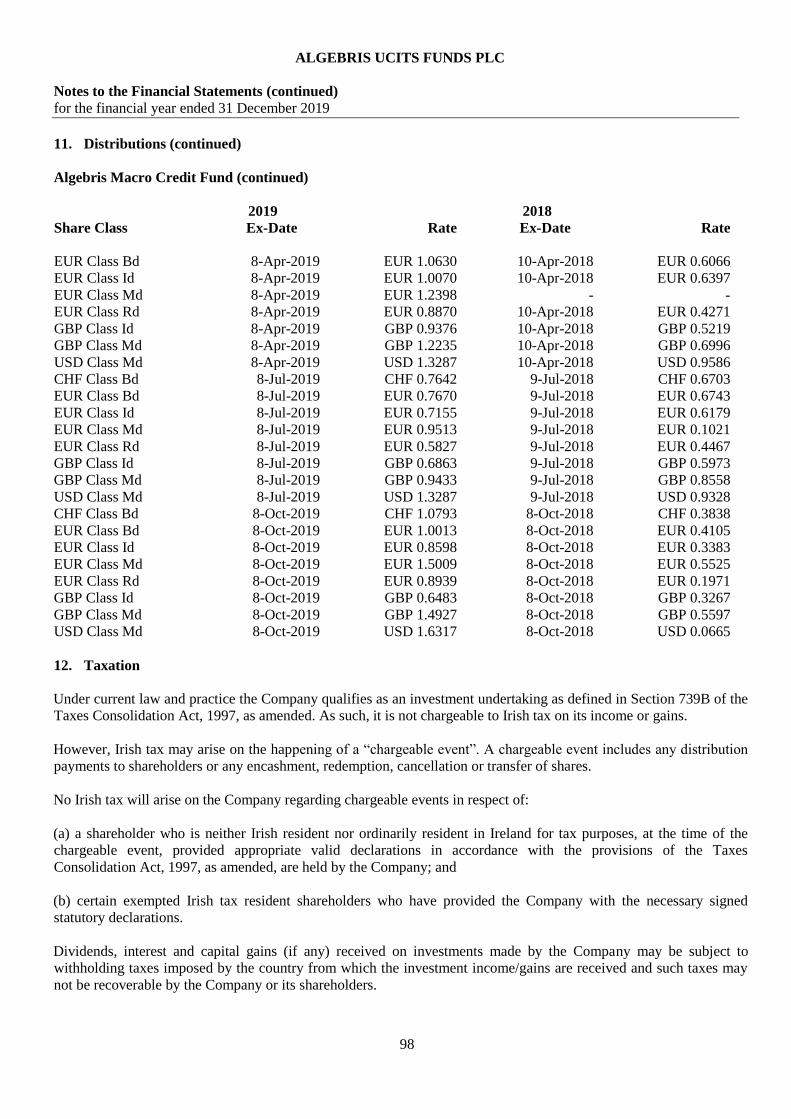
ALGEBRIS UCITS FUNDS PLC
Notes to the Financial Statements (continued)
for the financial year ended 31 December 2019
98
11. Distributions (continued)
Algebris Macro Credit Fund (continued)
2019 2018
Share Class Ex-Date Rate Ex-Date Rate
EUR Class Bd 8-Apr-2019 EUR 1.0630 10-Apr-2018 EUR 0.6066
EUR Class Id 8-Apr-2019 EUR 1.0070 10-Apr-2018 EUR 0.6397
EUR Class Md 8-Apr-2019 EUR 1.2398 - -
EUR Class Rd 8-Apr-2019 EUR 0.8870 10-Apr-2018 EUR 0.4271
GBP Class Id 8-Apr-2019 GBP 0.9376 10-Apr-2018 GBP 0.5219
GBP Class Md 8-Apr-2019 GBP 1.2235 10-Apr-2018 GBP 0.6996
USD Class Md 8-Apr-2019 USD 1.3287 10-Apr-2018 USD 0.9586
CHF Class Bd 8-Jul-2019 CHF 0.7642 9-Jul-2018 CHF 0.6703
EUR Class Bd 8-Jul-2019 EUR 0.7670 9-Jul-2018 EUR 0.6743
EUR Class Id 8-Jul-2019 EUR 0.7155 9-Jul-2018 EUR 0.6179
EUR Class Md 8-Jul-2019 EUR 0.9513 9-Jul-2018 EUR 0.1021
EUR Class Rd 8-Jul-2019 EUR 0.5827 9-Jul-2018 EUR 0.4467
GBP Class Id 8-Jul-2019 GBP 0.6863 9-Jul-2018 GBP 0.5973
GBP Class Md 8-Jul-2019 GBP 0.9433 9-Jul-2018 GBP 0.8558
USD Class Md 8-Jul-2019 USD 1.3287 9-Jul-2018 USD 0.9328
CHF Class Bd 8-Oct-2019 CHF 1.0793 8-Oct-2018 CHF 0.3838
EUR Class Bd 8-Oct-2019 EUR 1.0013 8-Oct-2018 EUR 0.4105
EUR Class Id 8-Oct-2019 EUR 0.8598 8-Oct-2018 EUR 0.3383
EUR Class Md 8-Oct-2019 EUR 1.5009 8-Oct-2018 EUR 0.5525
EUR Class Rd 8-Oct-2019 EUR 0.8939 8-Oct-2018 EUR 0.1971
GBP Class Id 8-Oct-2019 GBP 0.6483 8-Oct-2018 GBP 0.3267
GBP Class Md 8-Oct-2019 GBP 1.4927 8-Oct-2018 GBP 0.5597
USD Class Md 8-Oct-2019 USD 1.6317 8-Oct-2018 USD 0.0665
12. Taxation
Under current law and practice the Company qualifies as an investment undertaking as defined in Section 739B of the
Taxes Consolidation Act, 1997, as amended. As such, it is not chargeable to Irish tax on its income or gains.
However, Irish tax may arise on the happening of a “chargeable event”. A chargeable event includes any distribution
payments to shareholders or any encashment, redemption, cancellation or transfer of shares.
No Irish tax will arise on the Company regarding chargeable events in respect of:
(a) a shareholder who is neither Irish resident nor ordinarily resident in Ireland for tax purposes, at the time of the
chargeable event, provided appropriate valid declarations in accordance with the provisions of the Taxes
Consolidation Act, 1997, as amended, are held by the Company; and
(b) certain exempted Irish tax resident shareholders who have provided the Company with the necessary signed
statutory declarations.
Dividends, interest and capital gains (if any) received on investments made by the Company may be subject to
withholding taxes imposed by the country from which the investment income/gains are received and such taxes may
not be recoverable by the Company or its shareholders.

ALGEBRIS UCITS FUNDS PLC
Notes to the Financial Statements (continued)
for the financial year ended 31 December 2019
99
13. Soft commissions
There were no soft commission arrangements affecting the Company during the financial year ended 31 December
2019 (2018: Nil).
14. Risks associated with financial instruments
The Company’s risks are those set out in the Prospectus and the relevant Supplements and any consideration of risk
here should be viewed in the context of the Prospectus and the relevant Supplements which is the primary
documentation governing the operation of the Company.
The Company’s activities expose it to a variety of financial risks: market risk (including price risk, currency risk and
interest rate risk), credit risk and liquidity risk. The Company’s overall risk management process focuses on the
unpredictability of financial markets and seeks to mitigate potential adverse effects on the Company’s financial
performance.
The Investment Manager seeks to mitigate the financial risk in the Company in its daily risk management process.
From year to year, the Company’s exposure to risk will alter as market conditions change and as the components of
the portfolio change and are adjusted through trading, subscriptions and redemptions. With regard to the objectives,
policies and processes for managing the risk, whilst adapting to the current market conditions, the approach will
remain consistent from year to year.
The Company uses the commitment approach to calculate Algebris Financial Credit, Algebris Financial Income,
Algebris Allocation Fund, Algebris Core Italy and Algebris IG Financial Credit Sub-Fund’s global exposure. This
approach converts the Company’s foreign direct investments positions into an equivalent position of the underlying
asset based on the market value of the underlying asset.
The Company uses the Value-at-Risk (“VaR”) Approach to calculate Algebris Financial Equity Sub-Fund’s global
exposure which ensures that the use of financial derivative instruments is within the limits specified by the Central
Bank. The calculation of VaR is on a relative basis and is monitored daily to ensure that it does not exceed twice
that of the MSCI World Financials Index over a 20 day holding period. The basis of the VaR calculation is detailed
in a Supplement to the Company’s Prospectus. The Company’s portfolio VaR is calculated daily by the Investment
Manager at 99% confidence levels for a 20 day holding period, using the historical approach. The lowest, highest
and the average utilisation of the VaR limit at 99% confidence levels calculated during the year was 8.9%, 16.5%
and 11.6% respectively. The VaR model is fed with daily data of the relevant market indices since inception. The
median sum of derivative notional leverage employed during the year by the Company was 242.6%.
Until 20 February 2019, the Company used the VaR Approach to calculate Algebris Allocation Sub-Fund’s global
exposure which ensures that the use of financial derivative instruments is within the limits specified by the Central
Bank. The calculation of VaR is on an absolute basis and is monitored daily to ensure that it does not exceed 20% of
NAV over a 20 day holding period. The basis of the VaR calculation is detailed in a Supplement to the Company’s
Prospectus. The Company’s portfolio VaR is calculated daily by the Investment Manager at 99% confidence levels
for a 20 day holding period, using the historical approach. The lowest, highest and the average utilisation of the
VaR limit at 99% confidence levels calculated during the year was 1.1%, 6.1% and 4.7% respectively. The VaR
model is fed with daily data of the relevant market indices since inception. The median sum of derivative notional
leverage employed during the year by the Company was 55.5%.
From 21 February 2019, the Company adopted the commitment approach to calculate Algebris Allocation Sub-
Fund’s global exposure. This approach converts the Company’s foreign direct investments positions into an
equivalent position of the underlying asset based on the market value of the underlying asset.
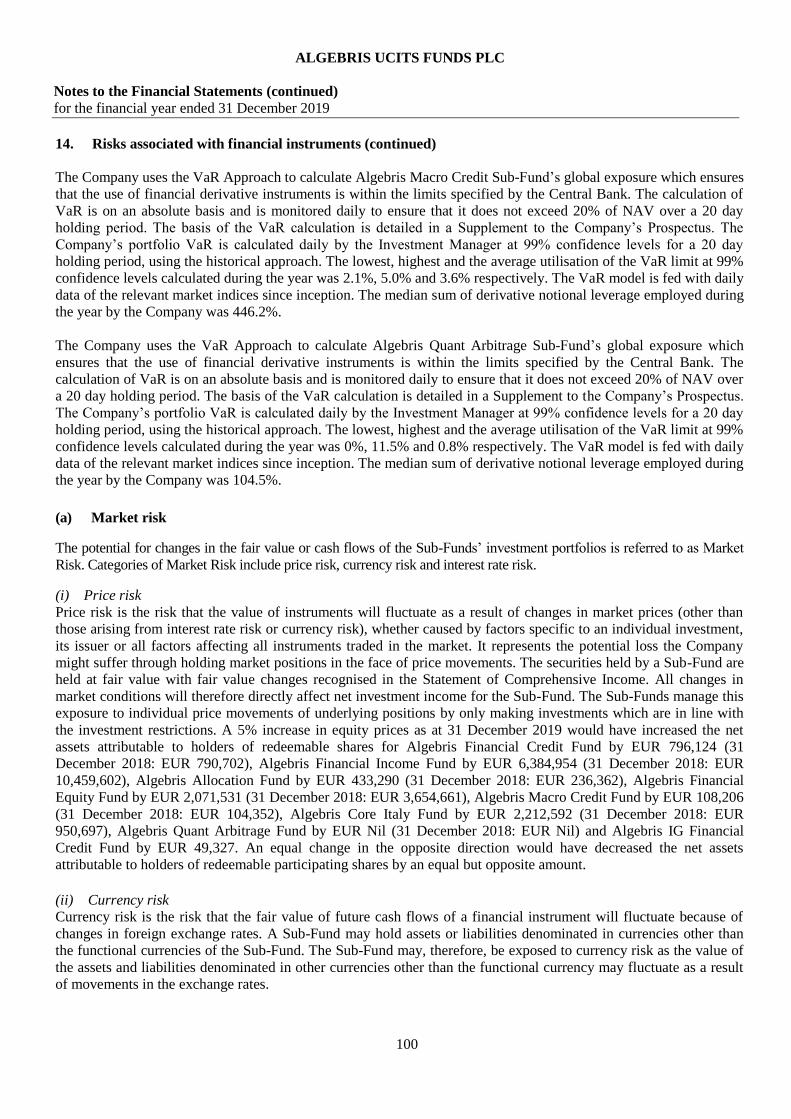
ALGEBRIS UCITS FUNDS PLC
Notes to the Financial Statements (continued)
for the financial year ended 31 December 2019
100
14. Risks associated with financial instruments (continued)
The Company uses the VaR Approach to calculate Algebris Macro Credit Sub-Fund’s global exposure which ensures
that the use of financial derivative instruments is within the limits specified by the Central Bank. The calculation of
VaR is on an absolute basis and is monitored daily to ensure that it does not exceed 20% of NAV over a 20 day
holding period. The basis of the VaR calculation is detailed in a Supplement to the Company’s Prospectus. The
Company’s portfolio VaR is calculated daily by the Investment Manager at 99% confidence levels for a 20 day
holding period, using the historical approach. The lowest, highest and the average utilisation of the VaR limit at 99%
confidence levels calculated during the year was 2.1%, 5.0% and 3.6% respectively. The VaR model is fed with daily
data of the relevant market indices since inception. The median sum of derivative notional leverage employed during
the year by the Company was 446.2%.
The Company uses the VaR Approach to calculate Algebris Quant Arbitrage Sub-Fund’s global exposure which
ensures that the use of financial derivative instruments is within the limits specified by the Central Bank. The
calculation of VaR is on an absolute basis and is monitored daily to ensure that it does not exceed 20% of NAV over
a 20 day holding period. The basis of the VaR calculation is detailed in a Supplement to the Company’s Prospectus.
The Company’s portfolio VaR is calculated daily by the Investment Manager at 99% confidence levels for a 20 day
holding period, using the historical approach. The lowest, highest and the average utilisation of the VaR limit at 99%
confidence levels calculated during the year was 0%, 11.5% and 0.8% respectively. The VaR model is fed with daily
data of the relevant market indices since inception. The median sum of derivative notional leverage employed during
the year by the Company was 104.5%.
(a) Market risk
The potential for changes in the fair value or cash flows of the Sub-Funds’ investment portfolios is referred to as Market
Risk. Categories of Market Risk include price risk, currency risk and interest rate risk.
(i) Price risk
Price risk is the risk that the value of instruments will fluctuate as a result of changes in market prices (other than
those arising from interest rate risk or currency risk), whether caused by factors specific to an individual investment,
its issuer or all factors affecting all instruments traded in the market. It represents the potential loss the Company
might suffer through holding market positions in the face of price movements. The securities held by a Sub-Fund are
held at fair value with fair value changes recognised in the Statement of Comprehensive Income. All changes in
market conditions will therefore directly affect net investment income for the Sub-Fund. The Sub-Funds manage this
exposure to individual price movements of underlying positions by only making investments which are in line with
the investment restrictions. A 5% increase in equity prices as at 31 December 2019 would have increased the net
assets attributable to holders of redeemable shares for Algebris Financial Credit Fund by EUR 796,124 (31
December 2018: EUR 790,702), Algebris Financial Income Fund by EUR 6,384,954 (31 December 2018: EUR
10,459,602), Algebris Allocation Fund by EUR 433,290 (31 December 2018: EUR 236,362), Algebris Financial
Equity Fund by EUR 2,071,531 (31 December 2018: EUR 3,654,661), Algebris Macro Credit Fund by EUR 108,206
(31 December 2018: EUR 104,352), Algebris Core Italy Fund by EUR 2,212,592 (31 December 2018: EUR
950,697), Algebris Quant Arbitrage Fund by EUR Nil (31 December 2018: EUR Nil) and Algebris IG Financial
Credit Fund by EUR 49,327. An equal change in the opposite direction would have decreased the net assets
attributable to holders of redeemable participating shares by an equal but opposite amount.
(ii) Currency risk
Currency risk is the risk that the fair value of future cash flows of a financial instrument will fluctuate because of
changes in foreign exchange rates. A Sub-Fund may hold assets or liabilities denominated in currencies other than
the functional currencies of the Sub-Fund. The Sub-Fund may, therefore, be exposed to currency risk as the value of
the assets and liabilities denominated in other currencies other than the functional currency may fluctuate as a result
of movements in the exchange rates.
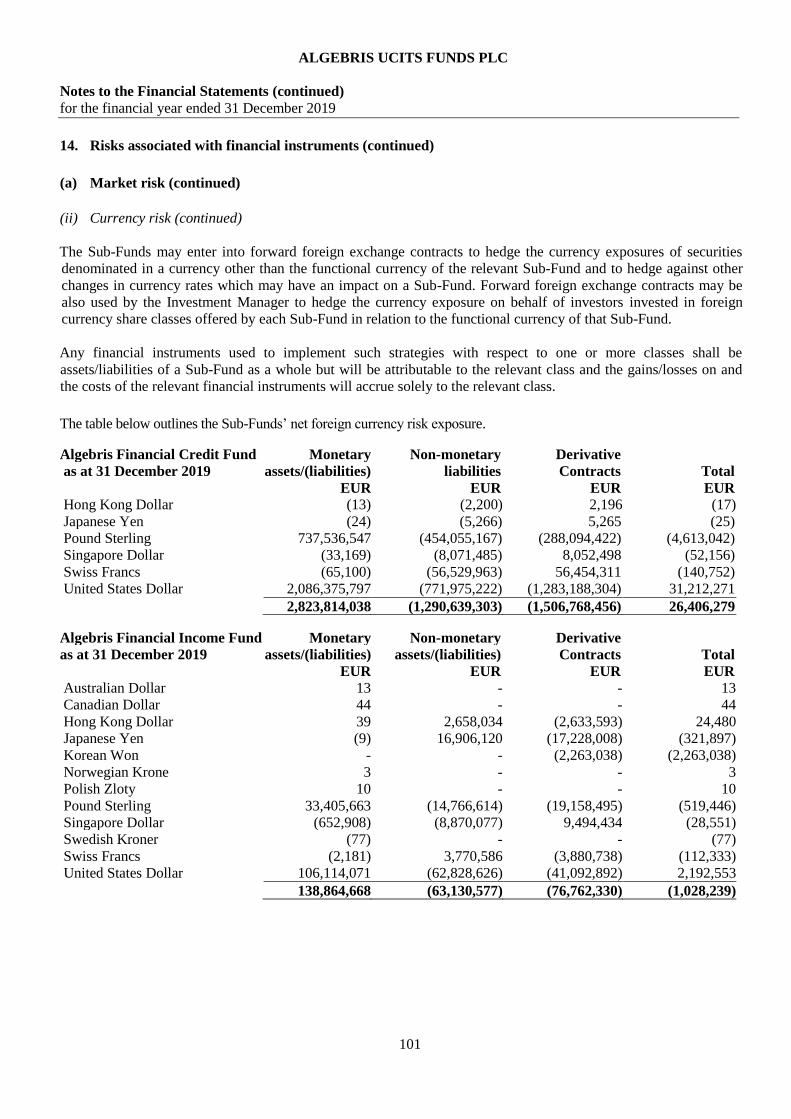
ALGEBRIS UCITS FUNDS PLC
Notes to the Financial Statements (continued)
for the financial year ended 31 December 2019
101
14. Risks associated with financial instruments (continued)
(a) Market risk (continued)
(ii) Currency risk (continued)
The Sub-Funds may enter into forward foreign exchange contracts to hedge the currency exposures of securities
denominated in a currency other than the functional currency of the relevant Sub-Fund and to hedge against other
changes in currency rates which may have an impact on a Sub-Fund. Forward foreign exchange contracts may be
also used by the Investment Manager to hedge the currency exposure on behalf of investors invested in foreign
currency share classes offered by each Sub-Fund in relation to the functional currency of that Sub-Fund.
Any financial instruments used to implement such strategies with respect to one or more classes shall be
assets/liabilities of a Sub-Fund as a whole but will be attributable to the relevant class and the gains/losses on and
the costs of the relevant financial instruments will accrue solely to the relevant class.
The table below outlines the Sub-Funds’ net foreign currency risk exposure.
Algebris Financial Credit Fund Monetary Non-monetary Derivative
as at 31 December 2019 assets/(liabilities) liabilities Contracts Total
EUR EUR EUR EUR
Hong Kong Dollar (13) (2,200) 2,196 (17)
Japanese Yen (24) (5,266) 5,265 (25)
Pound Sterling 737,536,547 (454,055,167) (288,094,422) (4,613,042)
Singapore Dollar (33,169) (8,071,485) 8,052,498 (52,156)
Swiss Francs (65,100) (56,529,963) 56,454,311 (140,752)
United States Dollar 2,086,375,797 (771,975,222) (1,283,188,304) 31,212,271
2,823,814,038 (1,290,639,303) (1,506,768,456) 26,406,279
Algebris Financial Income Fund Monetary Non-monetary Derivative
as at 31 December 2019 assets/(liabilities) assets/(liabilities) Contracts Total
EUR EUR EUR EUR
Australian Dollar 13 - - 13
Canadian Dollar 44 - - 44
Hong Kong Dollar 39 2,658,034 (2,633,593) 24,480
Japanese Yen (9) 16,906,120 (17,228,008) (321,897)
Korean Won - - (2,263,038) (2,263,038)
Norwegian Krone 3 - - 3
Polish Zloty 10 - - 10
Pound Sterling 33,405,663 (14,766,614) (19,158,495) (519,446)
Singapore Dollar (652,908) (8,870,077) 9,494,434 (28,551)
Swedish Kroner (77) - - (77)
Swiss Francs (2,181) 3,770,586 (3,880,738) (112,333)
United States Dollar 106,114,071 (62,828,626) (41,092,892) 2,192,553
138,864,668 (63,130,577) (76,762,330) (1,028,239)

ALGEBRIS UCITS FUNDS PLC
Notes to the Financial Statements (continued)
for the financial year ended 31 December 2019
102
14. Risks associated with financial instruments (continued)
(a) Market risk (continued)
(ii) Currency risk (continued)
Algebris Allocation Fund Monetary Non-monetary Derivative
as at 31 December 2019 assets/(liabilities) assets/(liabilities) Contracts Total
EUR EUR EUR EUR
Australian Dollar (2) - - (2)
Canadian Dollar 60 - - 60
Danish Krone (3) - - (3)
Hong Kong Dollar 7 - - 7
Japanese Yen (10) (1,087) 1,057 (40)
Mexican Peso (1) - - (1)
Norwegian Krone 8 - - 8
Pound Sterling (1,335) - - (1,335)
Singapore Dollar (10) - - (10)
Swedish Kroner (76) - - (76)
Swiss Francs (280) (23,326) 22,853 (753)
United States Dollar (18,895) 449,649 - 430,754
(20,537) 425,236 23,910 428,609
Algebris Financial Equity Fund Monetary Non-monetary Derivative
as at 31 December 2019 assets/(liabilities) assets/(liabilities) Contracts Total
EUR EUR EUR EUR
Brazilian real 3,651 - (1,094,788) (1,091,137)
Canadian Dollar (880) - - (880)
Hong Kong Dollar - 1,247,322 (1,235,814) 11,508
Japanese Yen (39) 4,563,831 (4,650,635) (86,843)
Korean Won - - (963,957) (963,957)
Polish Zloty (33) - - (33)
Pound Sterling 21,715 (4,966,586) 4,953,320 8,449
Singapore dollar 66 - - 66
Swedish Kroner (26) - - (26)
Swiss Francs 1,821 (1,567,590) 1,540,899 (24,870)
United States Dollar 20,018 (5,095,581) 5,229,854 154,291
46,293 (5,818,604) 3,778,879 (1,993,432)
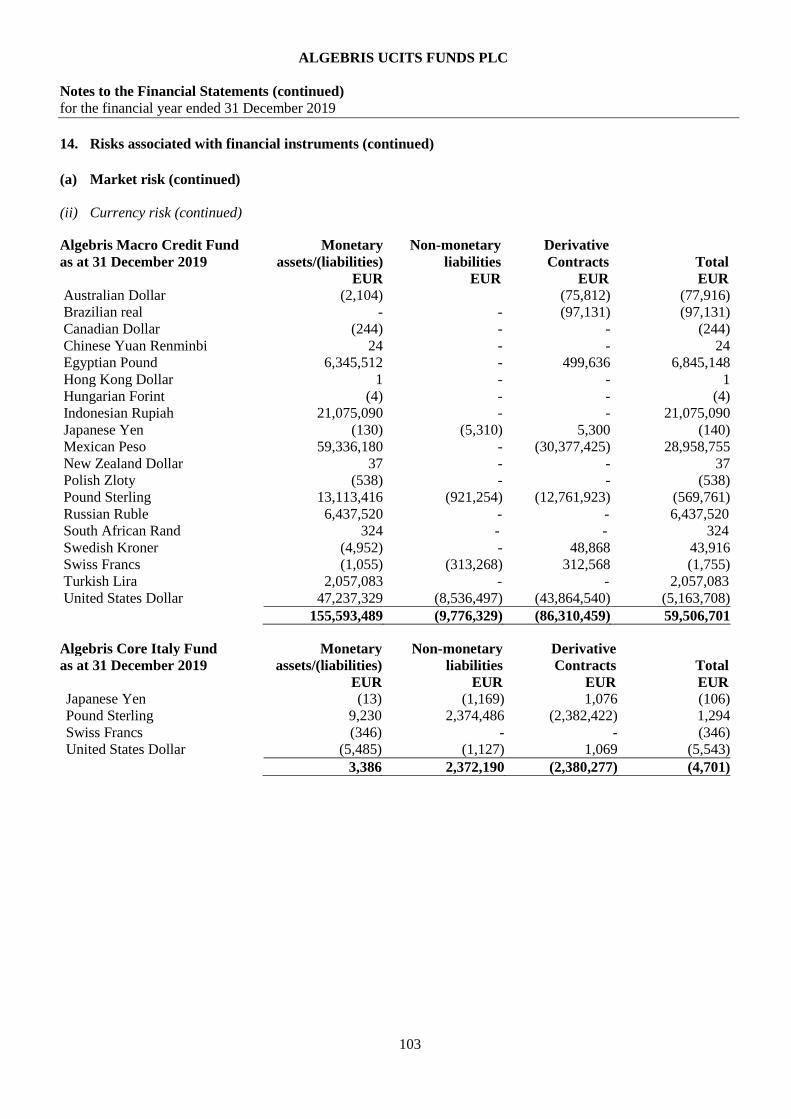
ALGEBRIS UCITS FUNDS PLC
Notes to the Financial Statements (continued)
for the financial year ended 31 December 2019
103
14. Risks associated with financial instruments (continued)
(a) Market risk (continued)
(ii) Currency risk (continued)
Algebris Macro Credit Fund Monetary Non-monetary Derivative
as at 31 December 2019 assets/(liabilities) liabilities Contracts Total
EUR EUR EUR EUR
Australian Dollar (2,104) (75,812) (77,916)
Brazilian real - - (97,131) (97,131)
Canadian Dollar (244) - - (244)
Chinese Yuan Renminbi 24 - - 24
Egyptian Pound 6,345,512 - 499,636 6,845,148
Hong Kong Dollar 1 - - 1
Hungarian Forint (4) - - (4)
Indonesian Rupiah 21,075,090 - - 21,075,090
Japanese Yen (130) (5,310) 5,300 (140)
Mexican Peso 59,336,180 - (30,377,425) 28,958,755
New Zealand Dollar 37 - - 37
Polish Zloty (538) - - (538)
Pound Sterling 13,113,416 (921,254) (12,761,923) (569,761)
Russian Ruble 6,437,520 - - 6,437,520
South African Rand 324 - - 324
Swedish Kroner (4,952) - 48,868 43,916
Swiss Francs (1,055) (313,268) 312,568 (1,755)
Turkish Lira 2,057,083 - - 2,057,083
United States Dollar 47,237,329 (8,536,497) (43,864,540) (5,163,708)
155,593,489 (9,776,329) (86,310,459) 59,506,701
Algebris Core Italy Fund Monetary Non-monetary Derivative
as at 31 December 2019 assets/(liabilities) liabilities Contracts Total
EUR EUR EUR EUR
Japanese Yen (13) (1,169) 1,076 (106)
Pound Sterling 9,230 2,374,486 (2,382,422) 1,294
Swiss Francs (346) - - (346)
United States Dollar (5,485) (1,127) 1,069 (5,543)
3,386 2,372,190 (2,380,277) (4,701)
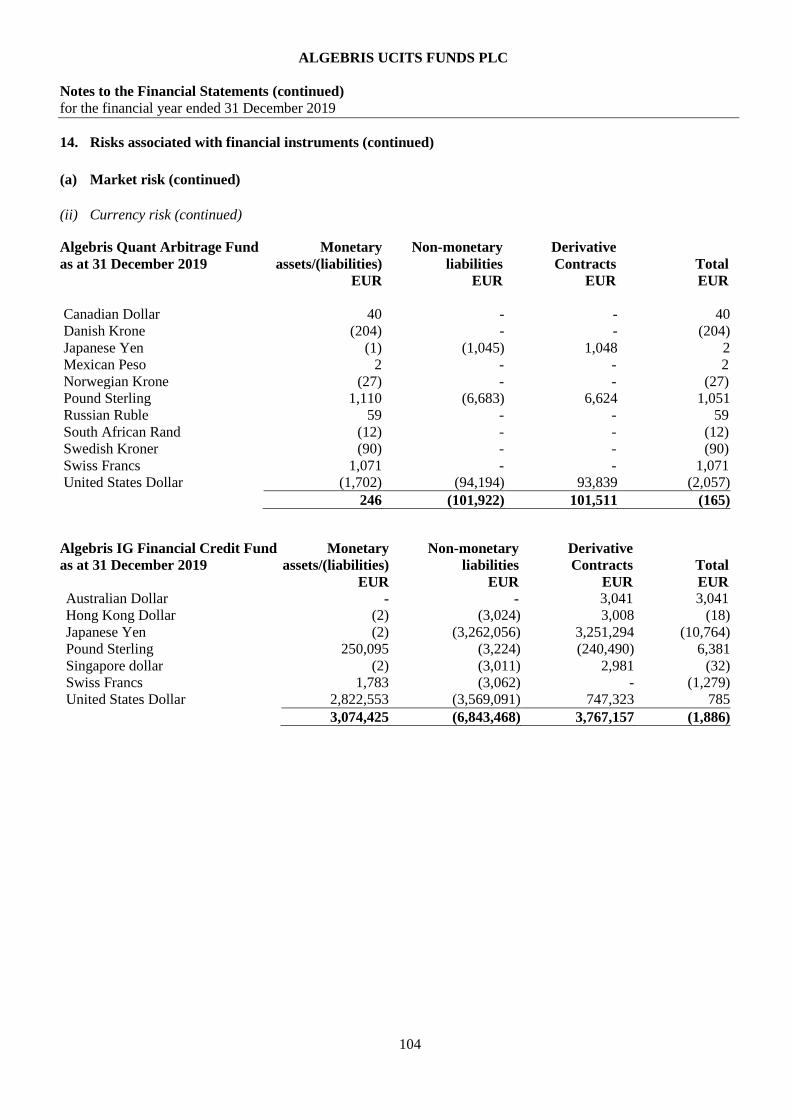
ALGEBRIS UCITS FUNDS PLC
Notes to the Financial Statements (continued)
for the financial year ended 31 December 2019
104
14. Risks associated with financial instruments (continued)
(a) Market risk (continued)
(ii) Currency risk (continued)
Algebris Quant Arbitrage Fund Monetary Non-monetary Derivative
as at 31 December 2019 assets/(liabilities) liabilities Contracts Total
EUR EUR EUR EUR
Canadian Dollar 40 - - 40
Danish Krone (204) - - (204)
Japanese Yen (1) (1,045) 1,048 2
Mexican Peso 2 - - 2
Norwegian Krone (27) - - (27)
Pound Sterling 1,110 (6,683) 6,624 1,051
Russian Ruble 59 - - 59
South African Rand (12) - - (12)
Swedish Kroner (90) - - (90)
Swiss Francs 1,071 - - 1,071
United States Dollar (1,702) (94,194) 93,839 (2,057)
246 (101,922) 101,511 (165)
Algebris IG Financial Credit Fund Monetary Non-monetary Derivative
as at 31 December 2019 assets/(liabilities) liabilities Contracts Total
EUR EUR EUR EUR
Australian Dollar - - 3,041 3,041
Hong Kong Dollar (2) (3,024) 3,008 (18)
Japanese Yen (2) (3,262,056) 3,251,294 (10,764)
Pound Sterling 250,095 (3,224) (240,490) 6,381
Singapore dollar (2) (3,011) 2,981 (32)
Swiss Francs 1,783 (3,062) - (1,279)
United States Dollar 2,822,553 (3,569,091) 747,323 785
3,074,425 (6,843,468) 3,767,157 (1,886)

ALGEBRIS UCITS FUNDS PLC
Notes to the Financial Statements (continued)
for the financial year ended 31 December 2019
105
14. Risks associated with financial instruments (continued)
(a) Market risk (continued)
(ii) Currency risk (continued)
Algebris Financial Credit Fund Monetary Non-monetary Derivative
as at 31 December 2018 assets/(liabilities) liabilities Contracts Total
EUR EUR EUR EUR
Japanese Yen (2) (4,418) 4,421 1
Pound Sterling 549,616,618 (395,739,007) (145,185,326) 8,692,285
Singapore Dollar 138,274 (5,755,734) 5,743,918 126,458
Swiss Francs (587,802) (51,275,046) 52,170,182 307,334
United States Dollar 2,067,005,851 (638,219,248) (1,428,291,160) 495,443
2,616,172,939 (1,090,993,453) (1,515,557,965) 9,621,521
Algebris Financial Income Fund Monetary Non-monetary Derivative
as at 31 December 2018 assets/(liabilities) assets/(liabilities) Contracts Total
EUR EUR EUR EUR
Australian Dollar 12 - - 12
Canadian Dollar 40 - - 40
Hong Kong Dollar 6 9,982,579 (10,005,499) (22,914)
Japanese Yen (6) 8,616,883 (8,624,171) (7,294)
Korean Won - - (3,530,294) (3,530,294)
Norwegian Krone 3 - - 3
Polish Zloty 10 - - 10
Pound Sterling 25,414,820 (14,367,830) (12,091,712) (1,044,722)
Singapore Dollar (15,096) (13,185,317) 13,083,431 (116,982)
Swedish Kroner (78) - - (78)
Swiss Francs (216) 16,029,691 (15,579,238) 450,237
United States Dollar 119,189,949 (30,014,738) (89,138,834) 36,377
144,589,444 (22,938,732) (125,886,317) (4,235,605)
Algebris Allocation Fund Monetary Non-monetary Derivative
as at 31 December 2018 assets/(liabilities) assets/(liabilities) Contracts Total
EUR EUR EUR EUR
Australian Dollar (1,590) - (154,189) (155,779)
Canadian Dollar 56 - - 56
Danish Krone (3) 61,424 (61,060) 361
Hong Kong Dollar 44 268,786 (274,553) (5,723)
Japanese Yen (5) 235,954 (236,128) (179)
Korean Won - - (63,716) (63,716)
Mexican Peso (1) - - (1)
Norwegian Krone 8 - - 8
Pound Sterling 223,360 (42,265) (190,487) (9,392)
Singapore Dollar (10) 60,613 (60,711) (108)
Swedish Kroner (208) - (22) (230)
Swiss Francs 2,473 365,636 (359,472) 8,637
United States Dollar 1,527,636 2,426,929 (4,087,323) (132,758)
1,751,760 3,377,077 (5,487,661) (358,824)

ALGEBRIS UCITS FUNDS PLC
Notes to the Financial Statements (continued)
for the financial year ended 31 December 2019
106
14. Risks associated with financial instruments (continued)
(a) Market risk (continued)
(ii) Currency risk (continued)
Algebris Financial Equity Fund Monetary Non-monetary Derivative
as at 31 December 2018 assets/(liabilities) assets/(liabilities) Contracts Total
EUR EUR EUR EUR
Australian Dollar (22,337) - (2,215,845) (2,238,182)
Canadian Dollar - - (883,645) (883,645)
Danish Krone (54) - 20 (34)
Hong Kong Dollar 459 3,450,039 (3,524,003) (73,505)
Japanese Yen (75) 3,374,352 (3,373,308) 969
Korean Won - - (930,953) (930,953)
Polish Zloty (32) - - (32)
Pound Sterling 2,240 (6,069,225) 5,976,735 (90,250)
Singapore dollar (160) 954,648 (957,952) (3,464)
Swedish Kroner (2,864) - 33 (2,831)
Swiss Francs 681 4,939,805 (4,769,340) 171,146
United States Dollar 1,832,736 16,683,786 (16,624,192) 1,892,330
1,810,594 23,333,405 (27,302,450) (2,158,451)
Algebris Macro Credit Fund Monetary Non-monetary Derivative
as at 31 December 2018 assets/(liabilities) liabilities Contracts Total
EUR EUR EUR EUR
Australian Dollar (596) - - (596)
Chinese Yuan 23 - - 23
Czech Crown (93) - - (93)
Hong Kong Dollar 1 - - 1
Hungarian Forint (4) - - (4)
Japanese Yen (181) (4,316) 4,305 (192)
Mexican Peso (1,831) - - (1,831)
New Zealand Dollar 100 - - 100
Polish Zloty (1,016) - - (1,016)
Pound Sterling 23,359,472 (2,664,094) (21,575,358) (879,980)
Russian Ruble - - (281,770) (281,770)
South African Rand (99) - - (99)
Swedish Kroner (9) - - (9)
Swiss Francs 2,647 (439,384) 438,437 1,700
Turkish Lira 516 - - 516
United States Dollar 158,736,253 (5,088,369) (115,761,061) 37,886,823
182,095,183 (8,196,163) (137,175,447) 36,723,573

ALGEBRIS UCITS FUNDS PLC
Notes to the Financial Statements (continued)
for the financial year ended 31 December 2019
107
14. Risks associated with financial instruments (continued)
(a) Market risk (continued)
(ii) Currency risk (continued)
Algebris Core Italy Fund Monetary Non-monetary Derivative
as at 31 December 2018 assets/(liabilities) liabilities Contracts Total
EUR EUR EUR EUR
Pound Sterling 10,627 273,923 (273,508) 11,042
United States Dollar 875,656 - (868,725) 6,931
Swiss Francs 1,443 - - 1,443
887,726 273,923 (1,142,233) 19,416
Algebris Quant Arbitrage Fund Monetary Non-monetary Derivative
as at 31 December 2018 assets/(liabilities) liabilities Contracts Total
EUR EUR EUR EUR
Mexican Peso 1 - - 1
Pound Sterling (3,355) (1,852,544) 1,849,515 (6,384)
Russian Ruble 48 - - 48
South African Rand (10) - - (10)
Swiss Francs 4,128 - - 4,128
United States Dollar 8,249,225 (87,444) (8,234,635) (72,854)
8,250,037 (1,939,988) (6,385,120) (75,071)
At 31 December 2019 if any non-functional currencies had strengthened by 5% in relation to the respective functional
currency of the Sub-Funds, with all other variables held constant, net assets attributable to holders of redeemable
participating shares would have increased by the amounts shown below:
Algebris Financial Credit Fund Algebris Financial Credit Fund
as at 31 December 2019 as at 31 December 2018
EUR EUR Hong Kong Dollar (1) Hong Kong Dollar -
Japanese Yen (1) Japanese Yen -
Pound Sterling (230,652) Pound Sterling 434,614
Singapore Dollar (2,608) Singapore Dollar 6,323
Swiss Francs (7,038) Swiss Francs 15,367
United States Dollar 1,560,614 United States Dollar 24,772
1,320,314 481,076

ALGEBRIS UCITS FUNDS PLC
Notes to the Financial Statements (continued)
for the financial year ended 31 December 2019
108
14. Risks associated with financial instruments (continued)
(a) Market risk (continued)
(ii) Currency risk (continued)
Algebris Financial Income Fund Algebris Financial Income Fund
as at 31 December 2019 as at 31 December 2018
EUR EUR
Australian Dollar 1 Australian Dollar 1
Canadian Dollar 2 Canadian Dollar 2
Hong Kong Dollar 1,224 Hong Kong Dollar (1,146)
Japanese Yen (16,095) Japanese Yen (365)
Korean Won (113,152) Korean Won (176,515)
Polish Zloty 1 Polish Zloty 1
Pound Sterling (25,972) Pound Sterling (52,236)
Singapore Dollar (1,428) Singapore Dollar (5,849)
Swedish Kroner (4) Swedish Kroner (4)
Swiss Francs (5,617) Swiss Francs 22,512
United States Dollar 109,628 United States Dollar 1,819
(51,412) (211,780)
Algebris Allocation Fund Algebris Allocation Fund
as at 31 December 2019 as at 31 December 2018
EUR EUR
Australian Dollar - Australian Dollar (7,789)
Canadian Dollar 3 Canadian Dollar 3
Danish Krone - Danish Krone 18
Hong Kong Dollar - Hong Kong Dollar (286)
Japanese Yen (2) Japanese Yen (9)
Korean Won - Korean Won (3,186)
Pound Sterling (67) Pound Sterling (470)
Singapore Dollar (1) Singapore Dollar (5)
Swedish Kroner (4) Swedish Kroner (12)
Swiss Francs (38) Swiss Francs 432
United States Dollar 21,538 United States Dollar (6,638)
21,429 (17,942)
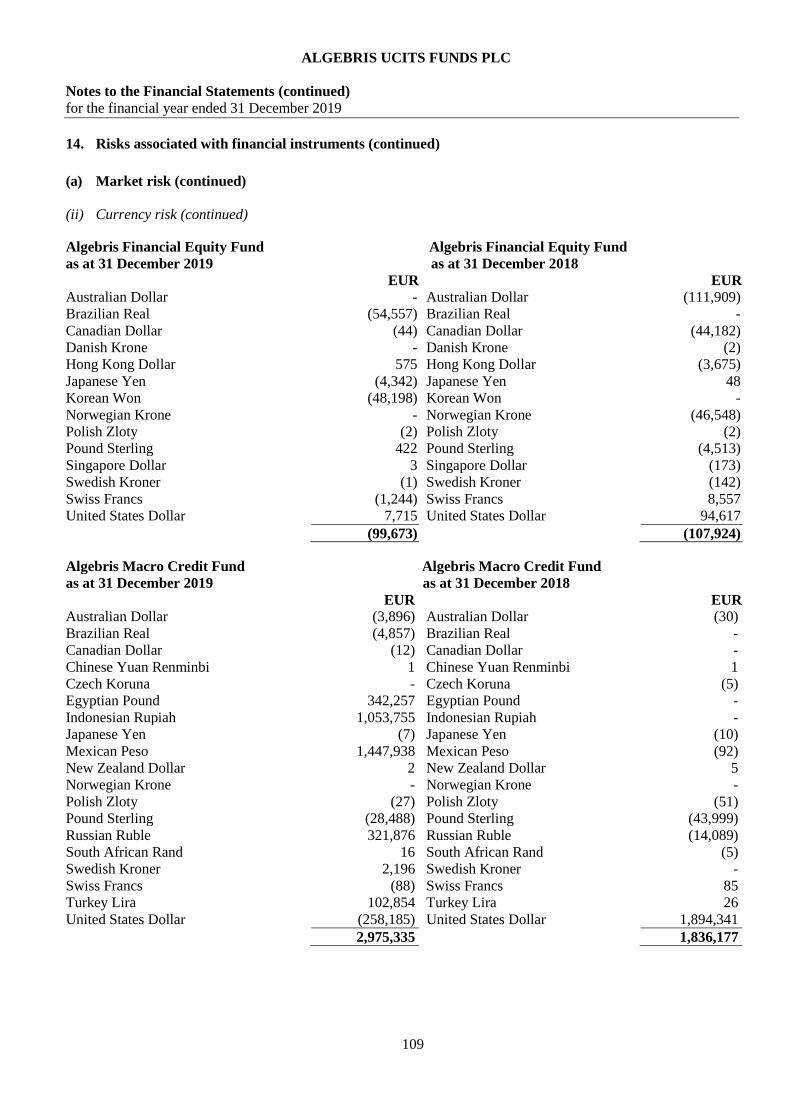
ALGEBRIS UCITS FUNDS PLC
Notes to the Financial Statements (continued)
for the financial year ended 31 December 2019
109
14. Risks associated with financial instruments (continued)
(a) Market risk (continued)
(ii) Currency risk (continued)
Algebris Financial Equity Fund Algebris Financial Equity Fund
as at 31 December 2019 as at 31 December 2018
EUR EUR
Australian Dollar - Australian Dollar (111,909)
Brazilian Real (54,557) Brazilian Real -
Canadian Dollar (44) Canadian Dollar (44,182)
Danish Krone - Danish Krone (2)
Hong Kong Dollar 575 Hong Kong Dollar (3,675)
Japanese Yen (4,342) Japanese Yen 48
Korean Won (48,198) Korean Won -
Norwegian Krone - Norwegian Krone (46,548)
Polish Zloty (2) Polish Zloty (2)
Pound Sterling 422 Pound Sterling (4,513)
Singapore Dollar 3 Singapore Dollar (173)
Swedish Kroner (1) Swedish Kroner (142)
Swiss Francs (1,244) Swiss Francs 8,557
United States Dollar 7,715 United States Dollar 94,617
(99,673) (107,924)
Algebris Macro Credit Fund Algebris Macro Credit Fund
as at 31 December 2019 as at 31 December 2018
EUR EUR
Australian Dollar (3,896) Australian Dollar (30)
Brazilian Real (4,857) Brazilian Real -
Canadian Dollar (12) Canadian Dollar -
Chinese Yuan Renminbi 1 Chinese Yuan Renminbi 1
Czech Koruna - Czech Koruna (5)
Egyptian Pound 342,257 Egyptian Pound -
Indonesian Rupiah 1,053,755 Indonesian Rupiah -
Japanese Yen (7) Japanese Yen (10)
Mexican Peso 1,447,938 Mexican Peso (92)
New Zealand Dollar 2 New Zealand Dollar 5
Norwegian Krone - Norwegian Krone -
Polish Zloty (27) Polish Zloty (51)
Pound Sterling (28,488) Pound Sterling (43,999)
Russian Ruble 321,876 Russian Ruble (14,089)
South African Rand 16 South African Rand (5)
Swedish Kroner 2,196 Swedish Kroner -
Swiss Francs (88) Swiss Francs 85
Turkey Lira 102,854 Turkey Lira 26
United States Dollar (258,185) United States Dollar 1,894,341
2,975,335 1,836,177

ALGEBRIS UCITS FUNDS PLC
Notes to the Financial Statements (continued)
for the financial year ended 31 December 2019
110
14. Risks associated with financial instruments (continued)
(a) Market risk (continued)
(ii) Currency risk (continued)
Algebris Core Italy Fund Algebris Core Italy Fund
as at 31 December 2019 as at 31 December 2018
EUR EUR
Japanese Yen (5) Japanese Yen -
Pound Sterling 65 Pound Sterling 552
Swiss Francs (17) Swiss Francs 72
United States Dollar (277) United States Dollar 347
(234) 971
Algebris Quant Arbitrage Fund Algebris Quant Arbitrage Fund
as at 31 December 2019 as at 31 December 2018
EUR EUR
Canadian Dollar 2 Canadian Dollar -
Danish Krone (10) Danish Krone -
Norwegian Krone (1) Norwegian Krone -
Pound Sterling 53 Pound Sterling (319)
Russian Ruble 3 Russian Ruble 2
South African Rand (1) South African Rand (1)
Swedish Kroner (5) Swedish Kroner -
Swiss Francs 54 Swiss Francs 206
United States Dollar (103) United States Dollar (3,643)
(8) (3,755)
Algebris IG Financial Credit Fund
as at 31 December 2019
EUR
Australian Dollar 152
Hong Kong Dollar (1)
Japanese Yen (538)
Pound Sterling 319
Singapore Dollar (2)
Swiss Francs (64)
United States Dollar 39
(95)
A 5% decrease in non-functional currencies in relation to the respective functional currency with all other variables
held constant, would lead to a corresponding decrease in the net assets attributable to holders of redeemable
participating shares by the approximate amounts as shown in the above tables. The estimated movement is based on
management’s determination of a reasonably possible change in foreign exchange rates. In practice, the actual results
may differ from the sensitivity analysis above and the difference could be material.

ALGEBRIS UCITS FUNDS PLC
Notes to the Financial Statements (continued)
for the financial year ended 31 December 2019
111
14. Risks associated with financial instruments (continued)
(a) Market risk (continued)
(iii) Interest rate risk
Interest rate risk is the risk that the fair value of future cash flows of a financial instrument will fluctuate because of
changes in market interest rates.
The Sub-Funds will be exposed to interest rate risk in several dimensions. Many of the Sub-Funds’ investments are subject
to fluctuations in value if interest rates change. In the case of many credit instruments that may be acquired by the Sub-
Funds, there is the further concern - as the issuers of such instruments are often in precarious financial condition - that the
likelihood of default on the instruments increases as interest rates rise. A summary of the Sub-Funds’ interest rate gap
position, analysed by the earlier of contractual re-pricing or maturity dates, is as follows:
Interest rate risk
Algebris Financial Credit Fund Less than 1 Month
More than No Stated Non-interest
as at 31 December 2019 1 month -1 year 1-5 years 5 years Maturity bearing Total
EUR EUR EUR EUR EUR EUR EUR
Assets
Financial assets at fair value
through profit or loss - - 10,583,973 624,917,029 3,647,143,921 40,827,540 4,323,472,463
Cash and cash equivalents 813,465,388 - - - - - 813,465,388
Due from brokers - - - - - 3,858 3,858
Due from members - - - - - 25,468,953 25,468,953
Accrued income and other receivables - - - - - 40,908,465 40,908,465
Total Financial Assets 813,465,388 - 10,583,973 624,917,029 3,647,143,921 107,208,816
5,203,319,127
Less than 1 Month
More than No Stated Non-interest
1 month -1 year 1-5 years 5 years Maturity bearing Total
EUR EUR EUR EUR EUR EUR EUR
Liabilities
Financial liabilities at fair
value through profit or loss - - - - - 8,546,824 8,546,824
Cash collateral received 11,139,602 - - - - - 11,139,602
Due to members - - - - - 5,533,554 5,533,554
Due to broker - - - - - 2,599 2,599
Directors’ fee payable - - - - - 6,541 6,541
Performance fee payable - - - - - 18,985,942 18,985,942
Investment management fee payable - - - - - 3,543,889 3,543,889
Administration fee payable - - - - - 113,369 113,369
Audit fee payable - - - - - 92,330 92,330
Depositary fee payable - - - - - 114,825 114,825
Accrued expenses and other payables - - - - - 426,940 426,940
Net assets attributable to holders of
redeemable participating shares - - - - - 5,154,812,712 5,154,812,712
Total Financial Liabilities 11,139,602 - - - - 5,192,179,525 5,203,319,127
Total interest sensitivity gap 802,325,786 - 10,583,973 624,917,029 3,647,143,921

ALGEBRIS UCITS FUNDS PLC
Notes to the Financial Statements (continued)
for the financial year ended 31 December 2019
112
14. Risks associated with financial instruments (continued)
(a) Market risk (continued)
(iii) Interest rate risk (continued)
Interest rate risk
Algebris Financial Credit Fund Less than 1 Month
More than No Stated Non-interest
as at 31 December 2018 1 month -1 year 1-5 years 5 years Maturity bearing Total
EUR EUR EUR EUR EUR EUR EUR
Assets
Financial assets at fair value
through profit or loss - - 9,290,640 407,288,882 3,573,683,081 37,311,591 4,027,574,194
Cash and cash equivalents 289,512,984 - - - - - 289,512,984
Cash collateral pledged 2,690,805 - - - - - 2,690,805
Due from brokers - - - - - 4,682 4,682
Due from members - - - - - 4,872,588 4,872,588
Accrued income and other receivables - - - - - 49,565,782 49,565,782
Total Financial Assets 292,203,789 - 9,290,640 407,288,882 3,573,683,081 91,754,643 4,374,221,035
Less than 1 Month
More than No Stated Non-interest
1 month -1 year 1-5 years 5 years Maturity bearing Total
EUR EUR EUR EUR EUR EUR EUR
Liabilities
Financial liabilities at fair
value through profit or loss - - - - - 9,263,654 9,263,654
Cash collateral received 10,066,145 - - - - - 10,066,145
Repurchase agreements - - - 5,215,764 - - 5,215,764
Due to members - - - - - 23,023,426 23,023,426
Due to broker - - - - - 12,998 12,998
Directors’ fee payable - - - - - 1,511 1,511
Investment management fee payable - - - - - 2,883,258 2,883,258
Administration fee payable - - - - - 95,269 95,269
Audit fee payable - - - - - 63,594 63,594
Depositary fee payable - - - - - 95,756 95,756
Accrued expenses and other payables - - - - - 185,770 185,770
Net assets attributable to holders of
redeemable participating shares - - - - - 4,323,313,890 4,323,313,890
Total Financial Liabilities 10,066,145 - - 5,215,764 - 4,358,939,126 4,374,221,035
Total interest sensitivity gap 282,137,644 - 9,290,640 402,073,118 3,573,683,081
At 31 December 2019 for Algebris Financial Credit Fund, if interest rates had been 50 basis points higher/lower with all
other variables held constant, the increase in net assets attributable to holders of redeemable participating shares would have
been EUR 21,413,225 (31 December 2018: EUR 19,951,313) higher/lower. This primarily arises from the increase/decrease
in the fair value of fixed interest securities. Any cash and cash equivalents held by the Company are held at short term
market rates and therefore are not exposed to significant amounts of interest rate risk and hence they have not been included
in the basis points movement calculation.
Interest rate risk
Algebris Financial Income Fund Less than 1 Month
More than No Stated Non-interest
as at 31 December 2019 1 month -1 year 1-5 years 5 years Maturity bearing Total
EUR EUR EUR EUR EUR EUR EUR
Assets
Financial assets at fair value
through profit or loss - - 2,070,683 36,764,348 208,126,111 130,583,259 377,544,401
Cash and cash equivalents 92,926,195 - - - - - 92,926,195
Cash collateral pledged 4,277,889 - - - - - 4,277,889
Due from broker - - - - - 579,064 579,064
Due from members - - - - - 2,707,341 2,707,341
Accrued income and other receivables - - - - - 2,620,740 2,620,740
Total Financial Assets 97,204,084 - 2,070,683 36,764,348 208,126,111 136,490,404 480,655,630
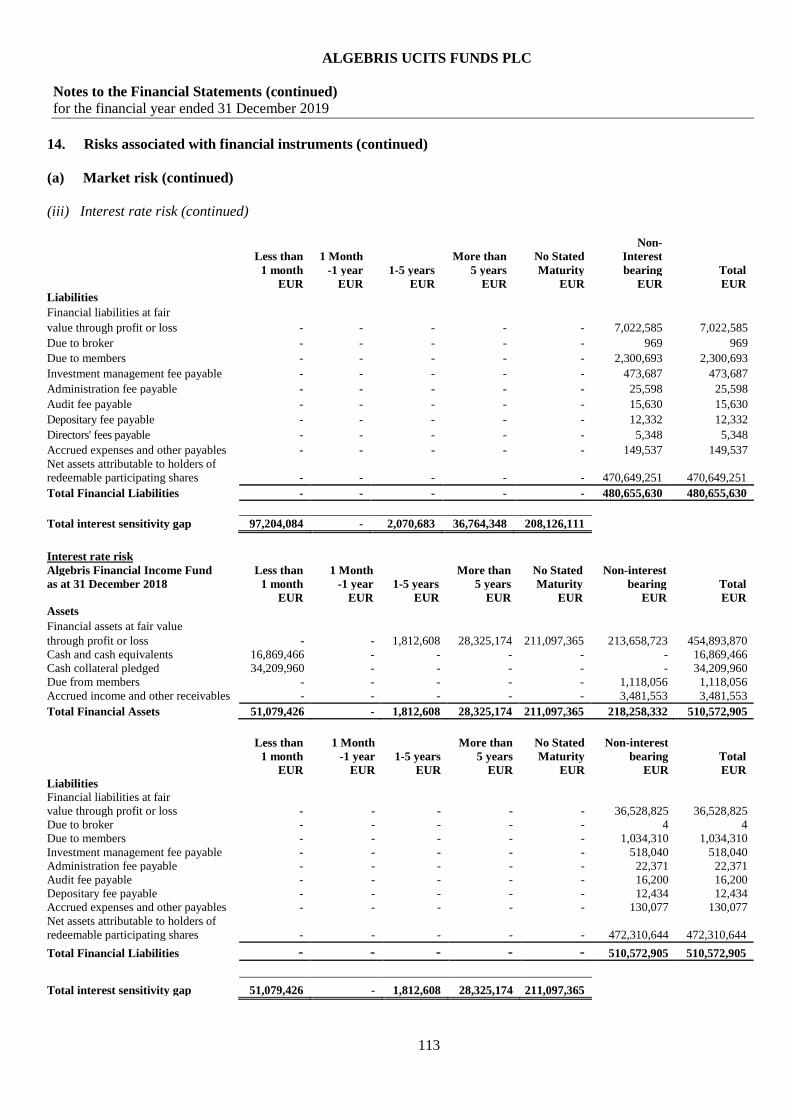
ALGEBRIS UCITS FUNDS PLC
Notes to the Financial Statements (continued)
for the financial year ended 31 December 2019
113
14. Risks associated with financial instruments (continued)
(a) Market risk (continued)
(iii) Interest rate risk (continued)
Less than 1 Month
More than No Stated
Non-
Interest
1 month -1 year 1-5 years 5 years Maturity bearing Total
EUR EUR EUR EUR EUR EUR EUR
Liabilities
Financial liabilities at fair
value through profit or loss - - - - - 7,022,585 7,022,585
Due to broker - - - - - 969 969
Due to members - - - - - 2,300,693 2,300,693
Investment management fee payable - - - - - 473,687 473,687
Administration fee payable - - - - - 25,598 25,598
Audit fee payable - - - - - 15,630 15,630
Depositary fee payable - - - - - 12,332 12,332
Directors' fees payable - - - - - 5,348 5,348
Accrued expenses and other payables - - - - - 149,537 149,537
Net assets attributable to holders of
redeemable participating shares - - - - - 470,649,251 470,649,251
Total Financial Liabilities - - - - - 480,655,630 480,655,630
Total interest sensitivity gap 97,204,084 - 2,070,683 36,764,348 208,126,111
Interest rate risk
Algebris Financial Income Fund Less than 1 Month
More than No Stated Non-interest
as at 31 December 2018 1 month -1 year 1-5 years 5 years Maturity bearing Total
EUR EUR EUR EUR EUR EUR EUR
Assets
Financial assets at fair value
through profit or loss - - 1,812,608 28,325,174 211,097,365 213,658,723 454,893,870
Cash and cash equivalents 16,869,466 - - - - - 16,869,466
Cash collateral pledged 34,209,960 - - - - - 34,209,960
Due from members - - - - - 1,118,056 1,118,056
Accrued income and other receivables - - - - - 3,481,553 3,481,553
Total Financial Assets 51,079,426 - 1,812,608 28,325,174 211,097,365 218,258,332 510,572,905
Less than 1 Month
More than No Stated Non-interest
1 month -1 year 1-5 years 5 years Maturity bearing Total
EUR EUR EUR EUR EUR EUR EUR
Liabilities
Financial liabilities at fair
value through profit or loss - - - - - 36,528,825 36,528,825
Due to broker - - - - - 4 4
Due to members - - - - - 1,034,310 1,034,310
Investment management fee payable - - - - - 518,040 518,040
Administration fee payable - - - - - 22,371 22,371
Audit fee payable - - - - - 16,200 16,200
Depositary fee payable - - - - - 12,434 12,434
Accrued expenses and other payables - - - - - 130,077 130,077
Net assets attributable to holders of
redeemable participating shares - - - - - 472,310,644 472,310,644
Total Financial Liabilities - - - - - 510,572,905 510,572,905
Total interest sensitivity gap 51,079,426 - 1,812,608 28,325,174 211,097,365

ALGEBRIS UCITS FUNDS PLC
Notes to the Financial Statements (continued)
for the financial year ended 31 December 2019
114
14. Risks associated with financial instruments (continued)
(a) Market risk (continued)
(iii) Interest rate risk (continued)
At 31 December 2019 for Algebris Financial Income Fund, if interest rates had been 50 basis points higher/lower with all
other variables held constant, the increase in net assets attributable to holders of redeemable participating shares would have
been EUR 1,234,806 (31 December 2018: EUR 1,206,176) higher/lower. This primarily arises from the increase/decrease in
the fair value of fixed interest securities. Any cash and cash equivalents held by the Company are held at short term market
rates and therefore are not exposed to significant amounts of interest rate risk and hence they have not been included in the
basis points movement calculation.
Interest rate risk
Algebris Allocation Fund Less than 1 Month
More than No Stated Non-interest
as at 31 December 2019 1 month -1 year 1-5 years 5 years Maturity bearing Total
EUR EUR EUR EUR EUR EUR EUR
Assets
Financial assets at fair value
through profit or loss - - - - - 8,666,008 8,666,008
Cash and cash equivalents 895,273 - - - - - 895,273
Due from members - - - - - 1,384 1,384
Accrued income and other receivables - - - - - 106,448 106,448
Total Financial Assets 895,273 - - - 8,773,840 9,669,113
Less than 1 Month
More than No Stated Non-interest
1 month -1 year 1-5 years 5 years Maturity bearing Total
EUR EUR EUR EUR EUR EUR EUR
Liabilities
Cash collateral received 4,908 - - - - - 4,908
Due to members - - - - - 9,297 9,297
Investment management fee payable - - - - - 7,303 7,303
Administration fee payable - - - - - 760 760
Audit fee payable - - - - - 259 259
Depositary fee payable - - - - - 248 248
Performance fee payable - - - - - 6 6
Directors' fees payable - - - - - 5,347 5,347
Accrued expenses and other payables - - - - - 39,586 39,586
Net assets attributable to holders of
redeemable participating shares - - - - - 9,601,399 9,601,399
Total Financial Liabilities 4,908 - - - - 9,664,205 9,669,113
Total interest sensitivity gap 890,365 - - - -
Interest rate risk
Algebris Allocation Fund Less than 1 Month
More than No Stated Non-interest
as at 31 December 2018 1 month -1 year 1-5 years 5 years Maturity bearing Total
EUR EUR EUR EUR EUR EUR EUR
Assets
Financial assets at fair value
through profit or loss - 3,254,259 557,831 239,833 1,958,186 4,968,649 10,978,758
Cash and cash equivalents 1,448,072 - - - - - 1,448,072
Cash collateral pledged 489,058 - - - - - 489,058
Due from members - - - - - 44,740 44,740
Accrued income and other receivables - - - - - 85,361 85,361
Total Financial Assets 1,937,130 3,254,259 557,831 239,833 1,958,186 5,098,750 13,045,989

ALGEBRIS UCITS FUNDS PLC
Notes to the Financial Statements (continued)
for the financial year ended 31 December 2019
115
14. Risks associated with financial instruments (continued)
(a) Market risk (continued)
(iii) Interest rate risk (continued)
Less than 1 Month
More than No Stated Non-interest
1 month -1 year 1-5 years 5 years Maturity bearing Total
EUR EUR EUR EUR EUR EUR EUR
Liabilities
Financial liabilities at fair
value through profit or loss - - - - - 841,908 841,908
Due to members - - - - - 22,653 22,653
Investment management fee payable - - - - - 18,275 18,275
Administration fee payable - - - - - 630 630
Audit fee payable - - - - - 300 300
Depositary fee payable - - - - - 314 314
Accrued expenses and other payables - - - - - 27,655 27,655
Net assets attributable to holders of
redeemable participating shares - - - - - 12,134,254 12,134,254
Total Financial Liabilities - - - - - 13,045,989 13,045,989
Total interest sensitivity gap 1,937,130 3,254,259 557,831 239,833 1,958,186
At 31 December 2019 for Algebris Allocation Fund, if interest rates had been 50 basis points higher/lower with all other
variables held constant, the increase in net assets attributable to holders of redeemable participating shares would have been
Nil (31 December 2018: EUR 30,051) higher/lower. This primarily arises from the increase/decrease in the fair value of
fixed interest securities. Any cash and cash equivalents held by the Company are held at short term market rates and
therefore are not exposed to significant amounts of interest rate risk and hence they have not been included in the basis
points movement calculation.
Interest rate risk
Algebris Financial Equity Fund Less than Month
More than No Stated Non-interest
as at 31 December 2019 1 month -1 year 1-5 years 5 years Maturity bearing Total
EUR EUR EUR EUR EUR EUR EUR
Assets
Financial assets at fair value through profit or loss - 12,712,524 - - - 43,767,915 56,480,439
Cash and cash equivalents 18,630,693 - - - - - 18,630,693
Due from broker - - - - - 94,073 94,073
Due from members - - - - - 52,445 52,445
Accrued income and other receivables - - - - - 22,762 22,762
Total Financial Assets 18,630,693 12,712,524 - - - 43,937,195 75,280,412

ALGEBRIS UCITS FUNDS PLC
Notes to the Financial Statements (continued)
for the financial year ended 31 December 2019
116
14. Risks associated with financial instruments (continued)
(a) Market risk (continued)
(iii) Interest rate risk (continued)
Less than 1 Month
More than No Stated Non-interest
1 month -1 year 1-5 years 5 years Maturity bearing Total
EUR EUR EUR EUR EUR EUR EUR
Liabilities
Financial liabilities at fair
value through profit or loss - - - - - 762,228 762,228
Cash collateral received 1,680,638 - - - - - 1,680,638
Performance fee payable - - - - - 274 274
Due to broker - - - - - 157 157
Due to members - - - - - 178,183 178,183
Investment management fee payable - - - - - 54,483 54,483
Administration fee payable - - - - - 7,679 7,679
Audit fee payable - - - - - 2,468 2,468
Directors' fee payable - - - - - 5,837 5,837
Depositary fee payable - - - - - 1,937 1,937
Accrued expenses and other payables - - - - - 40,672 40,672
Net assets attributable to holders of
redeemable participating shares - - - - - 72,545,856 72,545,856
Total Financial Liabilities 1,680,638 - - - - 73,599,774 75,280,412
Total interest sensitivity gap 16,950,055 12,712,524 - - -
Interest rate risk
Algebris Financial Equity Fund Less than 1 Month
More than No Stated Non-interest
as at 31 December 2018 1 month -1 year 1-5 years 5 years Maturity bearing Total
EUR EUR EUR EUR EUR EUR EUR
Assets
Financial assets at fair value through profit or loss - - - - - 78,142,175 78,142,175
Cash and cash equivalents 4,108,256 - - - - - 4,108,256
Cash collateral pledged 6,473,994 - - - - - 6,473,994
Due from broker - - - - - 708,936 708,936
Due from members - - - - - 275,818 275,818
Accrued income and other receivables - - - - - 59,472 59,472
Total Financial Assets 10,582,250 - - - - 79,186,401 89,768,651
Less than 1 Month
More than No Stated Non-interest
1 month -1 year 1-5 years 5 years Maturity bearing Total
EUR EUR EUR EUR EUR EUR EUR
Liabilities
Financial liabilities at fair
value through profit or loss - - - - - 9,249,934 9,249,934
Due to broker - - - - - 142 142
Due to members - - - - - 65,664 65,664
Investment management fee payable - - - - - 58,231 58,231
Administration fee payable - - - - - 7,936 7,936
Audit fee payable - - - - - 2,800 2,800
Directors' fee payable - - - - - 588 588
Depositary fee payable - - - - - 2,144 2,144
Accrued expenses and other payables - - - - - 92,430 92,430
Net assets attributable to holders of
redeemable participating shares - - - - - 80,288,782 80,288,782
Total Financial Liabilities - - - - - 89,768,651 89,768,651
Total interest sensitivity gap 10,582,250 - - - -
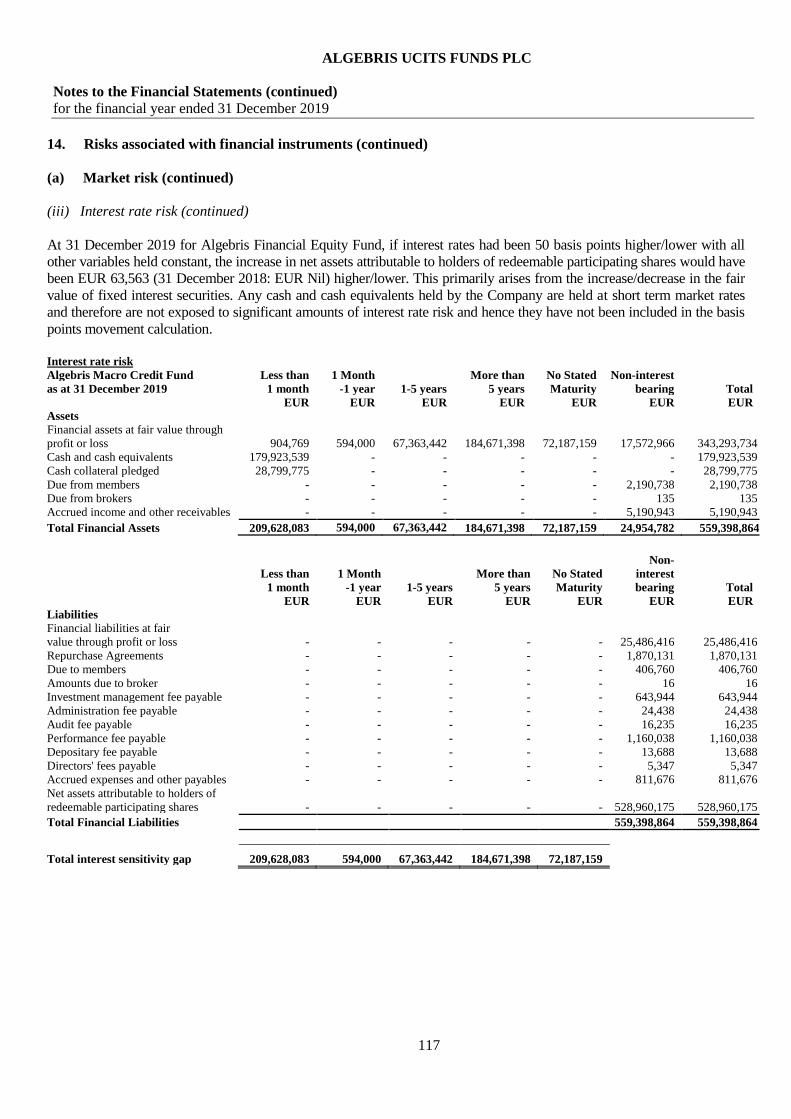
ALGEBRIS UCITS FUNDS PLC
Notes to the Financial Statements (continued)
for the financial year ended 31 December 2019
117
14. Risks associated with financial instruments (continued)
(a) Market risk (continued)
(iii) Interest rate risk (continued)
At 31 December 2019 for Algebris Financial Equity Fund, if interest rates had been 50 basis points higher/lower with all
other variables held constant, the increase in net assets attributable to holders of redeemable participating shares would have
been EUR 63,563 (31 December 2018: EUR Nil) higher/lower. This primarily arises from the increase/decrease in the fair
value of fixed interest securities. Any cash and cash equivalents held by the Company are held at short term market rates
and therefore are not exposed to significant amounts of interest rate risk and hence they have not been included in the basis
points movement calculation.
Interest rate risk
Algebris Macro Credit Fund Less than 1 Month
More than No Stated Non-interest
as at 31 December 2019 1 month -1 year 1-5 years 5 years Maturity bearing Total
EUR EUR EUR EUR EUR EUR EUR
Assets
Financial assets at fair value through
profit or loss 904,769 594,000 67,363,442 184,671,398 72,187,159 17,572,966 343,293,734
Cash and cash equivalents 179,923,539 - - - - - 179,923,539
Cash collateral pledged 28,799,775 - - - - - 28,799,775
Due from members - - - - - 2,190,738 2,190,738
Due from brokers - - - - - 135 135
Accrued income and other receivables - - - - - 5,190,943 5,190,943
Total Financial Assets 209,628,083 594,000 67,363,442 184,671,398 72,187,159 24,954,782 559,398,864
Less than 1 Month
More than No Stated
Non-
interest
1 month -1 year 1-5 years 5 years Maturity bearing Total
EUR EUR EUR EUR EUR EUR EUR
Liabilities
Financial liabilities at fair
value through profit or loss - - - - - 25,486,416 25,486,416
Repurchase Agreements - - - - - 1,870,131 1,870,131
Due to members - - - - - 406,760 406,760
Amounts due to broker - - - - - 16 16
Investment management fee payable - - - - - 643,944 643,944
Administration fee payable - - - - - 24,438 24,438
Audit fee payable - - - - - 16,235 16,235
Performance fee payable - - - - - 1,160,038 1,160,038
Depositary fee payable - - - - - 13,688 13,688
Directors' fees payable - - - - - 5,347 5,347
Accrued expenses and other payables - - - - - 811,676 811,676
Net assets attributable to holders of
redeemable participating shares - - - - - 528,960,175 528,960,175
Total Financial Liabilities 559,398,864 559,398,864
Total interest sensitivity gap 209,628,083 594,000 67,363,442 184,671,398 72,187,159

ALGEBRIS UCITS FUNDS PLC
Notes to the Financial Statements (continued)
for the financial year ended 31 December 2019
118
14. Risks associated with financial instruments (continued)
(a) Market risk (continued)
(iii) Interest rate risk (continued)
Interest rate risk
Algebris Macro Credit Fund Less than 1 Month
More than No Stated Non-interest
as at 31 December 2018 1 month -1 year 1-5 years 5 years Maturity bearing Total
EUR EUR EUR EUR EUR EUR EUR
Assets
Financial assets at fair value through profit or loss - 3,623,797 215,227,583 124,270,147 277,171,584 40,063,155 660,356,266
Cash and cash equivalents 63,624,139 - - - - - 63,624,139
Cash collateral pledged 45,324,019 - - - - - 45,324,019
Due from members - - - - - 75,833 75,833
Accrued income and other
receivables - - - - - 10,128,360 10,128,360
Total Financial Assets 108,948,158 3,623,797 215,227,583 124,270,147 277,171,584 50,267,348 779,508,617
Less than 1 Month
More than No Stated Non-interest
1 month -1 year 1-5 years 5 years Maturity bearing Total
EUR EUR EUR EUR EUR EUR EUR
Liabilities
Financial liabilities at fair
value through profit or loss - - - - - 25,380,059 25,380,059
Cash collateral received 2,690,000 - - - - - 2,690,000
Repurchase Agreements - - 22,653,079 19,926,152 - - 42,579,231
Due to members - - - - - 3,587,074 3,587,074
Investment management fee payable - - - - - 835,705 835,705
Administration fee payable - - - - - 27,641 27,641
Audit fee payable - - - - - 19,000 19,000
Depositary fee payable - - - - - 17,837 17,837
Accrued expenses and other payables - - - - - 276,742 276,742
Net assets attributable to holders of
redeemable participating shares - - - - - 704,095,328 704,095,328
Total Financial Liabilities 2,690,000 - 22,653,079 19,926,152 - 734,239,386 779,508,617
Total interest sensitivity gap 106,258,158 3,623,797 192,574,504 104,343,995 277,171,584
At 31 December 2019 for Algebris Macro Credit Fund, if interest rates had been 50 basis points higher/lower with all other
variables held constant, the increase in net assets attributable to holders of redeemable participating shares would have been
EUR 1,628,604 (31 December 2018: EUR 3,101,466) higher/lower. This primarily arises from the increase/decrease in the
fair value of fixed interest securities. Any cash and cash equivalents held by the Company are held at short term market rates
and therefore are not exposed to significant amounts of interest rate risk and hence they have not been included in the basis
points movement calculation.
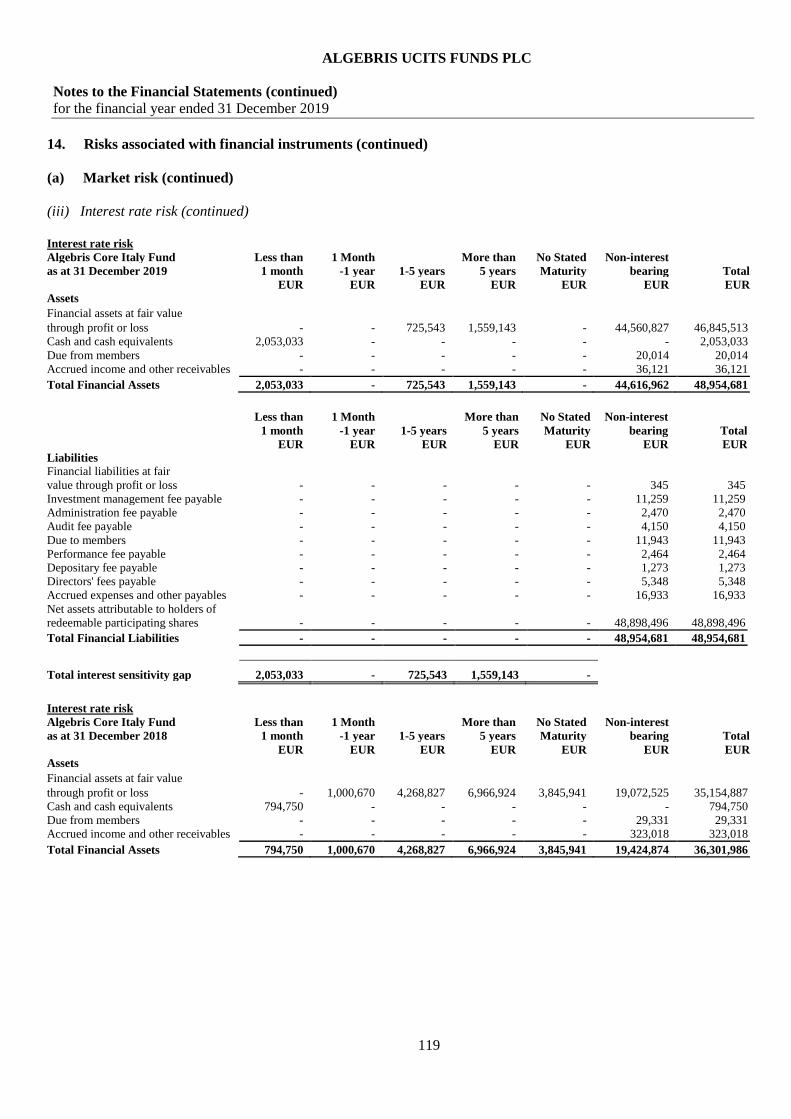
ALGEBRIS UCITS FUNDS PLC
Notes to the Financial Statements (continued)
for the financial year ended 31 December 2019
119
14. Risks associated with financial instruments (continued)
(a) Market risk (continued)
(iii) Interest rate risk (continued)
Interest rate risk
Algebris Core Italy Fund Less than 1 Month
More than No Stated Non-interest
as at 31 December 2019 1 month -1 year 1-5 years 5 years Maturity bearing Total
EUR EUR EUR EUR EUR EUR EUR
Assets
Financial assets at fair value through profit or loss - - 725,543 1,559,143 - 44,560,827 46,845,513
Cash and cash equivalents 2,053,033 - - - - - 2,053,033
Due from members - - - - - 20,014 20,014
Accrued income and other receivables - - - - - 36,121 36,121
Total Financial Assets 2,053,033 - 725,543 1,559,143 - 44,616,962 48,954,681
Less than 1 Month
More than No Stated Non-interest
1 month -1 year 1-5 years 5 years Maturity bearing Total
EUR EUR EUR EUR EUR EUR EUR
Liabilities
Financial liabilities at fair
value through profit or loss - - - - - 345 345
Investment management fee payable - - - - - 11,259 11,259
Administration fee payable - - - - - 2,470 2,470
Audit fee payable - - - - - 4,150 4,150
Due to members - - - - - 11,943 11,943
Performance fee payable - - - - - 2,464 2,464
Depositary fee payable - - - - - 1,273 1,273
Directors' fees payable - - - - - 5,348 5,348
Accrued expenses and other payables - - - - - 16,933 16,933
Net assets attributable to holders of
redeemable participating shares - - - - - 48,898,496 48,898,496
Total Financial Liabilities - - - - - 48,954,681 48,954,681
Total interest sensitivity gap 2,053,033 - 725,543 1,559,143 -
Interest rate risk
Algebris Core Italy Fund Less than 1 Month
More than No Stated Non-interest
as at 31 December 2018 1 month -1 year 1-5 years 5 years Maturity bearing Total
EUR EUR EUR EUR EUR EUR EUR
Assets
Financial assets at fair value through profit or loss - 1,000,670 4,268,827 6,966,924 3,845,941 19,072,525 35,154,887
Cash and cash equivalents 794,750 - - - - - 794,750
Due from members - - - - - 29,331 29,331
Accrued income and other receivables - - - - - 323,018 323,018
Total Financial Assets 794,750 1,000,670 4,268,827 6,966,924 3,845,941 19,424,874 36,301,986

ALGEBRIS UCITS FUNDS PLC
Notes to the Financial Statements (continued)
for the financial year ended 31 December 2019
120
14. Risks associated with financial instruments (continued)
(a) Market risk (continued)
(iii) Interest rate risk (continued)
Less than 1 Month
More than No Stated Non-interest
1 month -1 year 1-5 years 5 years Maturity bearing Total
EUR EUR EUR EUR EUR EUR EUR
Liabilities
Financial liabilities at fair
value through profit or loss - - - - - 279 279
Repurchase Agreements - - 271,624 - - - 271,624
Investment management fee payable - - - - - 7,935 7,935
Administration fee payable - - - - - 1,644 1,644
Audit fee payable - - - - - 4,357 4,357
Depositary fee payable - - - - - 922 922
Accrued expenses and other payables - - - - - 19,715 19,715
Net assets attributable to holders of
redeemable participating shares - - - - - 35,995,510 35,995,510
Total Financial Liabilities - - 271,624 - - 36,030,362 36,301,986
Total interest sensitivity gap 794,750 1,000,670 3,997,203 6,966,924 3,845,941
At 31 December 2019 for Algebris Core Italy Fund, if interest rates had been 50 basis points higher/lower with all other
variables held constant, the increase in net assets attributable to holders of redeemable participating shares would have been
EUR 11,423 (31 December 2018: EUR 80,412) higher/lower. This primarily arises from the increase/decrease in the fair
value of fixed interest securities. Any cash and cash equivalents held by the Company are held at short term market rates
and therefore are not exposed to significant amounts of interest rate risk and hence they have not been included in the basis
points movement calculation.
Interest rate risk
Algebris Quant Arbitrage Fund Less than 1 Month
More than No Stated Non-interest
as at 31 December 2019 1 month -1 year 1-5 years 5 years Maturity bearing Total
EUR EUR EUR EUR EUR EUR EUR
Assets
Financial assets at fair value through profit or loss - 23,314,279 - - - 2 23,314,281
Cash and cash equivalents 11,914,445 - - - - - 11,914,445
Cash collateral pledged 2,688 - - - - - 2,688
Due from brokers - - - - - 9,405 9,405
Due from members - - - - - 43,280 43,280
Accrued income and other receivables - - - - - 104,490 104,490
Total Financial Assets 11,917,133 23,314,279 - - - 157,177 35,388,589
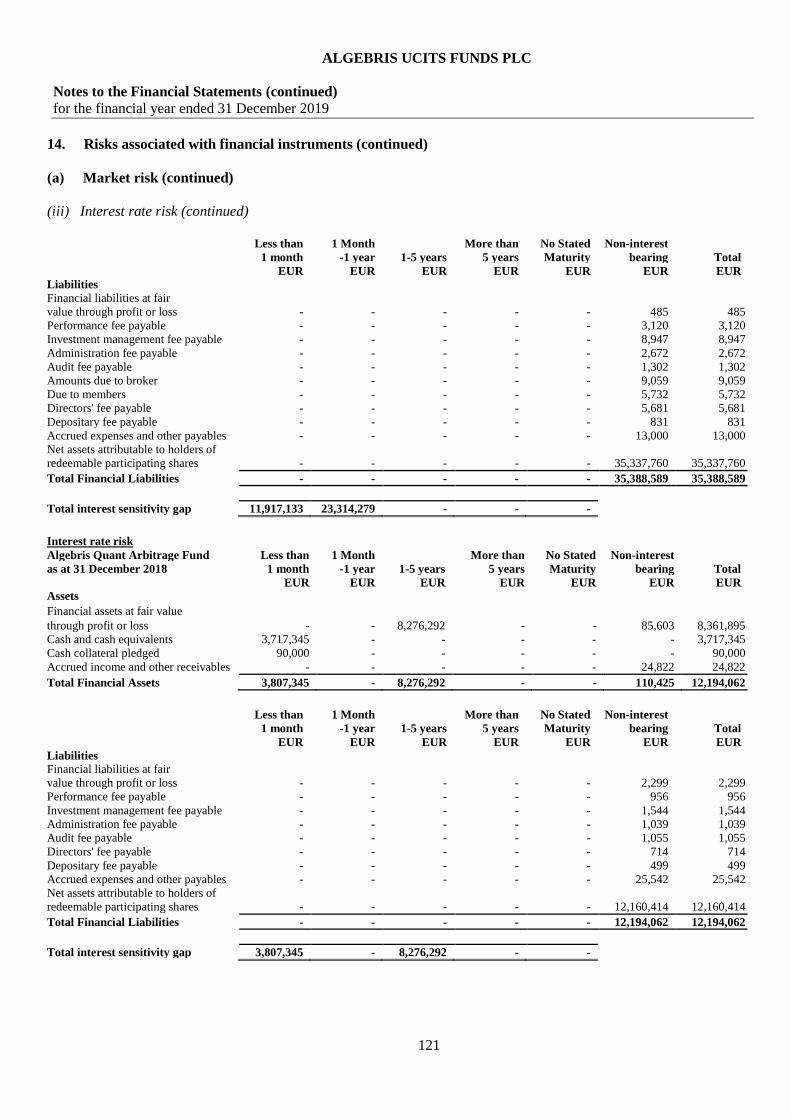
ALGEBRIS UCITS FUNDS PLC
Notes to the Financial Statements (continued)
for the financial year ended 31 December 2019
121
14. Risks associated with financial instruments (continued)
(a) Market risk (continued)
(iii) Interest rate risk (continued)
Less than 1 Month
More than No Stated Non-interest
1 month -1 year 1-5 years 5 years Maturity bearing Total
EUR EUR EUR EUR EUR EUR EUR
Liabilities
Financial liabilities at fair
value through profit or loss - - - - - 485 485
Performance fee payable - - - - - 3,120 3,120
Investment management fee payable - - - - - 8,947 8,947
Administration fee payable - - - - - 2,672 2,672
Audit fee payable - - - - - 1,302 1,302
Amounts due to broker - - - - - 9,059 9,059
Due to members - - - - - 5,732 5,732
Directors' fee payable - - - - - 5,681 5,681
Depositary fee payable - - - - - 831 831
Accrued expenses and other payables - - - - - 13,000 13,000
Net assets attributable to holders of
redeemable participating shares - - - - - 35,337,760 35,337,760
Total Financial Liabilities - - - - - 35,388,589 35,388,589
Total interest sensitivity gap 11,917,133 23,314,279 - - -
Interest rate risk
Algebris Quant Arbitrage Fund Less than 1 Month
More than No Stated Non-interest
as at 31 December 2018 1 month -1 year 1-5 years 5 years Maturity bearing Total
EUR EUR EUR EUR EUR EUR EUR
Assets
Financial assets at fair value through profit or loss - - 8,276,292 - - 85,603 8,361,895
Cash and cash equivalents 3,717,345 - - - - - 3,717,345
Cash collateral pledged 90,000 - - - - - 90,000
Accrued income and other receivables - - - - - 24,822 24,822
Total Financial Assets 3,807,345 - 8,276,292 - - 110,425 12,194,062
Less than 1 Month
More than No Stated Non-interest
1 month -1 year 1-5 years 5 years Maturity bearing Total
EUR EUR EUR EUR EUR EUR EUR
Liabilities
Financial liabilities at fair
value through profit or loss - - - - - 2,299 2,299
Performance fee payable - - - - - 956 956
Investment management fee payable - - - - - 1,544 1,544
Administration fee payable - - - - - 1,039 1,039
Audit fee payable - - - - - 1,055 1,055
Directors' fee payable - - - - - 714 714
Depositary fee payable - - - - - 499 499
Accrued expenses and other payables - - - - - 25,542 25,542
Net assets attributable to holders of
redeemable participating shares - - - - - 12,160,414 12,160,414
Total Financial Liabilities - - - - - 12,194,062 12,194,062
Total interest sensitivity gap 3,807,345 - 8,276,292 - -
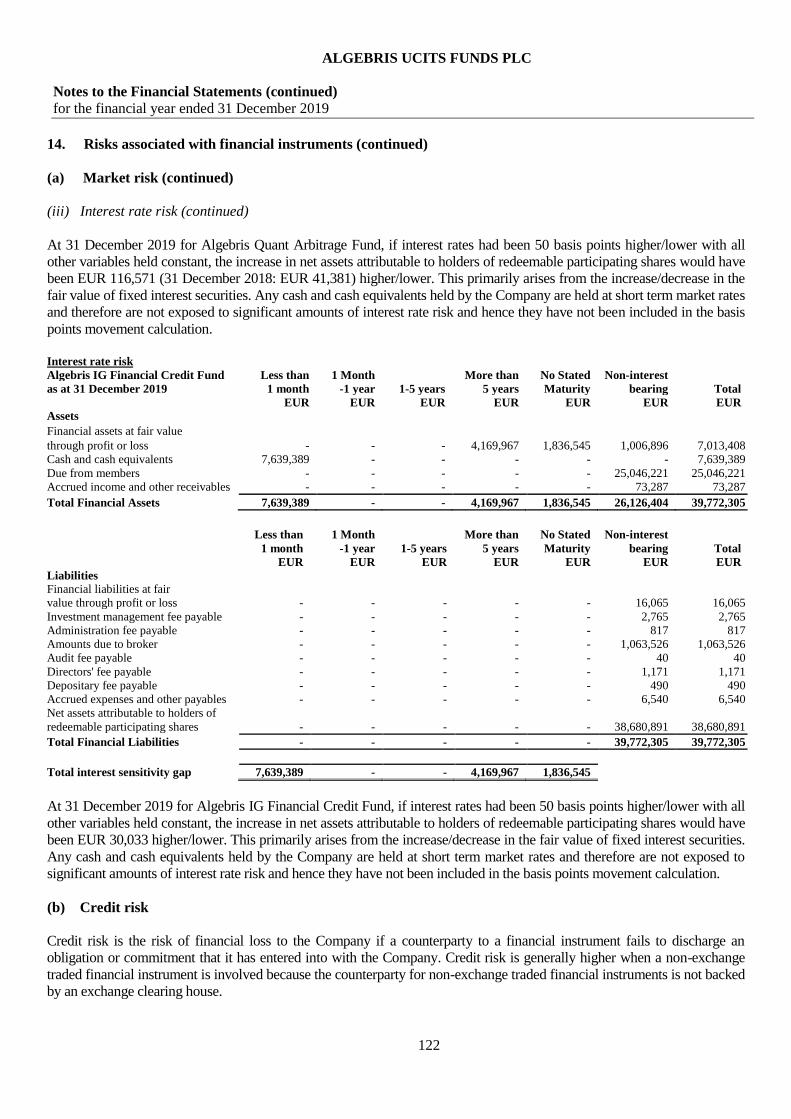
ALGEBRIS UCITS FUNDS PLC
Notes to the Financial Statements (continued)
for the financial year ended 31 December 2019
122
14. Risks associated with financial instruments (continued)
(a) Market risk (continued)
(iii) Interest rate risk (continued)
At 31 December 2019 for Algebris Quant Arbitrage Fund, if interest rates had been 50 basis points higher/lower with all
other variables held constant, the increase in net assets attributable to holders of redeemable participating shares would have
been EUR 116,571 (31 December 2018: EUR 41,381) higher/lower. This primarily arises from the increase/decrease in the
fair value of fixed interest securities. Any cash and cash equivalents held by the Company are held at short term market rates
and therefore are not exposed to significant amounts of interest rate risk and hence they have not been included in the basis
points movement calculation.
Interest rate risk
Algebris IG Financial Credit Fund Less than 1 Month
More than No Stated Non-interest
as at 31 December 2019 1 month -1 year 1-5 years 5 years Maturity bearing Total
EUR EUR EUR EUR EUR EUR EUR
Assets
Financial assets at fair value through profit or loss - - - 4,169,967 1,836,545 1,006,896 7,013,408
Cash and cash equivalents 7,639,389 - - - - - 7,639,389
Due from members - - - - - 25,046,221 25,046,221
Accrued income and other receivables - - - - - 73,287 73,287
Total Financial Assets 7,639,389 - - 4,169,967 1,836,545 26,126,404 39,772,305
Less than 1 Month
More than No Stated Non-interest
1 month -1 year 1-5 years 5 years Maturity bearing Total
EUR EUR EUR EUR EUR EUR EUR
Liabilities
Financial liabilities at fair
value through profit or loss - - - - - 16,065 16,065
Investment management fee payable - - - - - 2,765 2,765
Administration fee payable - - - - - 817 817
Amounts due to broker - - - - - 1,063,526 1,063,526
Audit fee payable - - - - - 40 40
Directors' fee payable - - - - - 1,171 1,171
Depositary fee payable - - - - - 490 490
Accrued expenses and other payables - - - - - 6,540 6,540
Net assets attributable to holders of
redeemable participating shares - - - - - 38,680,891 38,680,891
Total Financial Liabilities - - - - - 39,772,305 39,772,305
Total interest sensitivity gap 7,639,389 - - 4,169,967 1,836,545
At 31 December 2019 for Algebris IG Financial Credit Fund, if interest rates had been 50 basis points higher/lower with all
other variables held constant, the increase in net assets attributable to holders of redeemable participating shares would have
been EUR 30,033 higher/lower. This primarily arises from the increase/decrease in the fair value of fixed interest securities.
Any cash and cash equivalents held by the Company are held at short term market rates and therefore are not exposed to
significant amounts of interest rate risk and hence they have not been included in the basis points movement calculation.
(b) Credit risk
Credit risk is the risk of financial loss to the Company if a counterparty to a financial instrument fails to discharge an
obligation or commitment that it has entered into with the Company. Credit risk is generally higher when a non-exchange
traded financial instrument is involved because the counterparty for non-exchange traded financial instruments is not backed
by an exchange clearing house.

ALGEBRIS UCITS FUNDS PLC
Notes to the Financial Statements (continued)
for the financial year ended 31 December 2019
123
14. Risks associated with financial instruments (continued)
(b) Credit risk (continued)
Higher yielding debt securities are generally unsecured and may be subordinated to certain other outstanding securities and
obligations of the issuer, which may be secured on substantially all of the issuer’s assets. The lower rating of debt
obligations in the higher-yielding sector reflects a greater probability that adverse changes in the financial condition of the
issuer or in general economic conditions or both may impair the ability of the issuer to make payments of principal and
interest. Non-investment grade debt securities may not be protected by financial covenants or limitations on additional
indebtedness.
The analysis below summarises the credit quality of the Sub-Fund’s debt portfolio as at 31 December as rated by
Standard & Poor’s.
Debt securities by rating category Algebris Financial Credit Fund Algebris Financial Income Fund
2019 2018 2019 2018
B - 4.39% - 5.04%
B- 0.59% 0.55% - -
B+ 12.05% 9.30% 10.98% 6.51%
BB 15.64%
% 15.24% 19.04% 13.56%
BB- 15.06% 15.37% 8.69% 9.25%
BB+ 14.92% 12.24% 6.83% 14.13%
BBB+ 0.35% 0.01% - -
BBB 0.73% 0.37% 1.66% 3.00%
BBB- 8.08% 9.20% 11.87% 7.99%
B1(Moody's) 0.39% - - -
B1u (Moody’s) - 4.26% - 5.42%
B2 (Moody's) - 1.04% - 1.03%
Ba1 (Moody's) 10.03% 8.93% 11.34% 10.51%
Ba1u (Moody's) 1.74% 1.56% 3.86% 5.14%
Ba2 (Moody's) 4.75% 4.55% 3.03% 3.88%
Ba3 (Moody's) 1.06% 0.05% 2.89% 0.27%
Ba3u(Moody's) 3.72% - 5.69% -
Baa3 (Moody's) 4.23% 5.04% 1.84% 3.92%
CCC+ - - 0.81% -
Caa1(Moody's) - - 0.27% -
Caa2 (Moody's) - - - 0.61%
B+ (Fitch) 1.62% 3.48% 0.99% 0.94%
BB- (Fitch) 0.34% 0.44% 0.75% 0.92%
NR 4.70% 3.98% 9.46% 7.88%
Total 100.00% 100.00% 100.00% 100.00%
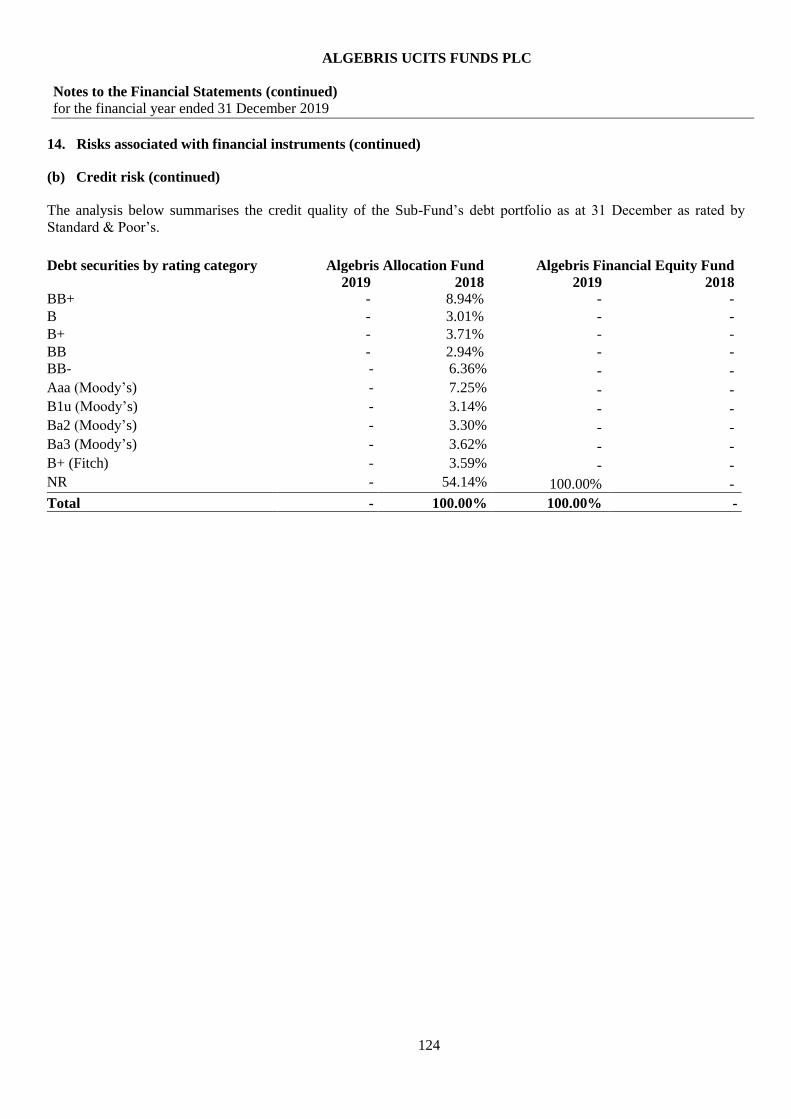
ALGEBRIS UCITS FUNDS PLC
Notes to the Financial Statements (continued)
for the financial year ended 31 December 2019
124
14. Risks associated with financial instruments (continued)
(b) Credit risk (continued)
The analysis below summarises the credit quality of the Sub-Fund’s debt portfolio as at 31 December as rated by
Standard & Poor’s.
Debt securities by rating category Algebris Allocation Fund Algebris Financial Equity Fund
2019 2018 2019 2018
BB+ - 8.94% - -
B - 3.01% - -
B+ - 3.71% - -
BB - 2.94% - -
BB- - 6.36% - -
Aaa (Moody’s) - 7.25% - -
B1u (Moody’s) - 3.14% - -
Ba2 (Moody’s) - 3.30% - -
Ba3 (Moody’s) - 3.62% - -
B+ (Fitch) - 3.59% - -
NR - 54.14% 100.00% -
Total - 100.00% 100.00% -

ALGEBRIS UCITS FUNDS PLC
Notes to the Financial Statements (continued)
for the financial year ended 31 December 2019
125
14. Risks associated with financial instruments (continued)
(b) Credit risk (continued)
The analysis below summarises the credit quality of the Sub-Fund’s debt portfolio as at 31 December as rated by
Standard & Poor’s.
Debt securities by rating category Algebris Macro Credit Fund Algebris Core Italy Fund
2019 2018 2019 2018 (P)B - 0.38% - 2.27% A- 18.20% - - - AAA 0.56% - - - B+ *- - - 12.24% - B+ 1.99% 6.63% - 5.32% B 10.60% 15.23% - 7.55% B- 10.31% 10.30% - - BB+ 0.73% 0.74% - 3.26% BB 5.05% 6.23% - 3.02% BB- 5.43% 12.03% - 21.26% BBB 1.94% - - - BBB+ 3.62% - - - BBB- 1.20% 0.33% - - CC 0.12% - - - CCC 2.04% - 4.38% - CCC+ 5.85% 0.70% - - CCC- 1.33% 0.46% - - D 0.72% 0.39% - 0.42% Aaa (Moody’s) - 11.89% - 5.48% B1 (Moody’s) - 0.41% - - B1u (Moody’s) 1.75% 4.99% - 8.22% B2 (Moody’s) - 3.68% - - B2u (Moody’s) - 1.38% - - B3 (Moody’s) 1.01% 0.51% - 3.2% Ba1 (Moody’s) 0.96% 5.76% - - Ba1u (Moody’s) - 0.99% - - Ba2 (Moody’s) - 2.58% - 2.52% Baa2(Moody's) 1.10% - - - Ba3 (Moody’s) - 0.85% - - Ba3u(Moody's) 2.03% - - - Baa3 (Moody’s) 1.85% 0.29% - - Baa3u (Moody’s) - 2.36% - - Caa1 (Moody’s) 4.02% 0.36% 10.34% - Caa1 *+(Moody's) 0.57% - - - Caa2 (Moody’s) - 0.69% - 5.52% WR 0.15% - 1.43% - B (Fitch) 2.33% 1.53% - - B+ (Fitch) - 0.53% - - BB (Fitch) - 0.9% - - BB- (Fitch) - 0.16% - 3.08% BBB- (Fitch) - - - 7.55% CC (Fitch) - 0.29% - - WD (Fitch) 0.17% - - - NR 14.37% 6.43% 71.61% 21.33%
Total 100.00% 100.00% 100.00% 100.00%
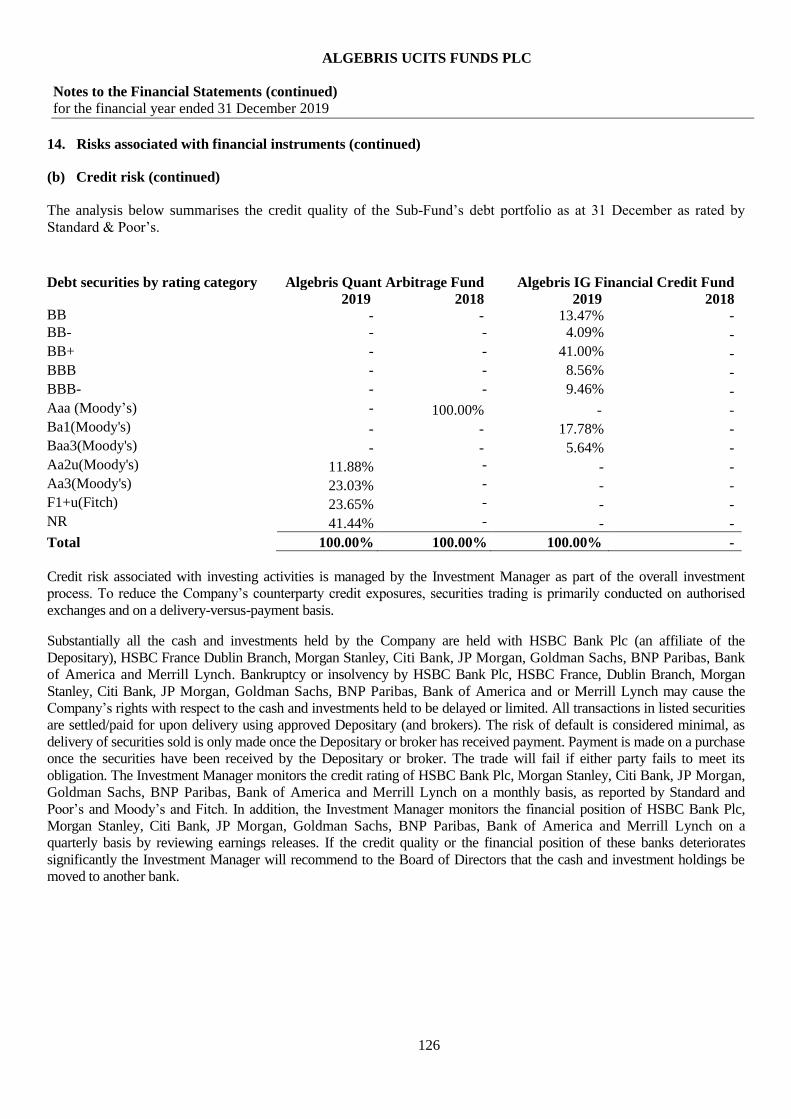
ALGEBRIS UCITS FUNDS PLC
Notes to the Financial Statements (continued)
for the financial year ended 31 December 2019
126
14. Risks associated with financial instruments (continued)
(b) Credit risk (continued)
The analysis below summarises the credit quality of the Sub-Fund’s debt portfolio as at 31 December as rated by
Standard & Poor’s.
Debt securities by rating category Algebris Quant Arbitrage Fund Algebris IG Financial Credit Fund
2019 2018 2019 2018 BB - - 13.47% -
BB- - - 4.09% -
BB+ - - 41.00% -
BBB - - 8.56% -
BBB- - - 9.46% -
Aaa (Moody’s) - 100.00% - -
Ba1(Moody's) - - 17.78% -
Baa3(Moody's) - - 5.64% -
Aa2u(Moody's) 11.88% - - -
Aa3(Moody's) 23.03% - - -
F1+u(Fitch) 23.65% - - -
NR 41.44% - - -
Total 100.00% 100.00% 100.00% -
Credit risk associated with investing activities is managed by the Investment Manager as part of the overall investment
process. To reduce the Company’s counterparty credit exposures, securities trading is primarily conducted on authorised
exchanges and on a delivery-versus-payment basis.
Substantially all the cash and investments held by the Company are held with HSBC Bank Plc (an affiliate of the
Depositary), HSBC France Dublin Branch, Morgan Stanley, Citi Bank, JP Morgan, Goldman Sachs, BNP Paribas, Bank
of America and Merrill Lynch. Bankruptcy or insolvency by HSBC Bank Plc, HSBC France, Dublin Branch, Morgan
Stanley, Citi Bank, JP Morgan, Goldman Sachs, BNP Paribas, Bank of America and or Merrill Lynch may cause the
Company’s rights with respect to the cash and investments held to be delayed or limited. All transactions in listed securities
are settled/paid for upon delivery using approved Depositary (and brokers). The risk of default is considered minimal, as
delivery of securities sold is only made once the Depositary or broker has received payment. Payment is made on a purchase
once the securities have been received by the Depositary or broker. The trade will fail if either party fails to meet its
obligation. The Investment Manager monitors the credit rating of HSBC Bank Plc, Morgan Stanley, Citi Bank, JP Morgan,
Goldman Sachs, BNP Paribas, Bank of America and Merrill Lynch on a monthly basis, as reported by Standard and
Poor’s and Moody’s and Fitch. In addition, the Investment Manager monitors the financial position of HSBC Bank Plc,
Morgan Stanley, Citi Bank, JP Morgan, Goldman Sachs, BNP Paribas, Bank of America and Merrill Lynch on a
quarterly basis by reviewing earnings releases. If the credit quality or the financial position of these banks deteriorates
significantly the Investment Manager will recommend to the Board of Directors that the cash and investment holdings be
moved to another bank.
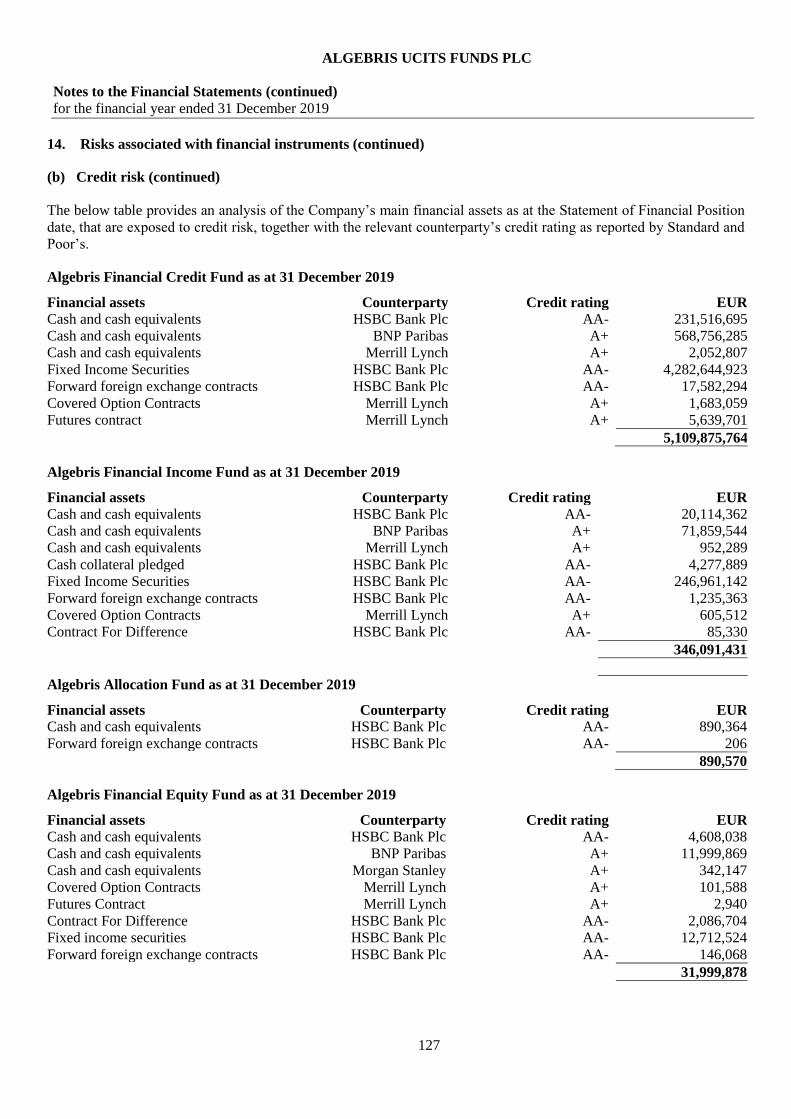
ALGEBRIS UCITS FUNDS PLC
Notes to the Financial Statements (continued)
for the financial year ended 31 December 2019
127
14. Risks associated with financial instruments (continued)
(b) Credit risk (continued)
The below table provides an analysis of the Company’s main financial assets as at the Statement of Financial Position
date, that are exposed to credit risk, together with the relevant counterparty’s credit rating as reported by Standard and
Poor’s.
Algebris Financial Credit Fund as at 31 December 2019
Financial assets Counterparty Credit rating EUR Cash and cash equivalents HSBC Bank Plc AA- 231,516,695
Cash and cash equivalents BNP Paribas A+ 568,756,285
Cash and cash equivalents Merrill Lynch A+ 2,052,807
Fixed Income Securities HSBC Bank Plc AA- 4,282,644,923
Forward foreign exchange contracts HSBC Bank Plc AA- 17,582,294
Covered Option Contracts Merrill Lynch A+ 1,683,059
Futures contract Merrill Lynch A+ 5,639,701
5,109,875,764
Algebris Financial Income Fund as at 31 December 2019
Financial assets Counterparty Credit rating EUR Cash and cash equivalents HSBC Bank Plc AA- 20,114,362
Cash and cash equivalents BNP Paribas A+ 71,859,544
Cash and cash equivalents Merrill Lynch A+ 952,289
Cash collateral pledged HSBC Bank Plc AA- 4,277,889
Fixed Income Securities HSBC Bank Plc AA- 246,961,142
Forward foreign exchange contracts HSBC Bank Plc AA- 1,235,363
Covered Option Contracts Merrill Lynch A+ 605,512
Contract For Difference HSBC Bank Plc AA- 85,330
346,091,431
Algebris Allocation Fund as at 31 December 2019
Financial assets Counterparty Credit rating EUR Cash and cash equivalents HSBC Bank Plc AA- 890,364
Forward foreign exchange contracts HSBC Bank Plc AA- 206
890,570
Algebris Financial Equity Fund as at 31 December 2019
Financial assets Counterparty Credit rating EUR Cash and cash equivalents HSBC Bank Plc AA- 4,608,038
Cash and cash equivalents BNP Paribas A+ 11,999,869
Cash and cash equivalents Morgan Stanley A+ 342,147
Covered Option Contracts Merrill Lynch A+ 101,588
Futures Contract Merrill Lynch A+ 2,940
Contract For Difference HSBC Bank Plc AA- 2,086,704
Fixed income securities HSBC Bank Plc AA- 12,712,524
Forward foreign exchange contracts HSBC Bank Plc AA- 146,068
31,999,878
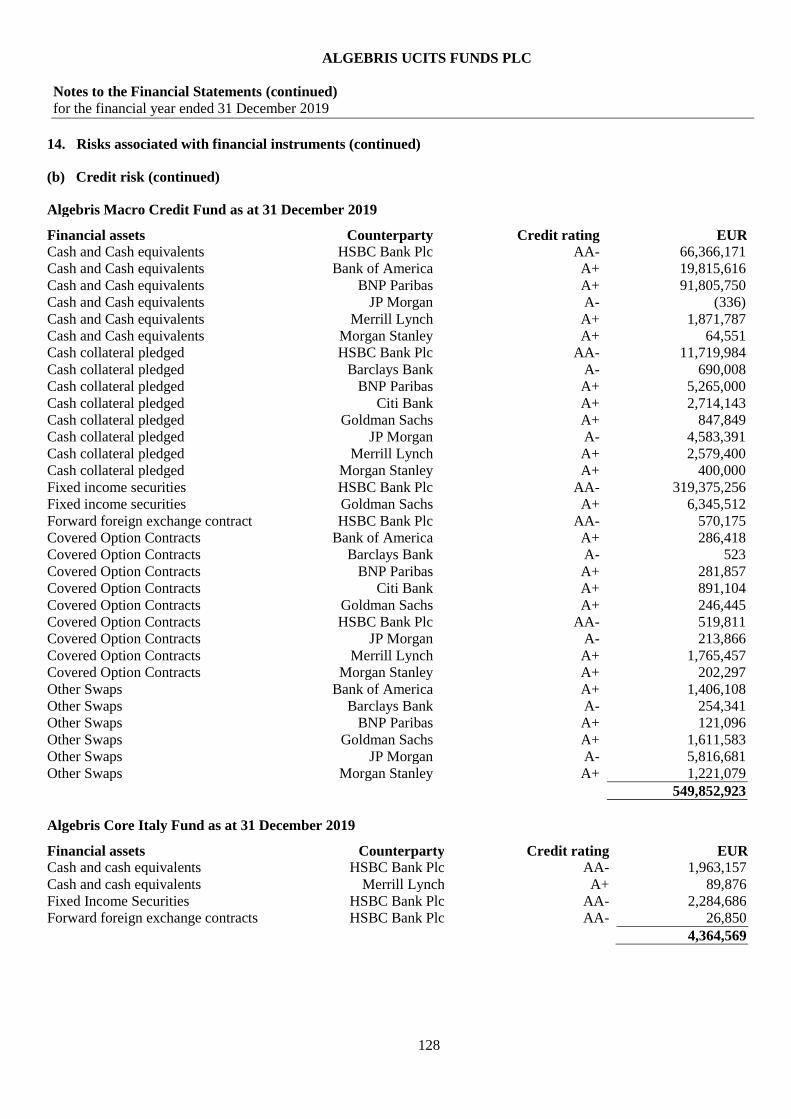
ALGEBRIS UCITS FUNDS PLC
Notes to the Financial Statements (continued)
for the financial year ended 31 December 2019
128
14. Risks associated with financial instruments (continued)
(b) Credit risk (continued)
Algebris Macro Credit Fund as at 31 December 2019
Financial assets Counterparty Credit rating EUR Cash and Cash equivalents HSBC Bank Plc AA- 66,366,171
Cash and Cash equivalents Bank of America A+ 19,815,616
Cash and Cash equivalents BNP Paribas A+ 91,805,750
Cash and Cash equivalents JP Morgan A- (336)
Cash and Cash equivalents Merrill Lynch A+ 1,871,787
Cash and Cash equivalents Morgan Stanley A+ 64,551
Cash collateral pledged HSBC Bank Plc AA- 11,719,984
Cash collateral pledged Barclays Bank A- 690,008
Cash collateral pledged BNP Paribas A+ 5,265,000
Cash collateral pledged Citi Bank A+ 2,714,143
Cash collateral pledged Goldman Sachs A+ 847,849
Cash collateral pledged JP Morgan A- 4,583,391
Cash collateral pledged Merrill Lynch A+ 2,579,400
Cash collateral pledged Morgan Stanley A+ 400,000
Fixed income securities HSBC Bank Plc AA- 319,375,256
Fixed income securities Goldman Sachs A+ 6,345,512
Forward foreign exchange contract HSBC Bank Plc AA- 570,175
Covered Option Contracts Bank of America A+ 286,418
Covered Option Contracts Barclays Bank A- 523
Covered Option Contracts BNP Paribas A+ 281,857
Covered Option Contracts Citi Bank A+ 891,104
Covered Option Contracts Goldman Sachs A+ 246,445
Covered Option Contracts HSBC Bank Plc AA- 519,811
Covered Option Contracts JP Morgan A- 213,866
Covered Option Contracts Merrill Lynch A+ 1,765,457
Covered Option Contracts Morgan Stanley A+ 202,297
Other Swaps Bank of America A+ 1,406,108
Other Swaps Barclays Bank A- 254,341
Other Swaps BNP Paribas A+ 121,096
Other Swaps Goldman Sachs A+ 1,611,583
Other Swaps JP Morgan A- 5,816,681
Other Swaps Morgan Stanley A+ 1,221,079
549,852,923
Algebris Core Italy Fund as at 31 December 2019
Financial assets Counterparty Credit rating EUR Cash and cash equivalents HSBC Bank Plc AA- 1,963,157
Cash and cash equivalents Merrill Lynch A+ 89,876
Fixed Income Securities HSBC Bank Plc AA- 2,284,686
Forward foreign exchange contracts HSBC Bank Plc AA- 26,850
4,364,569

ALGEBRIS UCITS FUNDS PLC
Notes to the Financial Statements (continued)
for the financial year ended 31 December 2019
129
14. Risks associated with financial instruments (continued)
(b) Credit risk (continued)
Algebris Quant Arbitrage Fund as at 31 December 2019
Financial assets Counterparty Credit rating EUR Cash and Cash equivalents HSBC Bank Plc AA- 3,576,826
Cash and Cash equivalents BNP Paribas A+ 6,193,393
Cash and Cash equivalents Morgan Stanley A+ 2,144,226
Cash collateral pledged Morgan Stanley A+ 2,688
Fixed income securities HSBC Bank Plc AA- 23,314,279
Forward foreign exchange contract HSBC Bank Plc AA- 2
35,231,414
Algebris IG Financial Credit Fund as at 31 December 2019
Financial assets Counterparty Credit rating EUR Cash and Cash equivalents HSBC Bank Plc AA- 7,639,389
Fixed income securities HSBC Bank Plc AA- 6,006,512
Forward foreign exchange contract HSBC Bank Plc AA- 20,361
13,666,262
Algebris Financial Credit Fund as at 31 December 2018
Financial assets Counterparty Credit rating EUR Cash and cash equivalents HSBC Bank Plc AA- 119,600,476
Cash and cash equivalents BNP Paribas A 169,912,508
Cash collateral pledged JP Morgan A- 2,690,805
Fixed Income Securities HSBC Bank Plc AA- 3,990,262,603
Forward foreign exchange contracts HSBC Bank Plc AA- 21,335,981
Futures contract HSBC Bank Plc AA- 161,565
4,303,963,938
Algebris Financial Income Fund as at 31 December 2018
Financial assets Counterparty Credit rating EUR Cash and cash equivalents HSBC Bank Plc AA- 11,871,735
Cash and cash equivalents BNP Paribas A 4,997,731
Cash collateral pledged HSBC Bank Plc AA- 34,209,960
Fixed Income Securities HSBC Bank Plc AA- 241,235,147
Forward foreign exchange contracts HSBC Bank Plc AA- 2,682,984
Covered Option Contracts HSBC Bank Plc AA- 1,559,148
Contract For Difference HSBC Bank Plc AA- 213,742
296,770,447

ALGEBRIS UCITS FUNDS PLC
Notes to the Financial Statements (continued)
for the financial year ended 31 December 2019
130
14. Risks associated with financial instruments (continued)
(b) Credit risk (continued)
Algebris Asset Allocation Fund as at 31 December 2018
Financial assets Counterparty Credit rating EUR Cash and cash equivalents HSBC Bank Plc AA- 1,448,072
Cash collateral pledged HSBC Bank Plc AA- 489,058
Fixed Income Securities HSBC Bank Plc AA- 6,010,109
Forward foreign exchange contracts HSBC Bank Plc AA- 51,713
Covered Option Contracts HSBC Bank Plc AA- 22,634
Futures Contract HSBC Bank Plc AA- 58,386
Contract For Difference HSBC Bank Plc AA- 108,173
8,188,145
Algebris Financial Equity Fund as at 31 December 2018
Financial assets Counterparty Credit rating EUR Cash and cash equivalents HSBC Bank Plc AA- 4,230,977
Cash and cash equivalents Morgan Stanley A+ (669,740)
Cash and cash equivalents BNP Paribas A 547,019
Cash collateral pledged HSBC Bank Plc AA- 5,561,942
Cash collateral pledged Morgan Stanley A+ 912,052
Forward foreign exchange contracts HSBC Bank Plc AA- 704,508
Covered Option Contracts HSBC Bank Plc AA- 465,137
Futures Contract HSBC Bank Plc AA- 76,700
Contract For Difference HSBC Bank Plc AA- 2,873,307
Contract For Difference Morgan Stanley A+ 929,304
15,631,206

ALGEBRIS UCITS FUNDS PLC
Notes to the Financial Statements (continued)
for the financial year ended 31 December 2019
131
14. Risks associated with financial instruments (continued)
(b) Credit risk (continued)
Algebris Macro Credit Fund as at 31 December 2018
Financial assets Counterparty Credit rating EUR Cash and Cash equivalents HSBC Bank Plc AA- 21,940,205
Cash and Cash equivalents Bank of America A+ (5,096,851)
Cash and Cash equivalents BNP Paribas A 52,468,012
Cash and Cash equivalents Goldman Sachs A+ (2,954,884)
Cash and Cash equivalents JP Morgan A- (2,873,263)
Cash and Cash equivalents Merrill Lynch A+ 140,920
Cash collateral pledged HSBC Bank Plc AA- 11,765,598
Cash collateral pledged BNP Paribas A 5,150,000
Cash collateral pledged Citi Bank A+ 2,164,575
Cash collateral pledged Goldman Sachs A+ 4,073,214
Cash collateral pledged JP Morgan A- 22,170,632
Fixed income securities HSBC Bank Plc AA- 620,293,112
Forward foreign exchange contract HSBC Bank Plc AA- 1,517,135
Covered Option Contracts Bank of America A+ 2,143,416
Covered Option Contracts BNP Paribas A 485,715
Covered Option Contracts HSBC Bank Plc AA- 516,750
Covered Option Contracts JP Morgan A- 1,528,821
Covered Option Contracts Merrill Lynch A+ 1,931,035
Future Contracts Merrill Lynch A+ 1,205,536
Other Swaps HSBC Bank Plc AA- 3,338,356
Other Swaps Bank of America A+ 11,158,951
Other Swaps BNP Paribas A 908,326
Other Swaps Citi Bank A+ 713,180
Other Swaps Goldman Sachs A+ 8,446,329
Other Swaps JP Morgan A- 4,082,572
767,217,392

ALGEBRIS UCITS FUNDS PLC
Notes to the Financial Statements (continued)
for the financial year ended 31 December 2019
132
14. Risks associated with financial instruments (continued)
(b) Credit risk (continued)
Algebris Core Italy Fund as at 31 December 2018
Financial assets Counterparty Credit rating EUR Cash and cash equivalents HSBC Bank Plc AA- 794,750
Fixed Income Securities HSBC Bank Plc AA- 16,082,362
Forward foreign exchange contracts HSBC Bank Plc AA- 8,589
16,885,701
Algebris Tail Risk Fund as at 31 December 2018
Financial assets Counterparty Credit rating EUR Cash and Cash equivalents HSBC Bank Plc AA- 1,684,750
Cash and Cash equivalents Bank of America A+ 81,168
Cash and Cash equivalents BNP Paribas A 1,596,900
Cash and Cash equivalents Merrill Lynch A+ 354,526
Cash collateral pledged Merrill Lynch A+ 90,000
Fixed income securities HSBC Bank Plc AA- 8,276,292
Forward foreign exchange contract HSBC Bank Plc AA- 85,603
12,169,239
All the cash and cash equivalents and due from broker balances are held with counterparties with minimum ratings
ranging from AA- to AA+ and the Company recognised an impairment allowance as immaterial on application of IFRS 9
under ‘expected credit loss’ (ECL) model. The amount of the allowance did not change for 2019.
The Company will also be exposed to a credit risk in relation to the counterparties with whom it transacts or places margin
or collateral in respect of transactions in financial derivative instruments and may bear the risk of counterparty default.
(c) Liquidity risk
Liquidity risk is the risk that an entity will encounter difficulty in meeting obligations associated with financial liabilities.
The Company is exposed to daily cash redemptions of redeemable participating shares and monitors this activity to ensure
that funds are available to meet the redemption requirements.
The Company’s actively traded securities are considered to be readily realisable as they are actively traded on recognised
stock exchanges.
The Company’s financial instruments also comprise investments in derivative contracts traded over-the-counter, which are
not traded in an organised public market and which generally may be illiquid. As a result, the Company may not be able to
liquidate quickly some of its investments in these instruments at an amount close to its fair value in order to meet its
liquidity requirements, or to respond to specific events such as a deterioration in the credit worthiness of any particular
issuer.
At 31 December 2019 substantially all of the Company’s liabilities, including net assets attributable to redeemable
participating shareholders, are payable within one month.
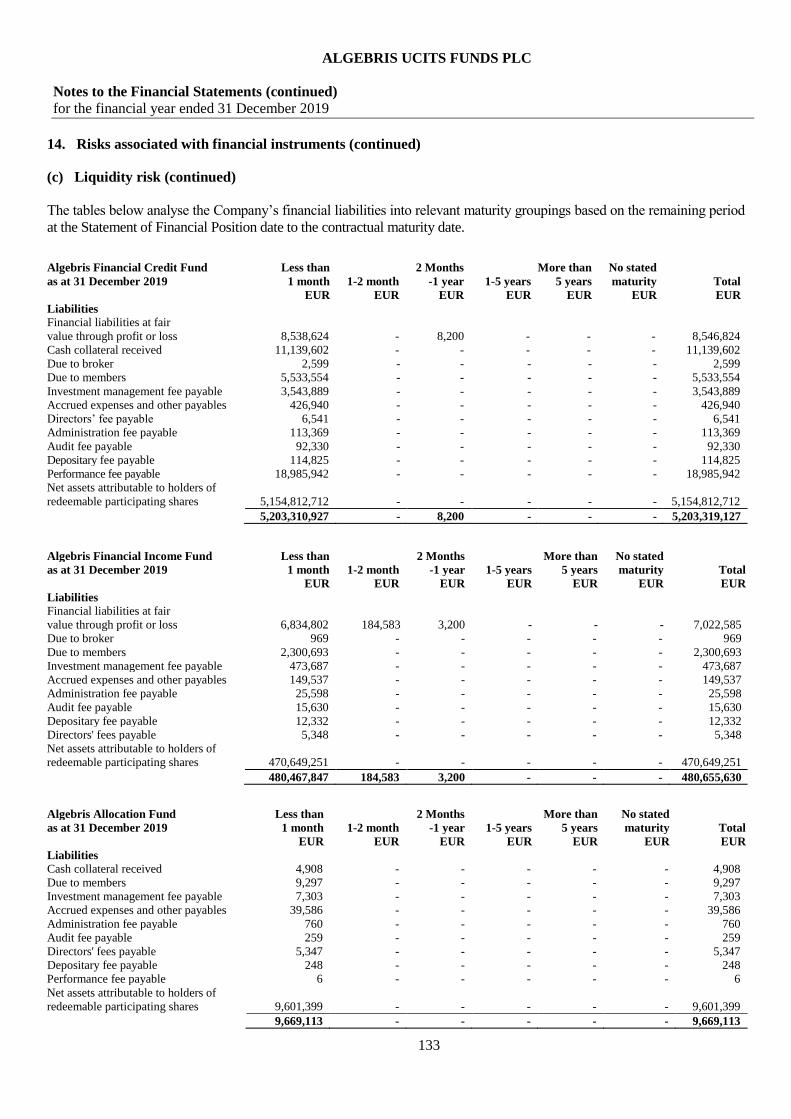
ALGEBRIS UCITS FUNDS PLC
Notes to the Financial Statements (continued)
for the financial year ended 31 December 2019
133
14. Risks associated with financial instruments (continued)
(c) Liquidity risk (continued)
The tables below analyse the Company’s financial liabilities into relevant maturity groupings based on the remaining period
at the Statement of Financial Position date to the contractual maturity date.
Algebris Financial Credit Fund Less than
2 Months More than No stated
as at 31 December 2019 1 month 1-2 month -1 year 1-5 years 5 years maturity Total
EUR EUR EUR EUR EUR EUR EUR
Liabilities
Financial liabilities at fair
value through profit or loss 8,538,624 - 8,200 - - - 8,546,824
Cash collateral received 11,139,602 - - - - - 11,139,602
Due to broker 2,599 - - - - - 2,599
Due to members 5,533,554 - - - - - 5,533,554
Investment management fee payable 3,543,889 - - - - - 3,543,889
Accrued expenses and other payables 426,940 - - - - - 426,940
Directors’ fee payable 6,541 - - - - - 6,541
Administration fee payable 113,369 - - - - - 113,369
Audit fee payable 92,330 - - - - - 92,330
Depositary fee payable 114,825 - - - - - 114,825
Performance fee payable 18,985,942 - - - - - 18,985,942
Net assets attributable to holders of
redeemable participating shares 5,154,812,712 - - - - - 5,154,812,712
5,203,310,927 - 8,200 - - - 5,203,319,127
Algebris Financial Income Fund Less than
2 Months More than No stated
as at 31 December 2019 1 month 1-2 month -1 year 1-5 years 5 years maturity Total
EUR EUR EUR EUR EUR EUR EUR
Liabilities
Financial liabilities at fair
value through profit or loss 6,834,802 184,583 3,200 - - - 7,022,585
Due to broker 969 - - - - - 969
Due to members 2,300,693 - - - - - 2,300,693
Investment management fee payable 473,687 - - - - - 473,687
Accrued expenses and other payables 149,537 - - - - - 149,537
Administration fee payable 25,598 - - - - - 25,598
Audit fee payable 15,630 - - - - - 15,630
Depositary fee payable 12,332 - - - - - 12,332
Directors' fees payable 5,348 - - - - - 5,348
Net assets attributable to holders of
redeemable participating shares 470,649,251 - - - - - 470,649,251
480,467,847 184,583 3,200 - - - 480,655,630
Algebris Allocation Fund Less than
2 Months More than No stated
as at 31 December 2019 1 month 1-2 month -1 year 1-5 years 5 years maturity Total
EUR EUR EUR EUR EUR EUR EUR
Liabilities
Cash collateral received 4,908 - - - - - 4,908
Due to members 9,297 - - - - - 9,297
Investment management fee payable 7,303 - - - - - 7,303
Accrued expenses and other payables 39,586 - - - - - 39,586
Administration fee payable 760 - - - - - 760
Audit fee payable 259 - - - - - 259
Directors' fees payable 5,347 - - - - - 5,347
Depositary fee payable 248 - - - - - 248
Performance fee payable 6 - - - - - 6
Net assets attributable to holders of
redeemable participating shares 9,601,399 - - - - - 9,601,399
9,669,113 - - - - - 9,669,113

ALGEBRIS UCITS FUNDS PLC
Notes to the Financial Statements (continued)
for the financial year ended 31 December 2019
134
14. Risks associated with financial instruments (continued)
(c) Liquidity risk (continued)
Algebris Financial Equity Fund Less than
2 Months More than No stated
as at 31 December 2019 1 month 1-2 month -1 year 1-5 years 5 years maturity Total
EUR EUR EUR EUR EUR EUR EUR
Liabilities
Financial liabilities at fair
value through profit or loss 702,799 30,441 28,988 - - - 762,228
Cash collateral received 1,680,638 - - - - - 1,680,638
Due to broker 157 - - - - - 157
Due to member 178,183 - - - - - 178,183
Investment management fee payable 54,483 - - - - - 54,483
Accrued expenses and other payables 40,672 - - - - - 40,672
Administration fee payable 7,679 - - - - - 7,679
Audit fee payable 2,468 - - - - - 2,468
Directors’ fee payable 5,837 - - - - - 5,837
Depositary fee payable 1,937 - - - - - 1,937
Performance fee payable 274 - - - - - 274
Net assets attributable to holders of
redeemable participating shares 72,545,856 - - - - - 72,545,856
75,220,983 30,441 28,988 - - - 75,280,412
Algebris Macro Credit Fund Less than
2 Months More than No stated
as at 31 December 2019 1 month 1-2 month -1 year 1-5 years 5 years maturity Total
EUR EUR EUR EUR EUR EUR EUR
Liabilities
Financial liabilities at fair
value through profit or loss 952,110 612,367 1,938,158 19,805,448 4,048,464 - 27,356,547
Due to broker 16 - - - - - 16
Due to members 406,760 - - - - - 406,760
Investment management fee payable 643,944 - - - - - 643,944
Accrued expenses and other payables 206,542 - - - - - 206,542
Administration fee payable 24,438 - - - - - 24,438
Audit fee payable 16,235 - - - - - 16,235
Depositary fee payable 13,688 - - - - - 13,688
Directors' fees payable 5,347 - - - - - 5,347
Interest Payable 605,134 - - - - - 605,134
Performance fee payable 1,160,038 - - - - - 1,160,038
Net assets attributable to holders of
redeemable participating shares 528,960,175 - - - - - 528,960,175
532,994,427 612,367 1,938,158 19,805,448 4,048,464 - 559,398,864
Algebris Core Italy Fund Less than
2 Months More than No stated
as at 31 December 2019 1 month 1-2 month -1 year 1-5 years 5 years maturity Total
EUR EUR EUR EUR EUR EUR EUR
Liabilities
Financial liabilities at fair
value through profit or loss 5 - 340 - - - 345
Due to member 11,943 - - - - - 11,943
Directors' fees payable 5,348 - - - - - 5,348
Performance fee payable 2,464 - - - - - 2,464
Investment management fee payable 11,259 - - - - - 11,259
Accrued expenses and other payables 16,933 - - - - - 16,933
Administration fee payable 2,470 - - - - - 2,470
Audit fee payable 4,150 - - - - - 4,150
Depositary fee payable 1,273 - - - - - 1,273
Net assets attributable to holders of
redeemable participating shares 48,898,496 - - - - - 48,898,496
48,954,341 - 340 - - - 48,954,681
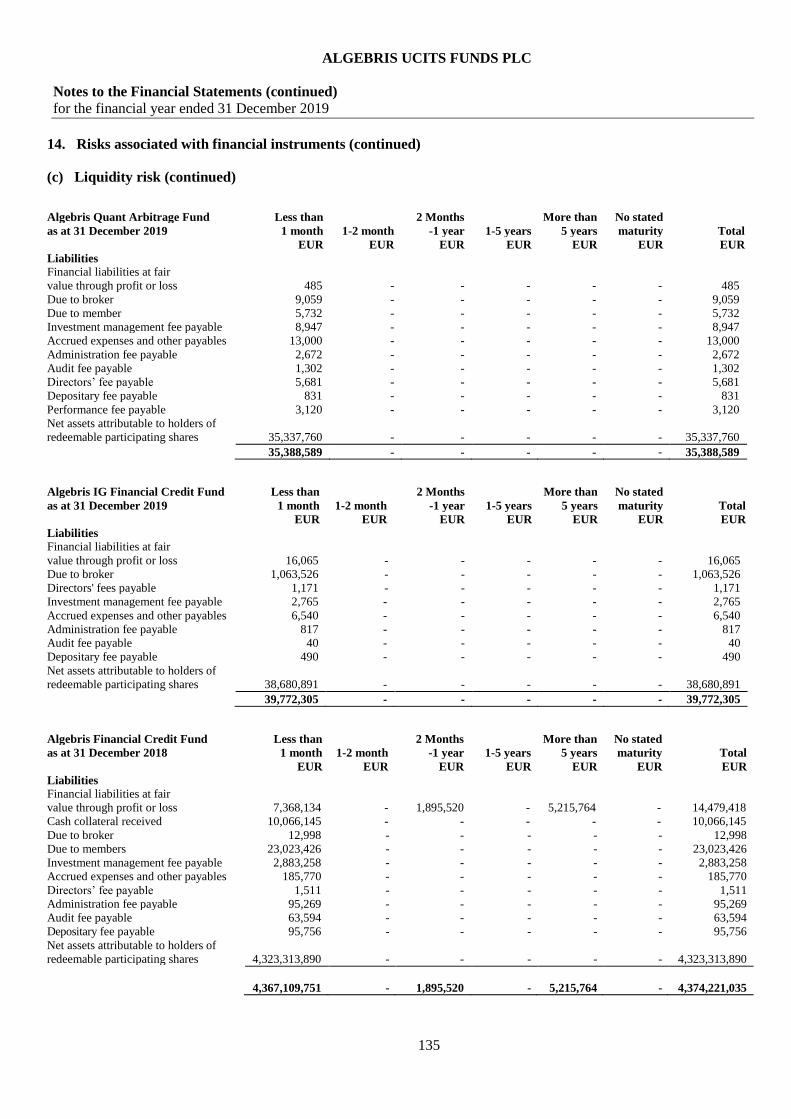
ALGEBRIS UCITS FUNDS PLC
Notes to the Financial Statements (continued)
for the financial year ended 31 December 2019
135
14. Risks associated with financial instruments (continued)
(c) Liquidity risk (continued)
Algebris Quant Arbitrage Fund Less than
2 Months More than No stated
as at 31 December 2019 1 month 1-2 month -1 year 1-5 years 5 years maturity Total
EUR EUR EUR EUR EUR EUR EUR
Liabilities
Financial liabilities at fair
value through profit or loss 485 - - - - - 485
Due to broker 9,059 - - - - - 9,059
Due to member 5,732 - - - - - 5,732
Investment management fee payable 8,947 - - - - - 8,947
Accrued expenses and other payables 13,000 - - - - - 13,000
Administration fee payable 2,672 - - - - - 2,672
Audit fee payable 1,302 - - - - - 1,302
Directors’ fee payable 5,681 - - - - - 5,681
Depositary fee payable 831 - - - - - 831
Performance fee payable 3,120 - - - - - 3,120
Net assets attributable to holders of
redeemable participating shares 35,337,760 - - - - - 35,337,760
35,388,589 - - - - - 35,388,589
Algebris IG Financial Credit Fund Less than
2 Months More than No stated
as at 31 December 2019 1 month 1-2 month -1 year 1-5 years 5 years maturity Total
EUR EUR EUR EUR EUR EUR EUR
Liabilities
Financial liabilities at fair
value through profit or loss 16,065 - - - - - 16,065
Due to broker 1,063,526 - - - - - 1,063,526
Directors' fees payable 1,171 - - - - - 1,171
Investment management fee payable 2,765 - - - - - 2,765
Accrued expenses and other payables 6,540 - - - - - 6,540
Administration fee payable 817 - - - - - 817
Audit fee payable 40 - - - - - 40
Depositary fee payable 490 - - - - - 490
Net assets attributable to holders of
redeemable participating shares 38,680,891 - - - - - 38,680,891
39,772,305 - - - - - 39,772,305
Algebris Financial Credit Fund Less than
2 Months More than No stated
as at 31 December 2018 1 month 1-2 month -1 year 1-5 years 5 years maturity Total
EUR EUR EUR EUR EUR EUR EUR
Liabilities
Financial liabilities at fair
value through profit or loss 7,368,134 - 1,895,520 - 5,215,764 - 14,479,418
Cash collateral received 10,066,145 - - - - - 10,066,145
Due to broker 12,998 - - - - - 12,998
Due to members 23,023,426 - - - - - 23,023,426
Investment management fee payable 2,883,258 - - - - - 2,883,258
Accrued expenses and other payables 185,770 - - - - - 185,770
Directors’ fee payable 1,511 - - - - - 1,511
Administration fee payable 95,269 - - - - - 95,269
Audit fee payable 63,594 - - - - - 63,594
Depositary fee payable 95,756 - - - - - 95,756
Net assets attributable to holders of
redeemable participating shares 4,323,313,890 - - - - -
4,323,313,890
4,367,109,751 - 1,895,520 - 5,215,764 -
4,374,221,035

ALGEBRIS UCITS FUNDS PLC
Notes to the Financial Statements (continued)
for the financial year ended 31 December 2019
136
14. Risks associated with financial instruments (continued)
(c) Liquidity risk (continued)
Algebris Financial Income Fund Less than
2 Months More than No stated
as at 31 December 2018 1 month 1-2 month -1 year 1-5 years 5 years maturity Total
EUR EUR EUR EUR EUR EUR EUR
Liabilities
Financial liabilities at fair
value through profit or loss 36,249,045 - 279,780 - - - 36,528,825
Due to broker 4 - - - - - 4
Due to members 1,034,310 - - - - - 1,034,310
Investment management fee payable 518,040 - - - - - 518,040
Accrued expenses and other payables 130,077 - - - - - 130,077
Administration fee payable 22,371 - - - - - 22,371
Audit fee payable 16,200 - - - - - 16,200
Depositary fee payable 12,434 - - - - - 12,434
Net assets attributable to holders of
redeemable participating shares 472,310,644 - - - - - 472,310,644
510,293,125 - 279,780 - - - 510,572,905
Algebris Allocation Fund Less than
2 Months More than No stated
as at 31 December 2018 1 month 1-2 month -1 year 1-5 years 5 years maturity Total
EUR EUR EUR EUR EUR EUR EUR
Liabilities
Financial liabilities at fair
value through profit or loss 829,166 - 12,742 - - - 841,908
Due to members 22,653 - - - - - 22,653
Investment management fee payable 18,275 - - - - - 18,275
Accrued expenses and other payables 27,655 - - - - - 27,655
Administration fee payable 630 - - - - - 630
Audit fee payable 300 - - - - - 300
Depositary fee payable 314 - - - - - 314
Net assets attributable to holders of
redeemable participating shares 12,134,254 - - - - - 12,134,254
13,033,247 - 12,742 - - - 13,045,989
Algebris Financial Equity Fund Less than
2 Months More than No stated
as at 31 December 2018 1 month 1-2 month -1 year 1-5 years 5 years maturity Total
EUR EUR EUR EUR EUR EUR EUR
Liabilities
Financial liabilities at fair
value through profit or loss 9,249,934 - - - - - 9,249,934
Due to broker 142 - - - - - 142
Due to member 65,664 - - - - - 65,664
Investment management fee payable 58,231 - - - - - 58,231
Accrued expenses and other payables 92,430 - - - - - 92,430
Administration fee payable 7,936 - - - - - 7,936
Audit fee payable 2,800 - - - - - 2,800
Directors’ fee payable 588 - - - - - 588
Depositary fee payable 2,144 - - - - - 2,144
Net assets attributable to holders of
redeemable participating shares 80,288,782 - - - - - 80,288,782
89,768,651 - - - - - 89,768,651
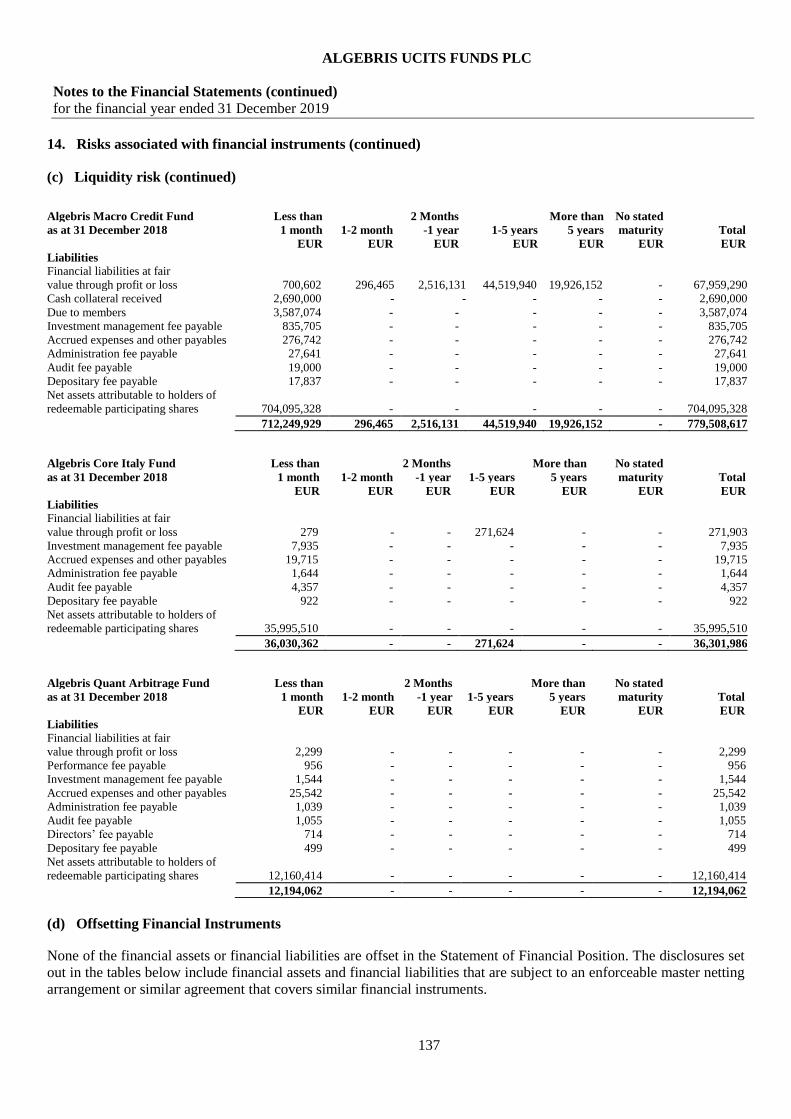
ALGEBRIS UCITS FUNDS PLC
Notes to the Financial Statements (continued)
for the financial year ended 31 December 2019
137
14. Risks associated with financial instruments (continued)
(c) Liquidity risk (continued)
Algebris Macro Credit Fund Less than
2 Months More than No stated
as at 31 December 2018 1 month 1-2 month -1 year 1-5 years 5 years maturity Total
EUR EUR EUR EUR EUR EUR EUR
Liabilities
Financial liabilities at fair
value through profit or loss 700,602 296,465 2,516,131 44,519,940 19,926,152 - 67,959,290
Cash collateral received 2,690,000 - - - - - 2,690,000
Due to members 3,587,074 - - - - - 3,587,074
Investment management fee payable 835,705 - - - - - 835,705
Accrued expenses and other payables 276,742 - - - - - 276,742
Administration fee payable 27,641 - - - - - 27,641
Audit fee payable 19,000 - - - - - 19,000
Depositary fee payable 17,837 - - - - - 17,837
Net assets attributable to holders of
redeemable participating shares 704,095,328 - - - - - 704,095,328
712,249,929 296,465 2,516,131 44,519,940 19,926,152 - 779,508,617
Algebris Core Italy Fund Less than
2 Months More than No stated
as at 31 December 2018 1 month 1-2 month -1 year 1-5 years 5 years maturity Total
EUR EUR EUR EUR EUR EUR EUR
Liabilities
Financial liabilities at fair
value through profit or loss 279 - - 271,624 - - 271,903
Investment management fee payable 7,935 - - - - - 7,935
Accrued expenses and other payables 19,715 - - - - - 19,715
Administration fee payable 1,644 - - - - - 1,644
Audit fee payable 4,357 - - - - - 4,357
Depositary fee payable 922 - - - - - 922
Net assets attributable to holders of
redeemable participating shares 35,995,510 - - - - - 35,995,510
36,030,362 - - 271,624 - - 36,301,986
Algebris Quant Arbitrage Fund Less than
2 Months More than No stated
as at 31 December 2018 1 month 1-2 month -1 year 1-5 years 5 years maturity Total
EUR EUR EUR EUR EUR EUR EUR
Liabilities
Financial liabilities at fair
value through profit or loss 2,299 - - - - - 2,299
Performance fee payable 956 - - - - - 956
Investment management fee payable 1,544 - - - - - 1,544
Accrued expenses and other payables 25,542 - - - - - 25,542
Administration fee payable 1,039 - - - - - 1,039
Audit fee payable 1,055 - - - - - 1,055
Directors’ fee payable 714 - - - - - 714
Depositary fee payable 499 - - - - - 499
Net assets attributable to holders of
redeemable participating shares 12,160,414 - - - - - 12,160,414
12,194,062 - - - - - 12,194,062
(d) Offsetting Financial Instruments
None of the financial assets or financial liabilities are offset in the Statement of Financial Position. The disclosures set
out in the tables below include financial assets and financial liabilities that are subject to an enforceable master netting
arrangement or similar agreement that covers similar financial instruments.

ALGEBRIS UCITS FUNDS PLC
Notes to the Financial Statements (continued)
for the financial year ended 31 December 2019
138
14. Risks associated with financial instruments (continued)
(d) Offsetting Financial Instruments (continued)
The similar agreements include derivative clearing agreements, global master repurchase agreements and global
master securities lending agreements. Similar financial instruments include derivatives, sale and repurchase
agreements and securities borrowing agreements.
The ISDA and similar master netting arrangements do not meet the criteria for offsetting in the Statement of Financial
Position. This is because they create a right of set-off of recognised amounts that is enforceable only following an
event of default, insolvency or bankruptcy of the Sub-Fund or the counterparties. In addition, the Sub-Fund and its
counterparties do not intend to settle on a net basis or to realise the assets and settle the liabilities simultaneously.
Algebris Financial Credit Fund
31 December 2019
Financial assets which are subject to enforceable master netting arrangements or similar agreements are detailed in the
following table.
Description of
type of
Financial
Assets
Gross amount
of recognised
Financial Asset
Gross amount
of Financial
Liabilities
offset in the
Statement of
Financial
Position
Net amount of
Financial
Asset
presented in
the Statement
of Financial
Position
Gross amounts not offset in the
Statement of Financial Position
Net amount
Financial
Instrument
Cash
Collateral
received
EUR EUR EUR EUR EUR EUR
Derivatives
HSBC Bank Plc 17,582,294 - 17,582,294 (8,538,624) - 9,043,670
Merrill Lynch 7,322,760 - 7,322,760 (8,200) - 7,314,560
24,905,054 - 24,905,054 (8,546,824) - 16,358,230
Financial liabilities which are subject to enforceable master netting arrangements or similar agreements are detailed in
the following table.
Description of
type of
Financial
Liabilities
Gross amount
of recognised
Financial
Liabilities
Gross amounts
of Financial
Assets offset
in the Statement
of Financial
Position
Net amount of
Financial
Liabilities
presented in the
Statement of
Financial
Position
Gross amounts not offset in the
Statement of Financial Position
Net amount
Financial
Instrument
Cash
Collateral
pledged
EUR EUR EUR EUR EUR EUR
Derivatives
HSBC Bank Plc (8,538,624) - (8,538,624) 8,538,624 - -
Merrill Lynch (8,200) - (8,200) 8,200 - -
(8,546,824) - (8,546,824) 8,546,824 - -
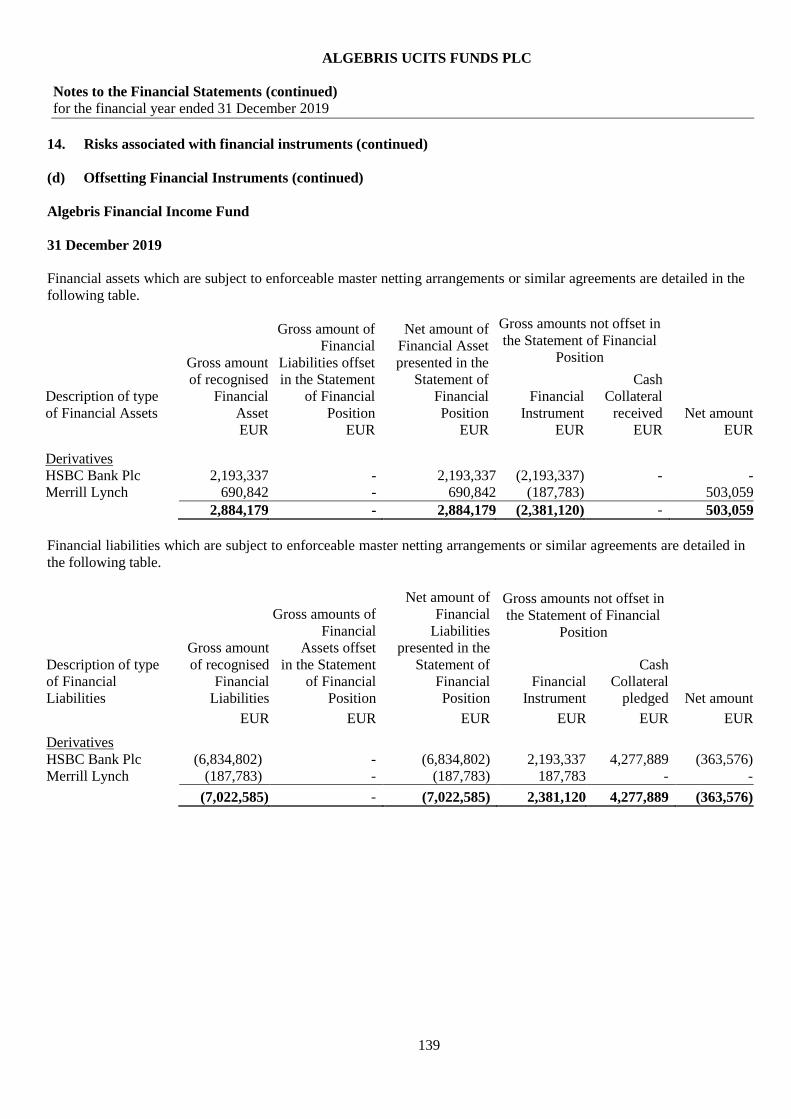
ALGEBRIS UCITS FUNDS PLC
Notes to the Financial Statements (continued)
for the financial year ended 31 December 2019
139
14. Risks associated with financial instruments (continued)
(d) Offsetting Financial Instruments (continued)
Algebris Financial Income Fund
31 December 2019
Financial assets which are subject to enforceable master netting arrangements or similar agreements are detailed in the
following table.
Description of type
of Financial Assets
Gross amount
of recognised
Financial
Asset
Gross amount of
Financial
Liabilities offset
in the Statement
of Financial
Position
Net amount of
Financial Asset
presented in the
Statement of
Financial
Position
Gross amounts not offset in
the Statement of Financial
Position
Net amount
Financial
Instrument
Cash
Collateral
received
EUR EUR EUR EUR EUR EUR
Derivatives
HSBC Bank Plc 2,193,337 - 2,193,337 (2,193,337) - -
Merrill Lynch 690,842 - 690,842 (187,783) 503,059
2,884,179 - 2,884,179 (2,381,120) - 503,059
Financial liabilities which are subject to enforceable master netting arrangements or similar agreements are detailed in
the following table.
Description of type
of Financial
Liabilities
Gross amount
of recognised
Financial
Liabilities
Gross amounts of
Financial
Assets offset
in the Statement
of Financial
Position
Net amount of
Financial
Liabilities
presented in the
Statement of
Financial
Position
Gross amounts not offset in
the Statement of Financial
Position
Net amount
Financial
Instrument
Cash
Collateral
pledged
EUR EUR EUR EUR EUR EUR
Derivatives
HSBC Bank Plc (6,834,802) - (6,834,802) 2,193,337 4,277,889 (363,576)
Merrill Lynch (187,783) - (187,783) 187,783 - -
(7,022,585) - (7,022,585) 2,381,120 4,277,889 (363,576)
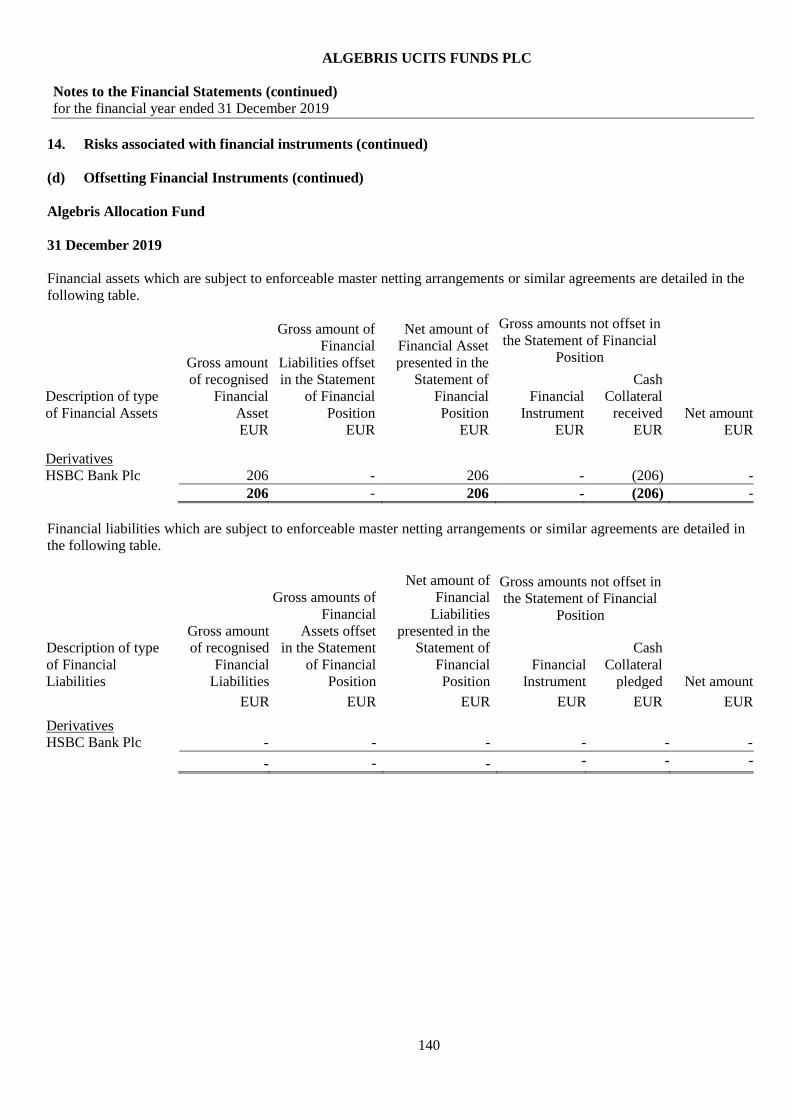
ALGEBRIS UCITS FUNDS PLC
Notes to the Financial Statements (continued)
for the financial year ended 31 December 2019
140
14. Risks associated with financial instruments (continued)
(d) Offsetting Financial Instruments (continued)
Algebris Allocation Fund
31 December 2019
Financial assets which are subject to enforceable master netting arrangements or similar agreements are detailed in the
following table.
Description of type
of Financial Assets
Gross amount
of recognised
Financial
Asset
Gross amount of
Financial
Liabilities offset
in the Statement
of Financial
Position
Net amount of
Financial Asset
presented in the
Statement of
Financial
Position
Gross amounts not offset in
the Statement of Financial
Position
Net amount
Financial
Instrument
Cash
Collateral
received
EUR EUR EUR EUR EUR EUR
Derivatives
HSBC Bank Plc 206 - 206 - (206) -
206 - 206 - (206) -
Financial liabilities which are subject to enforceable master netting arrangements or similar agreements are detailed in
the following table.
Description of type
of Financial
Liabilities
Gross amount
of recognised
Financial
Liabilities
Gross amounts of
Financial
Assets offset
in the Statement
of Financial
Position
Net amount of
Financial
Liabilities
presented in the
Statement of
Financial
Position
Gross amounts not offset in
the Statement of Financial
Position
Net amount
Financial
Instrument
Cash
Collateral
pledged
EUR EUR EUR EUR EUR EUR
Derivatives
HSBC Bank Plc - - - - - -
- - - - - -

ALGEBRIS UCITS FUNDS PLC
Notes to the Financial Statements (continued)
for the financial year ended 31 December 2019
141
14. Risks associated with financial instruments (continued)
(d) Offsetting Financial Instruments (continued)
Algebris Financial Equity Fund
31 December 2019
Financial assets which are subject to enforceable master netting arrangements or similar agreements are detailed in the
following table.
Description of type
of Financial Assets
Gross amount
of recognised
Financial
Asset
Gross amount of
Financial
Liabilities offset
in the Statement
of Financial
Position
Net amount of
Financial Asset
presented in the
Statement of
Financial
Position
Gross amounts not offset in
the Statement of Financial
Position
Net amount
Financial
Instrument
Cash
Collateral
received
EUR EUR EUR EUR EUR EUR
Derivatives
HSBC Bank Plc 2,232,772 - 2,232,772 (702,799) (1,529,973) -
Merrill Lynch 104,528 - 104,528 (59,428) - 45,100
2,337,300 - 2,337,300 (762,227) (1,529,973) 45,100
Financial liabilities which are subject to enforceable master netting arrangements or similar agreements are detailed in
the following table.
Description of type
of Financial
Liabilities
Gross amount
of recognised
Financial
Liabilities
Gross amounts of
Financial
Assets offset
in the Statement
of Financial
Position
Net amount of
Financial
Liabilities
presented in the
Statement of
Financial
Position
Gross amounts not offset in
the Statement of Financial
Position
Net amount
Financial
Instrument
Cash
Collateral
pledged
EUR EUR EUR EUR EUR EUR
Derivatives
HSBC Bank Plc (702,799) - (702,799) 702,799 - -
Morgan Stanley (59,428) - (59,428) 59,428 - -
(762,227) - (762,227) 762,227 - -

ALGEBRIS UCITS FUNDS PLC
Notes to the Financial Statements (continued)
for the financial year ended 31 December 2019
142
14. Risks associated with financial instruments (continued)
(d) Offsetting Financial Instruments (continued)
Algebris Macro Credit Fund
31 December 2019
Financial assets which are subject to enforceable master netting arrangements or similar agreements are detailed in the
following table.
Description of
type of
Financial
Assets
Gross amount of
recognised
Financial Asset
Gross
amount of
Financial
Liabilities
offset in the
Statement of
Financial
Position
Net amount
of Financial
Asset
presented in
the Statement
of Financial
Position
Gross amounts not offset in the
Statement of Financial Position
Net amount
Financial
Instrument
Cash
Collateral
received
Financial
Collateral
to be offset
against
repos
EUR EUR EUR EUR EUR EUR EUR
Derivatives
Bank of
America
Merrill Lynch 1,692,527 - 1,692,527 (1,692,527) - - -
Barclays 254,864 - 254,864 (194,737) - - 60,127
BNP Paribas 402,953 - 402,953 (402,953) - - -
Citi Bank 891,104 - 891,104 (739,969) - - 151,135
Goldman
Sachs 1,858,028 - 1,858,028 (31,616) - - 1,826,412
HSBC Bank
Plc 1,089,985 - 1,089,985 (676,068) - - 413,917
JP Morgan 6,030,547 - 6,030,547 (2,487,579) - - 3,542,968
Morgan
Stanley 1,423,376 - 1,423,376 (402,918) - - 1,020,458
Merrill Lynch
International
Bank 1,765,457 - 1,765,457 (1,462,191) - - 303,266
15,408,841 - 15,408,841 (8,090,558) - - 7,318,283
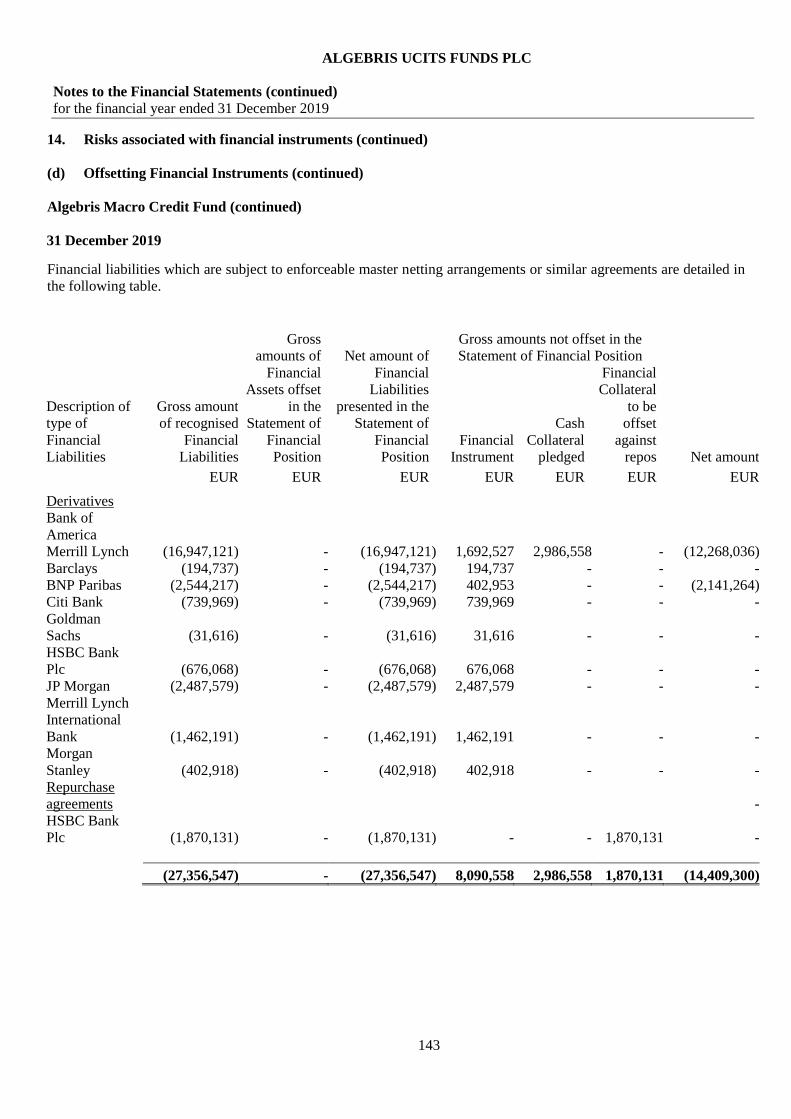
ALGEBRIS UCITS FUNDS PLC
Notes to the Financial Statements (continued)
for the financial year ended 31 December 2019
143
14. Risks associated with financial instruments (continued)
(d) Offsetting Financial Instruments (continued)
Algebris Macro Credit Fund (continued)
31 December 2019
Financial liabilities which are subject to enforceable master netting arrangements or similar agreements are detailed in
the following table.
Description of
type of
Financial
Liabilities
Gross amount
of recognised
Financial
Liabilities
Gross
amounts of
Financial
Assets offset
in the
Statement of
Financial
Position
Net amount of
Financial
Liabilities
presented in the
Statement of
Financial
Position
Gross amounts not offset in the
Statement of Financial Position
Net amount
Financial
Instrument
Cash
Collateral
pledged
Financial
Collateral
to be
offset
against
repos
EUR EUR EUR EUR EUR EUR EUR
Derivatives
Bank of
America
Merrill Lynch (16,947,121) - (16,947,121) 1,692,527 2,986,558 - (12,268,036)
Barclays (194,737) - (194,737) 194,737 - - -
BNP Paribas (2,544,217) - (2,544,217) 402,953 - - (2,141,264)
Citi Bank (739,969) - (739,969) 739,969 - - -
Goldman
Sachs (31,616) - (31,616) 31,616 - - -
HSBC Bank
Plc (676,068) - (676,068) 676,068 - - -
JP Morgan (2,487,579) - (2,487,579) 2,487,579 - - -
Merrill Lynch
International
Bank (1,462,191) - (1,462,191) 1,462,191 - - -
Morgan
Stanley (402,918) - (402,918) 402,918 - - -
Repurchase
agreements -
HSBC Bank
Plc (1,870,131) - (1,870,131) - - 1,870,131 -
(27,356,547) - (27,356,547) 8,090,558 2,986,558 1,870,131 (14,409,300)

ALGEBRIS UCITS FUNDS PLC
Notes to the Financial Statements (continued)
for the financial year ended 31 December 2019
144
14. Risks associated with financial instruments (continued)
(d) Offsetting Financial Instruments (continued)
Algebris Core Italy Fund
31 December 2019
Financial assets which are subject to enforceable master netting arrangements or similar agreements are detailed in the
following table.
Description of
type of
Financial
Assets
Gross amount
of recognised
Financial Asset
Gross
amount of
Financial
Liabilities
offset in the
Statement of
Financial
Position
Net amount of
Financial Asset
presented in the
Statement of
Financial
Position
Gross amounts not offset in the
Statement of Financial Position
Net amount
Financial
Instrument
Cash
Collateral
received
EUR EUR EUR EUR EUR EUR
Derivatives
HSBC Bank
Plc 308,993 - 308,993 (5) - 308,988
308,993 - 308,993 (5) - 308,988
Financial liabilities which are subject to enforceable master netting arrangements or similar agreements are detailed in
the following table.
Description of
type of
Financial
Liabilities
Gross amount
of recognised
Financial
Liabilities
Gross amounts
of Financial
Assets offset
in the
Statement of
Financial
Position
Net amount of
Financial
Liabilities
presented in the
Statement of
Financial
Position
Gross amounts not offset in the
Statement of Financial Position
Net amount
Financial
Instrument
Cash
Collateral
pledged
EUR EUR EUR EUR EUR EUR
Derivatives
Merrill Lynch
International
Bank (340) (340) - - (340)
HSBC Bank
Plc (5) - (5) 5 - -
(345) - (345) 5 - (340)
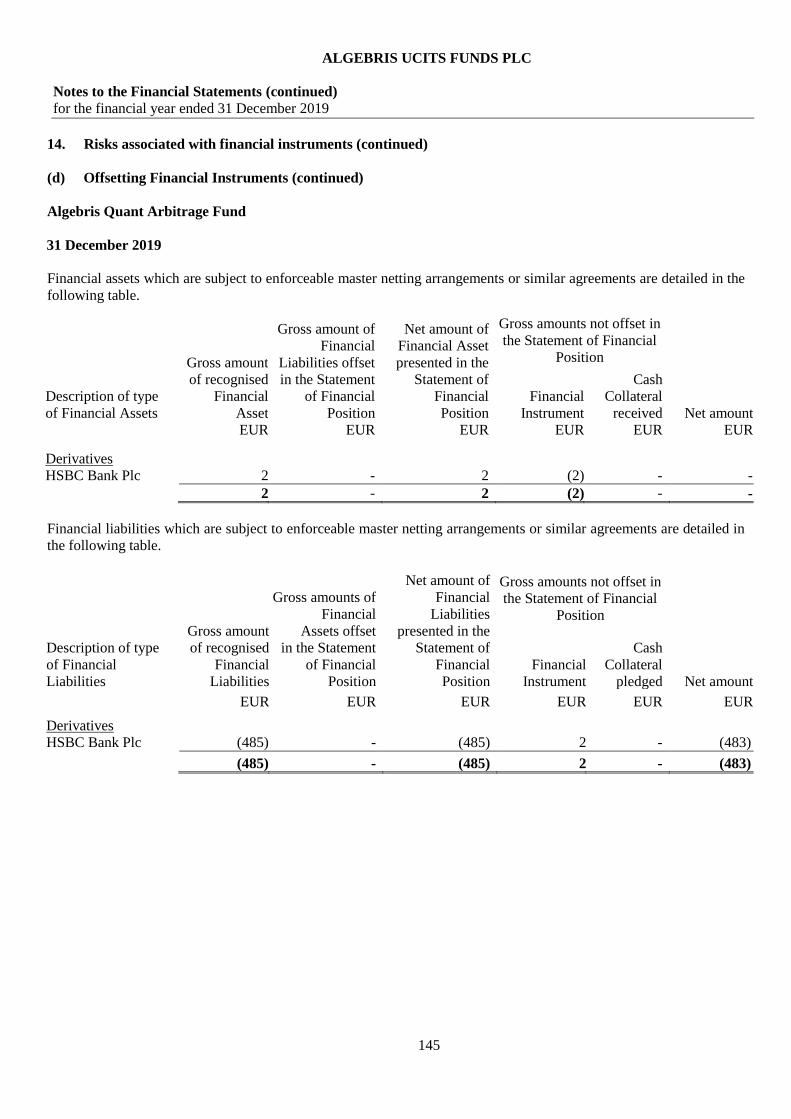
ALGEBRIS UCITS FUNDS PLC
Notes to the Financial Statements (continued)
for the financial year ended 31 December 2019
145
14. Risks associated with financial instruments (continued)
(d) Offsetting Financial Instruments (continued)
Algebris Quant Arbitrage Fund
31 December 2019
Financial assets which are subject to enforceable master netting arrangements or similar agreements are detailed in the
following table.
Description of type
of Financial Assets
Gross amount
of recognised
Financial
Asset
Gross amount of
Financial
Liabilities offset
in the Statement
of Financial
Position
Net amount of
Financial Asset
presented in the
Statement of
Financial
Position
Gross amounts not offset in
the Statement of Financial
Position
Net amount
Financial
Instrument
Cash
Collateral
received
EUR EUR EUR EUR EUR EUR
Derivatives
HSBC Bank Plc 2 - 2 (2) - -
2 - 2 (2) - -
Financial liabilities which are subject to enforceable master netting arrangements or similar agreements are detailed in
the following table.
Description of type
of Financial
Liabilities
Gross amount
of recognised
Financial
Liabilities
Gross amounts of
Financial
Assets offset
in the Statement
of Financial
Position
Net amount of
Financial
Liabilities
presented in the
Statement of
Financial
Position
Gross amounts not offset in
the Statement of Financial
Position
Net amount
Financial
Instrument
Cash
Collateral
pledged
EUR EUR EUR EUR EUR EUR
Derivatives
HSBC Bank Plc (485) - (485) 2 - (483)
(485) - (485) 2 - (483)
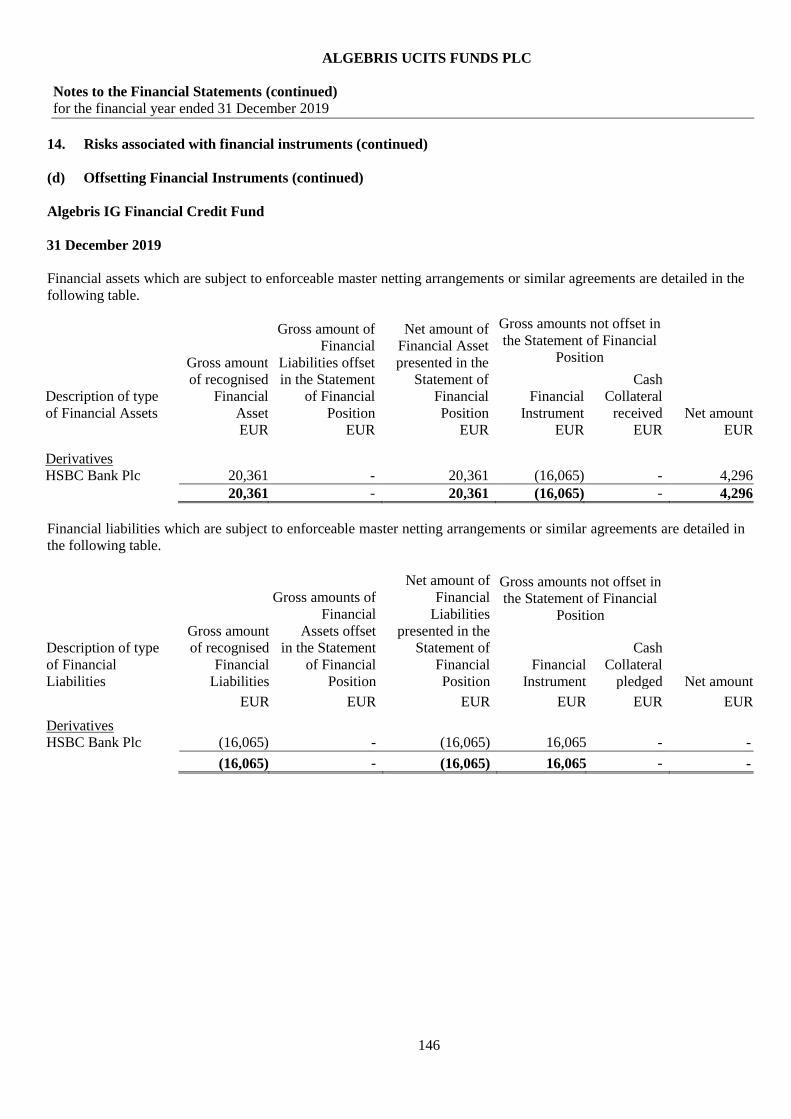
ALGEBRIS UCITS FUNDS PLC
Notes to the Financial Statements (continued)
for the financial year ended 31 December 2019
146
14. Risks associated with financial instruments (continued)
(d) Offsetting Financial Instruments (continued)
Algebris IG Financial Credit Fund
31 December 2019
Financial assets which are subject to enforceable master netting arrangements or similar agreements are detailed in the
following table.
Description of type
of Financial Assets
Gross amount
of recognised
Financial
Asset
Gross amount of
Financial
Liabilities offset
in the Statement
of Financial
Position
Net amount of
Financial Asset
presented in the
Statement of
Financial
Position
Gross amounts not offset in
the Statement of Financial
Position
Net amount
Financial
Instrument
Cash
Collateral
received
EUR EUR EUR EUR EUR EUR
Derivatives
HSBC Bank Plc 20,361 - 20,361 (16,065) - 4,296
20,361 - 20,361 (16,065) - 4,296
Financial liabilities which are subject to enforceable master netting arrangements or similar agreements are detailed in
the following table.
Description of type
of Financial
Liabilities
Gross amount
of recognised
Financial
Liabilities
Gross amounts of
Financial
Assets offset
in the Statement
of Financial
Position
Net amount of
Financial
Liabilities
presented in the
Statement of
Financial
Position
Gross amounts not offset in
the Statement of Financial
Position
Net amount
Financial
Instrument
Cash
Collateral
pledged
EUR EUR EUR EUR EUR EUR
Derivatives
HSBC Bank Plc (16,065) - (16,065) 16,065 - -
(16,065) - (16,065) 16,065 - -
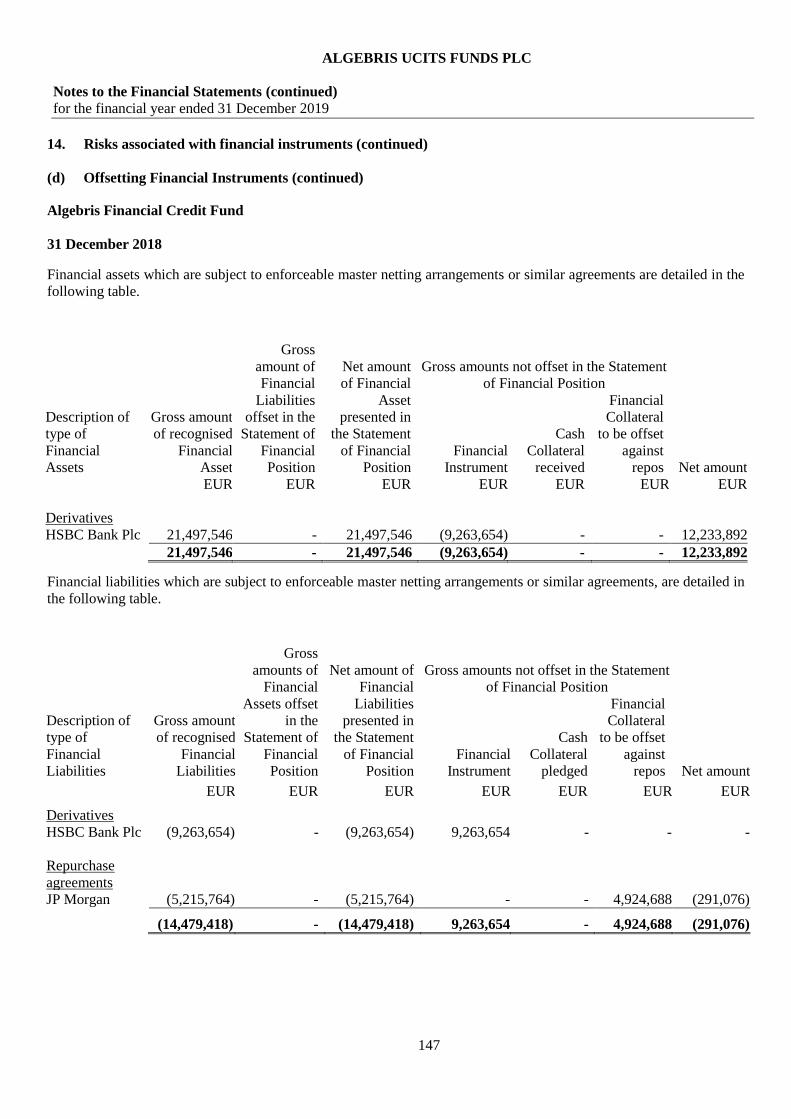
ALGEBRIS UCITS FUNDS PLC
Notes to the Financial Statements (continued)
for the financial year ended 31 December 2019
147
14. Risks associated with financial instruments (continued)
(d) Offsetting Financial Instruments (continued)
Algebris Financial Credit Fund
31 December 2018
Financial assets which are subject to enforceable master netting arrangements or similar agreements are detailed in the
following table.
Description of
type of
Financial
Assets
Gross amount
of recognised
Financial
Asset
Gross
amount of
Financial
Liabilities
offset in the
Statement of
Financial
Position
Net amount
of Financial
Asset
presented in
the Statement
of Financial
Position
Gross amounts not offset in the Statement
of Financial Position
Net amount
Financial
Instrument
Cash
Collateral
received
Financial
Collateral
to be offset
against
repos
EUR EUR EUR EUR EUR EUR EUR
Derivatives
HSBC Bank Plc 21,497,546 - 21,497,546 (9,263,654) - - 12,233,892
21,497,546 - 21,497,546 (9,263,654) - - 12,233,892
Financial liabilities which are subject to enforceable master netting arrangements or similar agreements, are detailed in
the following table.
Description of
type of
Financial
Liabilities
Gross amount
of recognised
Financial
Liabilities
Gross
amounts of
Financial
Assets offset
in the
Statement of
Financial
Position
Net amount of
Financial
Liabilities
presented in
the Statement
of Financial
Position
Gross amounts not offset in the Statement
of Financial Position
Net amount
Financial
Instrument
Cash
Collateral
pledged
Financial
Collateral
to be offset
against
repos
EUR EUR EUR EUR EUR EUR EUR
Derivatives
HSBC Bank Plc (9,263,654) - (9,263,654) 9,263,654 - - -
Repurchase
agreements
JP Morgan (5,215,764) - (5,215,764) - - 4,924,688 (291,076)
(14,479,418) - (14,479,418) 9,263,654 - 4,924,688 (291,076)
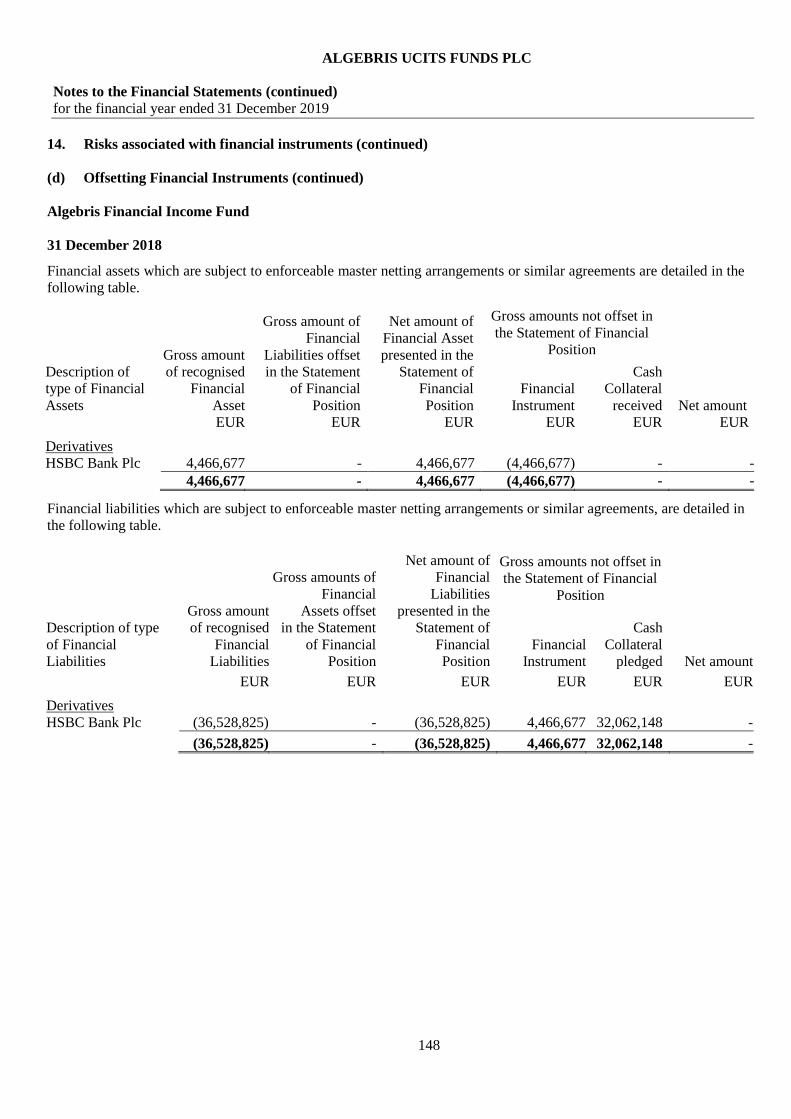
ALGEBRIS UCITS FUNDS PLC
Notes to the Financial Statements (continued)
for the financial year ended 31 December 2019
148
14. Risks associated with financial instruments (continued)
(d) Offsetting Financial Instruments (continued)
Algebris Financial Income Fund
31 December 2018
Financial assets which are subject to enforceable master netting arrangements or similar agreements are detailed in the
following table.
Description of
type of Financial
Assets
Gross amount
of recognised
Financial
Asset
Gross amount of
Financial
Liabilities offset
in the Statement
of Financial
Position
Net amount of
Financial Asset
presented in the
Statement of
Financial
Position
Gross amounts not offset in
the Statement of Financial
Position
Net amount
Financial
Instrument
Cash
Collateral
received
EUR EUR EUR EUR EUR EUR
Derivatives
HSBC Bank Plc 4,466,677 - 4,466,677 (4,466,677) - -
4,466,677 - 4,466,677 (4,466,677) - -
Financial liabilities which are subject to enforceable master netting arrangements or similar agreements, are detailed in
the following table.
Description of type
of Financial
Liabilities
Gross amount
of recognised
Financial
Liabilities
Gross amounts of
Financial
Assets offset
in the Statement
of Financial
Position
Net amount of
Financial
Liabilities
presented in the
Statement of
Financial
Position
Gross amounts not offset in
the Statement of Financial
Position
Net amount
Financial
Instrument
Cash
Collateral
pledged
EUR EUR EUR EUR EUR EUR
Derivatives
HSBC Bank Plc (36,528,825) - (36,528,825) 4,466,677 32,062,148 -
(36,528,825) - (36,528,825) 4,466,677 32,062,148 -

ALGEBRIS UCITS FUNDS PLC
Notes to the Financial Statements (continued)
for the financial year ended 31 December 2019
149
14. Risks associated with financial instruments (continued)
(d) Offsetting Financial Instruments (continued)
Algebris Allocation Fund
31 December 2018
Financial assets which are subject to enforceable master netting arrangements or similar agreements are detailed in the
following table.
Description of type
of Financial Assets
Gross amount
of recognised
Financial
Asset
Gross amount of
Financial
Liabilities offset
in the Statement
of Financial
Position
Net amount of
Financial Asset
presented in the
Statement of
Financial
Position
Gross amounts not offset in
the Statement of Financial
Position
Net amount
Financial
Instrument
Cash
Collateral
received
EUR EUR EUR EUR EUR EUR
Derivatives
HSBC Bank Plc 241,406 - 241,406 (241,406) - -
241,406 - 241,406 (241,406) - -
Financial liabilities which are subject to enforceable master netting arrangements or similar agreements are detailed in
the following table.
Description of type
of Financial
Liabilities
Gross amount
of recognised
Financial
Liabilities
Gross amounts of
Financial
Assets offset
in the Statement
of Financial
Position
Net amount of
Financial
Liabilities
presented in the
Statement of
Financial
Position
Gross amounts not offset in
the Statement of Financial
Position
Net amount
Financial
Instrument
Cash
Collateral
pledged
EUR EUR EUR EUR EUR EUR
Derivatives
HSBC Bank Plc (841,908) - (841,908) 241,406 489,058 (111,444)
(841,908) - (841,908) 241,406 489,058 (111,444)

ALGEBRIS UCITS FUNDS PLC
Notes to the Financial Statements (continued)
for the financial year ended 31 December 2019
150
14. Risks associated with financial instruments (continued)
(d) Offsetting Financial Instruments (continued)
Algebris Financial Equity Fund
31 December 2018
Financial assets which are subject to enforceable master netting arrangements or similar agreements are detailed in the
following table.
Description of type
of Financial Assets
Gross amount
of recognised
Financial
Asset
Gross amount of
Financial
Liabilities offset
in the Statement
of Financial
Position
Net amount of
Financial Asset
presented in the
Statement of
Financial
Position
Gross amounts not offset in
the Statement of Financial
Position
Net amount
Financial
Instrument
Cash
Collateral
received
EUR EUR EUR EUR EUR EUR
Derivatives
HSBC Bank Plc 4,119,651 - 4,119,651 (4,119,651) - -
Morgan Stanley 929,305 - 929,305 (127,446) - 801,859
5,048,956 - 5,048,956 (4,247,097) - 801,859
Financial liabilities which are subject to enforceable master netting arrangements or similar agreements are detailed in
the following table.
Description of type
of Financial
Liabilities
Gross amount
of recognised
Financial
Liabilities
Gross amounts of
Financial
Assets offset
in the Statement
of Financial
Position
Net amount of
Financial
Liabilities
presented in the
Statement of
Financial
Position
Gross amounts not offset in
the Statement of Financial
Position
Net amount
Financial
Instrument
Cash
Collateral
pledged
EUR EUR EUR EUR EUR EUR
Derivatives
HSBC Bank Plc (9,122,488) - (9,122,488) 4,119,651 5,002,837 -
Morgan Stanley (127,446) - (127,446) 127,446 - -
(9,249,934) - (9,249,934) 4,247,097 5,002,837 -
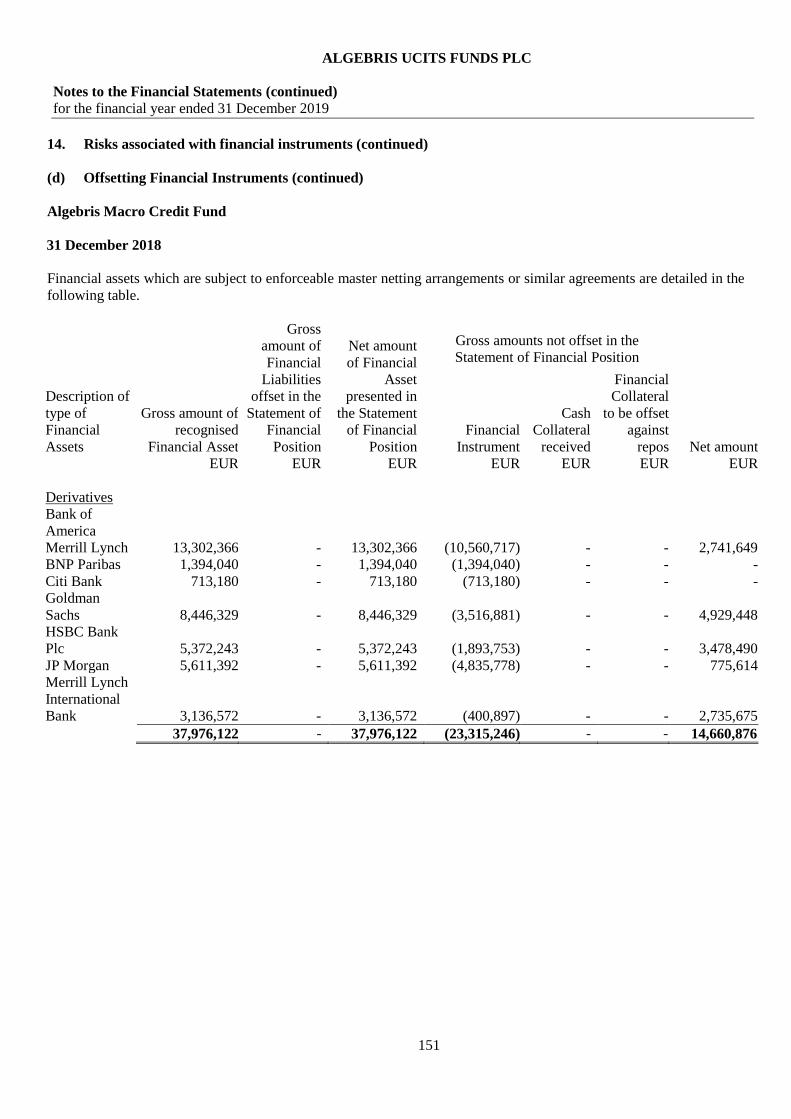
ALGEBRIS UCITS FUNDS PLC
Notes to the Financial Statements (continued)
for the financial year ended 31 December 2019
151
14. Risks associated with financial instruments (continued)
(d) Offsetting Financial Instruments (continued)
Algebris Macro Credit Fund
31 December 2018
Financial assets which are subject to enforceable master netting arrangements or similar agreements are detailed in the
following table.
Description of
type of
Financial
Assets
Gross amount of
recognised
Financial Asset
Gross
amount of
Financial
Liabilities
offset in the
Statement of
Financial
Position
Net amount
of Financial
Asset
presented in
the Statement
of Financial
Position
Gross amounts not offset in the
Statement of Financial Position
Net amount
Financial
Instrument
Cash
Collateral
received
Financial
Collateral
to be offset
against
repos
EUR EUR EUR EUR EUR EUR EUR
Derivatives
Bank of
America
Merrill Lynch 13,302,366 - 13,302,366 (10,560,717) - - 2,741,649
BNP Paribas 1,394,040 - 1,394,040 (1,394,040) - - -
Citi Bank 713,180 - 713,180 (713,180) - - -
Goldman
Sachs 8,446,329 - 8,446,329 (3,516,881) - - 4,929,448
HSBC Bank
Plc 5,372,243 - 5,372,243 (1,893,753) - - 3,478,490
JP Morgan 5,611,392 - 5,611,392 (4,835,778) - - 775,614
Merrill Lynch
International
Bank 3,136,572 - 3,136,572 (400,897) - - 2,735,675
37,976,122 - 37,976,122 (23,315,246) - - 14,660,876
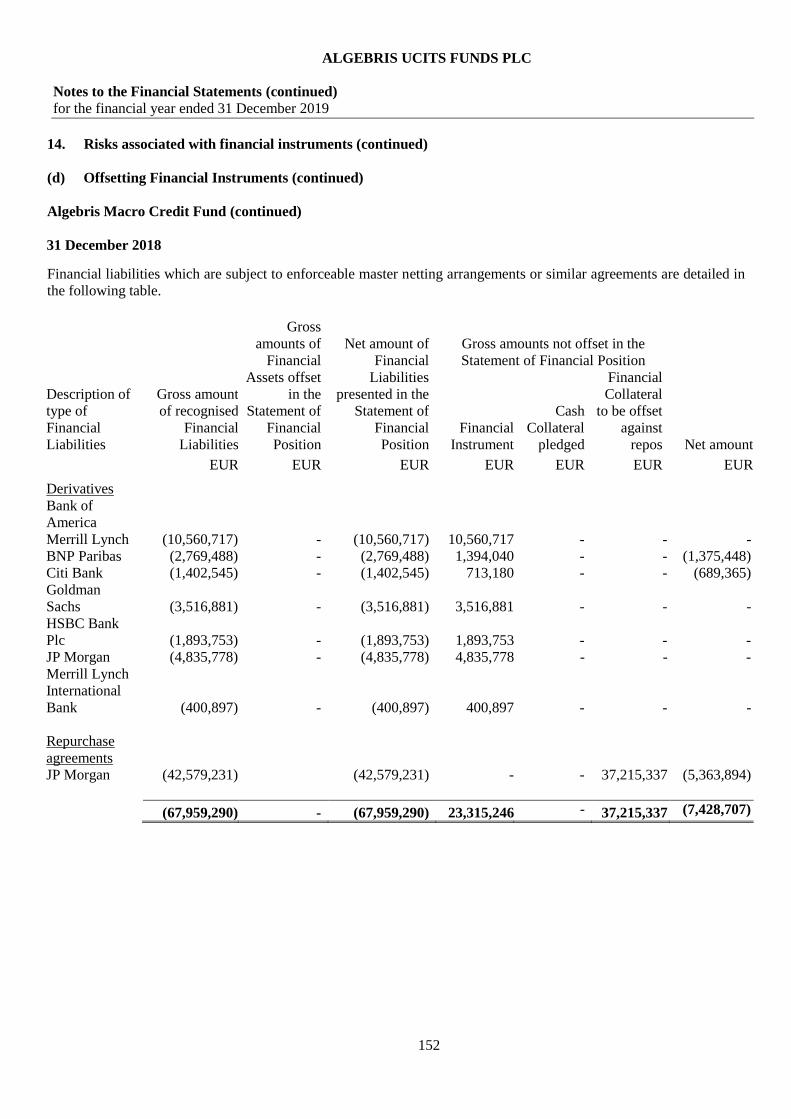
ALGEBRIS UCITS FUNDS PLC
Notes to the Financial Statements (continued)
for the financial year ended 31 December 2019
152
14. Risks associated with financial instruments (continued)
(d) Offsetting Financial Instruments (continued)
Algebris Macro Credit Fund (continued)
31 December 2018
Financial liabilities which are subject to enforceable master netting arrangements or similar agreements are detailed in
the following table.
Description of
type of
Financial
Liabilities
Gross amount
of recognised
Financial
Liabilities
Gross
amounts of
Financial
Assets offset
in the
Statement of
Financial
Position
Net amount of
Financial
Liabilities
presented in the
Statement of
Financial
Position
Gross amounts not offset in the
Statement of Financial Position
Net amount
Financial
Instrument
Cash
Collateral
pledged
Financial
Collateral
to be offset
against
repos
EUR EUR EUR EUR EUR EUR EUR
Derivatives
Bank of
America
Merrill Lynch (10,560,717) - (10,560,717) 10,560,717 - - -
BNP Paribas (2,769,488) - (2,769,488) 1,394,040 - - (1,375,448)
Citi Bank (1,402,545) - (1,402,545) 713,180 - - (689,365)
Goldman
Sachs (3,516,881) - (3,516,881) 3,516,881 - - -
HSBC Bank
Plc (1,893,753) - (1,893,753) 1,893,753 - - -
JP Morgan (4,835,778) - (4,835,778) 4,835,778 - - -
Merrill Lynch
International
Bank (400,897) - (400,897) 400,897 - - -
Repurchase
agreements
JP Morgan (42,579,231) (42,579,231) - - 37,215,337 (5,363,894)
(67,959,290) - (67,959,290) 23,315,246 -
13,000,45
5
37,215,337 (7,428,707)
(30,867,975
)

ALGEBRIS UCITS FUNDS PLC
Notes to the Financial Statements (continued)
for the financial year ended 31 December 2019
153
14. Risks associated with financial instruments (continued)
(d) Offsetting Financial Instruments (continued)
Algebris Core Italy Fund
31 December 2018
Financial assets which are subject to enforceable master netting arrangements or similar agreements are detailed in
the following table.
Description
of type of
Financial
Assets
Gross amount
of recognised
Financial Asset
Gross
amount of
Financial
Liabilities
offset in the
Statement of
Financial
Position
Net amount
of Financial
Asset
presented in
the Statement
of Financial
Position
Gross amounts not offset in the
Statement of Financial Position
Net amount
Financial
Instrument
Cash
Collateral
received
Financial
Collateral to
be offset
against repos
EUR EUR EUR EUR EUR EUR EUR
Derivatives
HSBC Bank
Plc 58,576 - 58,576 (279) - - 58,297
58,576 - 58,576 (279) - - 58,297
Financial liabilities which are subject to enforceable master netting arrangements or similar agreements are detailed
in the following table.
Description
of type of
Financial
Liabilities
Gross amount
of recognised
Financial
Liabilities
Gross amounts
of Financial
Assets offset
in the
Statement of
Financial
Position
Net amount of
Financial
Liabilities
presented in the
Statement of
Financial
Position
Gross amounts not offset in the
Statement of Financial Position
Net amount
Financial
Instrument
Cash
Collateral
pledged
Financial
Collateral
to be offset
against
repos
EUR EUR EUR EUR EUR EUR EUR
Derivatives
HSBC Bank
Plc (279) - (279) 279 - - -
Repurchase
agreements
JP Morgan (271,624) - (271,624) - - 32,513 (239,111)
(271,903) - (271,903) 279 - 32,513 (239,111)

ALGEBRIS UCITS FUNDS PLC
Notes to the Financial Statements (continued)
for the financial year ended 31 December 2019
154
14. Risks associated with financial instruments (continued)
(d) Offsetting Financial Instruments (continued)
Algebris Quant Arbitrage Fund
31 December 2018
Financial assets which are subject to enforceable master netting arrangements or similar agreements are detailed in
the following table.
Description of type
of Financial Assets
Gross amount
of recognised
Financial
Asset
Gross amount of
Financial
Liabilities offset
in the Statement
of Financial
Position
Net amount of
Financial Asset
presented in the
Statement of
Financial
Position
Gross amounts not offset in
the Statement of Financial
Position
Net amount
Financial
Instrument
Cash
Collateral
received
EUR EUR EUR EUR EUR EUR
Derivatives
HSBC Bank Plc 85,603 - 85,603 (2,299) - 83,304
85,603 - 85,603 (2,299) - 83,304
Financial liabilities which are subject to enforceable master netting arrangements or similar agreements are detailed in
the following table.
Description of type
of Financial
Liabilities
Gross amount
of recognised
Financial
Liabilities
Gross amounts of
Financial
Assets offset
in the Statement
of Financial
Position
Net amount of
Financial
Liabilities
presented in the
Statement of
Financial
Position
Gross amounts not offset in
the Statement of Financial
Position
Net amount
Financial
Instrument
Cash
Collateral
pledged
EUR EUR EUR EUR EUR EUR
Derivatives
HSBC Bank Plc (2,299) - (2,299) 2,299 - -
(2,299) - (2,299) 2,299 - -
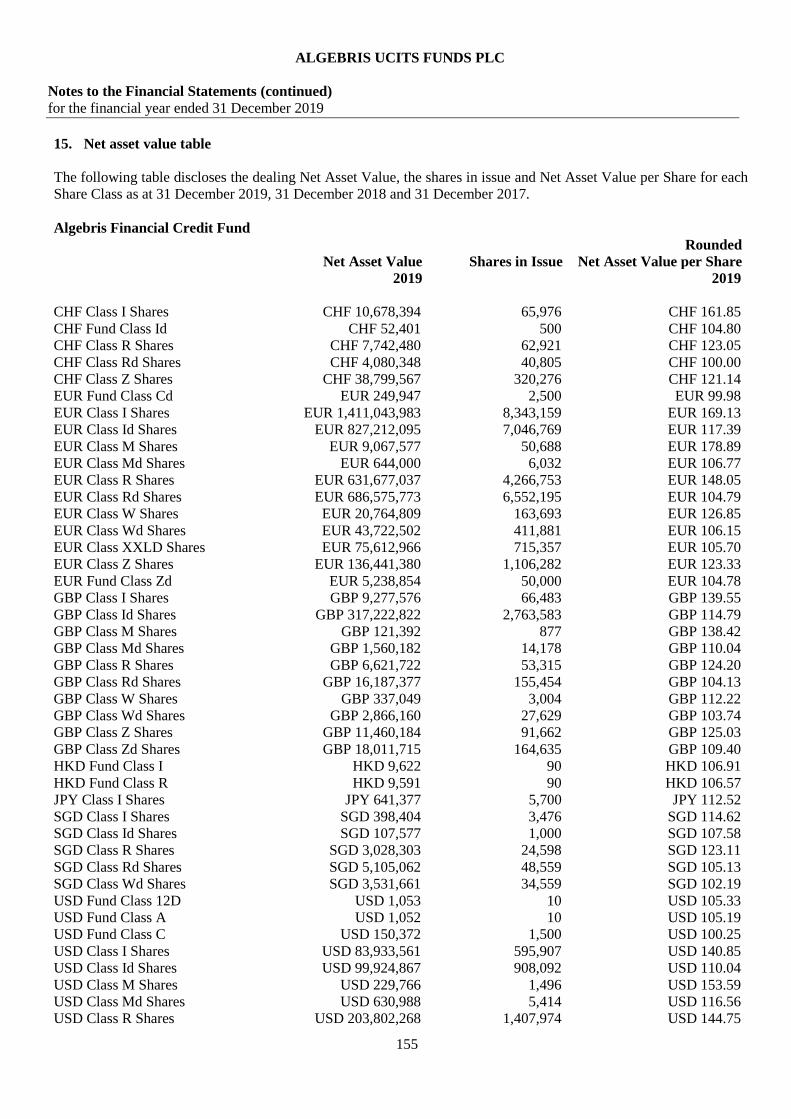
ALGEBRIS UCITS FUNDS PLC
Notes to the Financial Statements (continued)
for the financial year ended 31 December 2019
155
15. Net asset value table
The following table discloses the dealing Net Asset Value, the shares in issue and Net Asset Value per Share for each
Share Class as at 31 December 2019, 31 December 2018 and 31 December 2017.
Algebris Financial Credit Fund
Net Asset Value Shares in Issue
Rounded
Net Asset Value per Share
2019 2019
CHF Class I Shares CHF 10,678,394 65,976 CHF 161.85
CHF Fund Class Id CHF 52,401 500 CHF 104.80
CHF Class R Shares CHF 7,742,480 62,921 CHF 123.05
CHF Class Rd Shares CHF 4,080,348 40,805 CHF 100.00
CHF Class Z Shares CHF 38,799,567 320,276 CHF 121.14
EUR Fund Class Cd EUR 249,947 2,500 EUR 99.98
EUR Class I Shares EUR 1,411,043,983 8,343,159 EUR 169.13
EUR Class Id Shares EUR 827,212,095 7,046,769 EUR 117.39
EUR Class M Shares EUR 9,067,577 50,688 EUR 178.89
EUR Class Md Shares EUR 644,000 6,032 EUR 106.77
EUR Class R Shares EUR 631,677,037 4,266,753 EUR 148.05
EUR Class Rd Shares EUR 686,575,773 6,552,195 EUR 104.79
EUR Class W Shares EUR 20,764,809 163,693 EUR 126.85
EUR Class Wd Shares EUR 43,722,502 411,881 EUR 106.15
EUR Class XXLD Shares EUR 75,612,966 715,357 EUR 105.70
EUR Class Z Shares EUR 136,441,380 1,106,282 EUR 123.33
EUR Fund Class Zd EUR 5,238,854 50,000 EUR 104.78
GBP Class I Shares GBP 9,277,576 66,483 GBP 139.55
GBP Class Id Shares GBP 317,222,822 2,763,583 GBP 114.79
GBP Class M Shares GBP 121,392 877 GBP 138.42
GBP Class Md Shares GBP 1,560,182 14,178 GBP 110.04
GBP Class R Shares GBP 6,621,722 53,315 GBP 124.20
GBP Class Rd Shares GBP 16,187,377 155,454 GBP 104.13
GBP Class W Shares GBP 337,049 3,004 GBP 112.22
GBP Class Wd Shares GBP 2,866,160 27,629 GBP 103.74
GBP Class Z Shares GBP 11,460,184 91,662 GBP 125.03
GBP Class Zd Shares GBP 18,011,715 164,635 GBP 109.40
HKD Fund Class I HKD 9,622 90 HKD 106.91
HKD Fund Class R HKD 9,591 90 HKD 106.57
JPY Class I Shares JPY 641,377 5,700 JPY 112.52
SGD Class I Shares SGD 398,404 3,476 SGD 114.62
SGD Class Id Shares SGD 107,577 1,000 SGD 107.58
SGD Class R Shares SGD 3,028,303 24,598 SGD 123.11
SGD Class Rd Shares SGD 5,105,062 48,559 SGD 105.13
SGD Class Wd Shares SGD 3,531,661 34,559 SGD 102.19
USD Fund Class 12D USD 1,053 10 USD 105.33
USD Fund Class A USD 1,052 10 USD 105.19
USD Fund Class C USD 150,372 1,500 USD 100.25
USD Class I Shares USD 83,933,561 595,907 USD 140.85
USD Class Id Shares USD 99,924,867 908,092 USD 110.04
USD Class M Shares USD 229,766 1,496 USD 153.59
USD Class Md Shares USD 630,988 5,414 USD 116.56
USD Class R Shares USD 203,802,268 1,407,974 USD 144.75
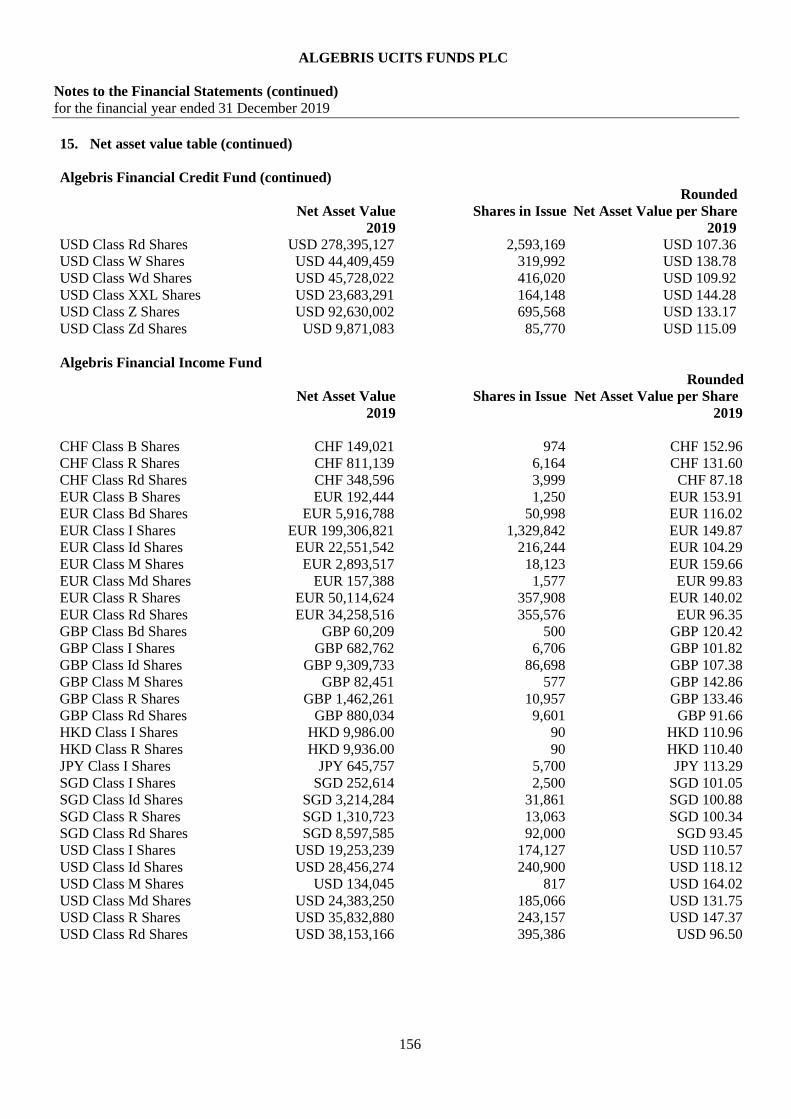
ALGEBRIS UCITS FUNDS PLC
Notes to the Financial Statements (continued)
for the financial year ended 31 December 2019
156
15. Net asset value table (continued)
Algebris Financial Credit Fund (continued)
Net Asset Value Shares in Issue
Rounded
Net Asset Value per Share
2019 2019
USD Class Rd Shares USD 278,395,127 2,593,169 USD 107.36
USD Class W Shares USD 44,409,459 319,992 USD 138.78
USD Class Wd Shares USD 45,728,022 416,020 USD 109.92
USD Class XXL Shares USD 23,683,291 164,148 USD 144.28
USD Class Z Shares USD 92,630,002 695,568 USD 133.17
USD Class Zd Shares USD 9,871,083 85,770 USD 115.09
Algebris Financial Income Fund
Net Asset Value Shares in Issue
Rounded
Net Asset Value per Share
2019 2019
CHF Class B Shares CHF 149,021 974 CHF 152.96
CHF Class R Shares CHF 811,139 6,164 CHF 131.60
CHF Class Rd Shares CHF 348,596 3,999 CHF 87.18
EUR Class B Shares EUR 192,444 1,250 EUR 153.91
EUR Class Bd Shares EUR 5,916,788 50,998 EUR 116.02
EUR Class I Shares EUR 199,306,821 1,329,842 EUR 149.87
EUR Class Id Shares EUR 22,551,542 216,244 EUR 104.29
EUR Class M Shares EUR 2,893,517 18,123 EUR 159.66
EUR Class Md Shares EUR 157,388 1,577 EUR 99.83
EUR Class R Shares EUR 50,114,624 357,908 EUR 140.02
EUR Class Rd Shares EUR 34,258,516 355,576 EUR 96.35
GBP Class Bd Shares GBP 60,209 500 GBP 120.42
GBP Class I Shares GBP 682,762 6,706 GBP 101.82
GBP Class Id Shares GBP 9,309,733 86,698 GBP 107.38
GBP Class M Shares GBP 82,451 577 GBP 142.86
GBP Class R Shares GBP 1,462,261 10,957 GBP 133.46
GBP Class Rd Shares GBP 880,034 9,601 GBP 91.66
HKD Class I Shares HKD 9,986.00 90 HKD 110.96
HKD Class R Shares HKD 9,936.00 90 HKD 110.40
JPY Class I Shares JPY 645,757 5,700 JPY 113.29
SGD Class I Shares SGD 252,614 2,500 SGD 101.05
SGD Class Id Shares SGD 3,214,284 31,861 SGD 100.88
SGD Class R Shares SGD 1,310,723 13,063 SGD 100.34
SGD Class Rd Shares SGD 8,597,585 92,000 SGD 93.45
USD Class I Shares USD 19,253,239 174,127 USD 110.57
USD Class Id Shares USD 28,456,274 240,900 USD 118.12
USD Class M Shares USD 134,045 817 USD 164.02
USD Class Md Shares USD 24,383,250 185,066 USD 131.75
USD Class R Shares USD 35,832,880 243,157 USD 147.37
USD Class Rd Shares USD 38,153,166 395,386 USD 96.50

ALGEBRIS UCITS FUNDS PLC
Notes to the Financial Statements (continued)
for the financial year ended 31 December 2019
157
15. Net asset value table (continued)
Algebris Allocation Fund
Net Asset Value Shares in Issue
Rounded
Net Asset Value per Share
2019 2019
CHF Class R Shares CHF 25,316 264 CHF 96.00
EUR Class B Shares EUR 1,064 10 EUR 106.40
EUR Class I Shares EUR 7,740,911 75,327 EUR 102.76
EUR Class M Shares EUR 313,983 2,946 EUR 106.57
EUR Class R Shares EUR 1,521,028 15,513 EUR 98.05
JPY Class B Shares JPY 132,368 1,250 JPY 105.89
Algebris Financial Equity Fund
Net Asset Value Shares in Issue
Rounded
Net Asset Value per Share
2019 2019
CHF Class B Shares CHF 3,261,105 22,530 CHF 144.74
CHF Class R Shares CHF 169,544 1,253 CHF 135.26
EUR Class B Shares EUR 12,552,301 104,820 EUR 119.75
EUR Class Bm Shares EUR 616,003 387 EUR 1,591.33
EUR Class I Shares EUR 17,407,558 152,116 EUR 114.44
EUR Class M Shares EUR 3,770,073 29,164 EUR 129.27
EUR Class R Shares EUR 2,524,933 24,375 EUR 103.59
EUR Class Rm Shares EUR 24 - EUR 1,208.90
GBP Class B Shares GBP 965,948 10,289 GBP 93.88
GBP Class I Shares GBP 15,271 148 GBP 103.46
GBP Class M Shares GBP 638,748 4,840 GBP 131.98
GBP Class Md Shares GBP 2,560,781 31,151 GBP 82.20
GBP Class Mm Shares GBP 15,903 8 GBP 1,884.20
JPY Class B Shares JPY 608,075 5,700 JPY 106.68
USD Class B Shares USD 18,300,100 140,097 USD 130.62
USD Class Bm Shares USD 231,959 125 USD 1,855.68
USD Class M Shares USD 3,033,064 21,534 USD 140.85
USD Class Md Shares USD 9,271,900 83,089 USD 111.59
USD Class Mm Shares USD 49,611 18 USD 2,773.09
Algebris Macro Credit Fund
Net Asset Value Shares in Issue
Rounded
Net Asset Value per Share
2019 2019
CHF Class B Shares CHF 339,997 2,978 CHF 114.18
EUR Class B Shares EUR 1,064,286 9,075 EUR 117.27
EUR Class Bd Shares EUR 10,474,211 100,000 EUR 104.74
EUR Class I Shares EUR 25,014,725 217,652 EUR 114.93
EUR Class Id Shares EUR 19,674,161 192,271 EUR 102.33
EUR Class M Shares EUR 4,919,566 40,234 EUR 122.27

ALGEBRIS UCITS FUNDS PLC
Notes to the Financial Statements (continued)
for the financial year ended 31 December 2019
158
15. Net asset value table (continued)
Algebris Macro Credit Fund (continued)
Net Asset Value Shares in Issue
Rounded
Net Asset Value per Share
2019 2019
EUR Class Md Shares EUR 84,544 800 EUR 105.68
EUR Class R Shares EUR 157,080,549 1,386,269 EUR 113.31
EUR Class Rd Shares EUR 300,893,242 2,927,265 EUR 102.79
GBP Class B Shares GBP 18,234 150 GBP 121.77
GBP Class I Shares GBP 166,849 1,562 GBP 106.85
GBP Class Id Shares GBP 428,828 4,272 GBP 100.37
GBP Class M Shares GBP 16,310 148 GBP 110.08
GBP Class Md Shares GBP 46,908 445 GBP 105.38
GBP Class R Shares GBP 101,310 893 GBP 113.45
JPY Class I Shares JPY 646,701 5,700 JPY 113.46
USD Class B Shares USD 63,545 500 USD 127.09
USD Class I Shares USD 2,748,620 25,546 USD 107.59
USD Class M Shares USD 4,181,800 33,324 USD 125.49
USD Class MD Shares USD 1,248,964 10,734 USD 116.36
USD Class R Shares USD 1,328,192 11,211 USD 118.47
Algebris Core Italy Fund
Net Asset Value Shares in Issue
Rounded
Net Asset Value per Share
2019 2019
EUR Class Eb Shares EUR 25,433,396 229,026 EUR 111.05
EUR Class I Shares EUR 1,135 10 EUR 113.49
EUR Class M Shares EUR 23,160,288 206,250 EUR 112.29
EUR Class R Shares EUR 347,134 3,253 EUR 106.73
JPY Class I Shares JPY 142,352 1,250 JPY 113.88
USD Class I Shares USD 1,264 11 USD 114.91
Algebris Quant Arbitrage Fund
Net Asset Value Shares in Issue
Rounded
Net Asset Value per Share
2019 2019
EUR Class Eb Shares EUR 23,112,451 230,850 EUR 100.12
EUR Class I Shares EUR 651,666 6,420 EUR 101.50
EUR Class M Shares EUR 11,492,207 113,850 EUR 100.94
EUR Class R Shares EUR 1,012 10 EUR 101.16
GBP Class EB Shares GBP 1,030 10 GBP 103.00
GBP Class M Shares GBP 4,617 45 GBP 102.99
JPY Fund Class I JPY 127,254 1,250 JPY 101.80
USD Class EB Shares USD 104,479 1,000 USD 104.48
USD Class I Shares USD 1,131 11 USD 102.81
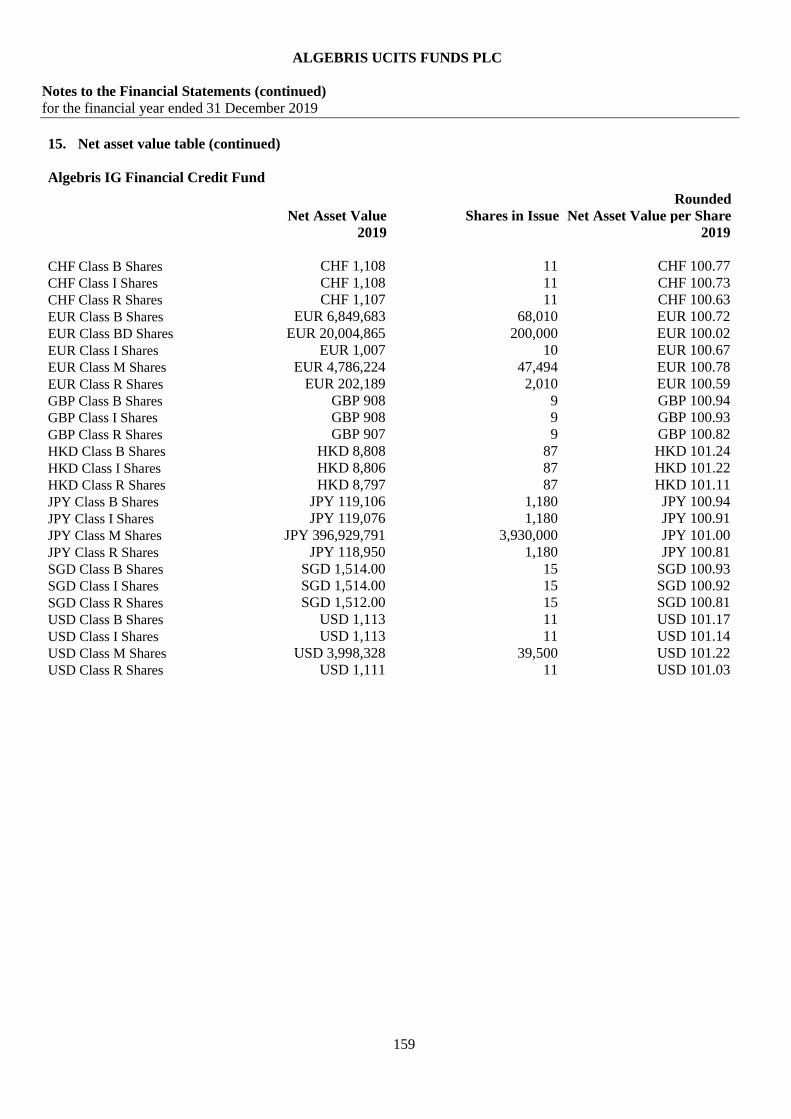
ALGEBRIS UCITS FUNDS PLC
Notes to the Financial Statements (continued)
for the financial year ended 31 December 2019
159
15. Net asset value table (continued)
Algebris IG Financial Credit Fund
Net Asset Value Shares in Issue
Rounded
Net Asset Value per Share
2019 2019
CHF Class B Shares CHF 1,108 11 CHF 100.77
CHF Class I Shares CHF 1,108 11 CHF 100.73
CHF Class R Shares CHF 1,107 11 CHF 100.63
EUR Class B Shares EUR 6,849,683 68,010 EUR 100.72
EUR Class BD Shares EUR 20,004,865 200,000 EUR 100.02
EUR Class I Shares EUR 1,007 10 EUR 100.67
EUR Class M Shares EUR 4,786,224 47,494 EUR 100.78
EUR Class R Shares EUR 202,189 2,010 EUR 100.59
GBP Class B Shares GBP 908 9 GBP 100.94
GBP Class I Shares GBP 908 9 GBP 100.93
GBP Class R Shares GBP 907 9 GBP 100.82
HKD Class B Shares HKD 8,808 87 HKD 101.24
HKD Class I Shares HKD 8,806 87 HKD 101.22
HKD Class R Shares HKD 8,797 87 HKD 101.11
JPY Class B Shares JPY 119,106 1,180 JPY 100.94
JPY Class I Shares JPY 119,076 1,180 JPY 100.91
JPY Class M Shares JPY 396,929,791 3,930,000 JPY 101.00
JPY Class R Shares JPY 118,950 1,180 JPY 100.81
SGD Class B Shares SGD 1,514.00 15 SGD 100.93
SGD Class I Shares SGD 1,514.00 15 SGD 100.92
SGD Class R Shares SGD 1,512.00 15 SGD 100.81
USD Class B Shares USD 1,113 11 USD 101.17
USD Class I Shares USD 1,113 11 USD 101.14
USD Class M Shares USD 3,998,328 39,500 USD 101.22
USD Class R Shares USD 1,111 11 USD 101.03
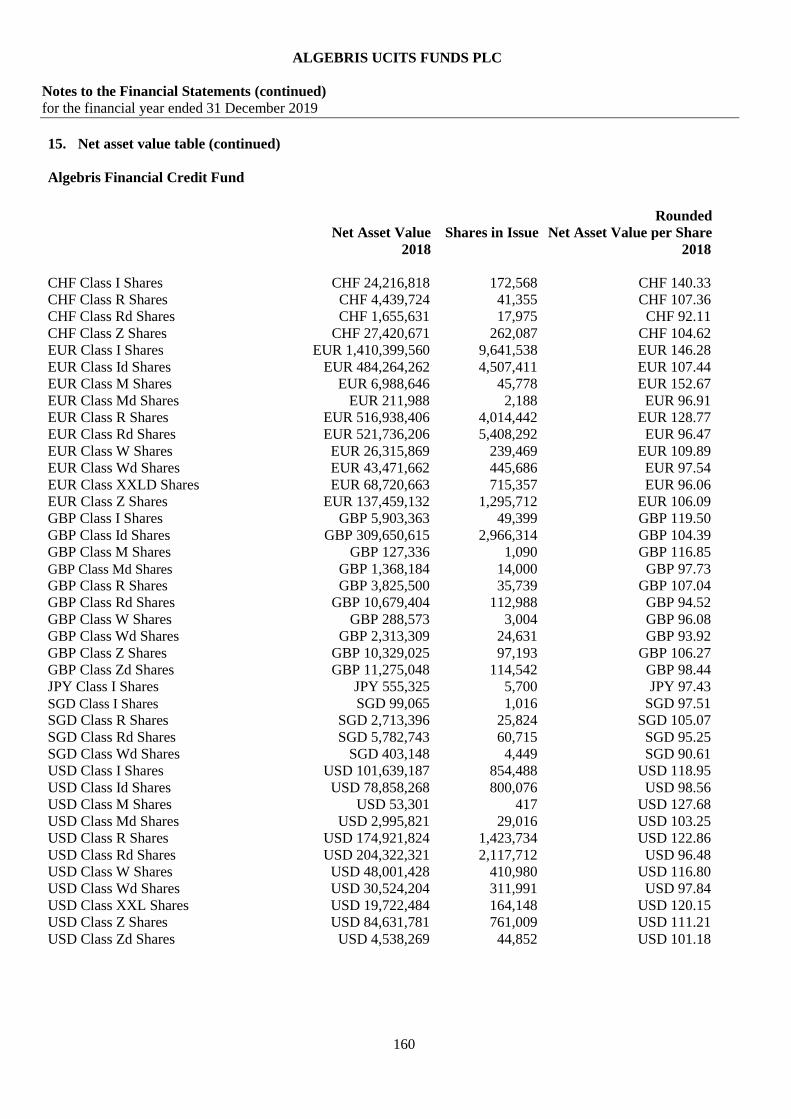
ALGEBRIS UCITS FUNDS PLC
Notes to the Financial Statements (continued)
for the financial year ended 31 December 2019
160
15. Net asset value table (continued)
Algebris Financial Credit Fund
Net Asset Value Shares in Issue
Rounded
Net Asset Value per Share
2018 2018
CHF Class I Shares CHF 24,216,818 172,568 CHF 140.33
CHF Class R Shares CHF 4,439,724 41,355 CHF 107.36
CHF Class Rd Shares CHF 1,655,631 17,975 CHF 92.11
CHF Class Z Shares CHF 27,420,671 262,087 CHF 104.62
EUR Class I Shares EUR 1,410,399,560 9,641,538 EUR 146.28
EUR Class Id Shares EUR 484,264,262 4,507,411 EUR 107.44
EUR Class M Shares EUR 6,988,646 45,778 EUR 152.67
EUR Class Md Shares EUR 211,988 2,188 EUR 96.91
EUR Class R Shares EUR 516,938,406 4,014,442 EUR 128.77
EUR Class Rd Shares EUR 521,736,206 5,408,292 EUR 96.47
EUR Class W Shares EUR 26,315,869 239,469 EUR 109.89
EUR Class Wd Shares EUR 43,471,662 445,686 EUR 97.54
EUR Class XXLD Shares EUR 68,720,663 715,357 EUR 96.06
EUR Class Z Shares EUR 137,459,132 1,295,712 EUR 106.09
GBP Class I Shares GBP 5,903,363 49,399 GBP 119.50
GBP Class Id Shares GBP 309,650,615 2,966,314 GBP 104.39
GBP Class M Shares GBP 127,336 1,090 GBP 116.85
GBP Class Md Shares GBP 1,368,184 14,000 GBP 97.73
GBP Class R Shares GBP 3,825,500 35,739 GBP 107.04
GBP Class Rd Shares GBP 10,679,404 112,988 GBP 94.52
GBP Class W Shares GBP 288,573 3,004 GBP 96.08
GBP Class Wd Shares GBP 2,313,309 24,631 GBP 93.92
GBP Class Z Shares GBP 10,329,025 97,193 GBP 106.27
GBP Class Zd Shares GBP 11,275,048 114,542 GBP 98.44
JPY Class I Shares JPY 555,325 5,700 JPY 97.43
SGD Class I Shares SGD 99,065 1,016 SGD 97.51
SGD Class R Shares SGD 2,713,396 25,824 SGD 105.07
SGD Class Rd Shares SGD 5,782,743 60,715 SGD 95.25
SGD Class Wd Shares SGD 403,148 4,449 SGD 90.61
USD Class I Shares USD 101,639,187 854,488 USD 118.95
USD Class Id Shares USD 78,858,268 800,076 USD 98.56
USD Class M Shares USD 53,301 417 USD 127.68
USD Class Md Shares USD 2,995,821 29,016 USD 103.25
USD Class R Shares USD 174,921,824 1,423,734 USD 122.86
USD Class Rd Shares USD 204,322,321 2,117,712 USD 96.48
USD Class W Shares USD 48,001,428 410,980 USD 116.80
USD Class Wd Shares USD 30,524,204 311,991 USD 97.84
USD Class XXL Shares USD 19,722,484 164,148 USD 120.15
USD Class Z Shares USD 84,631,781 761,009 USD 111.21
USD Class Zd Shares USD 4,538,269 44,852 USD 101.18
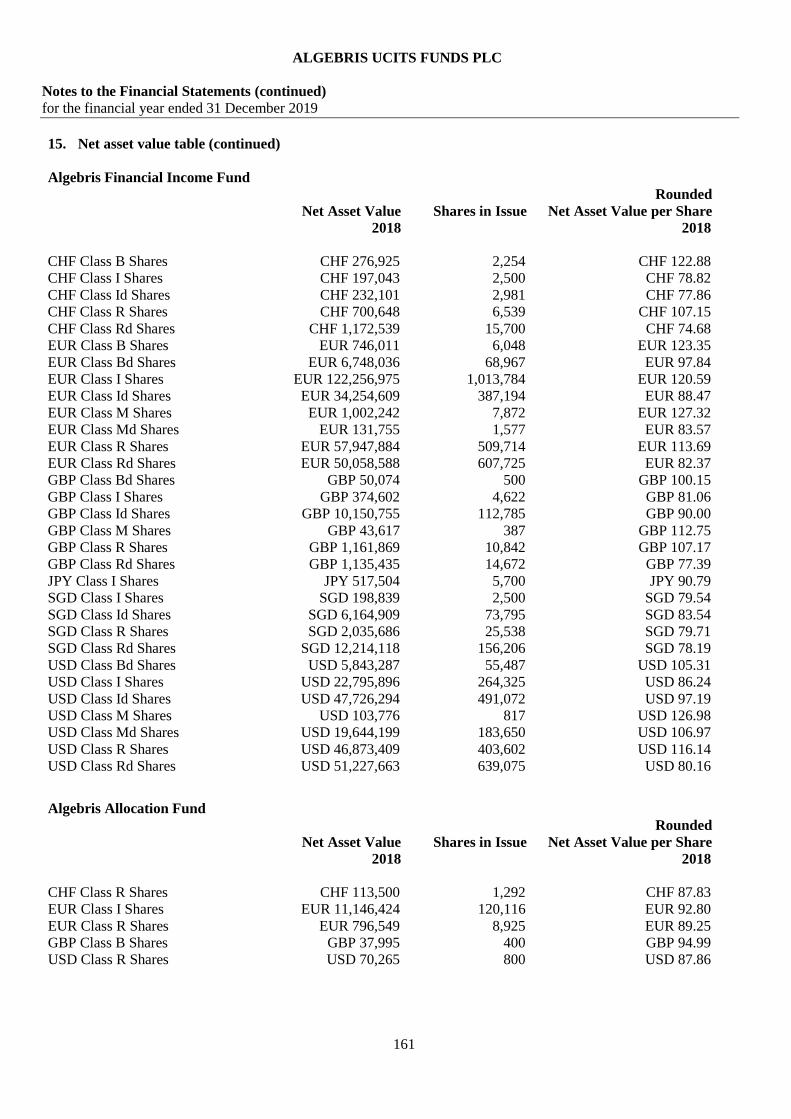
ALGEBRIS UCITS FUNDS PLC
Notes to the Financial Statements (continued)
for the financial year ended 31 December 2019
161
15. Net asset value table (continued)
Algebris Financial Income Fund
Net Asset Value Shares in Issue
Rounded
Net Asset Value per Share
2018 2018
CHF Class B Shares CHF 276,925 2,254 CHF 122.88
CHF Class I Shares CHF 197,043 2,500 CHF 78.82
CHF Class Id Shares CHF 232,101 2,981 CHF 77.86
CHF Class R Shares CHF 700,648 6,539 CHF 107.15
CHF Class Rd Shares CHF 1,172,539 15,700 CHF 74.68
EUR Class B Shares EUR 746,011 6,048 EUR 123.35
EUR Class Bd Shares EUR 6,748,036 68,967 EUR 97.84
EUR Class I Shares EUR 122,256,975 1,013,784 EUR 120.59
EUR Class Id Shares EUR 34,254,609 387,194 EUR 88.47
EUR Class M Shares EUR 1,002,242 7,872 EUR 127.32
EUR Class Md Shares EUR 131,755 1,577 EUR 83.57
EUR Class R Shares EUR 57,947,884 509,714 EUR 113.69
EUR Class Rd Shares EUR 50,058,588 607,725 EUR 82.37
GBP Class Bd Shares GBP 50,074 500 GBP 100.15
GBP Class I Shares GBP 374,602 4,622 GBP 81.06
GBP Class Id Shares GBP 10,150,755 112,785 GBP 90.00
GBP Class M Shares GBP 43,617 387 GBP 112.75
GBP Class R Shares GBP 1,161,869 10,842 GBP 107.17
GBP Class Rd Shares GBP 1,135,435 14,672 GBP 77.39
JPY Class I Shares JPY 517,504 5,700 JPY 90.79
SGD Class I Shares SGD 198,839 2,500 SGD 79.54
SGD Class Id Shares SGD 6,164,909 73,795 SGD 83.54
SGD Class R Shares SGD 2,035,686 25,538 SGD 79.71
SGD Class Rd Shares SGD 12,214,118 156,206 SGD 78.19
USD Class Bd Shares USD 5,843,287 55,487 USD 105.31
USD Class I Shares USD 22,795,896 264,325 USD 86.24
USD Class Id Shares USD 47,726,294 491,072 USD 97.19
USD Class M Shares USD 103,776 817 USD 126.98
USD Class Md Shares USD 19,644,199 183,650 USD 106.97
USD Class R Shares USD 46,873,409 403,602 USD 116.14
USD Class Rd Shares USD 51,227,663 639,075 USD 80.16
Algebris Allocation Fund
Net Asset Value Shares in Issue
Rounded
Net Asset Value per Share
2018 2018
CHF Class R Shares CHF 113,500 1,292 CHF 87.83
EUR Class I Shares EUR 11,146,424 120,116 EUR 92.80
EUR Class R Shares EUR 796,549 8,925 EUR 89.25
GBP Class B Shares GBP 37,995 400 GBP 94.99
USD Class R Shares USD 70,265 800 USD 87.86

ALGEBRIS UCITS FUNDS PLC
Notes to the Financial Statements (continued)
for the financial year ended 31 December 2019
162
15. Net asset value table (continued)
Algebris Financial Equity Fund
Net Asset Value Shares in Issue
Rounded
Net Asset Value per Share
2018 2018
CHF Class B Shares CHF 3,015,667 26,000 CHF 115.99
CHF Class R Shares CHF 192,203 1,755 CHF 109.50
EUR Class B Shares EUR 16,311,707 170,292 EUR 95.79
EUR Class Bm Shares EUR 643,222 505 EUR 1,272.87
EUR Class I Shares EUR 19,317,973 210,516 EUR 91.76
EUR Class M Shares EUR 1,692,575 16,533 EUR 102.37
EUR Class R Shares EUR 2,312,855 27,636 EUR 83.69
EUR Class Rm Shares EUR 47,962 50 EUR 959.44
GBP Class B Shares GBP 2,917,631 39,328 GBP 74.19
GBP Class I Shares GBP 5,639 68 GBP 83.18
GBP Class M Shares GBP 425,105 4,105 GBP 103.57
GBP Class Md Shares GBP 2,095,243 31,618 GBP 66.27
GBP Class Mm Shares GBP 12,476 8 GBP 1,478.16
JPY Class B Shares JPY 484,571 5,700 JPY 85.01
USD Class B Shares USD 15,274,489 150,523 USD 101.48
USD Class Bm Shares USD 180,121 125 USD 1,440.96
USD Class M Shares USD 2,331,786 21,534 USD 108.29
USD Class Md Shares USD 17,800,230 202,489 USD 87.91
USD Class Mm Shares USD 38,139 18 USD 2,131.88
Algebris Macro Credit Fund
Net Asset Value Shares in Issue
Rounded
Net Asset Value per Share
2018 2018
CHF Class B Shares CHF 282,164 2,978 CHF 94.76
CHF Class Bd Shares CHF 98,224 1,100 CHF 89.29
CHF Class I Shares CHF 86,797 970 CHF 89.48
CHF Class R Shares CHF 27,536 303 CHF 90.99
EUR Class B Shares EUR 6,121,129 63,098 EUR 97.01
EUR Class Bd Shares EUR 37,667,450 420,382 EUR 89.60
EUR Class I Shares EUR 44,448,494 466,222 EUR 95.34
EUR Class Id Shares EUR 16,873,883 192,271 EUR 87.76
EUR Class M Shares EUR 5,005,742 50,093 EUR 99.93
EUR Class Md Shares EUR 72,343 800 EUR 90.43
EUR Class R Shares EUR 190,249,726 2,014,646 EUR 94.43
EUR Class Rd Shares EUR 395,495,687 4,485,465 EUR 88.17
GBP Class B Shares GBP 1,900,910 19,150 GBP 99.27
GBP Class I Shares GBP 54,045 613 GBP 88.17
GBP Class Id Shares GBP 255,700 3,007 GBP 85.04
GBP Class M Shares GBP 9,846 111 GBP 88.82
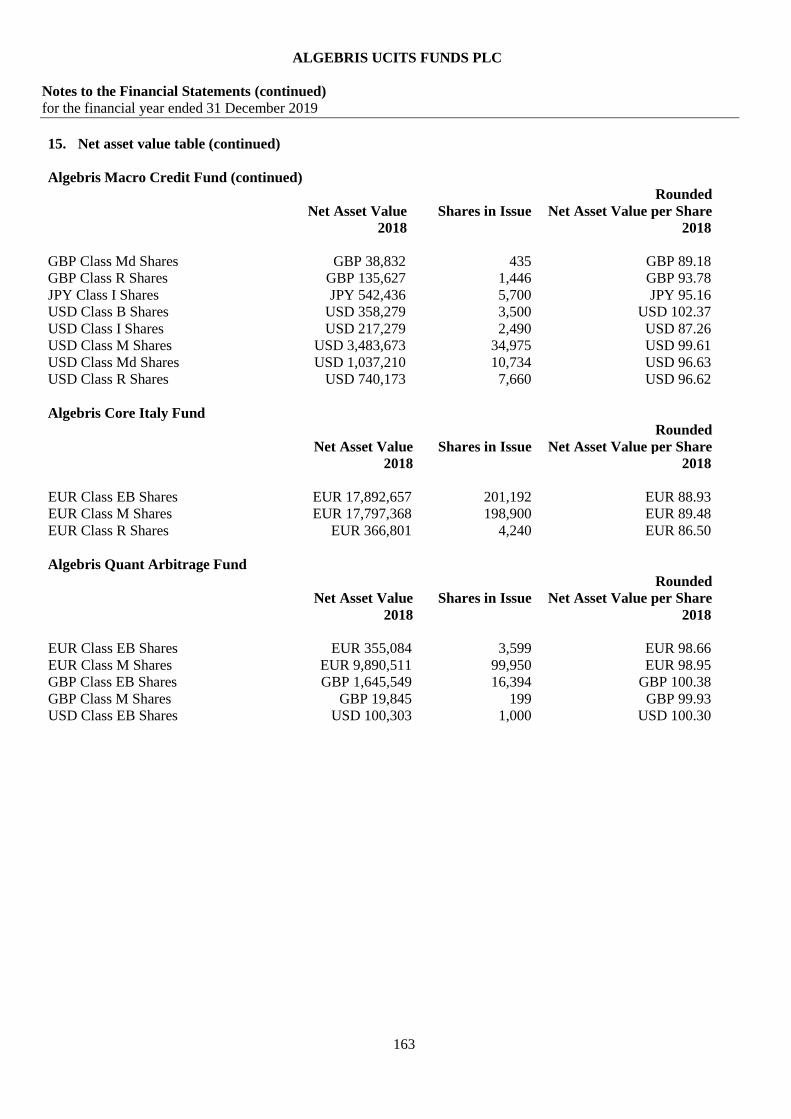
ALGEBRIS UCITS FUNDS PLC
Notes to the Financial Statements (continued)
for the financial year ended 31 December 2019
163
15. Net asset value table (continued)
Algebris Macro Credit Fund (continued)
Net Asset Value Shares in Issue
Rounded
Net Asset Value per Share
2018 2018
GBP Class Md Shares GBP 38,832 435 GBP 89.18
GBP Class R Shares GBP 135,627 1,446 GBP 93.78
JPY Class I Shares JPY 542,436 5,700 JPY 95.16
USD Class B Shares USD 358,279 3,500 USD 102.37
USD Class I Shares USD 217,279 2,490 USD 87.26
USD Class M Shares USD 3,483,673 34,975 USD 99.61
USD Class Md Shares USD 1,037,210 10,734 USD 96.63
USD Class R Shares USD 740,173 7,660 USD 96.62
Algebris Core Italy Fund
Net Asset Value Shares in Issue
Rounded
Net Asset Value per Share
2018 2018
EUR Class EB Shares EUR 17,892,657 201,192 EUR 88.93
EUR Class M Shares EUR 17,797,368 198,900 EUR 89.48
EUR Class R Shares EUR 366,801 4,240 EUR 86.50
Algebris Quant Arbitrage Fund
Net Asset Value Shares in Issue
Rounded
Net Asset Value per Share
2018 2018
EUR Class EB Shares EUR 355,084 3,599 EUR 98.66
EUR Class M Shares EUR 9,890,511 99,950 EUR 98.95
GBP Class EB Shares GBP 1,645,549 16,394 GBP 100.38
GBP Class M Shares GBP 19,845 199 GBP 99.93
USD Class EB Shares USD 100,303 1,000 USD 100.30
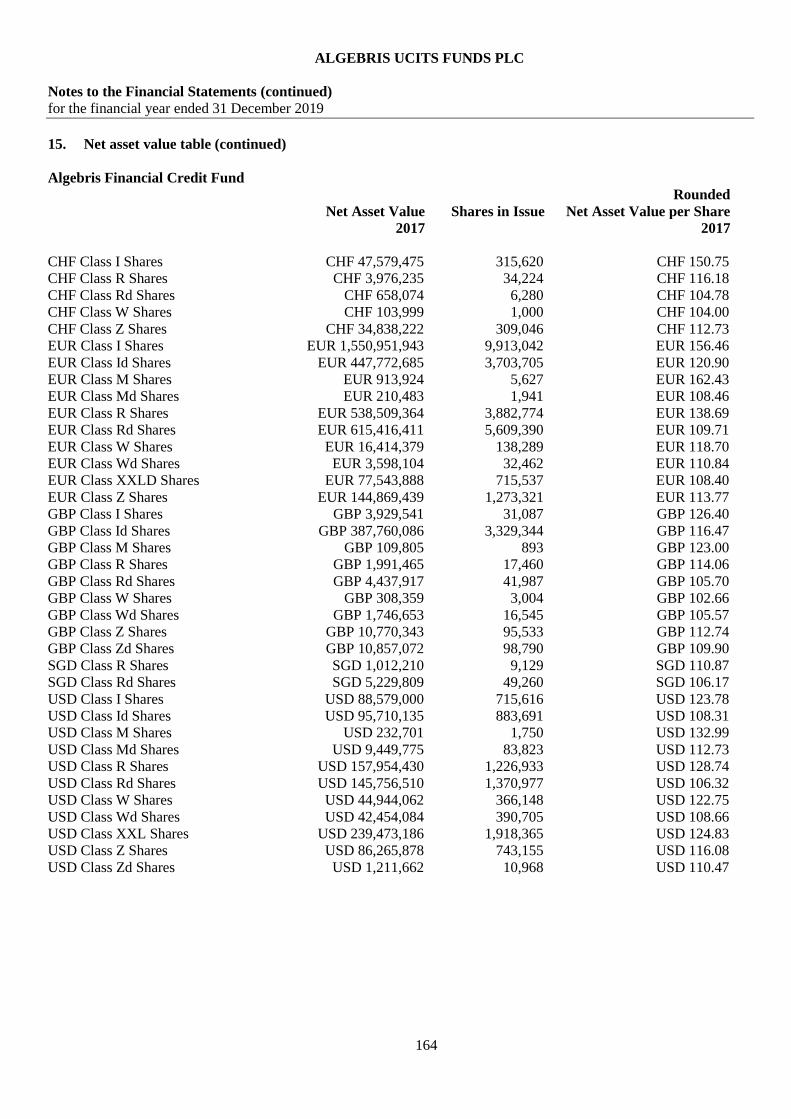
ALGEBRIS UCITS FUNDS PLC
Notes to the Financial Statements (continued)
for the financial year ended 31 December 2019
164
15. Net asset value table (continued)
Algebris Financial Credit Fund
Net Asset Value Shares in Issue
Rounded
Net Asset Value per Share
2017 2017
CHF Class I Shares CHF 47,579,475 315,620 CHF 150.75
CHF Class R Shares CHF 3,976,235 34,224 CHF 116.18
CHF Class Rd Shares CHF 658,074 6,280 CHF 104.78
CHF Class W Shares CHF 103,999 1,000 CHF 104.00
CHF Class Z Shares CHF 34,838,222 309,046 CHF 112.73
EUR Class I Shares EUR 1,550,951,943 9,913,042 EUR 156.46
EUR Class Id Shares EUR 447,772,685 3,703,705 EUR 120.90
EUR Class M Shares EUR 913,924 5,627 EUR 162.43
EUR Class Md Shares EUR 210,483 1,941 EUR 108.46
EUR Class R Shares EUR 538,509,364 3,882,774 EUR 138.69
EUR Class Rd Shares EUR 615,416,411 5,609,390 EUR 109.71
EUR Class W Shares EUR 16,414,379 138,289 EUR 118.70
EUR Class Wd Shares EUR 3,598,104 32,462 EUR 110.84
EUR Class XXLD Shares EUR 77,543,888 715,537 EUR 108.40
EUR Class Z Shares EUR 144,869,439 1,273,321 EUR 113.77
GBP Class I Shares GBP 3,929,541 31,087 GBP 126.40
GBP Class Id Shares GBP 387,760,086 3,329,344 GBP 116.47
GBP Class M Shares GBP 109,805 893 GBP 123.00
GBP Class R Shares GBP 1,991,465 17,460 GBP 114.06
GBP Class Rd Shares GBP 4,437,917 41,987 GBP 105.70
GBP Class W Shares GBP 308,359 3,004 GBP 102.66
GBP Class Wd Shares GBP 1,746,653 16,545 GBP 105.57
GBP Class Z Shares GBP 10,770,343 95,533 GBP 112.74
GBP Class Zd Shares GBP 10,857,072 98,790 GBP 109.90
SGD Class R Shares SGD 1,012,210 9,129 SGD 110.87
SGD Class Rd Shares SGD 5,229,809 49,260 SGD 106.17
USD Class I Shares USD 88,579,000 715,616 USD 123.78
USD Class Id Shares USD 95,710,135 883,691 USD 108.31
USD Class M Shares USD 232,701 1,750 USD 132.99
USD Class Md Shares USD 9,449,775 83,823 USD 112.73
USD Class R Shares USD 157,954,430 1,226,933 USD 128.74
USD Class Rd Shares USD 145,756,510 1,370,977 USD 106.32
USD Class W Shares USD 44,944,062 366,148 USD 122.75
USD Class Wd Shares USD 42,454,084 390,705 USD 108.66
USD Class XXL Shares USD 239,473,186 1,918,365 USD 124.83
USD Class Z Shares USD 86,265,878 743,155 USD 116.08
USD Class Zd Shares USD 1,211,662 10,968 USD 110.47

ALGEBRIS UCITS FUNDS PLC
Notes to the Financial Statements (continued)
for the financial year ended 31 December 2019
165
15. Net asset value table (continued)
Algebris Financial Income Fund
Net Asset Value Shares in Issue
Rounded
Net Asset Value per Share
2017 2017
CHF Class B Shares CHF 428,478 2,874 CHF 149.07
CHF Class R Shares CHF 361,850 2,750 CHF 131.58
EUR Class B Shares EUR 6,768,486 45,389 EUR 149.12
EUR Class Bd Shares EUR 12,211,935 99,115 EUR 123.21
EUR Class I Shares EUR 90,186,386 616,173 EUR 146.37
EUR Class Id Shares EUR 17,788,056 159,320 EUR 111.65
EUR Class M Shares EUR 1,090,421 7,121 EUR 153.13
EUR Class Md Shares EUR 275,359 2,601 EUR 105.85
EUR Class R Shares EUR 26,210,148 188,243 EUR 139.24
EUR Class Rd Shares EUR 2,088,300 20,020 EUR 104.31
GBP Class Bd Shares GBP 62,370 500 GBP 124.74
GBP Class Id Shares GBP 16,364,060 145,317 GBP 112.61
GBP Class M Shares GBP 24,558 183 GBP 134.17
GBP Class R Shares GBP 52,453 404 GBP 129.76
SGD Class Id Shares SGD 1,072,745 10,442 SGD 102.74
USD Class Bd Shares USD 7,150,678 55,487 USD 128.87
USD Class I Shares USD 3,279,059 32,269 USD 101.62
USD Class Id Shares USD 12,971,921 108,800 USD 119.23
USD Class M Shares USD 844,282 5,684 USD 148.55
USD Class Md Shares USD 23,916,403 183,625 USD 130.25
USD Class R Shares USD 5,072,346 36,721 USD 138.13
Algebris Allocation Fund
Net Asset Value Shares in Issue
Rounded
Net Asset Value per Share
2017 2017
CHF Class R Shares CHF 27,494 264 CHF 104.26
EUR Class I Shares EUR 9,109,300 83,776 EUR 108.73
EUR Class R Shares EUR 253,487 2,402 EUR 105.53
GBP Class B Shares GBP 43,893 400 GBP 109.73
USD Class R Shares USD 80,657 800 USD 100.86
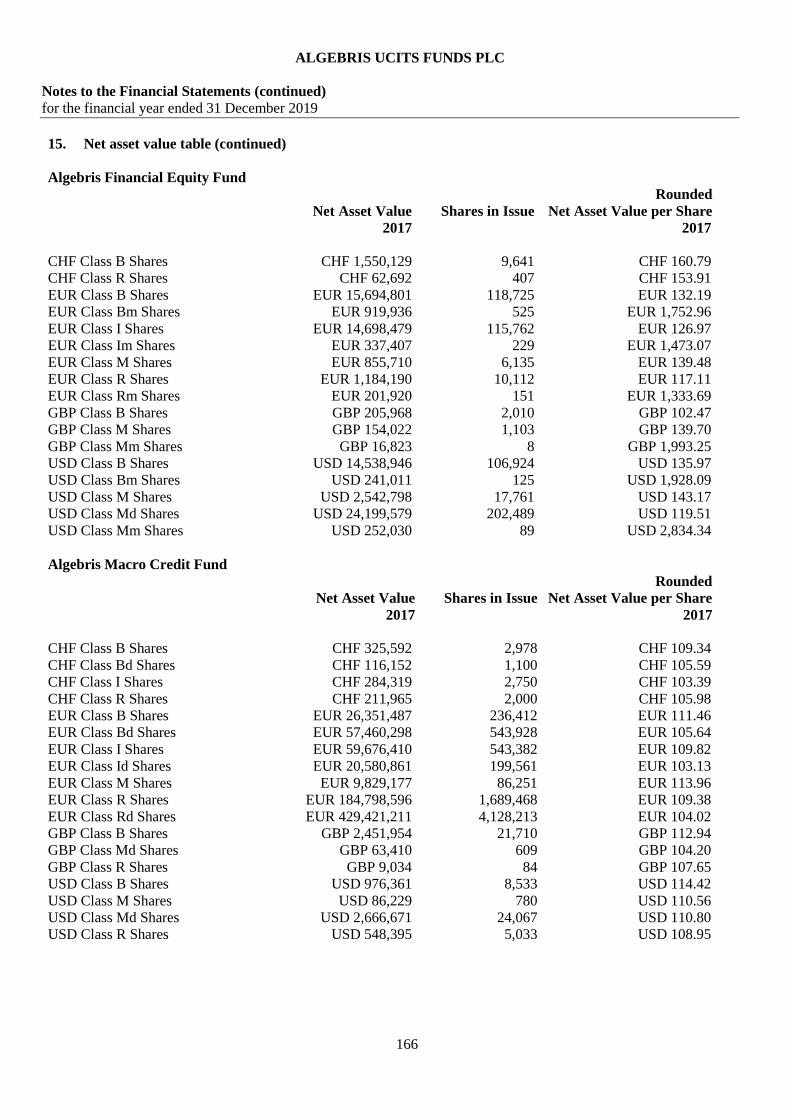
ALGEBRIS UCITS FUNDS PLC
Notes to the Financial Statements (continued)
for the financial year ended 31 December 2019
166
15. Net asset value table (continued)
Algebris Financial Equity Fund
Net Asset Value Shares in Issue
Rounded
Net Asset Value per Share
2017 2017
CHF Class B Shares CHF 1,550,129 9,641 CHF 160.79
CHF Class R Shares CHF 62,692 407 CHF 153.91
EUR Class B Shares EUR 15,694,801 118,725 EUR 132.19
EUR Class Bm Shares EUR 919,936 525 EUR 1,752.96
EUR Class I Shares EUR 14,698,479 115,762 EUR 126.97
EUR Class Im Shares EUR 337,407 229 EUR 1,473.07
EUR Class M Shares EUR 855,710 6,135 EUR 139.48
EUR Class R Shares EUR 1,184,190 10,112 EUR 117.11
EUR Class Rm Shares EUR 201,920 151 EUR 1,333.69
GBP Class B Shares GBP 205,968 2,010 GBP 102.47
GBP Class M Shares GBP 154,022 1,103 GBP 139.70
GBP Class Mm Shares GBP 16,823 8 GBP 1,993.25
USD Class B Shares USD 14,538,946 106,924 USD 135.97
USD Class Bm Shares USD 241,011 125 USD 1,928.09
USD Class M Shares USD 2,542,798 17,761 USD 143.17
USD Class Md Shares USD 24,199,579 202,489 USD 119.51
USD Class Mm Shares USD 252,030 89 USD 2,834.34
Algebris Macro Credit Fund
Net Asset Value Shares in Issue
Rounded
Net Asset Value per Share
2017 2017
CHF Class B Shares CHF 325,592 2,978 CHF 109.34
CHF Class Bd Shares CHF 116,152 1,100 CHF 105.59
CHF Class I Shares CHF 284,319 2,750 CHF 103.39
CHF Class R Shares CHF 211,965 2,000 CHF 105.98
EUR Class B Shares EUR 26,351,487 236,412 EUR 111.46
EUR Class Bd Shares EUR 57,460,298 543,928 EUR 105.64
EUR Class I Shares EUR 59,676,410 543,382 EUR 109.82
EUR Class Id Shares EUR 20,580,861 199,561 EUR 103.13
EUR Class M Shares EUR 9,829,177 86,251 EUR 113.96
EUR Class R Shares EUR 184,798,596 1,689,468 EUR 109.38
EUR Class Rd Shares EUR 429,421,211 4,128,213 EUR 104.02
GBP Class B Shares GBP 2,451,954 21,710 GBP 112.94
GBP Class Md Shares GBP 63,410 609 GBP 104.20
GBP Class R Shares GBP 9,034 84 GBP 107.65
USD Class B Shares USD 976,361 8,533 USD 114.42
USD Class M Shares USD 86,229 780 USD 110.56
USD Class Md Shares USD 2,666,671 24,067 USD 110.80
USD Class R Shares USD 548,395 5,033 USD 108.95

ALGEBRIS UCITS FUNDS PLC
Notes to the Financial Statements (continued)
for the financial year ended 31 December 2019
167
15. Net asset value table (continued)
Algebris Core Italy Fund
Net Asset Value Shares in Issue
Rounded
Net Asset Value per Share
2017 2017
EUR Class EB Shares EUR 7,257,234 72,091 EUR 100.67
EUR Class M Shares EUR 20,044,485 198,900 EUR 100.78
EUR Class R Shares EUR 100,620 1,023 EUR 98.41
16. Exchange rates
The following exchange rates were used to translate assets and liabilities into the functional currency Euro for the
Sub-Funds:
Currency 2019 2018
Swiss francs 0.9214 0.8881
Euro 1.0000 1.0000
Japanese Yen 0.0082 0.0080
Pound Sterling 1.1835 1.1124
Singapore Dollar 0.6632 0.6396
United States Dollar 0.8919 0.8718
17. Supplemental information
The Investment Manager is subject to the Securities and Exchange Commission’s amended Rule 206(4)-2 under the
Investment Advisers Act of 1940. The Investment Manager has decided to provide the following information to all
investors in order for the financial statements to comply with the requirements that allow the Investment Manager to
claim the Audit Exemption available to it under the SEC Custody Rule. The additional information required is to
provide reconciliation between the financial statements and the accounting standards generally accepted in the
United States of America. The Investment Manager has requested that the Board include this information in the
financial statements.

ALGEBRIS UCITS FUNDS PLC
Notes to the Financial Statements (continued)
for the financial year ended 31 December 2019
168
17. Supplemental information (continued)
Financial Highlights*
Algebris Financial Credit Fund
2019 2019 2019 2019 2019 2019
CHF
Class I
CHF
Class Id
CHF
Class R
CHF
Class Rd
CHF
Class Z
EUR
Class Cd
Net asset value, beginning of financial year/period
140.33 100.00 107.36 92.11 104.62 100.00
Income/(loss) from investment operations:
Net investment income/(loss)
0.88 0.84 (0.02) 0.01 1.19 0.01
Net realised and unrealised gain/(loss) from securities
transactions and appreciation on deferred incentive fee
20.64 4.76 15.71 13.05 15.32 (0.03)
Distributions to holders of redeemable participating
shares - (0.80) - (5.17) - -
--- Net increase/(decrease) in net assets from operations
21.52 4.80 15.69 7.89 16.51 (0.02)
Net asset value, end of financial year/period
161.85 104.80 123.05 100.00 121.14 99.98
Total return before Incentive Allocation and Distribution 16.16% 6.20% 15.33% 14.86% 15.78% (0.02%)
Incentive Allocation (0.82%) (0.61%) (0.72%) (0.68%) - -
Distribution - (0.80%) - (5.61%) - -
Total return after Incentive Allocation and Distribution 15.34% 4.80% 14.61% 8.57% 15.78% (0.02%)
Ratios to average net assets:
Expenses 0.75% 0.63% 1.40% 1.38% 1.00% 18.25%
Incentive Allocation 0.61% 0.59% 0.72% 0.85% - -
Total expenses and Incentive Allocation 1.35% 1.22% 2.12% 2.23% 1.00% 18.25%
Net investment income after Incentive Allocation 4.51% 4.04% 3.53% 3.34% 4.68% 3.65%
*The total returns detailed above exclude dividends received by shareholders. For classes that have not been in
existence for the whole year, the ratios to average net assets have been annualised however, total return ratios have
not.

ALGEBRIS UCITS FUNDS PLC
Notes to the Financial Statements (continued)
for the financial year ended 31 December 2019
169
17. Supplemental information (continued)
Financial Highlights* (continued)
Algebris Financial Credit Fund (continued)
2019 2019 2019 2019 2019
EUR
Class I
EUR
Class Id
EUR
Class R
EUR
Class Rd
EUR
Class W
Net asset value, beginning of financial year
146.28 107.44 128.77 96.47 109.89
Income/(loss) from investment operations:
Net investment income
6.57 4.71 4.99 3.65 4.77
Net realised and unrealised gain from securities
transactions and appreciation on deferred incentive fee
16.28 11.57 14.29 10.37 12.19
Distributions to holders of redeemable participating shares - (6.34) - (5.70) -
---
Net increase in net assets from operations
22.85 9.95 19.28 8.32 16.96
Net asset value, end of financial year
169.13 117.39 148.05 104.79 126.85
Total return before Incentive Allocation and Distribution 16.57% 16.03% 15.77% 15.26% 15.43%
Incentive Allocation (0.95%) (0.87%) (0.79%) (0.72%) -
Distribution - (5.90%) - (5.91%) -
Total return after Incentive Allocation and Distribution 15.62% 9.26% 14.97% 8.62% 15.43%
Ratios to average net assets:
Expenses 0.72% 0.70% 1.42% 1.41% 1.74%
Incentive Allocation 0.84% 0.93% 0.74% 0.73% -
Total expenses and Incentive Allocation 1.56% 1.63% 2.15% 2.14% 1.74%
Net investment income after Incentive Allocation 4.19% 4.03% 3.57% 3.56% 4.06%
*The total returns detailed above exclude dividends received by shareholders. For classes that have not been in
existence for the whole year, the ratios to average net assets have been annualised however, total return ratios have
not.
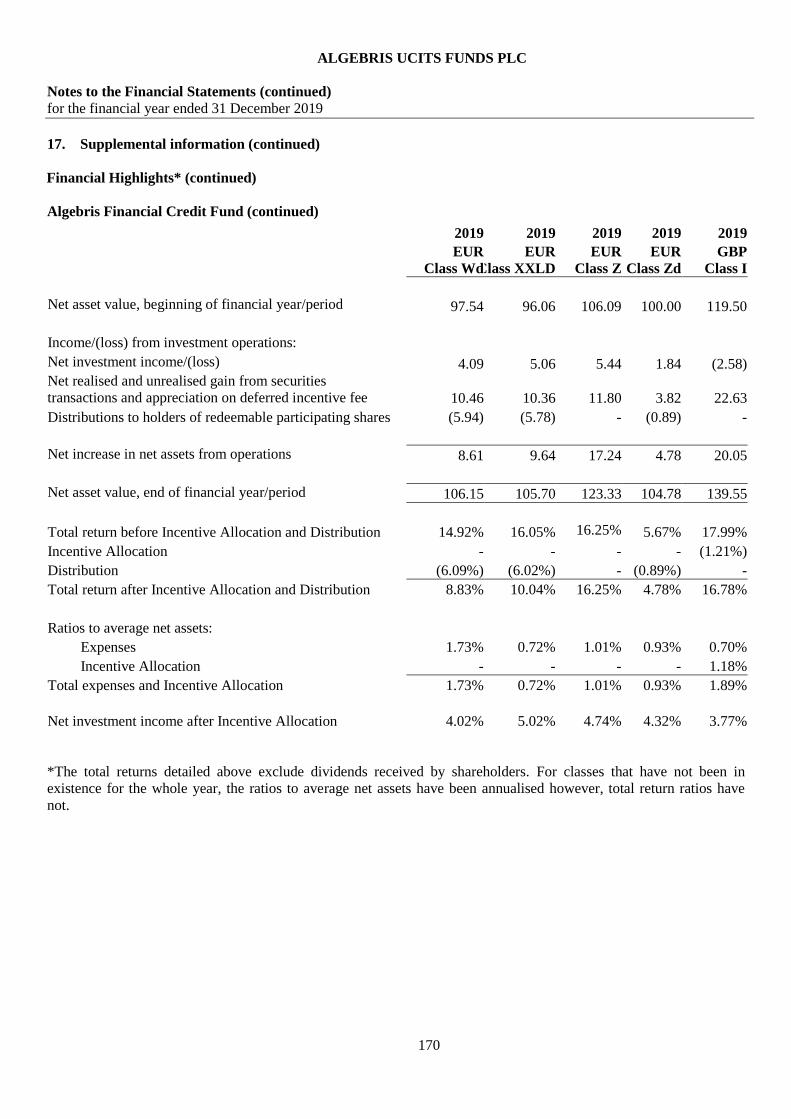
ALGEBRIS UCITS FUNDS PLC
Notes to the Financial Statements (continued)
for the financial year ended 31 December 2019
170
17. Supplemental information (continued)
Financial Highlights* (continued)
Algebris Financial Credit Fund (continued)
2019 2019 2019 2019 2019
EUR
Class Wd
EUR
Class XXLD
EUR
Class Z
EUR
Class Zd
GBP
Class I
Net asset value, beginning of financial year/period
97.54 96.06 106.09 100.00 119.50
Income/(loss) from investment operations:
Net investment income/(loss)
4.09 5.06 5.44 1.84 (2.58)
Net realised and unrealised gain from securities
transactions and appreciation on deferred incentive fee
10.46 10.36 11.80 3.82 22.63
Distributions to holders of redeemable participating shares (5.94) (5.78) - (0.89) -
---
Net increase in net assets from operations
8.61 9.64 17.24 4.78 20.05
Net asset value, end of financial year/period
106.15 105.70 123.33 104.78 139.55
Total return before Incentive Allocation and Distribution 14.92% 16.05% 16.25%
5.67% 17.99%
Incentive Allocation - - - - (1.21%)
Distribution (6.09%) (6.02%) - (0.89%) -
Total return after Incentive Allocation and Distribution 8.83% 10.04% 16.25% 4.78% 16.78%
Ratios to average net assets:
Expenses 1.73% 0.72% 1.01% 0.93% 0.70%
Incentive Allocation - - - - 1.18%
Total expenses and Incentive Allocation 1.73% 0.72% 1.01% 0.93% 1.89%
Net investment income after Incentive Allocation 4.02% 5.02% 4.74% 4.32% 3.77%
*The total returns detailed above exclude dividends received by shareholders. For classes that have not been in
existence for the whole year, the ratios to average net assets have been annualised however, total return ratios have
not.

ALGEBRIS UCITS FUNDS PLC
Notes to the Financial Statements (continued)
for the financial year ended 31 December 2019
171
17. Supplemental information (continued)
Financial Highlights* (continued)
Algebris Financial Credit Fund (continued)
2019 2019 2019 2019 2019
GBP
Class Id
GBP
Class R
GBP
Class Rd
GBP
Class W
GBP
Class Wd
Net asset value, beginning of financial year/period
104.39 107.04 94.52 96.08 93.92
Income/(loss) from investment operations:
Net investment loss
(2.00) (3.00) (2.36) (1.97) (1.78)
Net realised and unrealised gain from securities transactions
and appreciation on deferred incentive fee
18.86 20.16 17.14 18.11 17.04
Distributions to holders of redeemable participating shares (6.46) - (5.17) - (5.44)
---
Net increase in net assets from operations
10.40 17.16 9.61 16.14 9.82
Net asset value, end of financial year/period
114.79 124.20 104.13 112.22 103.74
Total return before Incentive Allocation and Distribution 17.23% 17.12% 16.56% 16.80% 16.25%
Incentive Allocation (1.08%) (1.09%) (0.93%) - -
Distribution (6.19%) - (5.47%) - (5.79%)
Total return after Incentive Allocation and Distribution 9.96% 16.03% 10.17% 16.80% 10.46%
Ratios to average net assets:
Expenses 0.72% 1.40% 1.41% 1.72% 1.72%
Incentive Allocation 1.05% 1.12% 0.96% - -
Total expenses and Incentive Allocation 1.77% 2.52% 2.37% 1.72% 1.72%
Net investment income after Incentive Allocation 3.95% 3.12% 3.29% 4.01% 4.00%
*The total returns detailed above exclude dividends received by shareholders. For classes that have not been in
existence for the whole year, the ratios to average net assets have been annualised however, total return ratios have not.
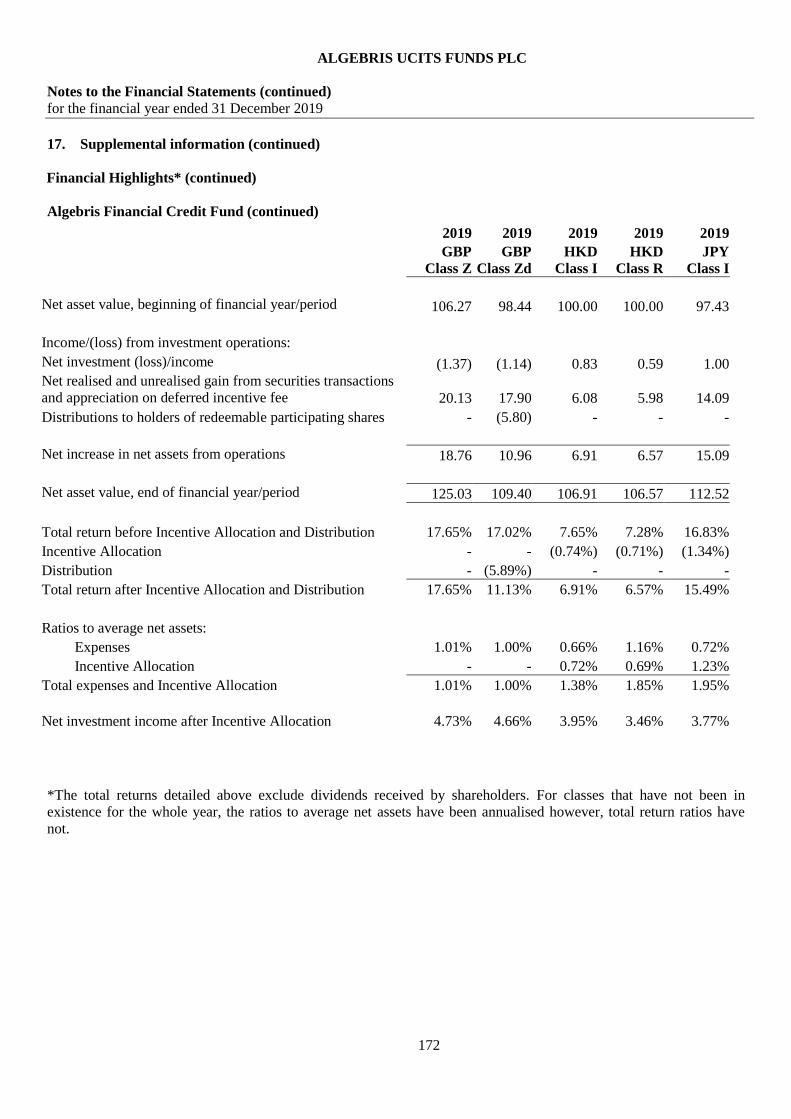
ALGEBRIS UCITS FUNDS PLC
Notes to the Financial Statements (continued)
for the financial year ended 31 December 2019
172
17. Supplemental information (continued)
Financial Highlights* (continued)
Algebris Financial Credit Fund (continued)
2019 2019 2019 2019 2019
GBP
Class Z
GBP
Class Zd
HKD
Class I
HKD
Class R
JPY
Class I
Net asset value, beginning of financial year/period
106.27 98.44 100.00 100.00 97.43
Income/(loss) from investment operations:
Net investment (loss)/income
(1.37) (1.14) 0.83 0.59 1.00
Net realised and unrealised gain from securities transactions
and appreciation on deferred incentive fee
20.13
17.90 6.08 5.98
14.09
Distributions to holders of redeemable participating shares - (5.80) - - -
---
Net increase in net assets from operations
18.76 10.96 6.91 6.57 15.09
Net asset value, end of financial year/period
125.03 109.40 106.91 106.57 112.52
Total return before Incentive Allocation and Distribution 17.65% 17.02% 7.65% 7.28% 16.83%
Incentive Allocation - - (0.74%) (0.71%) (1.34%)
Distribution - (5.89%) - - -
Total return after Incentive Allocation and Distribution 17.65% 11.13% 6.91% 6.57% 15.49%
Ratios to average net assets:
Expenses 1.01% 1.00% 0.66% 1.16% 0.72%
Incentive Allocation - - 0.72% 0.69% 1.23%
Total expenses and Incentive Allocation 1.01% 1.00% 1.38% 1.85% 1.95%
Net investment income after Incentive Allocation 4.73% 4.66% 3.95% 3.46% 3.77%
*The total returns detailed above exclude dividends received by shareholders. For classes that have not been in
existence for the whole year, the ratios to average net assets have been annualised however, total return ratios have
not.

ALGEBRIS UCITS FUNDS PLC
Notes to the Financial Statements (continued)
for the financial year ended 31 December 2019
173
17. Supplemental information (continued)
Financial Highlights* (continued)
Algebris Financial Credit Fund (continued)
2019 2019 2019 2019 2019
SGD
Class I
SGD
Class Id
SGD
Class R
SGD
Class Rd
SGD
Class Wd
Net asset value, beginning of financial year/period
97.51 100.00 105.07 95.25 90.61
Income/(loss) from investment operations:
Net investment income/(loss)
0.16 (0.33) (0.33) (0.25) 0.54
Net realised and unrealised gain from securities
transactions and appreciation on deferred incentive fee
16.95 9.64 18.37 16.05 15.36
Distributions to holders of redeemable participating shares - (1.73) - (5.92) (4.32)
---
Net increase net assets from operations
17.11 7.58 18.04 9.88 11.58
Net asset value, end of financial year/period
114.62 107.58 123.11 105.13 102.19
Total return before Incentive Allocation and Distribution 19.12% 10.40% 18.45% 17.76% 17.55%
Incentive Allocation (1.57%) (1.09%) (1.28%) (1.17%) -
Distribution - (1.73%) - (6.21%) (4.77%)
Total return after Incentive Allocation and Distribution 17.55% 7.58% 17.17% 10.37% 12.78%
Ratios to average net assets:
Expenses 0.66% 0.68% 1.43% 1.43% 1.68%
Incentive Allocation 1.72% 1.24% 1.14% 1.08% -
Total expenses and Incentive Allocation 2.37% 1.92% 2.57% 2.51% 1.68%
Net investment income after Incentive Allocation 3.09% 3.48% 3.18% 3.26% 3.76%
*The total returns detailed above exclude dividends received by shareholders. For classes that have not been in
existence for the whole year, the ratios to average net assets have been annualised however, total return ratios have
not.

ALGEBRIS UCITS FUNDS PLC
Notes to the Financial Statements (continued)
for the financial year ended 31 December 2019
174
17. Supplemental information (continued)
Financial Highlights* (continued)
Algebris Financial Credit Fund (continued)
2019 2019 2019 2019 2019 2019
USD
Class 12D
USD
Class A
USD
Class C
USD
Class I
USD
Class Id
USD
Class R
Net asset value, beginning of financial year/period
100.00 100.00 100.00 118.95 98.56 122.86
Income/(loss) from investment operations:
Net investment income
3.39 3.24 1.30 2.13 1.66 1.44
Net realised and unrealised gain/(loss) from securities
transactions and appreciation on deferred incentive fee
1.94 1.95 (1.05) 19.77 15.93 20.45
Distributions to holders of redeemable participating
shares - - - - (6.10) -
---
Net increase in net assets from operations
5.33 5.19 0.25 21.90 11.48 21.89
Net asset value, end of financial year/period
105.33 105.19 100.25 140.85 110.04
110.04 144.75
Total return before Incentive Allocation and
Distribution 5.33% 5.19% 0.25% 19.95% 19.31% 19.19%
Incentive Allocation - - - (1.54%) (1.47%) (1.37%)
Distribution - - - - (6.19%) -
Total return after Incentive Allocation and
Distribution 5.33% 5.19% 0.25% 18.41% 11.65% 17.82%
Ratios to average net assets:
Expenses 3.87% 4.48% 0.81% 0.72% 0.72% 1.42%
Incentive Allocation - - - 1.34% 1.41% 1.24%
Total expenses and Incentive Allocation 3.87% 4.48% 0.81% 2.06% 2.12% 2.66%
Net investment income after Incentive Allocation 4.21% 3.61% 4.06% 3.70% 3.57% 3.06%
*The total returns detailed above exclude dividends received by shareholders. For classes that have not been in
existence for the whole year, the ratios to average net assets have been annualised however, total return ratios have
not.

ALGEBRIS UCITS FUNDS PLC
Notes to the Financial Statements (continued)
for the financial year ended 31 December 2019
175
17. Supplemental information (continued)
Financial Highlights* (continued)
Algebris Financial Credit Fund (continued)
2019 2019 2019 2019 2019 2019
USD
Class Rd
USD
Class W
USD
Class Wd
USD
Class XXL
USD
Class Z
USD
Class Zd
Net asset value, beginning of financial year
96.48 116.80 97.84 120.15 111.21 101.18
Income/(loss) from investment operations:
Net investment income
1.03 2.60 2.05 4.04 3.37 2.92
Net realised and unrealised gain from securities
transactions
and appreciation on deferred incentive fee
15.62 19.38 15.82 20.09 18.59 16.49
Distributions to holders of redeemable
participating shares (5.77) - (5.79) - - (5.49)
---
Net increase in net assets from operations
10.88 21.98 12.08 24.13 21.96 13.91
Net asset value, end of financial year
107.36 138.78 109.92 144.28 133.17 115.09
Total return before Incentive Allocation and
Distribution 18.59% 18.82% 18.27% 20.08% 19.75% 19.18%
Incentive Allocation (1.33%) - - - - -
Distribution (5.98%) - (5.92%) - - (5.43%)
Total return after Incentive Allocation and
Distribution 11.28% 18.82% 12.35% 20.08% 19.75% 13.75%
Ratios to average net assets:
Expenses 1.41% 1.73% 1.71% 0.72% 1.01% 1.00%
Incentive Allocation 1.30% - - - - -
Total expenses and Incentive Allocation 2.71% 1.73% 1.71% 0.72% 1.01% 1.00%
Net investment income after Incentive Allocation 2.97% 4.03% 3.97% 5.00% 4.71% 4.66%
*The total returns detailed above exclude dividends received by shareholders. For classes that have not been in
existence for the whole year, the ratios to average net assets have been annualised however, total return ratios have
not.

ALGEBRIS UCITS FUNDS PLC
Notes to the Financial Statements (continued)
for the financial year ended 31 December 2019
176
17. Supplemental information (continued)
Financial Highlights* (continued)
Algebris Financial Income Fund
2019 2019 2019 2019 2019
CHF
Class B
CHF
Class R
CHF
Class Rd
EUR
Class B
EUR
Class Bd
Net asset value, beginning of financial year
122.88 107.15 74.68 123.35 97.84
Income/(loss) from investment operations:
Net investment (loss)/income
(0.50) (1.98) (1.30) 4.73 3.67
Net realised and unrealised gain from securities transactions
and appreciation on deferred incentive fee
30.58 26.43 17.81 25.83 19.89
Distributions to holders of redeemable participating shares - - (4.01) - (5.38)
Net increase in net assets from operations
30.08 24.45 12.50 30.56 18.18
Net asset value, end of financial year
152.96 131.60 87.18 153.91 116.02
Total return before Incentive Allocation and Distribution 24.48% 22.82% 22.11% 24.78% 24.08%
Incentive Allocation - - - - -
Distribution - - (5.37%) - (5.50%)
Total return after Incentive Allocation and Distribution 24.48% 22.82% 16.74% 24.78% 18.58%
Ratios to average net assets:
Expenses 1.14% 2.45% 2.44% 1.16% 1.16%
Incentive Allocation - - - - -
Total expenses and Incentive Allocation 1.14% 2.45% 2.44% 1.16% 1.16%
Net investment income after Incentive Allocation 3.50% 2.08% 2.39% 3.42% 3.50%
*The total returns detailed above exclude dividends received by shareholders. For classes that have not been in
existence for the whole year, the ratios to average net assets have been annualised however, total return ratios have
not.

ALGEBRIS UCITS FUNDS PLC
Notes to the Financial Statements (continued)
for the financial year ended 31 December 2019
177
17. Supplemental information (continued)
Financial Highlights* (continued)
Algebris Financial Income Fund (continued)
2019 2019 2019 2019
EUR
Class I
EUR
Class Id
EUR
Class R
EUR
Class Rd
Net asset value, beginning of financial year
120.59 88.47 113.69 82.37
Income/(loss) from investment operations:
Net investment income
4.08 2.92 2.68 1.91
Net realised and unrealised gain from securities transactions
and appreciation on deferred incentive fee
25.20 17.95 23.65 16.64
Distributions to holders of redeemable participating shares - (5.05) - (4.57)
Net increase in net assets from operations
29.28 15.82 26.33 13.98
Net asset value, end of financial year
149.87 104.29 140.02 96.35
Total return before Incentive Allocation and Distribution 24.28% 23.59% 23.16% 22.52%
Incentive Allocation - - - -
Distribution - (5.71%) - (5.55%)
Total return after Incentive Allocation and Distribution 24.28% 17.88% 23.16% 16.97%
Ratios to average net assets:
Expenses 1.56% 1.58% 2.47% 2.48%
Incentive Allocation - - - -
Total expenses and Incentive Allocation 1.56% 1.58% 2.47% 2.48%
Net investment income after Incentive Allocation 3.04% 3.28% 2.26% 2.40%
*The total returns detailed above exclude dividends received by shareholders. For classes that have not been in
existence for the whole year, the ratios to average net assets have been annualised however, total return ratios have
not.

ALGEBRIS UCITS FUNDS PLC
Notes to the Financial Statements (continued)
for the financial year ended 31 December 2019
178
17. Supplemental information (continued)
Financial Highlights* (continued)
Algebris Financial Income Fund (continued)
2019 2019 2019 2019
GBP
Class Bd
GBP
Class I
GBP
Class Id
GBP
Class R
Net asset value, beginning of financial year
100.15 81.06 90.00 107.17
Income/(loss) from investment operations:
Net investment (loss)
(2.51) (2.54) (2.64) (4.43)
Net realised and unrealised gain from securities transactions
and appreciation on deferred incentive fee
27.99 23.30 25.03 30.72
Distributions to holders of redeemable participating shares (5.21) - (5.02) -
Net increase in net assets from operations
20.27 20.76 17.37 26.29
Net asset value, end of financial year
120.42 101.82 107.37 133.46
Total return before Incentive Allocation and Distribution 25.44% 25.61% 24.88% 24.53%
Incentive Allocation - - - -
Distribution (5.20%) - (5.57%) -
Total return after Incentive Allocation and Distribution 20.24% 25.61% 19.31% 24.53%
Ratios to average net assets:
Expenses 1.15% 1.51% 1.55% 2.45%
Incentive Allocation - - - -
Total expenses and Incentive Allocation 1.15% 1.51% 1.55% 2.45%
Net investment income after Incentive Allocation 3.38% 2.62% 2.90% 2.04%
*The total returns detailed above exclude dividends received by shareholders. For classes that have not been in
existence for the whole year, the ratios to average net assets have been annualised however, total return ratios have
not.
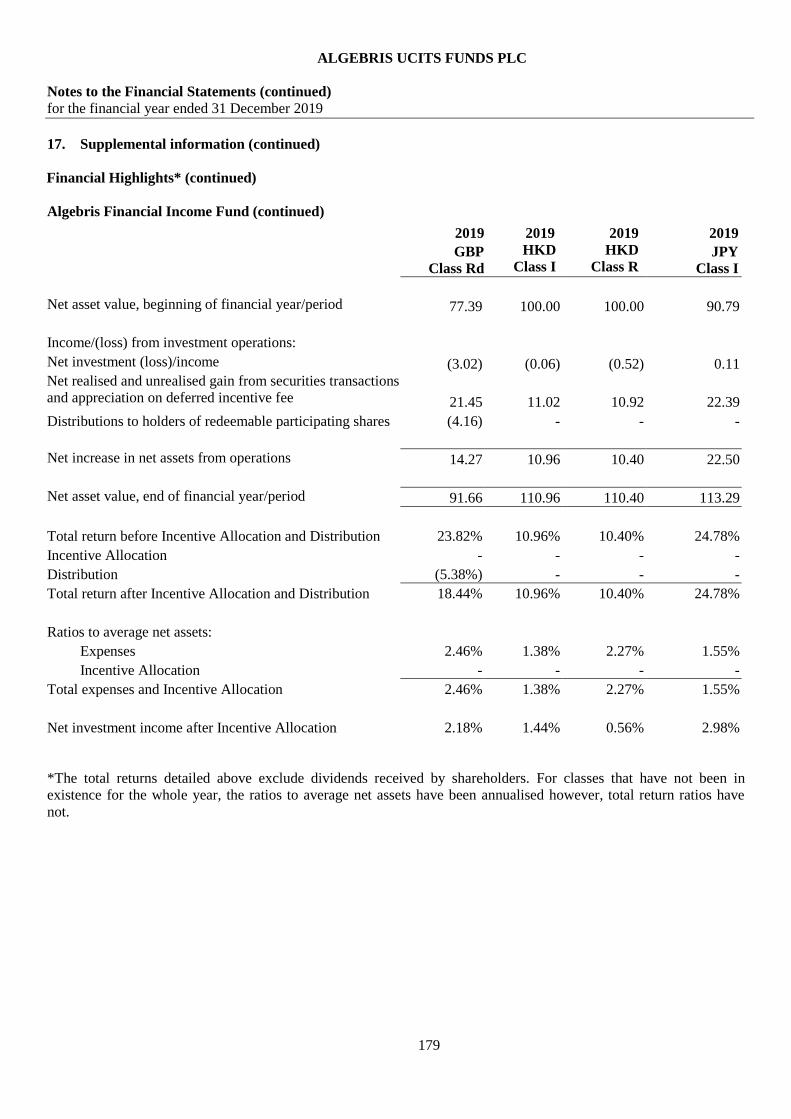
ALGEBRIS UCITS FUNDS PLC
Notes to the Financial Statements (continued)
for the financial year ended 31 December 2019
179
17. Supplemental information (continued)
Financial Highlights* (continued)
Algebris Financial Income Fund (continued)
2019 2019 2019 2019
GBP
Class Rd
HKD
Class I
I
HKD
Class R
R
JPY
Class I
Net asset value, beginning of financial year/period
77.39 100.00 100.00 90.79
Income/(loss) from investment operations:
Net investment (loss)/income
(3.02) (0.06) (0.52) 0.11
Net realised and unrealised gain from securities transactions
and appreciation on deferred incentive fee
21.45 11.02 10.92 22.39
Distributions to holders of redeemable participating shares (4.16) - - -
Net increase in net assets from operations
14.27 10.96 10.40 22.50
Net asset value, end of financial year/period
91.66 110.96 110.40 113.29
Total return before Incentive Allocation and Distribution 23.82% 10.96% 10.40% 24.78%
Incentive Allocation - - - -
Distribution (5.38%) - - -
Total return after Incentive Allocation and Distribution 18.44% 10.96% 10.40% 24.78%
Ratios to average net assets:
Expenses 2.46% 1.38% 2.27% 1.55%
Incentive Allocation - - - -
Total expenses and Incentive Allocation 2.46% 1.38% 2.27% 1.55%
Net investment income after Incentive Allocation 2.18% 1.44% 0.56% 2.98%
*The total returns detailed above exclude dividends received by shareholders. For classes that have not been in
existence for the whole year, the ratios to average net assets have been annualised however, total return ratios have
not.
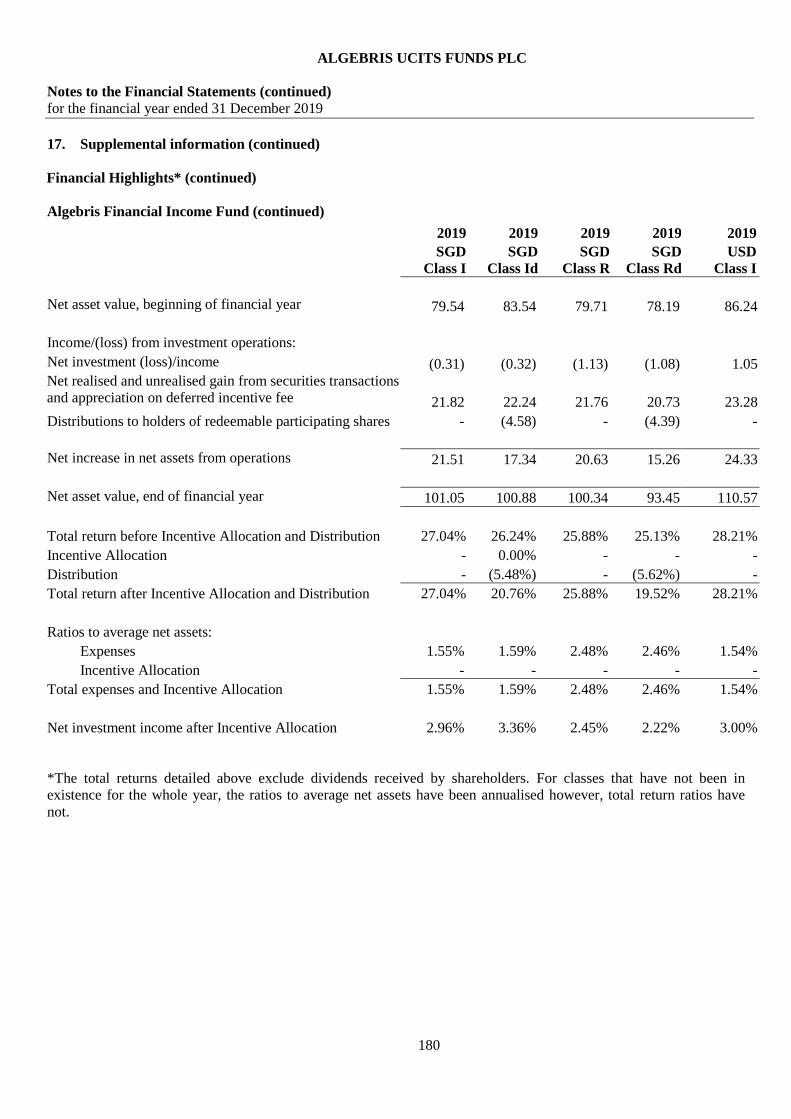
ALGEBRIS UCITS FUNDS PLC
Notes to the Financial Statements (continued)
for the financial year ended 31 December 2019
180
17. Supplemental information (continued)
Financial Highlights* (continued)
Algebris Financial Income Fund (continued)
2019 2019 2019 2019 2019
SGD
Class I
SGD
Class Id
SGD
Class R
SGD
Class Rd
USD
Class I
Net asset value, beginning of financial year
79.54 83.54 79.71 78.19 86.24
Income/(loss) from investment operations:
Net investment (loss)/income
(0.31) (0.32) (1.13) (1.08) 1.05
Net realised and unrealised gain from securities transactions
and appreciation on deferred incentive fee
21.82 22.24 21.76 20.73 23.28
Distributions to holders of redeemable participating shares - (4.58) - (4.39) -
Net increase in net assets from operations
21.51 17.34 20.63 15.26 24.33
Net asset value, end of financial year
101.05 100.88 100.34 93.45 110.57
Total return before Incentive Allocation and Distribution 27.04% 26.24% 25.88% 25.13% 28.21%
Incentive Allocation - 0.00% - - -
Distribution - (5.48%) - (5.62%) -
Total return after Incentive Allocation and Distribution 27.04% 20.76% 25.88% 19.52% 28.21%
Ratios to average net assets:
Expenses 1.55% 1.59% 2.48% 2.46% 1.54%
Incentive Allocation - - - - -
Total expenses and Incentive Allocation 1.55% 1.59% 2.48% 2.46% 1.54%
Net investment income after Incentive Allocation 2.96% 3.36% 2.45% 2.22% 3.00%
*The total returns detailed above exclude dividends received by shareholders. For classes that have not been in
existence for the whole year, the ratios to average net assets have been annualised however, total return ratios have
not.

ALGEBRIS UCITS FUNDS PLC
Notes to the Financial Statements (continued)
for the financial year ended 31 December 2019
181
17. Supplemental information (continued)
Financial Highlights* (continued)
Algebris Financial Income Fund (continued)
2019 2019 2019
USD Class
Id
USD Class
R
USD
Class Rd
Net asset value, beginning of financial year
97.19 116.14 80.16
Income/(loss) from investment operations:
Net investment income
1.11 0.20 0.11
Net realised and unrealised gain from securities transactions and
appreciation on deferred incentive fee
25.32 31.03 20.82
Distributions to holders of redeemable participating shares (5.50) - (4.59)
Net increase in net assets from operations
20.93 31.23 16.34
Net asset value, end of financial year
118.12 147.37 96.50
Total return before Incentive Allocation and Distribution 27.19% 26.89% 26.10%
Incentive Allocation - - -
Distribution (5.66%) - (5.72%)
Total return after Incentive Allocation and Distribution 21.54% 26.89% 20.38%
Ratios to average net assets:
Expenses 1.57% 2.47% 2.47%
Incentive Allocation - - -
Total expenses and Incentive Allocation 1.57% 2.47% 2.47%
Net investment income after Incentive Allocation 3.29% 2.32% 2.31%
*The total returns detailed above exclude dividends received by shareholders. For classes that have not been in
existence for the whole year, the ratios to average net assets have been annualised however, total return ratios have
not.

ALGEBRIS UCITS FUNDS PLC
Notes to the Financial Statements (continued)
for the financial year ended 31 December 2019
182
17. Supplemental information (continued)
Financial Highlights* (continued)
Algebris Allocation Fund
2019 2019 2019 2019 2019
CHF
Class R
EUR
Class B
EUR
Class I
EUR
Class R
JPY
Class B
Net asset value, beginning of financial year/period
87.83 100.00 92.80 89.25 100.00
Income/(loss) from investment operations:
Net investment loss
(5.09) (0.84) (1.06) (1.76) (1.85)
Net realised and unrealised gain from securities transactions
and appreciation on deferred incentive fee
13.26 7.24 11.02 10.56 7.74
Distributions to holders of redeemable participating shares - - - - -
Net increase in net assets from operations
8.17 6.40 9.96 8.80 5.89
- - - -
Net asset value, end of financial year/period
96.00 106.40 102.76 98.05 105.89
Total return before Incentive Allocation 9.30% 6.74% 10.73% 9.86% 6.51%
Incentive Allocation - (0.34%) - - (0.62%)
Total return after Incentive Allocation 9.30% 6.40% 10.73% 9.86% 5.89%
Ratios to average net assets:
Expenses 3.32% 1.53% 2.44% 3.13% 1.95%
Incentive Allocation - 0.33% - - 0.60%
Total expenses and Incentive Allocation 3.32% 1.86% 2.44% 3.13% 2.55%
Net investment expense after Incentive Allocation (1.62%) (0.96)% (1.00%) (1.84%) (2.18%)
*The total returns detailed above exclude dividends received by shareholders. For classes that have not been in
existence for the whole year, the ratios to average net assets have been annualised however, total return ratios have
not.
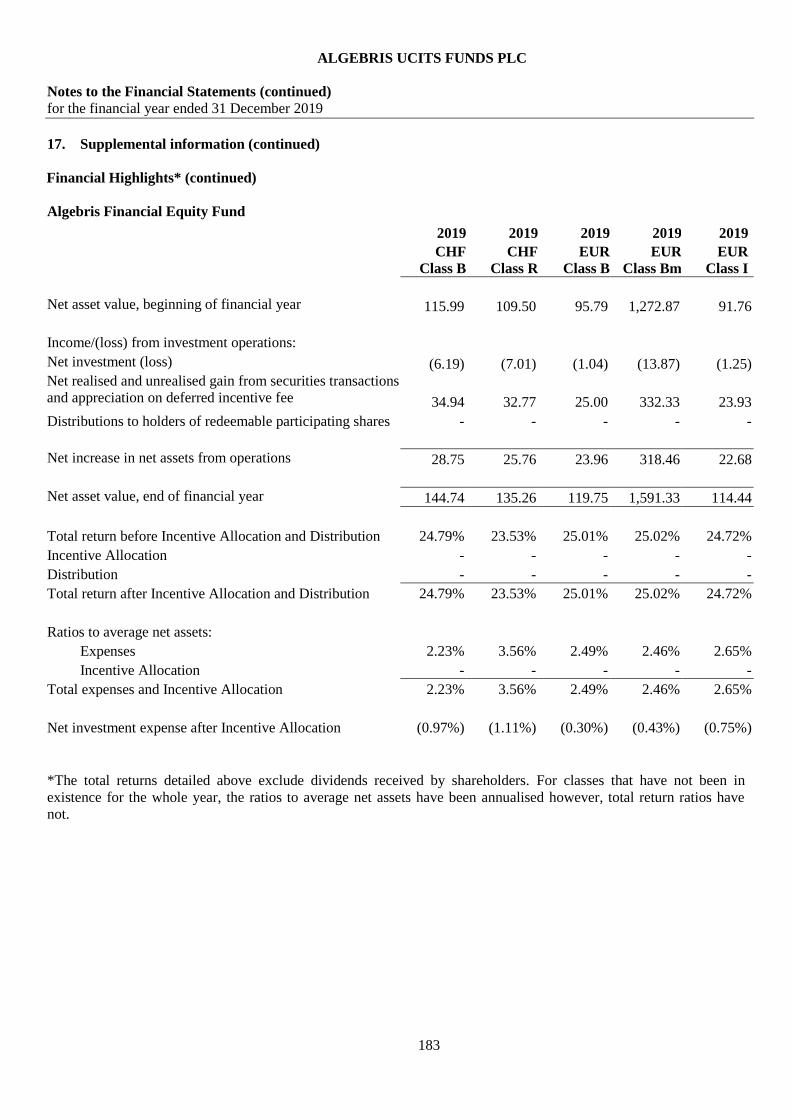
ALGEBRIS UCITS FUNDS PLC
Notes to the Financial Statements (continued)
for the financial year ended 31 December 2019
183
17. Supplemental information (continued)
Financial Highlights* (continued)
Algebris Financial Equity Fund
2019 2019 2019 2019 2019
CHF
Class B
CHF
Class R
EUR
Class B
EUR
Class Bm
EUR
Class I
Net asset value, beginning of financial year
115.99 109.50 95.79 1,272.87 91.76
Income/(loss) from investment operations:
Net investment (loss)
(6.19) (7.01) (1.04) (13.87) (1.25)
Net realised and unrealised gain from securities transactions
and appreciation on deferred incentive fee
34.94 32.77 25.00 332.33 23.93
Distributions to holders of redeemable participating shares - - - - -
Net increase in net assets from operations
28.75 25.76 23.96 318.46 22.68
Net asset value, end of financial year
144.74 135.26 119.75 1,591.33 114.44
Total return before Incentive Allocation and Distribution 24.79% 23.53% 25.01% 25.02% 24.72%
Incentive Allocation - - - - -
Distribution - - - - -
Total return after Incentive Allocation and Distribution 24.79% 23.53% 25.01% 25.02% 24.72%
Ratios to average net assets:
Expenses 2.23% 3.56% 2.49% 2.46% 2.65%
Incentive Allocation - - - - -
Total expenses and Incentive Allocation 2.23% 3.56% 2.49% 2.46% 2.65%
Net investment expense after Incentive Allocation (0.97%) (1.11%) (0.30%) (0.43%) (0.75%)
*The total returns detailed above exclude dividends received by shareholders. For classes that have not been in
existence for the whole year, the ratios to average net assets have been annualised however, total return ratios have
not.
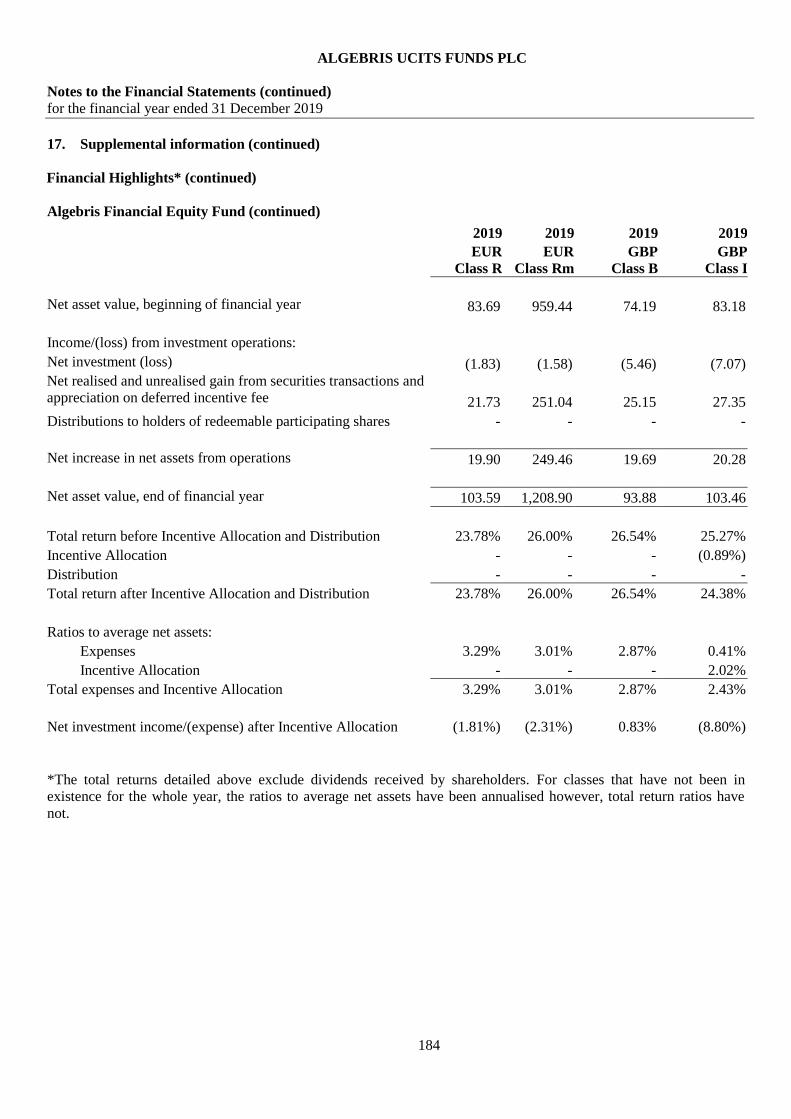
ALGEBRIS UCITS FUNDS PLC
Notes to the Financial Statements (continued)
for the financial year ended 31 December 2019
184
17. Supplemental information (continued)
Financial Highlights* (continued)
Algebris Financial Equity Fund (continued)
2019 2019 2019 2019
EUR
Class R
EUR
Class Rm
GBP
Class B
GBP
Class I
Net asset value, beginning of financial year
83.69 959.44 74.19 83.18
Income/(loss) from investment operations:
Net investment (loss)
(1.83) (1.58) (5.46) (7.07)
Net realised and unrealised gain from securities transactions and
appreciation on deferred incentive fee
21.73 251.04 25.15 27.35
Distributions to holders of redeemable participating shares - - - -
Net increase in net assets from operations
19.90 249.46 19.69 20.28
Net asset value, end of financial year
103.59 1,208.90 93.88 103.46
Total return before Incentive Allocation and Distribution 23.78% 26.00% 26.54% 25.27%
Incentive Allocation - - - (0.89%)
Distribution - - - -
Total return after Incentive Allocation and Distribution 23.78% 26.00% 26.54% 24.38%
Ratios to average net assets:
Expenses 3.29% 3.01% 2.87% 0.41%
Incentive Allocation - - - 2.02%
Total expenses and Incentive Allocation 3.29% 3.01% 2.87% 2.43%
Net investment income/(expense) after Incentive Allocation (1.81%) (2.31%) 0.83% (8.80%)
*The total returns detailed above exclude dividends received by shareholders. For classes that have not been in
existence for the whole year, the ratios to average net assets have been annualised however, total return ratios have
not.

ALGEBRIS UCITS FUNDS PLC
Notes to the Financial Statements (continued)
for the financial year ended 31 December 2019
185
17. Supplemental information (continued)
Financial Highlights* (continued)
Algebris Financial Equity Fund (continued)
2019 2019 2019 2019 2019
GBP
Class Mm
JPY
Class B
USD
Class B
USD
Class Bm
USD
Class Mm
Net asset value, beginning of financial year
1,478.16 85.01 101.48 1,440.96 2,131.88
Income/(loss) from investment operations:
Net investment (loss)
(92.85) (4.61) (3.39) (48.16) (47.12)
Net realised and unrealised gain from securities
transactions and appreciation on deferred incentive fee
498.89 26.28 32.53 462.88 688.33
Distributions to holders of redeemable participating shares - - - - -
Net increase in net assets from operations
406.04 21.67 29.14 414.72 641.21
Net asset value, end of financial year
1,884.20 106.68 130.62 1,855.68 2,773.09
Total return before Incentive Allocation and Distribution 27.47% 26.36% 28.72% 28.78% 30.08%
Incentive Allocation - (0.87%) - - -
Distribution - - - - -
Total return after Incentive Allocation and Distribution 27.47% 25.49% 28.72% 28.78% 30.08%
Ratios to average net assets:
Expenses 1.18% 2.21% 2.29% 2.21% 1.20%
Incentive Allocation - 0.77% - - -
Total expenses and Incentive Allocation 1.18% 2.98% 2.29% 2.21% 1.20%
Net investment expense after Incentive Allocation (0.06%) (1.76%) (0.75%) (1.00%) (0.02%)
*The total returns detailed above exclude dividends received by shareholders. For classes that have not been in
existence for the whole year, the ratios to average net assets have been annualised however, total return ratios have
not.
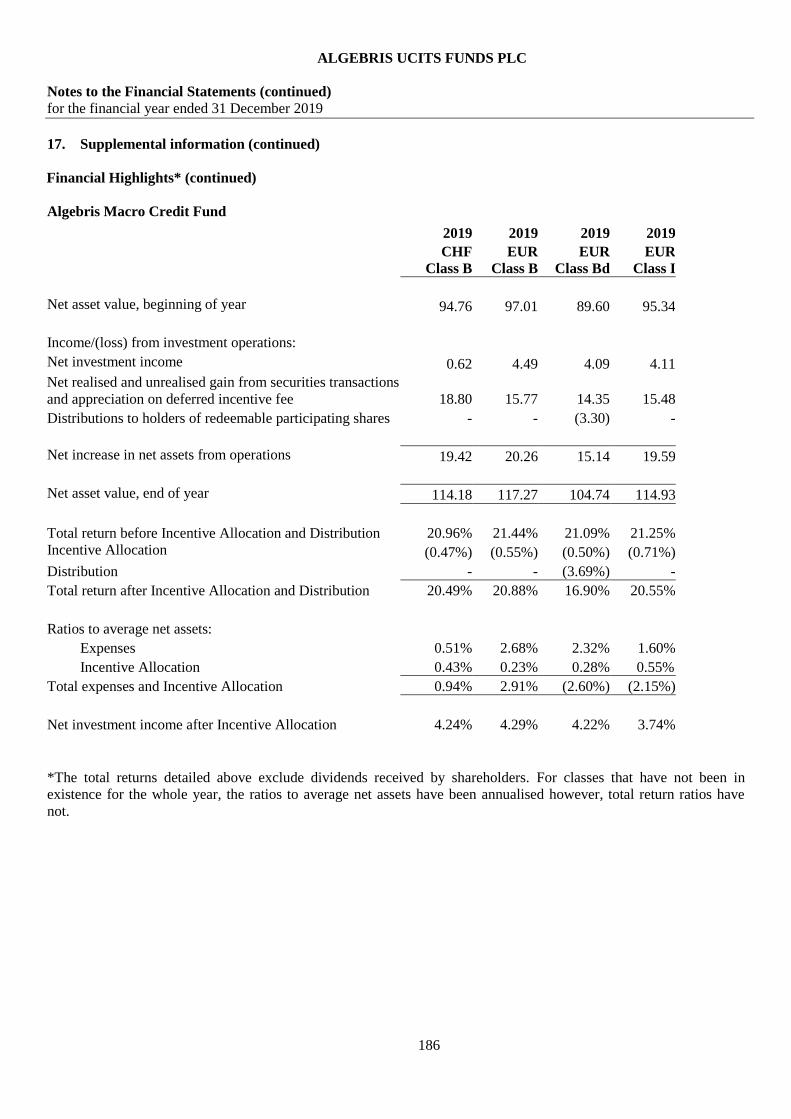
ALGEBRIS UCITS FUNDS PLC
Notes to the Financial Statements (continued)
for the financial year ended 31 December 2019
186
17. Supplemental information (continued)
Financial Highlights* (continued)
Algebris Macro Credit Fund
2019 2019 2019 2019
CHF
Class B
EUR
Class B
EUR
Class Bd
EUR
Class I
Net asset value, beginning of year
94.76 97.01 89.60 95.34
Income/(loss) from investment operations:
Net investment income
0.62 4.49 4.09 4.11
Net realised and unrealised gain from securities transactions
and appreciation on deferred incentive fee 18.80 15.77 14.35 15.48
Distributions to holders of redeemable participating shares - - (3.30) -
Net increase in net assets from operations
19.42 20.26 15.14 19.59
Net asset value, end of year
114.18 117.27 104.74 114.93
Total return before Incentive Allocation and Distribution 20.96% 21.44% 21.09% 21.25%
Incentive Allocation
(0.47%) (0.55%) (0.50%) (0.71%)
Distribution - - (3.69%) -
Total return after Incentive Allocation and Distribution 20.49% 20.88% 16.90% 20.55%
Ratios to average net assets:
Expenses 0.51% 2.68% 2.32% 1.60%
Incentive Allocation 0.43% 0.23% 0.28% 0.55%
Total expenses and Incentive Allocation 0.94% 2.91% (2.60%) (2.15%)
Net investment income after Incentive Allocation 4.24% 4.29% 4.22% 3.74%
*The total returns detailed above exclude dividends received by shareholders. For classes that have not been in
existence for the whole year, the ratios to average net assets have been annualised however, total return ratios have
not.
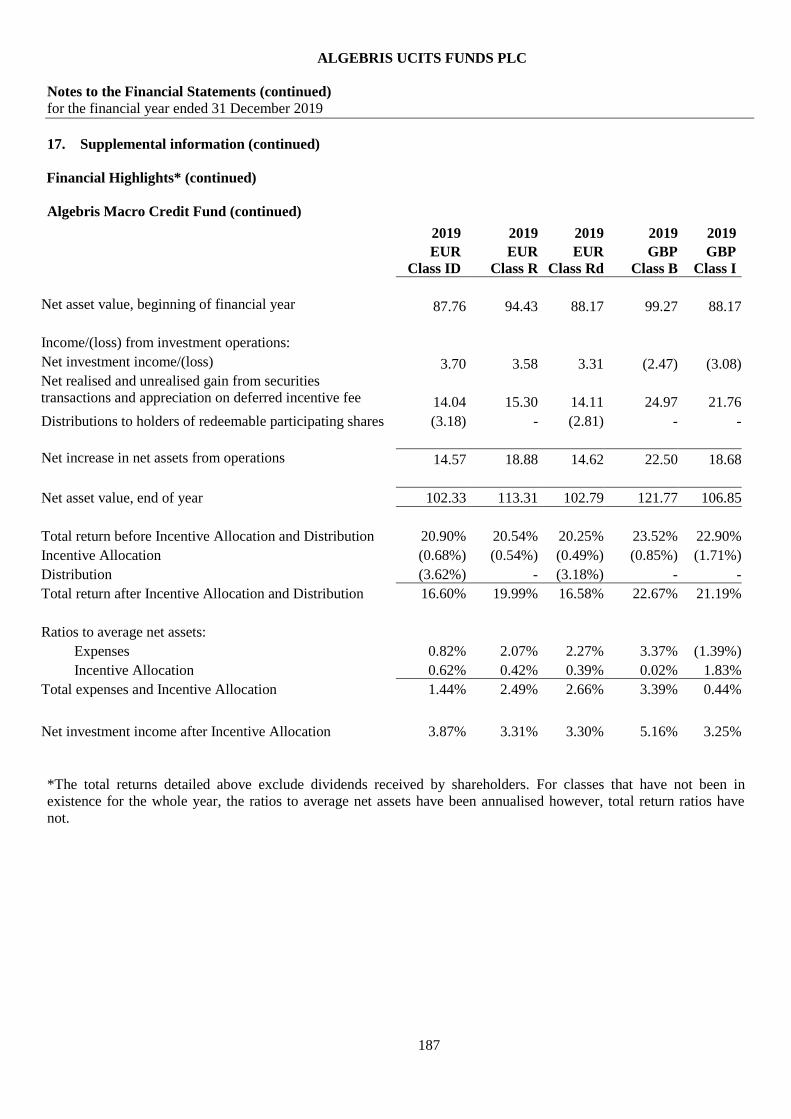
ALGEBRIS UCITS FUNDS PLC
Notes to the Financial Statements (continued)
for the financial year ended 31 December 2019
187
17. Supplemental information (continued)
Financial Highlights* (continued)
Algebris Macro Credit Fund (continued)
2019 2019 2019 2019 2019
EUR
Class ID
EUR
Class R
EUR
Class Rd
GBP
Class B
GBP
Class I
Net asset value, beginning of financial year
87.76 94.43 88.17 99.27 88.17
Income/(loss) from investment operations:
Net investment income/(loss)
3.70 3.58 3.31 (2.47) (3.08)
Net realised and unrealised gain from securities
transactions and appreciation on deferred incentive fee
14.04 15.30 14.11 24.97 21.76
Distributions to holders of redeemable participating shares (3.18) - (2.81) - -
Net increase in net assets from operations
14.57 18.88 14.62 22.50 18.68
Net asset value, end of year 102.33 113.31 102.79 121.77 106.85
Total return before Incentive Allocation and Distribution 20.90% 20.54% 20.25% 23.52% 22.90%
Incentive Allocation (0.68%) (0.54%) (0.49%) (0.85%) (1.71%)
Distribution (3.62%) - (3.18%) - -
Total return after Incentive Allocation and Distribution 16.60% 19.99% 16.58% 22.67% 21.19%
Ratios to average net assets:
Expenses 0.82% 2.07% 2.27% 3.37% (1.39%)
Incentive Allocation 0.62% 0.42% 0.39% 0.02% 1.83%
Total expenses and Incentive Allocation 1.44% 2.49% 2.66% 3.39% 0.44%
Net investment income after Incentive Allocation 3.87% 3.31% 3.30% 5.16% 3.25%
*The total returns detailed above exclude dividends received by shareholders. For classes that have not been in
existence for the whole year, the ratios to average net assets have been annualised however, total return ratios have
not.
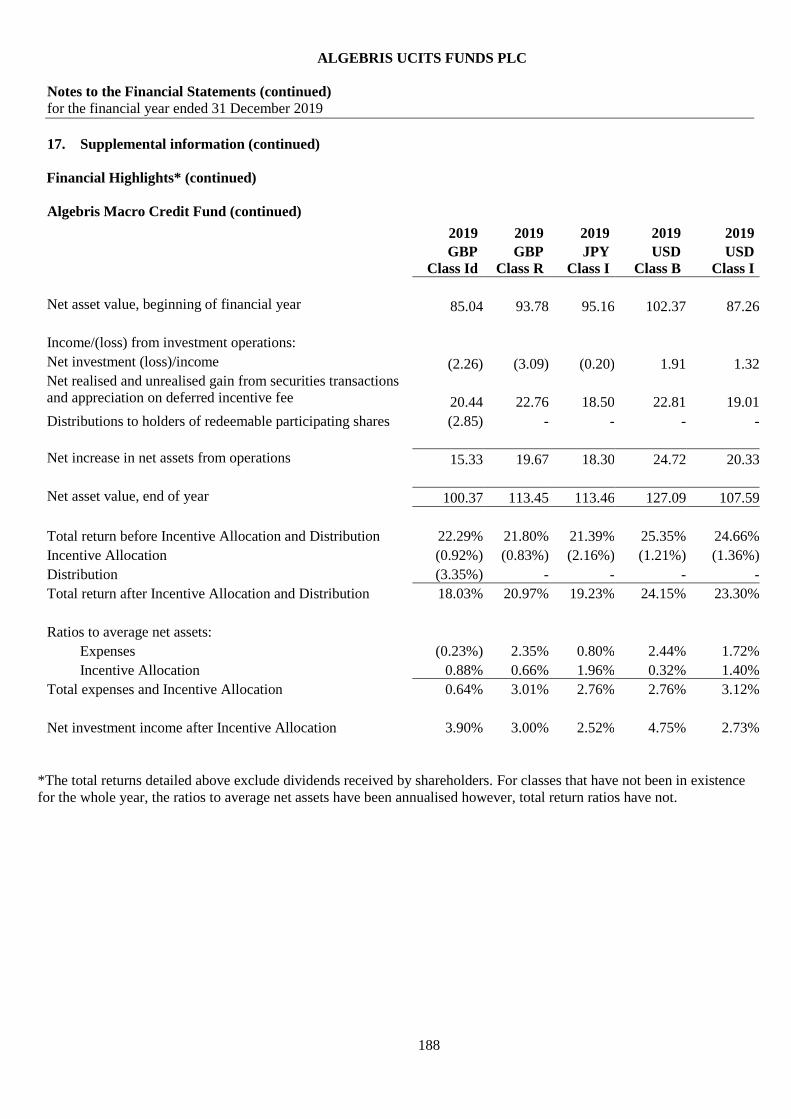
ALGEBRIS UCITS FUNDS PLC
Notes to the Financial Statements (continued)
for the financial year ended 31 December 2019
188
17. Supplemental information (continued)
Financial Highlights* (continued)
Algebris Macro Credit Fund (continued)
2019 2019 2019 2019 2019
GBP
Class Id
GBP
Class R
JPY
Class I
USD
Class B
USD
Class I
Net asset value, beginning of financial year
85.04 93.78 95.16 102.37 87.26
Income/(loss) from investment operations:
Net investment (loss)/income
(2.26) (3.09) (0.20) 1.91 1.32
Net realised and unrealised gain from securities transactions
and appreciation on deferred incentive fee
20.44 22.76 18.50 22.81 19.01
Distributions to holders of redeemable participating shares (2.85) - - - -
Net increase in net assets from operations
15.33 19.67 18.30 24.72 20.33
Net asset value, end of year
100.37 113.45 113.46 127.09 107.59
Total return before Incentive Allocation and Distribution 22.29% 21.80% 21.39% 25.35% 24.66%
Incentive Allocation (0.92%) (0.83%) (2.16%) (1.21%) (1.36%)
Distribution (3.35%) - - - -
Total return after Incentive Allocation and Distribution 18.03% 20.97% 19.23% 24.15% 23.30%
Ratios to average net assets:
Expenses (0.23%) 2.35% 0.80% 2.44% 1.72%
Incentive Allocation 0.88% 0.66% 1.96% 0.32% 1.40%
Total expenses and Incentive Allocation 0.64% 3.01% 2.76% 2.76% 3.12%
Net investment income after Incentive Allocation 3.90% 3.00% 2.52% 4.75% 2.73%
*The total returns detailed above exclude dividends received by shareholders. For classes that have not been in existence
for the whole year, the ratios to average net assets have been annualised however, total return ratios have not.
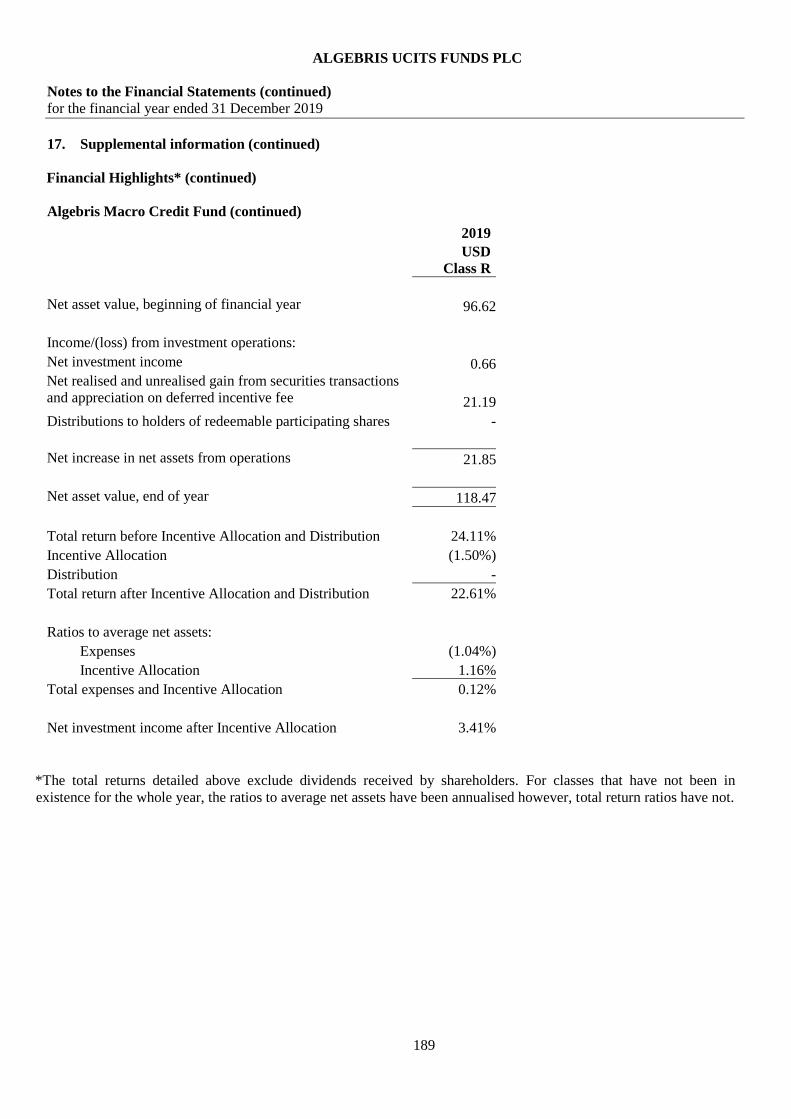
ALGEBRIS UCITS FUNDS PLC
Notes to the Financial Statements (continued)
for the financial year ended 31 December 2019
189
17. Supplemental information (continued)
Financial Highlights* (continued)
Algebris Macro Credit Fund (continued)
2019
USD
Class R
Net asset value, beginning of financial year
96.62
Income/(loss) from investment operations:
Net investment income
0.66
Net realised and unrealised gain from securities transactions
and appreciation on deferred incentive fee
21.19
Distributions to holders of redeemable participating shares -
Net increase in net assets from operations
21.85
Net asset value, end of year
118.47
Total return before Incentive Allocation and Distribution 24.11%
Incentive Allocation (1.50%)
Distribution -
Total return after Incentive Allocation and Distribution 22.61%
Ratios to average net assets:
Expenses (1.04%)
Incentive Allocation 1.16%
Total expenses and Incentive Allocation 0.12%
Net investment income after Incentive Allocation 3.41%
*The total returns detailed above exclude dividends received by shareholders. For classes that have not been in
existence for the whole year, the ratios to average net assets have been annualised however, total return ratios have not.

ALGEBRIS UCITS FUNDS PLC
Notes to the Financial Statements (continued)
for the financial year ended 31 December 2019
190
17. Supplemental information (continued)
Financial Highlights* (continued)
Algebris Core Italy Fund
2019 2019 2019 2019 2019
EUR
Class EB
EUR
Class I
EUR
Class R
JPY
Class I
USD
Class I
Net asset value, beginning of financial year/period
88.93 100.00 86.50 100.00 100.00
Income/(loss) from investment operations:
Net investment income/(loss)
1.09 (1.59) (0.17) (2.08) (2.17)
Net realised and unrealised gain from securities transactions
and appreciation on deferred incentive fee
21.03 15.08 20.40 15.96 17.08
Distributions to holders of redeemable participating shares - - - - -
Net increase in net assets from operations
22.12 13.49 20.23 13.88 14.91
Net asset value, end of year/period 111.05 113.49
106.73 113.88 114.91
Total return before Incentive Allocation 24.87% 14.95% 24.25% 15.40% 16.09%
Incentive Allocation - (1.46)% (0.86%) (1.52%) (1.18%)
Total return after Incentive Allocation 24.87% 13.49% 23.39% 13.88% 14.91%
Ratios to average net assets:
Expenses 1.69% 1.69% 2.11% 1.73% 1.80%
Incentive Allocation - 1.39% 0.66% 1.43% 1.12%
Total expenses and Incentive Allocation 1.69% 3.08% 2.77% 3.16% 2.92%
Net investment income/(expense) after Incentive Allocation 1.11% (1.60%) 0.07% (1.68%) (1.44%)
*The total returns detailed above exclude dividends received by shareholders. For classes that have not been in
existence for the whole year, the ratios to average net assets have been annualised however, total return ratios have
not.
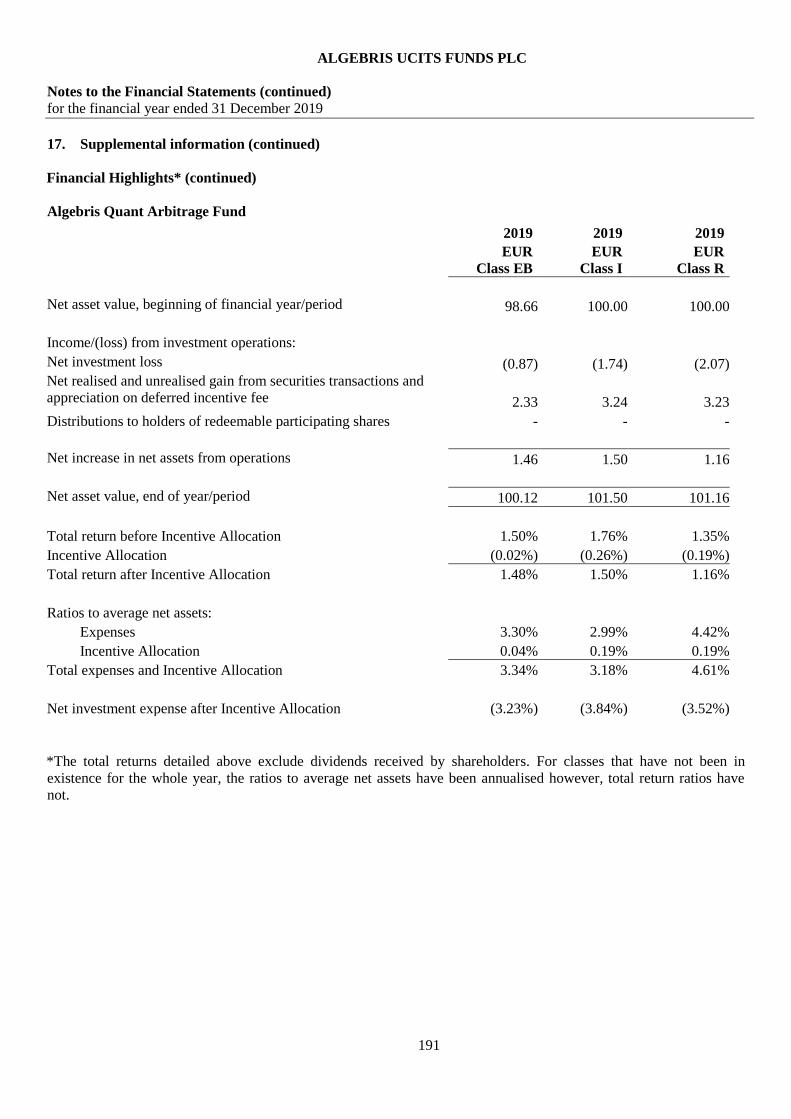
ALGEBRIS UCITS FUNDS PLC
Notes to the Financial Statements (continued)
for the financial year ended 31 December 2019
191
17. Supplemental information (continued)
Financial Highlights* (continued)
Algebris Quant Arbitrage Fund
2019 2019 2019
EUR
Class EB
EUR
Class I
EUR
Class R
Net asset value, beginning of financial year/period
98.66 100.00 100.00
Income/(loss) from investment operations:
Net investment loss
(0.87) (1.74) (2.07)
Net realised and unrealised gain from securities transactions and
appreciation on deferred incentive fee
2.33 3.24 3.23
Distributions to holders of redeemable participating shares - - -
Net increase in net assets from operations
1.46 1.50 1.16
Net asset value, end of year/period
100.12 101.50 101.16
Total return before Incentive Allocation 1.50% 1.76% 1.35%
Incentive Allocation (0.02%) (0.26%) (0.19%)
Total return after Incentive Allocation 1.48% 1.50% 1.16%
Ratios to average net assets:
Expenses 3.30% 2.99% 4.42%
Incentive Allocation 0.04% 0.19% 0.19%
Total expenses and Incentive Allocation 3.34% 3.18% 4.61%
Net investment expense after Incentive Allocation (3.23%) (3.84%) (3.52%)
*The total returns detailed above exclude dividends received by shareholders. For classes that have not been in
existence for the whole year, the ratios to average net assets have been annualised however, total return ratios have
not.

ALGEBRIS UCITS FUNDS PLC
Notes to the Financial Statements (continued)
for the financial year ended 31 December 2019
192
17. Supplemental information (continued)
Financial Highlights* (continued)
Algebris Quant Arbitrage Fund (continued)
2019 2019 2019 2019
GBP
Class EB
JPY
Class I
USD
Class EB
USD
Class I
Net asset value, beginning of financial year/period
100.00 100.00 100.30 100.00
Income/(loss) from investment operations:
Net investment loss
(7.95) (2.33) (4.52) (2.87)
Net realised and unrealised gain from securities transactions and
appreciation on deferred incentive fee
10.95 4.13 8.70 5.68
Distributions to holders of redeemable participating shares - - - -
Net increase in net assets from operations
3.00 1.80 4.18 2.81
Net asset value, end of year/period
103.00 101.80 104.48 102.81
Total return before Incentive Allocation 3.31% 2.07% 4.57% 3.26%
Incentive Allocation (0.31%) (0.27%) (0.40%) (0.45%)
Total return after Incentive Allocation 3.00% 1.80% 4.17% 2.81%
Ratios to average net assets:
Expenses 2.70% 3.70% 3.70% 3.63%
Incentive Allocation 0.30% 0.27% 0.39% 0.44%
Total expenses and Incentive Allocation 3.00% 3.97% 4.09% 4.43%
Net investment expense after Incentive Allocation (2.77%) (2.87%) (2.35%) (3.01%)
*The total returns detailed above exclude dividends received by shareholders. For classes that have not been in
existence for the whole year, the ratios to average net assets have been annualised however, total return ratios have
not.
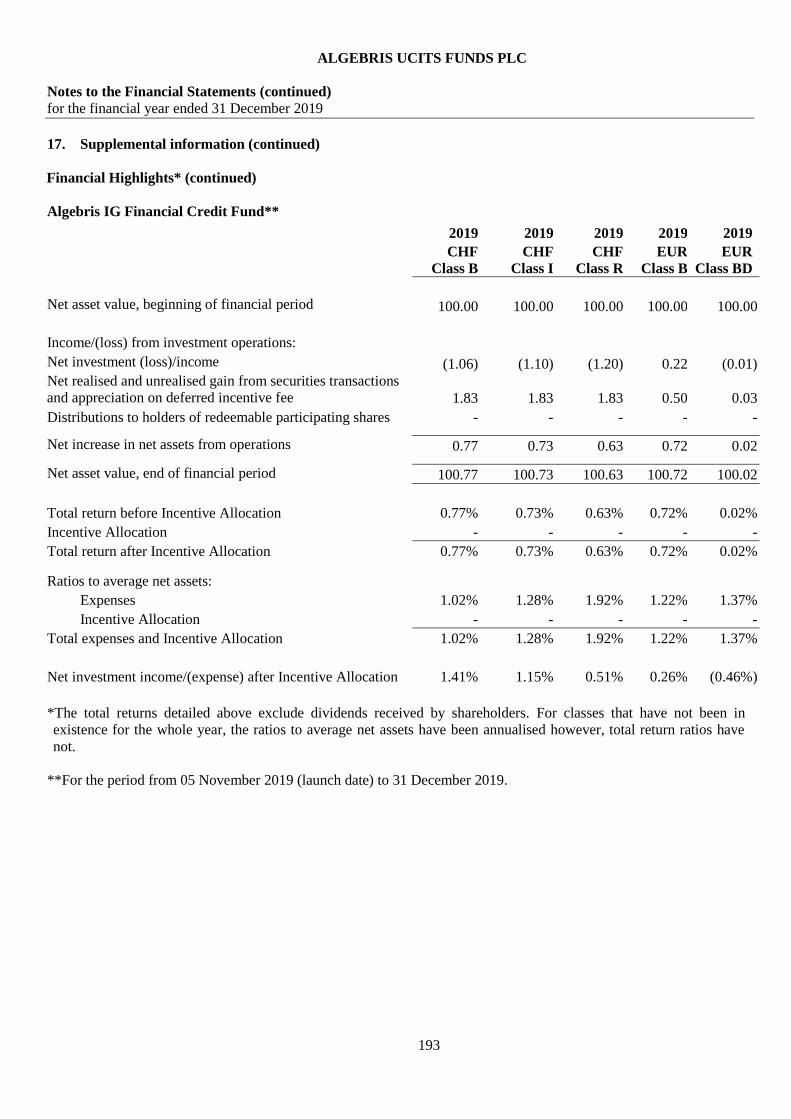
ALGEBRIS UCITS FUNDS PLC
Notes to the Financial Statements (continued)
for the financial year ended 31 December 2019
193
17. Supplemental information (continued)
Financial Highlights* (continued)
Algebris IG Financial Credit Fund**
2019 2019 2019 2019 2019
CHF
Class B
CHF
Class I
CHF
Class R
EUR
Class B
EUR
Class BD
Net asset value, beginning of financial period
100.00 100.00 100.00 100.00 100.00
Income/(loss) from investment operations:
Net investment (loss)/income
(1.06) (1.10) (1.20) 0.22 (0.01)
Net realised and unrealised gain from securities transactions
and appreciation on deferred incentive fee
1.83 1.83 1.83 0.50 0.03
Distributions to holders of redeemable participating shares - - - - - ---
Net increase in net assets from operations
0.77 0.73 0.63 0.72 0.02
Net asset value, end of financial period
100.77 100.73 100.63 100.72 100.02
Total return before Incentive Allocation 0.77% 0.73% 0.63% 0.72% 0.02%
Incentive Allocation - - - - -
Total return after Incentive Allocation 0.77% 0.73% 0.63% 0.72% 0.02%
Ratios to average net assets:
Expenses 1.02% 1.28% 1.92% 1.22% 1.37%
Incentive Allocation - - - - -
Total expenses and Incentive Allocation 1.02% 1.28% 1.92% 1.22% 1.37%
Net investment income/(expense) after Incentive Allocation 1.41% 1.15% 0.51% 0.26% (0.46%)
*The total returns detailed above exclude dividends received by shareholders. For classes that have not been in
existence for the whole year, the ratios to average net assets have been annualised however, total return ratios have
not.
**For the period from 05 November 2019 (launch date) to 31 December 2019.

ALGEBRIS UCITS FUNDS PLC
Notes to the Financial Statements (continued)
for the financial year ended 31 December 2019
194
17. Supplemental information (continued)
Financial Highlights* (continued)
Algebris IG Financial Credit Fund** (continued)
2019 2019 2019 2019
EUR
Class I
EUR
Class R
GBP
Class B
GBP
Class I
Net asset value, beginning of financial period
100.00 100.00 100.00 100.00
Income/(loss) from investment operations:
Net investment income/(loss)
0.17 0.10 (1.93) (1.94)
Net realised and unrealised gain from securities transactions
and appreciation on deferred incentive fee
0.50 0.49 2.87 2.87
Distributions to holders of redeemable participating shares - - - - ---
Net increase in net assets from operations
0.67 0.59 0.94 0.93
Net asset value, end of financial period
100.67 100.59 100.94 100.93
Total return before Incentive Allocation 0.67% 0.59% 0.94% 0.93%
Incentive Allocation - - - -
Total return after Incentive Allocation 0.67% 0.59% 0.94% 0.93%
Ratios to average net assets:
Expenses 1.34% 6.34% 1.09% 1.15%
Incentive Allocation - - - -
Total expenses and Incentive Allocation 1.34% 6.34% 1.09% 1.15%
Net investment income/(expense) after Incentive Allocation 1.09% (5.64%) 1.34% 1.28%
*The total returns detailed above exclude dividends received by shareholders. For classes that have not been in
existence for the whole year, the ratios to average net assets have been annualised however, total return ratios have
not.
**For the period from 05 November 2019 (launch date) to 31 December 2019.
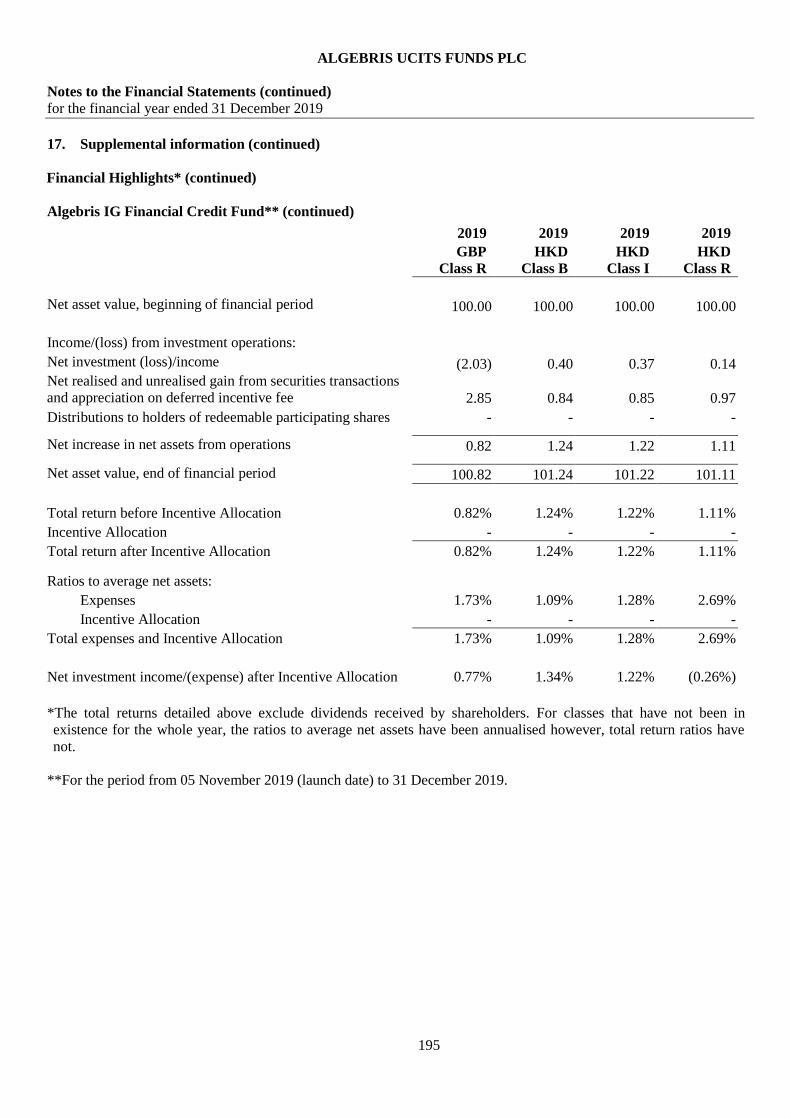
ALGEBRIS UCITS FUNDS PLC
Notes to the Financial Statements (continued)
for the financial year ended 31 December 2019
195
17. Supplemental information (continued)
Financial Highlights* (continued)
Algebris IG Financial Credit Fund** (continued)
2019 2019 2019 2019
GBP
Class R
HKD
Class B
HKD
Class I
HKD
Class R
Net asset value, beginning of financial period
100.00 100.00 100.00 100.00
Income/(loss) from investment operations:
Net investment (loss)/income
(2.03) 0.40 0.37 0.14
Net realised and unrealised gain from securities transactions
and appreciation on deferred incentive fee
2.85 0.84 0.85 0.97
Distributions to holders of redeemable participating shares - - - - ---
Net increase in net assets from operations
0.82 1.24 1.22 1.11
Net asset value, end of financial period
100.82 101.24 101.22 101.11
Total return before Incentive Allocation 0.82% 1.24% 1.22% 1.11%
Incentive Allocation - - - -
Total return after Incentive Allocation 0.82% 1.24% 1.22% 1.11%
Ratios to average net assets:
Expenses 1.73% 1.09% 1.28% 2.69%
Incentive Allocation - - - -
Total expenses and Incentive Allocation 1.73% 1.09% 1.28% 2.69%
Net investment income/(expense) after Incentive Allocation 0.77% 1.34% 1.22% (0.26%)
*The total returns detailed above exclude dividends received by shareholders. For classes that have not been in
existence for the whole year, the ratios to average net assets have been annualised however, total return ratios have
not.
**For the period from 05 November 2019 (launch date) to 31 December 2019.
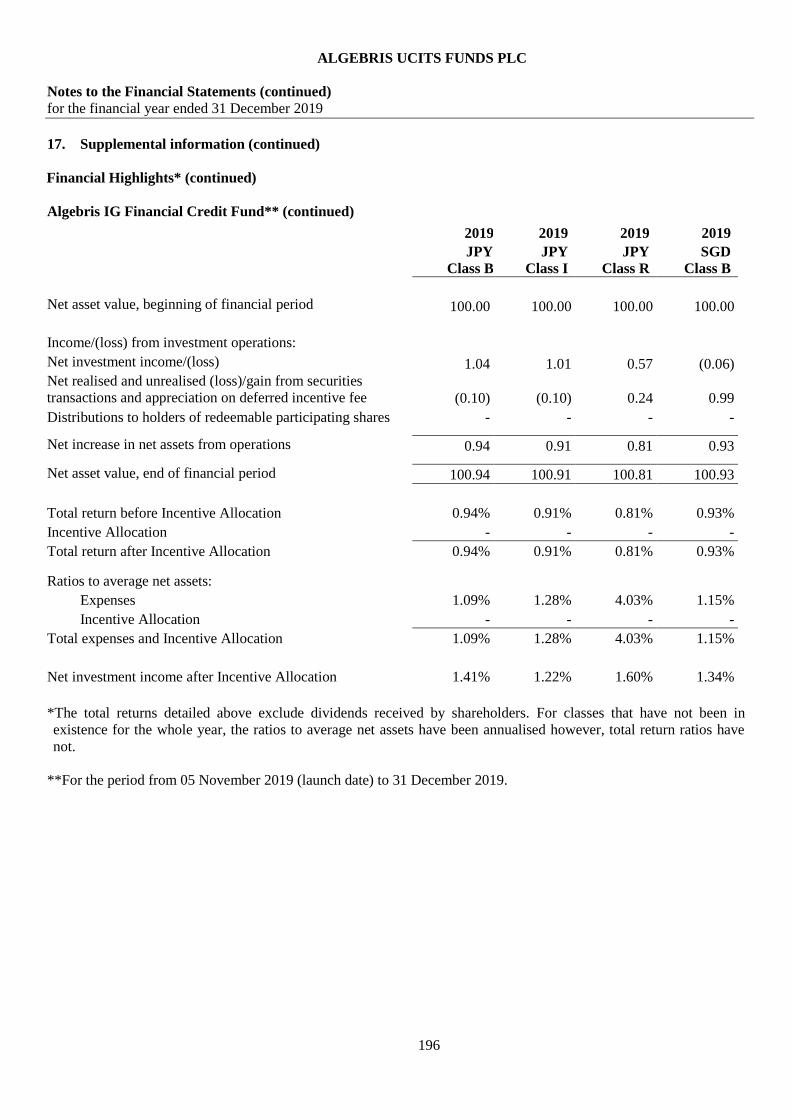
ALGEBRIS UCITS FUNDS PLC
Notes to the Financial Statements (continued)
for the financial year ended 31 December 2019
196
17. Supplemental information (continued)
Financial Highlights* (continued)
Algebris IG Financial Credit Fund** (continued)
2019 2019 2019 2019
JPY
Class B
JPY
Class I
JPY
Class R
SGD
Class B
Net asset value, beginning of financial period
100.00 100.00 100.00 100.00
Income/(loss) from investment operations:
Net investment income/(loss)
1.04 1.01 0.57 (0.06)
Net realised and unrealised (loss)/gain from securities
transactions and appreciation on deferred incentive fee
(0.10) (0.10) 0.24 0.99
Distributions to holders of redeemable participating shares - - - - ---
Net increase in net assets from operations
0.94 0.91 0.81 0.93
Net asset value, end of financial period
100.94 100.91 100.81 100.93
Total return before Incentive Allocation 0.94% 0.91% 0.81% 0.93%
Incentive Allocation - - - -
Total return after Incentive Allocation 0.94% 0.91% 0.81% 0.93%
Ratios to average net assets:
Expenses 1.09% 1.28% 4.03% 1.15%
Incentive Allocation - - - -
Total expenses and Incentive Allocation 1.09% 1.28% 4.03% 1.15%
Net investment income after Incentive Allocation 1.41% 1.22% 1.60% 1.34%
*The total returns detailed above exclude dividends received by shareholders. For classes that have not been in
existence for the whole year, the ratios to average net assets have been annualised however, total return ratios have
not.
**For the period from 05 November 2019 (launch date) to 31 December 2019.
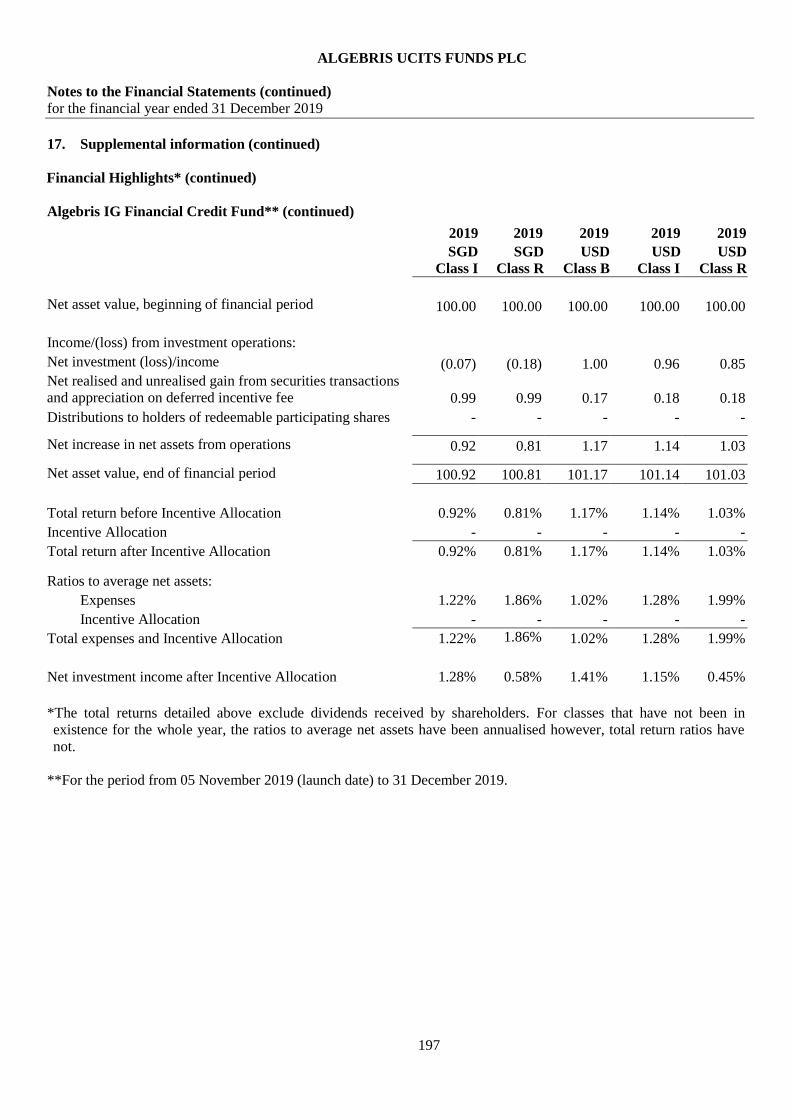
ALGEBRIS UCITS FUNDS PLC
Notes to the Financial Statements (continued)
for the financial year ended 31 December 2019
197
17. Supplemental information (continued)
Financial Highlights* (continued)
Algebris IG Financial Credit Fund** (continued)
2019 2019 2019 2019 2019
SGD
Class I
SGD
Class R
USD
Class B
USD
Class I
USD
Class R
Net asset value, beginning of financial period
100.00 100.00 100.00 100.00 100.00
Income/(loss) from investment operations:
Net investment (loss)/income
(0.07) (0.18) 1.00 0.96 0.85
Net realised and unrealised gain from securities transactions
and appreciation on deferred incentive fee
0.99 0.99 0.17 0.18 0.18
Distributions to holders of redeemable participating shares - - - - - ---
Net increase in net assets from operations
0.92 0.81 1.17 1.14 1.03
Net asset value, end of financial period
100.92 100.81 101.17 101.14 101.03
Total return before Incentive Allocation 0.92% 0.81% 1.17% 1.14% 1.03%
Incentive Allocation - - - - -
Total return after Incentive Allocation 0.92% 0.81% 1.17% 1.14% 1.03%
Ratios to average net assets:
Expenses 1.22% 1.86% 1.02% 1.28% 1.99%
Incentive Allocation - - - - -
Total expenses and Incentive Allocation 1.22% 1.86%
1.02% 1.28% 1.99%
Net investment income after Incentive Allocation 1.28% 0.58% 1.41% 1.15% 0.45%
*The total returns detailed above exclude dividends received by shareholders. For classes that have not been in
existence for the whole year, the ratios to average net assets have been annualised however, total return ratios have
not.
**For the period from 05 November 2019 (launch date) to 31 December 2019.

ALGEBRIS UCITS FUNDS PLC
Notes to the Financial Statements (continued)
for the financial year ended 31 December 2019
198
17. Supplemental information (continued)
Share Capital
For Algebris Financial Credit Fund, the Company paid 31 December 2019 redemptions of EUR 2,680,791 that were
effective 1 January 2020, which would result in a 0.052 % net decrease in the 31 December 2019 Net Assets, had they
been treated as payable as at 31 December 2019, as would be required under accounting standards generally accepted
in the United States of America.
For Algebris Financial Income Fund, the Company paid 31 December 2019 redemptions of EUR 2,215,612 that were
effective 1 January 2020, which would result in a 0.471 % net decrease in the 31 December 2019 Net Assets, had they
been treated as payable as at 31 December 2019, as would be required under accounting standards generally accepted
in the United States of America.
For Algebris Allocation Fund, the Company paid 31 December 2019 redemptions of EUR 6,089 that were effective 1
January 2020, which would result in a 0.063 % net decrease in the 31 December 2019 Net Assets, had they been
treated as payable as at 31 December 2019, as would be required under accounting standards generally accepted in the
United States of America.
For Algebris Financial Equity Fund, the Company paid 31 December 2019 redemptions of EUR 169,249 that were
effective 1 January 2020, which would result in a 0.233 % net decrease in the 31 December 2019 Net Assets, had they
been treated as payable as at 31 December 2019, as would be required under accounting standards generally accepted
in the United States of America.
For Algebris Macro Credit Fund, the Company paid 31 December 2019 redemptions of EUR 228,434 that were
effective 1 January 2020, which would result in a 0.043 % net decrease in the 31 December 2019 Net Assets, had they
been treated as payable as at 31 December 2019, as would be required under accounting standards generally accepted
in the United States of America.
For Algebris Core Italy Fund, the Company paid 31 December 2019 redemptions of EUR 11,943 that were effective 1
January 2020, which would result in a 0.024 % net decrease in the 31 December 2019 Net Assets, had they been
treated as payable as at 31 December 2019, as would be required under accounting standards generally accepted in the
United States of America.
For Algebris Quant Arbitrage Fund, the Company paid 31 December 2019 redemptions of EUR 1,120 that were
effective 1 January 2020, which would result in a 0.003 % net decrease in the 31 December 2019 Net Assets, had they
been treated as payable as at 31 December 2019, as would be required under accounting standards generally accepted
in the United States of America.
Accounting for Uncertainty in Income Taxes
“Accounting for Uncertainty in Income Taxes- an interpretation of ASC 740” effective January 1, 2009, clarifies the
accounting for uncertainty in income taxes recognised in Company’s financial statements in accordance with ASC
740; Accounting for Income Taxes. ASC 740 prescribes a recognition threshold and measurement attribute for the
financial statement recognition and measurement of a tax position taken or expected to be taken in a tax return. ASC
740 requires that the enterprise determines whether it is more likely than not that a tax position will be sustained upon
examination, including resolution of any related appeals or litigation processes, based on the technical merits of the
position. In evaluating whether a tax position has met the more-likely-than-not recognition threshold, the enterprise
should presume that the position will be examined by the appropriate taxing authority that has full knowledge of all
relevant information. A tax position that meets the more-likely-than-not recognition threshold is measured to
determine the amount of benefit to recognise in the financial statements. The tax position is measured at the largest
amount of benefit that is greater than 50 percent likely of being realised upon settlement.
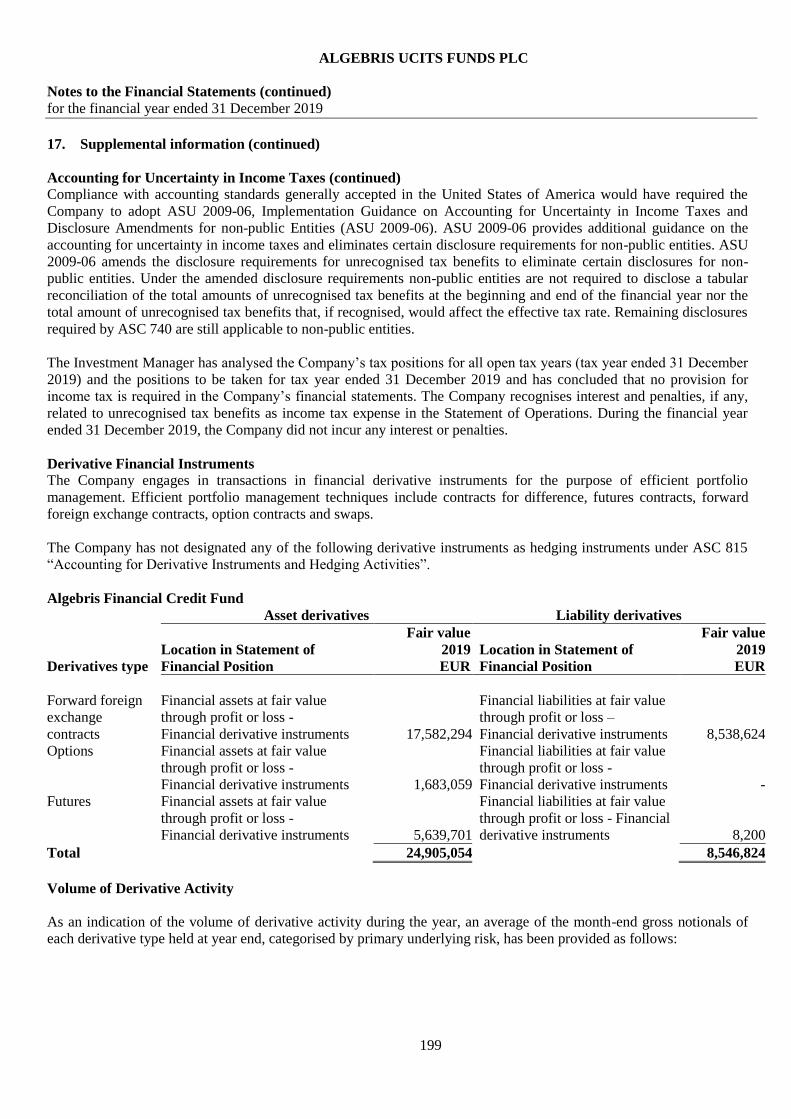
ALGEBRIS UCITS FUNDS PLC
Notes to the Financial Statements (continued)
for the financial year ended 31 December 2019
199
17. Supplemental information (continued)
Accounting for Uncertainty in Income Taxes (continued)
Compliance with accounting standards generally accepted in the United States of America would have required the
Company to adopt ASU 2009-06, Implementation Guidance on Accounting for Uncertainty in Income Taxes and
Disclosure Amendments for non-public Entities (ASU 2009-06). ASU 2009-06 provides additional guidance on the
accounting for uncertainty in income taxes and eliminates certain disclosure requirements for non-public entities. ASU
2009-06 amends the disclosure requirements for unrecognised tax benefits to eliminate certain disclosures for non-
public entities. Under the amended disclosure requirements non-public entities are not required to disclose a tabular
reconciliation of the total amounts of unrecognised tax benefits at the beginning and end of the financial year nor the
total amount of unrecognised tax benefits that, if recognised, would affect the effective tax rate. Remaining disclosures
required by ASC 740 are still applicable to non-public entities.
The Investment Manager has analysed the Company’s tax positions for all open tax years (tax year ended 31 December
2019) and the positions to be taken for tax year ended 31 December 2019 and has concluded that no provision for
income tax is required in the Company’s financial statements. The Company recognises interest and penalties, if any,
related to unrecognised tax benefits as income tax expense in the Statement of Operations. During the financial year
ended 31 December 2019, the Company did not incur any interest or penalties.
Derivative Financial Instruments
The Company engages in transactions in financial derivative instruments for the purpose of efficient portfolio
management. Efficient portfolio management techniques include contracts for difference, futures contracts, forward
foreign exchange contracts, option contracts and swaps.
The Company has not designated any of the following derivative instruments as hedging instruments under ASC 815
“Accounting for Derivative Instruments and Hedging Activities”.
Algebris Financial Credit Fund
Asset derivatives Liability derivatives
Derivatives type
Location in Statement of
Financial Position
Fair value
2019
EUR
Location in Statement of
Financial Position
Fair value
2019
EUR
Forward foreign
exchange
contracts
Financial assets at fair value
through profit or loss -
Financial derivative instruments 17,582,294
Financial liabilities at fair value
through profit or loss –
Financial derivative instruments 8,538,624
Options Financial assets at fair value
through profit or loss -
Financial derivative instruments 1,683,059
Financial liabilities at fair value
through profit or loss -
Financial derivative instruments -
Futures Financial assets at fair value
through profit or loss -
Financial derivative instruments 5,639,701
Financial liabilities at fair value
through profit or loss - Financial
derivative instruments 8,200
Total 24,905,054 8,546,824
Volume of Derivative Activity
As an indication of the volume of derivative activity during the year, an average of the month-end gross notionals of
each derivative type held at year end, categorised by primary underlying risk, has been provided as follows:

ALGEBRIS UCITS FUNDS PLC
Notes to the Financial Statements (continued)
for the financial year ended 31 December 2019
200
17. Supplemental information (continued)
Derivative Financial Instruments (continued)
Notional Long
Exposure
Notional Short
Exposure
EUR EUR
Currency Risk
Forward foreign exchange contracts 2,649,259,786 (1,200,998,434)
Equity Price Risk
Futures - (331,460,883)
Options 29,794,288,559 (16,353,514,309)
Algebris Financial Income Fund
Asset derivatives Liability derivatives
Derivatives type
Location in Statement of
Financial Position
Fair value
2019
EUR
Location in Statement of
Financial Position
Fair value
2019
EUR
Contracts for
difference
Financial assets at fair value
through profit or loss -
Financial derivative instruments 853,717
Financial liabilities at fair value
through profit or loss - Financial
derivative instruments 5,986,717
Forward foreign
exchange contracts
Financial assets at fair value
through profit or loss -
Financial derivative instruments 1,235,363
Financial liabilities at fair value
through profit or loss - Financial
derivative instruments 848,085
Futures Financial assets at fair value
through profit or loss -
Financial derivative instruments 85,330
Financial liabilities at fair value
through profit or loss - Financial
derivative instruments 3,200
Options Financial assets at fair value
through profit or loss -
Financial derivative instruments 605,512
Financial liabilities at fair value
through profit or loss - Financial
derivative instruments 184,583
Equity warrants Financial assets at fair value
through profit or loss -
Financial derivative instruments 104,257
Financial liabilities at fair value
through profit or loss -
Financial derivative instruments -
Total 2,884,179 7,022,585
Volume of Derivative Activity
As an indication of the volume of derivative activity during the year, an average of the month-end gross notionals of
each derivative type held at year end, categorised by primary underlying risk, has been provided as follows:
Notional Long
Exposure
Notional Short
Exposure
EUR EUR
Currency Risk
Forward foreign exchange contracts 277,749,271 (182,001,083)
Equity Price Risk
Contracts for difference 80,651,603 -
Equity warrants 329,218
Options 3,606,810,531 (1,951,846,241)
Futures - (27,047,816)
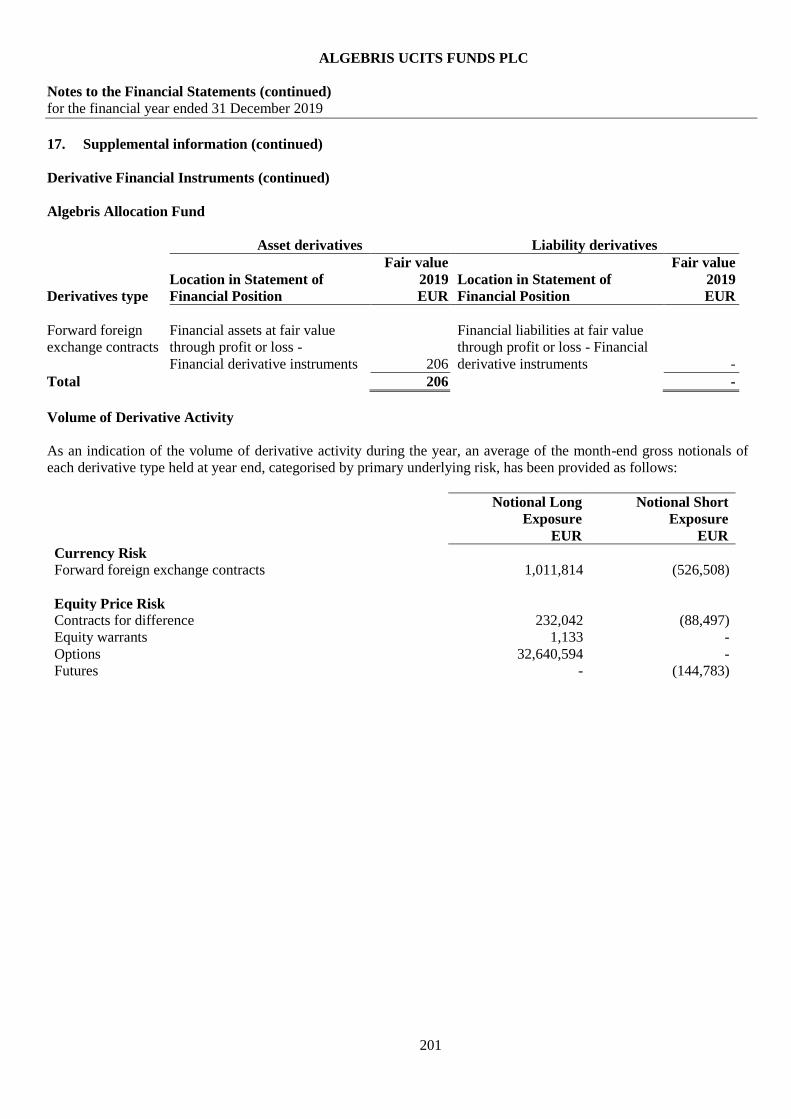
ALGEBRIS UCITS FUNDS PLC
Notes to the Financial Statements (continued)
for the financial year ended 31 December 2019
201
17. Supplemental information (continued)
Derivative Financial Instruments (continued)
Algebris Allocation Fund
Asset derivatives Liability derivatives
Derivatives type
Location in Statement of
Financial Position
Fair value
2019
EUR
Location in Statement of
Financial Position
Fair value
2019
EUR
Forward foreign
exchange contracts
Financial assets at fair value
through profit or loss -
Financial derivative instruments 206
Financial liabilities at fair value
through profit or loss - Financial
derivative instruments -
Total 206 -
Volume of Derivative Activity
As an indication of the volume of derivative activity during the year, an average of the month-end gross notionals of
each derivative type held at year end, categorised by primary underlying risk, has been provided as follows:
Notional Long
Exposure
Notional Short
Exposure
EUR EUR
Currency Risk
Forward foreign exchange contracts 1,011,814 (526,508)
Equity Price Risk
Contracts for difference 232,042 (88,497)
Equity warrants 1,133 -
Options 32,640,594 -
Futures - (144,783)
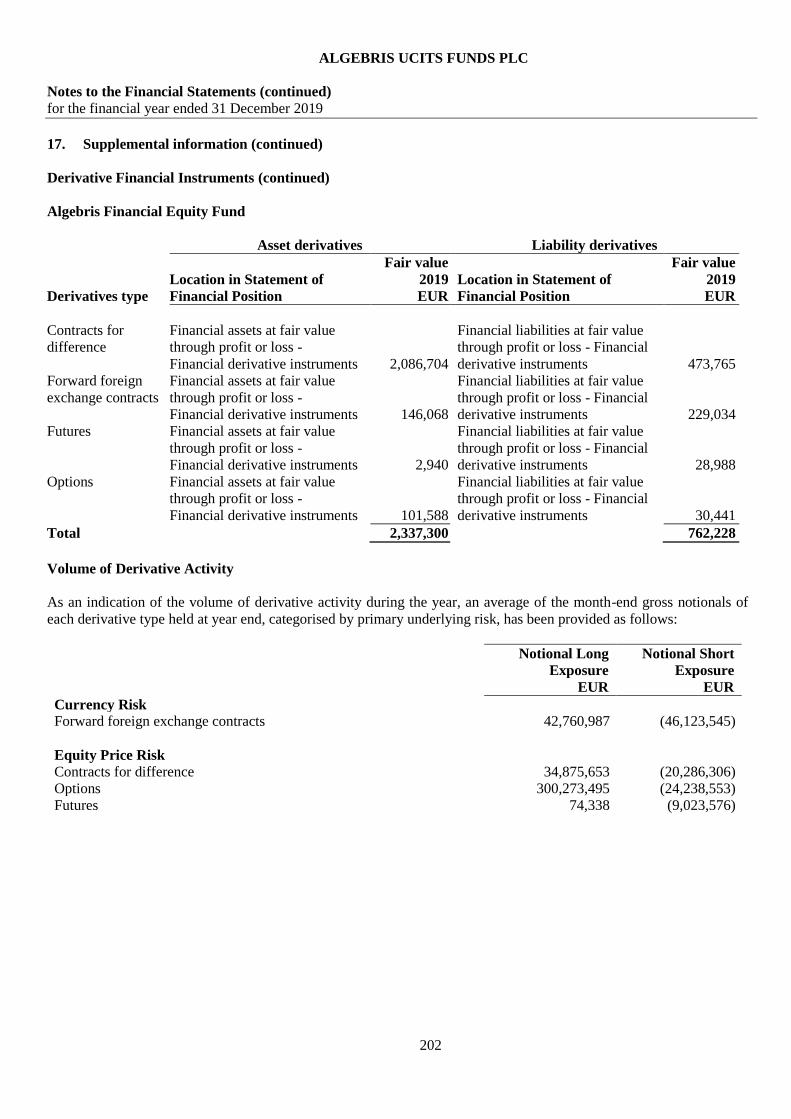
ALGEBRIS UCITS FUNDS PLC
Notes to the Financial Statements (continued)
for the financial year ended 31 December 2019
202
17. Supplemental information (continued)
Derivative Financial Instruments (continued)
Algebris Financial Equity Fund
Asset derivatives Liability derivatives
Derivatives type
Location in Statement of
Financial Position
Fair value
2019
EUR
Location in Statement of
Financial Position
Fair value
2019
EUR
Contracts for
difference
Financial assets at fair value
through profit or loss -
Financial derivative instruments 2,086,704
Financial liabilities at fair value
through profit or loss - Financial
derivative instruments 473,765
Forward foreign
exchange contracts
Financial assets at fair value
through profit or loss -
Financial derivative instruments 146,068
Financial liabilities at fair value
through profit or loss - Financial
derivative instruments 229,034
Futures Financial assets at fair value
through profit or loss -
Financial derivative instruments 2,940
Financial liabilities at fair value
through profit or loss - Financial
derivative instruments 28,988
Options Financial assets at fair value
through profit or loss -
Financial derivative instruments 101,588
Financial liabilities at fair value
through profit or loss - Financial
derivative instruments 30,441
Total 2,337,300 762,228
Volume of Derivative Activity
As an indication of the volume of derivative activity during the year, an average of the month-end gross notionals of
each derivative type held at year end, categorised by primary underlying risk, has been provided as follows:
Notional Long
Exposure
Notional Short
Exposure
EUR EUR
Currency Risk
Forward foreign exchange contracts 42,760,987 (46,123,545)
Equity Price Risk
Contracts for difference 34,875,653 (20,286,306)
Options 300,273,495 (24,238,553)
Futures 74,338 (9,023,576)

ALGEBRIS UCITS FUNDS PLC
Notes to the Financial Statements (continued)
for the financial year ended 31 December 2019
203
17. Supplemental information (continued)
Derivative Financial Instruments (continued)
Algebris Macro Credit Fund
Asset derivatives Liability derivatives
Derivatives type
Location in Statement of
Financial Position
Fair value
2019
EUR
Location in Statement of
Financial Position
Fair value
2019
EUR
Forward foreign
exchange contracts
Financial assets at fair value
through profit or loss -
Financial derivative instruments 570,175
Financial liabilities at fair value
through profit or loss - Financial
derivative instruments 206,566
Futures Financial assets at fair value
through profit or loss -
Financial derivative instruments -
Financial liabilities at fair value
through profit or loss - Financial
derivative instruments 833,478
Options Financial assets at fair value
through profit or loss -
Financial derivative instruments 4,407,778
Financial liabilities at fair value
through profit or loss - Financial
derivative instruments 1,844,560
Swaps Financial assets at fair value
through profit or loss -
Financial derivative instruments 10,430,889
Financial liabilities at fair value
through profit or loss - Financial
derivative instruments 22,601,812
Total 15,408,842 25,486,416
Volume of Derivative Activity
As an indication of the volume of derivative activity during the year, an average of the month-end gross notionals of
each derivative type held at year end, categorised by primary underlying risk, has been provided as follows:
Notional Long
Exposure
Notional Short
Exposure
EUR EUR
Currency Risk
Forward foreign exchange contracts 157,785,186 (44,551,212)
Equity Price Risk
Contracts for difference 71,027,372 (48,007,087)
Options 204,161,765,351 (10,939,781,814)
Futures 99,920,282 (36,218,472)
Other Swaps 880,700,000 (4,741,654,991)

ALGEBRIS UCITS FUNDS PLC
Notes to the Financial Statements (continued)
for the financial year ended 31 December 2019
204
17. Supplemental information (continued)
Derivative Financial Instruments (continued)
Algebris Core Italy Fund
Asset derivatives Liability derivatives
Derivatives type
Location in Statement of
Financial Position
Fair value
2019
EUR
Location in Statement of
Financial Position
Fair value
2019
EUR
Forward foreign
exchange contracts
Financial assets at fair value
through profit or loss -
Financial derivative instruments 26,850
Financial liabilities at fair value
through profit or loss - Financial
derivative instruments 5
Futures Financial assets at fair value
through profit or loss -
Financial derivative instruments -
Financial liabilities at fair value
through profit or loss - Financial
derivative instruments 340
Equity warrants Financial assets at fair value
through profit or loss -
Financial derivative instruments 282,143
Financial liabilities at fair value
through profit or loss - Financial
derivative instruments -
Total 308,993 345
Volume of Derivative Activity
As an indication of the volume of derivative activity during the year, an average of the month-end gross notionals of
each derivative type held at year end, categorised by primary underlying risk, has been provided as follows:
Notional Long
Exposure
Notional Short
Exposure
EUR EUR
Currency Risk
Forward foreign exchange contracts 2,183,653 (123,910)
Equity Price Risk
Contracts for difference 248,025 -
Equity warrants 1,193,428 -
Options 1,287,500 -
Futures - (3,825,400)

ALGEBRIS UCITS FUNDS PLC
Notes to the Financial Statements (continued)
for the financial year ended 31 December 2019
205
17. Supplemental information (continued)
Derivative Financial Instruments (continued)
Algebris Quant Arbitrage Fund
Asset derivatives Liability derivatives
Derivatives type
Location in Statement of
Financial Position
Fair value
2019
EUR
Location in Statement of
Financial Position
Fair value
2019
EUR
Forward foreign
exchange contracts
Financial assets at fair value
through profit or loss -
Financial derivative instruments 2
Financial liabilities at fair value
through profit or loss - Financial
derivative instruments 485
Total 2 485
Volume of Derivative Activity
As an indication of the volume of derivative activity during the year, an average of the month-end gross notionals of
each derivative type held at year end, categorised by primary underlying risk, has been provided as follows:
Notional Long
Exposure
Notional Short
Exposure
EUR EUR
Currency Risk
Forward foreign exchange contracts 849,890 (718,505)
Equity Price Risk
Other Swaps 7,271,334 (7,296,692)

ALGEBRIS UCITS FUNDS PLC
Notes to the Financial Statements (continued)
for the financial year ended 31 December 2019
206
17. Supplemental information (continued)
Derivative Financial Instruments (continued)
Algebris IG Financial Credit Fund
Asset derivatives Liability derivatives
Derivatives type
Location in Statement of
Financial Position
Fair value
2019
EUR
Location in Statement of
Financial Position
Fair value
2019
EUR
Forward foreign
exchange contracts
Financial assets at fair value
through profit or loss -
Financial derivative instruments 20,361
Financial liabilities at fair value
through profit or loss - Financial
derivative instruments 16,065
Total 20,361 16,065
Volume of Derivative Activity
As an indication of the volume of derivative activity during the year, an average of the month-end gross notionals of
each derivative type held at year end, categorised by primary underlying risk, has been provided as follows:
Notional Long
Exposure
Notional Short
Exposure
EUR EUR
Currency Risk
Forward foreign exchange contracts 2,772,766 (6,790,484)

ALGEBRIS UCITS FUNDS PLC
Notes to the Financial Statements (continued)
for the financial year ended 31 December 2019
207
17. Supplemental information (continued)
Derivative Financial Instruments (continued)
The effect of transactions in derivative instruments to the Statement of Comprehensive Income during the financial
year to 31 December 2019 was as follows:
Algebris Financial Credit Fund
Derivative type
Location of gain/(loss) on derivatives recognised in
Statement of Comprehensive income
Net realised
gain/(loss)
on derivatives
EUR
Net change in
unrealised
appreciation/
(depreciation)
on derivatives
EUR
Forward foreign
exchange contracts
Net loss on financial assets and liabilities
at fair value through profit or loss (79,545,998) (4,924,179)
Futures Net (loss)/gain on financial assets and liabilities
at fair value through profit or loss (34,431,088) 7,365,457
Options Net loss on financial assets and liabilities
at fair value through profit or loss (25,435,719) (824,299)
Total (139,412,805) 1,616,979
Algebris Financial Income Fund
Derivative type
Location of gain/(loss) on derivatives recognised in
Statement of Comprehensive income
Net realised
gain/(loss)
on derivatives
EUR
Net change in
unrealised
appreciation/
(depreciation)
on derivatives
EUR
Contracts for
difference
Net (loss)/gain on financial assets and liabilities
at fair value through profit or loss (12,075,672) 28,561,552
Forward foreign
exchange contracts
Net loss on financial assets and liabilities
at fair value through profit or loss (5,843,090) (254,924)
Futures Net (loss)/gain on financial assets and liabilities
at fair value through profit or loss (3,476,394) 361,910
Options Net (loss)/gain on financial assets and liabilities
at fair value through profit or loss (11,688,178) 729,692
Equity warrants Net gain on financial assets and liabilities
at fair value through profit or loss - 77,881
Total (33,083,334) 29,476,111
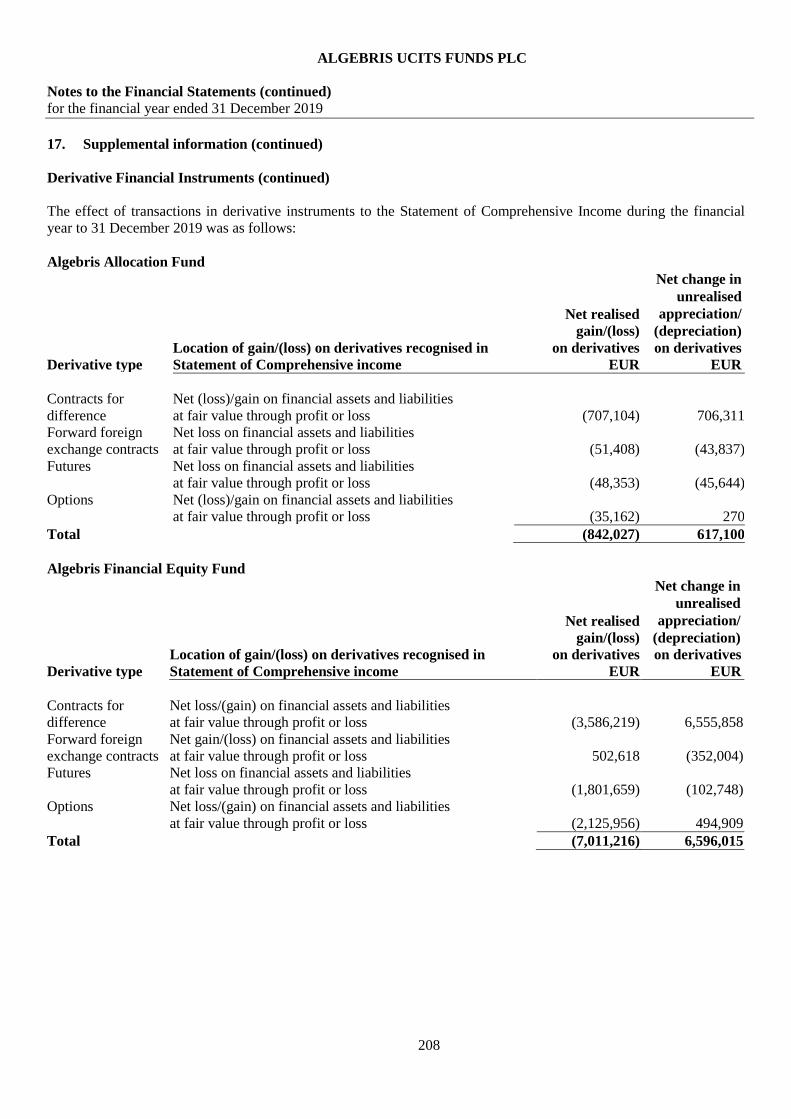
ALGEBRIS UCITS FUNDS PLC
Notes to the Financial Statements (continued)
for the financial year ended 31 December 2019
208
17. Supplemental information (continued)
Derivative Financial Instruments (continued)
The effect of transactions in derivative instruments to the Statement of Comprehensive Income during the financial
year to 31 December 2019 was as follows:
Algebris Allocation Fund
Derivative type
Location of gain/(loss) on derivatives recognised in
Statement of Comprehensive income
Net realised
gain/(loss)
on derivatives
EUR
Net change in
unrealised
appreciation/
(depreciation)
on derivatives
EUR
Contracts for
difference
Net (loss)/gain on financial assets and liabilities
at fair value through profit or loss (707,104) 706,311
Forward foreign
exchange contracts
Net loss on financial assets and liabilities
at fair value through profit or loss (51,408) (43,837)
Futures Net loss on financial assets and liabilities
at fair value through profit or loss (48,353) (45,644)
Options Net (loss)/gain on financial assets and liabilities
at fair value through profit or loss (35,162) 270
Total (842,027) 617,100
Algebris Financial Equity Fund
Derivative type
Location of gain/(loss) on derivatives recognised in
Statement of Comprehensive income
Net realised
gain/(loss)
on derivatives
EUR
Net change in
unrealised
appreciation/
(depreciation)
on derivatives
EUR
Contracts for
difference
Net loss/(gain) on financial assets and liabilities
at fair value through profit or loss (3,586,219) 6,555,858
Forward foreign
exchange contracts
Net gain/(loss) on financial assets and liabilities
at fair value through profit or loss 502,618 (352,004)
Futures Net loss on financial assets and liabilities
at fair value through profit or loss (1,801,659) (102,748)
Options Net loss/(gain) on financial assets and liabilities
at fair value through profit or loss (2,125,956) 494,909
Total (7,011,216) 6,596,015

ALGEBRIS UCITS FUNDS PLC
Notes to the Financial Statements (continued)
for the financial year ended 31 December 2019
209
17. Supplemental information (continued)
Derivative Financial Instruments (continued)
The effect of transactions in derivative instruments to the Statement of Comprehensive Income during the financial
year to 31 December 2019 was as follows:
Algebris Macro Credit Fund
Derivative type
Location of gain/(loss) on derivatives recognised in
Statement of Comprehensive income
Net realised
gain/(loss) on
derivatives
EUR
Net change in
unrealised
appreciation/
(depreciation)
on derivatives
EUR
Swaps including
contracts for
difference
Net gain on financial assets and liabilities
at fair value through profit or loss 42,332,963 9,823,238
Forward foreign
exchange contracts
Net loss on financial assets and liabilities
at fair value through profit or loss (9,341,499) (896,632)
Futures Net loss on financial assets and liabilities
at fair value through profit or loss (1,282,960) (2,039,014)
Options Net gain/(loss) on financial assets and liabilities
at fair value through profit or loss 5,522,094 (1,326,000)
Total 37,230,598 5,561,592
Algebris Core Italy Fund
Derivative type
Location of gain/(loss) on derivatives recognised in
Statement of Comprehensive income
Net realised
gain/(loss)
on derivatives
EUR
Net change in
unrealised
appreciation/
(depreciation)
on derivatives
EUR
Contracts for
difference
Net gain on financial assets and liabilities
at fair value through profit or loss 364,844 -
Forward foreign
exchange contracts
Net (loss)/gain on financial assets and liabilities
at fair value through profit or loss (71,645) 18,535
Future Net loss on financial assets and liabilities
at fair value through profit or loss (604,810) (340)
Options Net loss on financial assets and liabilities
at fair value through profit or loss (96,517) -
Equity warrants Net gain on financial assets and liabilities
at fair value through profit or loss 14,302 232,156
Total (393,826) 250,351
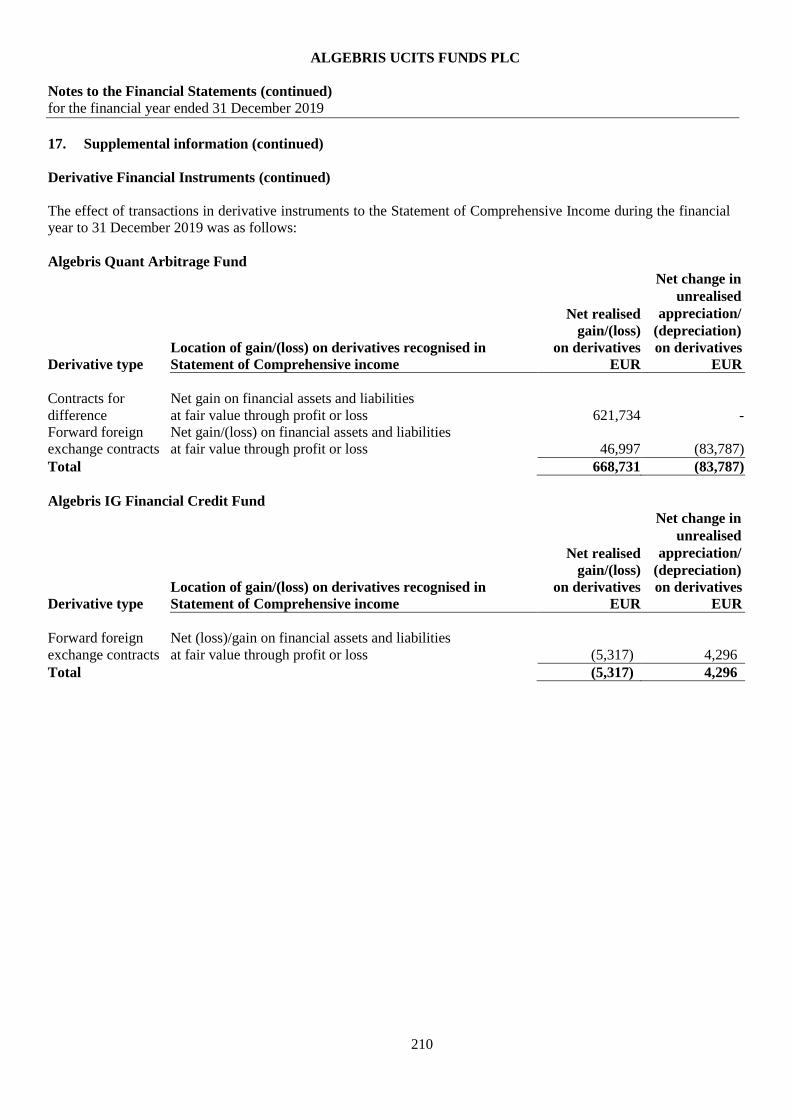
ALGEBRIS UCITS FUNDS PLC
Notes to the Financial Statements (continued)
for the financial year ended 31 December 2019
210
17. Supplemental information (continued)
Derivative Financial Instruments (continued)
The effect of transactions in derivative instruments to the Statement of Comprehensive Income during the financial
year to 31 December 2019 was as follows:
Algebris Quant Arbitrage Fund
Derivative type
Location of gain/(loss) on derivatives recognised in
Statement of Comprehensive income
Net realised
gain/(loss)
on derivatives
EUR
Net change in
unrealised
appreciation/
(depreciation)
on derivatives
EUR
Contracts for
difference
Net gain on financial assets and liabilities
at fair value through profit or loss 621,734 -
Forward foreign
exchange contracts
Net gain/(loss) on financial assets and liabilities
at fair value through profit or loss 46,997 (83,787)
Total 668,731 (83,787)
Algebris IG Financial Credit Fund
Derivative type
Location of gain/(loss) on derivatives recognised in
Statement of Comprehensive income
Net realised
gain/(loss)
on derivatives
EUR
Net change in
unrealised
appreciation/
(depreciation)
on derivatives
EUR
Forward foreign
exchange contracts
Net (loss)/gain on financial assets and liabilities
at fair value through profit or loss (5,317) 4,296
Total (5,317) 4,296

ALGEBRIS UCITS FUNDS PLC
Notes to the Financial Statements (continued)
for the financial year ended 31 December 2019
211
17. Supplemental information (continued)
Derivative Financial Instruments (continued)
Repurchase agreements
Repurchase agreements involve the sale of a fixed income security to a counter party, with an obligation for the
Fund to repurchase the security from the counter party at a contracted price on maturity. In connection with its
repurchase agreements the Sub-Funds are required to pledge collateral to their counterparties. If the fair value of the
collateral declines, the Sub-Funds may be required to post additional collateral to the counterparty. To mitigate this
risk, the Sub-Fund pledges financial instruments as collateral that are (1) issued by entities that the Sub-Fund’s
management believes have sufficient creditworthiness to meet their obligations when they come due and (2)
sufficiently liquid to be sold at their carrying amounts in the ordinary course of business. At 31 December 2019, the
Fund pledged the following securities which are included in the Statement of Financial Position as fixed income
pledged as collateral:
Algebris Macro Credit Fund
Type of Collateral Fair Value
EUR Fixed Income Securities 2,034,715

ALGEBRIS UCITS FUNDS PLC
Notes to the Financial Statements (continued)
for the financial year ended 31 December 2019
212
18. Related parties
The below table provides an analysis of related party transactions for the period ended 31 December 2019.
Name Relationship Transaction type Fees paid
Algebris (UK) Limited Investment Manager,
Promoter
Investment management
services
See note 6
The Investment Manager is a subsidiary of Algebris Investments (Luxembourg) S.a.r.l. Alexander Lasagna, Director
of the Company, is also a Director of both the Investment Manager and Algebris Investments (Luxembourg) S.a.r.l.
Alexander Lasagna holds 31,796 shares in Algebris Financial Equity Fund.
Fees paid to the Directors and the Company Secretary for the financial year ended 31 December 2019 are included
in Note 6 of these financial statements.
Algebris Investments (Asia) PTE LTD, a subsidiary of Algebris Investments (Luxembourg) S.a.r.l. holds 28,348
shares in Algebris Financial Credit Fund, 5,700 shares in Algebris Financial Income Fund, 10 shares in Algebris
Allocation Fund, 19,410 shares in Algebris Financial Equity Fund, 5,700 shares in Algebris Macro Credit Fund,
200,023 shares in Algebris Core Italy Fund and hold 100,050 shares in Algebris Quant Arbitrage Fund.
The Investment Manager holds 200 shares in Algebris Financial Credit Fund, 180 shares in Algebris Financial
Income Fund, 1,250 shares in Algebris Allocation Fund, 1,271 shares in Algebris Core Italy Fund, 1,291 shares in
Algebris Quant Arbitrage Fund and 4,003,769 shares in Algebris IG Financial Credit Fund.
In accordance with the requirements of UCITS Regulations, all transactions carried out with the Company by the
promoter, manager, depositary, investment adviser and associates/group companies (“connected parties”) must be
carried out as if negotiated at arm’s length and be in the best interests of shareholders. The Directors are satisfied that
there are arrangements in place to ensure that the obligations set out in the UCITS Notices are applied to all
transactions with connected parties and transactions with connected parties entered into during the period complied
with the obligations set out in the UCITS Notices.
Cross Sub-Fund Investments
For Algebris Allocation Fund, as at 31 December 2019, the cross Sub-Fund investments were as follows –
Currency EUR
Algebris UCITS Funds plc - Algebris Financial Income Fund Class M Accumulating 1,692,722
Algebris UCITS Funds plc - Algebris Financial Credit Fund Class M Accumulating 1,501,327
Algebris UCITS Funds plc - Algebris Macro Credit Fund Class M Accumulating 1,432,782
Algebris UCITS Funds plc - Algebris Core Italy Fund Class M Accumulating 824,376
Algebris UCITS Funds plc - Algebris Quant Arbitrage Fund Class M Accumulating 1,403,066
Algebris UCITS Funds Plc - Algebris IG Financial Credit Fund Class M EUR Accumulating 1,361,880
Algebris UCITS Funds Plc - Algebris Financial Credit Fund Class M USD Accumulating 178,547
Algebris UCITS Funds Plc - Algebris IG Financial Credit Fund Class M USD Accumulating 271,102
Total 8,665,802
There was net gain on financial assets and liabilities at fair value through profit & loss of EUR 784,852 due to such
cross holdings.
For Algebris IG Financial Credit Fund, as at 31 December 2019, the cross Sub-Fund investments were as follows –
Currency EUR
Algebris UCITS Funds plc - Algebris Financial Credit Fund Class M Accumulating 986,535
Total 986,535
There was net gain on financial assets and liabilities at fair value through profit & loss of EUR 20,050 due to such
cross holdings.

ALGEBRIS UCITS FUNDS PLC
Notes to the Financial Statements (continued)
for the financial year ended 31 December 2019
213
19. Litigation
On 6 June 2017, the Single Resolution Board (the European Banking Union's bank resolution authority) (the “SRB”)
adopted a resolution plan with respect to Banco Popular Español S.A. (“Banco Popular”), citing a “significant
deterioration of the liquidity situation of the bank” (the “Resolution”). As part of the Resolution, Banco Popular’s
outstanding AT1 securities were converted to equity and written down, while its Tier 2 securities were converted to
equity, written down and transferred to Banco Santander, S.A. (“Santander”) for one Euro. In the wake of the
Resolution (and without conceding its validity), it was decided that the net asset value of Algebris Financial Credit
Fund, Algebris Macro Credit Fund, Algebris Financial Income Fund and the Algebris Financial Equity Fund (the
“Impacted Funds”) should be reduced.
Algebris (UK) Limited, as Investment Manager on behalf of the Impacted Funds, has joined a group of affected
bondholders (the “Bondholders”) that have jointly appointed the law firm Quinn Emanuel Urquhart & Sullivan UK
LLP (“Quinn Emanuel”) to pursue various legal claims and actions in an effort to recover losses suffered by the
Bondholders in connection with the Resolution.
To date, Quinn Emanuel (acting on behalf of the Bondholders, including the Impacted Funds) has, inter alia, taken
the following actions:
(i) appointed (i) Andersen Tax and Legal and (ii) SLJ Abogados to advise the Bondholders with respect to their
rights under Spanish law;
(ii) retained experts to assess, inter alia, the value of Banco Popular at the time of the Resolution, and allegations of
improper conduct at or involving Banco Popular prior to the Resolution;
(iii) filed multiple applications to access critical documents from the SRB, the European Central Bank and the
European Commission (“EC”), and Santander;
(iv) filed actions for annulment against both the SRB and the EC before the General Court of the European Union
challenging the Resolution;
(v) filed an administrative claim in Spain challenging the conduct of the Spanish National Resolution Authority
(the Fondo de reestructuración ordenada bancaria) in giving effect to the Resolution in Spain;
(vi) filed writs joining the Bondholders as “aggrieved parties” in ongoing criminal proceedings in Spain concerning
allegations of improper conduct at and involving Banco Popular prior to the Resolution;
(vii) filed written submissions challenging the SRB’s preliminary decision not to grant affected creditors of Banco
Popular (including the Bondholders) compensation pursuant to the “no creditor worse off” principle; and
(viii) filed an action for annulment against the SRB challenging its failure to commission definitive, ex-post versions
of the valuations it was required to conduct/commission prior to adopting the Resolution.
As at 31 December 2019, the Impacted Funds account for approximately 12.64% of the Bondholders’ holdings in the
affected AT1 and Tier 2 securities. As funds join or leave the Bondholder group, that figure will change. Associated
legal costs will be borne by the Impacted Funds in proportion to their holdings.
It is not yet possible to ascertain the likely outcome of the various claims and actions being pursued by the
Bondholders or the anticipated recovery. As a result, with respect to the AT1 bonds, no fair value has been recognised
in these financial statements. The claims for the Tier 2 positions are being actively traded and therefore such positions
have been valued at the average of available broker quotes.

ALGEBRIS UCITS FUNDS PLC
Notes to the Financial Statements (continued)
for the financial year ended 31 December 2019
214
20. Significant events during the financial year
The Algebris Asset Allocation Fund was renamed the Algebris Allocation Fund and the Supplement to the Prospectus
dated 5 December 2018 was revised and issued with an effective date of 21 February 2019. The revised investment
objective for the Algebris Allocation Fund is to achieve positive absolute returns, primarily from capital appreciation on
investments in collective investment schemes, over an investment cycle of approximately 3 to 5 years. To achieve the
investment objective, the assets will be invested primarily in a range of underlying collective investment schemes which
comply with the Central Bank’s requirements as regards investment by a UCITS in other Collective Investment
Schemes.
The Algebris Tail Risk Fund was renamed the Algebris Quant Arbitrage Fund and the Supplement to the Prospectus
dated 5 December 2018 was revised and issued with effective date 10 May 2019. The revised investment objective for
the Algebris Quant Arbitrage Fund is to generate positive returns from capital appreciation over a broad range of market
environments by investing in a portfolio of equity and equity-related securities on a global basis whilst keeping a net
market exposure close to zero. The Fund would seek to achieve its investment objective by taking long and short
exposure to equity and equity-related securities globally, either directly or indirectly through the use of financial
derivative instruments (“FDI”). For the avoidance of doubt, the Fund may only take synthetic short exposure to these
asset classes through the use of FDIs but may take long exposure through direct investment and/or through the use of
FDIs.
Under the Algebris Quant Arbitrage Fund, the management fee in respect of Class EB shares would be 0.5% per annum,
Class I shares would be 0.75% per annum and Class R shares would be 1.5% per annum. The performance fee in respect
of Class EB would be 10% and for Class I and R shares would be 15% of the excess of the Net Asset Value per share of
the relevant Class EB, Class I and Class R shares (after the deduction of the management fee and all other payments and
expenses but before the deduction of any accrued performance fee) at the end of a performance period over the High
Water Mark.
On 1 April 2019, the Depositary merged into HSBC France. Its business operates from a Dublin branch of HSBC
France.
Supplements to the Prospectus dated 5 December 2018 were issued for Algebris Core Italy Fund with an effective date of
28 February 2019.
Supplements to the Prospectus dated 5 December 2018 were issued for Algebris Financial Income Fund and Algebris
Financial Credit Fund with an effective date 12 June 2019 and for Algebris Macro Credit Fund with an effective date 9
August 2019.
Algebris IG Financial Credit Fund was launched as a Sub-Fund of Algebris UCITS Funds plc with effect from 5
November 2019, with the Supplement to Prospectus issued on 30 October 2019. The launch date for all the active share
classes was 5 November 2019.
21. Significant events subsequent to the financial year end
In March 2020, the COVID-19 outbreak was declared a pandemic by the World Health Organization. The outbreak
and the response of Governments in dealing with the pandemic has seen a corresponding significant increase in
financial market volatility and corresponding fluctuations in the fair value of the Company’s investment portfolio.
The Company continues to determine net asset values with the frequency as set out in the offering documents,
consistently applying valuation policies and reflective of prevailing market conditions. As the market conditions
remain extremely volatile, the Investment Manager does not consider it meaningful to quantify the impact of this
outbreak on the Company.
ALGEBRIS UCITS FUNDS PLC
Notes to the Financial Statements (continued)
for the financial year ended 31 December 2019
215
21. Significant events subsequent to the financial year end (continued)
The financial statements have been prepared based upon conditions existing at 31 December 2019 and considering
those events occurring subsequent to that date, that provide evidence of conditions that existed at the end of the
reporting year. As the outbreak of COVID-19 occurred after 31 December 2019, its impact is considered an event
that is indicative of conditions that arose after the reporting year and accordingly, no adjustments have been made to
the financial statements as at 31 December 2019 for the impacts of COVID-19.
The nature and extent of the impact of such events is difficult to predict but they may adversely affect the return on
each Fund and its investments. Market disruptions or closures may result in the Investment Manager being unable
to accurately value the assets of a Fund, or in the event of high levels of redemption, the Company may use certain
liquidity management tools permitted by the Central Bank, including deferred redemptions, the implementation of
fair value pricing or temporarily suspension of a Fund.
In March 2020, the Directors in consultation with the Investment Manager made the decision to terminate the
Algebris Quant Arbitrage Fund.
Other than the above, no significant events have occurred since the end of the reporting year which would have an
impact on the financial position of the Company as disclosed in the statement of assets and liabilities as at 31
December 2019 or on the results and cash flows of the Company for the year ended on that date.
22. Approval of financial statements
The financial statements were approved and authorised for issue by the Board of Directors on 22 April 2020.

ALGEBRIS UCITS FUNDS PLC
Algebris Financial Credit Fund
Schedule of Investments
as at 31 December 2019
216
Holdings Financial Assets at Fair Value Through Profit or Loss Fair Value % of Net
EUR Asset Value
Equity Securities
United States 15,922,486 0.31
24,186 First Tennessee Bank (144A) (Preferred) Perpetual 15,922,486 0.31
Total Equity Securities 15,922,486 0.31
Fixed Income Securities
Austria 35,191,284 0.68
32,800,000 Bawag Group 35,191,284 0.68
Denmark 43,152,878 0.84
45,165,000 Danske Bank Perpetual 43,152,878 0.84
Finland 31,185,337 0.61
31,500,000 Nordea Bank Abp Perpetual 31,185,337 0.61
France 523,626,239 10.16
60,000,000 BNP Paribas Perpetual (AX7277939) 57,929,004 1.12
15,900,000 BNP Paribas Perpetual (EG5801956) 15,808,815 0.31
11,500,000 BNP Paribas VAR Perpetual 11,846,682 0.23
139,100,000 Credit Agricole 7.875% Perpetual 141,742,553 2.75
68,630,000 Credit Agricole VAR Perpetual 74,448,125 1.44
62,544,000 Societe Generale 7.875% Perpetual 62,755,976 1.22
38,500,000 Societe Generale Perpetual 37,600,339 0.73
46,400,000 Societe Generale Perpetual (LUX) 45,729,575 0.89
4,363,000 Societe Generale Perpetual (TRACE) 3,901,581 0.08
68,355,000 Societe Generale VAR Perpetual 71,863,589 1.39
Germany 92,784,836 1.80
14,200,000 Aareal Bank 7.625% Perpetual 14,526,458 0.28
74,400,000 Deutsche Bank 01/12/2032 62,731,702 1.22
18,080,000 Deutsche Bank 24/05/2028 15,526,676 0.30
Italy 773,406,319 15.00
16,040,000 Banco Bpm Spa 10/01/2029 16,445,571 0.32
9,605,000 Credito Valtellinese 4.7% 04/08/2021 9,924,606 0.19
5,125,000 Credito Valtellinese VAR 12/04/2027 5,565,494 0.11
89,077,000 Intesa Sanpaolo (144A) 5.71% 15/01/2026 85,997,996 1.67
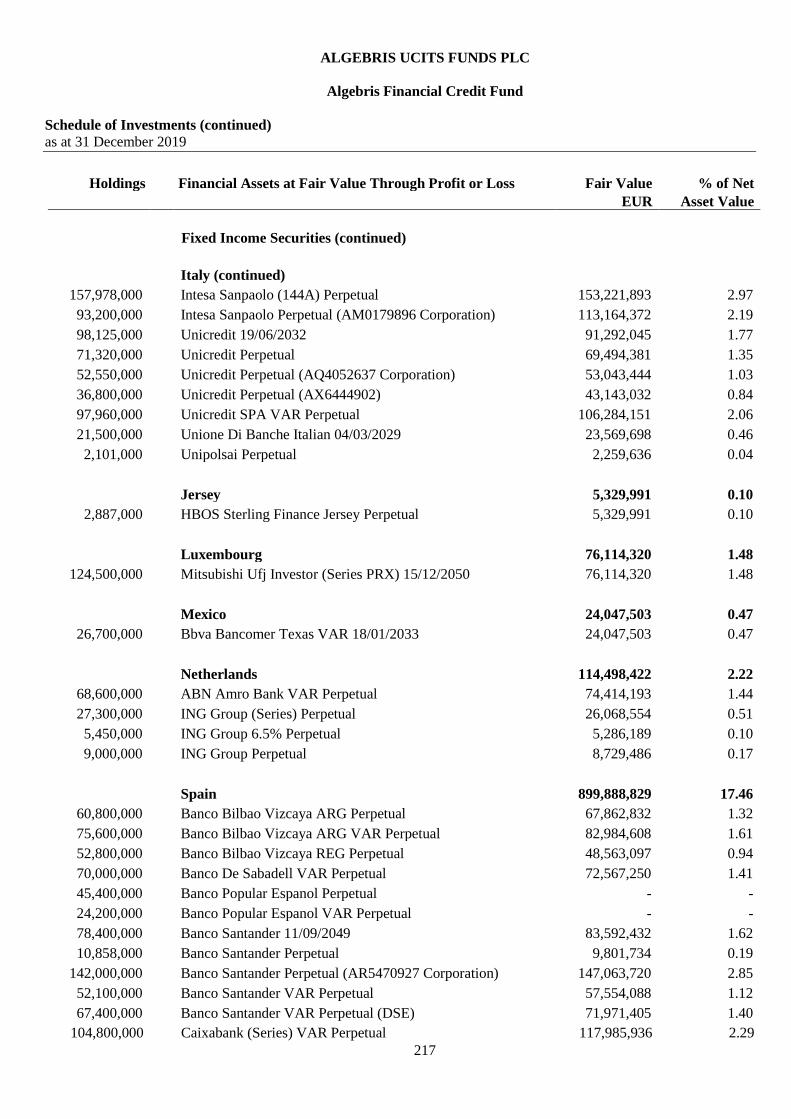
ALGEBRIS UCITS FUNDS PLC
Algebris Financial Credit Fund
Schedule of Investments (continued)
as at 31 December 2019
217
Holdings Financial Assets at Fair Value Through Profit or Loss Fair Value % of Net
EUR Asset Value
Fixed Income Securities (continued)
Italy (continued)
157,978,000 Intesa Sanpaolo (144A) Perpetual 153,221,893 2.97
93,200,000 Intesa Sanpaolo Perpetual (AM0179896 Corporation) 113,164,372 2.19
98,125,000 Unicredit 19/06/2032 91,292,045 1.77
71,320,000 Unicredit Perpetual 69,494,381 1.35
52,550,000 Unicredit Perpetual (AQ4052637 Corporation) 53,043,444 1.03
36,800,000 Unicredit Perpetual (AX6444902) 43,143,032 0.84
97,960,000 Unicredit SPA VAR Perpetual 106,284,151 2.06
21,500,000 Unione Di Banche Italian 04/03/2029 23,569,698 0.46
2,101,000 Unipolsai Perpetual 2,259,636 0.04
Jersey 5,329,991 0.10
2,887,000 HBOS Sterling Finance Jersey Perpetual 5,329,991 0.10
Luxembourg 76,114,320 1.48
124,500,000 Mitsubishi Ufj Investor (Series PRX) 15/12/2050 76,114,320 1.48
Mexico 24,047,503 0.47
26,700,000 Bbva Bancomer Texas VAR 18/01/2033 24,047,503 0.47
Netherlands 114,498,422 2.22
68,600,000 ABN Amro Bank VAR Perpetual 74,414,193 1.44
27,300,000 ING Group (Series) Perpetual 26,068,554 0.51
5,450,000 ING Group 6.5% Perpetual 5,286,189 0.10
9,000,000 ING Group Perpetual 8,729,486 0.17
Spain 899,888,829 17.46
60,800,000 Banco Bilbao Vizcaya ARG Perpetual 67,862,832 1.32
75,600,000 Banco Bilbao Vizcaya ARG VAR Perpetual 82,984,608 1.61
52,800,000 Banco Bilbao Vizcaya REG Perpetual 48,563,097 0.94
70,000,000 Banco De Sabadell VAR Perpetual 72,567,250 1.41
45,400,000 Banco Popular Espanol Perpetual - -
24,200,000 Banco Popular Espanol VAR Perpetual - -
78,400,000 Banco Santander 11/09/2049 83,592,432 1.62
10,858,000 Banco Santander Perpetual 9,801,734 0.19
142,000,000 Banco Santander Perpetual (AR5470927 Corporation) 147,063,720 2.85
52,100,000 Banco Santander VAR Perpetual 57,554,088 1.12
67,400,000 Banco Santander VAR Perpetual (DSE) 71,971,405 1.40
104,800,000 Caixabank (Series) VAR Perpetual 117,985,936 2.29

ALGEBRIS UCITS FUNDS PLC
Algebris Financial Credit Fund
Schedule of Investments (continued)
as at 31 December 2019
218
Holdings Financial Assets at Fair Value Through Profit or Loss Fair Value % of Net
EUR Asset Value
Fixed Income Securities (continued)
Spain (continued)
111,800,000 Caixabank Perpetual 114,479,287 2.22
24,000,000 Ibercaja Banco Perpetual 25,462,440 0.49
Switzerland 354,122,399 6.87
88,500,000 Credit Suisse Group 7.5% Perpetual 88,799,946 1.72
45,500,000 Credit Suisse Group Perpetual 44,233,857 0.86
27,600,000 Credit Suisse Group VAR Perpetual 27,016,589 0.53
50,600,000
Credit Suisse Group VAR Perpetual (AU3887497
Corporation) 50,500,714 0.98
15,800,000 UBS Group Perpetual 16,138,632 0.31
64,650,000 UBS Group Perpetual (JK4458820) 60,112,045 1.17
8,300,000 UBS Group Perpetual (QZ1261762) 7,856,203 0.15
60,200,000 UBS Group Perpetual (UV4180070) 59,464,413 1.15
United Kingdom 1,178,641,573 22.86
4,675,000 Bank of Scotland (Series B) Perpetual 6,850,500 0.13
10,000,000 Barclays 07/02/2028 10,172,700 0.20
28,900,000 Barclays 20/06/2030 28,784,137 0.56
36,100,000 Barclays Perpetual 35,175,928 0.68
42,300,000 Barclays Perpetual (AM6775317) 54,677,116 1.06
91,500,000 Barclays Perpetual (AO6220567) 113,159,883 2.20
11,900,000 Barclays Perpetual (AX7752402) 11,914,328 0.23
30,050,000 Barclays Perpetual (AZ0489668) 40,230,754 0.78
3,500,000 Barclays Perpetual (QZ3177313) 3,367,486 0.07
67,766,000 Barclays Perpetual (UV4299359) 89,141,581 1.73
19,900,000 Barclays Perpetual (ZR6733045) 25,465,628 0.49
22,000,000 HSBC Holdings Perpetual 21,363,272 0.41
48,932,000 HSBC Holdings Perpetual (AO1326237) 55,243,249 1.07
33,300,000 HSBC Holdings VAR Perpetual (AU6128063) 43,458,273 0.84
61,800,000 HSBC Holdings VAR Perpetual (DSE) 60,769,265 1.18
5,000,000 Lloyds Banking Group Perpetual 5,203,844 0.10
70,800,000 Lloyds Banking Group Perpetual (GBP) 94,145,614 1.83
11,000,000 Lloyds Banking Group Perpetual (ZQ5986752) 13,523,208 0.26
34,750,000 Lloyds Banking Group VAR Perpetual 51,983,713 1.01
18,600,000 Lloyds Banking Group(144A) VAR Perpetual 19,866,515 0.39
43,500,000 Lloyds Banking Group(144A) VAR Perpetual (LSE) 45,273,444 0.88
50,676,400 Nationwide Building Society Perpetual 99,979,460 1.94
22,200,000 Nationwide Building Society VAR Perpetual 28,474,573 0.55
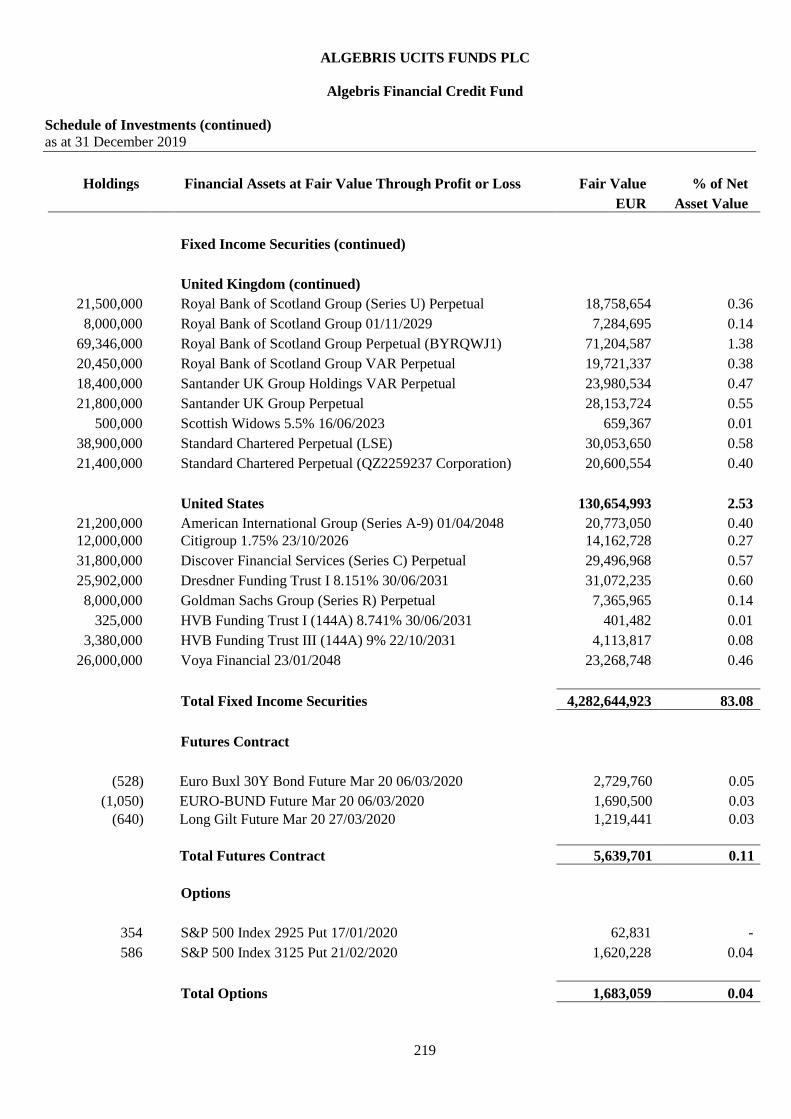
ALGEBRIS UCITS FUNDS PLC
Algebris Financial Credit Fund
Schedule of Investments (continued)
as at 31 December 2019
219
Holdings Financial Assets at Fair Value Through Profit or Loss Fair Value % of Net
EUR Asset Value
Fixed Income Securities (continued)
United Kingdom (continued)
21,500,000 Royal Bank of Scotland Group (Series U) Perpetual 18,758,654 0.36
8,000,000 Royal Bank of Scotland Group 01/11/2029 7,284,695 0.14
69,346,000 Royal Bank of Scotland Group Perpetual (BYRQWJ1) 71,204,587 1.38
20,450,000 Royal Bank of Scotland Group VAR Perpetual 19,721,337 0.38
18,400,000 Santander UK Group Holdings VAR Perpetual 23,980,534 0.47
21,800,000 Santander UK Group Perpetual 28,153,724 0.55
500,000 Scottish Widows 5.5% 16/06/2023 659,367 0.01
38,900,000 Standard Chartered Perpetual (LSE) 30,053,650 0.58
21,400,000 Standard Chartered Perpetual (QZ2259237 Corporation) 20,600,554 0.40
United States 130,654,993 2.53
21,200,000 American International Group (Series A-9) 01/04/2048 20,773,050 0.40
12,000,000 Citigroup 1.75% 23/10/2026 14,162,728 0.27
31,800,000 Discover Financial Services (Series C) Perpetual 29,496,968 0.57
25,902,000 Dresdner Funding Trust I 8.151% 30/06/2031 31,072,235 0.60
8,000,000 Goldman Sachs Group (Series R) Perpetual 7,365,965 0.14
325,000 HVB Funding Trust I (144A) 8.741% 30/06/2031 401,482 0.01
3,380,000 HVB Funding Trust III (144A) 9% 22/10/2031 4,113,817 0.08
26,000,000 Voya Financial 23/01/2048 23,268,748 0.46
Total Fixed Income Securities 4,282,644,923 83.08
Futures Contract
(528) Euro Buxl 30Y Bond Future Mar 20 06/03/2020 2,729,760 0.05
(1,050) EURO-BUND Future Mar 20 06/03/2020 1,690,500 0.03
(640) Long Gilt Future Mar 20 27/03/2020 1,219,441 0.03
Total Futures Contract 5,639,701 0.11
Options
354 S&P 500 Index 2925 Put 17/01/2020 62,831 -
586 S&P 500 Index 3125 Put 21/02/2020 1,620,228 0.04
Total Options 1,683,059 0.04
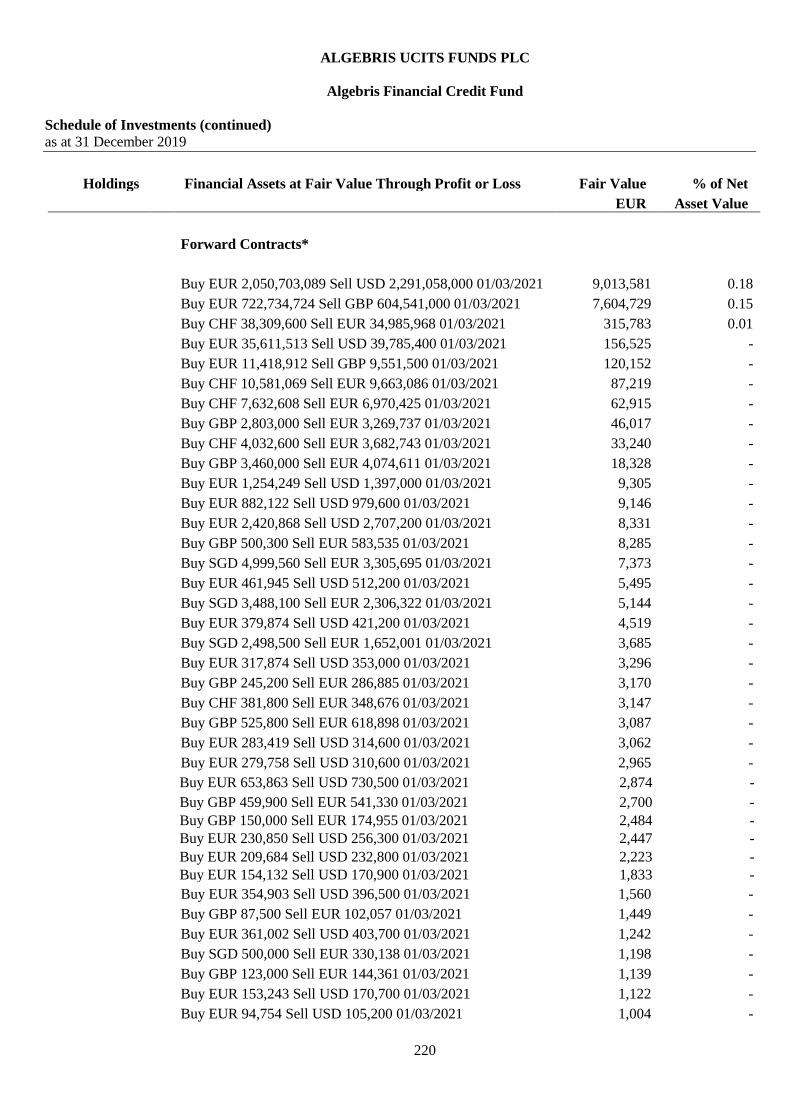
ALGEBRIS UCITS FUNDS PLC
Algebris Financial Credit Fund
Schedule of Investments (continued)
as at 31 December 2019
220
Holdings Financial Assets at Fair Value Through Profit or Loss Fair Value % of Net
EUR Asset Value
Forward Contracts*
Buy EUR 2,050,703,089 Sell USD 2,291,058,000 01/03/2021 9,013,581 0.18
Buy EUR 722,734,724 Sell GBP 604,541,000 01/03/2021 7,604,729 0.15
Buy CHF 38,309,600 Sell EUR 34,985,968 01/03/2021 315,783 0.01
Buy EUR 35,611,513 Sell USD 39,785,400 01/03/2021 156,525 -
Buy EUR 11,418,912 Sell GBP 9,551,500 01/03/2021 120,152 -
Buy CHF 10,581,069 Sell EUR 9,663,086 01/03/2021 87,219 -
Buy CHF 7,632,608 Sell EUR 6,970,425 01/03/2021 62,915 -
Buy GBP 2,803,000 Sell EUR 3,269,737 01/03/2021 46,017 -
Buy CHF 4,032,600 Sell EUR 3,682,743 01/03/2021 33,240 -
Buy GBP 3,460,000 Sell EUR 4,074,611 01/03/2021 18,328 -
Buy EUR 1,254,249 Sell USD 1,397,000 01/03/2021 9,305 -
Buy EUR 882,122 Sell USD 979,600 01/03/2021 9,146 -
Buy EUR 2,420,868 Sell USD 2,707,200 01/03/2021 8,331 -
Buy GBP 500,300 Sell EUR 583,535 01/03/2021 8,285 -
Buy SGD 4,999,560 Sell EUR 3,305,695 01/03/2021 7,373 -
Buy EUR 461,945 Sell USD 512,200 01/03/2021 5,495 -
Buy SGD 3,488,100 Sell EUR 2,306,322 01/03/2021 5,144 -
Buy EUR 379,874 Sell USD 421,200 01/03/2021 4,519 -
Buy SGD 2,498,500 Sell EUR 1,652,001 01/03/2021 3,685 -
Buy EUR 317,874 Sell USD 353,000 01/03/2021 3,296 -
Buy GBP 245,200 Sell EUR 286,885 01/03/2021 3,170 -
Buy CHF 381,800 Sell EUR 348,676 01/03/2021 3,147 -
Buy GBP 525,800 Sell EUR 618,898 01/03/2021 3,087 -
Buy EUR 283,419 Sell USD 314,600 01/03/2021 3,062 -
Buy EUR 279,758 Sell USD 310,600 01/03/2021 2,965 -
Buy EUR 653,863 Sell USD 730,500 01/03/2021 2,874 -
Buy GBP 459,900 Sell EUR 541,330 01/03/2021 2,700 -
Buy GBP 150,000 Sell EUR 174,955 01/03/2021 2,484 -
Buy EUR 230,850 Sell USD 256,300 01/03/2021 2,447 -
Buy EUR 209,684 Sell USD 232,800 01/03/2021 2,223 -
Buy EUR 154,132 Sell USD 170,900 01/03/2021 1,833 -
Buy EUR 354,903 Sell USD 396,500 01/03/2021 1,560 -
Buy GBP 87,500 Sell EUR 102,057 01/03/2021 1,449 -
Buy EUR 361,002 Sell USD 403,700 01/03/2021 1,242 -
Buy SGD 500,000 Sell EUR 330,138 01/03/2021 1,198 -
Buy GBP 123,000 Sell EUR 144,361 01/03/2021 1,139 -
Buy EUR 153,243 Sell USD 170,700 01/03/2021 1,122 -
Buy EUR 94,754 Sell USD 105,200 01/03/2021 1,004 -
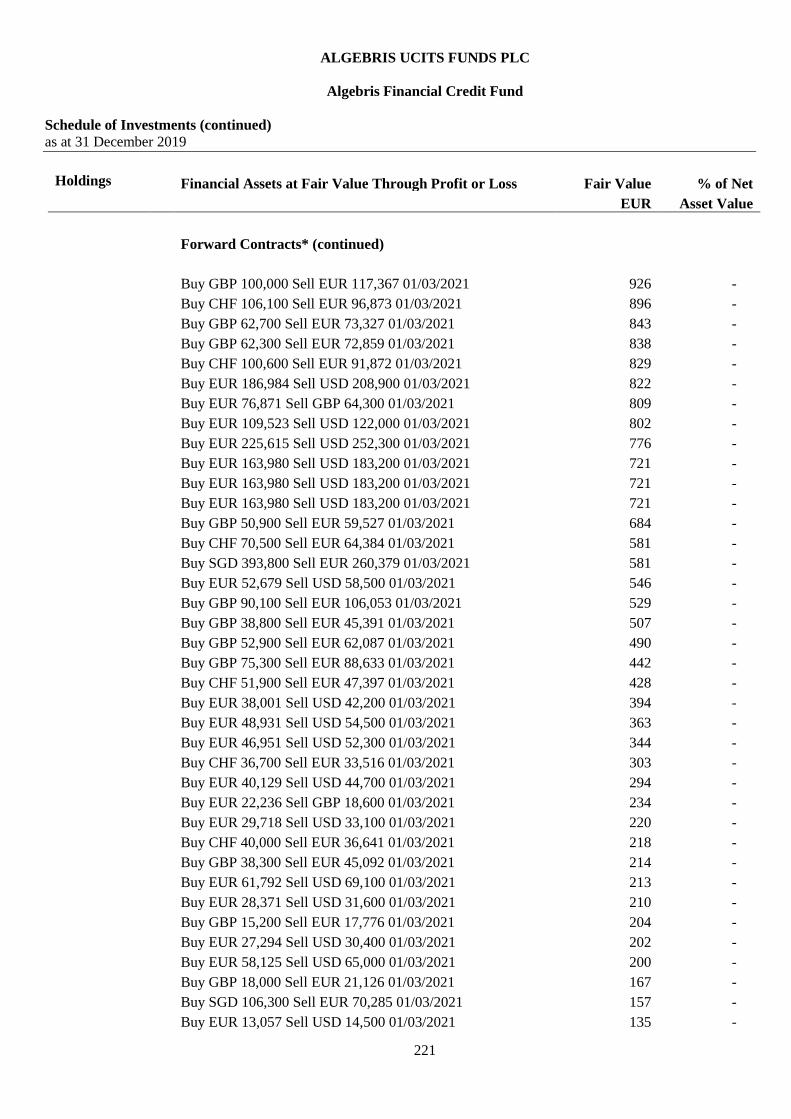
ALGEBRIS UCITS FUNDS PLC
Algebris Financial Credit Fund
Schedule of Investments (continued)
as at 31 December 2019
221
Holdings Financial Assets at Fair Value Through Profit or Loss Fair Value % of Net
EUR Asset Value
Forward Contracts* (continued)
Buy GBP 100,000 Sell EUR 117,367 01/03/2021 926 -
Buy CHF 106,100 Sell EUR 96,873 01/03/2021 896 -
Buy GBP 62,700 Sell EUR 73,327 01/03/2021 843 -
Buy GBP 62,300 Sell EUR 72,859 01/03/2021 838 -
Buy CHF 100,600 Sell EUR 91,872 01/03/2021 829 -
Buy EUR 186,984 Sell USD 208,900 01/03/2021 822 -
Buy EUR 76,871 Sell GBP 64,300 01/03/2021 809 -
Buy EUR 109,523 Sell USD 122,000 01/03/2021 802 -
Buy EUR 225,615 Sell USD 252,300 01/03/2021 776 -
Buy EUR 163,980 Sell USD 183,200 01/03/2021 721 -
Buy EUR 163,980 Sell USD 183,200 01/03/2021 721 -
Buy EUR 163,980 Sell USD 183,200 01/03/2021 721 -
Buy GBP 50,900 Sell EUR 59,527 01/03/2021 684 -
Buy CHF 70,500 Sell EUR 64,384 01/03/2021 581 -
Buy SGD 393,800 Sell EUR 260,379 01/03/2021 581 -
Buy EUR 52,679 Sell USD 58,500 01/03/2021 546 -
Buy GBP 90,100 Sell EUR 106,053 01/03/2021 529 -
Buy GBP 38,800 Sell EUR 45,391 01/03/2021 507 -
Buy GBP 52,900 Sell EUR 62,087 01/03/2021 490 -
Buy GBP 75,300 Sell EUR 88,633 01/03/2021 442 -
Buy CHF 51,900 Sell EUR 47,397 01/03/2021 428 -
Buy EUR 38,001 Sell USD 42,200 01/03/2021 394 -
Buy EUR 48,931 Sell USD 54,500 01/03/2021 363 -
Buy EUR 46,951 Sell USD 52,300 01/03/2021 344 -
Buy CHF 36,700 Sell EUR 33,516 01/03/2021 303 -
Buy EUR 40,129 Sell USD 44,700 01/03/2021 294 -
Buy EUR 22,236 Sell GBP 18,600 01/03/2021 234 -
Buy EUR 29,718 Sell USD 33,100 01/03/2021 220 -
Buy CHF 40,000 Sell EUR 36,641 01/03/2021 218 -
Buy GBP 38,300 Sell EUR 45,092 01/03/2021 214 -
Buy EUR 61,792 Sell USD 69,100 01/03/2021 213 -
Buy EUR 28,371 Sell USD 31,600 01/03/2021 210 -
Buy GBP 15,200 Sell EUR 17,776 01/03/2021 204 -
Buy EUR 27,294 Sell USD 30,400 01/03/2021 202 -
Buy EUR 58,125 Sell USD 65,000 01/03/2021 200 -
Buy GBP 18,000 Sell EUR 21,126 01/03/2021 167 -
Buy SGD 106,300 Sell EUR 70,285 01/03/2021 157 -
Buy EUR 13,057 Sell USD 14,500 01/03/2021 135 -
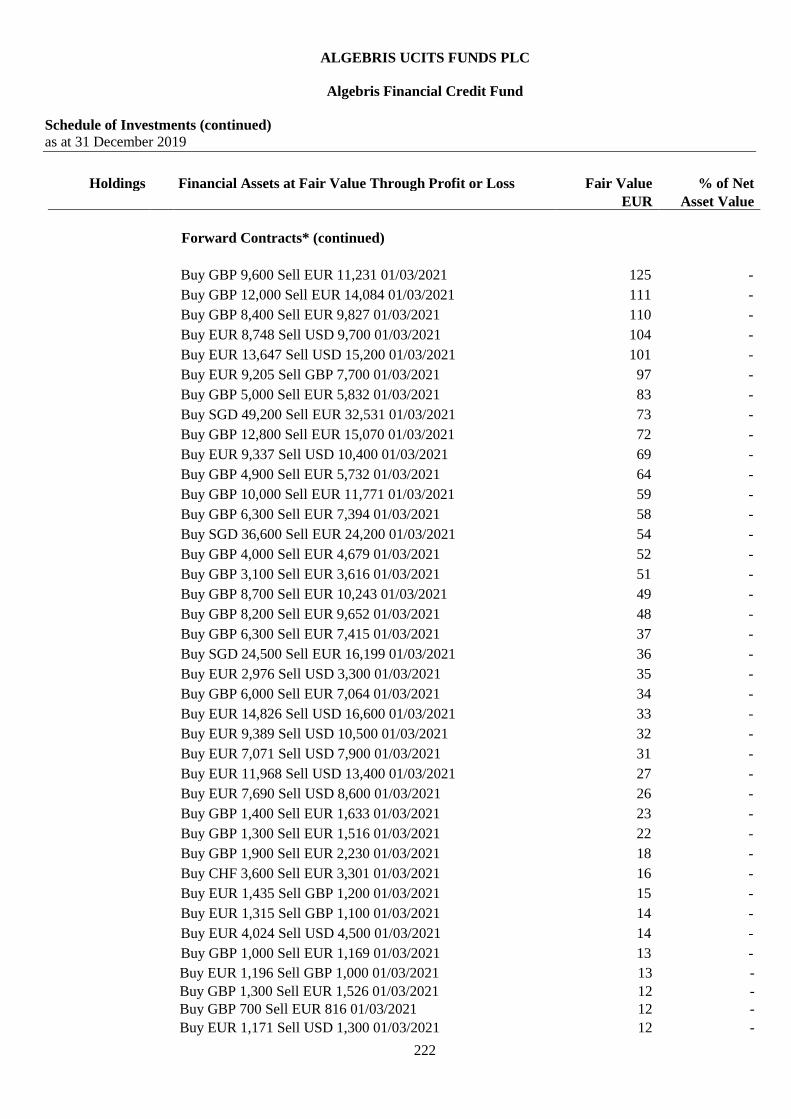
ALGEBRIS UCITS FUNDS PLC
Algebris Financial Credit Fund
Schedule of Investments (continued)
as at 31 December 2019
222
Holdings Financial Assets at Fair Value Through Profit or Loss Fair Value % of Net
EUR Asset Value
Forward Contracts* (continued)
Buy GBP 9,600 Sell EUR 11,231 01/03/2021 125 -
Buy GBP 12,000 Sell EUR 14,084 01/03/2021 111 -
Buy GBP 8,400 Sell EUR 9,827 01/03/2021 110 -
Buy EUR 8,748 Sell USD 9,700 01/03/2021 104 -
Buy EUR 13,647 Sell USD 15,200 01/03/2021 101 -
Buy EUR 9,205 Sell GBP 7,700 01/03/2021 97 -
Buy GBP 5,000 Sell EUR 5,832 01/03/2021 83 -
Buy SGD 49,200 Sell EUR 32,531 01/03/2021 73 -
Buy GBP 12,800 Sell EUR 15,070 01/03/2021 72 -
Buy EUR 9,337 Sell USD 10,400 01/03/2021 69 -
Buy GBP 4,900 Sell EUR 5,732 01/03/2021 64 -
Buy GBP 10,000 Sell EUR 11,771 01/03/2021 59 -
Buy GBP 6,300 Sell EUR 7,394 01/03/2021 58 -
Buy SGD 36,600 Sell EUR 24,200 01/03/2021 54 -
Buy GBP 4,000 Sell EUR 4,679 01/03/2021 52 -
Buy GBP 3,100 Sell EUR 3,616 01/03/2021 51 -
Buy GBP 8,700 Sell EUR 10,243 01/03/2021 49 -
Buy GBP 8,200 Sell EUR 9,652 01/03/2021 48 -
Buy GBP 6,300 Sell EUR 7,415 01/03/2021 37 -
Buy SGD 24,500 Sell EUR 16,199 01/03/2021 36 -
Buy EUR 2,976 Sell USD 3,300 01/03/2021 35 -
Buy GBP 6,000 Sell EUR 7,064 01/03/2021 34 -
Buy EUR 14,826 Sell USD 16,600 01/03/2021 33 -
Buy EUR 9,389 Sell USD 10,500 01/03/2021 32 -
Buy EUR 7,071 Sell USD 7,900 01/03/2021 31 -
Buy EUR 11,968 Sell USD 13,400 01/03/2021 27 -
Buy EUR 7,690 Sell USD 8,600 01/03/2021 26 -
Buy GBP 1,400 Sell EUR 1,633 01/03/2021 23 -
Buy GBP 1,300 Sell EUR 1,516 01/03/2021 22 -
Buy GBP 1,900 Sell EUR 2,230 01/03/2021 18 -
Buy CHF 3,600 Sell EUR 3,301 01/03/2021 16 -
Buy EUR 1,435 Sell GBP 1,200 01/03/2021 15 -
Buy EUR 1,315 Sell GBP 1,100 01/03/2021 14 -
Buy EUR 4,024 Sell USD 4,500 01/03/2021 14 -
Buy GBP 1,000 Sell EUR 1,169 01/03/2021 13 -
Buy EUR 1,196 Sell GBP 1,000 01/03/2021 13 -
Buy GBP 1,300 Sell EUR 1,526 01/03/2021 12 -
Buy GBP 700 Sell EUR 816 01/03/2021 12 -
Buy EUR 1,171 Sell USD 1,300 01/03/2021 12 -
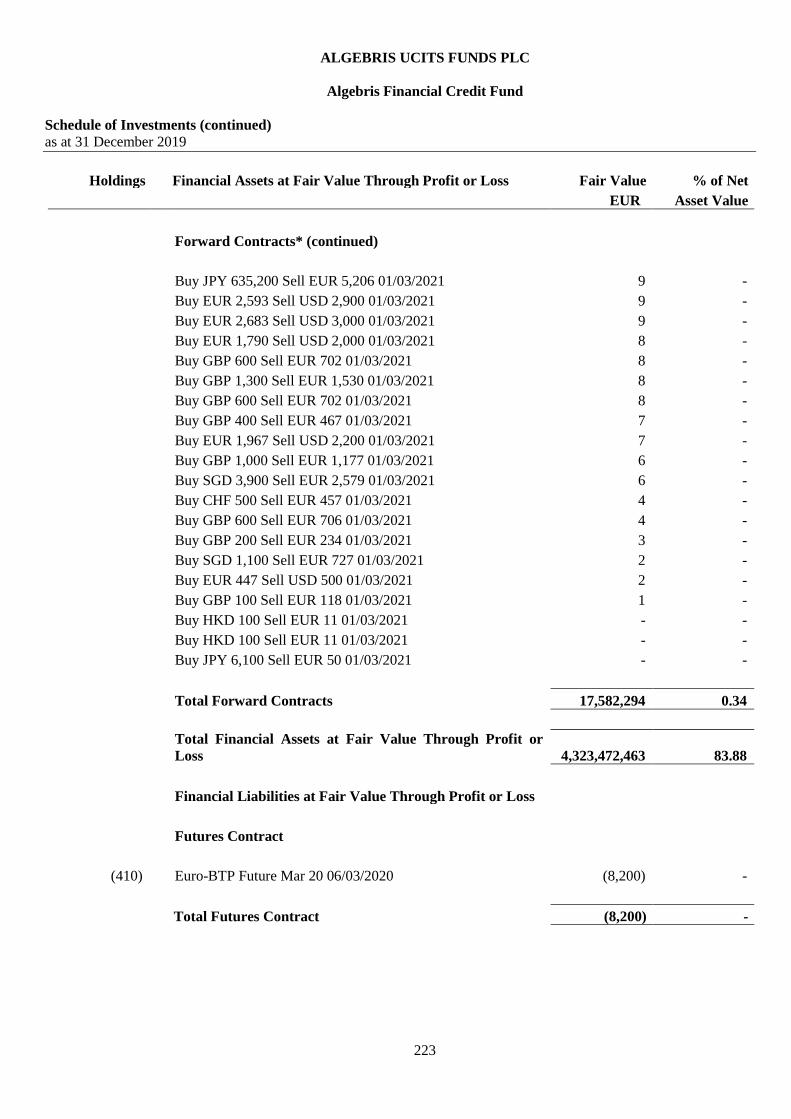
ALGEBRIS UCITS FUNDS PLC
Algebris Financial Credit Fund
Schedule of Investments (continued)
as at 31 December 2019
223
Holdings Financial Assets at Fair Value Through Profit or Loss Fair Value % of Net
EUR Asset Value
Forward Contracts* (continued)
Buy JPY 635,200 Sell EUR 5,206 01/03/2021 9 -
Buy EUR 2,593 Sell USD 2,900 01/03/2021 9 -
Buy EUR 2,683 Sell USD 3,000 01/03/2021 9 -
Buy EUR 1,790 Sell USD 2,000 01/03/2021 8 -
Buy GBP 600 Sell EUR 702 01/03/2021 8 -
Buy GBP 1,300 Sell EUR 1,530 01/03/2021 8 -
Buy GBP 600 Sell EUR 702 01/03/2021 8 -
Buy GBP 400 Sell EUR 467 01/03/2021 7 -
Buy EUR 1,967 Sell USD 2,200 01/03/2021 7 -
Buy GBP 1,000 Sell EUR 1,177 01/03/2021 6 -
Buy SGD 3,900 Sell EUR 2,579 01/03/2021 6 -
Buy CHF 500 Sell EUR 457 01/03/2021 4 -
Buy GBP 600 Sell EUR 706 01/03/2021 4 -
Buy GBP 200 Sell EUR 234 01/03/2021 3 -
Buy SGD 1,100 Sell EUR 727 01/03/2021 2 -
Buy EUR 447 Sell USD 500 01/03/2021 2 -
Buy GBP 100 Sell EUR 118 01/03/2021 1 -
Buy HKD 100 Sell EUR 11 01/03/2021 - -
Buy HKD 100 Sell EUR 11 01/03/2021 - -
Buy JPY 6,100 Sell EUR 50 01/03/2021 - -
Total Forward Contracts 17,582,294 0.34
Total Financial Assets at Fair Value Through Profit or
Loss 4,323,472,463 83.88
Financial Liabilities at Fair Value Through Profit or Loss
Futures Contract
(410) Euro-BTP Future Mar 20 06/03/2020 (8,200) -
Total Futures Contract (8,200) -

ALGEBRIS UCITS FUNDS PLC
Algebris Financial Credit Fund
Schedule of Investments (continued)
as at 31 December 2019
224
Holdings Financial Liabilities at Fair Value Through Profit or Loss Fair Value % of Net
EUR Asset Value
Forward Contracts*
Buy GBP 311,648,346 Sell EUR 372,578,669 01/03/2021 (3,920,332) (0.08)
Buy USD 273,191,955 Sell EUR 244,531,385 01/03/2021 (1,074,804) (0.02)
Buy USD 202,821,089 Sell EUR 181,543,127 01/03/2021 (797,948) (0.02)
Buy USD 101,830,744 Sell EUR 91,147,680 01/03/2021 (400,627) (0.02)
Buy USD 90,282,200 Sell EUR 80,810,694 01/03/2021 (355,192) (0.02)
Buy USD 81,663,352 Sell EUR 73,096,049 01/03/2021 (321,284) (0.01)
Buy GBP 17,635,120 Sell EUR 21,082,960 01/03/2021 (221,838) -
Buy GBP 16,398,175 Sell EUR 19,604,180 01/03/2021 (206,278) -
Buy USD 45,137,864 Sell EUR 40,402,450 01/03/2021 (177,583) -
Buy USD 44,062,977 Sell EUR 39,440,330 01/03/2021 (173,354) -
Buy GBP 11,378,600 Sell EUR 13,603,228 01/03/2021 (143,135) -
Buy GBP 9,205,982 Sell EUR 11,005,842 01/03/2021 (115,805) -
Buy EUR 22,166,591 Sell GBP 18,823,000 01/03/2021 (99,710) -
Buy USD 23,363,144 Sell EUR 20,912,116 01/03/2021 (91,916) -
Buy GBP 6,362,000 Sell EUR 7,605,834 01/03/2021 (80,030) -
Buy USD 5,959,000 Sell EUR 5,366,032 01/03/2021 (55,635) -
Buy GBP 3,007,800 Sell EUR 3,595,855 01/03/2021 (37,836) -
Buy USD 9,408,200 Sell EUR 8,421,186 01/03/2021 (37,014) -
Buy GBP 2,834,000 Sell EUR 3,388,075 01/03/2021 (35,650) -
Buy USD 3,265,000 Sell EUR 2,944,652 01/03/2021 (35,029) -
Buy GBP 1,541,000 Sell EUR 1,842,281 01/03/2021 (19,385) -
Buy USD 2,646,600 Sell EUR 2,368,945 01/03/2021 (10,412) -
Buy USD 1,339,900 Sell EUR 1,202,578 01/03/2021 (8,518) -
Buy USD 1,702,800 Sell EUR 1,524,159 01/03/2021 (6,699) -
Buy USD 1,000,000 Sell EUR 897,513 01/03/2021 (6,357) -
Buy USD 799,000 Sell EUR 717,113 01/03/2021 (5,080) -
Buy EUR 365,483 Sell GBP 313,000 01/03/2021 (4,774) -
Buy GBP 333,300 Sell EUR 398,463 01/03/2021 (4,193) -
Buy USD 1,026,400 Sell EUR 918,720 01/03/2021 (4,038) -
Buy USD 1,060,000 Sell EUR 948,621 01/03/2021 (3,996) -
Buy USD 400,000 Sell EUR 360,355 01/03/2021 (3,893) -
Buy USD 963,700 Sell EUR 862,598 01/03/2021 (3,791) -
Buy USD 314,600 Sell EUR 283,419 01/03/2021 (3,062) -
Buy USD 683,100 Sell EUR 611,436 01/03/2021 (2,687) -
Buy USD 622,200 Sell EUR 556,925 01/03/2021 (2,448) -
Buy EUR 366,642 Sell GBP 312,000 01/03/2021 (2,433) -
Buy GBP 182,700 Sell EUR 218,420 01/03/2021 (2,298) -
Buy EUR 344,075 Sell GBP 292,800 01/03/2021 (2,287) -

ALGEBRIS UCITS FUNDS PLC
Algebris Financial Credit Fund
Schedule of Investments (continued)
as at 31 December 2019
225
Holdings Financial Liabilities at Fair Value Through Profit or Loss Fair Value % of Net
EUR Asset Value
Forward Contracts* (continued)
Buy EUR 150,480 Sell GBP 129,000 01/03/2021 (2,118) -
Buy GBP 158,500 Sell EUR 189,488 01/03/2021 (1,994) -
Buy USD 200,000 Sell EUR 180,168 01/03/2021 (1,937) -
Buy USD 199,000 Sell EUR 179,268 01/03/2021 (1,928) -
Buy USD 300,000 Sell EUR 269,254 01/03/2021 (1,907) -
Buy USD 478,000 Sell EUR 427,853 01/03/2021 (1,881) -
Buy USD 280,600 Sell EUR 251,932 01/03/2021 (1,874) -
Buy GBP 99,500 Sell EUR 119,572 01/03/2021 (1,871) -
Buy USD 464,400 Sell EUR 415,680 01/03/2021 (1,827) -
Buy USD 357,000 Sell EUR 319,788 01/03/2021 (1,645) -
Buy GBP 119,165 Sell EUR 142,463 01/03/2021 (1,499) -
Buy USD 150,000 Sell EUR 135,133 01/03/2021 (1,460) -
Buy USD 219,700 Sell EUR 197,184 01/03/2021 (1,397) -
Buy USD 200,000 Sell EUR 179,567 01/03/2021 (1,335) -
Buy GBP 103,800 Sell EUR 124,094 01/03/2021 (1,306) -
Buy USD 125,000 Sell EUR 112,611 01/03/2021 (1,216) -
Buy USD 250,000 Sell EUR 223,941 01/03/2021 (1,152) -
Buy USD 248,800 Sell EUR 222,866 01/03/2021 (1,147) -
Buy GBP 88,500 Sell EUR 105,803 01/03/2021 (1,113) -
Buy USD 252,100 Sell EUR 225,652 01/03/2021 (992) -
Buy USD 100,000 Sell EUR 90,089 01/03/2021 (973) -
Buy USD 207,000 Sell EUR 185,423 01/03/2021 (954) -
Buy USD 150,000 Sell EUR 134,627 01/03/2021 (954) -
Buy USD 200,000 Sell EUR 179,153 01/03/2021 (922) -
Buy USD 198,500 Sell EUR 177,809 01/03/2021 (915) -
Buy USD 189,000 Sell EUR 169,299 01/03/2021 (871) -
Buy EUR 493,203 Sell USD 554,400 01/03/2021 (853) -
Buy USD 85,000 Sell EUR 76,575 01/03/2021 (827) -
Buy USD 81,200 Sell EUR 73,152 01/03/2021 (790) -
Buy GBP 61,300 Sell EUR 73,285 01/03/2021 (771) -
Buy EUR 53,310 Sell GBP 45,700 01/03/2021 (750) -
Buy EUR 102,416 Sell GBP 87,200 01/03/2021 (736) -
Buy USD 67,400 Sell EUR 60,720 01/03/2021 (656) -
Buy USD 100,000 Sell EUR 89,751 01/03/2021 (636) -
Buy USD 100,000 Sell EUR 89,751 01/03/2021 (636) -
Buy USD 150,300 Sell EUR 134,566 01/03/2021 (626) -
Buy USD 63,100 Sell EUR 56,846 01/03/2021 (614) -
Buy EUR 74,973 Sell GBP 63,800 01/03/2021 (497) -
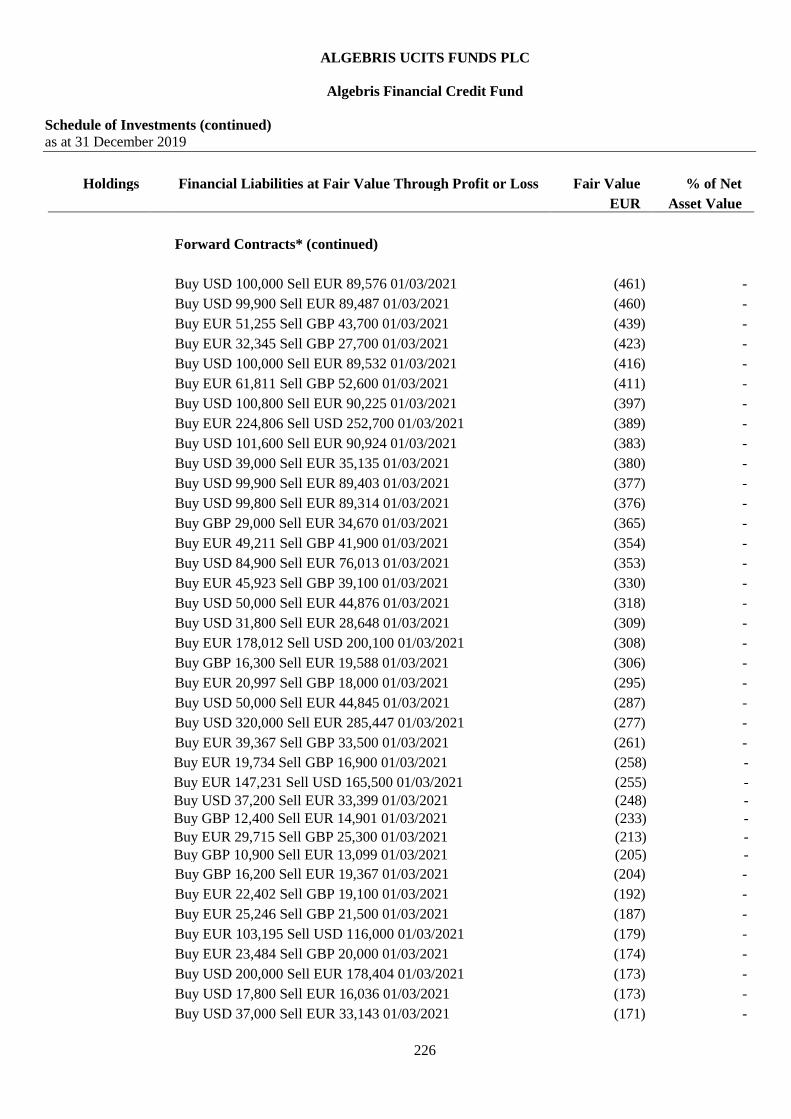
ALGEBRIS UCITS FUNDS PLC
Algebris Financial Credit Fund
Schedule of Investments (continued)
as at 31 December 2019
226
Holdings Financial Liabilities at Fair Value Through Profit or Loss Fair Value % of Net
EUR Asset Value
Forward Contracts* (continued)
Buy USD 100,000 Sell EUR 89,576 01/03/2021 (461) -
Buy USD 99,900 Sell EUR 89,487 01/03/2021 (460) -
Buy EUR 51,255 Sell GBP 43,700 01/03/2021 (439) -
Buy EUR 32,345 Sell GBP 27,700 01/03/2021 (423) -
Buy USD 100,000 Sell EUR 89,532 01/03/2021 (416) -
Buy EUR 61,811 Sell GBP 52,600 01/03/2021 (411) -
Buy USD 100,800 Sell EUR 90,225 01/03/2021 (397) -
Buy EUR 224,806 Sell USD 252,700 01/03/2021 (389) -
Buy USD 101,600 Sell EUR 90,924 01/03/2021 (383) -
Buy USD 39,000 Sell EUR 35,135 01/03/2021 (380) -
Buy USD 99,900 Sell EUR 89,403 01/03/2021 (377) -
Buy USD 99,800 Sell EUR 89,314 01/03/2021 (376) -
Buy GBP 29,000 Sell EUR 34,670 01/03/2021 (365) -
Buy EUR 49,211 Sell GBP 41,900 01/03/2021 (354) -
Buy USD 84,900 Sell EUR 76,013 01/03/2021 (353) -
Buy EUR 45,923 Sell GBP 39,100 01/03/2021 (330) -
Buy USD 50,000 Sell EUR 44,876 01/03/2021 (318) -
Buy USD 31,800 Sell EUR 28,648 01/03/2021 (309) -
Buy EUR 178,012 Sell USD 200,100 01/03/2021 (308) -
Buy GBP 16,300 Sell EUR 19,588 01/03/2021 (306) -
Buy EUR 20,997 Sell GBP 18,000 01/03/2021 (295) -
Buy USD 50,000 Sell EUR 44,845 01/03/2021 (287) -
Buy USD 320,000 Sell EUR 285,447 01/03/2021 (277) -
Buy EUR 39,367 Sell GBP 33,500 01/03/2021 (261) -
Buy EUR 19,734 Sell GBP 16,900 01/03/2021 (258) -
Buy EUR 147,231 Sell USD 165,500 01/03/2021 (255) -
Buy USD 37,200 Sell EUR 33,399 01/03/2021 (248) -
Buy GBP 12,400 Sell EUR 14,901 01/03/2021 (233) -
Buy EUR 29,715 Sell GBP 25,300 01/03/2021 (213) -
Buy GBP 10,900 Sell EUR 13,099 01/03/2021 (205) -
Buy GBP 16,200 Sell EUR 19,367 01/03/2021 (204) -
Buy EUR 22,402 Sell GBP 19,100 01/03/2021 (192) -
Buy EUR 25,246 Sell GBP 21,500 01/03/2021 (187) -
Buy EUR 103,195 Sell USD 116,000 01/03/2021 (179) -
Buy EUR 23,484 Sell GBP 20,000 01/03/2021 (174) -
Buy USD 200,000 Sell EUR 178,404 01/03/2021 (173) -
Buy USD 17,800 Sell EUR 16,036 01/03/2021 (173) -
Buy USD 37,000 Sell EUR 33,143 01/03/2021 (171) -
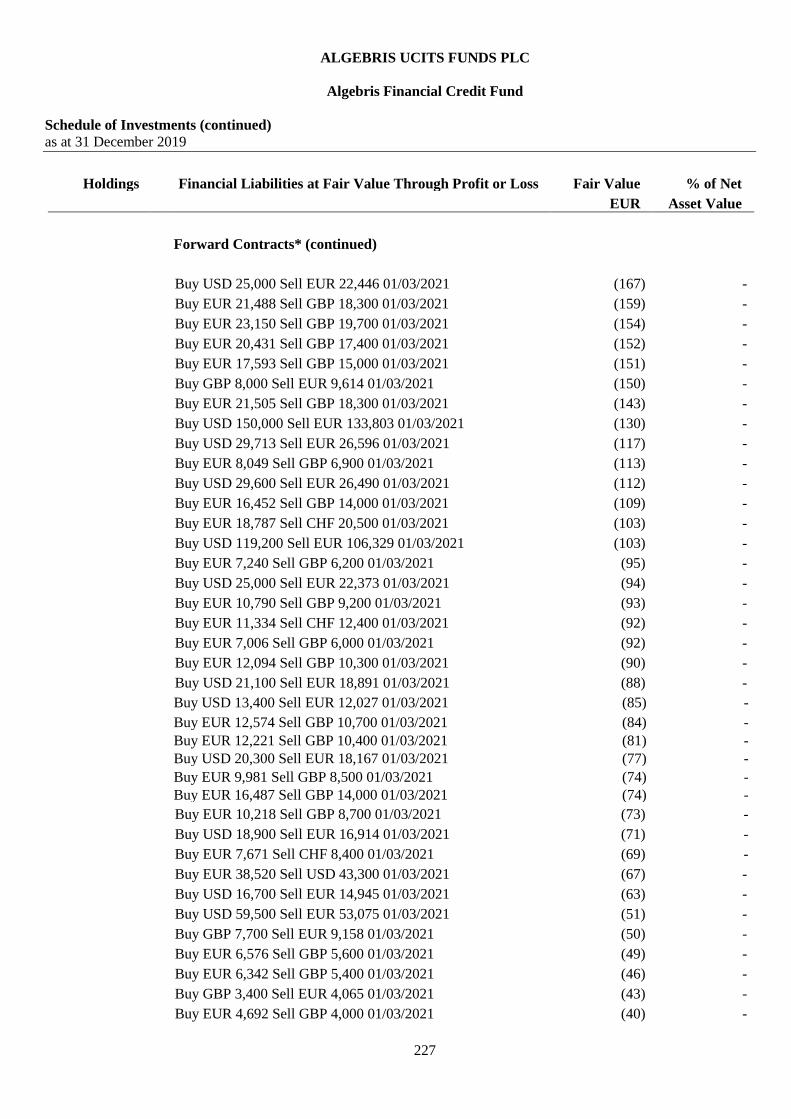
ALGEBRIS UCITS FUNDS PLC
Algebris Financial Credit Fund
Schedule of Investments (continued)
as at 31 December 2019
227
Holdings Financial Liabilities at Fair Value Through Profit or Loss Fair Value % of Net
EUR Asset Value
Forward Contracts* (continued)
Buy USD 25,000 Sell EUR 22,446 01/03/2021 (167) -
Buy EUR 21,488 Sell GBP 18,300 01/03/2021 (159) -
Buy EUR 23,150 Sell GBP 19,700 01/03/2021 (154) -
Buy EUR 20,431 Sell GBP 17,400 01/03/2021 (152) -
Buy EUR 17,593 Sell GBP 15,000 01/03/2021 (151) -
Buy GBP 8,000 Sell EUR 9,614 01/03/2021 (150) -
Buy EUR 21,505 Sell GBP 18,300 01/03/2021 (143) -
Buy USD 150,000 Sell EUR 133,803 01/03/2021 (130) -
Buy USD 29,713 Sell EUR 26,596 01/03/2021 (117) -
Buy EUR 8,049 Sell GBP 6,900 01/03/2021 (113) -
Buy USD 29,600 Sell EUR 26,490 01/03/2021 (112) -
Buy EUR 16,452 Sell GBP 14,000 01/03/2021 (109) -
Buy EUR 18,787 Sell CHF 20,500 01/03/2021 (103) -
Buy USD 119,200 Sell EUR 106,329 01/03/2021 (103) -
Buy EUR 7,240 Sell GBP 6,200 01/03/2021 (95) -
Buy USD 25,000 Sell EUR 22,373 01/03/2021 (94) -
Buy EUR 10,790 Sell GBP 9,200 01/03/2021 (93) -
Buy EUR 11,334 Sell CHF 12,400 01/03/2021 (92) -
Buy EUR 7,006 Sell GBP 6,000 01/03/2021 (92) -
Buy EUR 12,094 Sell GBP 10,300 01/03/2021 (90) -
Buy USD 21,100 Sell EUR 18,891 01/03/2021 (88) -
Buy USD 13,400 Sell EUR 12,027 01/03/2021 (85) -
Buy EUR 12,574 Sell GBP 10,700 01/03/2021 (84) -
Buy EUR 12,221 Sell GBP 10,400 01/03/2021 (81) -
Buy USD 20,300 Sell EUR 18,167 01/03/2021 (77) -
Buy EUR 9,981 Sell GBP 8,500 01/03/2021 (74) -
Buy EUR 16,487 Sell GBP 14,000 01/03/2021 (74) -
Buy EUR 10,218 Sell GBP 8,700 01/03/2021 (73) -
Buy USD 18,900 Sell EUR 16,914 01/03/2021 (71) -
Buy EUR 7,671 Sell CHF 8,400 01/03/2021 (69) -
Buy EUR 38,520 Sell USD 43,300 01/03/2021 (67) -
Buy USD 16,700 Sell EUR 14,945 01/03/2021 (63) -
Buy USD 59,500 Sell EUR 53,075 01/03/2021 (51) -
Buy GBP 7,700 Sell EUR 9,158 01/03/2021 (50) -
Buy EUR 6,576 Sell GBP 5,600 01/03/2021 (49) -
Buy EUR 6,342 Sell GBP 5,400 01/03/2021 (46) -
Buy GBP 3,400 Sell EUR 4,065 01/03/2021 (43) -
Buy EUR 4,692 Sell GBP 4,000 01/03/2021 (40) -

ALGEBRIS UCITS FUNDS PLC
Algebris Financial Credit Fund
Schedule of Investments (continued)
as at 31 December 2019
228
Holdings Financial Liabilities at Fair Value Through Profit or Loss Fair Value % of Net
EUR Asset Value
Forward Contracts* (continued)
Buy EUR 21,155 Sell CHF 23,000 01/03/2021 (39) -
Buy GBP 6,000 Sell EUR 7,136 01/03/2021 (39) -
Buy EUR 5,403 Sell GBP 4,600 01/03/2021 (39) -
Buy EUR 4,388 Sell CHF 4,800 01/03/2021 (36) -
Buy EUR 5,171 Sell GBP 4,400 01/03/2021 (34) -
Buy EUR 17,792 Sell USD 20,000 01/03/2021 (31) -
Buy GBP 1,500 Sell EUR 1,803 01/03/2021 (28) -
Buy GBP 4,100 Sell EUR 4,877 01/03/2021 (27) -
Buy USD 6,800 Sell EUR 6,087 01/03/2021 (27) -
Buy GBP 3,900 Sell EUR 4,639 01/03/2021 (25) -
Buy EUR 5,064 Sell GBP 4,300 01/03/2021 (23) -
Buy USD 5,500 Sell EUR 4,924 01/03/2021 (23) -
Buy EUR 9,563 Sell CHF 10,400 01/03/2021 (20) -
Buy EUR 4,122 Sell GBP 3,500 01/03/2021 (19) -
Buy SGD 50,000 Sell EUR 33,150 01/03/2021 (17) -
Buy GBP 1,300 Sell EUR 1,554 01/03/2021 (16) -
Buy USD 18,300 Sell EUR 16,324 01/03/2021 (16) -
Buy USD 10,600 Sell EUR 9,455 01/03/2021 (9) -
Buy USD 900 Sell EUR 811 01/03/2021 (9) -
Buy EUR 1,057 Sell GBP 900 01/03/2021 (8) -
Buy EUR 1,884 Sell GBP 1,600 01/03/2021 (8) -
Buy CHF 11,900 Sell EUR 10,973 01/03/2021 (7) -
Buy EUR 3,310 Sell CHF 3,600 01/03/2021 (7) -
Buy GBP 1,000 Sell EUR 1,189 01/03/2021 (6) -
Buy EUR 1,178 Sell GBP 1,000 01/03/2021 (5) -
Buy EUR 942 Sell GBP 800 01/03/2021 (4) -
Buy HKD 9,500 Sell EUR 1,091 01/03/2021 (4) -
Buy HKD 9,500 Sell EUR 1,091 01/03/2021 (4) -
Buy USD 1,000 Sell EUR 895 01/03/2021 (4) -
Buy USD 1,000 Sell EUR 895 01/03/2021 (4) -
Buy GBP 500 Sell EUR 595 01/03/2021 (3) -
Buy EUR 470 Sell GBP 400 01/03/2021 (3) -
Buy EUR 353 Sell GBP 300 01/03/2021 (2) -
Buy GBP 100 Sell EUR 119 01/03/2021 (1) -
Buy GBP 100 Sell EUR 119 01/03/2021 (1) -
Buy USD 300 Sell EUR 269 01/03/2021 (1) -
Total Forward Contracts (8,538,624) (0.17)
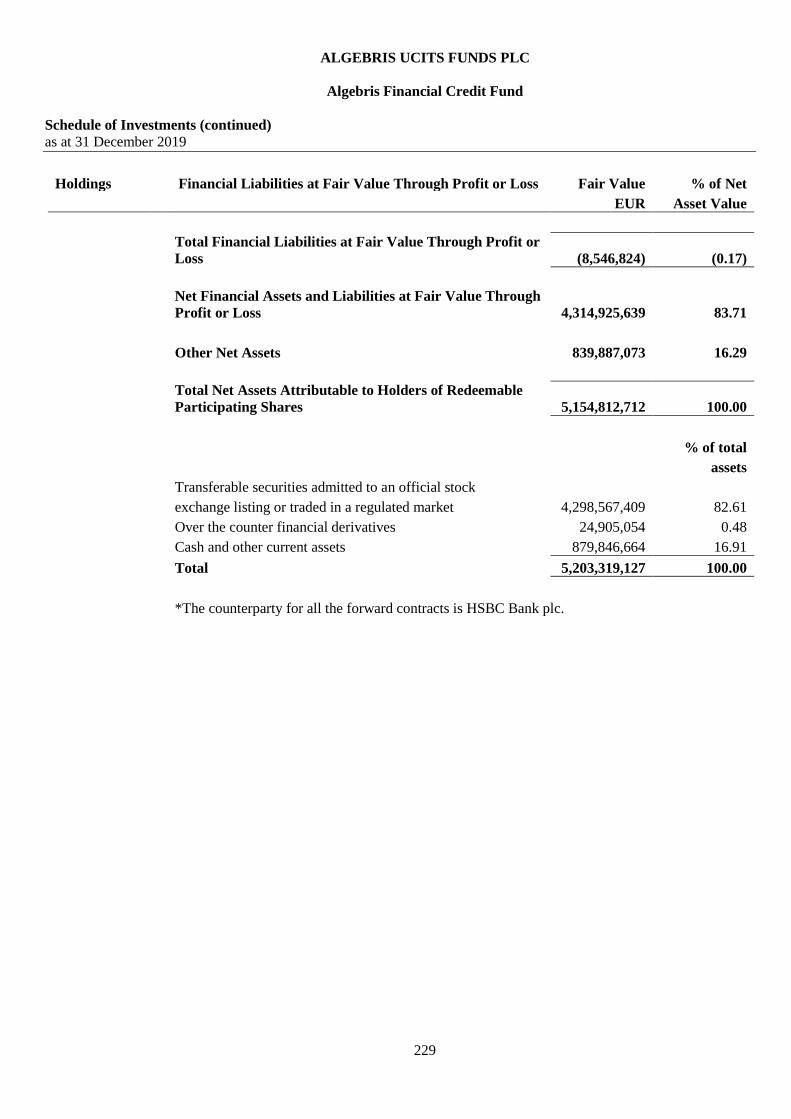
ALGEBRIS UCITS FUNDS PLC
Algebris Financial Credit Fund
Schedule of Investments (continued)
as at 31 December 2019
229
Holdings Financial Liabilities at Fair Value Through Profit or Loss Fair Value % of Net
EUR Asset Value
Total Financial Liabilities at Fair Value Through Profit or
Loss (8,546,824) (0.17)
Net Financial Assets and Liabilities at Fair Value Through
Profit or Loss 4,314,925,639 83.71
Other Net Assets 839,887,073 16.29
Total Net Assets Attributable to Holders of Redeemable
Participating Shares 5,154,812,712 100.00
% of total
assets
Transferable securities admitted to an official stock
exchange listing or traded in a regulated market 4,298,567,409 82.61
Over the counter financial derivatives 24,905,054 0.48
Cash and other current assets 879,846,664 16.91
Total 5,203,319,127 100.00
*The counterparty for all the forward contracts is HSBC Bank plc.
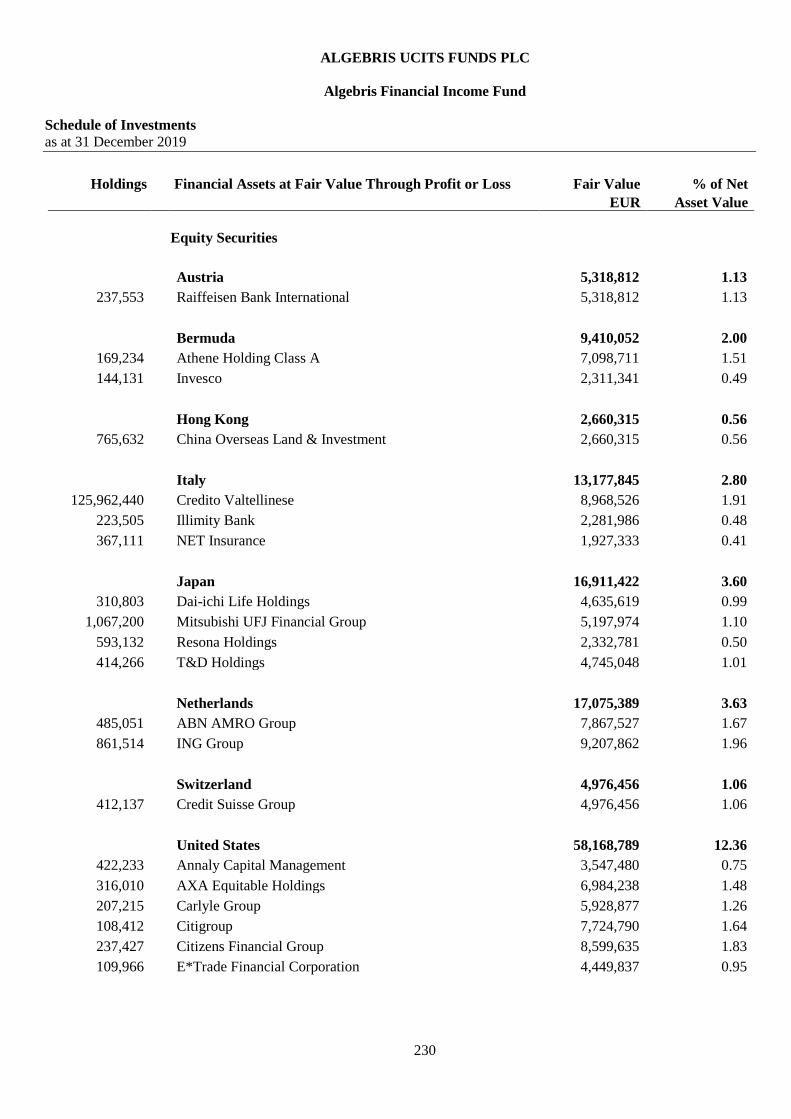
ALGEBRIS UCITS FUNDS PLC
Algebris Financial Income Fund
Schedule of Investments
as at 31 December 2019
230
Holdings Financial Assets at Fair Value Through Profit or Loss Fair Value % of Net
EUR Asset Value
Equity Securities
Austria 5,318,812 1.13
237,553 Raiffeisen Bank International 5,318,812 1.13
Bermuda 9,410,052 2.00
169,234 Athene Holding Class A 7,098,711 1.51
144,131 Invesco 2,311,341 0.49
Hong Kong 2,660,315 0.56
765,632 China Overseas Land & Investment 2,660,315 0.56
Italy 13,177,845 2.80
125,962,440 Credito Valtellinese 8,968,526 1.91
223,505 Illimity Bank 2,281,986 0.48
367,111 NET Insurance 1,927,333 0.41
Japan 16,911,422 3.60
310,803 Dai-ichi Life Holdings 4,635,619 0.99
1,067,200 Mitsubishi UFJ Financial Group 5,197,974 1.10
593,132 Resona Holdings 2,332,781 0.50
414,266 T&D Holdings 4,745,048 1.01
Netherlands 17,075,389 3.63
485,051 ABN AMRO Group 7,867,527 1.67
861,514 ING Group 9,207,862 1.96
Switzerland 4,976,456 1.06
412,137 Credit Suisse Group 4,976,456 1.06
United States 58,168,789 12.36
422,233 Annaly Capital Management 3,547,480 0.75
316,010 AXA Equitable Holdings 6,984,238 1.48
207,215 Carlyle Group 5,928,877 1.26
108,412 Citigroup 7,724,790 1.64
237,427 Citizens Financial Group 8,599,635 1.83
109,966 E*Trade Financial Corporation 4,449,837 0.95

ALGEBRIS UCITS FUNDS PLC
Algebris Financial Income Fund
Schedule of Investments (continued)
as at 31 December 2019
231
Holdings Financial Assets at Fair Value Through Profit or Loss Fair Value % of Net
EUR Asset Value
Equity Securities (continued)
United States (continued)
100,000 Fannie Mae (Series S) Preferred Perpetual 1,065,822 0.23
444,534 First Horizon National Corporation 6,565,718 1.40
1,234 First Tennessee Bank (144A) (Preferred) Perpetual 812,385 0.17
211,937 Investors Bancorp 2,252,256 0.48
223,750 Synovus Financial 7,822,869 1.66
87,088 Taubman Centers 2,414,882 0.51
Total Equity Securities 127,699,080 27.14
Fixed Income Securities
Austria 3,004,134 0.64
2,800,000 Bawag Group 3,004,134 0.64
Denmark 3,248,528 0.69
3,400,000 Danske Bank Perpetual 3,248,528 0.69
Finland 2,178,024 0.46
2,200,000 Nordea Bank ABP Perpetual 2,178,024 0.46
France 21,741,884 4.62
6,900,000 BNP Paribas VAR Perpetual 6,661,836 1.42
3,000,000 Credit Agricole 7.875% Perpetual 3,056,992 0.65
4,000,000 Credit Agricole VAR Perpetual 4,339,101 0.92
2,600,000 Societe Generale Perpetual 2,539,244 0.54
3,300,000 Societe Generale Perpetual (LUX) 3,252,319 0.69
1,800,000 Societe Generale VAR Perpetual 1,892,392 0.40
Germany 1,841,382 0.39
1,800,000 Aareal Bank 7.625% Perpetual 1,841,382 0.39
Italy 40,349,116 8.57
850,000 Banca Monte Dei Paschi 18/01/2028 669,362 0.14
2,004,000 Credito Valtellinese 4.7% 04/08/2021 2,070,683 0.44
5,200,000 Intesa Sanpaolo (144A) Perpetual 5,043,448 1.07
1,450,000 Intesa Sanpaolo 5.71% 15/01/2026 1,399,880 0.30
6,200,000 Intesa Sanpaolo Perpetual (AM0179896 Corporation) 7,528,102 1.60
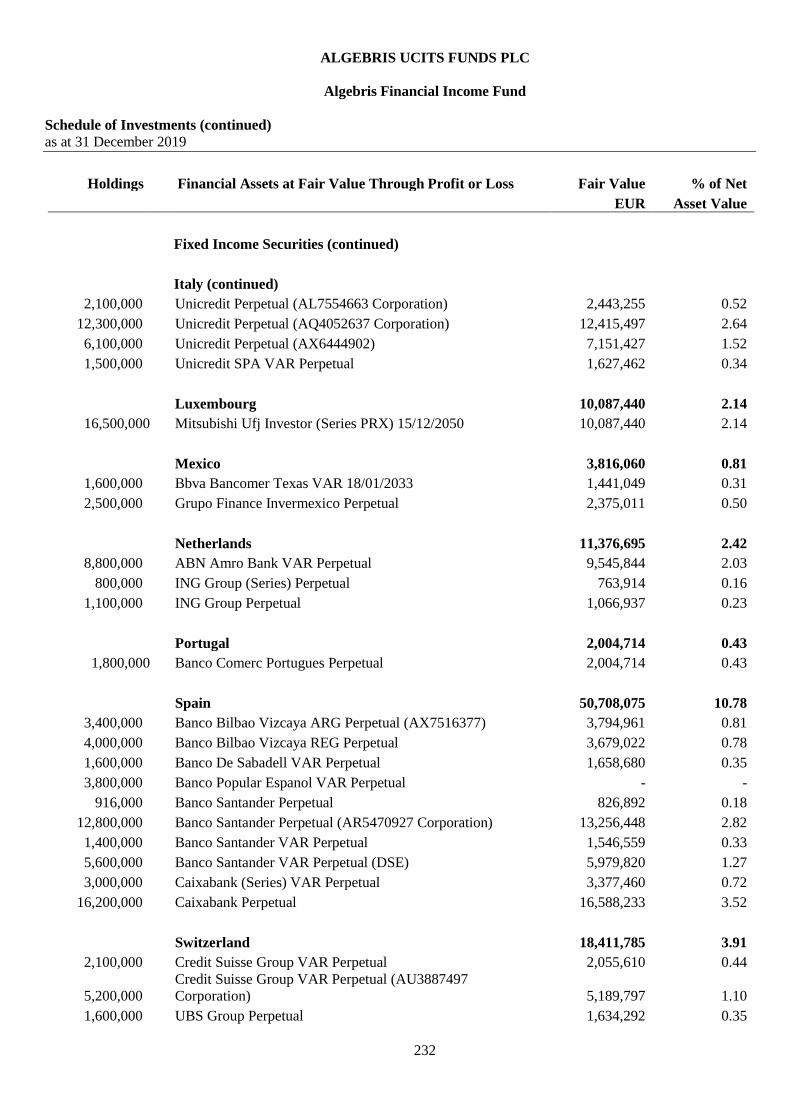
ALGEBRIS UCITS FUNDS PLC
Algebris Financial Income Fund
Schedule of Investments (continued)
as at 31 December 2019
232
Holdings Financial Assets at Fair Value Through Profit or Loss Fair Value % of Net
EUR Asset Value
Fixed Income Securities (continued)
Italy (continued)
2,100,000 Unicredit Perpetual (AL7554663 Corporation) 2,443,255 0.52
12,300,000 Unicredit Perpetual (AQ4052637 Corporation) 12,415,497 2.64
6,100,000 Unicredit Perpetual (AX6444902) 7,151,427 1.52
1,500,000 Unicredit SPA VAR Perpetual 1,627,462 0.34
Luxembourg 10,087,440 2.14
16,500,000 Mitsubishi Ufj Investor (Series PRX) 15/12/2050 10,087,440 2.14
Mexico 3,816,060 0.81
1,600,000 Bbva Bancomer Texas VAR 18/01/2033 1,441,049 0.31
2,500,000 Grupo Finance Invermexico Perpetual 2,375,011 0.50
Netherlands 11,376,695 2.42
8,800,000 ABN Amro Bank VAR Perpetual 9,545,844 2.03
800,000 ING Group (Series) Perpetual 763,914 0.16
1,100,000 ING Group Perpetual 1,066,937 0.23
Portugal 2,004,714 0.43
1,800,000 Banco Comerc Portugues Perpetual 2,004,714 0.43
Spain 50,708,075 10.78
3,400,000 Banco Bilbao Vizcaya ARG Perpetual (AX7516377) 3,794,961 0.81
4,000,000 Banco Bilbao Vizcaya REG Perpetual 3,679,022 0.78
1,600,000 Banco De Sabadell VAR Perpetual 1,658,680 0.35
3,800,000 Banco Popular Espanol VAR Perpetual - -
916,000 Banco Santander Perpetual 826,892 0.18
12,800,000 Banco Santander Perpetual (AR5470927 Corporation) 13,256,448 2.82
1,400,000 Banco Santander VAR Perpetual 1,546,559 0.33
5,600,000 Banco Santander VAR Perpetual (DSE) 5,979,820 1.27
3,000,000 Caixabank (Series) VAR Perpetual 3,377,460 0.72
16,200,000 Caixabank Perpetual 16,588,233 3.52
Switzerland 18,411,785 3.91
2,100,000 Credit Suisse Group VAR Perpetual 2,055,610 0.44
5,200,000
Credit Suisse Group VAR Perpetual (AU3887497
Corporation) 5,189,797 1.10
1,600,000 UBS Group Perpetual 1,634,292 0.35

ALGEBRIS UCITS FUNDS PLC
Algebris Financial Income Fund
Schedule of Investments (continued)
as at 31 December 2019
233
Holdings Financial Assets at Fair Value Through Profit or Loss Fair Value % of Net
EUR Asset Value
Fixed Income Securities (continued)
Switzerland (continued)
9,650,000 UBS Group Perpetual (UV4180070) 9,532,086 2.02
United Kingdom 55,026,689 11.69
1,000,000 Bank of Scotland (Series B) Perpetual 1,465,347 0.31
1,200,000 Barclays Perpetual 1,169,283 0.25
600,000 Barclays Perpetual (AM6775317) 775,562 0.16
6,600,000 Barclays Perpetual (AO6220567) 8,162,352 1.73
1,200,000 Barclays Perpetual (AX7752402) 1,201,445 0.26
1,400,000 Barclays Perpetual (AZ0489668) 1,874,311 0.40
1,800,000 Barclays Perpetual (UV4299359) 2,367,778 0.50
1,100,000 Barclays Perpetual (ZR6733045) 1,407,648 0.30
1,600,000 HSBC Holdings Perpetual (AO1326237) 1,806,368 0.38
2,100,000 HSBC Holdings VAR Perpetual (AU6128063) 2,740,612 0.58
1,800,000 Lloyds Banking Group(144A) VAR Perpetual 1,922,566 0.41
9,200,000 Lloyds Banking Group(144A) VAR Perpetual (LSE) 9,575,073 2.03
5,260,000 Nationwide Building Society Perpetual 10,377,454 2.21
6,000,000 Royal Bank of Scotland Group Perpetual (BYRQWJ1) 6,160,810 1.31
1,400,000 Santander UK Group Holdings VAR Perpetual 1,824,606 0.39
1,700,000 Santander UK Group Perpetual 2,195,474 0.47
United States 23,166,617 4.92
2,700,000 American International Group (Series A-9) 01/04/2048 2,645,625 0.56
2,700,000 Citigroup 25/08/2036 1,926,507 0.41
5,000,000 Dresdner Funding Trust I 8.151% 30/06/2031 5,998,038 1.27
14,075,000 Voya Financial 23/01/2048 12,596,447 2.68
Total Fixed Income Securities 246,961,143 52.47
Contracts For Difference*
3,182,309 Barclays 853,716 0.18
Total Contracts For Difference* 853,716 0.18
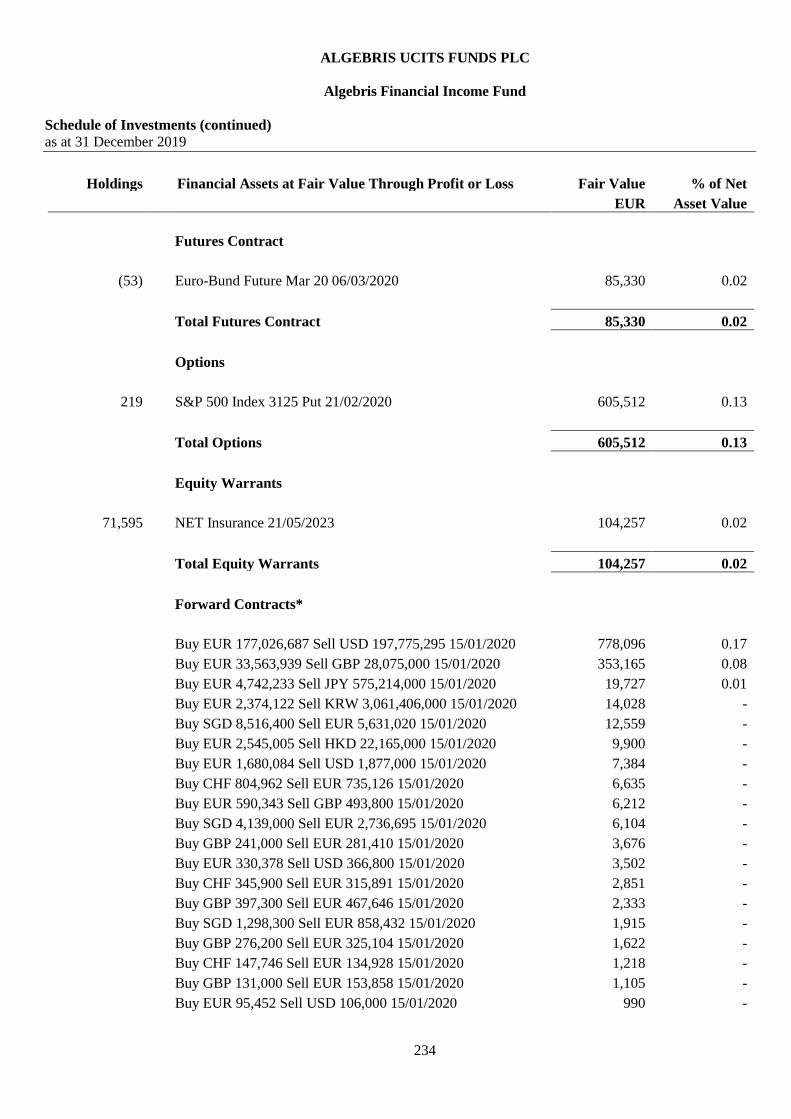
ALGEBRIS UCITS FUNDS PLC
Algebris Financial Income Fund
Schedule of Investments (continued)
as at 31 December 2019
234
Holdings Financial Assets at Fair Value Through Profit or Loss Fair Value % of Net
EUR Asset Value
Futures Contract
(53) Euro-Bund Future Mar 20 06/03/2020 85,330 0.02
Total Futures Contract 85,330 0.02
Options
219 S&P 500 Index 3125 Put 21/02/2020 605,512 0.13
Total Options 605,512 0.13
Equity Warrants
71,595 NET Insurance 21/05/2023 104,257 0.02
Total Equity Warrants 104,257 0.02
Forward Contracts*
Buy EUR 177,026,687 Sell USD 197,775,295 15/01/2020 778,096 0.17
Buy EUR 33,563,939 Sell GBP 28,075,000 15/01/2020 353,165 0.08
Buy EUR 4,742,233 Sell JPY 575,214,000 15/01/2020 19,727 0.01
Buy EUR 2,374,122 Sell KRW 3,061,406,000 15/01/2020 14,028 -
Buy SGD 8,516,400 Sell EUR 5,631,020 15/01/2020 12,559 -
Buy EUR 2,545,005 Sell HKD 22,165,000 15/01/2020 9,900 -
Buy EUR 1,680,084 Sell USD 1,877,000 15/01/2020 7,384 -
Buy CHF 804,962 Sell EUR 735,126 15/01/2020 6,635 -
Buy EUR 590,343 Sell GBP 493,800 15/01/2020 6,212 -
Buy SGD 4,139,000 Sell EUR 2,736,695 15/01/2020 6,104 -
Buy GBP 241,000 Sell EUR 281,410 15/01/2020 3,676 -
Buy EUR 330,378 Sell USD 366,800 15/01/2020 3,502 -
Buy CHF 345,900 Sell EUR 315,891 15/01/2020 2,851 -
Buy GBP 397,300 Sell EUR 467,646 15/01/2020 2,333 -
Buy SGD 1,298,300 Sell EUR 858,432 15/01/2020 1,915 -
Buy GBP 276,200 Sell EUR 325,104 15/01/2020 1,622 -
Buy CHF 147,746 Sell EUR 134,928 15/01/2020 1,218 -
Buy GBP 131,000 Sell EUR 153,858 15/01/2020 1,105 -
Buy EUR 95,452 Sell USD 106,000 15/01/2020 990 -
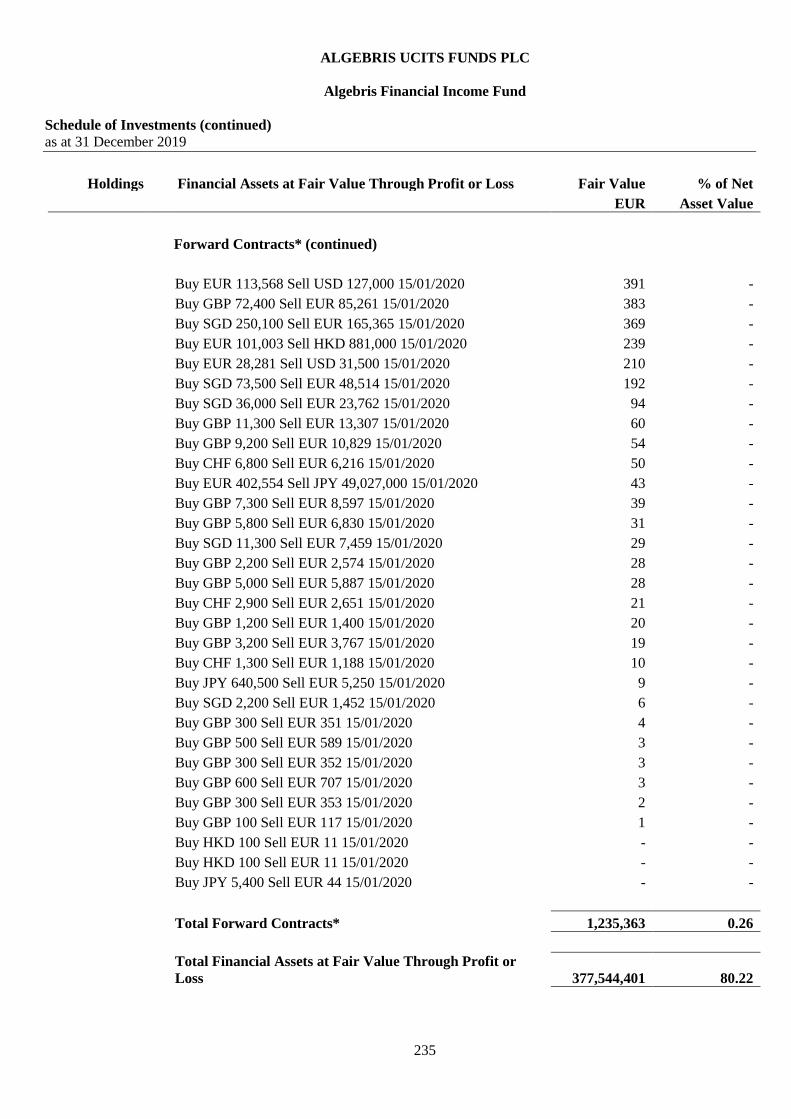
ALGEBRIS UCITS FUNDS PLC
Algebris Financial Income Fund
Schedule of Investments (continued)
as at 31 December 2019
235
Holdings Financial Assets at Fair Value Through Profit or Loss Fair Value % of Net
EUR Asset Value
Forward Contracts* (continued)
Buy EUR 113,568 Sell USD 127,000 15/01/2020 391 -
Buy GBP 72,400 Sell EUR 85,261 15/01/2020 383 -
Buy SGD 250,100 Sell EUR 165,365 15/01/2020 369 -
Buy EUR 101,003 Sell HKD 881,000 15/01/2020 239 -
Buy EUR 28,281 Sell USD 31,500 15/01/2020 210 -
Buy SGD 73,500 Sell EUR 48,514 15/01/2020 192 -
Buy SGD 36,000 Sell EUR 23,762 15/01/2020 94 -
Buy GBP 11,300 Sell EUR 13,307 15/01/2020 60 -
Buy GBP 9,200 Sell EUR 10,829 15/01/2020 54 -
Buy CHF 6,800 Sell EUR 6,216 15/01/2020 50 -
Buy EUR 402,554 Sell JPY 49,027,000 15/01/2020 43 -
Buy GBP 7,300 Sell EUR 8,597 15/01/2020 39 -
Buy GBP 5,800 Sell EUR 6,830 15/01/2020 31 -
Buy SGD 11,300 Sell EUR 7,459 15/01/2020 29 -
Buy GBP 2,200 Sell EUR 2,574 15/01/2020 28 -
Buy GBP 5,000 Sell EUR 5,887 15/01/2020 28 -
Buy CHF 2,900 Sell EUR 2,651 15/01/2020 21 -
Buy GBP 1,200 Sell EUR 1,400 15/01/2020 20 -
Buy GBP 3,200 Sell EUR 3,767 15/01/2020 19 -
Buy CHF 1,300 Sell EUR 1,188 15/01/2020 10 -
Buy JPY 640,500 Sell EUR 5,250 15/01/2020 9 -
Buy SGD 2,200 Sell EUR 1,452 15/01/2020 6 -
Buy GBP 300 Sell EUR 351 15/01/2020 4 -
Buy GBP 500 Sell EUR 589 15/01/2020 3 -
Buy GBP 300 Sell EUR 352 15/01/2020 3 -
Buy GBP 600 Sell EUR 707 15/01/2020 3 -
Buy GBP 300 Sell EUR 353 15/01/2020 2 -
Buy GBP 100 Sell EUR 117 15/01/2020 1 -
Buy HKD 100 Sell EUR 11 15/01/2020 - -
Buy HKD 100 Sell EUR 11 15/01/2020 - -
Buy JPY 5,400 Sell EUR 44 15/01/2020 - -
Total Forward Contracts* 1,235,363 0.26
Total Financial Assets at Fair Value Through Profit or
Loss 377,544,401 80.22

ALGEBRIS UCITS FUNDS PLC
Algebris Financial Income Fund
Schedule of Investments (continued)
as at 31 December 2019
236
Holdings Financial Liabilities at Fair Value Through Profit or Loss Fair Value % of Net
EUR Asset Value
Financial Liabilities at Fair Value Through Profit or Loss
Contracts For Difference*
22,235,493 Banco Comercial Portugues (54,604) (0.01)
8,136,902 Banco De Sabadell (2,081,318) (0.44)
2,389,886 Banco Santander (1,805,108) (0.39)
155,397 BNP Paribas (60,295) (0.01)
79,500 Hana Financial Group (110,132) (0.02)
304,813 Societe Generale (1,063,551) (0.23)
736,211 UniCredit (811,709) (0.17)
Total Contracts For Difference* (5,986,717) (1.27)
Futures Contract
(160) Euro-BTP Future Mar 20 06/03/2020 (3,200) -
Total Futures Contract (3,200) -
Options
(219) S&P 500 Index 2900 Put 21/02/2020 (184,583) (0.04)
Total Options (184,583) (0.04)
Forward Contracts*
Buy USD 37,159,500 Sell EUR 33,261,097 15/01/2020 (146,195) (0.03)
Buy USD 35,511,758 Sell EUR 31,786,219 15/01/2020 (139,712) (0.03)
Buy USD 28,423,879 Sell EUR 25,441,930 15/01/2020 (111,826) (0.02)
Buy GBP 8,527,568 Sell EUR 10,194,792 15/01/2020 (107,271) (0.02)
Buy USD 24,119,702 Sell EUR 21,589,304 15/01/2020 (94,893) (0.02)
Buy USD 19,419,700 Sell EUR 17,382,379 15/01/2020 (76,402) (0.02)
Buy USD 7,627,000 Sell EUR 6,846,994 15/01/2020 (50,149) (0.01)
Buy EUR 4,863,018 Sell CHF 5,325,000 15/01/2020 (43,894) (0.01)

ALGEBRIS UCITS FUNDS PLC
Algebris Financial Income Fund
Schedule of Investments
as at 31 December 2019
237
Holdings Financial Liabilities at Fair Value Through Profit or Loss Fair Value % of Net
EUR Asset Value
Forward Contracts* (continued)
Buy EUR 12,088,239 Sell JPY 1,474,823,000 15/01/2020 (20,054) (0.01)
Buy GBP 1,350,098 Sell EUR 1,614,055 15/01/2020 (16,983) (0.01)
Buy GBP 872,400 Sell EUR 1,042,963 15/01/2020 (10,974) -
Buy GBP 680,400 Sell EUR 813,425 15/01/2020 (8,559) -
Buy EUR 1,389,607 Sell GBP 1,180,000 15/01/2020 (6,251) -
Buy USD 495,000 Sell EUR 443,968 15/01/2020 (2,846) -
Buy USD 200,100 Sell EUR 180,268 15/01/2020 (1,947) -
Buy EUR 179,157 Sell CHF 196,000 15/01/2020 (1,454) -
Buy EUR 637,031 Sell SGD 963,100 15/01/2020 (1,188) -
Buy USD 322,200 Sell EUR 288,122 15/01/2020 (992) -
Buy GBP 75,532 Sell EUR 90,299 15/01/2020 (950) -
Buy USD 307,900 Sell EUR 275,334 15/01/2020 (948) -
Buy USD 247,400 Sell EUR 221,233 15/01/2020 (761) -
Buy GBP 59,663 Sell EUR 71,328 15/01/2020 (751) -
Buy USD 211,500 Sell EUR 189,130 15/01/2020 (651) -
Buy GBP 100,000 Sell EUR 118,940 15/01/2020 (647) -
Buy USD 132,608 Sell EUR 118,696 15/01/2020 (522) -
Buy USD 166,200 Sell EUR 148,622 15/01/2020 (511) -
Buy EUR 233,702 Sell USD 262,700 15/01/2020 (404) -
Buy GBP 6,300 Sell EUR 7,571 15/01/2020 (118) -
Buy EUR 62,896 Sell USD 70,700 15/01/2020 (109) -
Buy EUR 4,818 Sell GBP 4,100 15/01/2020 (32) -
Buy EUR 4,230 Sell GBP 3,600 15/01/2020 (28) -
Buy EUR 3,170 Sell GBP 2,700 15/01/2020 (24) -
Buy KRW 125,897,000 Sell EUR 97,069 15/01/2020 (12) -
Buy GBP 1,500 Sell EUR 1,784 15/01/2020 (10) -
Buy HKD 9,900 Sell EUR 1,137 15/01/2020 (4) -
Buy HKD 9,800 Sell EUR 1,125 15/01/2020 (4) -
Buy USD 1,200 Sell EUR 1,073 15/01/2020 (4) -
Buy GBP 500 Sell EUR 595 15/01/2020 (3) -
Buy GBP 100 Sell EUR 120 15/01/2020 (2) -
Total Forward Contracts* (848,085) (0.18)
Total Financial Liabilities at Fair Value Through Profit or
Loss (7,022,585) (1.49)

ALGEBRIS UCITS FUNDS PLC
Algebris Financial Income Fund
Schedule of Investments
as at 31 December 2019
238
Holdings Financial Liabilities at Fair Value Through Profit or Loss Fair Value % of Net
EUR Asset Value
Net Financial Assets and Liabilities at Fair Value Through
Profit or Loss 370,521,816 78.73
Other Net Assets 100,127,435 21.27
Total Net Assets Attributable to Holders of Redeemable
Participating Shares 470,649,251 100.00
% of total
assets
Transferable securities admitted to an official stock
exchange listing or traded in a regulated market 374,660,223 77.95
Over the counter financial derivatives 2,884,178 0.60
Cash and other current assets 103,111,230 21.45
Total Assets 480,655,630 100.00
*The counterparty for all the contracts for differences and forward contracts is HSBC Bank plc
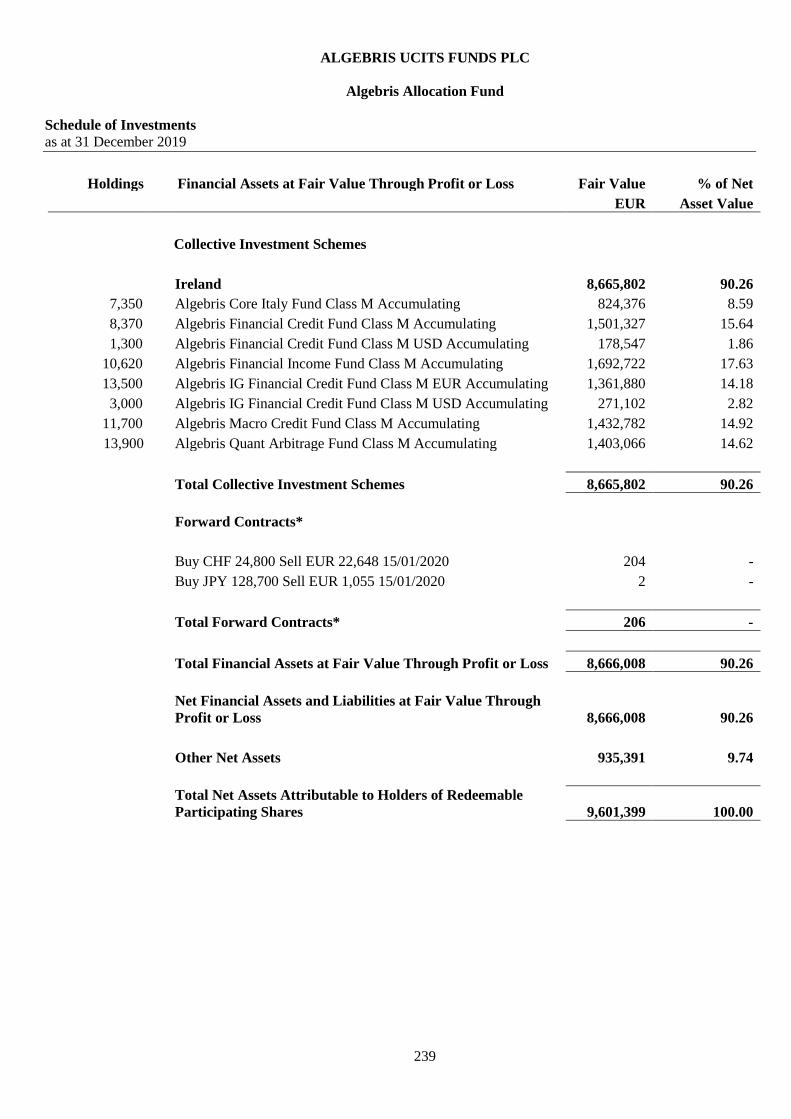
ALGEBRIS UCITS FUNDS PLC
Algebris Allocation Fund
Schedule of Investments
as at 31 December 2019
239
Holdings Financial Assets at Fair Value Through Profit or Loss Fair Value % of Net
EUR Asset Value
Collective Investment Schemes
Ireland 8,665,802 90.26
7,350 Algebris Core Italy Fund Class M Accumulating 824,376 8.59
8,370 Algebris Financial Credit Fund Class M Accumulating 1,501,327 15.64
1,300 Algebris Financial Credit Fund Class M USD Accumulating 178,547 1.86
10,620 Algebris Financial Income Fund Class M Accumulating 1,692,722 17.63
13,500 Algebris IG Financial Credit Fund Class M EUR Accumulating 1,361,880 14.18
3,000 Algebris IG Financial Credit Fund Class M USD Accumulating 271,102 2.82
11,700 Algebris Macro Credit Fund Class M Accumulating 1,432,782 14.92
13,900 Algebris Quant Arbitrage Fund Class M Accumulating 1,403,066 14.62
Total Collective Investment Schemes 8,665,802 90.26
Forward Contracts*
Buy CHF 24,800 Sell EUR 22,648 15/01/2020 204 -
Buy JPY 128,700 Sell EUR 1,055 15/01/2020 2 -
Total Forward Contracts* 206 -
Total Financial Assets at Fair Value Through Profit or Loss 8,666,008 90.26
Net Financial Assets and Liabilities at Fair Value Through
Profit or Loss 8,666,008 90.26
Other Net Assets 935,391 9.74
Total Net Assets Attributable to Holders of Redeemable
Participating Shares 9,601,399 100.00

ALGEBRIS UCITS FUNDS PLC
Algebris Allocation Fund
Schedule of Investments (continued)
as at 31 December 2019
240
Holdings Financial Assets at Fair Value Through Profit or Loss Fair Value % of Net
EUR Asset Value
% of total
assets
Transferable securities admitted to an official stock
exchange listing or traded in a regulated market - -
Investment Funds 8,665,802 89.62
Over the counter financial derivatives 206 -
Cash and other current assets 1,003,105 10.38
Total Assets 9,669,113 100.00
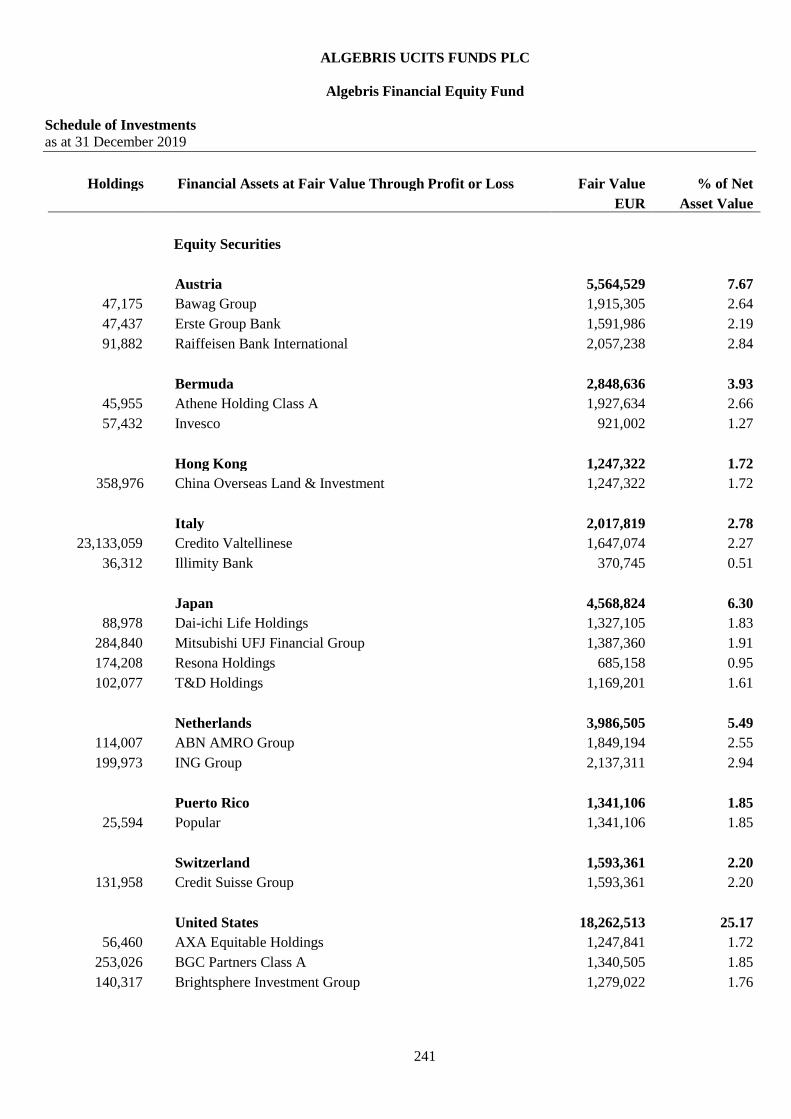
ALGEBRIS UCITS FUNDS PLC
Algebris Financial Equity Fund
Schedule of Investments
as at 31 December 2019
241
Holdings Financial Assets at Fair Value Through Profit or Loss Fair Value % of Net
EUR Asset Value
Equity Securities
Austria 5,564,529 7.67
47,175 Bawag Group 1,915,305 2.64
47,437 Erste Group Bank 1,591,986 2.19
91,882 Raiffeisen Bank International 2,057,238 2.84
Bermuda 2,848,636 3.93
45,955 Athene Holding Class A 1,927,634 2.66
57,432 Invesco 921,002 1.27
Hong Kong 1,247,322 1.72
358,976 China Overseas Land & Investment 1,247,322 1.72
Italy 2,017,819 2.78
23,133,059 Credito Valtellinese 1,647,074 2.27
36,312 Illimity Bank 370,745 0.51
Japan 4,568,824 6.30
88,978 Dai-ichi Life Holdings 1,327,105 1.83
284,840 Mitsubishi UFJ Financial Group 1,387,360 1.91
174,208 Resona Holdings 685,158 0.95
102,077 T&D Holdings 1,169,201 1.61
Netherlands 3,986,505 5.49
114,007 ABN AMRO Group 1,849,194 2.55
199,973 ING Group 2,137,311 2.94
Puerto Rico 1,341,106 1.85
25,594 Popular 1,341,106 1.85
Switzerland 1,593,361 2.20
131,958 Credit Suisse Group 1,593,361 2.20
United States 18,262,513 25.17
56,460 AXA Equitable Holdings 1,247,841 1.72
253,026 BGC Partners Class A 1,340,505 1.85
140,317 Brightsphere Investment Group 1,279,022 1.76
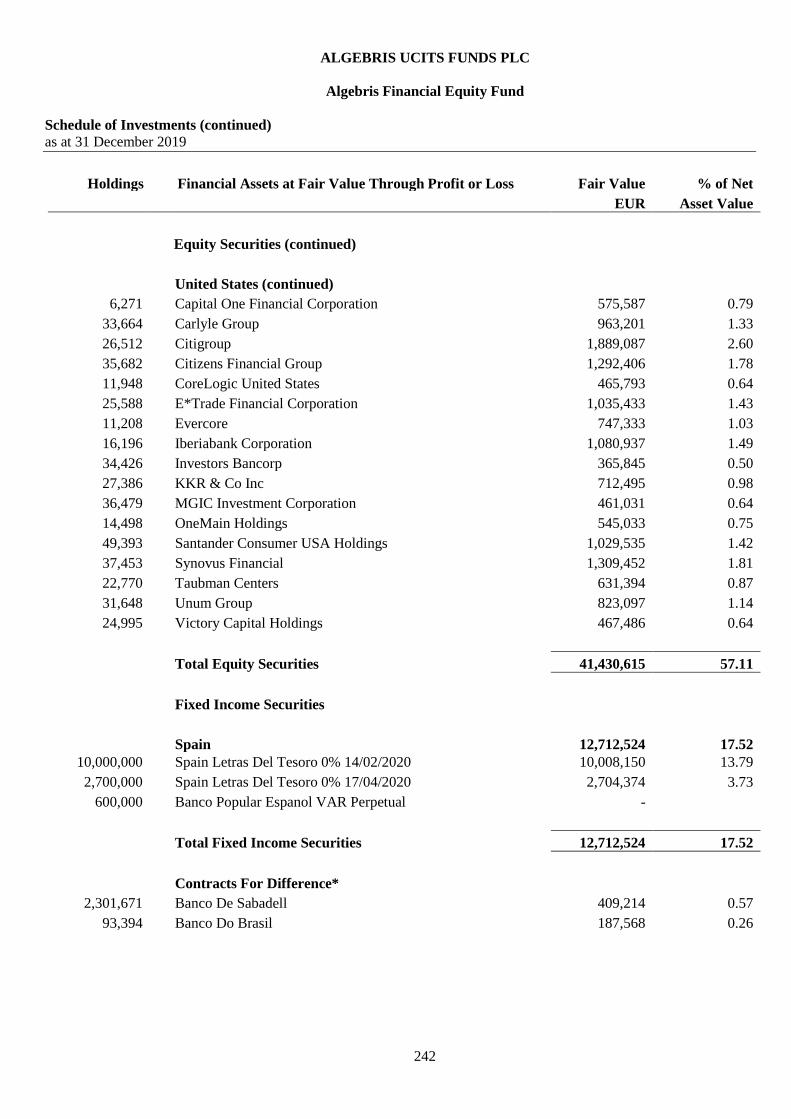
ALGEBRIS UCITS FUNDS PLC
Algebris Financial Equity Fund
Schedule of Investments (continued)
as at 31 December 2019
242
Holdings Financial Assets at Fair Value Through Profit or Loss Fair Value % of Net
EUR Asset Value
Equity Securities (continued)
United States (continued)
6,271 Capital One Financial Corporation 575,587 0.79
33,664 Carlyle Group 963,201 1.33
26,512 Citigroup 1,889,087 2.60
35,682 Citizens Financial Group 1,292,406 1.78
11,948 CoreLogic United States 465,793 0.64
25,588 E*Trade Financial Corporation 1,035,433 1.43
11,208 Evercore 747,333 1.03
16,196 Iberiabank Corporation 1,080,937 1.49
34,426 Investors Bancorp 365,845 0.50
27,386 KKR & Co Inc 712,495 0.98
36,479 MGIC Investment Corporation 461,031 0.64
14,498 OneMain Holdings 545,033 0.75
49,393 Santander Consumer USA Holdings 1,029,535 1.42
37,453 Synovus Financial 1,309,452 1.81
22,770 Taubman Centers 631,394 0.87
31,648 Unum Group 823,097 1.14
24,995 Victory Capital Holdings 467,486 0.64
Total Equity Securities 41,430,615 57.11
Fixed Income Securities
Spain 12,712,524 17.52
10,000,000 Spain Letras Del Tesoro 0% 14/02/2020 10,008,150 13.79
2,700,000 Spain Letras Del Tesoro 0% 17/04/2020 2,704,374 3.73
600,000 Banco Popular Espanol VAR Perpetual -
Total Fixed Income Securities 12,712,524 17.52
Contracts For Difference*
2,301,671 Banco De Sabadell 409,214 0.57
93,394 Banco Do Brasil 187,568 0.26

ALGEBRIS UCITS FUNDS PLC
Algebris Financial Equity Fund
Schedule of Investments (continued)
as at 31 December 2019
243
Holdings Financial Assets at Fair Value Through Profit or Loss Fair Value % of Net
EUR Asset Value
Contracts For Difference* (continued)
782,450 Bankia 32,614 0.04
912,269 Barclays 204,276 0.28
48,430 BNP Paribas 422,969 0.58
552,917 CaixaBank 251,252 0.35
1,458,553 Unicaja Banco 185,371 0.26
256,155 UniCredit 393,440 0.54
Total Contracts For Difference* 2,086,704 2.88
Futures contract
(21)
Dow Jones EURO STOXX 50 (Price) Index Future Mar 20
20/03/2020 2,940 -
Total Futures Contract 2,940 -
Options
500 Bank of America Corporation 32 Put 17/01/2020 3,122 -
250 JPMorgan Chase 125 Put 17/01/2020 4,460 0.01
34 S&P 500 Index 3125 Put 21/02/2020 94,006 0.13
Total Options 101,588 0.14
Forward Contracts**
Buy EUR 23,172,985 Sell USD 25,889,000 15/01/2020 101,854 0.14
Buy CHF 3,234,998 Sell EUR 2,954,339 15/01/2020 26,666 0.04
Buy EUR 1,193,219 Sell HKD 10,392,000 15/01/2020 4,642 0.01
Buy EUR 347,311 Sell USD 385,600 15/01/2020 3,681 0.01
Buy GBP 210,100 Sell EUR 245,818 15/01/2020 2,716 -
Buy EUR 179,326 Sell GBP 150,000 15/01/2020 1,887 -
Buy CHF 168,292 Sell EUR 153,691 15/01/2020 1,387 -
Buy GBP 80,000 Sell EUR 93,959 15/01/2020 675 -
Buy GBP 41,000 Sell EUR 47,827 15/01/2020 673 -
Buy EUR 34,670 Sell GBP 29,000 15/01/2020 365 -
Buy CHF 35,100 Sell EUR 32,084 15/01/2020 260 -
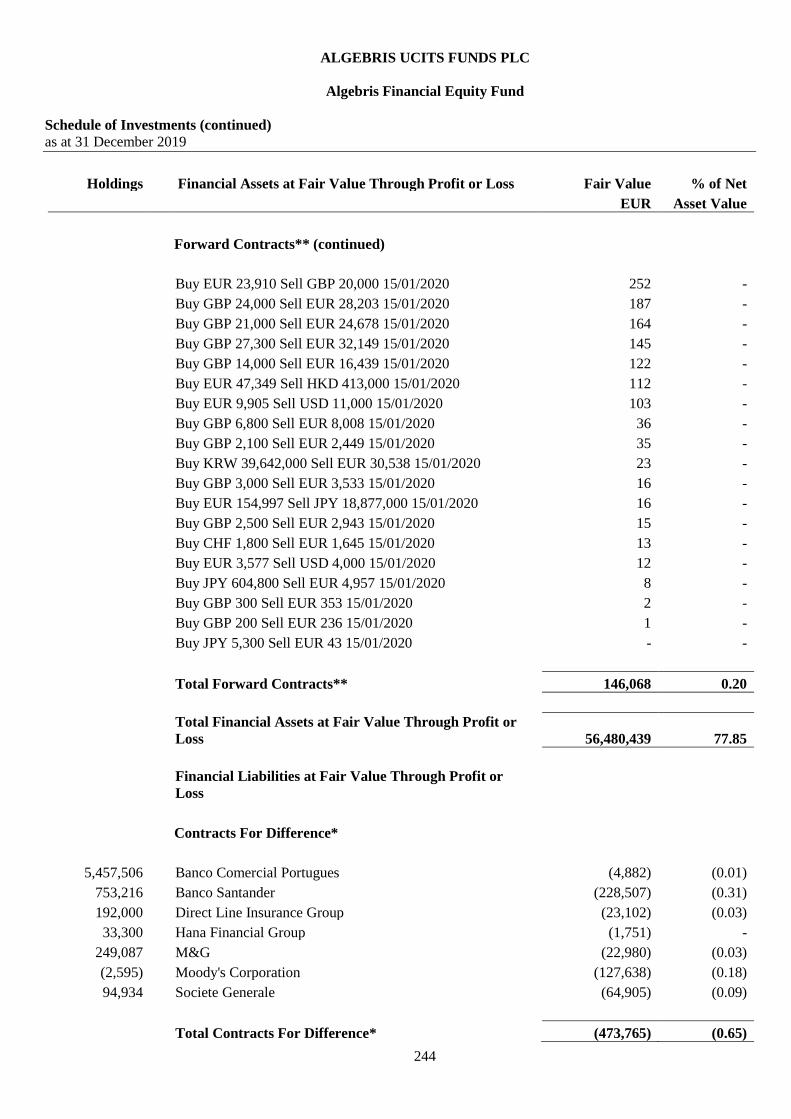
ALGEBRIS UCITS FUNDS PLC
Algebris Financial Equity Fund
Schedule of Investments (continued)
as at 31 December 2019
244
Holdings Financial Assets at Fair Value Through Profit or Loss Fair Value % of Net
EUR Asset Value
Forward Contracts** (continued)
Buy EUR 23,910 Sell GBP 20,000 15/01/2020 252 -
Buy GBP 24,000 Sell EUR 28,203 15/01/2020 187 -
Buy GBP 21,000 Sell EUR 24,678 15/01/2020 164 -
Buy GBP 27,300 Sell EUR 32,149 15/01/2020 145 -
Buy GBP 14,000 Sell EUR 16,439 15/01/2020 122 -
Buy EUR 47,349 Sell HKD 413,000 15/01/2020 112 -
Buy EUR 9,905 Sell USD 11,000 15/01/2020 103 -
Buy GBP 6,800 Sell EUR 8,008 15/01/2020 36 -
Buy GBP 2,100 Sell EUR 2,449 15/01/2020 35 -
Buy KRW 39,642,000 Sell EUR 30,538 15/01/2020 23 -
Buy GBP 3,000 Sell EUR 3,533 15/01/2020 16 -
Buy EUR 154,997 Sell JPY 18,877,000 15/01/2020 16 -
Buy GBP 2,500 Sell EUR 2,943 15/01/2020 15 -
Buy CHF 1,800 Sell EUR 1,645 15/01/2020 13 -
Buy EUR 3,577 Sell USD 4,000 15/01/2020 12 -
Buy JPY 604,800 Sell EUR 4,957 15/01/2020 8 -
Buy GBP 300 Sell EUR 353 15/01/2020 2 -
Buy GBP 200 Sell EUR 236 15/01/2020 1 -
Buy JPY 5,300 Sell EUR 43 15/01/2020 - -
Total Forward Contracts** 146,068 0.20
Total Financial Assets at Fair Value Through Profit or
Loss 56,480,439 77.85
Financial Liabilities at Fair Value Through Profit or
Loss
Contracts For Difference*
5,457,506 Banco Comercial Portugues (4,882) (0.01)
753,216 Banco Santander (228,507) (0.31)
192,000 Direct Line Insurance Group (23,102) (0.03)
33,300 Hana Financial Group (1,751) -
249,087 M&G (22,980) (0.03)
(2,595) Moody's Corporation (127,638) (0.18)
94,934 Societe Generale (64,905) (0.09)
Total Contracts For Difference* (473,765) (0.65)
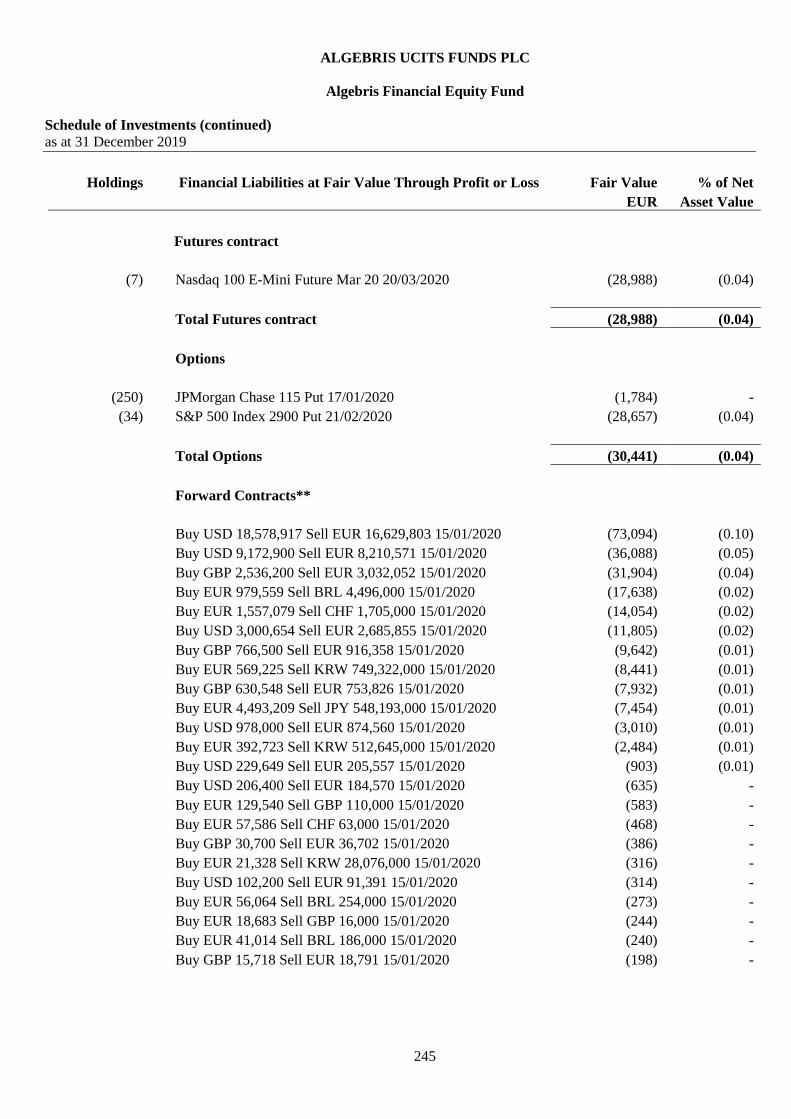
ALGEBRIS UCITS FUNDS PLC
Algebris Financial Equity Fund
Schedule of Investments (continued)
as at 31 December 2019
245
Holdings Financial Liabilities at Fair Value Through Profit or Loss Fair Value % of Net
EUR Asset Value
Futures contract
(7) Nasdaq 100 E-Mini Future Mar 20 20/03/2020 (28,988) (0.04)
Total Futures contract (28,988) (0.04)
Options
(250) JPMorgan Chase 115 Put 17/01/2020 (1,784) -
(34) S&P 500 Index 2900 Put 21/02/2020 (28,657) (0.04)
Total Options (30,441) (0.04)
Forward Contracts**
Buy USD 18,578,917 Sell EUR 16,629,803 15/01/2020 (73,094) (0.10)
Buy USD 9,172,900 Sell EUR 8,210,571 15/01/2020 (36,088) (0.05)
Buy GBP 2,536,200 Sell EUR 3,032,052 15/01/2020 (31,904) (0.04)
Buy EUR 979,559 Sell BRL 4,496,000 15/01/2020 (17,638) (0.02)
Buy EUR 1,557,079 Sell CHF 1,705,000 15/01/2020 (14,054) (0.02)
Buy USD 3,000,654 Sell EUR 2,685,855 15/01/2020 (11,805) (0.02)
Buy GBP 766,500 Sell EUR 916,358 15/01/2020 (9,642) (0.01)
Buy EUR 569,225 Sell KRW 749,322,000 15/01/2020 (8,441) (0.01)
Buy GBP 630,548 Sell EUR 753,826 15/01/2020 (7,932) (0.01)
Buy EUR 4,493,209 Sell JPY 548,193,000 15/01/2020 (7,454) (0.01)
Buy USD 978,000 Sell EUR 874,560 15/01/2020 (3,010) (0.01)
Buy EUR 392,723 Sell KRW 512,645,000 15/01/2020 (2,484) (0.01)
Buy USD 229,649 Sell EUR 205,557 15/01/2020 (903) (0.01)
Buy USD 206,400 Sell EUR 184,570 15/01/2020 (635) -
Buy EUR 129,540 Sell GBP 110,000 15/01/2020 (583) -
Buy EUR 57,586 Sell CHF 63,000 15/01/2020 (468) -
Buy GBP 30,700 Sell EUR 36,702 15/01/2020 (386) -
Buy EUR 21,328 Sell KRW 28,076,000 15/01/2020 (316) -
Buy USD 102,200 Sell EUR 91,391 15/01/2020 (314) -
Buy EUR 56,064 Sell BRL 254,000 15/01/2020 (273) -
Buy EUR 18,683 Sell GBP 16,000 15/01/2020 (244) -
Buy EUR 41,014 Sell BRL 186,000 15/01/2020 (240) -
Buy GBP 15,718 Sell EUR 18,791 15/01/2020 (198) -

ALGEBRIS UCITS FUNDS PLC
Algebris Financial Equity Fund
Schedule of Investments (continued)
as at 31 December 2019
246
Holdings Financial Liabilities at Fair Value Through Profit or Loss Fair Value % of Net
EUR Asset Value
Forward Contracts** (continued)
Buy USD 49,071 Sell EUR 43,923 15/01/2020 (193) -
Buy EUR 16,420 Sell GBP 14,000 15/01/2020 (141) -
Buy EUR 18,318 Sell GBP 15,600 15/01/2020 (136) -
Buy EUR 75,706 Sell USD 85,100 15/01/2020 (131) -
Buy USD 33,400 Sell EUR 29,867 15/01/2020 (103) -
Buy EUR 11,730 Sell GBP 10,000 15/01/2020 (100) -
Buy EUR 11,046 Sell GBP 9,400 15/01/2020 (73) -
Buy EUR 2,936 Sell GBP 2,500 15/01/2020 (22) -
Buy USD 4,800 Sell EUR 4,296 15/01/2020 (19) -
Buy USD 2,500 Sell EUR 2,236 15/01/2020 (8) -
Buy USD 600 Sell EUR 537 15/01/2020 (2) -
Total Forward Contracts** (229,034) (0.32)
Total Financial Liabilities at Fair Value Through Profit or
Loss (762,228) (1.05)
Net Financial Assets and Liabilities at Fair Value Through
Profit or Loss 55,718,211 76.80
Other Net Assets 16,827,645 23.19
Total Net Assets Attributable to Holders of Redeemable
Participating Shares 72,545,856 100.00
% of total
assets
Transferable securities admitted to an official stock
exchange listing or traded in a regulated market 54,143,139 71.92
Over the counter financial derivatives 2,337,300 3.10
Cash and other current assets 18,799,973 24.98
Total Assets 75,280,412 100.00
*The counterparties for all the contracts for differences are HSBC Bank plc and Morgan Stanley.
**The counterparty for all the forward contracts is HSBC Bank plc.

ALGEBRIS UCITS FUNDS PLC
Algebris Macro Credit Fund
Schedule of Investments
as at 31 December 2019
247
Holdings Financial Assets at Fair Value Through Profit or Loss Fair Value % of Net
EUR Asset Value
Equity Securities
Italy 2,164,124 0.41
30,395,000 Credito Valtellinese 2,164,124 0.41
Total Equity Securities 2,164,124 0.41
Fixed Income Securities
Argentina 6,077,845 1.15
4,350,000 Provincia De Buenos Aire 15/05/2035 1,743,089 0.33
6,467,687 Republic of Argentina (Series Dsc Eur) 7.82% 31/12/2033 3,704,756 0.70
1,400,000 Republic of Argentina 5.25% 15/01/2028 630,000 0.12
Cayman Islands 239,252 0.05
1,076,804 Odbrcht Offshre Drill Finance 7.72% 01/12/2026 238,100 0.05
151,439 Odebrecht Oil & Finance 0% Perpetual 1,152 -
Channel Island 759,990 0.14
1,000,000 Eagle Interest Glo/Ruyi 5.375% 01/05/2023 759,990 0.14
Cyprus 1,230,115 0.23
1,000,000 Republic of Cyprus 2.75% 26/02/2034 1,230,115 0.23
Ecuador 7,576,618 1.43
9,000,000 Republic of Ecuador 7.875% 23/01/2028 7,167,639 1.35
500,000 Republic of Ecuador 7.875% 27/03/2025 408,979 0.08
Egypt 6,345,512 1.20
99,742,000 Government of Egypt (Series 7YR) 0% 06/08/2026 6,345,512 1.20
France 5,004,160 0.95
2,000,000 Electricite De France Perpetual 2,633,740 0.50
2,000,000 Solvay Finance (Series) Perpetual 2,370,420 0.45
Germany 2,151,310 0.41
2,000,000 Merck Kgaa 25/06/2079 2,151,310 0.41
Greece 8,900,807 1.68
2,500,000 Hellenic Republic 1.875% 23/07/2026 2,647,325 0.50
1,500,000 Hellenic Republic 3.875% 12/03/2029 1,816,582 0.34
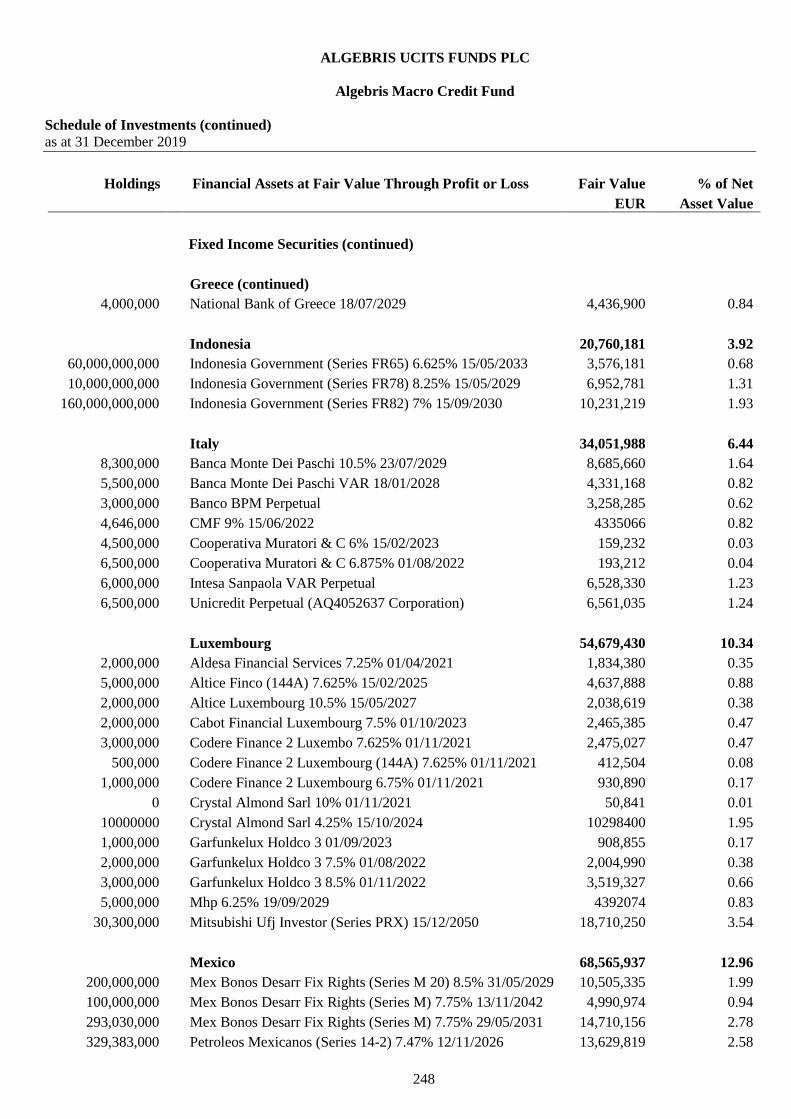
ALGEBRIS UCITS FUNDS PLC
Algebris Macro Credit Fund
Schedule of Investments (continued)
as at 31 December 2019
248
Holdings Financial Assets at Fair Value Through Profit or Loss Fair Value % of Net
EUR Asset Value
Fixed Income Securities (continued)
Greece (continued)
4,000,000 National Bank of Greece 18/07/2029 4,436,900 0.84
Indonesia 20,760,181 3.92
60,000,000,000 Indonesia Government (Series FR65) 6.625% 15/05/2033 3,576,181 0.68
10,000,000,000 Indonesia Government (Series FR78) 8.25% 15/05/2029 6,952,781 1.31
160,000,000,000 Indonesia Government (Series FR82) 7% 15/09/2030 10,231,219 1.93
Italy 34,051,988 6.44
8,300,000 Banca Monte Dei Paschi 10.5% 23/07/2029 8,685,660 1.64
5,500,000 Banca Monte Dei Paschi VAR 18/01/2028 4,331,168 0.82
3,000,000 Banco BPM Perpetual 3,258,285 0.62
4,646,000 CMF 9% 15/06/2022 4335066 0.82
4,500,000 Cooperativa Muratori & C 6% 15/02/2023 159,232 0.03
6,500,000 Cooperativa Muratori & C 6.875% 01/08/2022 193,212 0.04
6,000,000 Intesa Sanpaola VAR Perpetual 6,528,330 1.23
6,500,000 Unicredit Perpetual (AQ4052637 Corporation) 6,561,035 1.24
Luxembourg 54,679,430 10.34
2,000,000 Aldesa Financial Services 7.25% 01/04/2021 1,834,380 0.35
5,000,000 Altice Finco (144A) 7.625% 15/02/2025 4,637,888 0.88
2,000,000 Altice Luxembourg 10.5% 15/05/2027 2,038,619 0.38
2,000,000 Cabot Financial Luxembourg 7.5% 01/10/2023 2,465,385 0.47
3,000,000 Codere Finance 2 Luxembo 7.625% 01/11/2021 2,475,027 0.47
500,000 Codere Finance 2 Luxembourg (144A) 7.625% 01/11/2021 412,504 0.08
1,000,000 Codere Finance 2 Luxembourg 6.75% 01/11/2021 930,890 0.17
0 Crystal Almond Sarl 10% 01/11/2021 50,841 0.01
10000000 Crystal Almond Sarl 4.25% 15/10/2024 10298400 1.95
1,000,000 Garfunkelux Holdco 3 01/09/2023 908,855 0.17
2,000,000 Garfunkelux Holdco 3 7.5% 01/08/2022 2,004,990 0.38
3,000,000 Garfunkelux Holdco 3 8.5% 01/11/2022 3,519,327 0.66
5,000,000 Mhp 6.25% 19/09/2029 4392074 0.83
30,300,000 Mitsubishi Ufj Investor (Series PRX) 15/12/2050 18,710,250 3.54
Mexico 68,565,937 12.96
200,000,000 Mex Bonos Desarr Fix Rights (Series M 20) 8.5% 31/05/2029 10,505,335 1.99
100,000,000 Mex Bonos Desarr Fix Rights (Series M) 7.75% 13/11/2042 4,990,974 0.94
293,030,000 Mex Bonos Desarr Fix Rights (Series M) 7.75% 29/05/2031 14,710,156 2.78
329,383,000 Petroleos Mexicanos (Series 14-2) 7.47% 12/11/2026 13,629,819 2.58

ALGEBRIS UCITS FUNDS PLC
Algebris Macro Credit Fund
Schedule of Investments (continued)
as at 31 December 2019
249
Holdings Financial Assets at Fair Value Through Profit or Loss Fair Value % of Net
EUR Asset Value
Fixed Income Securities (continued)
Mexico (continued)
10,000,000 Petroleos Mexicanos 2.75% 21/04/2027 9,599,950 1.81
350,000,000 Petroleos Mexicanos 7.19% 12/09/2024 15,129,703 2.86
Netherlands 8,084,075 1.53
500,000 Hema Bondco I 15/07/2022 406,908 0.08
800,000 Hema Bondco Ii Bv 8.5% 15/01/2023 375,020 0.07
1,500,000 Promontoria Holding 6.75% 15/08/2023 1,347,727 0.25
2,500,000 Promontoria Holding FRN 15/08/2023 2,207,425 0.42
3,500,000 Summer Bidco Bv 9% 17/11/2025 3,746,995 0.71
Portugal 24,357,425 4.60
11,400,000 Banco Comerc Portugues Perpetual 12,696,522 2.40
4,800,000 Caixa Geral De Depositos Perpetual 5,679,528 1.07
5,000,000 Obrigacoes Do Tesouro (Series 15Y) 2.25% 18/04/2034 5,981,375 1.13
Russian Federation 6,272,028 1.19
390,000,000 Russia Govt Bond - OFZ (Series 6027) 8.15% 03/02/2027 6,272,028 1.19
Spain 31,321,026 5.92
4,000,000 Abanca Corporation Bancaria VAR Perpetual 4,350,500 0.82
3,800,000 Banco Popular Espanol Perpetual - -
4,000,000 Banco Popular Espanol VAR 22/12/2019 180,000 0.03
8,600,000 Banco Popular Espanol VAR Perpetual - -
3,000,000 Banco Santander Perpetual (AR5470927 Corporation) 3,106,980 0.59
9,200,000 BPE Financiaciones 6.873% 22/10/2020 414,000 0.08
13,400,000 Caixabank Perpetual 13,721,131 2.59
9,000,000 Ibercaja Banco Perpetual 9,548,415 1.81
Suriname 708,170 0.13
1,000,000 Republic of Suriname 9.25% 26/10/2026 708,170 0.13
Turkey 1,797,270 0.34
6,000,000
International Finance Corporation (Series GMTN) 11%
03/02/2021 892,501 0.17
6,000,000
International Finance Corporation (Series GMTN) 20%
22/01/2020 904,769 0.17
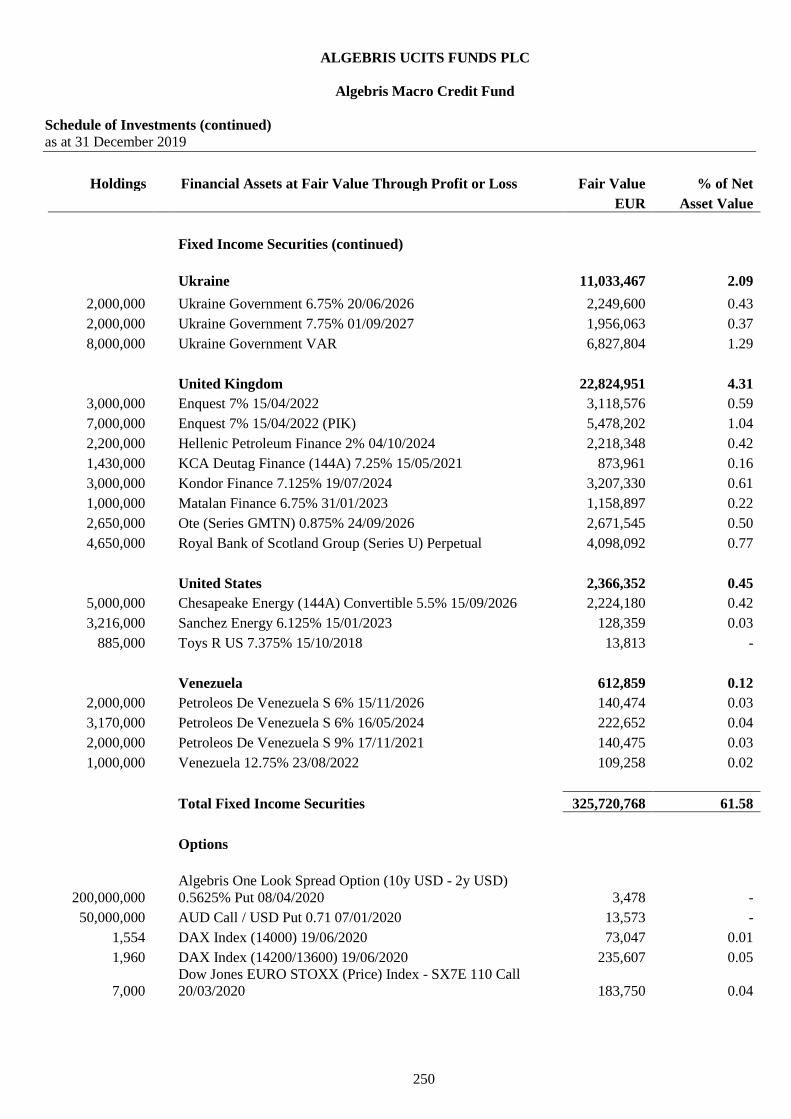
ALGEBRIS UCITS FUNDS PLC
Algebris Macro Credit Fund
Schedule of Investments (continued)
as at 31 December 2019
250
Holdings Financial Assets at Fair Value Through Profit or Loss Fair Value % of Net
EUR Asset Value
Fixed Income Securities (continued)
Ukraine 11,033,467 2.09
2,000,000 Ukraine Government 6.75% 20/06/2026 2,249,600 0.43
2,000,000 Ukraine Government 7.75% 01/09/2027 1,956,063 0.37
8,000,000 Ukraine Government VAR 6,827,804 1.29
United Kingdom 22,824,951 4.31
3,000,000 Enquest 7% 15/04/2022 3,118,576 0.59
7,000,000 Enquest 7% 15/04/2022 (PIK) 5,478,202 1.04
2,200,000 Hellenic Petroleum Finance 2% 04/10/2024 2,218,348 0.42
1,430,000 KCA Deutag Finance (144A) 7.25% 15/05/2021 873,961 0.16
3,000,000 Kondor Finance 7.125% 19/07/2024 3,207,330 0.61
1,000,000 Matalan Finance 6.75% 31/01/2023 1,158,897 0.22
2,650,000 Ote (Series GMTN) 0.875% 24/09/2026 2,671,545 0.50
4,650,000 Royal Bank of Scotland Group (Series U) Perpetual 4,098,092 0.77
United States 2,366,352 0.45
5,000,000 Chesapeake Energy (144A) Convertible 5.5% 15/09/2026 2,224,180 0.42
3,216,000 Sanchez Energy 6.125% 15/01/2023 128,359 0.03
885,000 Toys R US 7.375% 15/10/2018 13,813 -
Venezuela 612,859 0.12
2,000,000 Petroleos De Venezuela S 6% 15/11/2026 140,474 0.03
3,170,000 Petroleos De Venezuela S 6% 16/05/2024 222,652 0.04
2,000,000 Petroleos De Venezuela S 9% 17/11/2021 140,475 0.03
1,000,000 Venezuela 12.75% 23/08/2022 109,258 0.02
Total Fixed Income Securities 325,720,768 61.58
Options
200,000,000
Algebris One Look Spread Option (10y USD - 2y USD)
0.5625% Put 08/04/2020 3,478 -
50,000,000 AUD Call / USD Put 0.71 07/01/2020 13,573 -
1,554 DAX Index (14000) 19/06/2020 73,047 0.01
1,960 DAX Index (14200/13600) 19/06/2020 235,607 0.05
7,000
Dow Jones EURO STOXX (Price) Index - SX7E 110 Call
20/03/2020 183,750 0.04

ALGEBRIS UCITS FUNDS PLC
Algebris Macro Credit Fund
Schedule of Investments (continued)
as at 31 December 2019
251
Holdings Financial Assets at Fair Value Through Profit or Loss Fair Value % of Net
EUR Asset Value
Options (continued)
10,375
Dow Jones EURO STOXX (Price) Index - SX7E 115 Call
20/03/2020 116,719 0.02
221,000
Dow Jones EURO STOXX (Price) Index - SX7E
17/01/2020 Knock Out Option (105/120) 9,976 -
215,000
Dow Jones EURO STOXX (Price) Index - SX7E
19/06/2020 Knock Out Option (115/105) 106,104 0.02
323,241
Dow Jones EURO STOXX (Price) Index - SX7E
19/06/2020 Knock Out Option (120/107.5) 77,649 0.02
406,091
Dow Jones EURO STOXX (Price) Index - SX7E
21/02/2020 Knock Out Option (105/115) 154,237 0.03
2,661
Dow Jones EURO STOXX 50 (Price) Index 21/02/2020
Knock Out Option (3825/3990) 53,828 0.01
880
Dow Jones EURO STOXX 50 (Price) Index 3825 Call
17/01/2020 41,800 0.01
300
Dow Jones EURO STOXX 50 (Price) Index 3850 Call
17/01/2020 6,300 -
250
Dow Jones EURO STOXX 50 (Price) Index 3925 Call
21/02/2020 13,000 -
500 Euro-BTP Future Mar 20 138 Put 24/01/2020 87,500 0.02
500 Euro-Bund Future Mar 20 168.5 Put 21/02/2020 247,500 0.05
600 Euro-Bund Future Mar 20 169.5 Put 24/01/2020 261,000 0.05
4,061 FTSE 100 Index 7700 Call 20/03/2020 261,019 0.05
118,343 iShares MSCI Emerging Markets ETF 17/01/2020 175,995 0.03
449,439
iShares MSCI Emerging Markets ETF 21/02/2020 Knock
Out Option (47/49) 76,456 0.02
449,439
iShares MSCI Emerging Markets ETF 21/02/2020 Knock
Out Option (47/50) 51,596 0.01
5,000
iShares MSCI Emerging Markets ETF 45.73 Call
17/01/2020 100,339 0.02
4,500
iShares MSCI Emerging Markets ETF 45.73 Call
20/03/2020 401,356 0.08
50,000,000
iTraxx Europe Crossover Index Series 32 Ver 1 5 Yr Credit
Default Swap Index 5% 20/12/2024 3.25% Put 19/02/2020 18,225 -
20,000,000 RUB Call / USD Put 62.5 19/06/2020 269,367 0.05
8,164 S&P 500 Index 17/01/2020 217,531 0.04
8,000 S&P 500 Index 20/03/2020 79,205 0.01
7,751 S&P 500 Index 20/03/2020 Knock Out Option (3400/3600) 51,187 0.01
18,600 S&P 500 Index 21/02/2020 Knock Out Option (3375/3600) 78,087 0.02
100 S&P 500 Index 2900 Put 21/02/2020 101,231 0.02
34 S&P 500 Index 3205 Call 17/01/2020 122,512 0.02
30 S&P 500 Index 3250 Call 17/01/2020 42,142 0.01
500 US 10YR Note (CBT) Future Mar 20 125.5 Put 24/01/2020 10,453 -
500 US 10YR Note (CBT) Future Mar 20 127 Put 21/02/2020 118,456 0.02
1,100 US Long Bond (CBT) Future Mar 20 150 Put 24/01/2020 68,985 0.01
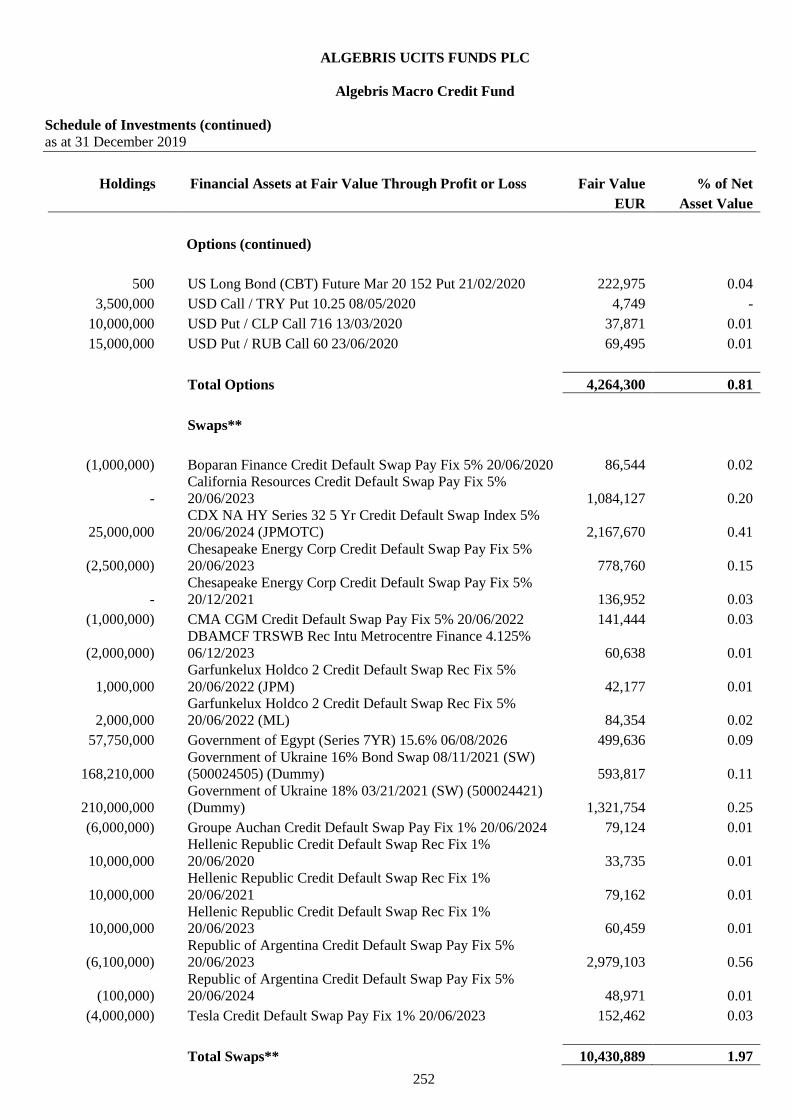
ALGEBRIS UCITS FUNDS PLC
Algebris Macro Credit Fund
Schedule of Investments (continued)
as at 31 December 2019
252
Holdings Financial Assets at Fair Value Through Profit or Loss Fair Value % of Net
EUR Asset Value
Options (continued)
500 US Long Bond (CBT) Future Mar 20 152 Put 21/02/2020 222,975 0.04
3,500,000 USD Call / TRY Put 10.25 08/05/2020 4,749 -
10,000,000 USD Put / CLP Call 716 13/03/2020 37,871 0.01
15,000,000 USD Put / RUB Call 60 23/06/2020 69,495 0.01
Total Options 4,264,300 0.81
Swaps**
(1,000,000) Boparan Finance Credit Default Swap Pay Fix 5% 20/06/2020 86,544 0.02
-
California Resources Credit Default Swap Pay Fix 5%
20/06/2023 1,084,127 0.20
25,000,000
CDX NA HY Series 32 5 Yr Credit Default Swap Index 5%
20/06/2024 (JPMOTC) 2,167,670 0.41
(2,500,000)
Chesapeake Energy Corp Credit Default Swap Pay Fix 5%
20/06/2023 778,760 0.15
-
Chesapeake Energy Corp Credit Default Swap Pay Fix 5%
20/12/2021 136,952 0.03
(1,000,000) CMA CGM Credit Default Swap Pay Fix 5% 20/06/2022 141,444 0.03
(2,000,000)
DBAMCF TRSWB Rec Intu Metrocentre Finance 4.125%
06/12/2023 60,638 0.01
1,000,000
Garfunkelux Holdco 2 Credit Default Swap Rec Fix 5%
20/06/2022 (JPM) 42,177 0.01
2,000,000
Garfunkelux Holdco 2 Credit Default Swap Rec Fix 5%
20/06/2022 (ML) 84,354 0.02
57,750,000 Government of Egypt (Series 7YR) 15.6% 06/08/2026 499,636 0.09
168,210,000
Government of Ukraine 16% Bond Swap 08/11/2021 (SW)
(500024505) (Dummy) 593,817 0.11
210,000,000
Government of Ukraine 18% 03/21/2021 (SW) (500024421)
(Dummy) 1,321,754 0.25
(6,000,000) Groupe Auchan Credit Default Swap Pay Fix 1% 20/06/2024 79,124 0.01
10,000,000
Hellenic Republic Credit Default Swap Rec Fix 1%
20/06/2020 33,735 0.01
10,000,000
Hellenic Republic Credit Default Swap Rec Fix 1%
20/06/2021 79,162 0.01
10,000,000
Hellenic Republic Credit Default Swap Rec Fix 1%
20/06/2023 60,459 0.01
(6,100,000)
Republic of Argentina Credit Default Swap Pay Fix 5%
20/06/2023 2,979,103 0.56
(100,000)
Republic of Argentina Credit Default Swap Pay Fix 5%
20/06/2024 48,971 0.01
(4,000,000) Tesla Credit Default Swap Pay Fix 1% 20/06/2023 152,462 0.03
Total Swaps** 10,430,889 1.97

ALGEBRIS UCITS FUNDS PLC
Algebris Macro Credit Fund
Schedule of Investments (continued)
as at 31 December 2019
253
Holdings Financial Assets at Fair Value Through Profit or Loss Fair Value % of Net
EUR Asset Value
Swaptions
30,000,000 DBAMCF SWPO 02/06/2020 (GSOTC) 140,087 0.03
10,000,000 DBAMCF SWPO 02/07/2020 (BARC) 523 -
50,000,000 DBAMCF SWPO 02/07/2020 (BNPOTC) 2,614 -
80,000,000 DBAMCF SWPO 02/07/2020 (GS) 254 -
Total Swaptions 143,478 0.03
Forward Contracts*
Buy EUR 47,500,392 Sell USD 53,067,728 15/01/2020 208,781 0.04
Buy RUB 424,000,000 Sell EUR 5,956,688 01/09/2020 137,252 0.03
Buy EUR 12,889,150 Sell GBP 10,781,300 15/01/2020 135,622 0.03
Buy EUR 35,698,052 Sell MXN 758,899,900 15/01/2020 52,204 0.01
Buy EUR 1,079,545 Sell GBP 903,000 15/01/2020 11,359 -
Buy AUD 1,211,000 Sell EUR 747,760 15/01/2020 9,972 -
Buy EUR 640,974 Sell USD 716,100 15/01/2020 2,817 -
Buy CHF 337,000 Sell EUR 307,763 15/01/2020 2,778 -
Buy AUD 307,000 Sell EUR 189,404 15/01/2020 2,688 -
Buy AUD 189,000 Sell EUR 115,719 15/01/2020 2,539 -
Buy EUR 143,662 Sell USD 159,500 15/01/2020 1,523 -
Buy AUD 246,000 Sell EUR 152,962 15/01/2020 962 -
Buy EUR 93,435 Sell SEK 974,000 15/01/2020 675 -
Buy EUR 77,637 Sell SEK 811,000 15/01/2020 401 -
Buy CHF 25,700 Sell EUR 23,470 15/01/2020 212 -
Buy GBP 10,000 Sell EUR 11,664 15/01/2020 166 -
Buy AUD 192,000 Sell EUR 120,024 15/01/2020 112 -
Buy GBP 10,000 Sell EUR 11,771 15/01/2020 59 -
Buy CHF 2,200 Sell EUR 2,009 15/01/2020 18 -
Buy GBP 1,000 Sell EUR 1,169 15/01/2020 13 -
Buy JPY 641,200 Sell EUR 5,256 15/01/2020 9 -
Buy GBP 200 Sell EUR 234 15/01/2020 3 -
Buy GBP 200 Sell EUR 234 15/01/2020 3 -
Buy GBP 400 Sell EUR 471 15/01/2020 2 -
Buy GBP 100 Sell EUR 117 15/01/2020 2 -
Buy CHF 100 Sell EUR 91 15/01/2020 1 -
Buy GBP 200 Sell EUR 235 15/01/2020 1 -
Buy GBP 100 Sell EUR 117 15/01/2020 1 -
Buy JPY 4,300 Sell EUR 35 15/01/2020 - -

ALGEBRIS UCITS FUNDS PLC
Algebris Macro Credit Fund
Schedule of Investments (continued)
as at 31 December 2019
254
Holdings Financial Assets at Fair Value Through Profit or Loss Fair Value % of Net
EUR Asset Value
Total Forward Contracts* 570,175 0.11
Total Financial Assets at Fair Value Through Profit or Loss 343,293,734 64.91
Financial Liabilities at Fair Value Through Profit or Loss
Repurchase Agreements
1,000,000
Cooperativa Muratori & C 6.875% 01/08/2022 (Repo Rate: -
(2.5%) @ 6.175) (37,027) (0.01)
2,000,000
Garfunkelux Holdco 3 7.5% 01/08/2022 (Repo Rate -(2.5%) @
96.7916663) (1,833,104) (0.34)
Total Repurchase Agreements (1,870,131) (0.35)
Options
(1)
Dow Jones EURO STOXX 50 (Price) Index 3700 Call
17/01/2020 (635) -
(500) Euro-BTP Future Mar 20 144.5 Call 24/01/2020 (175,000) (0.03)
(500) Euro-Bund Future Mar 20 173.5 Call 21/02/2020 (117,500) (0.02)
(5,000) iShares MSCI Emerging Markets ETF 39.73 Put 17/01/2020 (4,460) -
(4,500) iShares MSCI Emerging Markets ETF 43 Put 20/03/2020 (294,996) (0.06)
(50,000,000)
iTraxx Europe Crossover Index Series 32 Ver 1 5 Yr Credit
Default Swap Index 5% 20/12/2024 Call 15/01/2020 (441,808) (0.08)
(50,000,000)
iTraxx Europe Crossover Index Series 32 Ver 1 5 Yr Credit
Default Swap Index 5% 20/12/2024 Call 19/02/2020 (252,224) (0.05)
(100) S&P 500 Index 2600 Put 21/02/2020 (24,527) (0.01)
(500) US 10YR Note (CBT) Future Mar 20 129.5 Call 21/02/2020 (163,749) (0.03)
(500) US Long Bond (CBT) Future Mar 20 159 Call 21/02/2020 (306,591) (0.06)
(10,000,000) USD Call / CLP Put 855 13/03/2020 (6,488) -
- USD Call / RUB Put 70 06/23/2020 (500024681) (56,582) (0.01)
Total Options (1,844,560) (0.35)
Swaps**
3,000,000 Barclays Credit Default Swap Rec Fix 1% 20/12/2024 (7,573) -
2,000,000
California Resources Credit Default Swap Rec Fix 5%
20/06/2023 (1,084,127) (0.20)
(25,000,000)
CDX NA HY Series 32 5 Yr Credit Default Swap Index 5%
20/06/2024 (2,167,670) (0.41)
(25,000,000)
CDX NA HY Series 33 5 Yr Credit Default Swap Index 5%
20/12/2024 (2,132,822) (0.40)
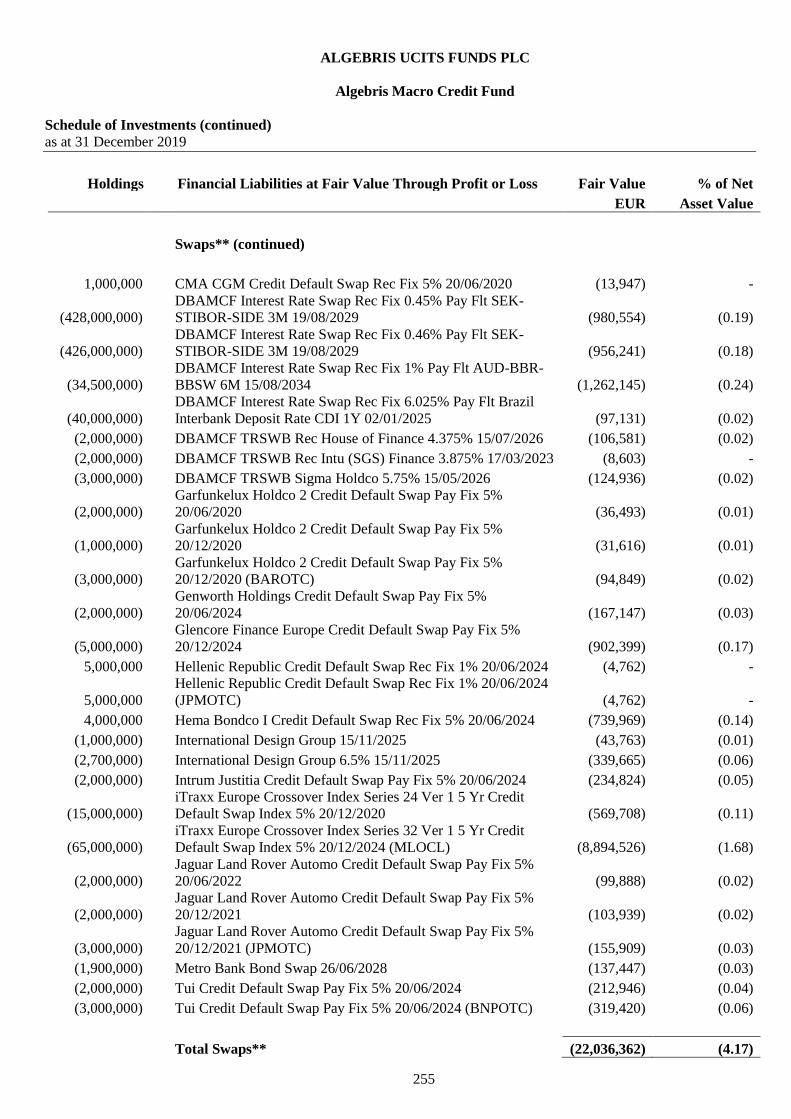
ALGEBRIS UCITS FUNDS PLC
Algebris Macro Credit Fund
Schedule of Investments (continued)
as at 31 December 2019
255
Holdings Financial Liabilities at Fair Value Through Profit or Loss Fair Value % of Net
EUR Asset Value
Swaps** (continued)
1,000,000 CMA CGM Credit Default Swap Rec Fix 5% 20/06/2020 (13,947) -
(428,000,000)
DBAMCF Interest Rate Swap Rec Fix 0.45% Pay Flt SEK-
STIBOR-SIDE 3M 19/08/2029 (980,554) (0.19)
(426,000,000)
DBAMCF Interest Rate Swap Rec Fix 0.46% Pay Flt SEK-
STIBOR-SIDE 3M 19/08/2029 (956,241) (0.18)
(34,500,000)
DBAMCF Interest Rate Swap Rec Fix 1% Pay Flt AUD-BBR-
BBSW 6M 15/08/2034 (1,262,145) (0.24)
(40,000,000)
DBAMCF Interest Rate Swap Rec Fix 6.025% Pay Flt Brazil
Interbank Deposit Rate CDI 1Y 02/01/2025 (97,131) (0.02)
(2,000,000) DBAMCF TRSWB Rec House of Finance 4.375% 15/07/2026 (106,581) (0.02)
(2,000,000) DBAMCF TRSWB Rec Intu (SGS) Finance 3.875% 17/03/2023 (8,603) -
(3,000,000) DBAMCF TRSWB Sigma Holdco 5.75% 15/05/2026 (124,936) (0.02)
(2,000,000)
Garfunkelux Holdco 2 Credit Default Swap Pay Fix 5%
20/06/2020 (36,493) (0.01)
(1,000,000)
Garfunkelux Holdco 2 Credit Default Swap Pay Fix 5%
20/12/2020 (31,616) (0.01)
(3,000,000)
Garfunkelux Holdco 2 Credit Default Swap Pay Fix 5%
20/12/2020 (BAROTC) (94,849) (0.02)
(2,000,000)
Genworth Holdings Credit Default Swap Pay Fix 5%
20/06/2024 (167,147) (0.03)
(5,000,000)
Glencore Finance Europe Credit Default Swap Pay Fix 5%
20/12/2024 (902,399) (0.17)
5,000,000 Hellenic Republic Credit Default Swap Rec Fix 1% 20/06/2024 (4,762) -
5,000,000
Hellenic Republic Credit Default Swap Rec Fix 1% 20/06/2024
(JPMOTC) (4,762) -
4,000,000 Hema Bondco I Credit Default Swap Rec Fix 5% 20/06/2024 (739,969) (0.14)
(1,000,000) International Design Group 15/11/2025 (43,763) (0.01)
(2,700,000) International Design Group 6.5% 15/11/2025 (339,665) (0.06)
(2,000,000) Intrum Justitia Credit Default Swap Pay Fix 5% 20/06/2024 (234,824) (0.05)
(15,000,000)
iTraxx Europe Crossover Index Series 24 Ver 1 5 Yr Credit
Default Swap Index 5% 20/12/2020 (569,708) (0.11)
(65,000,000)
iTraxx Europe Crossover Index Series 32 Ver 1 5 Yr Credit
Default Swap Index 5% 20/12/2024 (MLOCL) (8,894,526) (1.68)
(2,000,000)
Jaguar Land Rover Automo Credit Default Swap Pay Fix 5%
20/06/2022 (99,888) (0.02)
(2,000,000)
Jaguar Land Rover Automo Credit Default Swap Pay Fix 5%
20/12/2021 (103,939) (0.02)
(3,000,000)
Jaguar Land Rover Automo Credit Default Swap Pay Fix 5%
20/12/2021 (JPMOTC) (155,909) (0.03)
(1,900,000) Metro Bank Bond Swap 26/06/2028 (137,447) (0.03)
(2,000,000) Tui Credit Default Swap Pay Fix 5% 20/06/2024 (212,946) (0.04)
(3,000,000) Tui Credit Default Swap Pay Fix 5% 20/06/2024 (BNPOTC) (319,420) (0.06)
Total Swaps** (22,036,362) (4.17)
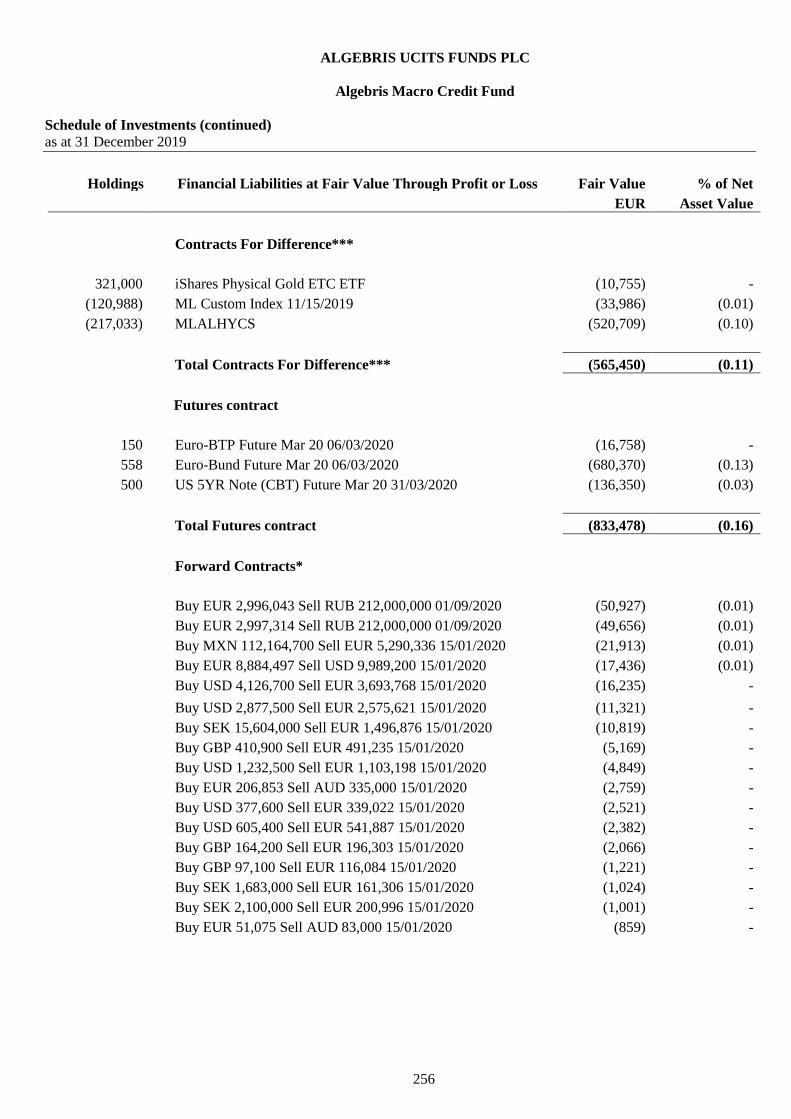
ALGEBRIS UCITS FUNDS PLC
Algebris Macro Credit Fund
Schedule of Investments (continued)
as at 31 December 2019
256
Holdings Financial Liabilities at Fair Value Through Profit or Loss Fair Value % of Net
EUR Asset Value
Contracts For Difference***
321,000 iShares Physical Gold ETC ETF (10,755) -
(120,988) ML Custom Index 11/15/2019 (33,986) (0.01)
(217,033) MLALHYCS (520,709) (0.10)
Total Contracts For Difference*** (565,450) (0.11)
Futures contract
150 Euro-BTP Future Mar 20 06/03/2020 (16,758) -
558 Euro-Bund Future Mar 20 06/03/2020 (680,370) (0.13)
500 US 5YR Note (CBT) Future Mar 20 31/03/2020 (136,350) (0.03)
Total Futures contract (833,478) (0.16)
Forward Contracts*
Buy EUR 2,996,043 Sell RUB 212,000,000 01/09/2020 (50,927) (0.01)
Buy EUR 2,997,314 Sell RUB 212,000,000 01/09/2020 (49,656) (0.01)
Buy MXN 112,164,700 Sell EUR 5,290,336 15/01/2020 (21,913) (0.01)
Buy EUR 8,884,497 Sell USD 9,989,200 15/01/2020 (17,436) (0.01)
Buy USD 4,126,700 Sell EUR 3,693,768 15/01/2020 (16,235) -
Buy USD 2,877,500 Sell EUR 2,575,621 15/01/2020 (11,321) -
Buy SEK 15,604,000 Sell EUR 1,496,876 15/01/2020 (10,819) -
Buy GBP 410,900 Sell EUR 491,235 15/01/2020 (5,169) -
Buy USD 1,232,500 Sell EUR 1,103,198 15/01/2020 (4,849) -
Buy EUR 206,853 Sell AUD 335,000 15/01/2020 (2,759) -
Buy USD 377,600 Sell EUR 339,022 15/01/2020 (2,521) -
Buy USD 605,400 Sell EUR 541,887 15/01/2020 (2,382) -
Buy GBP 164,200 Sell EUR 196,303 15/01/2020 (2,066) -
Buy GBP 97,100 Sell EUR 116,084 15/01/2020 (1,221) -
Buy SEK 1,683,000 Sell EUR 161,306 15/01/2020 (1,024) -
Buy SEK 2,100,000 Sell EUR 200,996 15/01/2020 (1,001) -
Buy EUR 51,075 Sell AUD 83,000 15/01/2020 (859) -
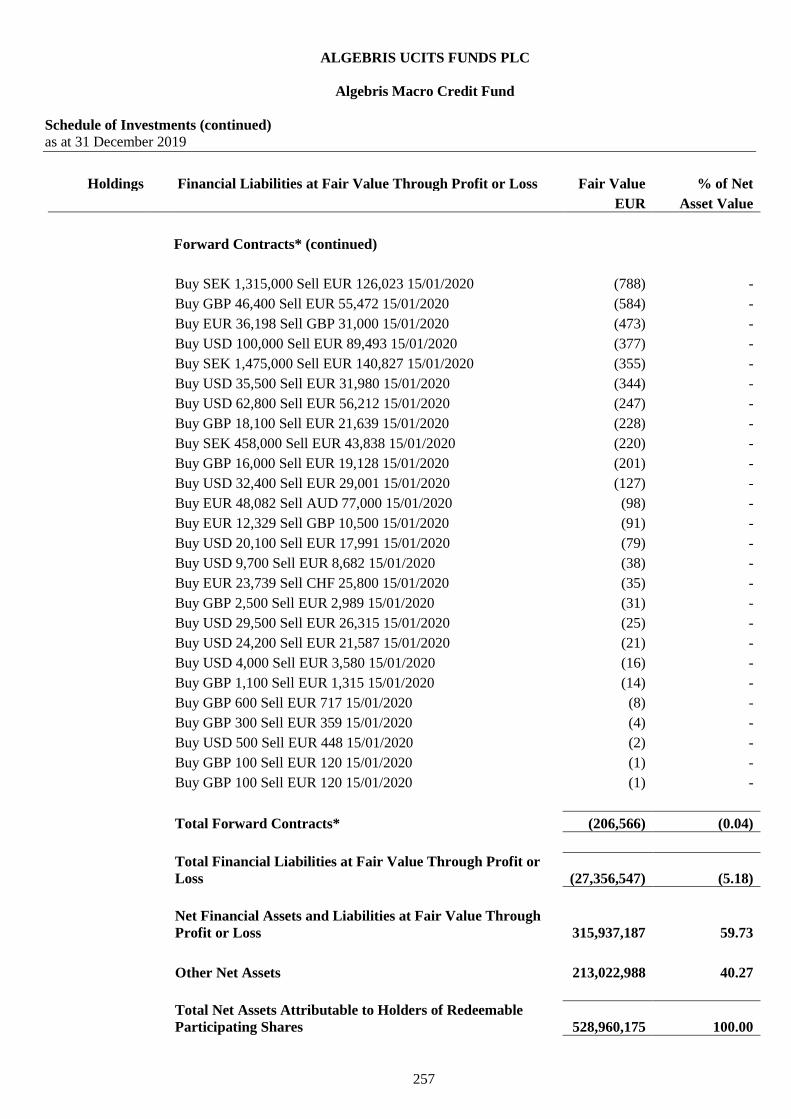
ALGEBRIS UCITS FUNDS PLC
Algebris Macro Credit Fund
Schedule of Investments (continued)
as at 31 December 2019
257
Holdings Financial Liabilities at Fair Value Through Profit or Loss Fair Value % of Net
EUR Asset Value
Forward Contracts* (continued)
Buy SEK 1,315,000 Sell EUR 126,023 15/01/2020 (788) -
Buy GBP 46,400 Sell EUR 55,472 15/01/2020 (584) -
Buy EUR 36,198 Sell GBP 31,000 15/01/2020 (473) -
Buy USD 100,000 Sell EUR 89,493 15/01/2020 (377) -
Buy SEK 1,475,000 Sell EUR 140,827 15/01/2020 (355) -
Buy USD 35,500 Sell EUR 31,980 15/01/2020 (344) -
Buy USD 62,800 Sell EUR 56,212 15/01/2020 (247) -
Buy GBP 18,100 Sell EUR 21,639 15/01/2020 (228) -
Buy SEK 458,000 Sell EUR 43,838 15/01/2020 (220) -
Buy GBP 16,000 Sell EUR 19,128 15/01/2020 (201) -
Buy USD 32,400 Sell EUR 29,001 15/01/2020 (127) -
Buy EUR 48,082 Sell AUD 77,000 15/01/2020 (98) -
Buy EUR 12,329 Sell GBP 10,500 15/01/2020 (91) -
Buy USD 20,100 Sell EUR 17,991 15/01/2020 (79) -
Buy USD 9,700 Sell EUR 8,682 15/01/2020 (38) -
Buy EUR 23,739 Sell CHF 25,800 15/01/2020 (35) -
Buy GBP 2,500 Sell EUR 2,989 15/01/2020 (31) -
Buy USD 29,500 Sell EUR 26,315 15/01/2020 (25) -
Buy USD 24,200 Sell EUR 21,587 15/01/2020 (21) -
Buy USD 4,000 Sell EUR 3,580 15/01/2020 (16) -
Buy GBP 1,100 Sell EUR 1,315 15/01/2020 (14) -
Buy GBP 600 Sell EUR 717 15/01/2020 (8) -
Buy GBP 300 Sell EUR 359 15/01/2020 (4) -
Buy USD 500 Sell EUR 448 15/01/2020 (2) -
Buy GBP 100 Sell EUR 120 15/01/2020 (1) -
Buy GBP 100 Sell EUR 120 15/01/2020 (1) -
Total Forward Contracts* (206,566) (0.04)
Total Financial Liabilities at Fair Value Through Profit or
Loss (27,356,547) (5.18)
Net Financial Assets and Liabilities at Fair Value Through
Profit or Loss
315,937,187 59.73
Other Net Assets 213,022,988 40.27
Total Net Assets Attributable to Holders of Redeemable
Participating Shares
528,960,175 100.00
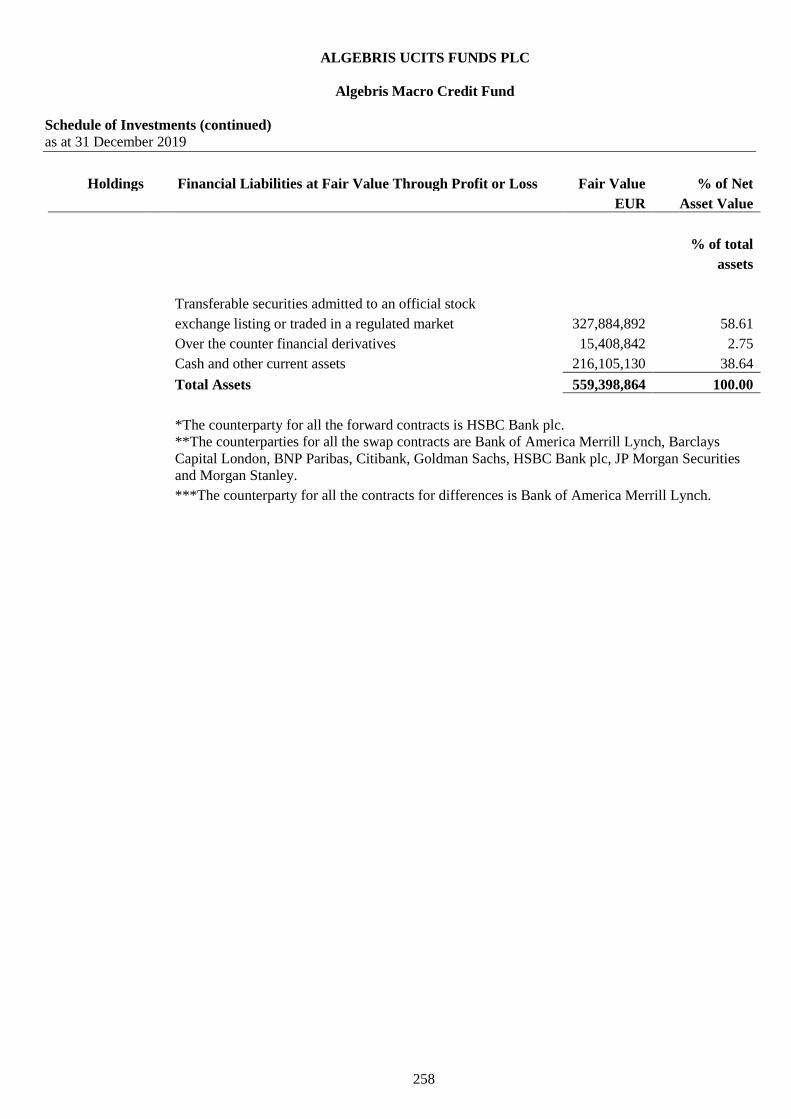
ALGEBRIS UCITS FUNDS PLC
Algebris Macro Credit Fund
Schedule of Investments (continued)
as at 31 December 2019
258
Holdings Financial Liabilities at Fair Value Through Profit or Loss Fair Value % of Net
EUR Asset Value
% of total
assets
Transferable securities admitted to an official stock
exchange listing or traded in a regulated market 327,884,892 58.61
Over the counter financial derivatives 15,408,842 2.75
Cash and other current assets 216,105,130 38.64
Total Assets 559,398,864 100.00
*The counterparty for all the forward contracts is HSBC Bank plc.
**The counterparties for all the swap contracts are Bank of America Merrill Lynch, Barclays
Capital London, BNP Paribas, Citibank, Goldman Sachs, HSBC Bank plc, JP Morgan Securities
and Morgan Stanley.
***The counterparty for all the contracts for differences is Bank of America Merrill Lynch.
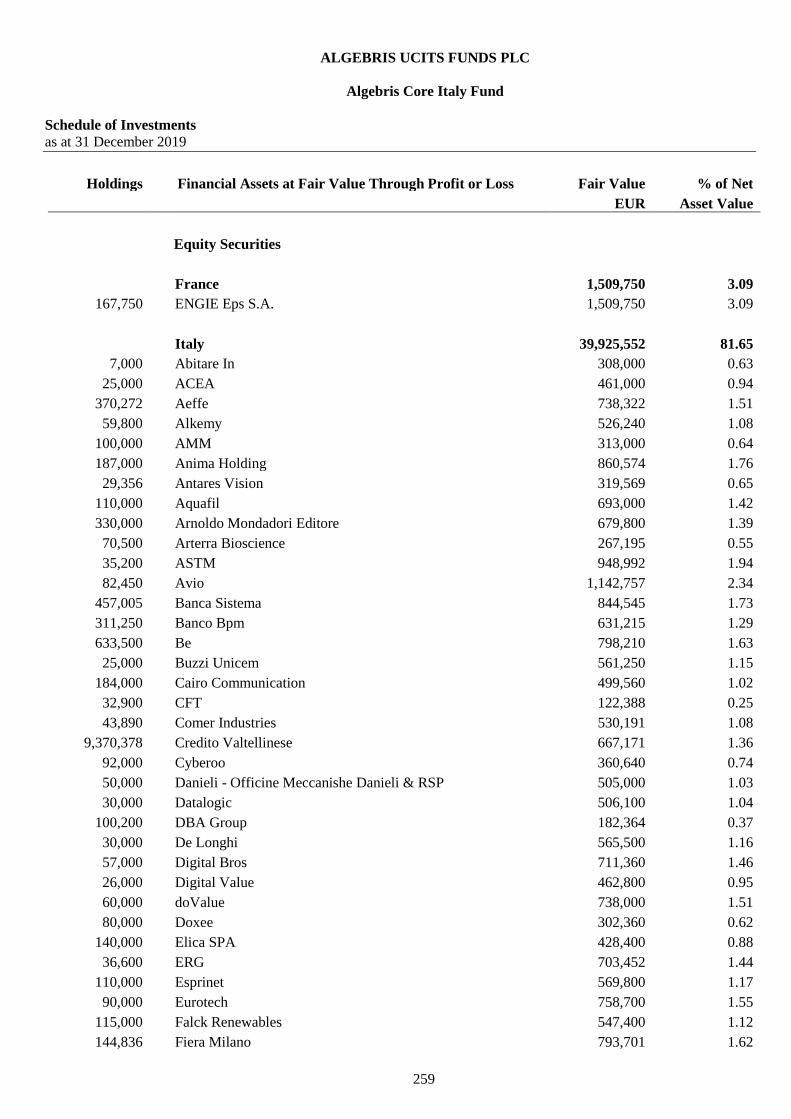
ALGEBRIS UCITS FUNDS PLC
Algebris Core Italy Fund
Schedule of Investments
as at 31 December 2019
259
Holdings Financial Assets at Fair Value Through Profit or Loss Fair Value % of Net
EUR Asset Value
Equity Securities
France 1,509,750 3.09
167,750 ENGIE Eps S.A. 1,509,750 3.09
Italy 39,925,552 81.65
7,000 Abitare In 308,000 0.63
25,000 ACEA 461,000 0.94
370,272 Aeffe 738,322 1.51
59,800 Alkemy 526,240 1.08
100,000 AMM 313,000 0.64
187,000 Anima Holding 860,574 1.76
29,356 Antares Vision 319,569 0.65
110,000 Aquafil 693,000 1.42
330,000 Arnoldo Mondadori Editore 679,800 1.39
70,500 Arterra Bioscience 267,195 0.55
35,200 ASTM 948,992 1.94
82,450 Avio 1,142,757 2.34
457,005 Banca Sistema 844,545 1.73
311,250 Banco Bpm 631,215 1.29
633,500 Be 798,210 1.63
25,000 Buzzi Unicem 561,250 1.15
184,000 Cairo Communication 499,560 1.02
32,900 CFT 122,388 0.25
43,890 Comer Industries 530,191 1.08
9,370,378 Credito Valtellinese 667,171 1.36
92,000 Cyberoo 360,640 0.74
50,000 Danieli - Officine Meccanishe Danieli & RSP 505,000 1.03
30,000 Datalogic 506,100 1.04
100,200 DBA Group 182,364 0.37
30,000 De Longhi 565,500 1.16
57,000 Digital Bros 711,360 1.46
26,000 Digital Value 462,800 0.95
60,000 doValue 738,000 1.51
80,000 Doxee 302,360 0.62
140,000 Elica SPA 428,400 0.88
36,600 ERG 703,452 1.44
110,000 Esprinet 569,800 1.17
90,000 Eurotech 758,700 1.55
115,000 Falck Renewables 547,400 1.12
144,836 Fiera Milano 793,701 1.62

ALGEBRIS UCITS FUNDS PLC
Algebris Core Italy Fund
Schedule of Investments (continued)
as at 31 December 2019
260
Holdings Financial Assets at Fair Value Through Profit or Loss Fair Value % of Net
EUR Asset Value
Equity Securities (continued)
Italy (continued)
34,900 Finlogic 219,870 0.45
100,500 FOS 320,595 0.66
21,800 Gabelli Value For Italy 212,550 0.43
149,300 Garofalo Health Care 859,968 1.76
26,000 Gibus 158,600 0.32
60,000 Gismondi 1754 202,800 0.41
35,000 Guala Closures 254,800 0.52
220,000 H-Farm 75,020 0.15
20,000 IDeaMI 198,000 0.41
10,000 Indel B 217,000 0.44
87,500 Intred 490,000 1.00
173,941 Iren 480,425 0.98
17,850 Italian Wine Brands 227,588 0.47
112,000 Leonardo 1,170,400 2.39
56,200 LU-VE 719,360 1.47
59,280 MailUp 280,394 0.57
54,500 Marzocchi Pompe 258,875 0.53
12,000 Moncler 480,840 0.98
40,000 Neodecortech 139,200 0.28
20,000 Neosperience 158,800 0.32
94,736 NET Insurance 497,364 1.02
98,000 Newlat Food 591,920 1.21
61,000 Nvp Srl 224,480 0.46
360,000 OVS 722,160 1.48
50,202 Pattern 223,399 0.46
13,900 Pharmanutra 325,260 0.67
220,199 Piquadro Spa 543,892 1.11
50,000 Poste Italiane 506,000 1.03
50,000 Powersoft 247,000 0.51
179,832 RAI Way 1,102,370 2.25
8,000 Reply 555,600 1.14
20,000 Sabaf 268,000 0.55
17,440 SAES Getters 529,304 1.08
625,000 Salini Impregilo 1,003,125 2.05
250,000 SEC 128,702 0.26
40,000 Sol 420,000 0.86
17,100 Somec 430,920 0.88
70,300 Tamburi Investment Partners 479,446 0.98

ALGEBRIS UCITS FUNDS PLC
Algebris Core Italy Fund
Schedule of Investments (continued)
as at 31 December 2019
261
Holdings Financial Assets at Fair Value Through Profit or Loss Fair Value % of Net
EUR Asset Value
Equity Securities (continued)
Italy (continued)
40,000 Techedge 198,800 0.41
22,000 Technogym 254,980 0.52
800,000 Telecom Italia/Milano 445,120 0.91
25,000 Thespac 242,500 0.50
45,491 Tinexta 527,696 1.08
230,000 Triboo 350,750 0.72
65,000 UniCredit 846,300 1.73
36,900 Unieuro 494,460 1.01
20,000 VEI 1 196,000 0.40
25,405 Vetrya 116,863 0.24
130,000 Websolute 279,500 0.57
Netherlands 570,747 1.17
84,882 Cementir Holding 570,747 1.17
United Kingdom 2,245,785 4.59
1,205,614 Telit Communications 2,245,785 4.59
Total Equity Securities 44,251,834 90.50
Fixed Income Securities
Argentina 100,177 0.20
250,000 Provincia De Buenos Aire 15/05/2035 100,177 0.20
Italy 961,789 1.97
300,000 Banca Monte Dei Paschi VAR 18/01/2028 236,245 0.48
500,000 Cooperativa Muratori & C 6% 15/02/2023 17,693 0.04
500,000 Cooperativa Muratori & C 6.875% 01/08/2022 14,863 0.03
400,000 Credito Valtellinese 4.7% 04/08/2021 413,310 0.85
275,333 Gamenet Group 27/04/2023 279,678 0.57

ALGEBRIS UCITS FUNDS PLC
Algebris Core Italy Fund
Schedule of Investments (continued)
as at 31 December 2019
262
Holdings Financial Assets at Fair Value Through Profit or Loss Fair Value % of Net
EUR Asset Value
Fixed Income Securities (continued)
Luxembourg 1,222,720 2.50
Mitsubishi Ufj Investor (Series PRX) 15/12/2050 1,222,720 2.50
Total Fixed Income Securities 2,284,686 4.67
Equity Warrants
8428 Antares Vision 19/04/2024 8403 0.02
24000 Arterra Bioscience 28/10/2022 27600 0.06
8750 Askoll Eva 31/12/2021 595 -
3420 CFT 28/06/2022 718 -
46000 Cyberoo 16/10/2023 46460 0.10
16700 DBA Group 07/01/2021 1336 -
80000 Doxee 15/12/2022 12952 0.03
20000 ELES Semiconductor Equipment 31/07/2024 25600 0.05
8250 ELES Semiconductor Equipment 31/12/2099 15840 0.03
29812 FOS 30/09/2022 20570 0.04
3000 Gabelli Value For Italy 19/04/2023 1050 -
15000 Gismondi 1754 31/10/2022 6315 0.01
2400 Guala Closures 21/12/2023 480 -
20000 Illa 15/10/2020 1840 -
15000 Maps 28/06/2024 20097 0.04
20089 Matica Fintec 30/11/2022 2009 0.01
18410 NET Insurance 21/05/2023 26809 0.06
25000 Powersoft 15/10/2021 19250 0.04
5000 Salcef 11/08/2024 4906 0.01
142000 Sciuker Frames 31/05/2021 17253 0.04
18000 Sostravel 15/07/2021 4212 0.01
5000 Thespac 11/07/2023 1499 -
6000 VEI 1 27/02/2023 869 -
120000 Websolute 30/11/2022 15480 0.03
Total Equity Warrants 282,143 0.58
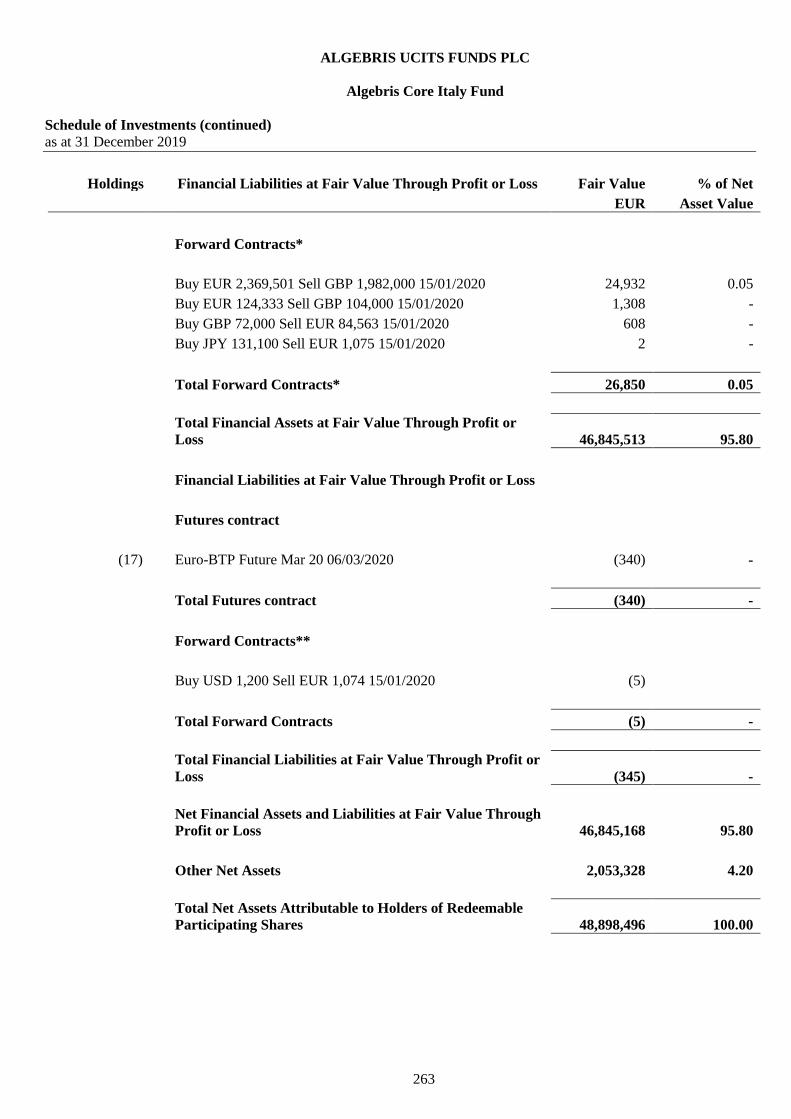
ALGEBRIS UCITS FUNDS PLC
Algebris Core Italy Fund
Schedule of Investments (continued)
as at 31 December 2019
263
Holdings Financial Liabilities at Fair Value Through Profit or Loss Fair Value % of Net
EUR Asset Value
Forward Contracts*
Buy EUR 2,369,501 Sell GBP 1,982,000 15/01/2020 24,932 0.05
Buy EUR 124,333 Sell GBP 104,000 15/01/2020 1,308 -
Buy GBP 72,000 Sell EUR 84,563 15/01/2020 608 -
Buy JPY 131,100 Sell EUR 1,075 15/01/2020 2 -
Total Forward Contracts* 26,850 0.05
Total Financial Assets at Fair Value Through Profit or
Loss 46,845,513 95.80
Financial Liabilities at Fair Value Through Profit or Loss
Futures contract
(17) Euro-BTP Future Mar 20 06/03/2020 (340) -
Total Futures contract (340) -
Forward Contracts**
Buy USD 1,200 Sell EUR 1,074 15/01/2020 (5)
Total Forward Contracts (5) -
Total Financial Liabilities at Fair Value Through Profit or
Loss (345) -
Net Financial Assets and Liabilities at Fair Value Through
Profit or Loss 46,845,168 95.80
Other Net Assets 2,053,328 4.20
Total Net Assets Attributable to Holders of Redeemable
Participating Shares 48,898,496 100.00

ALGEBRIS UCITS FUNDS PLC
Algebris Core Italy Fund
Schedule of Investments (continued)
as at 31 December 2019
264
Holdings Financial Liabilities at Fair Value Through Profit or Loss Fair Value % of Net
EUR Asset Value
% of total
assets
Transferable securities admitted to an official stock
exchange listing or traded in a regulated market 46,536,520 95.06
Over the counter financial derivatives 308,993 0.63
Cash and other current assets 2,109,168 4.31
Total Assets 48,954,681 100.00
*The counterparty for all the forward contracts is HSBC Bank plc.
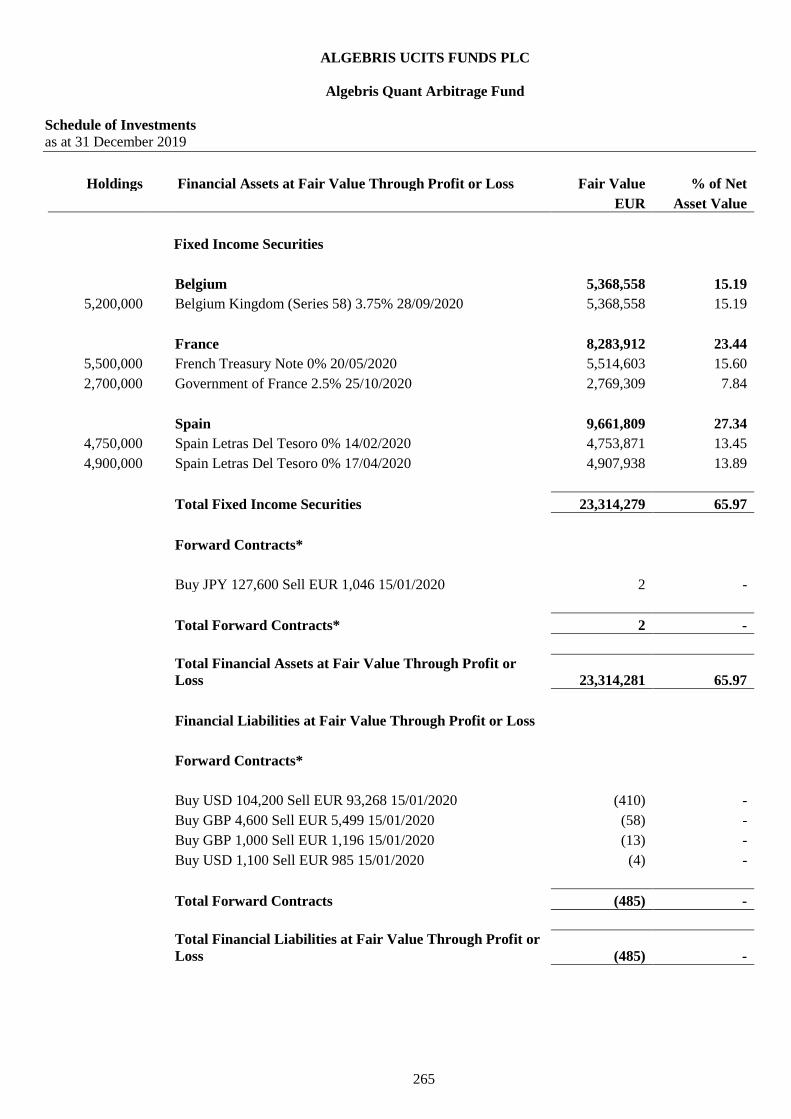
ALGEBRIS UCITS FUNDS PLC
Algebris Quant Arbitrage Fund
Schedule of Investments
as at 31 December 2019
265
Holdings Financial Assets at Fair Value Through Profit or Loss Fair Value % of Net
EUR Asset Value
Fixed Income Securities
Belgium 5,368,558 15.19
5,200,000 Belgium Kingdom (Series 58) 3.75% 28/09/2020 5,368,558 15.19
France 8,283,912 23.44
5,500,000 French Treasury Note 0% 20/05/2020 5,514,603 15.60
2,700,000 Government of France 2.5% 25/10/2020 2,769,309 7.84
Spain 9,661,809 27.34
4,750,000 Spain Letras Del Tesoro 0% 14/02/2020 4,753,871 13.45
4,900,000 Spain Letras Del Tesoro 0% 17/04/2020 4,907,938 13.89
Total Fixed Income Securities 23,314,279 65.97
Forward Contracts*
Buy JPY 127,600 Sell EUR 1,046 15/01/2020 2 -
Total Forward Contracts* 2 -
Total Financial Assets at Fair Value Through Profit or
Loss 23,314,281 65.97
Financial Liabilities at Fair Value Through Profit or Loss
Forward Contracts*
Buy USD 104,200 Sell EUR 93,268 15/01/2020 (410) -
Buy GBP 4,600 Sell EUR 5,499 15/01/2020 (58) -
Buy GBP 1,000 Sell EUR 1,196 15/01/2020 (13) -
Buy USD 1,100 Sell EUR 985 15/01/2020 (4) -
Total Forward Contracts (485) -
Total Financial Liabilities at Fair Value Through Profit or
Loss (485) -
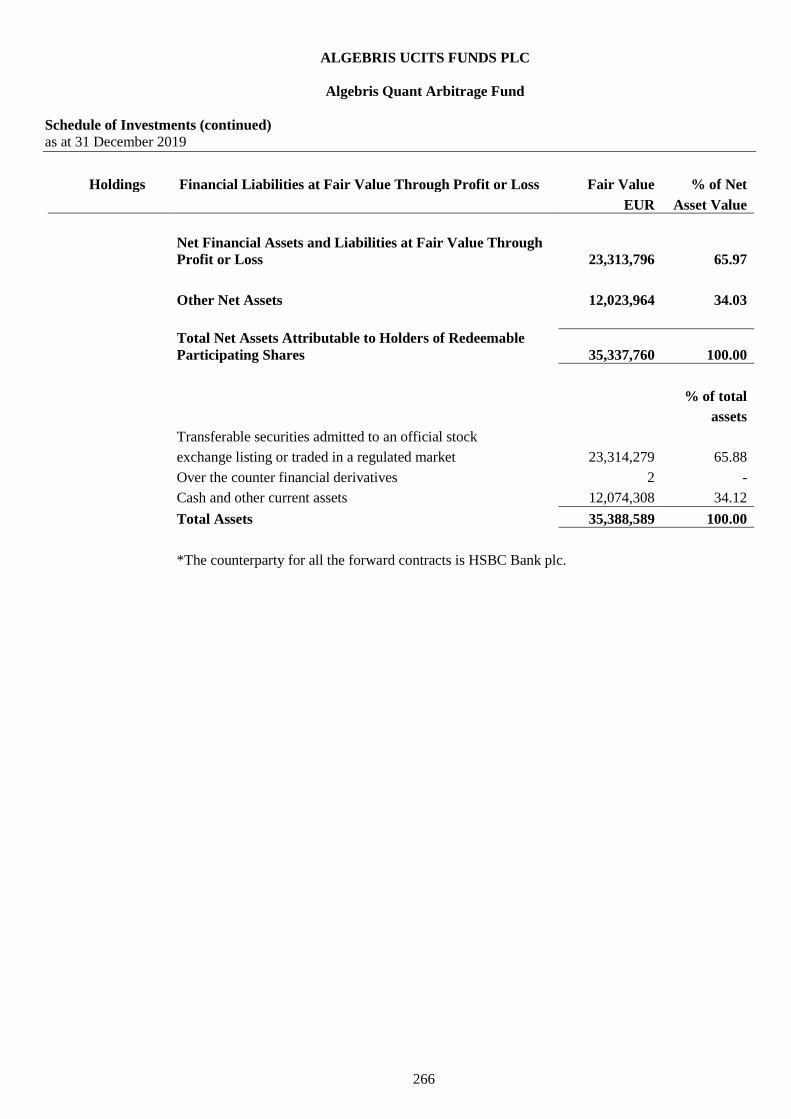
ALGEBRIS UCITS FUNDS PLC
Algebris Quant Arbitrage Fund
Schedule of Investments (continued)
as at 31 December 2019
266
Holdings Financial Liabilities at Fair Value Through Profit or Loss Fair Value % of Net
EUR Asset Value
Net Financial Assets and Liabilities at Fair Value Through
Profit or Loss 23,313,796 65.97
Other Net Assets 12,023,964 34.03
Total Net Assets Attributable to Holders of Redeemable
Participating Shares 35,337,760 100.00
% of total
assets
Transferable securities admitted to an official stock
exchange listing or traded in a regulated market 23,314,279 65.88
Over the counter financial derivatives 2 -
Cash and other current assets 12,074,308 34.12
Total Assets 35,388,589 100.00
*The counterparty for all the forward contracts is HSBC Bank plc.

ALGEBRIS UCITS FUNDS PLC
Algebris IG Financial Credit Fund
Schedule of Investments
as at 31 December 2019
267
Holdings Financial Assets at Fair Value Through Profit or Loss Fair Value % of Net
EUR Asset Value
Fixed Income Securities
Germany 182,198 0.47
200,000 Deutsche Bank 26/11/2025 182,198 0.47
Italy 1,698,192 4.39
500,000 Unicredit 02/04/2034 514,872 1.33
600,000 Unicredit 19/06/2032 558,219 1.44
600,000 Unione Di Banche Italian 12/07/2029 625,101 1.62
Netherlands 371,370 0.96
400,000 ABN Amro Bank 27/03/2028 371,370 0.96
Spain 1,502,925 3.89
200,000 Banco De Sabadell VAR 12/12/2028 228,191 0.59
1,000,000 Banco Santander VAR Perpetual (DSE) 1,067,825 2.76
200,000 Caixabank VAR 17/04/2030 206,909 0.54
United Kingdom 1,745,983 4.51
500,000 Barclays 07/02/2028 508,635 1.31
300,000 HSBC Holdings Perpetual (AO1326237) 338,694 0.87
200,000 Lloyds Banking Group Perpetual (ZQ5986752) 245,876 0.64
400,000 Royal Bank of Scotland Group 01/11/2029 364,235 0.94
300,000 Santander UK Group Holdings 4.75% 15/09/2025 288,543 0.75
United States 505,844 1.31
200,000 Citigroup 25/08/2036 142,705 0.37
200,000 Goldman Sachs Group (Series R) Perpetual 184,149 0.48
200,000 Voya Financial 23/01/2048 178,990 0.46
Total Fixed Income Securities 6,006,512 15.53

ALGEBRIS UCITS FUNDS PLC
Algebris IG Financial Credit Fund
Schedule of Investments (continued)
as at 31 December 2019
268
Holdings Financial Liabilities at Fair Value Through Profit or Loss Fair Value % of Net
EUR Asset Value
Collective Investment Scheme
Ireland 986,535 2.55
5,500 Algebris Financial Credit Fund Class M Accumulating 986,535 2.55
Total Collective Investment Scheme 986,535 2.55
Forward Contracts*
Buy EUR 2,778,359 Sell USD 3,104,000 15/01/2020 12,212 0.03
Buy JPY 395,660,200 Sell EUR 3,242,989 15/01/2020 5,380 0.01
Buy EUR 246,275 Sell GBP 206,000 15/01/2020 2,591 0.01
Buy EUR 30,433 Sell USD 34,000 15/01/2020 134 -
Buy CHF 1,100 Sell EUR 1,005 15/01/2020 9 -
Buy CHF 1,100 Sell EUR 1,005 15/01/2020 9 -
Buy CHF 1,100 Sell EUR 1,005 15/01/2020 9 -
Buy EUR 1,788 Sell USD 2,000 15/01/2020 6 -
Buy SGD 1,500 Sell EUR 992 15/01/2020 2 -
Buy SGD 1,500 Sell EUR 992 15/01/2020 2 -
Buy SGD 1,500 Sell EUR 992 15/01/2020 2 -
Buy JPY 118,700 Sell EUR 973 15/01/2020 2 -
Buy JPY 118,700 Sell EUR 973 15/01/2020 2 -
Buy JPY 118,800 Sell EUR 974 15/01/2020 1 -
Total Forward Contracts* 20,361 0.05
Total Financial Assets at Fair Value Through Profit or
Loss 7,013,408 18.13
Financial Liabilities at Fair Value Through Profit or Loss
Forward Contracts*
Buy USD 3,773,300 Sell EUR 3,377,443 15/01/2020 (14,845) (0.04)
Buy USD 202,000 Sell EUR 181,175 15/01/2020 (1,161) -
Buy GBP 900 Sell EUR 1,076 15/01/2020 (11) -
Buy GBP 900 Sell EUR 1,076 15/01/2020 (11) -
Buy GBP 900 Sell EUR 1,076 15/01/2020 (11) -
Buy USD 1,100 Sell EUR 985 15/01/2020 (5) -
Buy USD 1,100 Sell EUR 985 15/01/2020 (5) -

ALGEBRIS UCITS FUNDS PLC
Algebris IG Financial Credit Fund
Schedule of Investments (continued)
as at 31 December 2019
269
Holdings Financial Liabilities at Fair Value Through Profit or Loss Fair Value % of Net
EUR Asset Value
Forward Contracts* (continued)
Buy HKD 8,800 Sell EUR 1,010 15/01/2020 (4) -
Buy HKD 8,800 Sell EUR 1,010 15/01/2020 (4) -
Buy HKD 8,700 Sell EUR 999 15/01/2020 (4) -
Buy USD 1,100 Sell EUR 985 15/01/2020 (4) -
Total Forward Contracts* (16,065) (0.04)
Total Financial Liabilities at Fair Value Through Profit or
Loss (16,065) (0.04)
Net Financial Assets and Liabilities at Fair Value Through
Profit or Loss 6,997,343 18.09
Other Net Assets 31,683,548 81.91
Total Net Assets Attributable to Holders of Redeemable
Participating Shares 38,680,891 100.00
% of total
assets
Transferable securities admitted to an official stock
exchange listing or traded in a regulated market 6,006,512 15.10
Investment Funds 986,535 2.48
Over the counter financial derivatives 20,361 0.05
Cash and other current assets 32,758,897 82.37
Total Assets 39,772,305 100.00
*The counterparty for all the forward contracts is HSBC Bank plc.
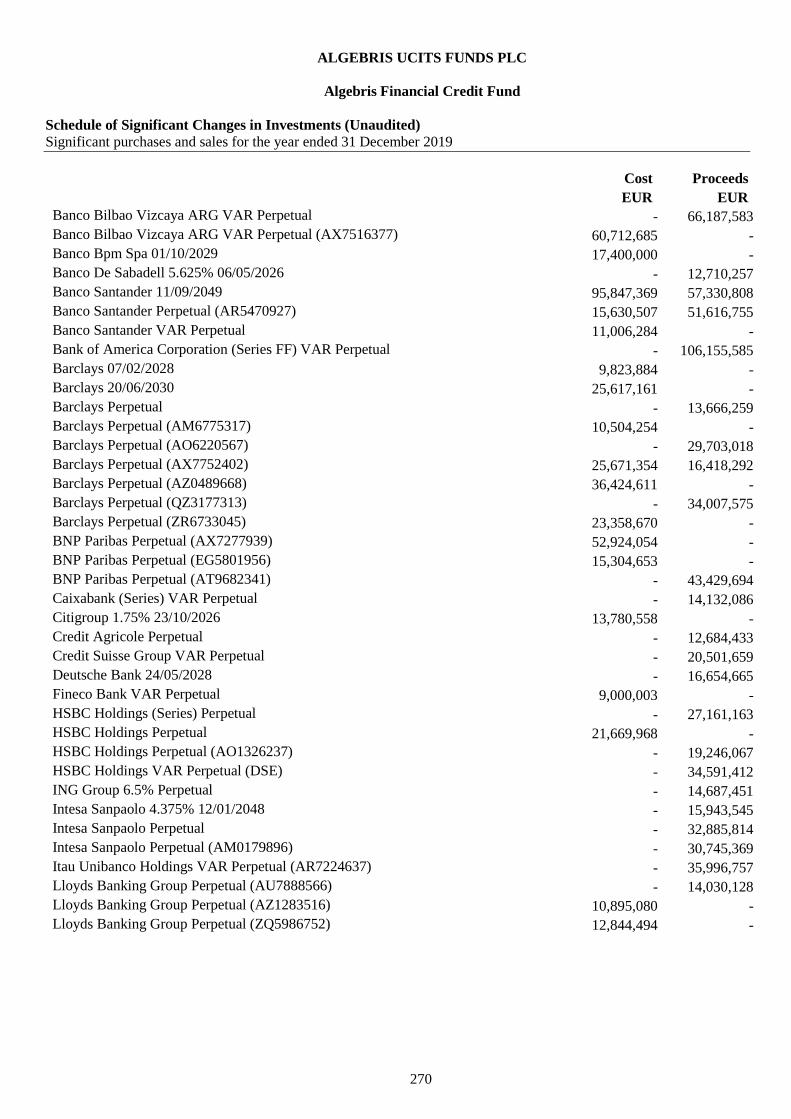
ALGEBRIS UCITS FUNDS PLC
Algebris Financial Credit Fund
Schedule of Significant Changes in Investments (Unaudited)
Significant purchases and sales for the year ended 31 December 2019
270
Cost Proceeds
EUR EUR
Banco Bilbao Vizcaya ARG VAR Perpetual - 66,187,583
Banco Bilbao Vizcaya ARG VAR Perpetual (AX7516377) 60,712,685 -
Banco Bpm Spa 01/10/2029 17,400,000 -
Banco De Sabadell 5.625% 06/05/2026 - 12,710,257
Banco Santander 11/09/2049 95,847,369 57,330,808
Banco Santander Perpetual (AR5470927) 15,630,507 51,616,755
Banco Santander VAR Perpetual 11,006,284 -
Bank of America Corporation (Series FF) VAR Perpetual - 106,155,585
Barclays 07/02/2028 9,823,884 -
Barclays 20/06/2030 25,617,161 -
Barclays Perpetual - 13,666,259
Barclays Perpetual (AM6775317) 10,504,254 -
Barclays Perpetual (AO6220567) - 29,703,018
Barclays Perpetual (AX7752402) 25,671,354 16,418,292
Barclays Perpetual (AZ0489668) 36,424,611 -
Barclays Perpetual (QZ3177313) - 34,007,575
Barclays Perpetual (ZR6733045) 23,358,670 -
BNP Paribas Perpetual (AX7277939) 52,924,054 -
BNP Paribas Perpetual (EG5801956) 15,304,653 -
BNP Paribas Perpetual (AT9682341) - 43,429,694
Caixabank (Series) VAR Perpetual - 14,132,086
Citigroup 1.75% 23/10/2026 13,780,558 -
Credit Agricole Perpetual - 12,684,433
Credit Suisse Group VAR Perpetual - 20,501,659
Deutsche Bank 24/05/2028 - 16,654,665
Fineco Bank VAR Perpetual 9,000,003 -
HSBC Holdings (Series) Perpetual - 27,161,163
HSBC Holdings Perpetual 21,669,968 -
HSBC Holdings Perpetual (AO1326237) - 19,246,067
HSBC Holdings VAR Perpetual (DSE) - 34,591,412
ING Group 6.5% Perpetual - 14,687,451
Intesa Sanpaolo 4.375% 12/01/2048 - 15,943,545
Intesa Sanpaolo Perpetual - 32,885,814
Intesa Sanpaolo Perpetual (AM0179896) - 30,745,369
Itau Unibanco Holdings VAR Perpetual (AR7224637) - 35,996,757
Lloyds Banking Group Perpetual (AU7888566) - 14,030,128
Lloyds Banking Group Perpetual (AZ1283516) 10,895,080 -
Lloyds Banking Group Perpetual (ZQ5986752) 12,844,494 -
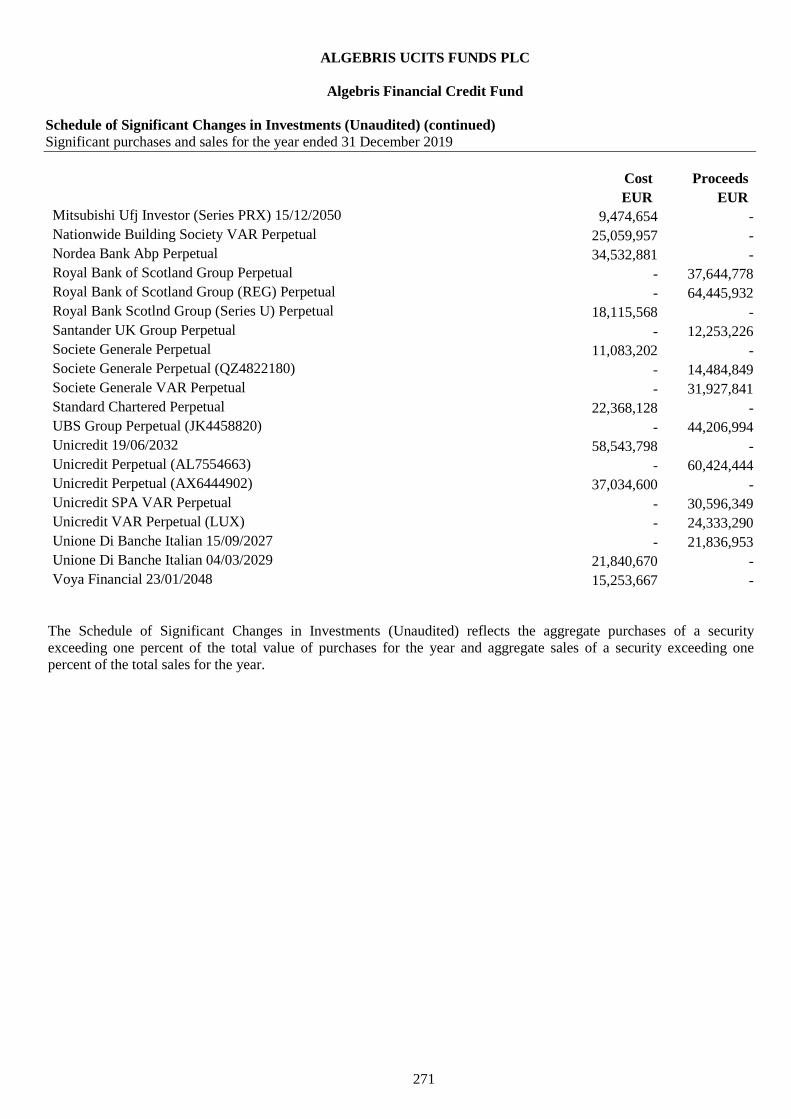
ALGEBRIS UCITS FUNDS PLC
Algebris Financial Credit Fund
Schedule of Significant Changes in Investments (Unaudited) (continued)
Significant purchases and sales for the year ended 31 December 2019
271
Cost Proceeds
EUR EUR
Mitsubishi Ufj Investor (Series PRX) 15/12/2050 9,474,654 -
Nationwide Building Society VAR Perpetual 25,059,957 -
Nordea Bank Abp Perpetual 34,532,881 -
Royal Bank of Scotland Group Perpetual - 37,644,778
Royal Bank of Scotland Group (REG) Perpetual - 64,445,932
Royal Bank Scotlnd Group (Series U) Perpetual 18,115,568 -
Santander UK Group Perpetual - 12,253,226
Societe Generale Perpetual 11,083,202 -
Societe Generale Perpetual (QZ4822180) - 14,484,849
Societe Generale VAR Perpetual - 31,927,841
Standard Chartered Perpetual 22,368,128 -
UBS Group Perpetual (JK4458820) - 44,206,994
Unicredit 19/06/2032 58,543,798 -
Unicredit Perpetual (AL7554663) - 60,424,444
Unicredit Perpetual (AX6444902) 37,034,600 -
Unicredit SPA VAR Perpetual - 30,596,349
Unicredit VAR Perpetual (LUX) - 24,333,290
Unione Di Banche Italian 15/09/2027 - 21,836,953
Unione Di Banche Italian 04/03/2029 21,840,670 -
Voya Financial 23/01/2048 15,253,667 -
The Schedule of Significant Changes in Investments (Unaudited) reflects the aggregate purchases of a security
exceeding one percent of the total value of purchases for the year and aggregate sales of a security exceeding one
percent of the total sales for the year.

ALGEBRIS UCITS FUNDS PLC
Algebris Financial Income Fund
Schedule of Significant Changes in Investments (Unaudited)
Significant purchases and sales for the year ended 31 December 2019
272
Cost Proceeds
EUR EUR
ABN Amro Bank VAR Perpetual - 5,746,185
ABN AMRO Group 8,006,124 -
AGNC Investment 6,655,812 6,945,596
Allianz SE Reg - 5,518,558
Annaly Capital Management 8,485,210 4,775,892
Apollo Global Management 5,965,979 9,472,450
Apollo Global Management LLC Class A - 11,067,290
Athene Holding Class A 7,265,457 -
AXA Equitable Holdings 5,994,200 -
Banco Bilbao Vizcaya ARG Perpetual (AX7516377) 3,396,761 -
Bank of America 2,415,570 7,008,404
Bank of America (Series FF) Perpetual - 7,063,514
Bank of China H Shares - 5,178,623
Blackstone Group 6,640,814 10,253,252
Blackstone Group LP - 12,630,132
BNP Paribas Perpetual (AT9682341) - 4,833,472
BNP Paribas Perpetual (AX7277939) 6,086,266 -
Carlyle Group - 10,723,009
China Construction Bank H Shares - 5,278,343
China Overseas Land & Investment 2,376,892 -
Citigroup - 5,016,568
Citigroup 25/08/2036 3,741,752 -
Citizens Financial Group 7,891,861 6,138,867
Comerica - 10,817,391
Credit Suisse Group 6,898,480 13,086,936
Credito Valtellinese 2,532,538 -
Dai-ichi Life Holdings 4,571,373 -
DBS Group Holdings 3,674,788 -
Dresdner Funding Trust 8.151% 30/06/2031 5,427,399 -
E*Trade Financial 5,638,004 5,622,669
Fifth Third Bancorp 11,198,338 12,402,466
First Horizon National 6,524,113 -
HSBC Holdings VAR Perpetual (DSE) - 5,461,932
Huntington Bancshares - 9,859,523
Illimity Bank 7,937,229 6,019,827
ING Group 5,939,143 7,290,410
Intesa Sanpaolo 4.375% 12/01/2048 3,297,289 10,054,488
Invesco 9,802,409 15,810,378
KBC Group 13,507,652 14,466,695
Keycorp 3,659,357 9,208,433

ALGEBRIS UCITS FUNDS PLC
Algebris Financial Income Fund
Schedule of Significant Changes in Investments (Unaudited) (continued)
Significant purchases and sales for the year ended 31 December 2019
273
Cost Proceeds
EUR EUR
Legg Mason - 6,335,569
Lincoln National 4,890,927 10,513,870
Lloyds Banking Group (144A) VAR Perpetual 3,421,464 -
Morgan Stanley 3,728,918 -
PacWest Bancorp - 5,657,177
Prudential Financial - 11,391,506
Raiffeisen Bank International 5,085,415 -
Resona Holdings 3,381,280 4,647,519
Sberbank of Russia - 6,398,608
Societe Generale Perpetual (LUX) - 7,591,573
Spaxs - 6,854,085
Suntrust Banks (Series H) Perpetual - 6,949,428
T&D Holdings 4,623,167 -
Two Harbors Investment 2,513,509 -
Two Harbors Investment Preference Perpetual - 6,015,056
UBS Group - 9,786,574
Unicredit Perpetual (AX6444902) 6,108,975 -
Voya Financial 23/01/2048 7,455,862 -
Wells Fargo & Co - 11,392,994
The Schedule of Significant Changes in Investments (Unaudited) reflects the aggregate purchases of a security
exceeding one percent of the total value of purchases for the year and aggregate sales of a security exceeding one
percent of the total sales for the year.
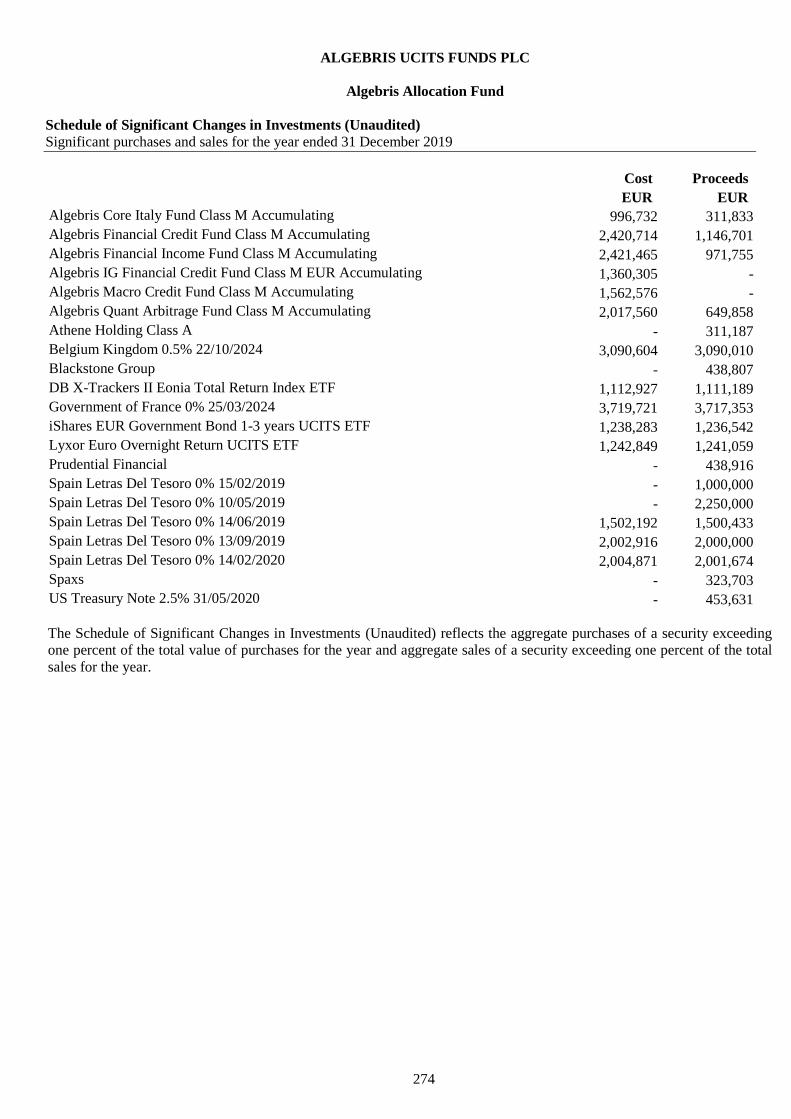
ALGEBRIS UCITS FUNDS PLC
Algebris Allocation Fund
Schedule of Significant Changes in Investments (Unaudited)
Significant purchases and sales for the year ended 31 December 2019
274
Cost Proceeds
EUR EUR
Algebris Core Italy Fund Class M Accumulating 996,732 311,833
Algebris Financial Credit Fund Class M Accumulating 2,420,714 1,146,701
Algebris Financial Income Fund Class M Accumulating 2,421,465 971,755
Algebris IG Financial Credit Fund Class M EUR Accumulating 1,360,305 -
Algebris Macro Credit Fund Class M Accumulating 1,562,576 -
Algebris Quant Arbitrage Fund Class M Accumulating 2,017,560 649,858
Athene Holding Class A - 311,187
Belgium Kingdom 0.5% 22/10/2024 3,090,604 3,090,010
Blackstone Group - 438,807
DB X-Trackers II Eonia Total Return Index ETF 1,112,927 1,111,189
Government of France 0% 25/03/2024 3,719,721 3,717,353
iShares EUR Government Bond 1-3 years UCITS ETF 1,238,283 1,236,542
Lyxor Euro Overnight Return UCITS ETF 1,242,849 1,241,059
Prudential Financial - 438,916
Spain Letras Del Tesoro 0% 15/02/2019 - 1,000,000
Spain Letras Del Tesoro 0% 10/05/2019 - 2,250,000
Spain Letras Del Tesoro 0% 14/06/2019 1,502,192 1,500,433
Spain Letras Del Tesoro 0% 13/09/2019 2,002,916 2,000,000
Spain Letras Del Tesoro 0% 14/02/2020 2,004,871 2,001,674
Spaxs - 323,703
US Treasury Note 2.5% 31/05/2020 - 453,631
The Schedule of Significant Changes in Investments (Unaudited) reflects the aggregate purchases of a security exceeding
one percent of the total value of purchases for the year and aggregate sales of a security exceeding one percent of the total
sales for the year.

ALGEBRIS UCITS FUNDS PLC
Algebris Financial Equity Fund
Schedule of Significant Changes in Investments (Unaudited)
Significant purchases and sales for the year ended 31 December 2019
275
Cost Proceeds
EUR EUR
ABN AMRO Group 6,669,656 4,109,117
Affiliated Managers Group 1,962,791 2,059,297
Apollo Global Management 1,577,685 2,379,301
Apollo Global Management LLC Class A 1,648,313 4,553,419
Athene Holding Class A - 4,145,787
AXA Equitable Holdings - 2,935,679
Banca Generali 1,503,983 -
Banca Mediolanum 1,489,717 -
BankUnited 2,040,005 1,912,273
Bawag Group 1,705,424 -
Blackstone Group 2,926,855 3,736,256
Blackstone Group LP 2,133,451 6,417,424
BrightSphere Investment Group - 2,769,899
Capital One Financial Corporation 1,913,833 -
Carlyle Group 1,440,048 4,982,471
Citigroup 1,396,643 3,599,368
Citizens Financial Group 3,464,348 3,340,379
Comerica - 3,991,705
Commerzbank 3,630,286 3,078,105
Credit Suisse Group 3,788,378 6,948,817
Credito Valtellinese - 2,213,060
Dai-ichi Life Holdings 2,155,153 -
Deutsche Bank 1,700,466 1,839,969
E*Trade Financial Corporation 2,832,160 2,320,244
Erste Group Bank 1,699,461 -
Fifth Third Bancorp 3,015,967 3,202,440
First Horizon National Corporation 1,775,519 1,880,647
Illimity Bank 3,721,256 3,190,773
ING Group 2,787,688 -
Invesco 1,923,072 2,187,444
KBC Group 5,070,990 8,954,552
Keycorp 2,696,818 4,342,280
KKR & Co 2,519,647 1,809,862
Lazard Class A - 2,552,820
Legg Mason - 2,102,627
Mitsubishi UFJ Financial Group - 2,206,400
Morgan Stanley 2,205,354 2,992,675
Och-Ziff Capital Management Group Class A Shares 1,701,144 -
Popular 2,030,539 -
Prudential Financial - 5,516,711
Raiffeisen Bank International 3,269,695 -
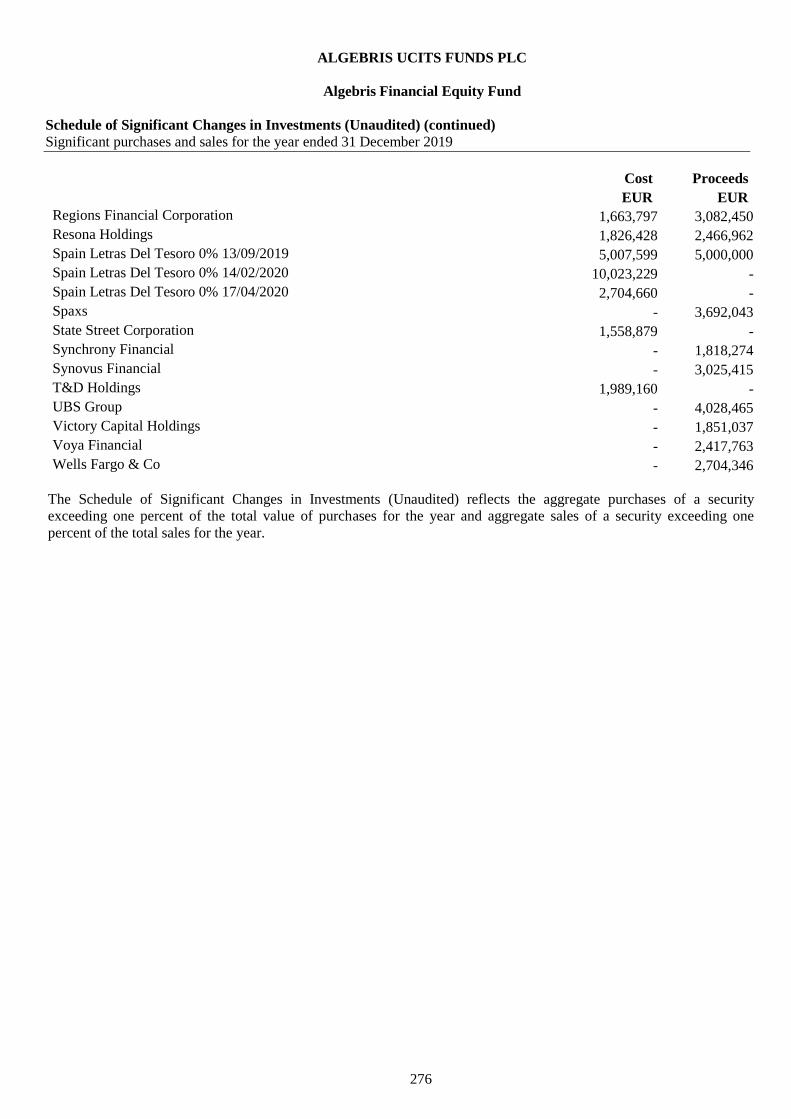
ALGEBRIS UCITS FUNDS PLC
Algebris Financial Equity Fund
Schedule of Significant Changes in Investments (Unaudited) (continued)
Significant purchases and sales for the year ended 31 December 2019
276
Cost Proceeds
EUR EUR
Regions Financial Corporation 1,663,797 3,082,450
Resona Holdings 1,826,428 2,466,962
Spain Letras Del Tesoro 0% 13/09/2019 5,007,599 5,000,000
Spain Letras Del Tesoro 0% 14/02/2020 10,023,229 -
Spain Letras Del Tesoro 0% 17/04/2020 2,704,660 -
Spaxs - 3,692,043
State Street Corporation 1,558,879 -
Synchrony Financial - 1,818,274
Synovus Financial - 3,025,415
T&D Holdings 1,989,160 -
UBS Group - 4,028,465
Victory Capital Holdings - 1,851,037
Voya Financial - 2,417,763
Wells Fargo & Co - 2,704,346
The Schedule of Significant Changes in Investments (Unaudited) reflects the aggregate purchases of a security
exceeding one percent of the total value of purchases for the year and aggregate sales of a security exceeding one
percent of the total sales for the year.

ALGEBRIS UCITS FUNDS PLC
Algebris Macro Credit Fund
Schedule of Significant Changes in Investments (Unaudited)
Significant purchases and sales for the year ended 31 December 2019
277
Cost Proceeds
EUR EUR
Altice Luxembourg 8% 15/05/2027 11,147,097 11,938,806
Banca Monte Dei Paschi 10.5% 23/07/2029 8,401,689 -
Banco Bilbao Vizcaya VAR Perpetual - 16,797,955
Banco Comerc Portugues Perpetual 12,221,433 -
Banco De Sabadell Perpetual (AN4046750) - 20,926,503
Banco De Sabadell VAR Perpetual - 18,015,726
Banco Santander Perpetual (AR5470927 Corporation) - 16,222,174
Banco Santander VAR Perpetual (DSE) - 19,321,683
Bonos Y Oblig Del Estado 1.85% 30/07/2035 17,482,891 18,064,099
Buoni Poliennali Del Tes 0.95% 01/03/2023 - 14,631,058
Buoni Poliennali Del Tes 2.8% 01/03/2067 10,131,550 10,626,571
Caixabank (Series) VAR Perpetual - 20,977,507
Crystal Almond Sarl 4.25% 15/10/2024 10,000,000 -
Crystal Almond Sarl 10% 01/11/2021 - 17,311,736
Enquest 7% 15/04/2022 (PIK) 8,743,760 -
France (Govt Of) 1.25% 25/05/2036 11,518,027 12,139,174
Hellenic Republic 1.875% 23/07/2026 10,482,990 -
Ibercaja Banco Perpetual 9,410,380 11,298,277
Indonesia Government (Series FR59) 7% 15/05/2027 8,624,010 -
Indonesia Government (Series FR65) 6.625% 15/05/2033 11,857,049 -
Indonesia Government (Series FR75) 7.5% 15/05/2038 10,430,508 -
Indonesia Government (Series FR78) 8.25% 15/05/2029 12,532,083 -
Indonesia Government (Series FR82) 7% 15/09/2030 10,273,270 -
Intesa Sanpaola VAR Perpetual - 17,950,664
Intesa Sanpaolo Perpetual (AM0179896) - 28,525,283
iShares EUR High Yield Corp Bond UCITS ETF EUR Dist 15,014,203 14,997,749
Mex Bonos Desarr Fix Rights (Series M 20) 7.5% 03/06/2027 23,719,382 24,061,935
Mex Bonos Desarr Fix Rights (Series M 20) 8.5% 31/05/2029 18,318,841 -
Mex Bonos Desarr Fix Rt (Ser M) 5.75% 05/03/2026 17,600,074 17,903,455
Mex Bonos Desarr Fix Rights (Series M) 7.75% 29/05/2031 14,912,495 -
Nota Do Tesouro Nacional (Ser NTNF) 10% 01/01/2023 7,897,410 -
Obrigacoes Do Tesouro (Series 15Y) 2.25% 18/04/2034 14,847,723 -
Petroleos Mexicanos 2.75% 21/04/2027 13,992,323 -
Petroleos Mexicanos 7.19% 12/09/2024 21,221,278 -
Petroleos Mexicanos 7.47% 12/11/2026 11,905,503 -
Piraeus Group Finance (BR) VAR 26/06/2029 7,000,000 -
Republic of Cyprus 2.75% 26/02/2034 8,494,400 -
Republic of Ecuador 7.95% 20/06/2024 - 11,473,205
Republic of South Africa 8.75% 28/02/2048 11,714,636 11,539,981
Russia Government Bond - OFZ (Series 6223) 6.5% 28/02/2024 27,793,704 28,855,052
Russia Govt Bond - Ofz (Ser 6224) 6.9% 23/05/2029 10,122,229 10,598,403

ALGEBRIS UCITS FUNDS PLC
Algebris Macro Credit Fund
Schedule of Significant Changes in Investments (Unaudited) (continued)
Significant purchases and sales for the year ended 31 December 2019
278
Cost Proceeds
EUR EUR
Russia Govt Bond-OFZ (Series 6225) 7.25% 10/05/2034 8,535,859 -
Russia Govt Bond - OFZ (Series 6027) 8.15% 03/02/2027 15,366,180 -
Turkey Government Bond 10.5% 15/01/2020 7,160,510 -
Ukraine Government 7.375% 25/09/2032 11,951,494 12,783,073
Ukraine Government 7.75% 01/09/2027 9,131,159 -
Unicredit SPA VAR Perpetual - 18,866,667
US Treasury Note 2.25% 30/04/2024 22,592,363 23,374,504
US Treasury Note 2.5% 31/05/2020 - 42,646,098
US Treasury Note 2.75% 30/11/2020 - 33,178,754
The Schedule of Significant Changes in Investments (Unaudited) reflects the aggregate purchases of a security
exceeding one percent of the total value of purchases for the year and aggregate sales of a security exceeding one
percent of the total sales for the year.


ALGEBRIS UCITS FUNDS PLC
Algebris Core Italy Fund
Schedule of Significant Changes in Investments (Unaudited) (continued)
Significant purchases and sales for the year ended 31 December 2019
280
Cost Proceeds
EUR EUR
Anima Holding 893,849 -
Aquafil 1,061,772 -
Autogrill - 752,696
Banca Generali 937,241 928,429
Banca Mediolanum 926,838 887,263
Banca Monte Dei Paschi VAR 18/01/2028 - 835,699
Banco Bpm 1,101,641 1,013,247
Buzzi Unicem 1,002,284 -
Cerved Group 1,062,447 1,120,406
Davide Campari-Milano 869,250 824,385
De Longhi 996,640 -
Digital Bros 1,199,180 -
doValue 1,326,018 -
Electro Power Systems 1,561,894 -
ENI - 758,837
Exor 1,515,377 1,588,090
Falck Renewables 782,633 1,087,316
Fiat Chrysler Automobiles 2,008,902 2,072,382
Fiera Milano 1,498,245 788,228
FinecoBank Banca Fineco 1,052,678 1,011,618
Gamenet Group - 931,730
Illimity Bank - 836,317
Interpump Group 823,601 799,695
Intesa Sanpaolo 1,261,416 1,702,646
Intesa Sanpaolo Perpetual (AM0179896) - 2,899,543
Leonardo 1,395,110 -
Mediobanca - 1,129,894
Moncler 1,440,136 955,421
Poste Italiane 839,344 -
RAI Way 1,173,172 -
Saipem 1,826,309 2,131,943
Salini Impregilo 1,031,760 -
Saras 890,795 995,513
Societa Iniziative Autostradali e Servizi 1,049,619 -
Spain Letras Del Tesoro 0% 15/02/2019 - 1,000,507
Spain Letras Del Tesoro 0% 14/06/2019 3,003,912 3,001,597
Telecom Italia/Milano - 749,278
Telecom Italia/Milano (TIT) 1,136,844 808,563
Telit Communications 2,248,689 -
Tenaris Milan 798,250 809,494
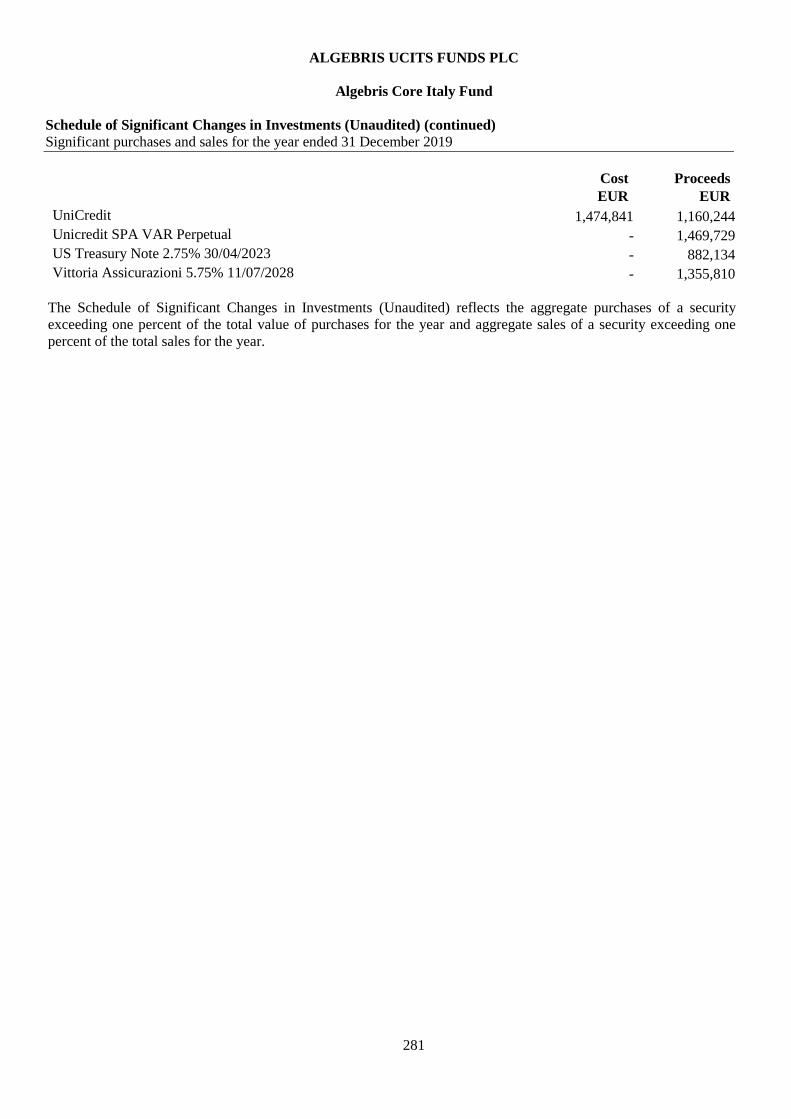
ALGEBRIS UCITS FUNDS PLC
Algebris Core Italy Fund
Schedule of Significant Changes in Investments (Unaudited) (continued)
Significant purchases and sales for the year ended 31 December 2019
281
Cost Proceeds
EUR EUR
UniCredit 1,474,841 1,160,244
Unicredit SPA VAR Perpetual - 1,469,729
US Treasury Note 2.75% 30/04/2023 - 882,134
Vittoria Assicurazioni 5.75% 11/07/2028 - 1,355,810
The Schedule of Significant Changes in Investments (Unaudited) reflects the aggregate purchases of a security
exceeding one percent of the total value of purchases for the year and aggregate sales of a security exceeding one
percent of the total sales for the year.
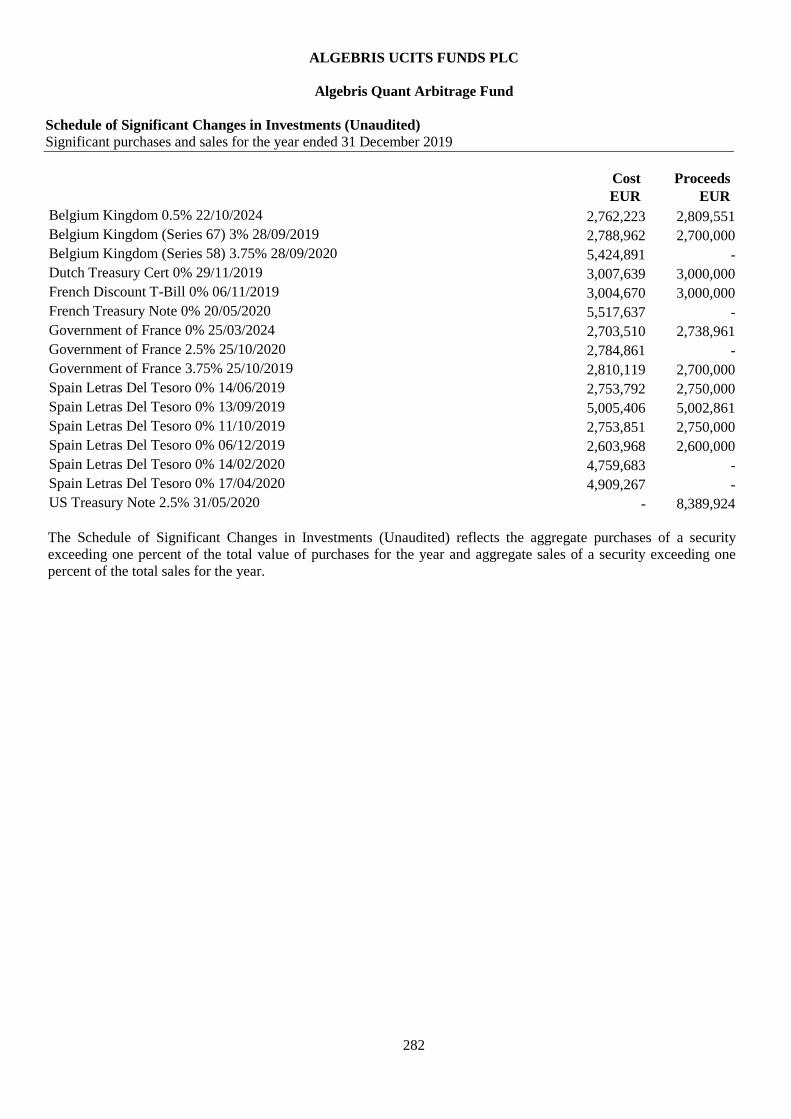
ALGEBRIS UCITS FUNDS PLC
Algebris Quant Arbitrage Fund
Schedule of Significant Changes in Investments (Unaudited)
Significant purchases and sales for the year ended 31 December 2019
282
Cost Proceeds
EUR EUR
Belgium Kingdom 0.5% 22/10/2024 2,762,223 2,809,551
Belgium Kingdom (Series 67) 3% 28/09/2019 2,788,962 2,700,000
Belgium Kingdom (Series 58) 3.75% 28/09/2020 5,424,891 -
Dutch Treasury Cert 0% 29/11/2019 3,007,639 3,000,000
French Discount T-Bill 0% 06/11/2019 3,004,670 3,000,000
French Treasury Note 0% 20/05/2020 5,517,637 -
Government of France 0% 25/03/2024 2,703,510 2,738,961
Government of France 2.5% 25/10/2020 2,784,861 -
Government of France 3.75% 25/10/2019 2,810,119 2,700,000
Spain Letras Del Tesoro 0% 14/06/2019 2,753,792 2,750,000
Spain Letras Del Tesoro 0% 13/09/2019 5,005,406 5,002,861
Spain Letras Del Tesoro 0% 11/10/2019 2,753,851 2,750,000
Spain Letras Del Tesoro 0% 06/12/2019 2,603,968 2,600,000
Spain Letras Del Tesoro 0% 14/02/2020 4,759,683 -
Spain Letras Del Tesoro 0% 17/04/2020 4,909,267 -
US Treasury Note 2.5% 31/05/2020 - 8,389,924
The Schedule of Significant Changes in Investments (Unaudited) reflects the aggregate purchases of a security
exceeding one percent of the total value of purchases for the year and aggregate sales of a security exceeding one
percent of the total sales for the year.

ALGEBRIS UCITS FUNDS PLC
Algebris IG Financial Credit Fund
Schedule of Significant Changes in Investments (Unaudited)
Significant purchases and sales for the year ended 31 December 2019
283
Cost Proceeds
EUR EUR
ABN Amro Bank 27/03/2028 378,716 -
Algebris Financial Credit Fund Class M Accumulating 966,485 -
Banco De Sabadell VAR 12/12/2028 233,067 -
Banco Santander VAR Perpetual (DSE) 1,066,483 -
Barclays 07/02/2028 515,021 -
Caixabank VAR 17/04/2030 207,866 -
Citigroup 25/08/2036 144,387 -
Deutsche Bank 26/11/2025 182,733 -
Goldman Sachs Group (Series R) Perpetual 181,670 -
HSBC Holdings Perpetual (AO1326237) 328,129 -
Lloyds Banking Group Perpetual (ZQ5986752) 233,536 -
Royal Bank of Scotland Group 01/11/2029 364,306 -
Santander Uk Group Holdings 4.75% 15/09/2025 295,278 -
Unicredit 19/06/2032 582,019 -
Unicredit 02/04/2034 525,491 -
Unione Di Banche Italian 12/07/2029 636,673 -
Voya Financial 23/01/2048 178,867 -
The Schedule of Significant Changes in Investments (Unaudited) reflects the aggregate purchases of a security
exceeding one percent of the total value of purchases for the year and aggregate sales of a security exceeding one
percent of the total sales for the period.

Other Additional Disclosures (Unaudited)
284
Algebris UCITS Funds Plc (the “Company”) is an investment company with variable capital incorporated with limited
liability in Ireland and established as an umbrella fund with segregated liability between sub-funds pursuant to the
Companies Act 2014 and the Central Bank (Supervision and Enforcement Act 2013 (Section 48(1)) (Undertakings for
Collective Investment in Transferable Securities) Regulations 2015 (the “Central Bank UCITS Regulations”).
IMPORTANT NOTICE TO INVESTORS IN GERMANY
The information agent in Germany is ACOLIN Europe GmbH, with registered office at Reichenaustrasse 11a-c, D-
78467 Konstanz, Germany.
The basic documents of the Company and the sub-funds, such as the prospectus (in English) and the key investor
information documents (in German), may be obtained free of charge at the registered office of the German information
agent.
IMPORTANT NOTICE TO INVESTORS IN SWITZERLAND
1) The state of the origin of the fund is Ireland.
2) The representative is ACOLIN Fund Services AG, Leutschenbachstrasse 50, CH-8050 Zurich.
3) The paying agent is Bank Vontobel Ltd., Gotthardstrasse 43, CH-8022 Zurich.
4) The prospectus, the Key Investor Information Documents, the fund regulation, the list of purchases and sales as well
as the annual and semi-annual reports may be obtained free of charge from the representative.
5) In respect of the units distributed in and from Switzerland, the place of performance and jurisdiction is at the
registered office of the representative.
6) The total expense ratio (TER) was calculated based on the version currently applicable of the “Guidelines on the
calculation and disclosure of the Total Expense Ratio (TER) of collective investment schemes” of the Swiss Funds &
Asset Management Association (SFAMA).
TOTAL EXPENSE RATIO
Total Expense Ratio for the period from 01.01.2019 to 31.12.2019:
Sub-Fund Share class TER
Algebris Financial Credit Fund CHF Class I 1.21%
CHF Class Id 1.20%
CHF Class R 2.02%
CHF Class Rd 2.14%
CHF Class Z 0.90%
EUR Class Cd 1.11%
EUR Class I 1.45%
EUR Class Id 1.54%
EUR Class M 0.11%
EUR Class Md 0.11%
EUR Class R 2.05%
EUR Class Rd 2.04%
EUR Class W 1.61%
EUR Class Wd 1.61%
EUR Class XXLd 0.61%
EUR Class Z 0.90%
EUR Class Zd 0.90%
GBP Class I 1.79%
GBP Class Id 1.66%
GBP Class M 0.11%
GBP Class Md 0.11%
GBP Class R 2.42%
GBP Class Rd 2.25%
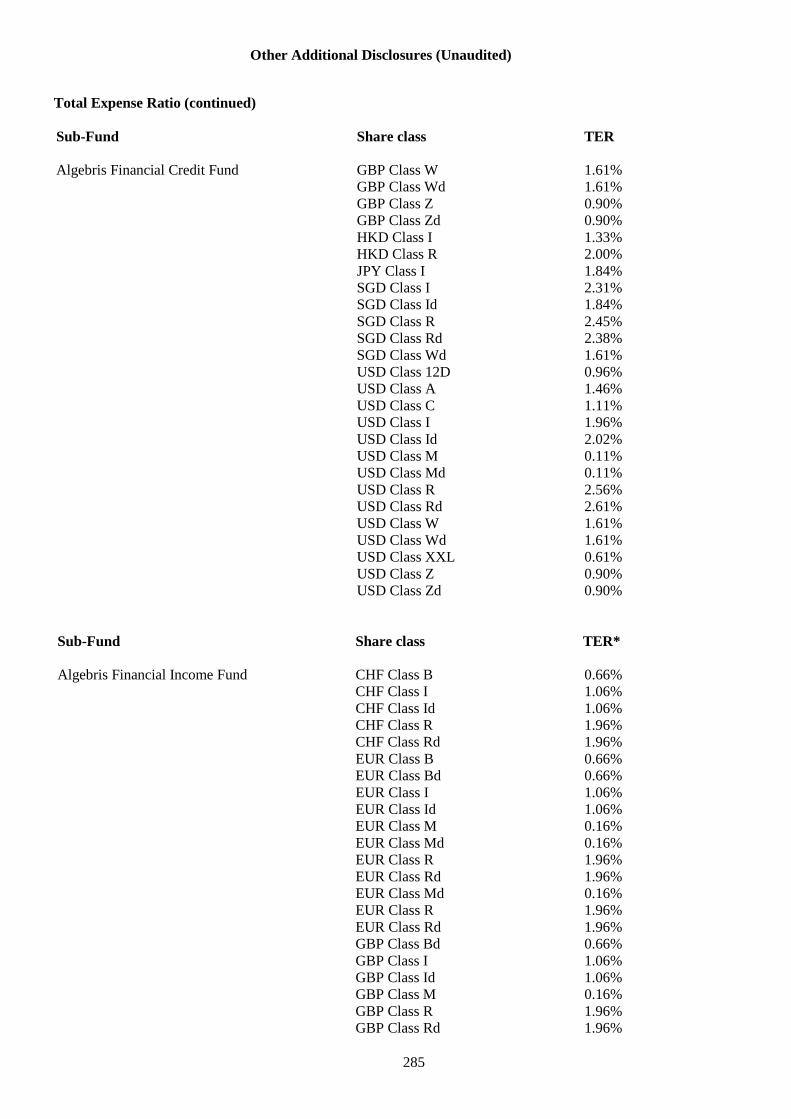
Other Additional Disclosures (Unaudited)
285
Total Expense Ratio (continued)
Sub-Fund Share class TER
Algebris Financial Credit Fund GBP Class W 1.61%
GBP Class Wd 1.61%
GBP Class Z 0.90%
GBP Class Zd 0.90%
HKD Class I 1.33%
HKD Class R 2.00%
JPY Class I 1.84%
SGD Class I 2.31%
SGD Class Id 1.84%
SGD Class R 2.45%
SGD Class Rd 2.38%
SGD Class Wd 1.61%
USD Class 12D 0.96%
USD Class A 1.46%
USD Class C 1.11%
USD Class I 1.96%
USD Class Id 2.02%
USD Class M 0.11%
USD Class Md 0.11%
USD Class R 2.56%
USD Class Rd 2.61%
USD Class W 1.61%
USD Class Wd 1.61%
USD Class XXL 0.61%
USD Class Z 0.90%
USD Class Zd 0.90%
Sub-Fund Share class TER*
Algebris Financial Income Fund CHF Class B 0.66%
CHF Class I 1.06%
CHF Class Id 1.06%
CHF Class R 1.96%
CHF Class Rd 1.96%
EUR Class B 0.66%
EUR Class Bd 0.66%
EUR Class I 1.06%
EUR Class Id 1.06%
EUR Class M 0.16%
EUR Class Md 0.16%
EUR Class R 1.96%
EUR Class Rd 1.96%
EUR Class Md 0.16%
EUR Class R 1.96%
EUR Class Rd 1.96%
GBP Class Bd 0.66%
GBP Class I 1.06%
GBP Class Id 1.06%
GBP Class M 0.16%
GBP Class R 1.96%
GBP Class Rd 1.96%
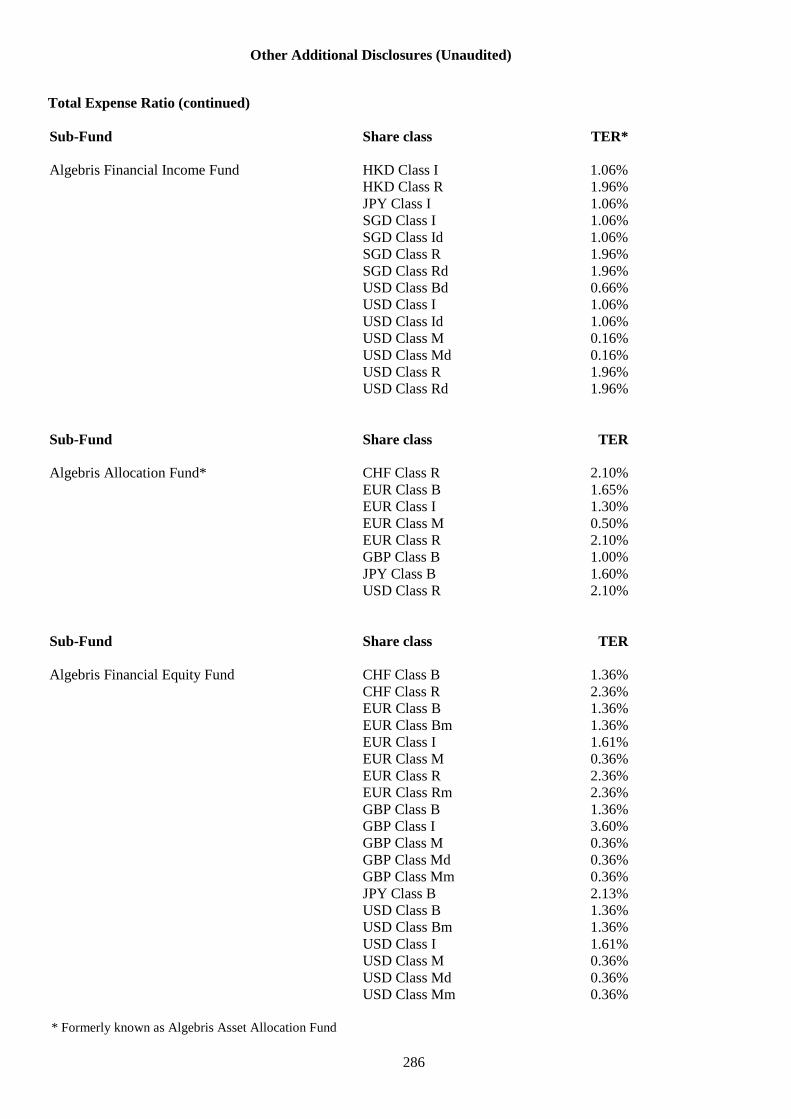
Other Additional Disclosures (Unaudited)
286
Total Expense Ratio (continued)
Sub-Fund Share class TER*
Algebris Financial Income Fund HKD Class I 1.06%
HKD Class R 1.96%
JPY Class I 1.06%
SGD Class I 1.06%
SGD Class Id 1.06%
SGD Class R 1.96%
SGD Class Rd 1.96%
USD Class Bd 0.66%
USD Class I 1.06%
USD Class Id 1.06%
USD Class M 0.16%
USD Class Md 0.16%
USD Class R 1.96%
USD Class Rd 1.96%
Sub-Fund Share class TER
Algebris Allocation Fund* CHF Class R 2.10%
EUR Class B 1.65%
EUR Class I 1.30%
EUR Class M 0.50%
EUR Class R 2.10%
GBP Class B 1.00%
JPY Class B 1.60%
USD Class R 2.10%
Sub-Fund Share class TER
Algebris Financial Equity Fund CHF Class B 1.36%
CHF Class R 2.36%
EUR Class B 1.36%
EUR Class Bm 1.36%
EUR Class I 1.61%
EUR Class M 0.36%
EUR Class R 2.36%
EUR Class Rm 2.36%
GBP Class B 1.36%
GBP Class I 3.60%
GBP Class M 0.36%
GBP Class Md 0.36%
GBP Class Mm 0.36%
JPY Class B 2.13%
USD Class B 1.36%
USD Class Bm 1.36%
USD Class I 1.61%
USD Class M 0.36%
USD Class Md 0.36%
USD Class Mm 0.36%
* Formerly known as Algebris Asset Allocation Fund

Other Additional Disclosures (Unaudited)
287
Total Expense Ratio (continued)
** Formerly known as Algebris Tail Risk Fund.
Sub-Fund Share class TER
Algebris Macro Credit Fund CHF Class B 1.39%
CHF Class Bd 1.17%
CHF Class I 1.12%
CHF Class R 1.72%
EUR Class B 1.20%
EUR Class Bd 1.26%
EUR Class I 1.67%
EUR Class Id 1.74%
EUR Class M 0.22%
EUR Class Md 0.22%
EUR Class R 2.15%
EUR Class Rd 2.11%
GBP Class B 0.99%
GBP Class I 2.95%
GBP Class Id 1.99%
GBP Class M 0.22%
GBP Class Md 0.22%
GBP Class R 2.38%
JPY Class I 3.07%
USD Class B 1.29%
USD Class I 2.51%
USD Class M 0.22%
USD Class Md 0.22%
USD Class R 2.87%
Sub-Fund Share class TER
Algebris Core Italy Fund EUR Class EB 0.91%
EUR Class I 2.31%
EUR Class M 0.41%
EUR Class R 2.08%
JPY Class I 2.35%
USD Class I 2.44%
Sub-Fund Share class TER
Algebris Quant Arbitrage Fund** EUR Class EB 1.04%
EUR Class I 1.44%
EUR Class M 0.50%
EUR Class R 2.19%
GBP Class EB 1.00%
GBP Class M 0.50%
JPY Class I 1.52%
USD Class EB 1.38%
USD Class I 1.68%
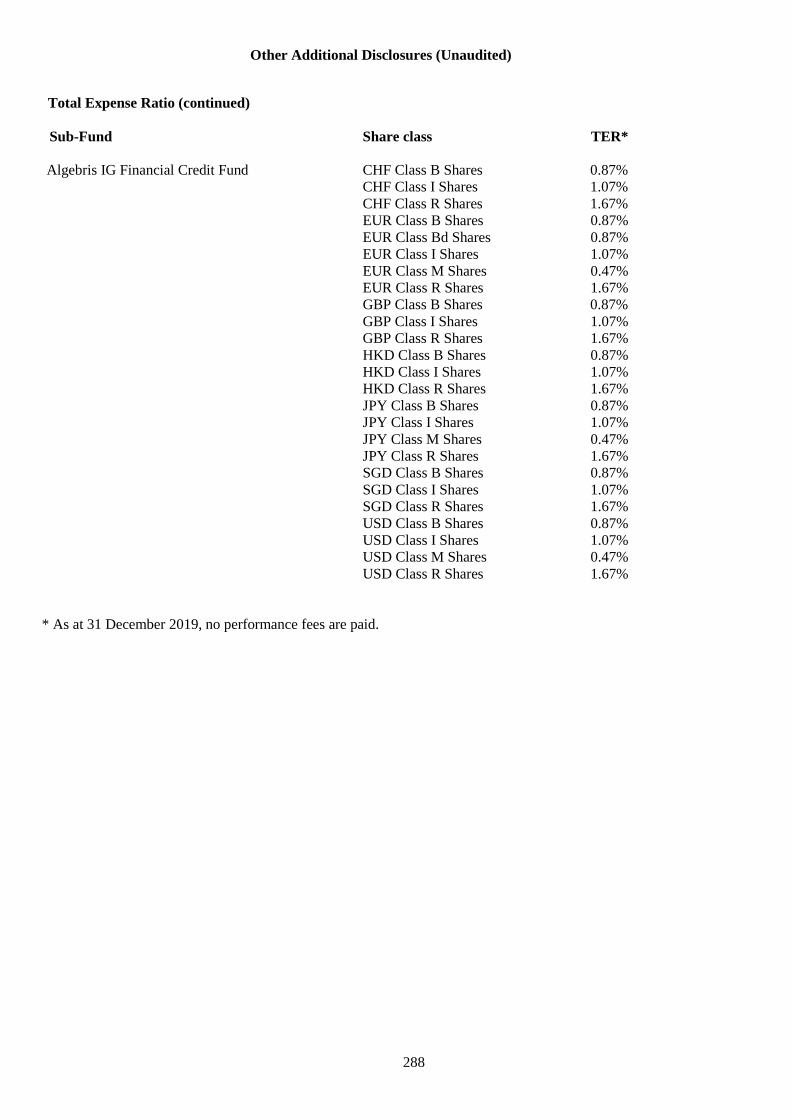
Other Additional Disclosures (Unaudited)
288
Total Expense Ratio (continued)
* As at 31 December 2019, no performance fees are paid.
Sub-Fund Share class TER*
Algebris IG Financial Credit Fund CHF Class B Shares 0.87%
CHF Class I Shares 1.07%
CHF Class R Shares 1.67%
EUR Class B Shares 0.87%
EUR Class Bd Shares 0.87%
EUR Class I Shares 1.07%
EUR Class M Shares 0.47%
EUR Class R Shares 1.67%
GBP Class B Shares 0.87%
GBP Class I Shares 1.07%
GBP Class R Shares 1.67%
HKD Class B Shares 0.87%
HKD Class I Shares 1.07%
HKD Class R Shares 1.67%
JPY Class B Shares 0.87%
JPY Class I Shares 1.07%
JPY Class M Shares 0.47%
JPY Class R Shares 1.67%
SGD Class B Shares 0.87%
SGD Class I Shares 1.07%
SGD Class R Shares 1.67%
USD Class B Shares 0.87%
USD Class I Shares 1.07%
USD Class M Shares 0.47%
USD Class R Shares 1.67%

Other Additional Disclosures (Unaudited)
289
Securities Financing Transaction
A Securities Financing Transaction (“SFT”) is defined per Article 3(11) of the Securities Financing Transaction
Regulation (“SFTR”) as;
a repurchase transaction or a reverse repurchase transaction;
a securities or commodities lending and securities or commodities borrowing;
a buy-sell back transaction or sell-buy back transaction;
a margin lending transaction.
As at 31 December 2019, the Sub-Funds engaged in two types of SFT’s: Total Return Swaps and Repurchase
Agreements.
Algebris Financial Credit Fund
The Algebris Financial Credit Fund has not engaged in any SFT’s as at 31 December 2019.
Data on return and cost for Swap
The following table reflects the return and cost for Swaps broken down between the Sub-Fund, the Investment
Manager and third parties for the year ended 31 December 2019. The returns presented are isolated to the financing
transactions themselves and therefore do not include investment returns on the underlying collateral positions:
Fund Manager
Third
parties
EUR EUR EUR
Total Return Swaps 30,208 - -
Total 30,208 - -
Algebris Financial Income Fund
The amount of securities and commodities on loan as a proportion of total lendable assets (excluding cash and cash
equivalents) was 0% as at 31 December 2019.
Global data
Absolute amount
EUR % of Net assets
Total Return Swaps 6,841,585 1.45%
Total 6,841,585 1.45%
Concentration data
The following table reflects the counter parties across all Total Return Swaps as at 31 December 2019, is as follows:
Counterparty
Swaps
EUR
HSBC Bank Plc 6,841,585
Total
6,841,585

Other Additional Disclosures (Unaudited)
290
Securities Financing Transaction (continued)
Algebris Financial Income Fund (continued)
Aggregate Transaction Data
Counterparty Type of SFT
Maturity tenor
(SFTs/Total
Return Swaps)
Market
Value
(EUR) MTM (EUR)
Country of
counterparty
establishment
(not collateral)
Settlement and
clearing
HSBC Bank Plc TRS
Three months to one
year - 6,841,585 United Kingdom Bilateral
The Company does not segregate cash collateral received and as such there is no segregation of any reinvestment
return on cash collateral for the year to 31 December 2019.
The Company has no custody accounts in existence specifically for the safekeeping of collateral received.
Safekeeping
Depositary Collateral assets safe-kept
EUR
HSBC Bank Plc 16,575,903
Total 16,575,903
The proportion of collateral held in segregated accounts is 100%.
Data on return and cost for Swap
The following table reflects the return and cost for Swaps broken down between the Sub-Fund, the Investment
Manager and third parties for the year ended 31 December 2019. The returns presented are isolated to the financing
transactions themselves and therefore do not include investment returns on the underlying collateral positions:
Fund Manager
Third
parties
EUR EUR EUR
Total Return Swaps (414) - -
Total (414) - -

Other Additional Disclosures (Unaudited)
291
Securities Financing Transaction (continued)
Algebris Financial Equity Fund
The amount of securities and commodities on loan as a proportion of total lendable assets (excluding cash and cash
equivalents) was 0% as at 31 December 2019.
Global data
Absolute amount
EUR % of Net assets
Total Return Swaps 2,559,462 3.53%
Total 2,559,462 3.53%
Concentration data
The following table reflects the counter parties across all Total Return Swaps contracts as at 31 December 2019, is as
follows:
Counterparty
Swaps
EUR
HSBC Bank Plc 2,559,462
Total 2,559,462
Aggregate Transaction Data
Counterparty Type of SFT
Maturity tenor
(SFTs/Total Return
Swaps)
Market
Value
(EUR) MTM (EUR)
Country of
counterparty
establishment
(not collateral)
Settlement
and clearing
HSBC Bank Plc TRS
Three months to one
year 2,559,462 United Kingdom Bilateral
The Company does not segregate cash collateral received and as such there is no segregation of any reinvestment
return on cash collateral for the year to 31 December 2019.
The Company has no custody accounts in existence specifically for the safekeeping of collateral received.
Safekeeping
Depositary Collateral assets safe-kept
EUR
HSBC Bank Plc 6,484,835
Total 6,484,835
The proportion of collateral held in segregated accounts is 100%.

Other Additional Disclosures (Unaudited)
292
Securities Financing Transaction (continued)
Algebris Financial Equity Fund (continued)
Data on return and cost for Swap
The following table reflects the return and cost for Swaps broken down between the Sub-Fund, the Investment
Manager and third parties for the year ended 31 December 2019. The returns presented are isolated to the financing
transactions themselves and therefore do not include investment returns on the underlying collateral positions:
Fund Manager
Third
parties
EUR EUR EUR
Total Return Swaps (66,874) - -
Total (66,874) - -
Algebris Macro Credit Fund
The amount of securities and commodities on loan as a proportion of total lendable assets (excluding cash and cash
equivalents) was 0% as at 31 December 2019.
Global data
Absolute amount
EUR % of Net assets
Repurchase Agreement 1,870,131 0.52%
Total Return Swaps 2,753,383 0.35%
Total 4,623,514 0.87%
The following table reflects the counter parties across all Total Return Swaps and Repurchase Agreements contracts as
at 31 December 2019, is as follows:
Counterparty
Swaps
EUR
JP Morgan Securities Plc 1,041,861
Goldman Sachs International 1,028,567
Merrill Lynch International 560,109
BNP Paribas S.A. 112,091
HSBC Bank Plc 10,755
Total
2,753,383
Counterparty
Repurchase Agreements
EUR
JP Morgan Securities Plc 1,870,131
Total
1,870,131
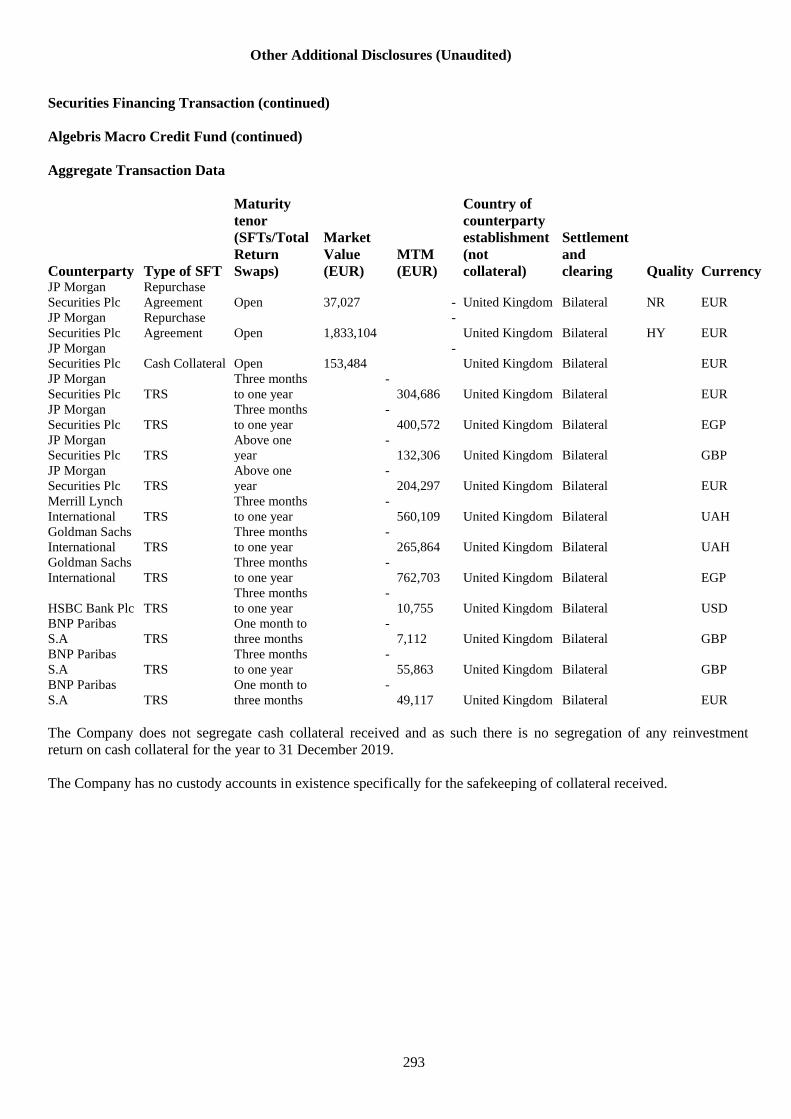
Other Additional Disclosures (Unaudited)
293
Securities Financing Transaction (continued)
Algebris Macro Credit Fund (continued)
Aggregate Transaction Data
Counterparty Type of SFT
Maturity
tenor
(SFTs/Total
Return
Swaps)
Market
Value
(EUR)
MTM
(EUR)
Country of
counterparty
establishment
(not
collateral)
Settlement
and
clearing Quality Currency JP Morgan
Securities Plc
Repurchase
Agreement Open 37,027 - United Kingdom Bilateral NR EUR
JP Morgan
Securities Plc
Repurchase
Agreement Open 1,833,104
-
United Kingdom Bilateral HY EUR
JP Morgan
Securities Plc Cash Collateral Open 153,484
-
United Kingdom Bilateral EUR
JP Morgan
Securities Plc TRS
Three months
to one year
-
304,686 United Kingdom Bilateral EUR
JP Morgan
Securities Plc TRS
Three months
to one year
-
400,572 United Kingdom Bilateral EGP
JP Morgan
Securities Plc TRS
Above one
year
-
132,306 United Kingdom Bilateral GBP
JP Morgan
Securities Plc TRS
Above one
year
-
204,297 United Kingdom Bilateral EUR
Merrill Lynch
International TRS
Three months
to one year
-
560,109 United Kingdom Bilateral UAH
Goldman Sachs
International TRS
Three months
to one year
-
265,864 United Kingdom Bilateral UAH
Goldman Sachs
International TRS
Three months
to one year
-
762,703 United Kingdom Bilateral EGP
HSBC Bank Plc TRS
Three months
to one year
-
10,755 United Kingdom Bilateral USD
BNP Paribas
S.A TRS
One month to
three months
-
7,112 United Kingdom Bilateral GBP
BNP Paribas
S.A TRS
Three months
to one year
-
55,863 United Kingdom Bilateral GBP
BNP Paribas
S.A TRS
One month to
three months
-
49,117 United Kingdom Bilateral EUR
The Company does not segregate cash collateral received and as such there is no segregation of any reinvestment
return on cash collateral for the year to 31 December 2019.
The Company has no custody accounts in existence specifically for the safekeeping of collateral received.
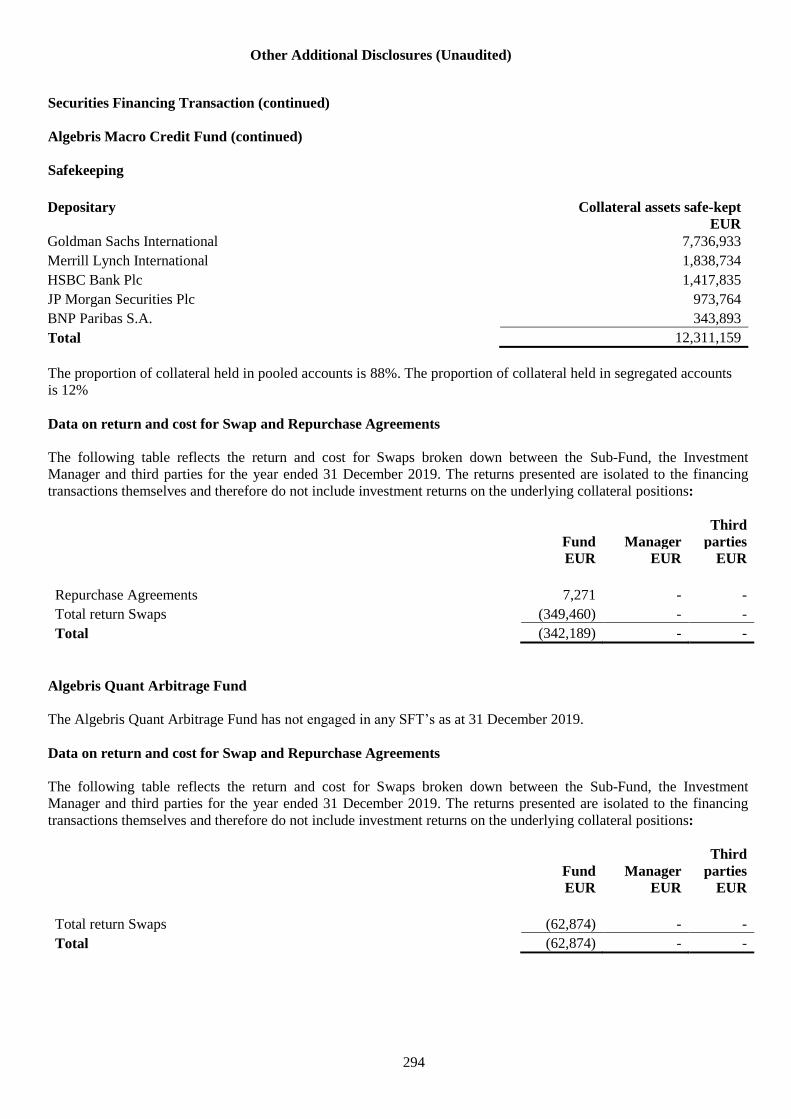
Other Additional Disclosures (Unaudited)
294
Securities Financing Transaction (continued)
Algebris Macro Credit Fund (continued)
Safekeeping
Depositary Collateral assets safe-kept
EUR
Goldman Sachs International 7,736,933
Merrill Lynch International 1,838,734
HSBC Bank Plc 1,417,835
JP Morgan Securities Plc 973,764
BNP Paribas S.A. 343,893
Total 12,311,159
The proportion of collateral held in pooled accounts is 88%. The proportion of collateral held in segregated accounts
is 12%
Data on return and cost for Swap and Repurchase Agreements
The following table reflects the return and cost for Swaps broken down between the Sub-Fund, the Investment
Manager and third parties for the year ended 31 December 2019. The returns presented are isolated to the financing
transactions themselves and therefore do not include investment returns on the underlying collateral positions:
Fund Manager
Third
parties
EUR EUR EUR
Repurchase Agreements 7,271 - -
Total return Swaps (349,460) - -
Total (342,189) - -
Algebris Quant Arbitrage Fund
The Algebris Quant Arbitrage Fund has not engaged in any SFT’s as at 31 December 2019.
Data on return and cost for Swap and Repurchase Agreements
The following table reflects the return and cost for Swaps broken down between the Sub-Fund, the Investment
Manager and third parties for the year ended 31 December 2019. The returns presented are isolated to the financing
transactions themselves and therefore do not include investment returns on the underlying collateral positions:
Fund Manager
Third
parties
EUR EUR EUR
Total return Swaps (62,874) - -
Total (62,874) - -
Other Additional Disclosures (Unaudited)
295
Securities Financing Transaction (continued)
Algebris Allocation Fund
The Algebris Allocation Fund has not engaged in any SFT’s as at 31 December 2019.
Algebris Core Italy Fund
The Algebris Core Italy Fund has not engaged in any SFT’s as at 31 December 2019.
Algebris IG Financial Credit Fund
The Algebris IG Financial Credit Fund has not engaged in any SFT’s as at 31 December 2019.

Other Additional Disclosures (Unaudited)
296
UCITS V – Disclosure of Remuneration Policy (Unaudited)
Algebris UCITS Funds Plc (the “Company”) has implemented a remuneration policy pursuant to Directive
2014/91/EU of the European Parliament and of the Council of 23 July 2014 amending Directive 2009/65/EC on the
coordination of laws, regulations and administrative provisions relating to undertakings for collective investment in
transferable securities (UCITS) as regards to depositary functions, remuneration policies and sanctions (the “UCITS
V Directive”).
This remuneration policy has been adopted by the Board of Directors in its supervisory function and who will be
responsible for (i) reviewing the general principles of the remuneration policy on an annual basis and (ii) ensuring
that the implementation of the remuneration policy is subject to review on an annual basis. Any revisions to the
remuneration policy will also require its approval.
The Company is a self-managed investment company with no employees, other than the Board of Directors. This
remuneration policy addresses the remuneration requirements of the UCITS V Directive as they apply to the
Company. The Company will ensure that appropriate contractual arrangements are put in place with entities to
which investment management is delegated to ensure that the UCITS remuneration rules are not circumvented or
that such delegates are subject to regulatory requirements on remuneration which are equally effective as those
applicable under the ESMA Guidelines on Sound Remuneration Policies under the UCITS Directive ESMA
2016/575 (the “ESMA Guidelines”). Contractual arrangements relate to any payments made to delegates’ identified
staff as compensation for performance of investment management activities on behalf of the Company.
The Independent members of the Board of Directors receive a fixed fee only and do not receive performance-based
remuneration therefore avoiding a potential conflict of interest. The basic fee of a Non-Executive Board member is
set at a level that is on par with the rest of the market and reflects the qualifications and contribution required in
view of the Company’s business strategy, objectives, values and the values of its Shareholders, the extent of the
responsibilities of the Board and the number of board meetings. No pension contributions are payable on Non-
Executive Board members’ fees. The non-independent director receives no fees.
The Designated Persons (KB Associates) do not receive remuneration of any kind individually from the Company.
The services of the Designated Persons are provided to the Company pursuant to an engagement letter between
Clifton Fund Consulting Limited trading as KB Associates (“KBA”) and the Company whereby the Designated
Persons are seconded to the Company on a part-time basis.
Taking into account the Company’s size, internal organisation nature, the scope and complexity of its activities, the
Board of Directors has decided to dis-apply the remuneration committee requirement. The Board is satisfied that this
disapplication is reconcilable with the risk profile, risk appetite and the strategy of the Company and its Sub-Funds.
Additionally, as the Company does not pay any variable remuneration to any of the Directors appointed by the
Company, the “pay out process rules” as set out in the UCITS V Directive are not applicable to the Company and an
assessment of whether they need to be dis-applied is not required.
Remuneration of Algebris (UK) Limited (the “Investment Manager”) split into fixed and variable is detailed in Note
6 of the financial statements. During the year, remuneration of €89,942,399 was paid by the Company to the
Investment Manager of which €24,898,121 remained outstanding at year end.
The total remuneration of the entire staff of the Investment Manager during the period was €13.3m divided into
£10.6m fixed remuneration and €12.5m variable remuneration. There were 73 beneficiaries. The aggregate amount
of remuneration of senior management (including executives) and members of staff of the Investment Manager
whose actions have a material impact on the risk profile of the Company during the year was €5.5m and €7.8m,
respectively. An allocation or breakdown of the total remuneration figures in relation to the Company does not exist
and is not readily available.