algebraic graph-assisted bidirectional transformers for
TRANSCRIPT

Algebraic Graph-assisted BidirectionalTransformers for Molecular PredictionDong Chen
Michigan State UniversityKaifu Gao
Michigan State UniversityDuc Nguyen
Department of Mathematics, University of KentuckyXin Chen
Peking UniversityYi Jiang
School of Advanced Materials, Peking University, Shenzhen Graduate SchoolGuowei Wei ( [email protected] )
Michigan State University https://orcid.org/0000-0001-8132-5998Feng Pan
Peking University Shenzhen Graduate School https://orcid.org/0000-0002-8216-1339
Article
Keywords: Algebraic graph, Transformer, Self-supervised Learning, Toxicity, Partition Coeffcient, Multi-task Learning
Posted Date: January 29th, 2021
DOI: https://doi.org/10.21203/rs.3.rs-152856/v1
License: This work is licensed under a Creative Commons Attribution 4.0 International License. Read Full License
Version of Record: A version of this preprint was published at Nature Communications on June 10th,2021. See the published version at https://doi.org/10.1038/s41467-021-23720-w.
Algebraic Graph-assisted Bidirectional Transformers for Molecular1
Prediction2
Dong Chen1,2, Kaifu Gao2, Duc Duy Nguyen3, Xin Chen1, Yi Jiang1, Guo-Wei Wei ∗2,4,53
and Feng Pan †14
1School of Advanced Materials, Peking University, Shenzhen Graduate School, Shenzhen 518055, China5
2Department of Mathematics, Michigan State University, MI, 48824, USA6
3Department of Mathematics, University of Kentucky, KY 40506, USA7
4Department of Electircal and Computer Engineering, Michigan State University, MI 48824, USA8
5Department of Biochemistry and Molecular Biology, Michigan State University, MI 48824, USA9
Abstract The ability of quantitative molecular prediction is of great significance to drug discovery, human10
health, and environmental protection. Despite considerable efforts, quantitative prediction of various molec-11
ular properties remains a challenge. Although some machine learning models, such as bidirectional encoder12
from transformer, can incorporate massive unlabeled molecular data into molecular representations via a13
self-supervised learning strategy, it neglects three-dimensional (3D) stereochemical information. Algebraic14
graph, specifically, element-specific multiscale weighted colored algebraic graph, embeds complementary 3D15
molecular information into graph invariants. We propose an algebraic graph-assisted bidirectional trans-16
former (AGBT) model by fusing representations generated by algebraic graph and bidirectional transformer,17
as well as a variety of machine learning algorithms, including decision trees, multitask learning, and deep18
neural networks. We validate the proposed AGBT model on five benchmark molecular datasets, involv-19
ing quantitative toxicity and partition coefficient. Extensive numerical experiments suggest that AGBT20
outperforms all other existing methods for all these molecular predictions.21
Keywords Algebraic graph, Transformer, Self-supervised Learning, Toxicity, Partition Coefficient, Multi-22
task Learning23
1 Introduction24
The fact that there is no specific and effective drug for coronavirus disease 2019 (COVID-19) one25
year after the outbreak reminds us that drug discovery remains a grand challenge. Rational drug discovery26
involves a long list of molecular properties, including binding affinity, toxicity, partition coefficient, solubility,27
pharmacokinetics, pharmacodynamics, etc. [1] Experimental determination of molecular properties is very28
time consuming and expensive. Additionally, experimental testing involving animals or humans is subject29
to serious ethical concerns. Therefore, various computer-aided or in silico approaches have become highly30
attractive because they can produce quick results without seriously sacrificing accuracy in many cases. [2]31
One of the most popular approaches is the quantitative structure activity relationship (QSAR) analysis. It32
assumes that similar molecules have similar bioactivities and physicochemical properties. [3]33
∗Corresponding author: [email protected]†Corresponding author: [email protected]
1

Recently, machine learning (ML), including deep learning (DL), has emerged as a powerful approach for34
data-driven discovery of in molecular science. For example, generative adversarial networks (GANs),[4, 5]35
graph convolutional networks (GCNs),[5, 6, 7], convolutional neural networks (CCNs)[8], and recurrent36
neural networks (RNNs) [9, 10], have become popular for drug discovery and molecular analysis.[11, 12, 9].37
However, DL methods require large datasets to determine their large number of weights and might not be38
competitive for small datasets.[13]39
Although DL methods, particularly CNN and GANs, can automatically extract features from simple40
data, such as images and/or texts, the performance of ML and DL methods for molecules, particularly macro-41
molecules, crucially depends on the molecular descriptors or molecular representations due to their intricate42
structural complexity [14]. Earlier molecular descriptors are designed as the profiles or fingerprints of inter-43
pretable physical properties in a bit string format [15]. Various fingerprints have been developed in the past44
few decades.[16, 17] There are four main categories of two-dimensional (2D) fingerprints [17], namely sub-45
structure key-based fingerprints,[18] topological or path-based fingerprints,[19] circular fingerprints,[16] and46
pharmacophore fingerprints.[20] However, 2D fingerprints lack three-dimensional (3D) structural information47
of molecules, especially stereochemical descriptions.48
To deal with the aforementioned problems, 3D-structure based fingerprints have been developed to49
capture 3D patterns of molecules. [21] However, the molecular structural complexity and high dimensionality50
are the major obstacles in designing efficient 3D fingerprints [14]. Recently, a variety of 3D molecular51
representations based on advanced mathematics, including algebraic topology [8, 22], differential geometry52
[23], and algebraic graph [24] have been proposed to simplify the structural complexity and dimensionality53
of molecules and biomolecules [14]. These methods have had tremendous success in protein classification,54
virtual screening, and the predictions of solubility, solvation free energies, toxicity, partition coefficients,55
protein folding stability changes upon mutation, and Drug Design Data Resource (D3R) Grand Challenges56
[25, 14], a worldwide competition series in computer-aided drug design. However, this approach depends on57
the availability of reliable 3D molecular structures.58
Alternatively, a self-supervised learning (SSL) strategy can be used to pre-train an autoencoder model59
that can produce latent space vectors as molecular representations without 3D molecular structures. The60
initial development of SSL was due to the need for natural language processing (NLP) [26, 27]. For example,61
bidirectional encoder representations from transformers (BERT) is designed to pre-train deep bidirectional62
transformer representations from unlabeled texts. [26] The techniques developed in understanding sequential63
words and sentences in NLP have been used for understanding the fundamental constitutional principles of64
molecules expressed as a simplified molecular-input line-entry system (SMILES) [28]. Unlabeled SMILES65
strings can be considered as text-based chemical sentences and are used as inputs for SSL pre-training.66
[27, 29] It is worth noting that the availability of large public chemical databases such as ZINC [30] and67
ChEMBL [31] makes SSL a viable option for molecular representation generation. However, latent-space68
representations ignore much stereochemical information, such as the dihedral angle [32] and chirality [33].69
Additionally, latent-space representations lack specific physical and chemical knowledge about task-specific70
properties. For example, van der Waals interactions can play a greater role than the covalent interactions in71
many drug-related properties [34], and need to be considered in the description of these properties.72
In this work, we introduce algebraic graph-assisted bidirectional transformer (AGBT) to construct new73
molecular representations via combining the advantages of 3D element-specific weighted colored algebraic74
graphs and deep bidirectional transformers. The element-specific weighted colored algebraic graphs generate75
intrinsically low-dimensional molecular representations, called algebraic graph-based fingerprints (AG-FPs),76
that significantly reduce the molecular structural complexity while retaining essentially physical/chemical77
information and physical insight. [24] Deep bidirectional transformer (DBT) utilizes an SSL-based pre-78
training process to learn fundamental constitutional principles from massive unlabeled SMILES data and79
a fine-tuning procedure to further train the model with task-specific data. The resulting molecular finger-80
prints, called bidirectional transformer-based fingerprints (BT-FPs), are latent-space vectors of the DBT.81
The proposed AGBT model is applied to five benchmark molecular datasets involving quantitative toxicity82
2

and partition coefficient. [2, 13, 35, 36] Extensive validation and comparison suggest that the proposed83
AGBT model gives rise to some of the best predictions of molecular properties.84
2 Results85
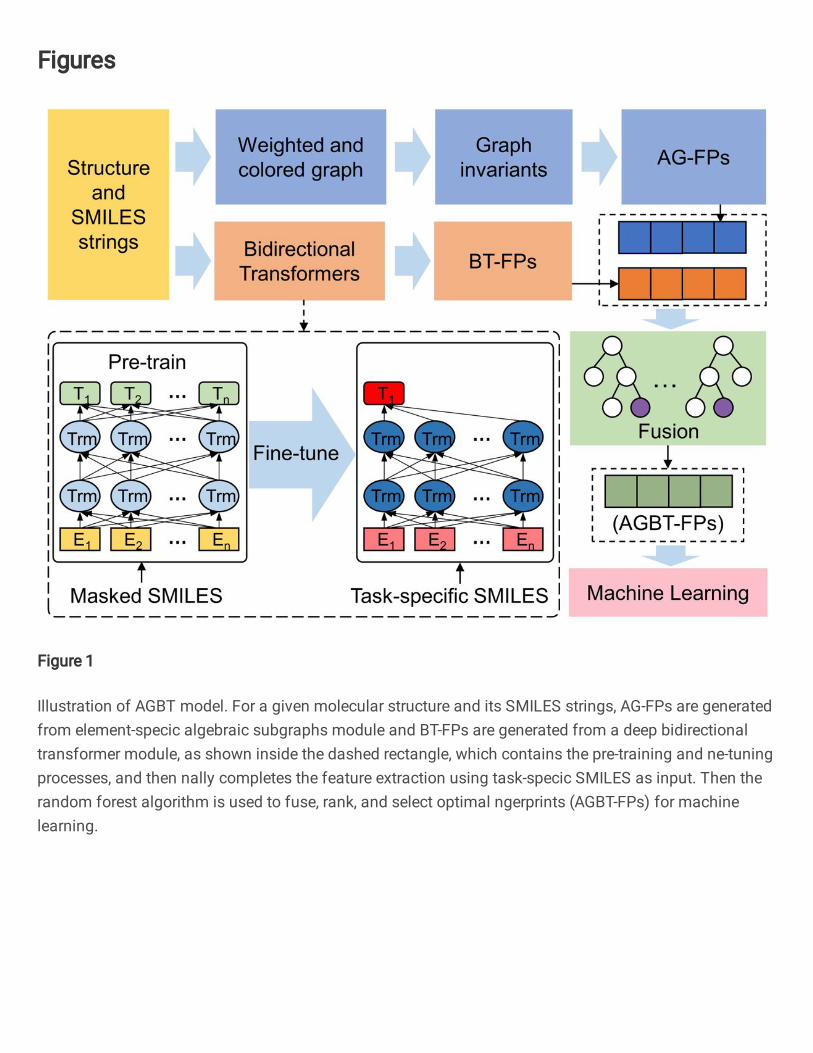
Figure 1: Illustration of AGBT model. For a given molecular structure and its SMILES strings, AG-FPs
are generated from element-specific algebraic subgraphs module and BT-FPs are generated from a deep
bidirectional transformer module, as shown inside the dashed rectangle, which contains the pre-training and
fine-tuning processes, and then finally completes the feature extraction using task-specific SMILES as input.
Then the random forest algorithm is used to fuse, rank, and select optimal fingerprints (AGBT-FPs) for
machine learning.
In this section, we present the proposed AGBT model and its results for molecular prediction on86
five datasets, i.e., LD50 dataset, IGC50 dataset, LC50 dataset, LC50DM dataset, and partition coefficient87
dataset. Table S1 lists the basic information of these five datasets and the CheMBL [31] dataset we used in88
the pre-training dataset. More descriptions of the datasets can be found in Section S1 of the Supplementary89
Information.90
Algebraic graph-assisted deep bidirectional transformers (AGBT) As shown in Figure 1, the pro-91
posed AGBT consists of four major modules: AG-FP generator (i.e., the blue rectangles), BT-FP generator92
(i.e., the orange rectangles), random forest (RF)-based feature-fusion module (i.e., the green rectangle), and93
downstream machine learning module (i.e., the pink rectangle). For the graph fingerprint generation, we use94
element-specific multiscale weighted colored algebraic graphs to encode the chemical and physical interac-95
tions into graph invariants and capture 3D molecular structural information. The BT-FPs have created in96
two steps: an SSL-based pre-training step with massive unlabeled input data and a task-specific fine-tuning97
step. The task-specific fine-tuning step can be executed in two ways. The first way is merely to adopt the98
same SSL procedure to fine-tune the model with task-specific data and generate their BT-FPs. The other99
way is to utilize labels in task-specific data via a supervised learning (SL) procedure to fine-tuning model100
and generate latent-space vectors of task-specific data, denoted as BTs-FPs (i.e, the orange vector). The101
random forest algorithm is used to rank the importance of fused AG-FP and BT-PF features and select an102
optimal set of AGBT-FPs of a fixed number of components. The downstream machine learning algorithms103
are fed with optimal features to achieve the best performance on four benchmark toxicity datasets.104
3

We carry out our final predictions by using some standard machine learning algorithms, namely, gradient105
boosted decision tree (GBDT) and deep neural networks (DNNs), including single-task DNN (ST-DNN,106
Figure S7a) and multitask DNN (MT-DNN, Figure S7b). Our training follows the traditional pipeline.[37]107
To evaluate the variance from machine learning predictions, we repeat our calculations 20 times on each set108
of parameters and use the average result as the final prediction. In this work, squared Pearson correlation109
coefficient (R2) and root-mean-square error (RMSE) are used to assess the accuracy of predictions. Further110
details on our AGBT model are given in the Section 5 and Section S2 of the Supplementary Information.111
Toxicity prediction Toxicity, a critical issue to consider in drug lead optimization, measures the degree112
to which a chemical compound can affect an organism adversely.[2] Indeed, toxicity and side effect are113
responsible for more than half of drug candidate failures on their path to the market.[38] The LC50DM set114
refers to the concentration of test chemicals in the water in milligrams per liter that cause 50% Daphnia115
Magna to die after 48 h. Its size is the smallest among the four datasets. Among its 353 molecules, 283116
are used as a training set and the rest 70 as a test set [2]. The small size leads to difficulties in building a117
robust prediction model. The overfitting issue poses a challenge to traditional machine learning methods if a118
large number of descriptors is used. MT-DNN is a method to extract information from data sets that share119
certain statistical distributions, which can effectively improve the predictive ability of models on small data120
sets [2, 13]. Based on the AGBT framework, we fuse AG-FPs and BTs-FPs, i.e., BT-FPs with a supervised121
fine-tuning procedure for task-specific data. We applied MT-DNN in the downstream task and obtained122
R2=0.830 and RMSE=0.743. As shown in Figure 2b, our model yields the best result, which is over 13%123
better than the previous best score of R2 = 0.733. This result indicates the power of our method.124
The IGC50 set is the second-largest toxicity set and its toxicity values range from 0.334 −log10
mol/L125
to 6.36 −log10
mol/L [2]. As shown in Figure 2a, the R2s from different methods fluctuate from 0.274 to126
0.810. Karim et al. also studied IGC50 dataset, but their training set and test set are different from those127
of others [2] and thus their results cannot be included in the present comparison. For our method, the R2 of128
MT-DNN with AGBT-FP is 0.842, which exceeds that of all existing methods. It suggests that our AGDMT129
framework not only can overcome overfitting problem, but also is not sensitive to dataset size.130
The oral rat LD50 set measures the number of chemicals that can kill half of the rats when orally131
ingested.[43, 35, 36] This dataset is the largest set among the four sets with as many as 7413 compounds.132
However, a large range of values in this set makes it relatively difficult to predict. [44] Gao et al. [17] studied133
this problem using many 2D molecular fingerprints and various machine learning methods, which includes134
GBDT, ST-DNN, and MT-DNN. However, the prediction accuracy of the LD50 data set did not improve135
much. As shown in Table 1, the R2 values for all existing methods range from 0.392 to 0.643. In our case, our136
method can achieve R2 0.671 and RMSE 0.554 log(mol/L), which are better than those from other existing137
methods.138
LC50 dataset reports the concentration of test chemicals in water by milligrams per liter that cause139
50% of fathead minnows to die after 96 hours. [43] Wu et al.[2] used physical information including energy,140
surface energy, electric charge and so on to construct molecular descriptors. These physical properties are141
related to molecular toxicity, achieving the prediction accuracy of R2 0.771. In this work, our AGBT-FPs142
with MT-DNN deliver the best R2 of 0.776. We also test the performance of our BT-FPs, which achieve R2143
0.783 with MT-DNN. As listed in Table 1, our model outperforms all other existing methods.144
Partition coefficient prediction Partition coefficient, denoted P , derived from the ratio of the concen-145
tration of a mixture of two mutually insoluble solvents at equilibrium, measures the drug relevance of the146
compound as well as its hydrophobicity to the human bodies. The logarithm of this coefficient is denoted as147
logP .[40] The training set used for partition coefficient prediction includes 8199 molecules. [41] A set of 406148
molecules approved by the Food and Drug Administration (FDA) is used as organic drugs were used as the149
test set for logP prediction[41] and its logP values range from -3.1 to 7.57. The comparison of different pre-150
diction methods for FDA molecular data set are listed in Table 1. It should be mentioned that the ALOGPS151
4

Table 1: Comparison of the R2 of various predicting methods on the LD50, LC50, and FDA Approved Small-Molecule data
sets.
LD50 LC50 FDA
Method R2 Method R2 Method R2
AGBT-FP 0.671 AGBT-FP 0.776/0.783a AGBTs-FP 0.905
MACCS[17] 0.643 BTAMDL2[13] 0.750 ESTD-1[40] 0.893
FP2[17] 0.631 ESTDS[2] 0.745 Estate2[17] 0.893
HybridModel[39] 0.629 Daylight-MTDNN[17] 0.724 XLOGP3[41] 0.872
Daylight[17] 0.624 Hierarchical[39] 0.710 Estate1[17] 0.870
BESTox[42] 0.619 Single Model[43] 0.704 MACCS[17] 0.867
BTAMDL1[13] 0.605 Estate1 MTDNN[17] 0.694 ECFP[17] 0.857
Estate1[17] 0.605 Group contribution[39] 0. 686 ESTD-2[40] 0.848
Estate2[17] 0.589 HybridModel[39] 0.678 XLOGP3-AA[41] 0.847
ECFP[17] 0.586 Estate2[17] 0.662 CLOGP[41] 0.838
Hierarchical[43] 0.578 FDA[17] 0.626 Daylight[17] 0.819
Nearest neighbor[43] 0.557 FP2[17] 0.609 TOPKAT[41] 0.815
FDA[43] 0.557 MACCS[17] 0.608 xlogp2[41] 0.800
Pharm2D[17] 0.443 ECFP[17] 0.573 alogp98[41] 0.777
ERG[17] 0.392 Pharm2D[17] 0.528 KOWWIN[41] 0.771
ERG[17] 0.348 HINT[17] 0.491a only BT-FP is used as input;
model established by Tetko et al.[45] can also be used in logP prediction, however, there is no guarantee152
that the training set of ALOGPS are independent of the test set and thus its result is not included in the153
comparison. As we can see from the Table 1, our AGBTs-FPs with STDNN model produce the best R2 of154
0.905. The predicted result of AGBTs-FPs with STDNN model for FDA data set are shown in Figure S8c.155
Notice that the neural network structure of the downstream STDNN model is still the same as the one in156
toxicity prediction. It proves robust of our AGBTs-FPs.157
None of all other existing methods can provide the best prediction simultaneously for all LD50, IGC50,158
LC50, and LC50DM. However, our AGBT framework delivers state-of-the-art performance on all four toxicity159
data sets as well as in the FDA partition coefficient data set. This indicates the power of our AGBT160
framework and its stable performance on datasets with different sizes and different molecular properties.161
3 Discussion162
In this section, we discuss how the AGBT model brings new insights to quantitative molecular prop-163
erty predictions, as well as the enhancement that algebraic graph-based fingerprints and deep bidirectional164
transformers-based fingerprints give rise to our proposed AGBT method.165
Impact of algebraic graph descriptor Pre-trained on a large number of molecules, deep SSL-based166
molecular fingerprints could achieve high accuracy. Many deep learning-based molecular fingerprints have167
shown a better performance than conventional fingerprints. However, deep learning fingerprints, including168
our BT-FPs, are prone to the loss of molecular stereochemical information. Therefore, we propose the use169
of algebraic graph theory in association with our AGBT framework to retain stereochemical and physical170
information and enhance the performance of original BT-FPs. Moreover, in this work, we set the total171
number of molecular fingerprints after feature fusion to 512, and thus we only need to optimize one neural172
network architecture. Our AGBT model is an efficient framework for molecular property predictions.173
5

Figure 2: a and b illustrate the comparison of the R2 by various methods for IGC50 set and LC50DM set, respectively.
AGBTs-FP means a fine-tuning process is applied to AGBT-FP. The other results were taken from Refs. 2, 17, 39, 13, 43, 23.
c, The bar charts illustrate the average R2 of AGBT-FPs and BT-FPs with three machine learning algorithm for the IGC50
dataset. All points in the figure show the R2 of the prediction from the 20 repeated experiments. d, The bar charts illustrate
the average R2 of AGBT-FPs and AGBTs-FPs with three machine learning algorithm for the LC50DM dataset. All points in
the figure show the R2 of the prediction from the 20 repeated experiments. e, Visualization of LD50 set. The axes are the top
three important features of AGBT-FPs. f, Predicted results of AGBT-FPs with MT-DNN model for IGC50 and LC50DM set,
respectively. The box plots in each figure statistic the R2 for 20 experiments. g, Variance ratios in the first two components
from the principal component analysis (PCA) are used to visualize the four toxicity data sets. h, Variance ratios in the first
two components from the PCA are used to visualize the four toxicity datasets.
Figure 2f shows the best prediction performance on the IGC50 and LC50DM datasets using the AGBT174
framework, namely, R2 = 0.842 on IGC50 and R2 = 0.830 on LC50DM. The orange bar at each point is175
the deviation of predicted toxicity with 20 experiments. For each experiment, R2 was calculated and the176
distribution of R2 is shown in subfigures. The performance on the LD50 and LC50 datasets are shown177
in Figure S8b. For LD50, IGC50, and LC50DM datasets, the best prediction results are obtained by the178
algebraic graph-assisted fingerprints. For the LC50 dataset, the AGBT-FP prediction of 0.776 is very close179
to the best performance of 0.783 obtained by BT-FPs. This indicates that the AGBT model can produce180
stable and robust prediction performance on various datasets. Moreover, For the IGC50 dataset, the R2 of181
the toxicity predictions from the three machine learning algorithms, i.e., GBDT, ST-DNN, and MT-DNN,182
are shown in the bar plot of Figure 2c. All points in the figure show the R2 of the prediction from the 20183
repeated experiments. It is obvious that for the IGC50 dataset, AGBT-FP performs better than BT-FP with184
GBDT and MT-DNN. However, when ST-DNN is used as a predictor, AGBT-FP has higher fluctuations in185
its predictions, resulting in a worse average of R2. AG-FPs and BT-FPs are produced from two different186
molecular fingerprint generators and have the dimensions of 1800 and 512, respectively. The fused molecular187
6

Table 2: Comparison of Prediction Results of AGBT-FP and AGBTs-FP for the toxicity datasets.
AGBT-FP AGBTs-FP
Datasets R2 RMSE R2 RMSE
LD50 0.671 0.554 0.612 0.606
IGC50 0.842 0.391 0.805 0.437
LC50 0.776 0.703 0.750 0.734
LC50DM 0.781 0.824 0.830 0.743
fingerprints, AGBT-FPs, return 512 components with heterogeneous information from AG-FPs and BT-FPs188
and require a longer training time.189
For the IGC50 dataset, only 1434 molecular structures were used to train the AGBT model, leading190
to a high fluctuation in prediction. Similar situations are found in the LD50 dataset and LC50DM dataset,191
as shown in Figure S9. For the LC50 dataset, the best result is obtained with BT-FPs, but the result of192
AGBT-FPs also reaches R2 0.776, exceeding all the other existing methods. Therefore, the fusion of AG-193
FPs and BT-FPs improves the accuracy of predictions for most datasets. Molecular descriptors based on194
mathematics complement to data-driven latent space descriptors.195
Predictive power of fine-tuning strategies In this work, we develop two strategies in the fine-tuning196
stage: SSL and SL with task-specific data. It is found that SSL strategy (See Figure S3) performs better on197
LD50, IGC50, and LC50 data sets, as shown in Figure 2f and Figure S8, while SL strategy with task-specific198
data (See Figure S4) is the best for LC50DM dataset. The LC50DM dataset is the smallest set with only 283199
molecules in its training set. Conventional methods cannot capture enough information from such a small200
dataset to achieve satisfactory results. In the AGBT model, the pre-training strategy with bidirectional201
transformer enables the model to acquire a general knowledge of molecules. During the fine-tuning phase,202
we further feed the model with four toxicity datasets with labels, and the labeled data guide the model to203
specifically extract toxin-related information from all the training data. Then we complement fine-tuning204
fingerprints with algebraic graph descriptors to ultimately enhance the robustness of the AGBT model and205
improve the performance on the LC50DM set (r2=0.830, RMSE=0.743).206
Figure 2d shows the performance of AGBT-FPs and AGBTs-FPs on the LC50DM dataset using three207
advanced machine learning methods. The bar charts show the R2 of prediction results with three machine208
learning algorithms and the subplot displays the distribution of R2 in 20 experiments. This figure shows that209
AGBTs-FPs have an excellent performance with all three machine learning algorithms, with R2 values being210
0.822 (GBDT), 0.815 (ST-DNN), and 0.830 (MT-DNN), respectively. This indicates that AGBTs-FPs can211
capture general toxin-related information during the sequential fine-tuning process. There is no significant212
difference among the three predictions based on GBDT, ST-DNN, and MT-DNN. In contrast, AGBT-FPs213
are derived from the model after self-supervised training. Their pre-training and fine-tuning processes do214
not involve any labeled data. The resulting prediction accuracies with GBDT and ST-DNN are quite low215
with R2 being 0.587 and 0.659 respectively. Through the MT-DNN model, the performance of AGBT-FPs216
can be significantly improved from R2 0.587 to 0.781.217
The above discussion indicates that SSL can acquire general molecular information and universal molec-218
ular descriptors without the guidance of labels. In downstream tasks, the MT-DNN model can also help to219
extract the task-specific information from related data. As for extremely small datasets, such as the LC50DM220
dataset ( 300 samples), the subsequent fine-tuning with a SL strategy is much more promising. The results221
of all four datasets using AGBT-FPs and AGBTs-FPs with MT-DNN model are shown in Table 2. For222
partition coefficient prediction, a major challenge of the test set (FDA) is that its structures are much more223
complex than that of the training set. So that the supervised learning in the fine-tuning procedure can give224
a better result, the value of R2 for AGBT-FP and AGBTs-FP are 0.901 and 0.885 separately.225
7
Molecular representations and structural genes In chemistry, the properties of molecules, such as226
toxicity, are often determined by some specific functional groups or fragments. Similar to biological genes,227
molecules have some determinants of their properties, which are called structural genes in this work. For some228
path-based fingerprints, such as FP2, a molecule is represented by 256 length vectors, each corresponding229
to a specific fragment. However, for molecular toxicity, it is difficult to achieve the best results from such230
a fingerprint, as shown in Figure 2a and b. The proposed AGBT-FP is a 512-dimensional fingerprint, with231
each dimension being a projection of various physical information about the molecule. In this section, we232
hope to characterize the key dimensions of AGBT-FPs to identify the structural genes.233
Using a random forest algorithm, we performed a feature importance analysis of AGBT-FPs. As shown234
in Figure S10, for the LD50, IGC50, and LC50 datasets, the top three features in the feature importance235
ranking are all from algebraic graph-based descriptors. For the LC50DM dataset, the most important feature236
is from BT-FPs and the 2nd and 3rd important features are from AG-FPs. This implies that the multiscale237
weighted colored algebraic graph-based molecular descriptors contribute the most critical molecular features,238
which are derived from embedding specific physical and chemical information into graph invariants. The top239
three important features of the LD50 set are illustrated in Figure 2e, where each point represents a molecule240
and the toxicity is represented by the color. It is easy to find that the top three important dimensions in241
AGBT-FP, denoted as Feature 1, Feature 2, and Feature 3, divide the molecules into two groups: one can242
be distinguished by Feature 3 and the other is a linear combination of Feature 1 and Feature 2. This means243
the molecule can be classified by just three key dimensions (features), indicating that these three features,244
or structural genes, dominate the intrinsic characteristics of molecules. However, since predicting molecular245
toxicity is complex, it is difficult to directly distinguish the toxicity of each molecule in AGBT-FPs through246
the first three dimensions. Similarly, the visualizations for the IGC50, LC50, and LC50DM datasets can be247
seen in Figure S11.248
We projected both AGBT-FPs and AGBTs-FPs into an orthogonal subspace by principal component249
analysis (PCA). As shown in Figure 2g, the first two principal components of AGBT-FPs can roughly divide250
the data into two clusters and the molecules in the same cluster have similar toxicity. Similarly, the top two251
components of AGBTs-FPs are given in Figure 2h. Along the direction of the first principal components, the252
molecular data can be well clustered according to the toxicity, with low toxic molecules on the left (green)253
and higher toxic molecules on the right (red). It indicates these two molecular fingerprints contain very254
different information. As shown in Figure S12, for AGBT-FPs we need 112 components to explain 90%255
of the variance, while for AGBTs-FPs we only need 48 components. The top two principal components of256
AGBT-FPs are just explaining 9% and 8% of the variance, which indicates that, since there is no labeled data257
to train the model, the generated AGBT-FPs represent general information about the molecular constitution258
rather than specific molecular properties. The first two components for AGBTs-FPs can explain 40% and259
13% of the variance respectively, which indicates that by using SL-based fine-tuning training, the model can260
effectively capture task-specific information.261
The AGBTs-FP model performs better in predicting specific properties because the labeled data are262
used to train the model during fine-tuning. It should be noted that some molecular information irrelevant to263
that particular property might be lost in this way. This strategy leads to better results for some datasets with264
minimal data, such as LC50DM, whose small amount of data is not enough to effectively obtain property-265
specific information in downstream tasks. However, if more downstream data are available, such as LD50,266
IGC50, and LC50, downstream machine learning methods can also derive property-specific information267
from general molecular information. For example, AGBT-FPs perform better on LD50, IGC50, and LC50268
datasets.269
4 Conclusion270
Despite many efforts in the past decade, accurate and reliable prediction of numerous molecular prop-271
erties remains a challenge. Recently, deep bidirectional transformers have become a popular new approach272
8
in molecular science for their ability to extract fundamental constitutional information of molecules from273
massive self-supervised learning (SSL). However, they neglect crucial stereochemical information. The alge-274
braic graph is effective in simplifying molecular structural complexity but relies on the availability of three-275
dimensional structures. We propose an algebraic graph-assisted bidirectional transformers (AGBT) model276
for the prediction of toxicity and partition coefficient. Specifically, element-specific multiscale weighted col-277
ored algebraic subgraphs are introduced to characterize crucial physical/chemical interactions. Moreover, for278
small datasets, we introduce a supervised fine-tuning procedure to the standard pre-trained SSL to focus on279
task-specific information. These approaches are paired with random forest, gradient boosted decision trees,280
multitask deep learning, and deep neural network algorithms in AGBT. We demonstrate that the proposed281
AGBT achieves R2 values of 0.671, 0.842, 0.783, 0.830, and 0.905 on LD50, IGC50, LC50, LC50DM, and282
FDA logP dataset, respectively, which are the best available predictions. Our model can be easily extended283
to the prediction of other molecular properties. Our results show that the proposed AGBT is a new and284
powerful framework for studying various properties of small molecules in drug discovery and environmental285
sciences.286
5 Methods287
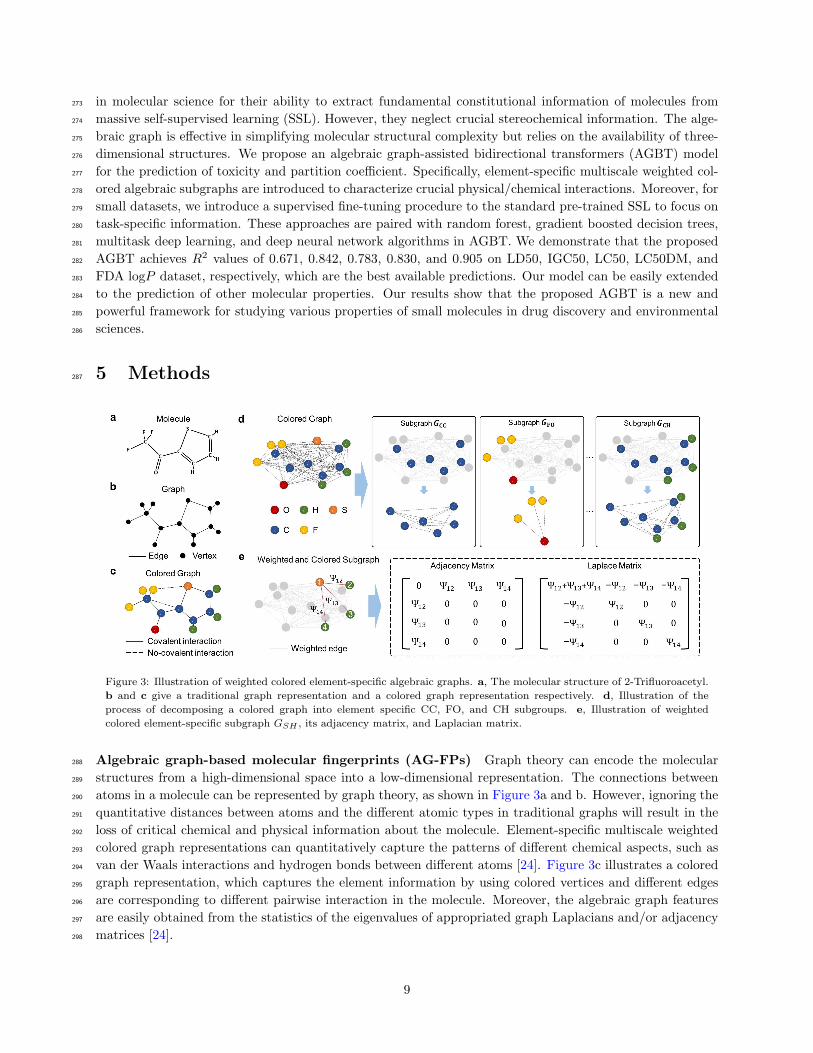
Figure 3: Illustration of weighted colored element-specific algebraic graphs. a, The molecular structure of 2-Trifluoroacetyl.
b and c give a traditional graph representation and a colored graph representation respectively. d, Illustration of the
process of decomposing a colored graph into element specific CC, FO, and CH subgroups. e, Illustration of weighted
colored element-specific subgraph GSH , its adjacency matrix, and Laplacian matrix.
Algebraic graph-based molecular fingerprints (AG-FPs) Graph theory can encode the molecular288
structures from a high-dimensional space into a low-dimensional representation. The connections between289
atoms in a molecule can be represented by graph theory, as shown in Figure 3a and b. However, ignoring the290
quantitative distances between atoms and the different atomic types in traditional graphs will result in the291
loss of critical chemical and physical information about the molecule. Element-specific multiscale weighted292
colored graph representations can quantitatively capture the patterns of different chemical aspects, such as293
van der Waals interactions and hydrogen bonds between different atoms [24]. Figure 3c illustrates a colored294
graph representation, which captures the element information by using colored vertices and different edges295
are corresponding to different pairwise interaction in the molecule. Moreover, the algebraic graph features296
are easily obtained from the statistics of the eigenvalues of appropriated graph Laplacians and/or adjacency297
matrices [24].298
9

As shown in Figure 3d, for a given molecule, we first construct element-specific colored subgraphs using299
selected subsets of atomic coordinates as vertices,300
V = {(ri, αi)|ri ∈ R3;αi ∈ E ; i = 1, 2, ..., N} (1)
where E = {H, C, N, O, S, P, F, Cl, Br,...} is a set of commonly occurring element types for a given dataset.301
And ith atom in a N -atom subset is labeled both by its element type αi and its position ri. We denote all the302
pairwise interactions between element types Ek1and Ek2
in a molecule by fast-decay radial basis functions303
W = {Ψ(||ri − rj ||; ηk1k2)|αi = Ek1
, αj = Ek2; i, j = 1, 2, ..., N ; ‖ri − rj‖ > ri + rj + σ} (2)
where ‖ri − rj‖ is the Euclidean distance between ith and jth atoms in a molecule, ri and rj are the atomic304
radii of ith and jth atoms, respectively, and σ is the mean standard deviation of ri and rj in the dataset.305
Figure 3e gives the illustration of Laplace and adjacency matrices based on the weighted colored subgraph.306
For the prediction of toxicity, van der Waals interactions are much more critical than covalent interactions307
and thus the distance constraint (‖ri − rj‖ > ri + rj + σ) is used to exclude covalent interactions. In308
biomolecules, we usually choose generalized exponential functions or generalized Lorentz functions as Ψ,309
which are weights between graph edges [46]. Here, ηk1k2in the function is a characteristic distance between310
the atoms and thus is a scale parameter. Therefore, we generate a weighted colored subgraph G(V,W). In311
order to construct element-specific molecular descriptors, the multiscale weighted colored subgraph rigidity312
is defined as313
RIG(ηk1k2) =
∑
i
µGi (ηk1k2
) =∑
i
∑
j
Ψ(‖ri − rj‖ ; ηk1k2),
αi = Ek1, αj = Ek2
; ‖ri − rj‖ > ri + rj + σ
(3)
where µGi (ηk1k2
) is a geometric subgraph centrality for the ith atom.[47] The summation over∑
j µGi (ηk1k2
)314
represents the total interaction strength for the selected pair of element types Ek1and Ek2
, which provide315
the element-specific coarse-grained description of molecular properties. By choosing appropriate element316
combinations k1 and k2, the characteristic distance ηk1k2, and subgraph weight Ψ, we finally construct317
a family of element-specific, scalable (i.e., molecular size independent), multiscale geometric graph-based318
molecular descriptors [24].319
To generate associated algebraic graph fingerprints, we construct corresponding graph Laplacians and/or320
adjacency matrices. For a given subgraph, its matrix representation can provide a straightforward description321
of the interaction between subgraph elements. To construct a Laplacian matrix, we consider a subgraph Gk1k2322
for each pair of element types Ek1and Ek2
and define an element-specific weighted colored Laplacian matrix323
L(ηk1k2) as [24]324
Lij(ηk1k2) =
{
−Ψ(‖ri − rj‖) if i 6= j, αi = Ek1, αj = Ek2
and ‖ri − rj‖ > ri + rj + σ;
−∑
j Lij if i = j(4)
Mathematically, the element-specific weighted Laplacian matrix is symmetric, diagonally dominant, and325
positive semi-definite, and thus all the eigenvalues are non-negative. The first eigenvalue of the Laplacian326
matrix is zero because the summation of every row or every column of the matrix is zero. The first non-zero327
eigenvalue of Lij(ηk1k2) is the algebraic connectivity (i.e., Fiedler value). Furthermore, the rank of the zero-328
dimensional topological invariant, which represents the number of the connected components in the graph,329
is equal to the number of zero eigenvalues of Lij(ηk1k2). A certain connection between geometric graph330
formulation and algebraic graph matrix can be defined by:331
RIg(ηk1k2) = TrL(ηk1k2
), (5)
where Tr is the trace. Therefore, we can directly construct a set of element-specific weighted colored Laplacian332
matrix-based molecular descriptors by the statistics of nontrivial eigenvalues {λLi }i=1,2,3,.., i.e., summation,333
10

minimum, maximum, average, and standard deviation of nontrivial eigenvalues. Note that the Fiedler value334
is included as the minimum.335
Similarly, an element-specific weighted adjacency matrix can be defined by336
Aij(ηk1k2) =
{
Ψ(‖ri − rj‖) if i 6= j, αi = Ek1, αj = Ek2
and ‖ri − rj‖ > ri + rj + σ;
0 if i = j(6)
Mathematically, adjacency matrix Aij(ηk1k2) is symmetrical non-negative matrix. The spectrum of the337
proposed element-specific weighted colored adjacency matrix is real. A set of element-specific weighted338
labeled adjacency matrix-based molecular descriptors can be obtained by the statistics of {λAi }i=1,2,3,.., i.e.,339
summation, minimum, maximum, average, and standard deviation of all positive eigenvalues. To predict the340
properties of a molecule, graph invariants, such as the eigenvalue statistics of the above matrix, can capture341
topological and physical information about the molecules, which is named algebraic graph fingerprints (AG-342
FPs). Detailed parameters of the proposed algebraic graph model can be found in Section S2.3 of the343
Supplementary Information.344
Bidirectional transformer fingerprints (BT-FPs) Unlike RNN-based models, deep bidirectional trans-345
former (DBT) is based on the attention mechanism and it is more parallelable to reduce the training time346
with massive data.[27] Based on the DBT architecture, Devlin et al.[26] introduced a new representation347
model called bidirectional encoder representations from transformer (BERT) for natural language processing.348
There are two tasks involving in BERT, masked language learning and consecutive sentences classification.349
Masked language learning uses a partially masked sentence (i.e., words) as input and employs other words to350
predict the masked words. The consecutive sentences classification is to classify if two sentences are consec-351
utive. In the present work, the inputs of the deep bidirectional transformer are molecular SMILES strings.352
Unlike the sentences in traditional BERT for natural language processing, the SMILES strings of different353
molecules are not logically connected. However, we train the bidirectional encoder from the transformer to354
recover the masked atoms or functional groups.355
Because a molecule could have multiple SMILES representations, we first convert all the input data into356
canonical SMILES strings, which provide a unique representation of each molecular structure. [48] Then,357
a SMILES string is split into symbols, e.g., C, H, N, O, =, Br, etc., which generally represent the atoms,358
chemical bonds, and connectivity, see Table S2 for more detail. In the pre-training stage, we first select a359
certain percentage of the input symbols randomly for three types of operations: mask, random changing, and360
no changing. The purpose of the pre-training is to learn fundamental constitutional principles of molecules361
in a SSL manner with massive unlabeled data. A loss function is built to improve the rate of correctly362
predicted masked symbols during the training. For each SMILES string, we add two special symbols, < s >363
and < \s >. Here, < s > means the beginning of a SMILES string and < \s > is a special terminating364
symbol. All symbols are embedded into input data of a fixed length. A position embedding is added to365
every symbol to indicate the order of the symbol. The embedded SMILES strings are fed into the BERT366
framework for further operation. Figure S2 shows the detailed process of pre-training procedure. In our367
work, more than 1.9 million unlabeled SMILES data from CheMBL [31] are used for the pre-training so that368
the model learns basic “syntactic information” about SMILES strings and captures global information of369
molecules.370
Both BT-FPs and BTs-FPs are created in the fine-tuning training step, which further learns the charac-371
teristics of task-specific data. Two types of fine-tuning procedures are used in our task-specific fine-tuning.372
The first type is still based on the self-supervised learning (SSL) strategy, where the task-specific SMILES373
strings are used as the training inputs, as shown in Figure S3. To accurately identify these task-specific374
data, only the ‘mask’ and ‘no changing’ operations are allowed in this fine-tuning. The resulting latent-space375
representations are called BT-FPs.376
The second fine-tuning procedure is based on a supervised learning (SL) strategy with labeled task-377
specific data. As shown in Figure S4, when dealing with multiple datasets with cross-dataset correlations,378
11
such as four toxicity datasets in the present study (Table S4), we make use of all the labels of four datasets379
to tune the model weights via supervised learning before generating the latent-space representations (i.e.,380
BTs-FPs), which significantly strengthens the predictive power of the model on the smallest dataset.381
In our DBT, an input SMILES string has a maximal allowed length of 256 symbols. During the training,382
each of the 256 symbols is embedded into a 512-dimensional vector that contains the information of the whole383
SMILES string. In this extended 256×512 representation, one can, in principle, select one or multiple 512-384
dimensional vectors to represent the original molecule. In our work, we choose the corresponding vector of the385
leading symbol < s > of a molecular SMILES string as the bidirectional transformer fingerprints (BT-FPs or386
BTs-FPs ) of the molecule. In the downstream tasks, BT-FPs or BTs-FPs are used for molecular property387
prediction. Detailed model parameters can be found in Section S2.5 of the Supplementary Information.388
Data and model availability389
The pre-training dataset used in this work is CheMBL26, which is available at chembl.gitbook.io/390
chembl-interface-documentation/downloads. To make sure the reproducibility of this work, the toxicity391
datasets and partition coefficient used in this work are also available at weilab.math.msu.edu/Database/.392
The overall models and related code have been released as an open-source code in the Github repository:393
github.com/ChenDdon/AGBTcode.394
Acknowledgment395
The research was financially supported by the National Key R&D Program of China (2016YFB0700600).396
The work of Gao and Wei was supported in partial by NSF Grants DMS1721024, DMS1761320, IIS1900473,397
NIH grants GM126189 and GM129004, Bristol-Myers Squibb, and Pfizer.398
Supporting Information399
The Supporting Information is available on the website at xxxxxx400
References401
[1] Li Di and Edward H Kerns. Drug-like properties: concepts, structure design and methods from ADME402
to toxicity optimization. Academic press, 2015.403
[2] Kedi Wu and Guo-Wei Wei. Quantitative toxicity prediction using topology based multitask deep neural404
networks. Journal of chemical information and modeling, 58(2):520–531, 2018.405
[3] Corwin Hansch, Peyton P Maloney, Toshio Fujita, and Robert M Muir. Correlation of biological activity406
of phenoxyacetic acids with hammett substituent constants and partition coefficients. Nature, 194(4824):407
178–180, 1962.408
[4] Evgeny Putin, Arip Asadulaev, Quentin Vanhaelen, Yan Ivanenkov, Anastasia V Aladinskaya, Alex409
Aliper, and Alex Zhavoronkov. Adversarial threshold neural computer for molecular de novo design.410
Molecular pharmaceutics, 15(10):4386–4397, 2018.411
[5] Nicola De Cao and Thomas Kipf. Molgan: An implicit generative model for small molecular graphs.412
arXiv preprint arXiv:1805.11973, 2018.413
[6] Yibo Li, Liangren Zhang, and Zhenming Liu. Multi-objective de novo drug design with conditional414
graph generative model. Journal of cheminformatics, 10(1):33, 2018.415
12
[7] Ruoyu Li, Sheng Wang, Feiyun Zhu, and Junzhou Huang. Adaptive graph convolutional neural networks.416
In Thirty-second AAAI conference on artificial intelligence, 2018.417
[8] Zixuan Cang and Guo-Wei Wei. Topologynet: Topology based deep convolutional and multi-task neural418
networks for biomolecular property predictions. PLoS computational biology, 13(7):e1005690, 2017.419
[9] Zheng Xu, Sheng Wang, Feiyun Zhu, and Junzhou Huang. Seq2seq fingerprint: An unsupervised deep420
molecular embedding for drug discovery. In Proceedings of the 8th ACM international conference on421
bioinformatics, computational biology, and health informatics, pages 285–294, 2017.422
[10] Mariya Popova, Olexandr Isayev, and Alexander Tropsha. Deep reinforcement learning for de novo drug423
design. Science advances, 4(7):eaap7885, 2018.424
[11] Zhenqin Wu, Bharath Ramsundar, Evan N Feinberg, Joseph Gomes, Caleb Geniesse, Aneesh S Pappu,425
Karl Leswing, and Vijay Pande. Moleculenet: a benchmark for molecular machine learning. Chemical426
science, 9(2):513–530, 2018.427
[12] Robin Winter, Floriane Montanari, Frank Noe, and Djork-Arne Clevert. Learning continuous and data-428
driven molecular descriptors by translating equivalent chemical representations. Chemical science, 10429
(6):1692–1701, 2019.430
[13] Jian Jiang, Rui Wang, Menglun Wang, Kaifu Gao, Duc Duy Nguyen, and Guo-Wei Wei. Boosting431
tree-assisted multitask deep learning for small scientific datasets. Journal of Chemical Information and432
Modeling, 60(3):1235–1244, 2020.433
[14] Duc Duy Nguyen, Zixuan Cang, and Guo-Wei Wei. A review of mathematical representations of434
biomolecular data. Physical Chemistry Chemical Physics, 22(8):4343–4367, 2020.435
[15] Roberto Todeschini and Viviana Consonni. Handbook of molecular descriptors, volume 11. John Wiley436
& Sons, 2008.437
[16] David Rogers and Mathew Hahn. Extended-connectivity fingerprints. Journal of chemical information438
and modeling, 50(5):742–754, 2010.439
[17] Kaifu Gao, Duc Duy Nguyen, Vishnu Sresht, Alan M Mathiowetz, Meihua Tu, and Guo-Wei Wei. Are 2d440
fingerprints still valuable for drug discovery? Physical Chemistry Chemical Physics, 22(16):8373–8390,441
2020.442
[18] Joseph L Durant, Burton A Leland, Douglas R Henry, and James G Nourse. Reoptimization of mdl443
keys for use in drug discovery. Journal of chemical information and computer sciences, 42(6):1273–1280,444
2002.445
[19] CA James, D Weininger, and J Delany. Daylight theory manual. daylight chemical information systems.446
Inc., Irvine, CA, 1995.447
[20] Jonathan S Mason and Daniel L Cheney. Library design and virtual screening using multiple 4-point448
pharmacophore fingerprints. In Biocomputing 2000, pages 576–587. World Scientific, 1999.449
[21] Jitender Verma, Vijay M Khedkar, and Evans C Coutinho. 3d-qsar in drug design-a review. Current450
topics in medicinal chemistry, 10(1):95–115, 2010.451
[22] Zhenyu Meng, D Vijay Anand, Yunpeng Lu, Jie Wu, and Kelin Xia. Weighted persistent homology for452
biomolecular data analysis. Scientific reports, 10(1):1–15, 2020.453
[23] Duc Duy Nguyen and Guo-Wei Wei. Dg-gl: Differential geometry-based geometric learning of molecular454
datasets. International journal for numerical methods in biomedical engineering, 35(3):e3179, 2019.455
13

[24] Duc Duy Nguyen and Guo-Wei Wei. Agl-score: Algebraic graph learning score for protein–ligand456
binding scoring, ranking, docking, and screening. Journal of chemical information and modeling, 59(7):457
3291–3304, 2019.458
[25] Duc Duy Nguyen, Kaifu Gao, Menglun Wang, and Guo-Wei Wei. Mathdl: mathematical deep learning459
for d3r grand challenge 4. Journal of computer-aided molecular design, 34(2):131–147, 2020.460
[26] Jacob Devlin, Ming-Wei Chang, Kenton Lee, and Kristina Toutanova. Bert: Pre-training of deep461
bidirectional transformers for language understanding. arXiv preprint arXiv:1810.04805, 2018.462
[27] Ashish Vaswani, Noam Shazeer, Niki Parmar, Jakob Uszkoreit, Llion Jones, Aidan N Gomez, Lukasz463
Kaiser, and Illia Polosukhin. Attention is all you need. In Advances in neural information processing464
systems, pages 5998–6008, 2017.465
[28] David Weininger. Smiles, a chemical language and information system. 1. introduction to methodology466
and encoding rules. Journal of chemical information and computer sciences, 28(1):31–36, 1988.467
[29] Sheng Wang, Yuzhi Guo, Yuhong Wang, Hongmao Sun, and Junzhou Huang. Smiles-bert: large scale468
unsupervised pre-training for molecular property prediction. In Proceedings of the 10th ACM Interna-469
tional Conference on Bioinformatics, Computational Biology and Health Informatics, pages 429–436,470
2019.471
[30] Teague Sterling and John J Irwin. Zinc 15–ligand discovery for everyone. Journal of chemical informa-472
tion and modeling, 55(11):2324–2337, 2015.473
[31] Anna Gaulton, Anne Hersey, Micha l Nowotka, A Patricia Bento, Jon Chambers, David Mendez, Pru-474
dence Mutowo, Francis Atkinson, Louisa J Bellis, Elena Cibrian-Uhalte, et al. The chembl database in475
2017. Nucleic acids research, 45(D1):D945–D954, 2017.476
[32] Arnaud Blondel and Martin Karplus. New formulation for derivatives of torsion angles and improper tor-477
sion angles in molecular mechanics: Elimination of singularities. Journal of Computational Chemistry,478
17(9):1132–1141, 1996.479
[33] Paula Y Bruice. Organic Chemistry: Pearson New International Edition. Pearson Higher Ed, 2013.480
[34] Zhenxing Chi, Rutao Liu, Bingjun Yang, and Hao Zhang. Toxic interaction mechanism between oxyte-481
tracycline and bovine hemoglobin. Journal of hazardous materials, 180(1-3):741–747, 2010.482
[35] Kevin S Akers, Glendon D Sinks, and T Wayne Schultz. Structure–toxicity relationships for selected483
halogenated aliphatic chemicals. Environmental toxicology and pharmacology, 7(1):33–39, 1999.484
[36] Hao Zhu, Alexander Tropsha, Denis Fourches, Alexandre Varnek, Ester Papa, Paola Gramatica, Tomas485
Oberg, Phuong Dao, Artem Cherkasov, and Igor V Tetko. Combinatorial qsar modeling of chemical486
toxicants tested against tetrahymena pyriformis. Journal of chemical information and modeling, 48(4):487
766–784, 2008.488
[37] Chanin Nantasenamat, Chartchalerm Isarankura-Na-Ayudhya, Thanakorn Naenna, and Virapong489
Prachayasittikul. A practical overview of quantitative structure-activity relationship. 2009.490
[38] Han Van De Waterbeemd and Eric Gifford. Admet in silico modelling: towards prediction paradise?491
Nature reviews Drug discovery, 2(3):192–204, 2003.492
[39] Abdul Karim, Avinash Mishra, MA Hakim Newton, and Abdul Sattar. Efficient toxicity prediction via493
simple features using shallow neural networks and decision trees. Acs Omega, 4(1):1874–1888, 2019.494
14
[40] Kedi Wu, Zhixiong Zhao, Renxiao Wang, and Guo-Wei Wei. Topp–s: Persistent homology-based multi-495
task deep neural networks for simultaneous predictions of partition coefficient and aqueous solubility.496
Journal of computational chemistry, 39(20):1444–1454, 2018.497
[41] Tiejun Cheng, Yuan Zhao, Xun Li, Fu Lin, Yong Xu, Xinglong Zhang, Yan Li, Renxiao Wang, and498
Luhua Lai. Computation of octanol- water partition coefficients by guiding an additive model with499
knowledge. Journal of chemical information and modeling, 47(6):2140–2148, 2007.500
[42] Jiarui Chen, Hong-Hin Cheong, and Shirley Weng In Siu. Bestox: A convolutional neural network re-501
gression model based on binary-encoded smiles for acute oral toxicity prediction of chemical compounds.502
In International Conference on Algorithms for Computational Biology, pages 155–166. Springer, 2020.503
[43] T Martin et al. User’s guide for test (version 4.2)(toxicity estimation software tool): A program to504
estimate toxicity from molecular structure. Washington (USA): US-EPA, 2016.505
[44] Hao Zhu, Todd M Martin, Lin Ye, Alexander Sedykh, Douglas M Young, and Alexander Tropsha.506
Quantitative structure- activity relationship modeling of rat acute toxicity by oral exposure. Chemical507
research in toxicology, 22(12):1913–1921, 2009.508
[45] Igor V Tetko and Pierre Bruneau. Application of alogps to predict 1-octanol/water distribution coef-509
ficients, logp, and logd, of astrazeneca in-house database. Journal of pharmaceutical sciences, 93(12):510
3103–3110, 2004.511
[46] Kristopher Opron, Kelin Xia, and Guo-Wei Wei. Fast and anisotropic flexibility-rigidity index for protein512
flexibility and fluctuation analysis. The Journal of chemical physics, 140(23):06B617 1, 2014.513
[47] David Bramer and Guo-Wei Wei. Multiscale weighted colored graphs for protein flexibility and rigidity514
analysis. The Journal of chemical physics, 148(5):054103, 2018.515
[48] Greeshma Neglur, Robert L Grossman, and Bing Liu. Assigning unique keys to chemical compounds for516
data integration: Some interesting counter examples. In International Workshop on Data Integration517
in the Life Sciences, pages 145–157. Springer, 2005.518
15
Figures
Figure 1
Illustration of AGBT model. For a given molecular structure and its SMILES strings, AG-FPs are generatedfrom element-speci c algebraic subgraphs module and BT-FPs are generated from a deep bidirectionaltransformer module, as shown inside the dashed rectangle, which contains the pre-training and ne-tuningprocesses, and then nally completes the feature extraction using task-speci c SMILES as input. Then therandom forest algorithm is used to fuse, rank, and select optimal ngerprints (AGBT-FPs) for machinelearning.

Figure 2
a and b illustrate the comparison of the R2 by various methods for IGC50 set and LC50DM set,respectively. AGBTs-FP means a �ne-tuning process is applied to AGBT-FP. The other results were takenfrom Refs. 2, 17, 39, 13, 43, 23. c, The bar charts illustrate the average R2 of AGBT-FPs and BT-FPs withthree machine learning algorithm for the IGC50 dataset. All points in the �gure show the R2 of theprediction from the 20 repeated experiments. d, The bar charts illustrate the average R2 of AGBT-FPs andAGBTs-FPs with three machine learning algorithm for the LC50DM dataset. All points in the �gure showthe R2 of the prediction from the 20 repeated experiments. e, Visualization of LD50 set. The axes are thetop three important features of AGBT-FPs. f, Predicted results of AGBT-FPs with MT-DNN model for IGC50and LC50DM set, respectively. The box plots in each �gure statistic the R2 for 20 experiments. g, Varianceratios in the �rst two components from the principal component analysis (PCA) are used to visualize thefour toxicity data sets. h, Variance ratios in the �rst two components from the PCA are used to visualizethe four toxicity datasets.

Figure 3
Illustration of weighted colored element-speci� c algebraic graphs. a, The molecular structure of 2-Triuoroacetyl. b and c give a traditional graph representation and a colored graph representationrespectively. d, Illustration of the process of decomposing a colored graph into element speci� c CC, FO,and CH subgroups. e, Illustration of weighted colored element-speci� c subgraph GSH, its adjacencymatrix, and Laplacian matrix.
Supplementary Files
This is a list of supplementary �les associated with this preprint. Click to download.
SupportingInformation.pdf