algebra unit 8 quadratic functions - … · 2 find the _____ of the vertex. choose a ... algebra...
TRANSCRIPT

Name: ______________________________
Algebra
Unit 8
Quadratic Functions

1
What does “a” do? What does “C” do?
Characteristics of the Graph:
Maximum Minimum Vertex
Parent Function
Equation:
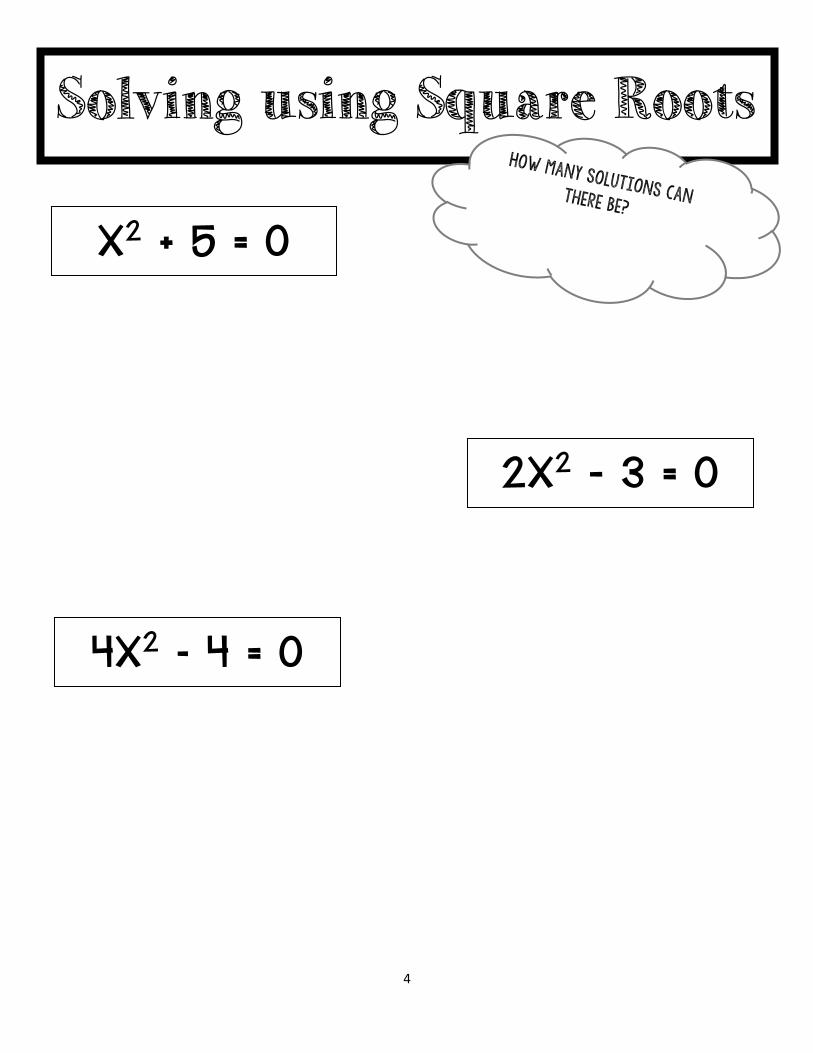
How many solutions can there be? They mean what?
Quadratic Function

2
Axis of Symmetry
Steps:
1
2
3
example: 𝑦 = −𝑥2 + 3 example: 𝑦 = 2𝑥2 + 6𝑥

3
1 Find the equation of the ______________.
2 Find the ______________ of the vertex.
3 Choose a value for x
on the same side of the
________ as the
____________to find
another point
4 __________ these
two points across the
axis of symmetry
5 __________ the parabola.
f(x) = x2 - 3x - 2
4
Solving using Square Roots
x2 + 5 = 0
2x2 - 3 = 0
4x2 – 4 = 0

5
When we factor, we learn…
Zero Product Property:
Examples
Solving by Factoring

6
Solv
ing by Com
ple
ting the S
quare
Equation
:
1
2
3
4
5
6
7
8
m2-6m=247
x2+5x+3=0

7
𝑥 =−𝑏 ± 𝑏2 − 4𝑎𝑐
2𝑎
QUADRATIC FORMULA
Y=-3x2+5x-2

8
𝑎 ± 𝑏𝑖
Complex Solutions
Example: x2+2x+3=0

9
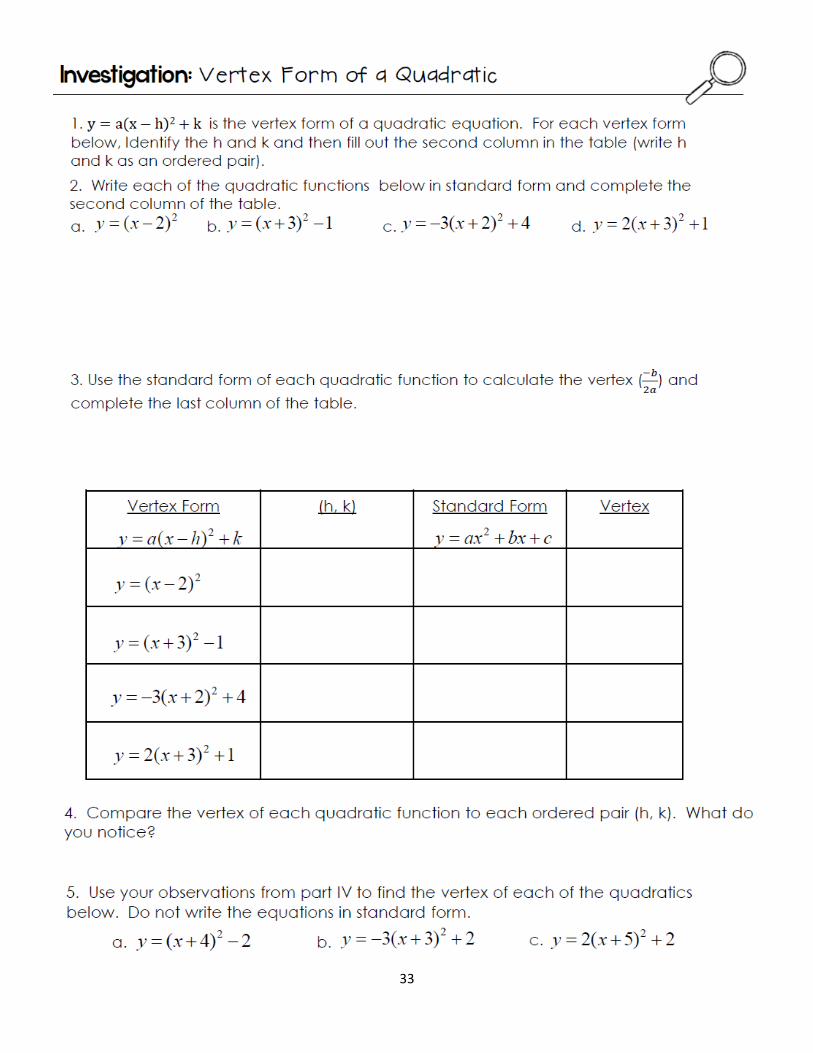
Vertex Form
𝑦 = 𝑎(𝑥 − ℎ)2 + 𝑘
Example:
𝑦 = 2(𝑥 − 1)2 + 3
Vertex: ( , )

10
Exploring Quadratic Graphs 1.) Write standard form of quadratic function.
2.) Graph the parent function (on graph at right): 𝑓(𝑥) = 𝑥2
3.) The lowest point of the parent function’s graph is its _____________.
4.) If 𝑎 > 0 in 𝑦 = 𝑎𝑥2 + 𝑏𝑥 + 𝑐 the parabola opens upwards/downwards (circle one) the vertex is the minimum/maximum (circle one)
5.) If 𝑎 < 0 in 𝑦 = 𝑎𝑥2 + 𝑏𝑥 + 𝑐 the parabola opens upwards/downwards (circle one) the vertex is the minimum/maximum (circle one)
6.) Make a table of values and graph the function 𝑓(𝑥) = −2𝑥2
7.) Make a table of values and graph the 𝑦 = 𝑥2 + 2

11
8.) Make a table of values and graph the function 𝑓(𝑥) = −𝑥2− 1
Finding the mistake
Describe the error on each graph (do not make an x-y chart). Then explain how you would correct the error.
#1 #2 #3

12
Exploring Quadratic Graphs Role of 𝑐 in 𝑦 = 𝑎𝑥2 + 𝑏𝑥 + 𝑐
1.) Graph 𝑓(𝑥) = 𝑥2 and 𝑓(𝑥) = 𝑥2 + 2 2. ) Graph 𝑓(𝑥) = 𝑥2 and 𝑓(𝑥) = 𝑥2 − 2
3.) Describe what positive and negative values of c do to the position of the vertex.

13
Exploring Quadratic Graphs Role of 𝑎 in 𝑦 = 𝑎𝑥2 + 𝑏𝑥 + 𝑐
1.) Graph 𝑓(𝑥) = 𝑥2 and 𝑓(𝑥) = 4𝑥2 on the same graph.
2.) Graph 𝑓(𝑥) = 𝑥2 and 𝑓(𝑥) = 1
4𝑥2 on the same graph.
3.) Graph 𝑓(𝑥) = 𝑥2 and 𝑓(𝑥) = −4𝑥2 on the same graph.
4.) Graph 𝑓(𝑥) = 𝑥2 and 𝑓(𝑥) = −1
4𝑥2 on the same graph.
5.) Describe what whole number versus fraction coefficient values of a do to the parabola.
6.) Describe what positive and negative values of a do to the parabola.
7.) Order the quadratic functions narrowest to widest without graphing.
𝑓(𝑥) = −𝑥2, 𝑓(𝑥) = −3𝑥2, 𝑓(𝑥) = 1
2𝑥2
8.) Order the quadratic functions narrowest to widest without graphing.
𝑓(𝑥) = 𝑥2, 𝑓(𝑥) = −2𝑥2, 𝑓(𝑥) = 1
2𝑥2
9.) Order the quadratic functions narrowest to widest without graphing.
𝑓(𝑥) = −3𝑥2, 𝑓(𝑥) = 3𝑥2, 𝑓(𝑥) = 1
3𝑥2
14
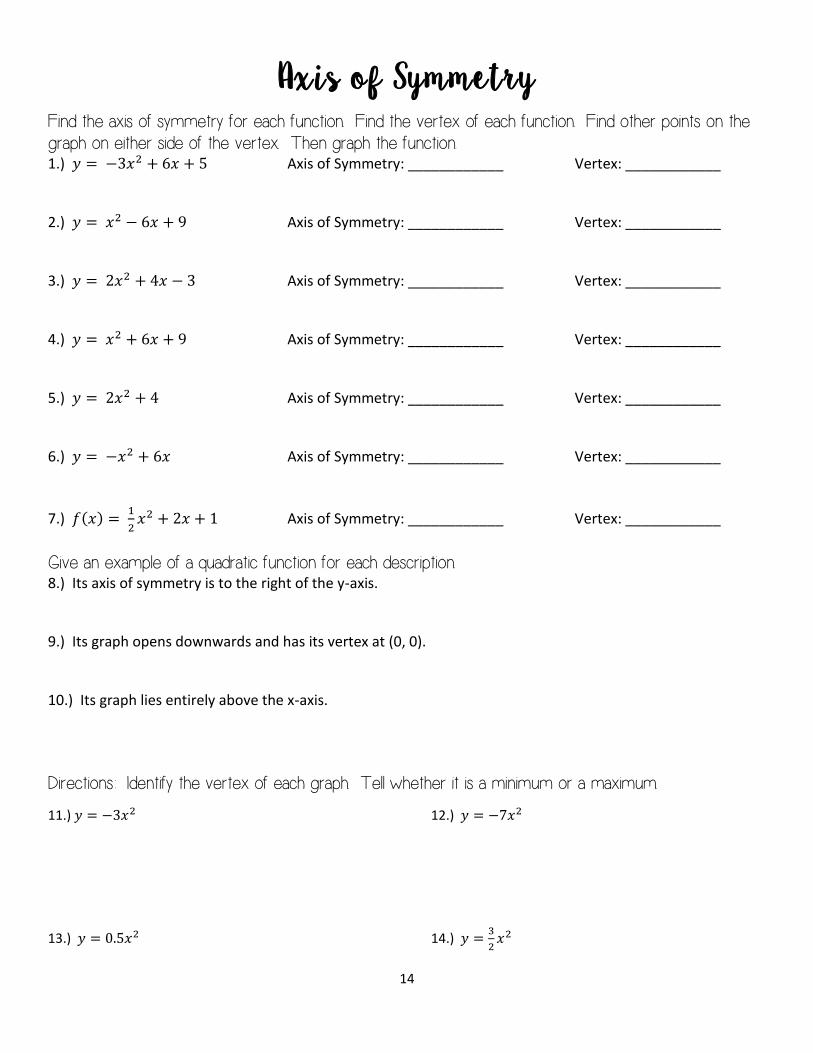
Axis of Symmetry Find the axis of symmetry for each function. Find the vertex of each function. Find other points on the graph on either side of the vertex. Then graph the function. 1.) 𝑦 = −3𝑥2 + 6𝑥 + 5 Axis of Symmetry: ____________ Vertex: ____________ 2.) 𝑦 = 𝑥2 − 6𝑥 + 9 Axis of Symmetry: ____________ Vertex: ____________ 3.) 𝑦 = 2𝑥2 + 4𝑥 − 3 Axis of Symmetry: ____________ Vertex: ____________ 4.) 𝑦 = 𝑥2 + 6𝑥 + 9 Axis of Symmetry: ____________ Vertex: ____________ 5.) 𝑦 = 2𝑥2 + 4 Axis of Symmetry: ____________ Vertex: ____________ 6.) 𝑦 = −𝑥2 + 6𝑥 Axis of Symmetry: ____________ Vertex: ____________
7.) 𝑓(𝑥) = 1
2𝑥2 + 2𝑥 + 1 Axis of Symmetry: ____________ Vertex: ____________
Give an example of a quadratic function for each description. 8.) Its axis of symmetry is to the right of the y-axis. 9.) Its graph opens downwards and has its vertex at (0, 0). 10.) Its graph lies entirely above the x-axis.
Directions: Identify the vertex of each graph. Tell whether it is a minimum or a maximum.
11.) 𝑦 = −3𝑥2 12.) 𝑦 = −7𝑥2
13.) 𝑦 = 0.5𝑥2 14.) 𝑦 =3
2𝑥2

15
*The y-intercept of the quadratic function is the value of c in y = ax2 + bx + c
1. The graph of y = ax2 + bx + c, where a does not equal 0, has the line
x = _________ as its axis of symmetry. The x-coordinate of the vertex is _______. Identify the y-intercept of each quadratic function
2. y = 2x2 + 3x + 4
3. f(x) = -4x2 + 2x – 1
4. y = x2 – 1/2x
*Steps to graphing a quadratic Function
Find the equation of the axis of symmetry
To find the y-coordinate of the vertex, substitute the value for the axis of symmetry in for x and solve for y
Choose a value for x on the same side of the vertex as the y-intercept to find another point
Reflect these two points across the axis of symmetry
Draw the parabola Graph the following quadratic functions
5. y = 2x2 + 4x – 3
6. f(x) = x2 - 6x + 9
7. y = -3x2 + 6x + 5

16
Solving by Graphing 1. The solution is where the quadratic function crosses the _______________.
2. There can be ____, ____, or ____ solutions to a quadratic function.
3. Sketch the graph of a quadratic function with 0 solutions.
4. Sketch the graph of a quadratic function with 1 solution.
5. Sketch the graph of a quadratic function with 2 solutions.
6. Match the number of solutions with the appropriate quadratic function without
actually graphing.
a. 0 solutions 1. 𝑓(𝑥) = 𝑥2 − 4
b. 1 solution 2. 𝑓(𝑥) = 𝑥2 + 4
c. 2 solutions 3. 𝑓(𝑥) = 𝑥2
7. Use the graph at the right to identify the
number of solutions and the actual solutions.
***In order to graph a quadratic function, the function must be set equal to zero
Solve each quadratic function by graphing and identifying the solutions.
8. 𝑥2 − 1 = 0 9. 2𝑥2 + 4 = 0
10. 𝑥2 − 16 = −16 11. 0 = −𝑥2 + 6𝑥 − 1

17
Graphing Quadratic Functions

18
Solving Quadratic Functions by Square Roots
Solve each equation using square roots to find the x-intercepts. Then graph your equation. 1. 𝑓(𝑥) = 𝑥2 − 144 Solution: ____________________________________ 2.) 𝑥2 − 225 = 0 Solution: ____________________________________ 3.) 𝑥2 + 25 = 25 Solution: ____________________________________ 4.) 𝑥2 − 9 = −16 Solution: ____________________________________ 5.) 5𝑥2 + 10 = 0 Solution: ____________________________________ 6.) −20𝑥2 + 80 = 𝑦 Solution: ____________________________________

19
Solving by Square Roots
Use the example above to solve the following quadratic functions, solve by using
square roots.
7. 𝑡2 − 25 = 0 8. 3𝑛2 + 12 = 12
9. 2𝑔2 + 32 = 0
10. Write and solve equations in the form of 𝑎𝑥2 + 𝑐 = 0 for each of the
following (your equations must have an a value)
a.) The equation has no solutions
b.) The equation has one solution
c.) The equation has two solutions.

20
Solving Quadratic Equations with Square Roots

21

22
Find zeros of quadratic function/Factoring
We can use the nature of the roots of a quadratic. There are 3 possibilities for the roots of a
quadratic in the form 02 cbxax .
1.) Two different real roots (2 zeros/solutions)
2.) Two equal real roots (1 zero/solution)
3.) No real roots (No zero/solution)
Example: 𝑦 = (𝑥 – 5)(𝑥 + 3)
𝑦 = (𝑥 − 5) 𝑦 = (𝑥 + 3) 0 = 𝑥 − 5 0 = 𝑥 + 3
0 + 5 = 𝑥 − 5 + 5 0 − 3 = 𝑥 + 3 − 3 𝑥 = 5 𝑥 = −3
Zeros are located at (5,0) and (−3,0), therefore there are 2 solutions.
What are the zeros of each function?
1.) 𝑦 = 2𝑥 – 3 2.) 𝑦 = 4(𝑥 – 7)(𝑥 – 3)(𝑥 + 4)
3.) 𝑦 = 𝑥(𝑥 + 6)
Factor each equation. What are the zeros of each function?
4.) 𝑦 = 𝑥2 − 𝑥 5.) 𝑦 = 𝑥2 + 𝑥 − 20
6.) 𝑦 = 2𝑥2 − 20𝑥 + 42 7.) 𝑦 = 𝑥3 − 3𝑥2 − 18𝑥 8.) 𝑦 = 𝑥4 − 16
9.) Student council decides it wants to raise money for a local charity. They decide to sell little sticky note
graph pads to everyone in the school. The equation 𝑓(𝑥) = −0.5𝑥2 + 4𝑥 − 11 will determine their profit on
the graph pads. Will they raise money for the charity?

23
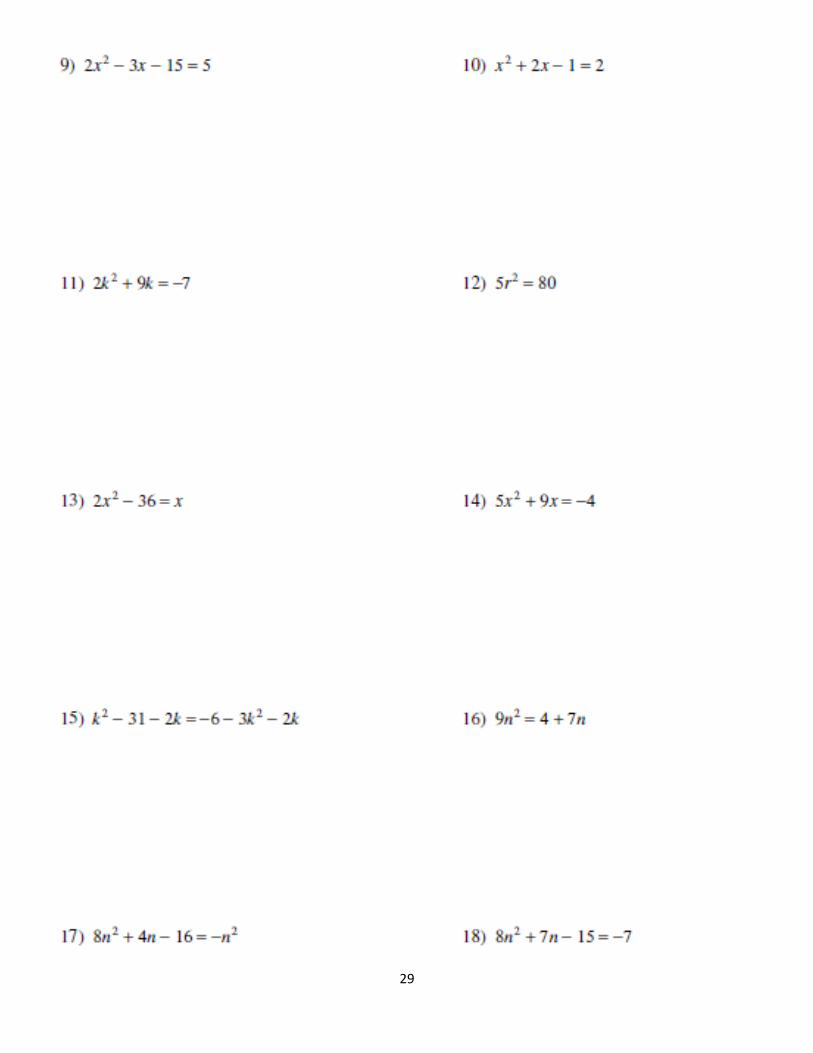
Solving by Factoring

24
Factoring then Graphing Factor each equation. Find all other components of your graph. Then graph. 1.) 𝑦 = 𝑥2 − 10𝑥 + 25 x= _____________ axis of symmetry: _________ vertex: ____________ 2.) 𝑓(𝑥) = 𝑥2 + 4𝑥 + 3 x= _____________ axis of symmetry: _________ vertex: ____________ 3.) 𝑦 = 𝑥2 + 6𝑥 + 8 x= _____________ axis of symmetry: _________ vertex: ____________ 4.) 𝑦 = 𝑥2 + 3𝑥 − 4 x= _____________ axis of symmetry: _________ vertex: ____________ 5.) 𝑦 = −𝑥2 + 3𝑥 − 4 x= _____________ axis of symmetry: _________ vertex: ____________
6.) 𝑓(𝑥) = 1
4𝑥2 + 2𝑥 + 4 x= _____________ axis of symmetry: _________ vertex: ____________
7.) 9𝑥2 − 4 = 𝑓(𝑥) x= _____________ axis of symmetry: _________ vertex: ____________ 8.) 𝑓(𝑥) = 9𝑥2 − 12𝑥 + 4 x= _____________ axis of symmetry: _________ vertex: ____________

25
Solving by Completing the Square
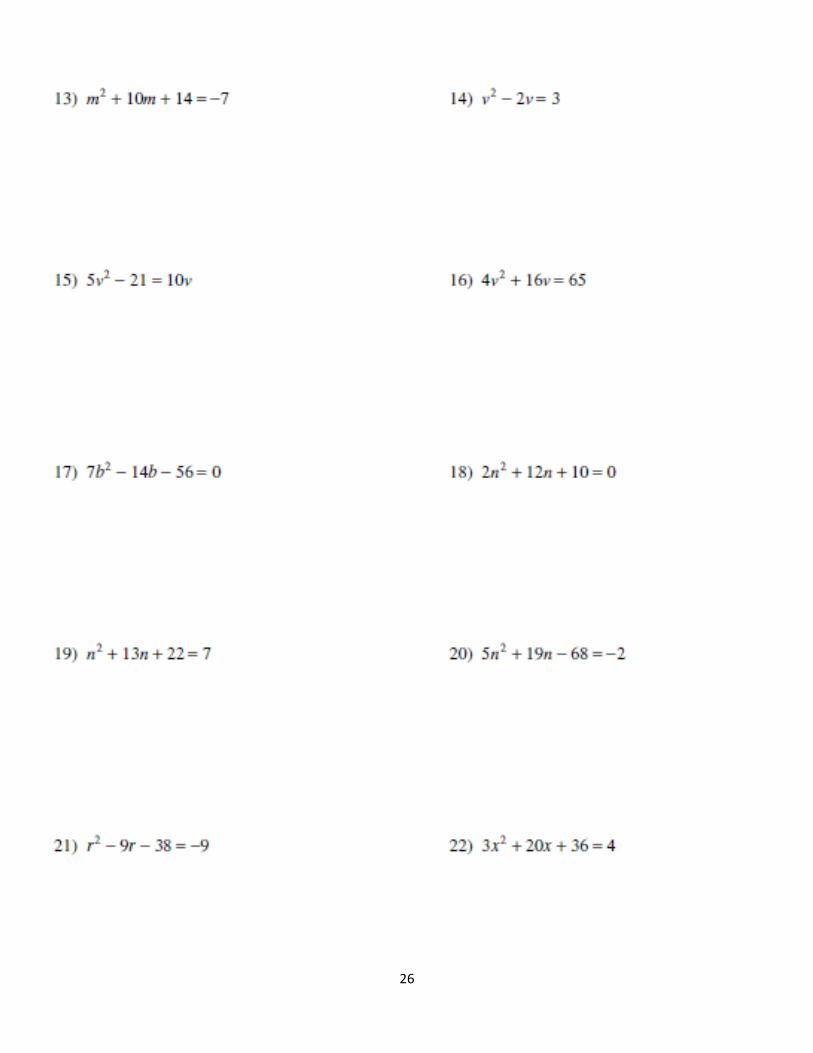
26

27
Solving Quadratic Functions by Completing the Square-3
Solve each equation using completing the square to find the x-intercepts. Then graph your equation. 1. 𝑓(𝑥) = 𝑥2 − 4𝑥 − 21 x= _____________________ 2.) 𝑥2 + 11𝑥 + 30 = 0 x= _____________________ 3.) 𝑥2 + 5𝑥 = 0 x= _____________________ 4.) 4𝑥2 + 12𝑥 = −9 x= _____________________ 5.) 2𝑥2 − 10𝑥 − 20 = 8 x= _____________________ 6.) 3𝑥2 − 12𝑥 = 15 x= _____________________

28
Quadratic Formula
29

30
Using the Quadratic Formula Use the quadratic formula to solve each equation. Round to the nearest hundredth when necessary. **Be sure to write the quadratic formula in standard form before using the quadratic formula. 1. x2 – 2x -8 = 0 2. x2 – 4x -117 3. -3x2 + 5x -2 = 0 4. 7x2 – 2x – 8 = 0 There are many methods for solving a quadratic equation. You can always use the quadratic formula, but sometimes another method may be easier. Which method would you choose to solve each equation? Justify your reasoning. 5. x2 + 2x – 13 = 0 6. 4x2 – 81 = 0 7. 9x2 – 31x = 51 8. 3x2 – 5x + 9 = 0 9. x2 + 4x – 60 = 0 10. -4x2 + 3x + 2 = 0 11. The function below models the United States population P in millions since 1900, where t
is the number of years after 1900. P = 0.0089t2 + 1.1149t + 78.4491
a) Use the function to estimate the United States population the year you graduate from high school.
b) Estimate the United States population in 2025. c) Use the function to predict when the population will reach 300 million.

31
Complex Numbers and Solutions
Simplify the radical.
1.) −9 2.) −4 3.) − −25
4.) − −1 5.) −16 6.) − −49
Perform the indicated operation. Write your answer as a complex solution. 7.) (3 + 2𝑖) + (9 + 𝑖) 8.) (5 − 3𝑖) − (−1 + 𝑖) 9.) (2 + 7𝑖) (4 + 2𝑖) 10.) −10𝑖(4 + 7𝑖)
Simplify. Use any method to solve. If necessary, write answers in the form of 𝒂 ±𝒃𝒊 11.) 𝑥2 = −1 12.) 𝑥2 + 2𝑥 + 10 = 0 13.) 𝑥2 − 4𝑥 + 7 = 0 14.) (3𝑥 + 10)2 = −81 15.) 8𝑥2 + 4𝑥 + 2 = 0 16.) 6𝑥2 + 𝑥 + 10 = 0

32
(2 )(2 )i i (1 2 ) ( 3 4 )i i (3 6 )(4 2 )i i 2(3 )i 4 (7 )i i
9
Start Here
6 5 36 (1 3 ) (7 3 )i i 81 16 3 5(3 2 )i
49
16 (3 10 ) (1 2 )i i (3 7 ) ( 1 2 )i i 4 3 16 2 5 2i i
2 9 2 9i i 6 36i 3 4 3 4i i 3 49 9 3 (5 3 )i i
(6 2 ) (1 2 )i i 2i 216 26i 4 3 4 3i i 1 2 1 2i i
225 5 4 1 2i i 1 2 2 3i i (2 )( 3 )i i 2(3 4 )i 3 (6 2 )i i
1
End Here
3 ( 5 )i i 25 (2 )i i (2 3 ) 3i i 3 (2 )i 64
Complex Number Maze Directions: To complete the maze 1) simplify each expression, 2) shade the squares that
contain simplified complex numbers, 3) from the square labeled 'Start Here" follow a
path through adjacent squares that contain simplified complex numbers to the square
labeled "End Here".
33

34
VERTEX FORM
Directions: Using the functions given, write each function in vertex form, find the maximum or minimum point of the
given quadratic function by completing the square, and find the line of symmetry.

35
Algebra Unit 7 Review of Types of Solving/Graphing Solve by graphing. Identify the vertex, axis of symmetry, x-intercepts, and y-intercepts. 1.) 𝑦 = −3𝑥2 + 6𝑥 + 5
2.) 𝑓(𝑥) = 𝑥2 + 4𝑥 + 3
3.) 𝑦 = 1
2𝑥2 + 2𝑥 + 1

36
Solve by factoring. Identify the vertex, axis of symmetry, and find the zeroes. Then graph.
4.) 𝑓(𝑥) = 𝑥2 + 𝑥 5.) 𝑦 = 𝑥2 − 12𝑥 + 36
6.) 𝑦 = 𝑥2 − 9 7.) 𝑓(𝑥) = 4𝑥2 + 5𝑥 − 6

37
Solve by completing the square. Identify the vertex, axis of symmetry, and find the zeroes.
Then graph.
8.) 2𝑥2 − 10𝑥 − 20 = 8 9.) 𝑥2 + 9𝑥 + 20 = 0
10.) 𝑥2 − 8𝑥 = −12 11.) 𝑦 = 𝑥2 + 7𝑥 + 12

38
Real World: Graphing Quadratic Functions
1. Which situation is best represented by the graph? a. Two seconds after the ball is thrown, it has a height of 5 feet. At 4 seconds, the ball reached 2ft. 5 seconds after it was thrown, it hit the ground. b. Two seconds after the ball is thrown, it has a height of 6 feet. At 4 seconds, the ball reached waist height. 4.5 seconds after it was thrown, it hit the ground. c. Two seconds after being thrown, the ball reached its peak height. 4 seconds after it was thrown, it hit the ground. 2. Answer following questions, using the graph above. a) Identify the x intercept(s) and explain what they represent in this context. b.)Identify the y intercept(s) and explain what they represent in this context. c) Does this graph have a maximum or does it have a minimum? Give the coordinates of this point. d) Where is the function increasing? e) Where is the function decreasing? 3. Which situation is best represented by the graph? a. We started bungee jumping at 12 ft. At 3 seconds we reached our lowest point at 3 ft. We finished our one jump at 6 seconds. b. We started bungee jumping at 12 ft. At 6 seconds we reached our lowest point at 6 ft. We finished our one jump at 12 seconds. c. We started bungee jumping at 10 ft. At 3 seconds we reached our lowest point at 3 ft. We finished our one jump at 6 seconds.

39
4. Answer following questions, using the graph above. a) Identify the x intercept(s) and explain what they represent in this context. b.)Identify the y intercept(s) and explain what they represent in this context. c) Does this graph have a maximum or does it have a minimum? Give the coordinates of this point. d) Where is the function increasing? e) Where is the function decreasing? 5. Sketch a graph that models the following situation. Label intercepts and maximum/minimum: Charlie is at the baseball field practicing. He swings at 3 feet high and hits a homerun. After 5 seconds, the ball reaches its maximum height of 15 feet. Ten seconds after hitting, the ball hits the ground.
6.) Answer following questions, using your graph. a) Identify the x intercept(s) and explain what they represent in this context.
b.)Identify the y intercept(s) and explain what they represent in this context.
c) Does this graph have a maximum or does it have a minimum? Give the coordinates of this point.
d) Where is the function increasing? e) Where is the function decreasing? 7. Sketch a graph that models the following situation. Label intercepts and maximum/minimum: Allison is fishing on a boat with her grandfather. Her grandfather gives her a net to try and get fish with. She starts with the net 1.5 feet above sea level. It takes her 2 seconds to get the net deep into the lake, at 3 feet below sea level. She scoops up a little fish and brings him out of the water in 2 seconds back to her starting point.
8.) Answer following questions, using your graph above. a) Identify the x intercept(s) and explain what they represent in this context.
b.)Identify the y intercept(s) and explain what they represent in this context.
c) Does this graph have a maximum or does it have a minimum? Give the coordinates of this point.
d) Where is the function increasing? e) Where is the function decreasing?