alexander ljungqvist stern school of business new...
TRANSCRIPT
Conflicts of interest and efficient contracting in IPOs* †
Alexander Ljungqvist Stern School of Business
New York University and CEPR
First draft: June 11, 2002 This draft: November 15, 2002
* I thank Craig Dunbar, Michel Habib, Hans Hvide, Tim Jenkinson, Eli Ofek, Bill Wilhelm, and seminar participants at Columbia Business School, Indiana University, New York University, the Norwegian School of Economics, the Norwegian School of Management (BI), Notre Dame, Penn State, Purdue, Rutgers, the Stockholm School of Economics, and the 2002 Oxford Finance Symposium for helpful comments. All errors are my own. † Address for correspondence: Stern School of Business, New York University, Suite 9-190, 44 West Fourth Street, New York NY 10012-1126. Phone 212-998-0304. Fax 212-995-4233. e-mail [email protected].
2
Conflicts of interest and efficient contracting in IPOs
Abstract We study the role of underwriter compensation in mitigating conflicts of interest between
companies going public and their investment bankers. Making the bank’s compensation more
sensitive to the issuer’s valuation should reduce agency conflicts and thus underpricing.
Consistent with this prediction, we show that contracting on higher commissions in U.K. IPOs
leads to significantly lower underpricing: a one percentage point increase in the commission rate
reduces the initial return by 11 percentage points, after controlling for other influences on
underpricing. Moreover, we present evidence consistent with issuers choosing commission rates
optimally. Overall, our results indicate that issuers and banks contract efficiently in U.K. IPOs.
Key words: Initial public offerings; Underpricing; Intermediation; Integrated securities houses; Underwriting contracts.
JEL classification: G32, G24
1
1. Introduction
Do investment banks maximize value to issuers when underwriting offerings of securities?
Recent regulatory investigations in the U.S. appear to be motivated by the assumption that they do
not. For instance, in January 2002, the Securities and Exchange Commission and NASD Regulation
jointly fined CSFB $100 million for “taking millions of dollars from customers in inflated
commissions in exchange for allocations of “hot” Initial Public Offerings (IPOs)” between April
1999 and June 2000.1 Such allocations would have generated huge customer profits at a time when
the average IPO was underpriced by 70 percent. Recent empirical research into IPO pricing also
implicitly assumes a conflict of interest between investments banks and issuers leading to higher
underpricing (Loughran and Ritter (2002a,b); Ljungqvist and Wilhelm (2003)). In their review
article, Ritter and Welch (2002) view this as one of the most promising areas of IPO research.
In principle, issuers can mitigate this agency conflict in two ways: they can monitor the
investment banks’ selling effort and pricing behavior directly, or they can use contract design to
realign the banks’ incentives by making their compensation an increasing function of the offer
price. Ljungqvist and Wilhelm (2003) provide evidence consistent with monitoring in the U.S., by
showing that first-day returns are lower, the greater are the monitoring incentives of the issuing
firms’ CEOs. In this paper, we focus on the role of contract design.
In practice, banks typically buy the IPO shares from the issuer at the offer price less a spread.
The spread is agreed well in advance of the offer price being fixed and typically is set as a fraction
of the offer price (with seven percent being the dominant spread in the U.S.; see Chen and Ritter
(2000)). Thus, the size of the spread can be thought of as the pay-for-performance sensitivity of the
bank’s compensation. All else equal, we would expect a higher spread to lead the bank to expend
greater effort, resulting in offer prices being set higher, or equivalently, underpricing being reduced.
2
This intuition is modeled formally by Baron (1982) in the context of a fixed-price offering and
Biais, Bossaerts, and Rochet (2002) for bookbuilding efforts.
Testing these agency models with U.S. data is difficult for two reasons. First, as Chen and Ritter
(2000) show, spreads cluster at seven percent so cross-sectional tests of the relation between spreads
and underpricing have little power.2 Perhaps not surprisingly, therefore, Chen and Ritter fail to find
a trade-off between underpricing and gross spreads in the U.S. Second, there is unobserved
heterogeneity because researchers do not observe the bundle of services issuers expect to receive in
return for the seven percent spread. These services include not only selling effort but also after-
market price support and analyst coverage, among others. The part of the seven percent that goes
toward inducing selling effort is thus not directly observable in the U.S.
IPO contracts in the U.K. are not subject to these shortcomings. First, there is no clustering.
Banks’ compensation takes the form of a linear, two-part function consisting of a flat fee and a
percentage commission on shares sold that varies between zero and seven percent. (Clearly the flat
fee has no effort incentive properties at the margin. Flat fees are rare if not unheard of in the U.S.)
Second, IPO contracts in the U.K. lack the uniformity we see in the U.S. They explicitly outline the
bundle of services issuers buy, and issuers’ choices are very heterogeneous.
This heterogeneity allows us to estimate the cost drivers that make up the commission, and thus
to isolate econometrically that part of the commission that goes toward inducing selling effort.
Linking this to realized underpricing, we show that contracting on higher commissions leads to
significantly lower underpricing: a one percentage point increase in the commission rate reduces the
initial return by 11 percentage points, after controlling for other influences on underpricing.
Moreover, we present evidence consistent with issuers choosing commission rates optimally. These
results do not appear to be driven by endogeneity concerns or outliers. Overall, our results indicate
that issuers and banks contract efficiently in U.K. IPOs.
3
In investigating the role of underwriter compensation, we control for a feature of the U.K.
institutional framework that is largely absent in the U.S. In the U.K. marketplace, investment
banks’ organizational structure is much less homogenized than in the U.S. Banks specializing in
either corporate finance or institutional brokerage co-exist with the more familiar U.S.-style
integrated securities houses (many of which are U.S.-owned). The integration of the corporate
finance and brokerage functions can lead to conflicts of interest to the detriment of either issuers or
investors, depending on whether the bank views future business with corporations or with investors
as the more lucrative. Banks that specialize in corporate finance rather than brokerage business
should not be subject to such conflicts of interest. In other words, when pricing an IPO they are
more likely to look after issuers’ interests, leading to lower underpricing. Consistent with this
prediction, our results show that issuers that choose relatively more specialized corporate finance
advisers experience much reduced underpricing.
Our empirical model has three components. Beginning with the last, we wish to test the
comparative static prediction that higher commissions reduce initial returns. Commissions are
endogenous and so we need to model them explicitly to mitigate the possibility of endogeneity bias
in the initial return regression. Commissions reflect not only issuers’ intended pay-for-performance
incentives but also the bundle of IPO services they have negotiated with their banks. These services
are presumably also chosen endogenously, so we first need to model issuers’ demands for them to
mitigate the possibility of selection bias in the commission equation.
The paper proceeds as follows. Section 2 details the sample and data sources. Section 3
describes U.K. IPO contracts and estimates the determinants of issuers’ demands for the various
IPO services. Section 4 models commissions. Section 5 analyzes the link between commissions and
underpricing and provides various robustness tests. Section 6 concludes.
4
2. Sample and Data
2.1 Data and Sources
Our dataset spans the period January 1991 to December 2001 and is an updated version of the
dataset compiled by Ljungqvist and Wilhelm (2002) which ends in May 2000. The list of IPOs was
obtained from the London Stock Exchange, Dealogic’s Equityware, and Thomson Financial’s SDC
and covers companies listing on the London Stock Exchange irrespective of their country of origin.
After excluding IPOs by investment trusts, companies previously listed elsewhere, global
depository receipts trading on SEAQ International, and introductions (listings not accompanied by
the sale of securities), there were 1,058 IPOs in the U.K. over the sample period. For 1,008 of these,
we are able to obtain the IPO contracts from filings with the London Stock Exchange and the U.K.
Listing Authority. From these contracts, we extract information regarding the commission rate and
flat fee elements of the compensation function. From the prospectuses, we hand-collect data on
company age, sales, debt, industry affiliation, and ownership structure at the time of the IPO, as
well as offer prices and gross proceeds. First-day trading prices are from Datastream, with all initial
returns in excess of 30 percent cross-checked using Reuters. We lack after-market prices for 10
IPOs. Cumulative inflation over the sample period is 36.9 percent using the Retail Price Inflation
index (excluding mortgage interest), so we express all currency amounts in December 2001
purchasing power. To control for the effect of withdrawn IPOs, we identify 290 offers that were
cancelled or postponed between 1991 and 2001 using filings with the London Stock Exchange and
the U.K. Listing Authority and a Reuters news search.
2.2 Descriptive Statistics
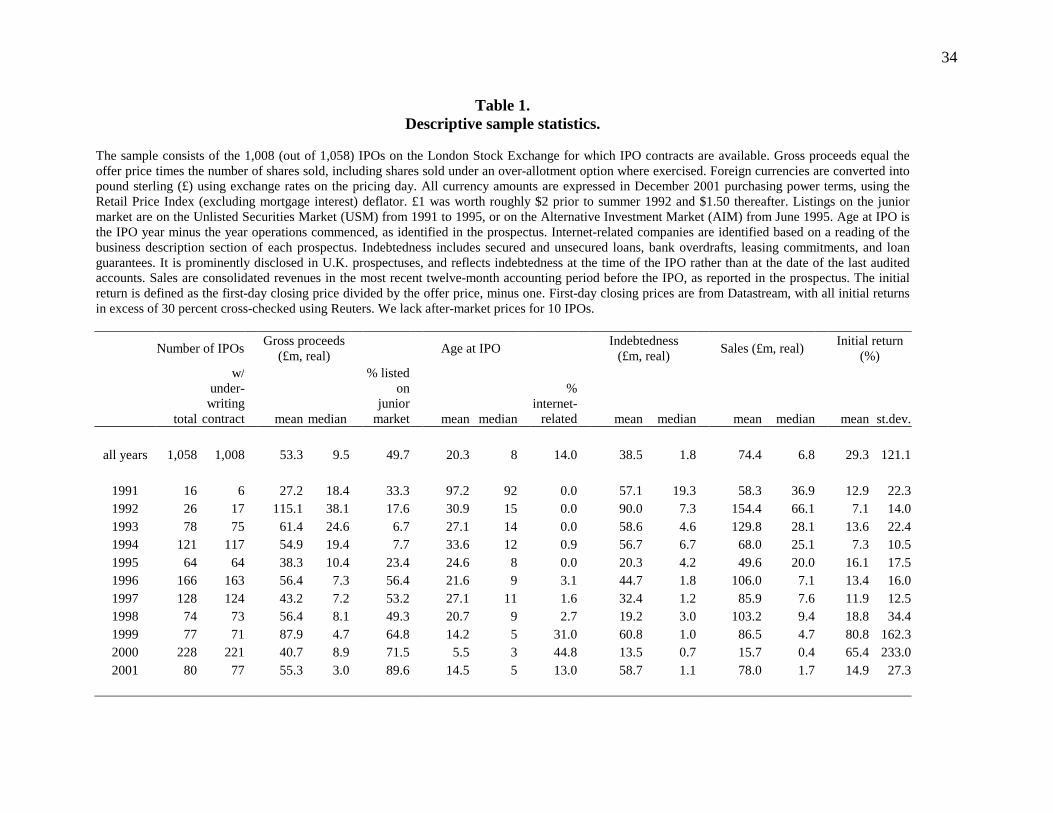
Table 1 provides descriptive sample statistics for the overall period and by year. IPO volume
fluctuates considerably, ranging from 16 IPOs in 1991 to 228 in 2000, with more than 100 new
5
issues in 1994, 1996, 1997, and 2000. The average (median) company raised £53.3 million (£9.5
million) in its IPO. This is lower than gross proceeds in the U.S. during the 1990s (Ljungqvist and
Wilhelm (2003)). What is even more different is the time trend: while in the U.S., companies raised
more and more money as the IPO market grew hotter towards the end of the decade, median gross
proceeds declined substantially in the U.K.
Just under half of the companies listed on the junior market tier (the Unlisted Securities Market,
USM, from 1991 to 1995, and the Alternative Investment Market, AIM, from June 1995), rather
than on the Official List. As Table 1 shows, junior market listings account for a larger fraction of
the sample in the second half of the period, following the opening of AIM.
Next, Table 1 describes certain firm characteristics that we will use to control for ex ante
uncertainty about the issuer’s valuation. At the time of its IPO, the average (median) company was
20.3 (eight) years old. Over the period, age at issue declined substantially, and at the peak of the hot
market in 1999-2000, the median company went public three to five years after commencing
operations. This is roughly comparable to the U.S. during the 1990s (Ljungqvist and Wilhelm
(2003)). Based on a reading of the business description section of the prospectus, internet-related
firms account for 14 percent of the sample overall, and 31 to 44.8 percent in 1999 through 2000,
mirroring developments in the U.S. The level of “indebtedness” at the time of the IPO (which
listing rules define as secured and unsecured loans, bank overdrafts, leasing commitments, and loan
guarantees) averages £38.5 million in real terms (median: £1.8 million). As James and Wier (1990)
argue, the presence of credit relationships can reduce valuation uncertainty. To control for size
effects we include revenue. In the last twelve month accounting period before the IPO, the average
(median) company had sales of £74.4 million (£6.8 million).
The final two columns of Table 1 show the mean and standard deviation of first-day returns.
Initial returns average 29.3 percent over the period, with notable spikes in 1999 and 2000 when the
6
average IPO jumped in price by 80.8 percent and 65.4 percent on its first day of trading,
respectively. These spikes also mirror conditions in the U.S. IPO market at the time.
3. The Structure of U.K. IPO Contracts
3.1 Contracting Environment
The London Stock Exchange requires IPO issuers to hire a “sponsor” (or, on AIM, a “nominated
adviser”) and a “nominated broker”. The sponsor fulfills the same role as the lead manager’s
corporate finance department in a U.S. IPO, such as valuing the company and helping prepare the
IPO prospectus. The broker places the stock with investors in much the same way as a lead
manager’s equity capital markets desk does in the U.S. Sponsor and broker need not be the same
bank. In our sample, they are different in 39.6 percent of cases.
Conceptually, there are three types of sponsor in the U.K. marketplace: those (such as Baring
Brothers or N.M. Rothschild & Sons) that rarely or never act as brokers; integrated securities houses
(such as Morgan Stanley or UBS Warburg) that usually broker the deals they sponsor; and brokers
(such as Cazenove & Co or HSBC James Capel) that only occasionally act as sponsor but whose
specialty is to broker deals. These differences in specialization likely affect how well a sponsor’s
interests are aligned with those of the issuer. We will later propose a measure of the sponsor’s
independence of the interests of buy-side investors to distinguish between these cases.
Following the IPO, the sponsor and broker continue to work for the issuer and receive annual
retainers in return. Importantly, a nominated broker would be expected to market the stock to
institutional investors in the after-market, not least by publishing analyst research on an on-going
basis. Thus, IPO issuers in the U.K. explicitly purchase analyst coverage.
The typical sequence of an IPO in the U.K. is as follows. About one month prior to listing, the
company releases a “pathfinder” prospectus which resembles a “red herring” in the U.S., except that
7
it need not disclose the offer price range. The pathfinder contains a draft contract between the
issuer, the sponsor, and the broker, setting out the duties and responsibilities of the parties as well as
the banks’ IPO compensation in the form of a flat fee and a commission rate.3,4 As in U.S. seasoned
offers (Bhagat and Frost (1986)), contracts are negotiated rather than awarded through competitive
sealed bid auctions. The final prospectus containing the offer price is released on “impact day”,
about 10 days prior to listing. At this point, the IPO contract becomes binding conditional on the
Exchange approving the listing by a certain date, typically no later than three weeks after impact
day. Following impact day, the broker endeavors to place the shares with investors.
3.2 Bank Compensation
The compensation the sponsor and broker receive for their IPO services follows one of three
main schedules in the U.K.:
• The linear, two-part function consisting of a flat fee and a percentage commission on shares sold
is the dominant form, and is used in 797 of the 1,008 contracts in the sample. This includes two
special cases: 156 contracts where the banks received no flat fee, resembling U.S. practice, and
79 contracts where the banks received only a flat fee and no commission.
• Some contracts combine a flat fee with different commission rates for different parts of the
offer. In offers open to the public prior to January 1996, banks were typically paid a higher
commission on shares placed with retail investors than on shares placed with institutions (89
cases). And in some rare cases, insiders pay a commission rate on the shares they sell in the IPO
that is higher (eight cases) or lower (18 cases) than the rate the company pays on newly issued
stock. In either case, we compute and report the weighted average commission rate (since that is
the lead manager’s expected marginal compensation) and so treat the compensation schedule as
a linear, two-part function.
8
• The commission rate can also be a step function of the number of shares placed or of proceeds
raised. For instance, banks might be paid three percent for the first 10 million raised, rising to
four percent for the next five million. Such convex incentives are present in 31 contracts,
including 13 cases where issuers offer the banks “performance bonuses” of between ½ and one
percent of gross proceeds, payable after the IPO at the sole discretion of the board. We have no
information regarding the actual payment of the bonuses. The reverse, though rare, is possible
too: lead managers may be paid a lower rate on additional shares sold. Such concave incentives
are present in 15 contracts. For the purpose of our empirical tests, we compute average
commission rates though our results are robust to using the (highest) marginal rate.
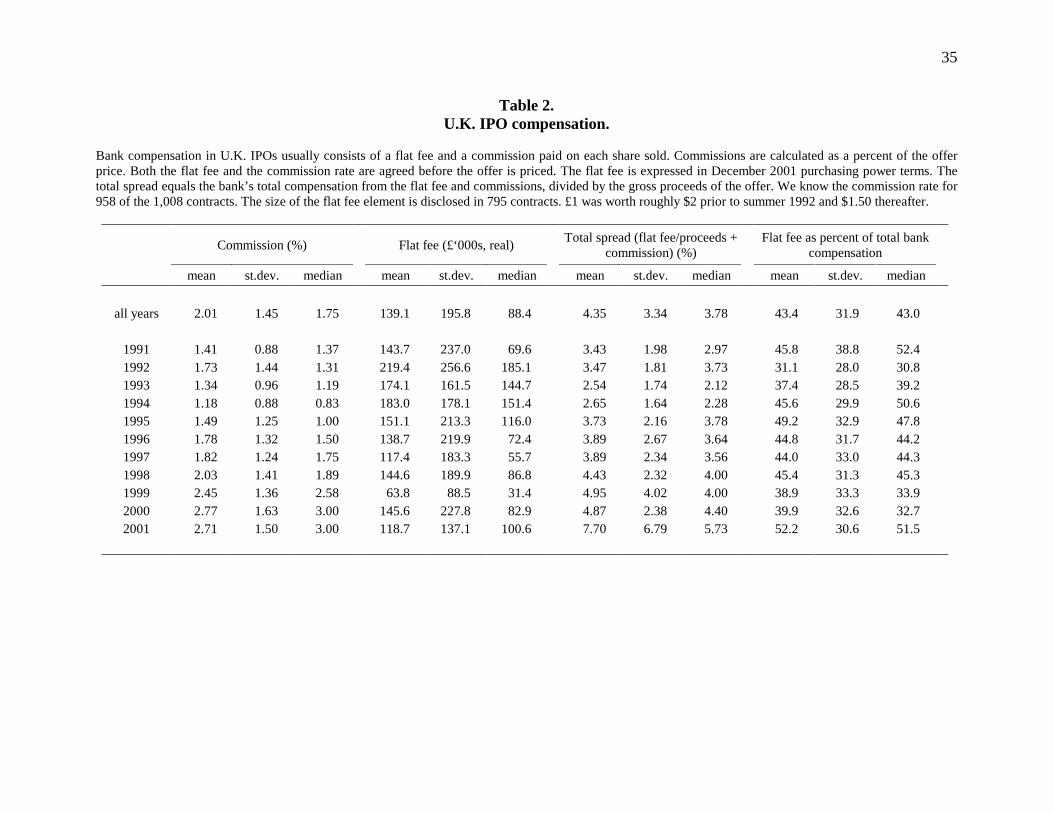
Table 2 provides details of IPO compensation in the U.K. We know the commission rate for 958 of
the 1,008 contracts and the size of the flat fee for 795. Commission rates average 2.01 percent over
the period (median: 1.75 percent), with a pronounced positive drift from 1.41 percent in 1991 to
2.71 percent in 2001. The range (not shown) is zero to seven percent. The most frequent
commission rate is three per cent (18.3 percent of cases), followed by ¾ percent (13.2 percent of
cases) and two percent (8.4 percent of cases).
In December 2001 purchasing power the flat fee element averages £139,060 (median: £88,434).
It exhibits a fair degree of variation but no clear trend over time. Together, the commission and flat
fee (where disclosed) amount to 4.35 percent of gross proceeds for the average company (median:
3.78 percent), considerably less than the typical seven percent spread paid by U.S. companies (Chen
and Ritter (2000)). Over time, there is a clear increasing trend, with both average and median total
spreads nearly doubling between 1991 and 2001. If there are economies of scale in IPO costs, this
trend is likely related to the decrease in gross proceeds over the period shown in Table 1.
With regard to bank compensation, IPOs in the U.K. cost only about two-thirds as much as IPOs
in the U.S. (4.35 vs. seven percent). Part of the difference may be due to the British practice of
9
keeping the sponsor and broker under contract after the IPO, which might promote the banks’
willingness to spread some of their costs over time. In the U.S., by contrast, there is only an
expectation that the lead bank will get future business (for a job well done).
In the average (median) IPO, the investment bank receives 43.4 (43.0) percent of its total
realized compensation from the flat fee element and the remainder from commissions. (The
expected proportions would have depended on the expected offer price and offer size at the time of
contracting.) With the exception of 2001, which saw a shift towards flat fees, these proportions
remained relatively stable over the period.
3.3 IPO Services
In addition to the distribution of their stock, what services do issuers purchase from the
investment banks? We focus on five discretionary services that issuers may demand and that may
increase the cost of their IPOs: underwriting cover, price support, marketing to investors in the U.S.,
retail participation, and post-IPO analyst coverage provided by the broker.
• As in U.S. firm-commitment offers, underwriting cover guarantees that the issuer will receive
the net proceeds regardless of the broker’s success in placing the stock. Unlike in the U.S.,
where deals are typically priced just hours before final allocations take place, U.K. banks tend to
bear underwriting risk for several days following impact day.5 It is common for underwriters to
lay off part of this risk by pre-placing shares with investors, who receive a commitment fee out
of the underwriter’s commission.
• Like in the U.S., banks managing an IPO in the U.K. are allowed to engage in activities that
stabilize prices in the first month of trading. Unlike in the U.S., however, they can only do so if
they have previously alerted investors to the possibility of price stabilization via an explicit
10
statement in the IPO prospectus.6,7 This is not a boilerplate statement, suggesting that issuers
decide whether or not to allow for price support on a case-by-case basis.
• Marketing in the U.S. requires either registration under the 1933 Securities Act or exemption
under Rule 144A for sale to “qualified institutional buyers” only. In either case, the IPO
prospectus includes a prominent disclaimer. Ljungqvist, Jenkinson, and Wilhelm (2003) show
that marketing IPOs in the U.S., though more costly, leads to significant price improvement in a
sample of new issues from 65 countries, particularly in less developed markets, perhaps because
the involvement of U.S. investors improves competition among investors.
• Until January 1996, issues exceeding certain proceeds thresholds were required to offer shares
to retail investors. Since January 1996, issuers can freely choose between a “placing” targeted
solely at institutional or extremely wealthy investors, and offers that are open to retail investors
(see Ljungqvist and Wilhelm (2002), Appendix C for further details).8
• As mentioned earlier, the bank brokering the IPO will usually provide analyst research coverage
of the company after the IPO. The perceived quality of the research and the reputation of the
broker’s analysts are likely to affect institutional demand and liquidity.
To measure the reputation of the broker’s analysts, we use the annual Extel Survey of Investment
Analysts (now owned by Thomson Financial). The survey provides institutional investors’ views on
brokerage houses based on votes cast for individual analysts, weighted by the investors’ funds under
management. For instance, in 2001, UBS Warburg’s analysts received 11.88 percent of all weighted
votes cast, making it the highest ranked London broker. Our variable “analyst ranking” is defined as
the percent of weighted votes the IPO issuer’s broker received in the Extel survey published in the
year the IPO takes place. For instance, “analyst ranking” equals 11.88 for all IPOs brokered by UBS
Warburg in 2001. If a broker is not ranked in the Extel survey, it is given a score of zero. In the case
of IPOs with multiple brokers, we compute the simple average of each broker’s weighted votes.
11
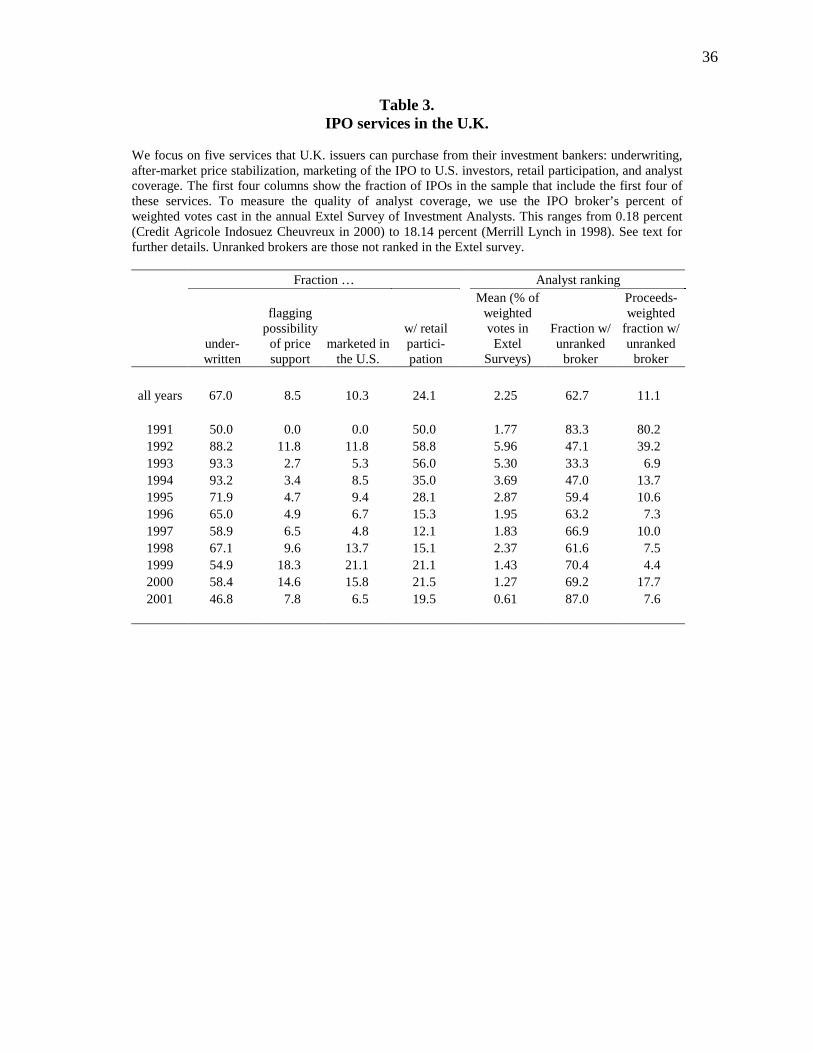
Table 3 shows that 67 percent of sample offerings were underwritten, 8.5 percent flagged the
possibility of price support, 10.3 percent were marketed to U.S. investors, and 24.1 percent were
open to retail investors. The average analyst ranking is 2.25 percent, which to put into perspective is
a little higher than the 2.1 percent that earned Credit Lyonnais the number 10 rank in 1995. 62.7
percent of IPOs, accounting for 11.1 percent of money raised, used an unranked broker.
Underwriting cover was particularly popular in 1992-1994 when around 90 percent of issues
were underwritten. Price support was particularly popular in 1991, 1999, and 2000, when more than
10 percent of issuers contracted to receive price support. Marketing to U.S. investors became more
widespread towards the end of the period. Retail participation, on the other hand, declined over time
as regulations requiring retail participation were first relaxed (in December 1993 and January 1995)
and then abolished (in January 1996). Note, however, that around one in six issuers voluntarily
chose to market their offerings to retail investors in 1996 through 2001. In the later years, more
issuers use unranked brokers, but these are typically the smaller offerings.
3.4 Issuer Demands for IPO Services
With the exception of the underwriting decision, which has been analyzed in the literature on
the choice between firm-commitment and best-efforts offers in the U.S. (see, for instance, Welch
(1991)), issuers’ demands for IPO services have not previously been modeled. Thus the empirical
models reported in this section are exploratory. Their purpose is to allow us to control for the
possibility that endogeneity in choosing IPO services biases our estimation of the relation between
commissions and initial returns.
We conjecture that issuers’ demands are a function of conditions in the stock market in general
and the IPO market in particular, as well as offer and firm characteristics. We estimate probit
models of the probability that an issue is underwritten, flags the possibility of price support, is
12
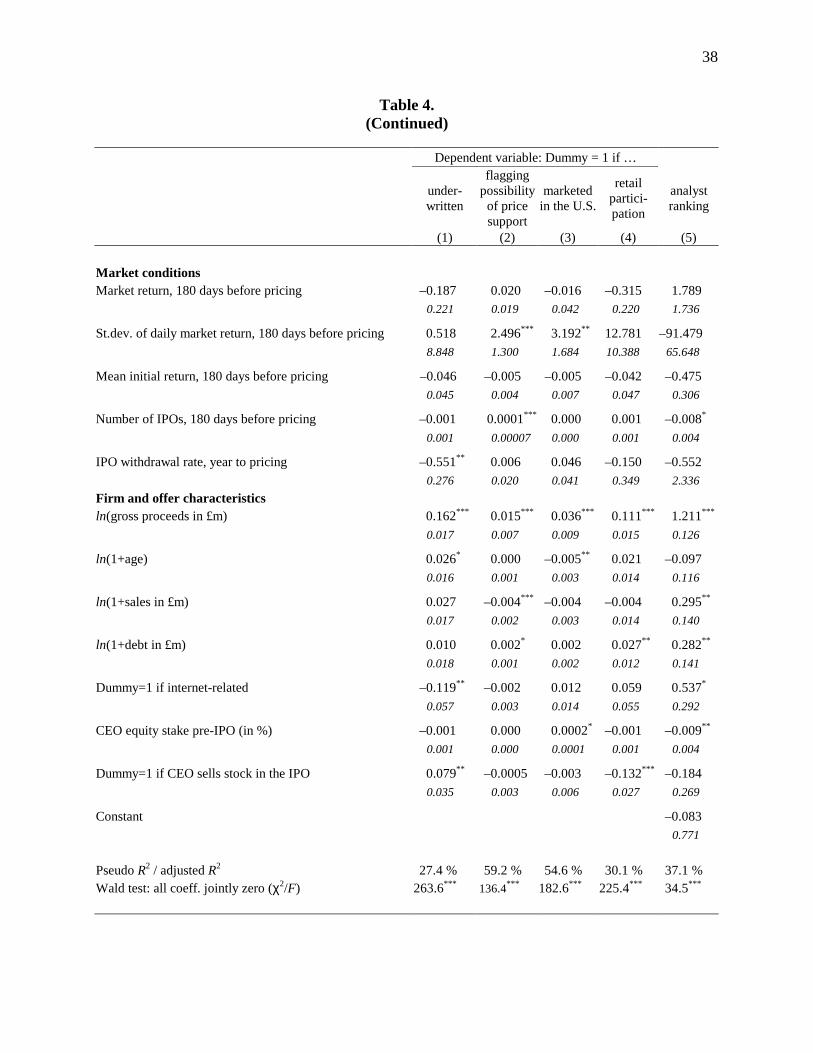
marketed to U.S. investors, or is open to retail investors. To aid the economic interpretation of the
results, columns (1) through (4) of Table 4 show the change in the probability for an infinitesimal
change in each independent, continuous variable and, by default, the discrete change in the
probability for dummy variables, rather than the probit coefficients. The regression of analyst
ranking shown in column (5) is estimated using least-squares. White heteroskedasticity-consistent
standard errors are shown in italics.
Looking across the five columns, the most consistent determinant of issuers’ demands for the
various services is offer size. The greater are log proceeds, the more likely are U.K. IPOs to be
underwritten, to allow for price stabilization, to be marketed to U.S. investors, and to involve retail
investors (after allowing for compulsory retail participation using dummies for the years 1991
through 1995). Firms raising larger amounts also hire brokers with higher-ranked analysts. The t-
statistics are all in excess of seven. Thus, there are two main types of offering in the U.K. market:
smaller IPOs that are placed with domestic institutions by brokers who provide no after-market
price support and little if any research coverage; and larger issues that may include one or more of
the additional IPO services in the table.
We might have expected that underwriting is more popular when the stock market is performing
poorly (as measured by the return on the FT-SE All Share Index, excluding investments trusts, over
the 180 calendar days before the pricing date), the market is more volatile (as measured by the
standard deviation of daily index returns over the same period), and the IPO market is less “hot” (as
measured by the average initial return and number of companies going public in the prior 180
days).9 The coefficients on these variables have the right signs but are imprecisely estimated. We do
find, however, a significant relation (p = 0.046) between the demand for underwriting and the IPO
withdrawal rate (which we define as the number of IPOs that are cancelled divided by the sum of
completed and cancelled IPOs in the 12 months to pricing). The relation is negative, suggesting
13
perhaps that banks are reluctant to underwrite securities at times when many IPOs are withdrawn.
Finally, IPOs are more likely to be underwritten, the older the company (p = 0.095), if the issuer’s
business is not internet-related (p = 0.027), and if its CEO sells stock in the IPO (p = 0.026). The
pseudo R2 of 27.4 percent indicates the model has good overall explanatory power.
The demand for price support is unrelated to market returns but increases in market volatility (p
< 0.001) and the number of recent IPOs (p = 0.009). It is lower for larger companies as measured by
log sales (p < 0.001) and marginally higher for more indebted issuers (p = 0.071). U.S. marketing is
more likely in more volatile markets (p = 0.037), among younger companies (p = 0.043), and the
more equity the CEO owns before the IPO (p = 0.071). Controlling for time variation and size
dependence in regulations mandating retail participation in the early years, companies are more
likely to open their offers to retail investors the more indebted they are (p = 0.025) and when the
CEO does not sell stock in the IPO (p < 0.001). The pseudo R2 for these three models range from 30
percent to 59 percent. Finally, companies hire brokers with higher-ranked analysts, the fewer
companies have recently gone public (p = 0.09), the larger they are in terms of log sales (p = 0.036),
the greater their indebtedness (p = 0.045), if their business is internet-related (p = 0.066), and the
less equity the CEO owns before the IPO (p = 0.018). The adjusted R2 of 37.1 percent again
indicates good fit.
4. Commissions and Pay-for-performance Sensitivities
4.1 Estimation and Empirical Model
To estimate the pay-for-performance sensitivity of the investment bank’s compensation
contract, we first need to estimate the contribution to the commission rate of the five services
analyzed in the previous section. We hence regress commission rates on dummy variables for issues
that are underwritten, have flagged the possibility of price support, are marketed in the U.S., or are
14
open to retail investors, as well as on the analyst ranking variable. The coefficient estimates are
measures of the marginal increase in commissions that is due to each service.10
Issuers presumably choose their bundles of services endogenously rather than randomly, so OLS
coefficients are likely to be biased. To estimate consistent coefficients for the four binary variables,
we use Heckman’s (1979) two-step treatment effects model. In the first step, we generate inverse
Mills’ ratios from the four probit models in Table 4. In the second step, we include these alongside
the binary variables in a least-squares regression with commission rates as the dependent variable.11
Non-zero coefficients estimated for the inverse Mills’ ratios would indicate self-selection bias.
Broker ranking, on the other hand, is treated as exogenous. Using the model reported in column
(5) of Table 4 as the auxiliary regression (with a dummy for VC backed companies added for
identification), a Durbin-Wu-Hausman test (Davidson and MacKinnon (1993) pp. 237f) finds no
evidence that broker ranking is endogenous with respect to the commission rate (p = 0.307). Thus,
instrumenting broker ranking in the commission regression would only reduce the efficiency of the
estimates.
We also control for other possible determinants of commissions.12 A bank that specializes in
corporate finance work rather than institutional brokerage may have a relative cost disadvantage,
and so charge higher fees, compared to an integrated securities house or a bank specializing in
brokering deals. To measure the degree of specialization – or equivalently, the sponsor’s
independence of the interests of buy-side investors – we compute, for each of the 107 sponsors in
the sample, the ratio of the number of deals the bank has sponsored over the sample period to the
sum of the number of deals it has sponsored and the number of deals it has brokered.13,14 This ratio
varies between zero and one. It equals one for a sponsor that never brokers IPOs, ½ for an
integrated securities house that brokers all the deals it sponsors, and less than ½ for a broker that
only occasionally acts as a sponsor. The median sample company uses an integrated securities
15
house (independence measure of 0.49), while 23.4 percent of sample companies use a sponsor that
never brokers IPOs. We interact our independence measure with a dummy equaling one if the
sponsor also brokers the deal to control for fee differences when issuers hire two separate banks.
Marketing an IPO presumably requires greater effort in bearish or volatile markets or when
many IPOs are being withdrawn. Periods of high initial returns may prompt issuers to offer higher
commissions so as to reduce underpricing in their own offering. Similarly, when IPO volume is
particularly high, the bank’s opportunity cost of effort may increase (Altinkilic and Hansen (2000))
also prompting issuers to offer higher commissions. Thus, we include the market conditions
variables from Table 4.
In the U.S., there is ample evidence of economies of scale in IPO spreads (see for instance Ritter
(1987), Dunbar (2000), or James (1992)), with smaller issues paying higher spreads.15 Whether this
will be the case for commissions in the U.K., however, is not clear: after all, issuers could cover the
banks’ fixed cost of managing an IPO via the flat fee. Nevertheless, we include log proceeds to
allow for the possibility of economies of scale in commission rates.
Uncertainty about the issuer’s value should increase the effort required in marketing the deal, so
we include log age, log sales, log debt, and the internet dummy variable as uncertainty proxies.16
Finally, we allow for the possibility of substitution between contracting and monitoring in
mitigation of the agency conflict between issuer and bank. Monitoring intensity is unobservable, but
Ljungqvist and Wilhelm (2003) argue that the CEO will expend less effort monitoring on behalf of
other shareholders when his stake in the outcome is smaller. His stake in the outcome is, in turn,
related to the fraction of the equity he owns before the IPO and to whether he sells stock in the IPO
(since Habib and Ljungqvist (2001) show that owners are more tolerant of underpricing the fewer
shares they sell at the time of the IPO, because the benefit of costly monitoring then is smaller). For
this, we hand-collect ownership and selling data from the prospectuses. The average (median) CEO
16
in our sample owns 29 (20.5) percent of equity outstanding just before the IPO. CEOs sell stock in
35.3 percent of sample IPOs.
4.2 Results
Table 5 presents the coefficient estimates alongside White heteroskedasticity-consistent
standard errors. Overall, the regression has good fit, given the adjusted R2 of 37.6 percent.
Commission rates are not significantly related to whether an offer is open to retail participation.
Underwriting cover increases commission rates by 112 basis points on average (p = 0.023), and the
negative and significant coefficient estimated for the inverse Mills’ ratio indicates that self-selection
would have caused OLS to estimate a downward-biased coefficient. Price stabilization increases
commission rates by 176 basis points on average (p = 0.009), with no evidence of self-selection
bias. Marketing to U.S. investors adds 206 basis points to the commission (p = 0.005), after
correcting for self-selection. Taken together, these estimates confirm Altinkilic and Hansen’s (2000)
conjecture that bank compensation increases at the margin in the cost of services provided.
Analyst ranking does not have a significant effect on commissions. However, this does not rule
that brokers with higher-ranked analysts charge issuers more via the annual post-IPO retainer.
Consistent with a cost disadvantage, relatively more independent sponsors charge higher
commissions (p = 0.011). This effect does not depend on whether they also broker the deal (p =
0.554 for the interaction term). In the next section, we will investigate whether hiring a more
independent sponsor leads to an offsetting benefit, in the form of reduced underpricing.
Market conditions behave as predicted. Issuers pay higher commissions when index returns
have been lower (p = 0.12) and in more volatile markets (p < 0.033). Volatility has the larger
impact: a one standard deviation increase in daily volatility (equivalent to 0.26 percent) during the
180 days pre-pricing increases commissions by 12 basis points, whereas a one standard deviation
17
fall in the level of market returns (equivalent to 7.94 percent) increases commissions by only seven
basis points. Conditions in the IPO market also affect commissions. A one standard deviation
increase in the level of underpricing during the 180 days pre-pricing (equivalent to 51.9 percent)
increases commissions by 14 basis point (p = 0.027). This is consistent with issuers offering higher
commissions in hot markets so as to reduce underpricing in their own offering. They also pay higher
commissions, the more firms have gone public in the prior 180 days (p = 0.076) and the more firms
have recently withdrawn their IPOs (p = 0.009), with one standard deviation increases in these
variables increasing commissions by 12 and nine basis points, respectively.
Commissions decrease in log proceeds (p = 0.033) suggesting the presence of economies of
scale. Altinkilic and Hansen (2000) advocate the use of a different functional form to allow for a U-
shaped relation between underwriter compensation and issue size, using inverse proceeds and
proceeds over pre-money market capitalization instead of log proceeds. However, including these
variables does not alter our conclusion.17
Commissions increase in valuation uncertainty given the negative coefficient estimated for log
sales (p < 0.001), though somewhat surprisingly we find a positive coefficient for log age (p =
0.04).
Finally, we find strong evidence of substitution between contracting and monitoring. Issuers pay
22.3 basis points lower commissions when the CEO sells stock in the IPO and so has a personal
interest in monitoring the banks’ pricing and selling effort (p = 0.023).
If we take regression model (6) in Table 5 as the average pricing schedule, holding market
conditions and firm/offer characteristics constant, we can impute each issuer’s chosen pay-for-
performance sensitivity as the difference between the actual commission agreed and the
commission predicted by model (6). This “excess” commission rate will be positive (negative)
when issuers pay more (less) than their bundle of services, market conditions, and characteristics
18
require on average. In this view, higher effort incentives correspond to paying a commission rate in
excess of that predicted by model (6).
5. Commissions, Selling Effort, and Underpricing
Do issuers design compensation contracts that induce investment banks to expend greater
selling effort? If so, we expect excess commissions to have a negative effect on underpricing after
controlling for other determinants of initial returns.
5.1 An Empirical Model of Underpricing
Most theories of IPO underpricing, including Baron’s (1982) and Biais, Bossaerts, and Rochet’s
(2002) agency models, predict that initial returns are higher, the greater is the ex ante uncertainty
about an issuer’s value. We attempt to control for this using log age (as in Loughran and Ritter
(2002b) and Ljungqvist and Wilhelm (2003)), log debt (as in James and Wier (1991) and Habib and
Ljungqvist (2001)), and the internet dummy (as in Loughran and Ritter and Ljungqvist and
Wilhelm). We do not include log proceeds or log sales as risk proxies, as neither is significantly
related to initial returns in our data. This lack of correlation makes log proceeds and log sales good
candidates for instruments. In particular, as shown in the previous section, they correlate
significantly with commissions, ensuring that predicted and excess commissions from the first-stage
regression in Table 5 can be properly instrumented for inclusion in the underpricing regression.
As discussed earlier, Ljungqvist and Wilhelm (2003) argue that underpricing will be higher, the
less of a stake the CEO has in expending monitoring effort to reduce it, so we expect an inverse
relation between initial returns and CEOs’ equity stakes just before the IPO. Habib and Ljungqvist
(2001) argue that insiders are more tolerant of underpricing, the fewer shares they sell at the time of
the IPO, so we expect a negative relation between initial returns and a dummy equaling one when
19
the CEO sells stock in the IPO – especially in view of the substitution effect between CEO selling
and commission rates documented in the previous section.
There is controversy over whether conditions in the stock market impact initial returns.
Loughran and Ritter (2002a) find that initial returns increase in prior market returns in the U.S.,
suggesting that underwriters fail to fully incorporate public information in the offer price, while
Lowry and Schwert (2002) find no significant effect. In our model, we include the 180-day pre-
pricing index return and daily return volatility.
Conditions in the IPO market are likely to impact initial returns, so we include the pre-pricing
average level of underpricing, the number of deals completed in the previous 180 days, and the
withdrawal rate. Lowry and Schwert (2002) show that initial returns exhibit relatively high
persistence leading to extended periods of high underpricing. Benveniste and Spindt (1989) argue
that investment banks can reduce underpricing by “bundling” deals (see Sherman’s (2000)
Proposition 2 for an elaboration of this point). A higher deal flow affords the banks the opportunity
to cut off informed investors from future lucrative deals as punishment for misrepresenting their
private information during bookbuilding. Higher deal flow should therefore lead to a lower
marginal cost of acquiring information, i.e. less money being left on the table in the form of
underpricing. Busaba, Benveniste, and Guo (2001) argue that underpricing is lower when the threat
to withdraw an offering is greater, as this threat reduces informed investors’ expected profit from
understating their private information.
We allow for the possibility that the reputation of the firm’s broker, as measured by the ranking
of its analysts, reduces underpricing. Carter and Manaster (1990) argue that a higher-ranked
underwriter can certify the quality of the issuing firm, leading investors to demand a smaller IPO
discount. Alternatively, a higher-ranked broker may have access to a higher quality network of
20
investors and so may be able to extract more information during bookbuilding. We initially treat the
analyst ranking variable as exogenous, though we will later instrument it using 2SLS.
We saw in the previous section that relatively more independent sponsors charge higher
commissions. We now investigate whether there is an offsetting benefit in the form of reduced
underpricing. The U.K. distinction between sponsors and brokers allows issuers to hire a bank to
advise them in their pricing negotiations with the broker, whose interests may be to leave more
money on the table to benefit buy-side investors. The more specialized or independent the sponsor,
in the sense of relying more on corporate finance work than on brokerage business, the harder a
bargain it may drive with the broker. This effect should be stronger when a relatively more
independent sponsor brokers the deal itself, as this removes a layer of agency.
Controlling for these factors, we expect excess commissions to be negatively related to initial
returns. This is the central test of efficient contracting in IPOs.
Our empirical model also includes predicted commissions, which are orthogonal to excess
commission by construction. They reflect the bundle of services issuers purchase which may, in
turn, affect underpricing. For instance, knowledge that the bank stands ready to support prices in the
after-market may lead uninformed investors to demand a lower initial return to compensate them for
the winner’s curse modeled by Rock (1996).
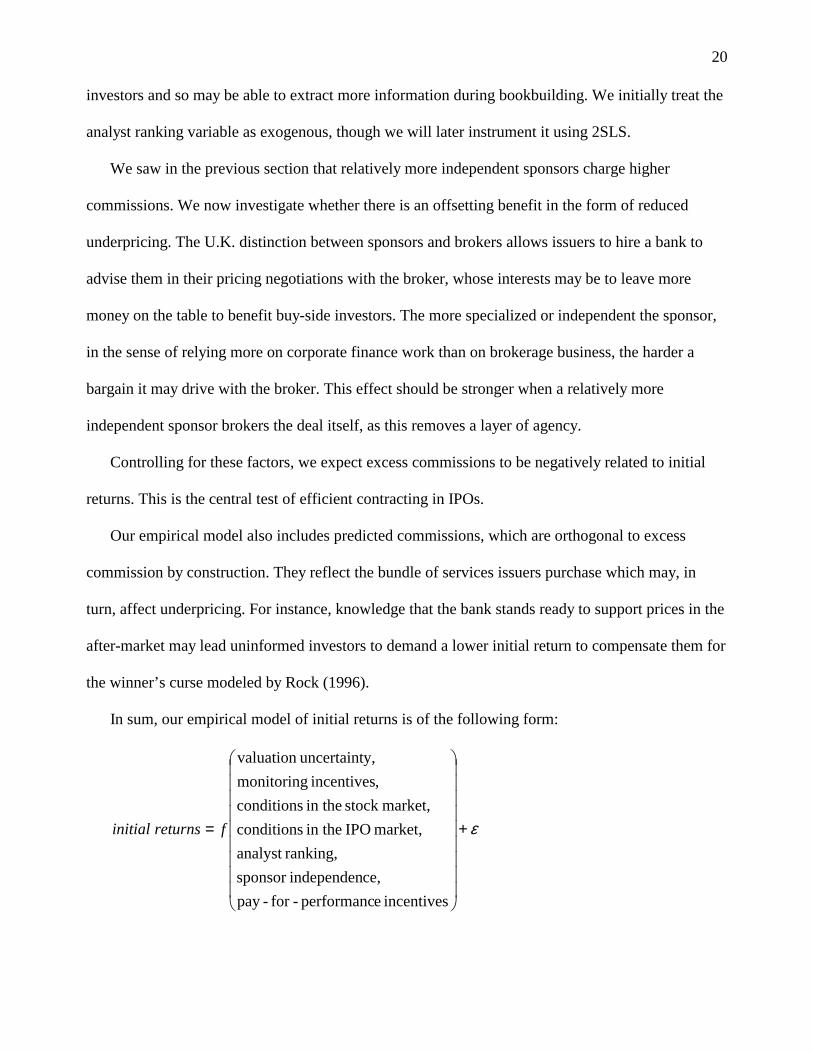
In sum, our empirical model of initial returns is of the following form:
ε+
=
incentives eperformanc-for-payce,independensponsor
ranking,analyst market, IPO in the conditions
market,stock in the conditions,incentives monitoring
y,uncertaintvaluation
freturnsinitial
21
5.2 Results
Table 6, model (7) presents the results of estimating the model outlined above using least
squares. The overall fit of the model is good, in view of the adjusted R2 of 10.9 percent. As
conjectured, firms subject to lower valuation uncertainty experience less underpricing: initial
returns decrease in log age (p < 0.001) and log debt (p = 0.002), while internet companies are
significantly more underpriced (p = 0.01). Monitoring incentives behave as predicted: initial returns
are lower, the greater the CEO’s equity stake (p = 0.169) and when the CEO sells stock in the IPO
(p = 0.013), though the former is imprecisely estimated in this specification. These results mirror
the findings of Ljungqvist and Wilhelm (2003) for the U.S. Unlike Loughran and Ritter (2002a),
we find no evidence that offer prices fail to incorporate recent market returns (or volatility).
Conditions in the IPO market, on the other hand, do influence initial returns: a one percent increase
in average underpricing in the 180 days before an issuer’s pricing day leads to a 0.24 percent
increase in the issuer’s own initial return (p = 0.049), while initial returns decrease in IPO volume
(p = 0.005), consistent with bundling. A one percent increase in the rate of IPO withdrawals reduces
initial returns by 1.2 percent (p = 0.057), consistent with the argument in Busaba, Benveniste, and
Guo (2001).
As conjectured, underpricing decreases in the reputation of the issuer’s broker (p = 0.022): a one
standard deviation increase in the broker’s analyst ranking (from a mean score of 2.3 to 6.6) reduces
initial returns by four percentage points (from 27.9 percent to 23.9 percent), holding all other
covariates at their sample means. Initial returns are also lower, the more independent the sponsor (p
= 0.033), particularly so if the sponsor brokers the deal itself (p = 0.03). A one standard deviation
increase in our sponsor independence measure (from 0.622 to 0.878) reduces initial returns by 7.4
percentage points if the sponsor doesn’t broker the IPO and by 13.9 percentage points if it does.
This is likely to more than offset the higher level of commissions independent sponsors charge.
22
Finally, predicted commissions correlate negatively with initial returns (p = 0.105), suggesting
that more expensive bundles of IPO services reduce initial returns somewhat.
Controlling for these effects, we find that excess commissions are significantly and inversely
related to initial returns (p = 0.038): a one percentage point increase in excess commissions (a little
under one standard deviation) reduces initial returns by 11.1 percentage points, from 27.9 percent to
16.8 percent. This provides strong evidence for the view that issuers can overcome agency problems
by offering banks higher commission rates, and the magnitude of the effect indicates that providing
banks with stronger pay-for-performance incentives has a large effect at the margin.
The magnitude of the effect deserves comment. Given the linear specification of model (7), the
implied cost-benefit trade-off depends inversely on the level of underpricing.18 This suggests that
the coefficient estimated for excess commissions is more reasonable for companies in the tail of the
distribution, rather than the average firm. In Section 5.3.3, we will estimate a log specification
which removes the scale dependence.
5.3 Robustness
5.3.1 Endogeneity Considerations
Model (7) accounts for the endogeneity of commissions but not of analyst ranking or sponsor
independence. To test for the exogeneity of analyst ranking, we perform a Durbin-Wu-Hausman
(DWH) test using the model for analyst ranking reported in column (5) of Table 4 as the auxiliary
regression. The DWH test statistic is F1,928 = 5.64 with p = 0.018, so we reject the null that analyst
ranking is exogenous with respect to initial returns. To test for the exogeneity of sponsor
independence, we use as instruments a set of industry dummy variables which aggregate four-digit
SIC codes into the 48 industry groupings studied by Fama and French (1997). The industry
dummies are jointly significant at the five percent level in the auxiliary regression but not in the
23
underpricing regression, and a robust Sargan test cannot reject the validity of the instrument set (p =
0.974). The DWH test statistic is F1,917 = 1.41 with p = 0.235, so we cannot reject the null that
sponsor independence is exogenous with respect to initial returns.
To generate consistent estimates of the effect of analyst ranking, we estimate a 2SLS version of
model (7). As instruments, we use log proceeds and a dummy equal to one if the issuer is VC-
backed, both of which correlate positively with analyst ranking but not with initial returns. (This is
the same instrument set as in Ljungqvist and Wilhelm’s (2003) model of U.S. IPOs.) A robust
Sargan test of the implied overidentification restriction fails to reject the validity of these
instruments (p = 0.428).
The results are reported as model (8). Consistent with the presence of endogeneity bias in (7),
we find that the coefficient estimated for analyst ranking increases almost eightfold in absolute
magnitude, making the effect much more economically significant. Excess commissions, on the
other hand, continue to be inversely related to initial returns (p = 0.036) and the magnitude of the
coefficient is virtually identical in models (7) and (8).
5.3.2 Partial Adjustment
Models (7) and (8) do not control for the partial adjustment phenomenon identified by Hanley
(1993) and so may suffer from omitted variable bias. Hanley shows that initial returns are higher,
the more the lead manager has revised the offer price upwards relative to the midpoint of the
indicative price range filed prior to bookbuilding. This supports Benveniste and Spindt’s (1989)
prediction that underpricing will be greater for deals drawing strong interest from institutional
investors during the bookbuilding effort.
24
However, controlling for partial adjustment in the U.K. is complicated by the fact that it is
unusual for issuers to file indicative price ranges (although potential investors are privately given
valuation indications; see Ljungqvist and Wilhelm (2002) for further details).
We have indicative price ranges for 273 of the 1,008 sample firms. 113 are priced below the
midpoint of the range, 23 are priced at the midpoint, and 137 are priced above the midpoint. In
model (9), we include a variable that equals the price revision (offer price / midpoint – 1) when
available, and zero otherwise. This is clearly a noisy measure of price revisions. The coefficient
estimate is positive and less than one, consistent with Hanley’s finding, and marginally significant
(p = 0.062). Its inclusion does not, however, materially change the coefficients estimated for the
other regressors.
5.3.3 Omitted Variable Biases
Other than partial adjustment, our model of initial returns controls for all the main economic
determinants suggested by prior theory and empirical evidence. Omitted variable bias could still
arise to the extent that our chosen proxies for such determinants fail to adequately capture the
economic effects that need to be controlled. Perhaps the most important economic effect that needs
to be controlled is firm-level valuation uncertainty. In unreported regressions, we have
experimented with alternative proxies, such as book value of assets, asset tangibility, asset mix
(current versus fixed), and pre-IPO cash flow profiles (levels and whether the issuer was cash flow-
positive or not). None of these add anything at the margin.
5.3.4 Outliers
Initial return distributions are typically right-skewed. Regression results may, therefore, be
sensitive to the presence of positive outliers. We address this concern in three ways. First, we
estimate models (7) through (9) using an inter-quartile regression (a regression of the difference
25
between the first and third quartile) rather than least squares (not shown). We continue to find a
significant negative relation between initial returns and excess commissions (p = 0.02 or better).
Second, we estimate least-squares regressions of models (7) through (9) where the initial return
is trimmed at either the first and 99th percentile, or the fifth and 95th percentile (not shown). In either
case, we still find a negative and significant relation between initial returns and excess
commissions. In the model (8) specification, for instance, a one percentage point increase in excess
commissions reduces initial returns by seven percentage points (p = 0.002) and 1.8 percentage
points (p = 0.015), respectively.
Finally, we replace the dependent variable in models (7) through (9) with the log of one plus the
initial return. This removes the scale dependence of the implied cost-benefit trade-off between
higher commissions and reduced underpricing.19 The results are shown in column (10) of Table 6.
Our results are qualitatively unchanged, though the overall fit of the model improves. We continue
to find that paying greater excess commissions reduces underpricing (p = 0.008). Not surprisingly,
the magnitude of the effect is smaller: a one percentage point increase in excess commissions
reduces log underpricing from 0.163 to 0.135, holding all other covariates at their sample means.
Unlike the linear specifications in models (7) through (10), the log specification thus suggests a
reasonable magnitude for the cost-benefit trade-off for the average company.
5.4 Optimality
In light of our evidence that initial returns are negatively related to excess commissions in the
cross-section, did issuers choose their commission rates optimally? The answer depends on the
relation between the benefit of reducing underpricing further and the cost of paying the bank a
higher commission. The benefit of reducing underpricing, in turn, depends on the size of the offer:
the fewer shares are sold, the less the issuer’s wealth is affected by a given degree of percentage
26
underpricing (Barry (1989)). Habib and Ljungqvist (2001) formalize this argument and show that
the appropriate objective function is to minimize not underpricing but “wealth losses” (the weighted
average loss on shares sold and on shares retained, bearing in mind the diluting effect of issuing
new shares at a discount to their true value).
If issuers did minimize wealth losses by inducing the constrained optimal level of bank effort,
the partial derivative of wealth losses with respect to excess commissions should be zero. The
coefficient on excess commissions in a regression of wealth losses on the other control variables in
Table 6 is an estimate of this partial derivative. Demsetz and Lehn (1985) first proposed such an
optimality test in the context of executive ownership, and Habib and Ljungqvist (2001) apply it to
IPO issuers’ choice of promotional expenses in the U.S.
Using the model (8) specification but with wealth losses (normalized by shares outstanding) as
the dependent variable, we find that wealth losses are invariant to excess commissions (p = 0.398,
results not shown). The coefficient estimate of –0.014 indicates that a one percentage point increase
in excess commissions would reduce wealth losses per share outstanding by only a little over one
penny on average. The same result obtains if we measure excess commissions in pound sterling:
increasing the excess commission paid to the sponsor and broker by £1 on the margin would reduce
an issuer’s wealth losses by only four pennies on average (p = 0.759, results not shown). This is
consistent with issuers having chosen commission rates optimally.
6. Conclusion
Using IPO contracts from the U.K., this paper has provided evidence of efficient contracting
between issuers and banks. Specifically, we have shown that when issuers pay banks abnormally
high commissions, initial returns are substantially reduced. While this implies the existence of an
agency problem between issuers and banks as hypothesized by Baron (1982), it also implies that
27
contract design can mitigate the agency problem, at a cost. In other words, market participants show
every sign of being able to take care of the agency problem themselves.
Our results may help explain why in the U.S., seasoned issuers prefer to negotiate compensation
after selecting their banks, even though competitive bidding is associated with lower fees (Bhagat
and Frost (1986)). Minimizing fees may simply not be optimal. Our results suggest that part of the
fee difference may represent payment for (better) performance.
We have also shown that banks specializing in corporate finance advice are associated with less
underpriced IPOs compared to integrated securities houses or banks specializing in institutional
brokerage. This suggests that the integration of corporate finance and broking under the same roof,
common in the U.S. marketplace, can lead to agency conflicts that upset the delicate balancing of
issuers’ and investors’ interests.
Finally, our results contribute to the debate of underwriter compensation in the U.S. The typical
U.S. gross spread of seven percent is substantially greater than the average commission of two
percent or the total spread of 4.35 percent in our U.K. sample. There are different interpretations.
Perhaps seven percent is the optimal incentive in the U.S., given market conditions and issuer
characteristics (Yeoman (2001)). Or perhaps U.S. banks are over-paid relative to the optimum:
spreads may be so high that the marginal cost exceeds the marginal benefit of inducing greater
selling effort. Chen and Ritter (2000) suggest that lack of competition among U.S. underwriters
could be responsible for keeping spreads above competitive levels. In contrast, Hansen (2001)
argues there is little evidence of collusion or lack of competition, and that underwriters compete on
the (unobservable) quality of their services. Our results suggest such a quality-fee trade-off in the
U.K. Whether U.S. issuers would be worse off if they reduced underwriter compensation remains
an open question.

28
But what may be more remarkable than the difference in the level of underwriter compensation
is the apparent high degree of homogenization of not just spreads but underwriting contracts in
general in the U.S. compared to the U.K. Behavior in the U.K. suggests that a one-size-fits-all
contract finds little favor with issuers.
29
Endnotes 1 NASD Regulation, Inc. news release dated January 22, 2002.
2 Penny stock offerings in the U.S. sometimes grant underwriters additional compensation in the
form of warrants whose exercise price depends on the offer price. Dunbar (1995) shows that
underpricing is reduced when warrants are used, consistent with the hypothesis that issuers choose
compensation contracts that minimize the costs of going public.
3 When the sponsor and broker are different banks, they split the fee and commission in some (often
undisclosed) fashion.
4 In addition to the flat fee, the sponsor and broker are reimbursed for reasonable “out-of-pocket
expenses”, which we ignore. Note that the flat fee does not include the annual retainers that the
sponsor and broker are due to be paid after the IPO.
5 A typical underwriting clause reads: “Under the Placing Agreement dated [on the impact day] the
bank has agreed, conditionally on Admission taking place no later than [one week after impact day]
or such later date (being no later than [two weeks after impact day]) as the Company and the bank
may agree, as agent for the Company to place [number] new ordinary shares at the Placing Price
and, to the extent that by 3pm on the business day prior to the day of Admission the bank has not
procured placees for all of the remaining new ordinary shares, the bank will itself subscribe for the
remaining new ordinary shares at the Placing Price.”
6 A typical disclosure reads: “In connection with the global offer, Bank XYZ may over-allocate or
effect other transactions intended to enable it to satisfy any over-allocations or which stabilize,
maintain, or otherwise affect the market price of the shares […] at levels which might not otherwise
prevail in the open market.”
30
7 Note that such disclosure does not imply that after-market prices will, in fact, be stabilized. Actual
stabilization has to be notified to Stock Exchange member firms when it is carried out.
8 A typical disclosure reads: “This offer is not and does not constitute an offer to the public within
the meaning of Schedule 11A to the Financial Services Act 1986. The offer is only open to persons
whose ordinary activities involve them in acquiring, holding, managing or disposing of investments
(as principal or agent) for the purposes of their businesses or otherwise in circumstances which will
not result in an offer to the public in the United Kingdom within the meaning of the Public Offers of
Securities Regulations 1995 (as amended) or the Financial Services Act 1986.”
9 All market conditions variables in the paper are computed over the 180-day period leading up to
the pricing day. Our results are not materially affected using shorter windows up to 90 days or
longer windows up to 365 days.
10 Each service might also increase the flat fee, but given its lack of incentive properties the flat fee
is not the focus of this study.
11 This approach yields consistent though somewhat inefficient coefficients, since it ignores the
possibility of correlation among the disturbances of the probit models (1) through (4) in Table 4.
However, the alternative of fitting a quadri-variate probit model is computationally extremely hard
due to the highly non-linear nature of the associated log-likelihood function.
12 We do not control separately for the ten privatizations in the sample.
13 In the case of multiple sponsors or brokers working on a deal, each is credited with the
corresponding fraction of the deal.
14 We obtain qualitatively similar (albeit somewhat noisier) results if we measure independence
using the sum of IPO proceeds rather than the number of IPOs.
31
15 Altinkilic and Hansen (2000) take issue with this view in the context of underwritten seasoned
equity and bond issues, pointing out that the additional services required to sell larger issues in fact
increase underwriter compensation at the margin. Since we control for the additional services
directly, their criticism has less force in our model.
16 James (1992) includes two additional variables: the probability that the firm will make a seasoned
equity offer in the future, and the inverse offer price. We do not have data to estimate the former.
The latter is not significant in our data.
17 Altinkilic and Hansen’s (2000) argument perhaps applies more properly to total spreads than to
commissions. Applying their functional form, we find that total spreads in our dataset increase in
inverse proceeds (p<0.001) and decrease in proceeds over pre-money market capitalization
(p=0.042). Thus, unlike in Altinkilic and Hansen, we continue to find economies of scale even when
the functional form allows for diseconomies.
18 Let P0 and P1 denote the offer and first-day trading price, respectively, and let P0* denote the
offer price an issuer would have achieved had it chosen a higher pay-for-performance incentive for
its bankers. It is straightforward to show that the change in underpricing equals *0
0*
0
0
1
PPP
PP −
− , that
is, the product of the initial return (plus one) and the offer price improvement. (This ignores the
effect that paying higher commissions has on P1, as well as dilution effects (see Barry (1989)).) So,
for a company with high (low) underpricing, an eleven percentage point reduction in the initial
return implies a relatively small (large) price improvement.
19 In the log specification, the change in underpricing equals ( )0*
0ln PP− using the notation of
footnote 18.
32
References
Altinkilic, O., Hansen, R.S., 2000. Are there economies of scale in underwriting fees? Evidence of rising external financing costs. Review of Financial Studies 13, 191-218.
Baron, D.P., 1982. A model of the demand for investment banking advising and distribution services for new issues. Journal of Finance 37, 955-976.
Barry, C.B., 1989. Initial public offering underpricing: The issuer’s view – a comment. Journal of Finance 44, 1099-1103.
Benveniste, L.M., Spindt, P.A., 1989. How investment bankers determine the offer price and allocation of new issues. Journal of Financial Economics 24, 343-61.
Bhagat, S., Frost, P., 1986. Issuing costs to existing shareholders in competitive and negotiated underwritten public utility equity offers. Journal of Financial Economics 3, 113-127.
Biais, B., Bossaerts, P. Rochet, J.-C., 2002. An optimal IPO mechanism. Review of Economic Studies 69, 117-146.
Busaba, W., Benveniste, L.M., Guo, R.-J., 2001. The withdrawal of initial public offerings during the premarket. Journal of Financial Economics 60, 73-102.
Carter, R.B., Manaster, S., 1990. Initial public offerings and underwriter reputation. Journal of Finance 45, 1045-1067.
Chen, H.-C., Ritter, J.R., 2000. The seven percent solution. Journal of Finance 55, 1105-1131.
Davidson, R., MacKinnon, J.G., 1993. Estimation and Inference in Econometrics. Oxford University Press.
Demsetz, H., Lehn, K., 1985. The structure of corporate ownership: causes and consequences. Journal of Political Economy 93, 1155-1177.
Dunbar, C.G., 1995. The use of warrants as underwriter compensation in initial public offerings. Journal of Financial Economics 38, 59-78.
Dunbar, C.G., 2000. Factors affecting investment bank initial public offering market share. Journal of Financial Economics 55, 3-41.
Fama, E.F., French, K.R., 1997. Industry costs of equity. Journal of Financial Economics 43, 153-194.
Habib, M.A., Ljungqvist, A.P., 2001. Underpricing and entrepreneurial wealth losses: theory and evidence. Review of Financial Studies 14, 433-458.
Hanley, K., 1993. The underpricing of initial public offerings and the partial adjustment phenomenon. Journal of Financial Economics 34, 231-50.
33
Hansen, R.S., 2001. Do investment banks compete in IPOs? The advent of the ‘7% plus contract’. Journal of Financial Economics 59, 313-346.
Heckman, J., 1979. Sample selection bias as a specification Error. Econometrica 47, 153-161.
James, C., 1992, Relationship-specific assets and the pricing of underwriter services. Journal of Finance 47, 1865-1885.
James, C., Wier, P., 1990. Borrowing relationships, intermediation and the cost of issuing public securities. Journal of Financial Economics 28, 149-171.
Ljungqvist, A.P., Jenkinson, T.J., Wilhelm, W.J., 2003. Global integration in primary equity markets: the role of U.S. banks and U.S. investors. Review of Financial Studies 16, forthcoming (Spring).
Ljungqvist, A.P., Wilhelm, W.J., 2002. IPO allocations: discriminatory or discretionary? Journal of Financial Economics 65, 167-201.
Ljungqvist, A.P., Wilhelm, W.J., 2003. IPO pricing in the dot-com bubble. Journal of Finance 58, forthcoming (April).
Loughran, T., Ritter, J.R., 2002a. Why don’t issuers get upset about leaving money on the table in IPOs? Review of Financial Studies 15, 413-443.
Loughran, T., Ritter, J.R., 2002b. Why has IPO underpricing changed over time? Unpublished working paper, University of Florida.
Lowry, M., Schwert, G.W., 2002. IPO market cycles: bubbles or sequential learning? Journal of Finance 57, 1171-1200.
Ritter, J., 1987. The costs of going public. Journal of Financial Economics 19, 269-281.
Ritter, J., Welch, I., 2002. A review of IPO activity, pricing, and allocations. Journal of Finance 57, 1795-1828.
Rock, K. 1986. Why new issues are underpriced. Journal of Financial Economics 15, 187-212.
Sherman, A., 2000. IPOs and long-term relationships: an advantage of book building. Review of Financial Studies 13, 697-714.
Welch, I., 1991. An empirical examination of models of contract choice in initial public offerings. Journal of Financial and Quantitative Analysis 26, 497-518.
Yeoman, J.C., 2001. The optimal spread and offering price for underwritten securities. Journal of Financial Economics 62, 169-198.
34
Table 1. Descriptive sample statistics.
The sample consists of the 1,008 (out of 1,058) IPOs on the London Stock Exchange for which IPO contracts are available. Gross proceeds equal the offer price times the number of shares sold, including shares sold under an over-allotment option where exercised. Foreign currencies are converted into pound sterling (£) using exchange rates on the pricing day. All currency amounts are expressed in December 2001 purchasing power terms, using the Retail Price Index (excluding mortgage interest) deflator. £1 was worth roughly $2 prior to summer 1992 and $1.50 thereafter. Listings on the junior market are on the Unlisted Securities Market (USM) from 1991 to 1995, or on the Alternative Investment Market (AIM) from June 1995. Age at IPO is the IPO year minus the year operations commenced, as identified in the prospectus. Internet-related companies are identified based on a reading of the business description section of each prospectus. Indebtedness includes secured and unsecured loans, bank overdrafts, leasing commitments, and loan guarantees. It is prominently disclosed in U.K. prospectuses, and reflects indebtedness at the time of the IPO rather than at the date of the last audited accounts. Sales are consolidated revenues in the most recent twelve-month accounting period before the IPO, as reported in the prospectus. The initial return is defined as the first-day closing price divided by the offer price, minus one. First-day closing prices are from Datastream, with all initial returns in excess of 30 percent cross-checked using Reuters. We lack after-market prices for 10 IPOs.
Number of IPOs Gross proceeds (£m, real) Age at IPO Indebtedness
(£m, real) Sales (£m, real) Initial return (%)
total
w/under-
writingcontract mean median
% listed on
junior market mean median
% internet-
related mean median mean median mean st.dev.
all years 1,058 1,008 53.3 9.5 49.7 20.3 8 14.0 38.5 1.8 74.4 6.8 29.3 121.1
1991 16 6 27.2 18.4 33.3 97.2 92 0.0 57.1 19.3 58.3 36.9 12.9 22.31992 26 17 115.1 38.1 17.6 30.9 15 0.0 90.0 7.3 154.4 66.1 7.1 14.01993 78 75 61.4 24.6 6.7 27.1 14 0.0 58.6 4.6 129.8 28.1 13.6 22.41994 121 117 54.9 19.4 7.7 33.6 12 0.9 56.7 6.7 68.0 25.1 7.3 10.51995 64 64 38.3 10.4 23.4 24.6 8 0.0 20.3 4.2 49.6 20.0 16.1 17.51996 166 163 56.4 7.3 56.4 21.6 9 3.1 44.7 1.8 106.0 7.1 13.4 16.01997 128 124 43.2 7.2 53.2 27.1 11 1.6 32.4 1.2 85.9 7.6 11.9 12.51998 74 73 56.4 8.1 49.3 20.7 9 2.7 19.2 3.0 103.2 9.4 18.8 34.41999 77 71 87.9 4.7 64.8 14.2 5 31.0 60.8 1.0 86.5 4.7 80.8 162.32000 228 221 40.7 8.9 71.5 5.5 3 44.8 13.5 0.7 15.7 0.4 65.4 233.02001 80 77 55.3 3.0 89.6 14.5 5 13.0 58.7 1.1 78.0 1.7 14.9 27.3
35
Table 2. U.K. IPO compensation.
Bank compensation in U.K. IPOs usually consists of a flat fee and a commission paid on each share sold. Commissions are calculated as a percent of the offer price. Both the flat fee and the commission rate are agreed before the offer is priced. The flat fee is expressed in December 2001 purchasing power terms. The total spread equals the bank’s total compensation from the flat fee and commissions, divided by the gross proceeds of the offer. We know the commission rate for 958 of the 1,008 contracts. The size of the flat fee element is disclosed in 795 contracts. £1 was worth roughly $2 prior to summer 1992 and $1.50 thereafter.
Commission (%) Flat fee (£‘000s, real) Total spread (flat fee/proceeds + commission) (%) Flat fee as percent of total bank
compensation
mean st.dev. median mean st.dev. median mean st.dev. median mean st.dev. median
all years 2.01 1.45 1.75 139.1 195.8 88.4 4.35 3.34 3.78 43.4 31.9 43.0
1991 1.41 0.88 1.37 143.7 237.0 69.6 3.43 1.98 2.97 45.8 38.8 52.4 1992 1.73 1.44 1.31 219.4 256.6 185.1 3.47 1.81 3.73 31.1 28.0 30.8 1993 1.34 0.96 1.19 174.1 161.5 144.7 2.54 1.74 2.12 37.4 28.5 39.2 1994 1.18 0.88 0.83 183.0 178.1 151.4 2.65 1.64 2.28 45.6 29.9 50.6 1995 1.49 1.25 1.00 151.1 213.3 116.0 3.73 2.16 3.78 49.2 32.9 47.8 1996 1.78 1.32 1.50 138.7 219.9 72.4 3.89 2.67 3.64 44.8 31.7 44.2 1997 1.82 1.24 1.75 117.4 183.3 55.7 3.89 2.34 3.56 44.0 33.0 44.3 1998 2.03 1.41 1.89 144.6 189.9 86.8 4.43 2.32 4.00 45.4 31.3 45.3 1999 2.45 1.36 2.58 63.8 88.5 31.4 4.95 4.02 4.00 38.9 33.3 33.9 2000 2.77 1.63 3.00 145.6 227.8 82.9 4.87 2.38 4.40 39.9 32.6 32.7 2001 2.71 1.50 3.00 118.7 137.1 100.6 7.70 6.79 5.73 52.2 30.6 51.5
36
Table 3. IPO services in the U.K.
We focus on five services that U.K. issuers can purchase from their investment bankers: underwriting, after-market price stabilization, marketing of the IPO to U.S. investors, retail participation, and analyst coverage. The first four columns show the fraction of IPOs in the sample that include the first four of these services. To measure the quality of analyst coverage, we use the IPO broker’s percent of weighted votes cast in the annual Extel Survey of Investment Analysts. This ranges from 0.18 percent (Credit Agricole Indosuez Cheuvreux in 2000) to 18.14 percent (Merrill Lynch in 1998). See text for further details. Unranked brokers are those not ranked in the Extel survey.
Fraction … Analyst ranking
under-written
flagging possibility
of price support
marketed in the U.S.
w/ retail partici-pation
Mean (% of weighted votes in
Extel Surveys)
Fraction w/ unranked
broker
Proceeds-weighted
fraction w/ unranked
broker
all years 67.0 8.5 10.3 24.1 2.25 62.7 11.1
1991 50.0 0.0 0.0 50.0 1.77 83.3 80.2 1992 88.2 11.8 11.8 58.8 5.96 47.1 39.2 1993 93.3 2.7 5.3 56.0 5.30 33.3 6.9 1994 93.2 3.4 8.5 35.0 3.69 47.0 13.7 1995 71.9 4.7 9.4 28.1 2.87 59.4 10.6 1996 65.0 4.9 6.7 15.3 1.95 63.2 7.3 1997 58.9 6.5 4.8 12.1 1.83 66.9 10.0 1998 67.1 9.6 13.7 15.1 2.37 61.6 7.5 1999 54.9 18.3 21.1 21.1 1.43 70.4 4.4 2000 58.4 14.6 15.8 21.5 1.27 69.2 17.7 2001 46.8 7.8 6.5 19.5 0.61 87.0 7.6
37
Table 4. Demand regressions.
In columns (1) through (4), we report probit regressions of issuers’ demands for the first four investment banking services presented in Table 3. In column (5), we report an OLS regression of issuers’ choice of analyst quality. Market returns are estimated using the FT-SE All Share index excluding investment trusts. The mean initial return in the 180 days before pricing is computed over all IPOs completed during that period. The IPO withdrawal rate is the number of withdrawn IPOs over the sum of withdrawn and completed IPOs in the previous 365 days. Data on the pre-IPO CEO equity stake are hand-collected from prospectuses. All other variables are as defined in Tables 1 and 3. The model of the demand for retail participation in (4) includes year dummies for 1991 through 1995 to proxy for the regulatory changes concerning mandatory participation of retail investors. To aid the economic interpretation of the results in (1) through (4), the table shows the change in the probability for an infinitesimal change in each independent, continuous variable and, by default, the discrete change in the probability for dummy variables, rather than the probit coefficients. White heteroskedasticity-consistent standard errors are shown in italics. We use ***, **, and * to denote significance at the one percent, five percent, and 10 percent level (two-sided), respectively.
38
Table 4. (Continued)
Dependent variable: Dummy = 1 if …
under-written
flagging possibility
of price support
marketed in the U.S.
retail partici-pation
analyst ranking
(1) (2) (3) (4) (5) Market conditions Market return, 180 days before pricing –0.187 0.020 –0.016 –0.315 1.789 0.221 0.019 0.042 0.220 1.736
St.dev. of daily market return, 180 days before pricing 0.518 2.496*** 3.192** 12.781 –91.479 8.848 1.300 1.684 10.388 65.648
Mean initial return, 180 days before pricing –0.046 –0.005 –0.005 –0.042 –0.475 0.045 0.004 0.007 0.047 0.306
Number of IPOs, 180 days before pricing –0.001 0.0001*** 0.000 0.001 –0.008* 0.001 0.00007 0.000 0.001 0.004
IPO withdrawal rate, year to pricing –0.551** 0.006 0.046 –0.150 –0.552 0.276 0.020 0.041 0.349 2.336 Firm and offer characteristics ln(gross proceeds in £m) 0.162*** 0.015*** 0.036*** 0.111*** 1.211*** 0.017 0.007 0.009 0.015 0.126
ln(1+age) 0.026* 0.000 –0.005** 0.021 –0.097 0.016 0.001 0.003 0.014 0.116
ln(1+sales in £m) 0.027 –0.004*** –0.004 –0.004 0.295** 0.017 0.002 0.003 0.014 0.140
ln(1+debt in £m) 0.010 0.002* 0.002 0.027** 0.282** 0.018 0.001 0.002 0.012 0.141
Dummy=1 if internet-related –0.119** –0.002 0.012 0.059 0.537* 0.057 0.003 0.014 0.055 0.292
CEO equity stake pre-IPO (in %) –0.001 0.000 0.0002* –0.001 –0.009** 0.001 0.000 0.0001 0.001 0.004
Dummy=1 if CEO sells stock in the IPO 0.079** –0.0005 –0.003 –0.132*** –0.184 0.035 0.003 0.006 0.027 0.269
Constant –0.083 0.771 Pseudo R2 / adjusted R2 27.4 % 59.2 % 54.6 % 30.1 % 37.1 % Wald test: all coeff. jointly zero (χ2/F) 263.6*** 136.4*** 182.6*** 225.4*** 34.5***
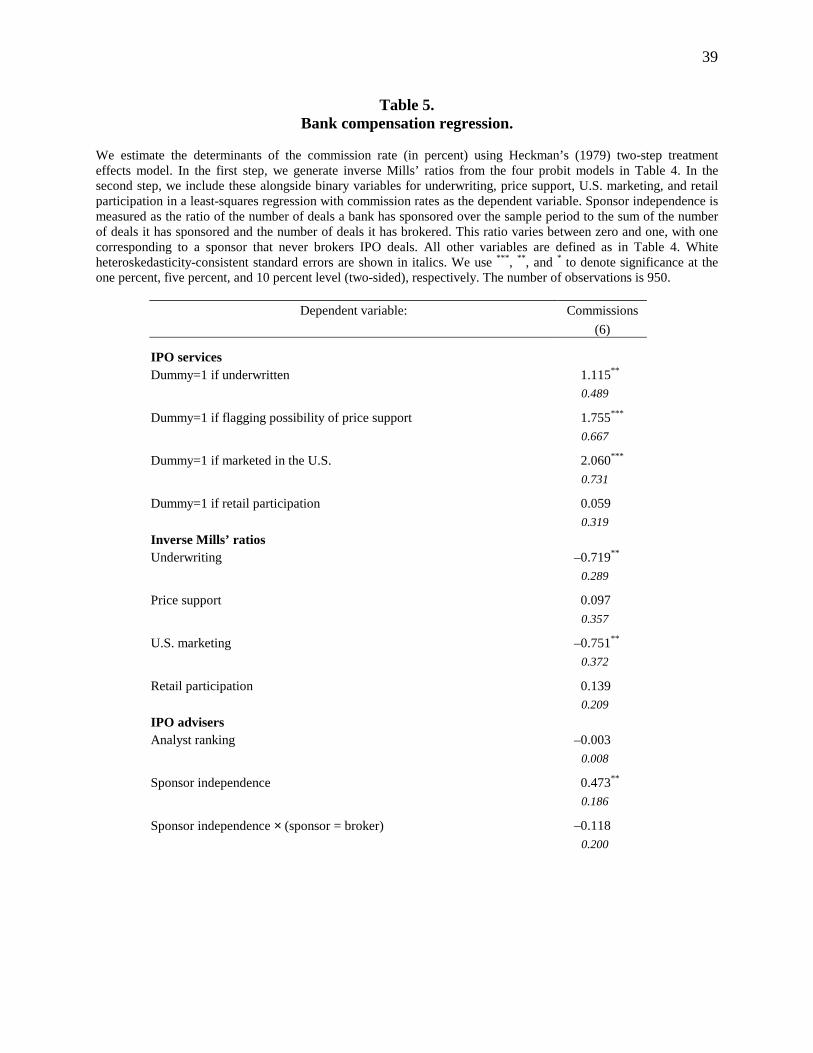
39
Table 5. Bank compensation regression.
We estimate the determinants of the commission rate (in percent) using Heckman’s (1979) two-step treatment effects model. In the first step, we generate inverse Mills’ ratios from the four probit models in Table 4. In the second step, we include these alongside binary variables for underwriting, price support, U.S. marketing, and retail participation in a least-squares regression with commission rates as the dependent variable. Sponsor independence is measured as the ratio of the number of deals a bank has sponsored over the sample period to the sum of the number of deals it has sponsored and the number of deals it has brokered. This ratio varies between zero and one, with one corresponding to a sponsor that never brokers IPO deals. All other variables are defined as in Table 4. White heteroskedasticity-consistent standard errors are shown in italics. We use ***, **, and * to denote significance at the one percent, five percent, and 10 percent level (two-sided), respectively. The number of observations is 950.
Dependent variable: Commissions (6)
IPO services Dummy=1 if underwritten 1.115** 0.489
Dummy=1 if flagging possibility of price support 1.755*** 0.667
Dummy=1 if marketed in the U.S. 2.060*** 0.731
Dummy=1 if retail participation 0.059 0.319 Inverse Mills’ ratios Underwriting –0.719** 0.289
Price support 0.097 0.357
U.S. marketing –0.751** 0.372
Retail participation 0.139 0.209 IPO advisers Analyst ranking –0.003 0.008
Sponsor independence 0.473** 0.186
Sponsor independence × (sponsor = broker) –0.118 0.200
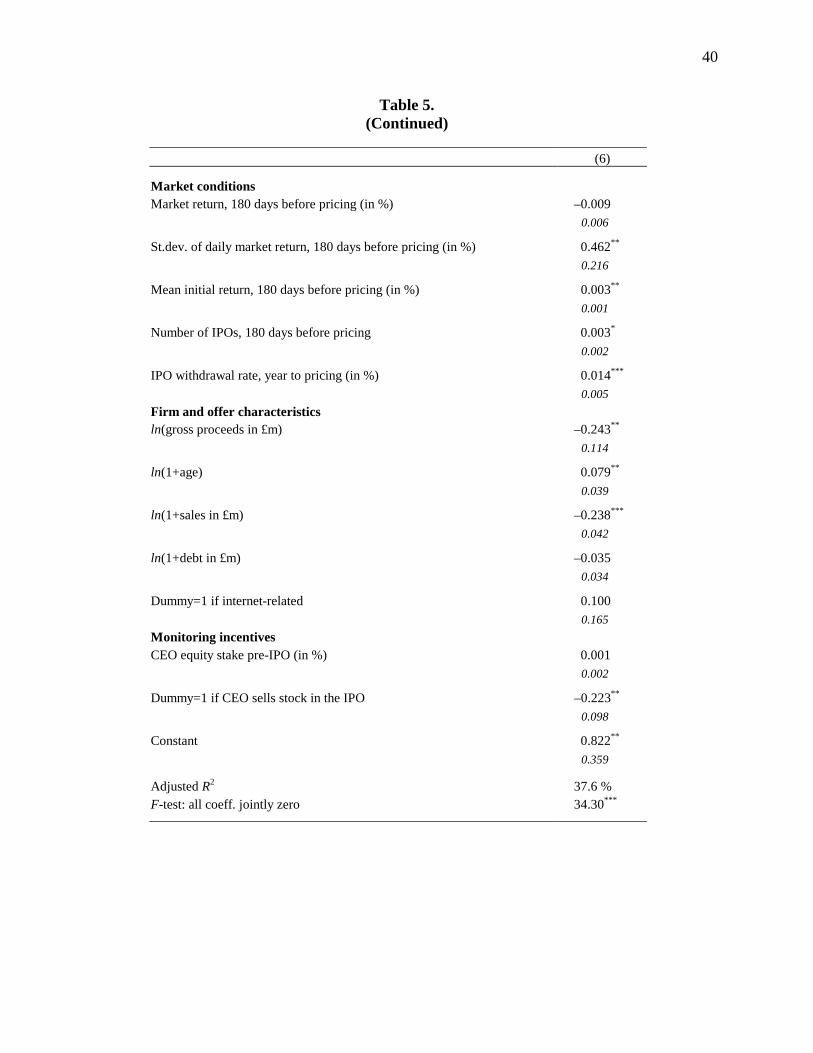
40
Table 5. (Continued)
(6)
Market conditions Market return, 180 days before pricing (in %) –0.009 0.006
St.dev. of daily market return, 180 days before pricing (in %) 0.462** 0.216
Mean initial return, 180 days before pricing (in %) 0.003** 0.001
Number of IPOs, 180 days before pricing 0.003* 0.002
IPO withdrawal rate, year to pricing (in %) 0.014*** 0.005 Firm and offer characteristics ln(gross proceeds in £m) –0.243** 0.114
ln(1+age) 0.079** 0.039
ln(1+sales in £m) –0.238*** 0.042
ln(1+debt in £m) –0.035 0.034
Dummy=1 if internet-related 0.100 0.165 Monitoring incentives CEO equity stake pre-IPO (in %) 0.001 0.002
Dummy=1 if CEO sells stock in the IPO –0.223** 0.098
Constant 0.822** 0.359
Adjusted R2 37.6 % F-test: all coeff. jointly zero 34.30***

41
Table 6. Initial return regressions.
We estimate the effect of “excess commissions” on initial returns (in percent) using least squares. Excess commissions are computed as the residuals from the commission regression shown in Table 5. Excess commissions will be positive (negative) when issuers pay more (less) than their bundle of services, market conditions, and characteristics require on average. Thus, higher effort incentives correspond to paying a commission rate in excess of that predicted by model (6) in Table 5. We expect excess commissions to have a negative effect on initial returns. In model (9), we include a variable that equals the price revision (offer price / midpoint – 1) when data on the (midpoint of the) initial price range are available, and zero otherwise. Models (8) and (9) allow for analyst ranking being endogenous using log proceeds and a dummy equaling one for VC-backed companies as instruments. Model (10) re-estimates (9) but with log initial returns as the dependent variable. The Sargan statistic is a test of the validity of our instruments, allowing for arbitrary heteroskedasticity. White heteroskedasticity-consistent standard errors are shown in italics. We use ***, **, and * to denote significance at the one percent, five percent, and 10 percent level (two-sided), respectively.
Dependent variable: Initial return (in %) Log initial return
(7) (8) (9) (10) Firm characteristics ln(1+age) –8.472*** –8.048*** –7.931*** –0.027*** 2.160 2.197 2.194 0.008
ln(1+debt in £m) –3.162*** 3.902 4.125 –0.002 1.017 3.012 3.027 0.009
Dummy=1 if internet-related 59.308*** 64.531*** 64.805*** 0.162*** 22.833 24.242 24.251 0.054 Monitoring incentives
CEO equity stake pre-IPO (in %) –0.165 –0.298** –0.288** –0.001** 0.120 0.146 0.146 0.0004
Dummy=1 if CEO sells stock in the IPO –12.490** –7.951* –8.553* –0.021 5.013 4.426 4.460 0.015 Market conditions
Market return, 180 days before pricing (in %) –0.034 0.214 0.184 0.002 0.258 0.270 0.272 0.001
St.dev. of daily market return 180 days before pricing (in %) 7.099 –5.081 –3.832 0.008 12.269 13.055 13.108 0.049
Mean initial return, 180 days before pricing (in %) 0.237** 0.204* 0.200* 0.0008** 0.120 0.120 0.120 0.0004
Number of IPOs, 180 days before pricing –0.621*** –0.719*** –0.716*** –0.0020*** 0.219 0.250 0.249 0.0005
IPO withdrawal rate, year to pricing (in %) –1.181* –1.378** –1.393** –0.0030** 0.619 0.689 0.691 0.0015
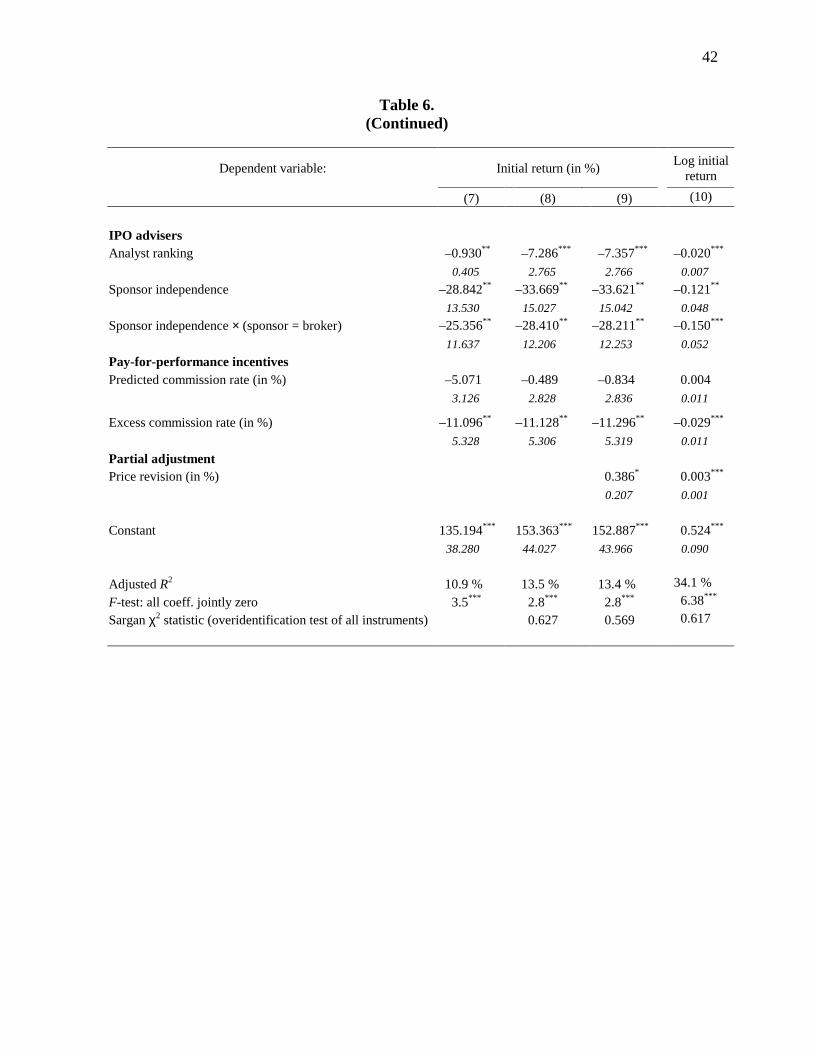
42
Table 6. (Continued)
Dependent variable: Initial return (in %) Log initial return
(7) (8) (9) (10) IPO advisers
Analyst ranking –0.930** –7.286*** –7.357*** –0.020*** 0.405 2.765 2.766 0.007 Sponsor independence –28.842** –33.669** –33.621** –0.121** 13.530 15.027 15.042 0.048 Sponsor independence × (sponsor = broker) –25.356** –28.410** –28.211** –0.150*** 11.637 12.206 12.253 0.052 Pay-for-performance incentives
Predicted commission rate (in %) –5.071 –0.489 –0.834 0.004 3.126 2.828 2.836 0.011
Excess commission rate (in %) –11.096** –11.128** –11.296** –0.029*** 5.328 5.306 5.319 0.011 Partial adjustment
Price revision (in %) 0.386* 0.003*** 0.207 0.001
Constant 135.194*** 153.363*** 152.887*** 0.524*** 38.280 44.027 43.966 0.090 Adjusted R2 10.9 % 13.5 % 13.4 % 34.1 % F-test: all coeff. jointly zero 3.5*** 2.8*** 2.8*** 6.38*** Sargan χ2 statistic (overidentification test of all instruments) 0.627 0.569 0.617