aleksander fabijan developing the right features
TRANSCRIPT
ALEKSANDER FABIJANDEVELOPING THE RIGHT FEATURES: THE ROLE AND IMPACT OF CUSTOMER AND PRODUCT DATA IN SOFTWARE PRODUCT DEVELOPMENT
MA
LM
Ö U
NIV
ER
SIT
Y, S
TU
DIE
S IN
CO
MP
UT
ER
SC
IEN
CE
NO
3, L
ICE
NT
IAT
E T
HE
SIS
AL
EK
SA
ND
ER
FA
BIJA
N
MA
LM
Ö U
NIV
ER
SIT
Y 2
01
6D
EV
ELO
PIN
G T
HE
RIG
HT
FE
AT
UR
ES
: TH
E R
OL
E A
ND
IMP
AC
T O
F C
US
TO
ME
R A
ND
PR
OD
UC
T D
ATA
IN S
OF
TW
AR
E P
RO
DU
CT
DE
VE
LOP
ME
NT
L I C E N T I A T E T H E S I S


D E V E L O P I N G T H E R I G H T F E A T U R E S : T H E R O L E A N D I M P A C T O F C U S T O M E R A N D P R O D U C T
D A T A I N S O F T W A R E P R O D U C T D E V E L O P M E N T

Malmö UniversityStudies In Computer Science No 3, Licentiate Thesis
© Aleksander Fabijan
ISBN 978-91-7104-736-6 (print)
ISBN 978-91-7104-737-3 (pdf)
Holmbergs, Malmö 2016

ALEKSANDER FABIJAN DEVELOPING THE RIGHT FEATURES: THE ROLE AND IMPACT OF CUSTOMER AND PRODUCT DATA IN SOFTWARE PRODUCT DEVELOPMENT
Department of Computer ScienceFaculty of Technology and Society
Malmö University, 2016

Electronically available at: https://dspace.mah.se/handle/2043/21268

Dedicated to my wife Bianca.


ABSTRACT
Software product development companies are increasingly striving to become data-driven. The access to customer feedback and prod-uct data has been, with products increasingly becoming connected to the Internet, demonetized. Systematically collecting the feedback and efficiently using it in product development, however, are chal-lenges that large-scale software development companies face today when being faced by large amounts of available data.
In this thesis, we explore the collection, use and impact of cus-tomer feedback on software product development. We base our work on a 2-year longitudinal multiple-case study research with case companies in the software-intensive domain, and complement it with a systematic review of the literature. In our work, we iden-tify and confirm that large-software companies today collect vast amounts of feedback data, however, struggle to effectively use it. And due to this situation, there is a risk of prioritizing the devel-opment of features that may not deliver value to customers.
Our contribution to this problem is threefold. First, we present a comprehensive and systematic review of activities and techniques used to collect customer feedback and product data in software product development. Next, we show that the impact of customer feedback evolves over time, but due to the lack of sharing of the collected data, companies do not fully benefit from this feedback. Finally, we provide an improvement framework for practitioners and researchers to use the collected feedback data in order to dif-ferentiate between different feature types and to model feature val-ue during the lifecycle. With our contributions, we aim to bring soft-
7

ware companies one step closer to data-driven decision making in software product development. Keywords. Customer feedback, data-driven development, feature val-ue, feature differentiation
8

ACKNOWLEDGMENT
First, I would like to thank my main supervisor Helena Holmström Olsson. Her insights and tips on conducting interviews, how to an-alyze the data, and her continuous availability significantly con-tributed to my research. She provided all the necessary guidance throughout this research.
Second, I would like to thank Jan Bosch. Although he contribut-ed to my research in a number of different ways, I would like to emphasize two in particular. First, his engineering mind-set. As be-ing one myself, I really enjoyed working with him. Second, he pro-vided continuous critics to my research work, however, never without ideas on what to do to improve it.
I would like to thank everyone at Malmö University that has been involved in the process of this research, especially (1) Bengt J. Nilsson and Ulrik Eklund that are all members of my evaluation group, and (2) my examiner Paul Davidsson. In addition to them, I wish to express my gratitude to Annabella Loconsole, who was re-sponsible to plan my teaching activities and made this process smooth, Romina Spalazzese, whom I also learned a lot from during our common lunches and breaks, and finally Enrico Johansson and Antonio Martini, who provided input to parts of my research and made the research work and experience exciting not only in the of-fice.
Last but not least, a great thank to Software Center companies with which I had a chance to work closer with during this research. Without them, this research would not be possible. The practition-ers in the companies were always supportive and helpful. Their in-put steered and continues to drive my research.
9


LIST OF PUBLICATIONS
Included papers
[A] Fabijan, A., Olsson, H.H., Bosch, J.: Early Value Argumen-tation and Prediction: An Iterative Approach to Quantify-ing Feature Value. Shorter version of this paper appeared in: Proceedings of the 16th International Conference on Product-Focused Software Process Improvement. pp. 16–23. Springer, Bolzano, Italy. (2015).
[B] Fabijan, A., Olsson, H.H., Bosch, J.: The Lack of Sharing of Customer Data in Large Software Organizations: Chal-lenges and Implications. In: Proceedings of the 17th Inter-national Conference on Agile Software Development XP2016. pp. 39–52. Springer, Edinburgh, Scotland. (2016).
[C] Fabijan, A., Olsson, H.H., Bosch, J.: Time to Say “Good Bye”: Feature Lifecycle. To appear in: Proceedings of the 42nd Euromicro Conference on Software Engineering and Advanced Applications, SEAA 2016. Limassol, Cyprus. (2016).
[D] Fabijan, A., Olsson, H.H., Bosch, J.: Commodity Eats In-novation for Breakfast: A Model for Differentiating Fea-ture Realization. Shorter version of this paper to appear in: Proceedings of the 17th International Conference on Prod-uct-Focused Software Process Improvement. Trondheim, Norway. (2016).
11

[E] Fabijan, A., Olsson, H.H. and Bosch, J. “Customer Feed-back and Data Collection Techniques: A Systematic Litera-ture Review on the Role and Impact of Feedback in Soft-ware Product Development”. Submitted to a journal. (2016).
Related papers but not included in the thesis
[F] Fabijan, A., Olsson, H.H., Bosch, J.: Customer Feedback and Data Collection Techniques in Software R&D: A Lit-erature Review. In: Proceedings of the Software Business, ICSOB 2015. pp. 139–153., Braga, Portugal (2015).
[G] A Fabijan, A., Olsson, H.H., Bosch, J.: Data-driven deci-sion-making in product R&D. In: Lect. Notes Bus. Inf. Process. vol. 212, pp. 350–351, XP 2015, Helsinki, Fin-land (2015).
Personal contribution For all publications above, the first author was the main contribu-tor with regard to inception, planning, execution and writing of the research.
12
TABLE OF CONTENT
ABSTRACT ......................................................................... 7
ACKNOWLEDGMENT.......................................................... 9
LIST OF PUBLICATIONS ..................................................... 11 Included papers ......................................................................... 11 Related papers but not included in the thesis ................................ 12
INTRODUCTION ............................................................... 17
BACKGROUND ................................................................ 21 The Role of Feedback in Product R&D .......................................... 21 Collection and Use of Customer Feedback .................................... 23 Feature Differentiation and Lifecycle ............................................ 24
RESEARCH DESIGN AND METHODOLOGY .......................... 27 Case Study Research .................................................................. 27 Software Center Collaboration .................................................... 28
Case Companies ................................................................... 29 Software Center Sprints ......................................................... 30
Design and Methodology of our Research .................................... 31 Research Design and Activities ............................................... 31 Data Collection ..................................................................... 34 Data Analysis ....................................................................... 38 Threats to Validity ................................................................. 39
PAPER OVERVIEW ............................................................ 41 Paper [A]: Early Value Argumentation and Prediction: an Iterative Approach to Quantifying Feature Value .......................... 43 Paper [B]: The Lack of Sharing of Customer Data in Large Software Organizations: Challenges and Implications................... 45

Paper [C]: Time to Say 'Good Bye': Feature Lifecycle .................... 47 Paper [D]: Commodity Eats Innovation for Breakfast: A Model for Differentiating Feature Realization .......................................... 49 Paper [E]: Customer Feedback and Data Collection Techniques: A Systematic Literature Review on the Role and Impact of Feedback in Software Product Development ................... 51
DISCUSSION .................................................................... 53 Contributions to the research questions ........................................ 54
RQ1: How can customer feedback and product data be collected and used in software-intensive companies? ............... 54 RQ2: How does customer feedback impact R&D activities in software-intensive companies and how does this impact evolve over time? .................................................................. 61 RQ3: How can software-intensive companies use customer feedback to steer feature development? ................................... 64
Future work ............................................................................... 69
CONCLUSION .................................................................. 71
BIBLIOGRAPHY .................................................................. 73
APPENDIX ........................................................................ 79
PAPER [A]......................................................................... 81 Fabijan, A., Olsson, H.H. and Bosch, J. ‘‘Early Value Argumentation and Prediction: An Iterative Approach to Quantifying Feature Value’’. ....................................................... 81
PAPER [B] ....................................................................... 111 Fabijan, A., Olsson, H.H. and Bosch, J. ‘‘The Lack of Sharing of Customer Data in Large Software Organizations: Challenges and Implications’’. ................................................... 111
PAPER [C] ....................................................................... 135 Fabijan, A., Olsson, H.H. and Bosch, J. ‘‘Time to Say 'Good Bye': Feature Lifecycle’’. ............................................................ 135
PAPER [D] ....................................................................... 163 Fabijan, A., Olsson, H.H. and Bosch, J. ‘‘Commodity Eats Innovation for Breakfast: A Model for Differentiating Feature Realisation’’. ............................................................................ 163

PAPER [E] ...................................................................... 193 Fabijan, A., Olsson, H.H. and Bosch, J. ‘‘Customer Feedback and Data Collection Techniques: A Systematic Literature Review on the Role and Impact of Feedback in Software Product Development’’. ............................................................. 193
APPENDIX A – LITERATURE SELECTION .......................... 237


17
INTRODUCTION
“A customer is the most important visitor on our premises, he is not dependent on us. We are dependent on him. He is not an in-terruption in our work. He is the purpose of it. He is not an outsider in our business. He is part of it. We are not doing him a favour by serving him. He is doing us a favour by giving us an opportunity to do so”
~ Mahatma Gandhi
Learning from and about customers is the essential unit of progress for companies employing agile development practices [1]. Whether developing a new product or improving an existing feature, only by learning what the customer needs are and validating how their so-lution addresses them in every iteration, it is clear if progress was made and value created. In this context, efficiently collecting and learning from customer feedback is the main challenge for software companies to be on par with their competitors where competing, and to innovate where they aim to excel [2].
Software development companies and their product development teams have been reaching out to customers since the era of tradi-tional waterfall development [3], [4]. The collection of customer feedback has always been important for R&D teams in order to better understand what customers want. Interviews, surveys, ob-servations and focus groups are only a few techniques that have regularly been used to involve with the customers and collect feed-back on software products. Today, in the era of agile software de-velopment and ‘Big Data’, and with products increasingly getting connected to the Internet, the qualitative techniques above are be-
17

18
ing complemented with quantitative and automated data collection [5], [2], [6], [7].
Not only that the quantitative collection can be cheaper and faster, the actual product usage data has the potential to make the prioritization process in product development more accurate [7][8]. The reason for that is the continuous collection of user activity throughout the product lifecycle, which focuses on what customers do rather than what they say [7], [9], [10].
Today however, more data is available than ever before to learn about customer habits, needs and preferences [11]–[13]. From the user perspective, products such as connected car are now becoming platforms where new types of content (e.g. relevant news, travel tips, status of home appliances) are being consumed. In addition, the communication channels are bi-directional. This means that new forms of expression, opinions and preferences can be captured and communicated as feedback to the product development organ-ization. In-product surveys, feature usage, and marketing of other products suddenly became new communication practices that are available for the users of once isolated products [2]. The users of these products are not only the consumers, but by contributing and providing feedback also co-creators of better products and valuable content [14], [15], [16].
How to benefit from these increasing amounts of data and syn-thesize it to learn from customers, products and other sources of feedback, is one of the main challenges that software industry ex-periences today [11],[17], [18].
The amount of software in products is rapidly increasing. At first, software functionality was required in order to support tangi-ble hardware without delivering any other perceptible value for the customers. Organizations accepted developing the software as a necessary cost without exploring the value of software features as such [19]. Today, however, once isolated systems and hardware-only components such as connected cars and radio systems contain logic that enables them to communicate over the Internet, ex-
18

19
change information and self-improve over time. Software features suddenly became the main competitive advantage of the product, and at the same time, the detail that delivers value to the customers [20], [21].
Using the feedback to predict and validate which features in the products actually deliver the value to the customers and how to quantify it is, however, challenging [8]. New features cost to de-velop, operate, can be expensive to support, and always increase the overall product complexity [22], [23]. Surprisingly, and despite knowing this, companies celebrate when a new feature is complet-ed and ready to be deployed to customers, even though the opening of the champagne should be kept aside until it is clear what value the new feature delivers. Transition to become value-driven within the organization comes with pain points for both the technology and organization [24].
Companies are adopting techniques to validate the value of the features during development, shortly after and while they are being deployed [10], [25], [26]. The remainder of the feature lifetime is, however, considered to be forgotten. Very little is known on how to track feature value over its lifetime. When is it optimal to actual-ly introduce the feature in the product and, more importantly, what to do when a feature no longer adds value to the product?
To summarize, there are two main challenges that prevent soft-ware companies from closing the ‘open loop’ between them and their customers: First, companies struggle to efficiently collect cus-tomer feedback and benefit from increasing amounts of data. Se-cond, companies fail to differentiate between features and model how the value of features in changes over time. Based on the challenges, we aim to answer the following three re-search questions:
19

20
RQ1: How can customer feedback and product data be collected and used in software-intensive companies?
RQ2: How does customer feedback impact R&D activities in software-intensive companies and how does this im-pact evolve over time?
RQ3: How can software-intensive companies use customer feedback to steer feature development?
This thesis provides a threefold contribution that is applicable to
companies employing large-scale software development practices: • We present a comprehensive and systematic review of ac-
tivities and techniques used to collect customer feedback and product data in software product development.
• We show that the impact of customer feedback evolves over time, but due to the lack of sharing of the collected data, companies do not fully benefit from this feedback.
• We provide an improvement framework for practitioners and researchers to use the collected feedback data in order to differentiate between different feature types and to mod-el feature value during the lifecycle. With this framework, we give software companies guidelines on how to prioritize development activities based on the type of the feature be-ing developed and the realized feature value.
The thesis is structured as follows. In the next chapter, we out-
line our theoretical background and all the components necessary to discuss our work. Next, we describe our research design and methodology, based on the case study and review of literature. In the Papers Overview chapter, we present the included publications. Next, we discuss our publications in relation to the research ques-tions above. The thesis ends with the conclusions drawn from this set of studies.
20

21
BACKGROUND
In this section, we present the role of customer feedback as de-scribed in the research literature. We start by introducing the topic of customer feedback and provide a number reasons why collecting and using feedback in software product development matters. Next, we provide an overview of the different ways that companies collect and use feedback in software product development. We rec-ognize that software development companies strive towards using the feedback data in order to very early and efficiently prioritize product development activities, however, fail to achieve this. As companies develop many features at a time, they need to be able to differentiate them in order to know how and to which extent to develop them, and when to deploy or remove them from the prod-uct. The Role of Feedback in Product R&D Rapid delivery of value to customers is one of the core priorities of software companies [26]. With many ideas and opinions on what might be good for the business and customers, however, it is im-portant to prioritize those that inherently deliver value, and discard those that do not. In order to achieve this and develop only the fea-tures and products that customers appreciate, software develop-ment companies and their product development teams collect cus-
21

22
tomer feedback. Customer feedback steers software product devel-opment in a number of different ways.
In product management literature [27], [28], [2], customer feed-back is considered as a source of knowledge for many scenarios. First, it is used as input to steer development activities of ongoing and existing products [2]. Next, the collection of customer feed-back provides companies with a competitive advantage during the innovation process [29]. This was recognized already by Von Hippel [27] in 1986. He discovered that certain groups of users, namely ‘lead users’ experiment with the products and services, and that they should be considered as a source of feedback used for in-novating new features or products, a concept that is used today in various product and service companies.
In Requirements Engineering [4] research, the term feedback re-fers to the comments and evaluations that users express upon hav-ing experienced the use of a software application or service. With this information, companies learn how their customers use the products, what features they appreciate, and what functionality they would like to see in new products [30].
In Web 2.0 domain, customer feedback has extensively been col-lected and used to experiment with the customers throughout the development process. By running continuous controlled experi-ments [6], [31], [32], [18], companies use customer feedback in or-der to confirm their hypothesis on the actual value of their devel-opment efforts. This enables them to incrementally improve their products and innovate over time.
In summary, customer feedback has a large impact on steering product development throughout the development pipeline. In the next section, we provide an overview of the different ways to col-lect customer feedback.
22

23
Collection and Use of Customer Feedback In the previous section, we provided a brief overview the different ways that customer feedback impacts product development. In this section, we illustrate the different ways that customer feedback can be collected and used. On a high level, customer feedback collection techniques span from qualitative techniques capturing customer experiences and behaviors [1], [2], towards quantitative techniques capturing prod-uct performance and operation [5], [2].
Qualitative customer feedback collection techniques typically re-quire active participation from customers and generate a small amount of qualitative feedback. The strength of such techniques is their ability to provide rich textual descriptions, opinions, and in-formation of how individuals experience a given situation [33]. As such, they provide in-depth information about the ‘human’ side of a situation and they reveal peoples’ perceptions of a given phenom-enon [33]. Examples of qualitative techniques are e.g. interviews [1], [2], user studies [34], [35], experience querying [36], [37], usa-bility studying [38], filming and observations [1], [2] etc.
Quantitative customer observations, on the other hand, focus on instrumentation and data from products in the field. Examples of quantitative techniques of customer feedback collection are e.g. operational data collection [39], [7], sentiment analysis [40] and controlled experimentation [31], [32], [18].
Regardless of the type of the technique that the data is being col-lected, however, the main goal of the collection activities is to pro-vide input to product development to (1) know what to develop or improve next [41], [31], [42], [8] and (2) how to prioritize it [7], [10], [25]. And to correctly decide on both, measuring the value of features in product is of significant importance. For this purpose, experimentation with the products used by the customers is a re-search area gaining momentum. The Hypex model [10] was the first attempt to support companies in initiating, conducting and
23

24
evaluating feature experiments, focusing on shortening the feed-back loops during the development of a feature. Olsson et [10] al. suggest to deploy a minimal viable instance of the functionality under development to customers, collect relevant quantitative feedback in metrics, and compare the measurement to previously defined and expected behavior. The Hypex model builds on the ‘Build-Measure-Learn’ methodology presented by Eric Ries [42] which was recognized and advocated as a scientific approach for creating, managing, and deploying a desired product to customers in the Lean Methodology. To complement the primary quantitative Hypex model, the QCD model [25] was developed as a response to the needs to integrate qualitative customer feedback in the experi-mentation process. It helps companies to move away from early specification of requirements and towards continuous validation of hypotheses by combining different types of feedback data and lev-ering the strength of synthesis and triangulation. Fagerholm et. al [43], [26], similarly, provided a process for continuous experimen-tation with software-intensive products that consists of building blocks, following the lean Start-up methodology [44].
In the next section, we describe the use of customer feedback to differentiate feature types and measure their value over time.
Feature Differentiation and Lifecycle Conducting experiments as described above typically aims to iden-tify which features deliver value to customers [25], [32]. Using feedback to define the value of a feature or a product from the cus-tomer point of view is an increasingly studied concept in the litera-ture [45], [46], [47]. Porter’s [46] value chain framework, for ex-ample, analyzes value creation at the companies level that identifies the activities of the firm and then studies the economic implications of those activities. Hemilä et al. [47] divide the benefits of a prod-uct or a feature among four types, i.e. functional, economic, emo-tional and symbolic value.
24

25
However, and as a consequence of another step in the development pipeline, experimentation has the potential to delay feature de-ployments and take time and resources away from the feature de-velopment. For this purpose, and to shorten development cycles, companies seek to identify ways of differentiating between features that should be extensively developed and experimented with, and features where being on-par with the competitors will be sufficient [22]. To recognize the importance of distinguishing between differ-ent types of functionality from a complexity point of view, Bosch [22] developed the ‘Three Layer Product Model’. The model pro-vides a high-level understanding of the three different layers of fea-tures, i.e. commodity, differentiating and innovative, however, does not give guidance on how to distinguish between the different types, neither which activities to invest into for each of them. Pre-vious research shows that the number of requests and ideas that originate from customer feedback often outnumbers available en-gineering resources [48]. Having a clear plan of which features to develop to what extent is thus essential for successful product de-velopment.
And as new software features are being developed and intro-duced to the product, existing products and features age and be-come over time less and less amenable to necessary adaptation and change [49], [50], [22]. As companies have been successful in re-moving developing constraints [51] and advancing towards contin-uous integration[52] and continuous deployment [53], [3], they deploy more features to their products as ever before. And with more features, the products often results in higher maintenance cost and overall product complexity [22], [23]. Due to this reason, introducing new features to customers using the product should be done systematically when they deliver value, not when they are de-veloped. And when operational costs exceed the return on invest-ment, features should be removed from the product before the re-moval costs more than the operation. Very little is known in the
25
26
literature on how to model feature value, how it changes over time and how to use novel approaches to feature development such as e.g. continuous experimentation to influence it.
To summarize, customer feedback has the potential to steer product management in differentiating and developing features that will deliver value to their customers. However, without a framework that practitioners can use to know which features to develop to what extent, when to introduce them to- and which ones to remove from products and when, companies risk to waste development resources. In the remainder of this thesis, and based on the longitudinal multiple-case study that we present in the next section, we confirm that this situation is indeed an issue and that companies do not fully benefit from the feedback data that they collect.
26

27
RESEARCH DESIGN AND METHODOLOGY
In this section, we describe our research strategy. In principal, we conducted a longitudinal multiple-case study research with case companies. We start by first introducing the case study research methodology and explain how it relates to our research challenges. Next, we introduce the Software Center, an industry-academia col-laboration that enabled us to conduct this research and the case companies we worked with. Finally, we detail how we applied the described methodology in our research. Case Study Research Case study research is a strategy used to investigate individual, group, organizational or social phenomena [54]. It is typically used to explain ‘how’ and ‘why’ type of questions that require an exten-sive and in-depth understanding of the phenomenon being studied [54], [55]. As a result, case studies can provide descriptions, test theories, or generate them. The case study strategy focuses on the dynamics within the setting and can involve either single or multi-ple cases, [55], [56]. Selection of cases is an important aspect of building theory from case studies. It is typical for case studies to perform multiple techniques of data collection such as conducting
27

28
interviews, writing field notes, conducting observations and focus groups, etc. [54], [56]. Both qualitative (e.g. interview statements) and quantitative (e.g. frequency of counts of some variable) types of data can be collected while conducting a case study. To under-stand and detail every case being studied, a case study typically in-volves within-case studies, which are central for insight generation and help researchers to cope with the often large quantities of data [56]. And by capturing the collection and analyses process over a period of time, a case study can be developed into a longitudinal case study [57]. Software Center Collaboration As briefly mentioned above, selecting the right cases for a case study is of significant importance. Motivated by our research ques-tions that address challenges related to large-scale software devel-opment companies, we conducted our research as part of a collab-oration with Software Center. Software Center is a collaboration between companies and universities in the Nordic region in Europe that consists of a wide range of projects. At the moment of writing this thesis, there are five universities and ten companies collaborat-ing in Software Center on multiple projects at the same time. The universities are the following; Chalmers University, Gothenburg University, Malmö University, Linköping University and Mälardalen University. The companies, on the other hand, are the following: Axis Communication, Ericsson, Grundfos, Jeppesen, Saab, Siemens, Tetra Pak, Verisure, Volvo Cars and Volvo Trucks. As the name Software Center depicts, companies in this collabora-tion develop products and services consisting solely of, or support-ed with, software. Each of the companies employs several thou-sands of practitioners.
Below, we describe the case companies involved in our research and the sprints methodology of working with them.
28

29
Case Companies Our longitudinal multiple-case study has been conducted as part of an ongoing work with one of the Software Center projects. In this project, we worked with five case companies that are involved in large-scale development of software products. Although we met with other companies that are part of the collaboration as well (and are in-volved in the same project), we studied in detail five of them. This is due to the availability of practitioners and the resources available. Four of the companies are based in Sweden, however, they conduct work in multiple sites around the world. The fifth company is based in Denmark. We briefly describe the case companies next.
• Company A is a provider of telecommunication systems and equipment, communications networks and multimedia solu-tions for mobile and fixed network operators. It is a multina-tional company with headquarters in Sweden. The company employs over hundred thousand employees worldwide and owns several thousands of patents. Throughout the longitu-dinal study, we met with representatives from three different sites. The first two sites are in two cities in Sweden. The third site is in China.
• Company B is a software company specializing in naviga-tional information, operations management and optimiza-tion solutions. Their focus is in providing software solutions with accurate and timely navigational information. The company’s headquarters are in the US and they have offices in more than fifty countries. Throughout the longitudinal study, we met with practitioners that primary work in Swe-den.
• Company C is a manufacturer and supplier of transport so-lutions, construction technology and vehicles for commercial use. They specialize in producing transport solutions that op-timize their customers’ needs in many different domains. The
29

30
company’s headquarters are in Sweden, however, their prod-ucts are sold and used in most of the countries worldwide.
• Company D is a world leading company in network video and offers products such as network cameras, video encod-ers, video management software and camera applications for professional IP video surveillance.
• Company E is a manufacturer and supplier of pump systems. They produce circulator pumps for heating and air condi-tioning, as well as centrifugal pumps for transporting liquids. The company’s headquarters are in Denmark. They employ about twenty thousand employees and for the purpose of this research, we met with representatives of the company from their headquarters office.
Software Center Sprints Researchers from partner universities collaborate with company practitioners on an ongoing basis. The work is organized in two six-months sprints per a calendar year. During a typical sprint, company practitioners and university researchers with similar in-terests meet on a regular basis to identify current research chal-lenges, advance on-going research, coordinate work, or to present and validate the findings. As research projects normally do not have immediate impact, maintaining organization interest is essen-tial with both presenting on-going work as well as communicating results [58].
A typical sprint starts with a joint “kick-off” workshop session where case company practitioners and researchers meet to agree on a research focus of the sprint. Multiple companies present their challenges related to the project domain and an agreement on a common and most important topic is selected for the focus of the sprint. At the same time, activities for the rest of the sprint are planned. The focus of the sprint is then further discussed on indi-vidual workshops with each of the case companies that wish to participate in the sprint. Researchers in the sprint typically follow-
30
31
up the workshop with a number of individual interviews with the participants. Aggregated data is analysed by the researchers and findings are validated with each of the case companies in a validat-ing session. This session is typically near the end of the sprint and is in a form of a reporting workshop with all of the case compa-nies. In addition to the research activities above, Software Center days are organized at least once per year where all of the compa-nies and universities meet and discuss recent research and industry challenges. Design and Methodology of our Research As mentioned above, we decided to conduct a longitudinal multiple case study. As this type of research design involves a repeated ob-servation of the phenomena studied over a period of time in multi-ple cases [55], sprints in Software Center were a good fit. We de-scribe the research activities and the data collection and analysis in the remainder of this section. Research Design and Activities We conducted our study in four sprints. In the first sprint, we in-vestigated the potential of customer feedback to steer data-driven decisions early in product development. In the next sprint, we in-vestigated how companies collect and use customer feedback in conducting data-driven decisions throughout a product and feature lifecycle. In the third sprint, we investigated how customer feed-back enables companies to differentiate product features and prior-itize product management decisions to maximize feature value over time. Finally, and in the sprint that started in August 2016 and will last until December 2016, we focus on modelling the value of the product and using continuous experimentation as a driver for business innovation.
We describe each of the sprints in detail next.
31

32
Sprint 1: The first sprint started in January 2015 and lasted until July 2015. In this sprint, we first conducted a literature review that focused on the feedback data collection practices as identified in the software engineering research. For details see reference to Paper [F]. In parallel, we followed the Software Center sprint activities as outlined in the previous section. The initial cross-company work-shop session took place in January 2015 in Göteborg, Sweden. Par-ticipants from five case companies involved in the project of data-driven development were present at this session. The joined work-shop served as a platform to introduce our previous research and other experience with data-driven development practices. The par-ticipants and researchers agreed to focus the sprint on feature ex-perimentation. All of the five companies agreed that they already collect data from their products and their customers in order to better understand and debug their products. What they were strug-gling with is to use the same data in product development to priori-tize feature development (e.g. identify how the value of a feature changes when a change in the system is deployed). We followed the development of the work in three of the case companies by (1) par-ticipating in company-specific workshops at each of the three com-panies and conducting individual interviews with company repre-sentatives (2 with practitioners from company A, 2 with practi-tioners from company B, and 2 interviews with participants from company C). We presented our results and validated our findings with the case companies at the end of the sprint, where all five case companies provided input on the findings. At the same time, each of the case companies presented their learnings and sprint results to other companies and researchers. In addition to the research activi-ties above, we organized two Software Center days (one at Com-pany A and one at Malmö University) with all of the case compa-nies participating. Sprint 2: The second sprint started in August 2015 and lasted until January 2016. We started with a cross-company workshop meeting
32

33
with the researcher and company representatives from the five case companies to decide on the sprint activities. The practitioners and researchers agreed to focus the sprint on identifying the different techniques used to collect customer feedback and product data. We conducted company-specific workshops with three of the case companies. During the individual workshop sessions, we conduct-ed a post-it exercise where the practitioners were asked to write down the different techniques that they use to collect feedback on the products that they develop. Each of the workshops was fol-lowed-up by individual interviews with practitioners at each of the three case companies that were chosen for a deeper study. In prin-cipal, this was an embedded multiple-case study with three case companies. We compared and synthesized the ways that our case companies collect and more importantly, use customer feedback to impact product development activities. On average, the interviews lasted 60 minutes. In total, we conducted twenty-two interviews with 13 open-ended questions. In addition to the research activities above, we organized a Software Center day at Company C with all of the case companies participating. We concluded the second sprint by presenting our results in a cross-company workshop at the end of the sprint, which also served as a validation session. Sprint 3: In the third sprint that was taking place between January 2016 and July 2016, we performed another level of analysis on the data that was collected in the first two sprints. As our questions were initially open-ended and covered several aspects of our inter-est, we could analyze how companies use the feedback data to dis-tinguish types of features and how they model their value over time. We triangulated this data with three company-specific work-shops at each of the case companies and by conducting a systemat-ic literature review that is appended to this thesis as Paper [A]. The findings were validated throughout the sprint and in a cross-company workshop at the end of the sprint.
33

34
Sprint 4: The ongoing sprint four started in August 2016. So far, we have initiated contact with the case companies and agreed on the focus of the sprint. We scheduled company-specific workshops with three of our case companies and informed the practitioners about planned follow-up interviews. The sprint will last until De-cember 2016 and during this sprint, we focus on extending the concept of modelling feature value throughout the development process towards modelling product value and using continuous ex-perimentation to drive product innovation. Data Collection During our longitudinal study, we carried a number of activities to collect data. First, we conducted a number of joint and individual workshops with each of the case companies. Second, we conducted open-ended interviews with individual practitioners from these companies. All workshops and interviews were conducted in Eng-lish. We describe the format of each of the data-collection activities next.
• Cross-Company workshops: Joint workshops were conduct-ed with practitioners from all of the case companies. During the joint workshops we asked open-ended questions and took field notes by writing our observations and what re-spondents answered. As mentioned above, in the beginning of the sprint the joint workshop served to establish a com-mon agreement between the companies and researchers on the focus of the sprint. The results were presented and find-ings validated in the joined workshop at the end of the sprint.
• Company-specific workshops: Individual workshops served as an activity where more company specific questions could be asked. We held the individual workshops with three of the case companies involved in this research due to resource limitations. At the individual workshops, we conducted fo-cus groups sessions, where topics of interest were discussed.
34

35
At each of the workshops, we took field notes that captured not only what the participants said, but also the way the said it (e.g. the emotional responses behind their statements).
• Interviews: We interviewed in-depth the practitioners that participated in the joined and individual workshops. The in-teractive nature of the interviews was helpful to capture and develop interesting and unexpected themes brought-up by the interviewee. The interview format started with an intro-duction and a short explanation of the research being con-ducted. Participants were then asked on their experience with the research focus. We also asked for examples on suc-cesses, pitfalls, and pain points that they experience with the focus topic of a sprint.
35

36
Collected Data: During sprint 1, we collected 32 pages of qualita-tive data that consisted of field notes and interview transcriptions. During the second sprint, we collected 13 pages of workshop notes, 176 post-it notes, 138 pages of interview transcriptions, and 9 graphical illustrations from the interviewees. During the third sprint, we collected 8 pages of qualitative text. In the ongoing sprint, the data collection activities only started and what we col-lected so far are 2 pages of e-mail communications. We visualize the high-level data collection activities and interac-tions with our practitioners in Timeline 1 below.
Timeline 1. Data collection activities visualized.
36

37
Below, we present the detailed roles of practitioners from the three case companies A, B and C, with whom we conducted several in-depth studies throughout this longitudinal research. We summarize their involvement in our research throughout the three completed sprints by marking how and where they contributed with “x” in Timeline 2.
Timeline 2.Interactions with practitioners.
37
39
Below, we present the detailed roles of practitioners from the three case companies A, B and C, with whom we conducted sev-eral in-depth studies throughout this longitudinal research. We summarize their involvement in our research throughout the three completed sprints by marking how and where they con-tributed with “x” in Timeline 2.
Tim
elin
e 2.
Inte
ract
ions
with
pra
ctiti
oner
s.

38
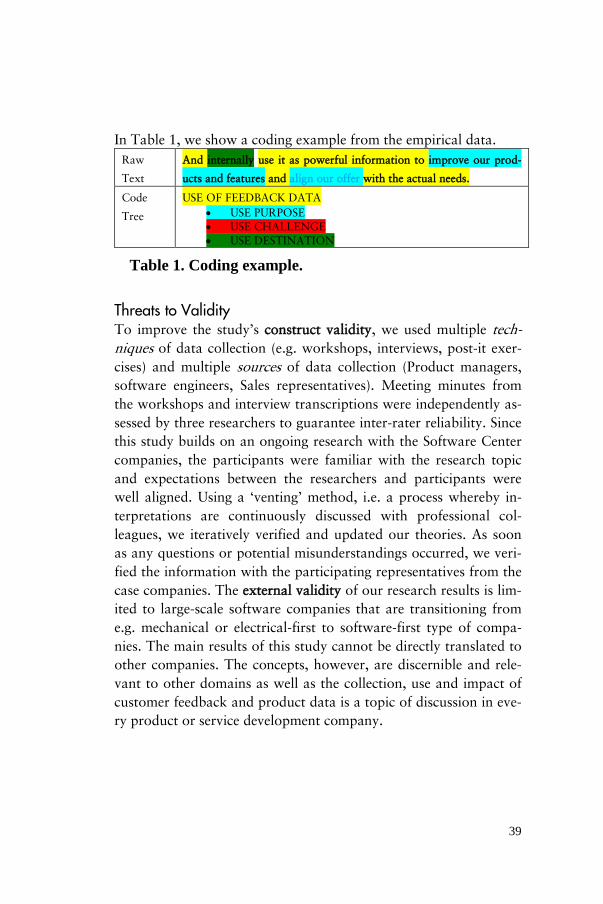
Data Analysis During analysis, the workshop notes, interview transcriptions and graphical illustrations were used when coding the data. The data collected were analyzed following the conventional qualitative con-tent analysis approach [59], where we derived the codes directly from the text. We describe the method in detail below. Analysis method. We read raw data word by word in order to de-rive codes. In this process, we first highlighted individual phrases that captured our attention in the transcriptions. We used color coding to highlight different topics that emerged during the analy-sis process. In this process, we reflected on the highlighted text sev-eral times and took notes. As this process continued for a few itera-tions (e.g. by analyzing the first few interviews), codes emerged from the highlights. In the next step, we sorted these codes into categories (e.g. grouping them by color). This type of design is ap-propriate when striving to describe a phenomenon where existing theory or research literature is limited. After we emerged with a few codes, we created definitions for those codes and continued to code the rest of the data using the definitions. We deducted subcat-egories from a code category in the later iterations. As we show on the example in Table 2, The high-level category “Use of feedback data” was further deducted into subcategories (“use purpose”, “use challenge”, and “use destination”). The advantage of this ap-proach was that we gained information from study participants without imposing preconceived categories. And since the amount of data was manageable, we did not use advanced coding tools during this study. We first independently and then jointly analyzed the collected data by following the approach above and derived the codes that were consolidated with an independent researcher that also participated in joint data-collection activities.
38
39
In Table 1, we show a coding example from the empirical data. Raw
Text
And internally use it as powerful information to improve our prod-
ucts and features and align our offer with the actual needs.
Code
Tree
USE OF FEEDBACK DATA • USE PURPOSE • USE CHALLENGE • USE DESTINATION
Table 1. Coding example.
Threats to Validity To improve the study’s construct validity, we used multiple tech-niques of data collection (e.g. workshops, interviews, post-it exer-cises) and multiple sources of data collection (Product managers, software engineers, Sales representatives). Meeting minutes from the workshops and interview transcriptions were independently as-sessed by three researchers to guarantee inter-rater reliability. Since this study builds on an ongoing research with the Software Center companies, the participants were familiar with the research topic and expectations between the researchers and participants were well aligned. Using a ‘venting’ method, i.e. a process whereby in-terpretations are continuously discussed with professional col-leagues, we iteratively verified and updated our theories. As soon as any questions or potential misunderstandings occurred, we veri-fied the information with the participating representatives from the case companies. The external validity of our research results is lim-ited to large-scale software companies that are transitioning from e.g. mechanical or electrical-first to software-first type of compa-nies. The main results of this study cannot be directly translated to other companies. The concepts, however, are discernible and rele-vant to other domains as well as the collection, use and impact of customer feedback and product data is a topic of discussion in eve-ry product or service development company.
39

40
40

41
PAPER OVERVIEW
In this section, we summarize our papers and present the main re-sults from each of them. Figure 1 shows the relations below the five included papers (4 published to international scientific confer-ences, 1 in submitted to a journal) and 2 excluded papers (1 pub-lished at an international conference, 1 published at a doctoral symposium).
41

42
.
Figure 1.Re-lations be-tweenpa-pers.
42
44
.
Figu
re 1
. Rel
atio
ns b
etw
een
pape
rs.

43
Paper [A]: Early Value Argumentation and Prediction: an Iterative Approach to Quantifying Feature Value Problem. In Paper [A], we investigated how to use feedback data that our case companies already collect to identify the value of a feature that is under development early in the development cycle. Specifically, the paper is addressing a situation where a minimal viable version of a feature has been developed and product devel-opment requires advice to either invest further in the development of the feature, or pivot the investments to other features.
Findings. Our findings indicate that predicting value for features under development is possible with the data that is already being collected by our case companies. Furthermore, we demonstrate with four feature experiments in Paper [A] that product manage-ment in large organizations can correctly re-prioritize R&D in-vestments to allocate resources to projects that will capture it. Contribution. We developed an actionable technique that practi-tioners in organizations can use to validate feature value early in the development cycle.
43

44
44

45
Paper [B]: The Lack of Sharing of Customer Data in Large Software Organizations: Challenges and Implications Problem. In this paper, we investigated in detail on how large software companies collect and use customer feedback and product data. We were interested which techniques do practitioners in dif-ferent stages of the product development (e.g. in the pre-development, development and post-deployment) use to collect feedback from their customers and products. Findings. Based on the case study research in three large software-intensive companies, we provide empirical evidence that lack of sharing of customer feedback and product data is the primary rea-son for insufficient use of customer data. Contribution. Based on the empirical data that we collected, we developed a model in which we identify what feedback data is col-lected by what role, how it is used within the development stage, and how it is shared across the development stages. In particular, we depict the critical hand-over points where the data gets ‘lost’ and collection activities are repeated.
45

46
46

47
Paper [C]: Time to Say 'Good Bye': Feature Lifecycle Problem. In Paper [C], we propose and study the concept of a software feature lifecycle, i.e., how does feature value change over time. Findings. We identified that as a consequence of poor sharing of customer feedback across the organization, teams at different stag-es of the development cycle interpret feature value in their own and known way. In practice, this causes collisions on what to optimize a feature for, how much, and whether it delivers value. Contribution. This paper is addressing the problem by providing a ‘Feature Lifecycle Model’. The main contribution of is a single-metric model (see its visualization on Figure 4) that can be used to identify when to add a feature to a product (A), which activities to prioritize during the growth period (C), and how to act when fea-ture value starts to decline(D) and become negative (E) by remov-ing it from the product before it’s operation costs becomes greater than its removal.
47

48
48

49
Paper [D]: Commodity Eats Innovation for Breakfast: A Model for Differentiating Feature Realization Problem. In Paper [C], we developed a model that can be used to measure and validate feature value over time. During that study, however, we got an indication that value for all features cannot be expressed in the same way and that different activities need to be prioritized for different types of features. Findings. What we identify and confirm in Paper [D] is that com-panies typically do not differentiate between feature types (e.g. which are the innovative features that should be developed exten-sively and which not). Consequently, the development activities are prioritized evenly and every feature that the companies develop is extensively developed and optimized. Contribution. In response to this issue, we develop a model that helps companies to differentiate between different types of features and correctly prioritize activities for each of the types.
49

50
50

51
Paper [E]: Customer Feedback and Data Collection Tech-niques: A Systematic Literature Review on the Role and Im-pact of Feedback in Software Product Development Problem. In our empirical research, we identified that the collection and use of customer feedback is unsystematic. Although practition-ers collect feedback data or know others that perform these activi-ties, there is a lack of a common model that would illustrate all the data-collection activities in a certain stage of a product develop-ment and data that originates from them. Findings. In this paper, we provide a comprehensive overview of the sources of feedback data, the different activities and techniques documented in the research literature to collect these data, and the impact of it on product R&D Contribution. We provide a systematic identification of activities and categorization of feedback collection activities and sources of feedback data. In addition, we categorize them in a 2-2 model (see Figure 6) and recognize their impact on software product develop-ment.
51

52
52

53
DISCUSSION
Today, more data is available than ever before to learn about cus-tomer habits, needs and preferences [11]–[13]. Companies collect data using qualitative techniques capturing customer experiences and behaviors [1], [2], [34], [36], [37] [38] and quantitative tech-niques capturing product performance and operation [5], [2], [39], [7], [40] [31], [32], [18]. Although most of the data typically serves as evidence to develops and debug products [39], we show in Paper [A] that using feedback data early in the development stage enables companies to correctly prioritize development activities and cap-ture value. However, and although the data exists in their data-bases, companies are not able to efficiently learn from these data and close the ‘open loop’ between them and their customers [8]. We identify in our research that lack of sharing of feedback data within the organization is the primary reason for this situation. Due to this, companies do not fully benefit from the learnings that they collect (see Paper [B]). In response to this situation, a number of models for experimenting with products and their features [10], [25], [26] building on top of the ‘Lean Startup’ practices [44], [42] has been developed. And although these models can be used to as-sess the value of a feature ad-hoc in a given point in time, they do not provide mechanisms to follow-up on how it changes through time and what activities to do to have an effect on it. As a conse-quence, companies do not know when to introduce a feature, to
53

54
what extent it should be developed, or when to remove it from a product. We address this issues separately by providing a ‘Feature Lifecycle Model’ (see Paper [C]) and ‘Feature Differentiation Mod-el’ (see Paper [D), and synthesize them below in what we name “The Feature Differentiation and Value Modelling Framework”.
The framework leverages the systematic collection of customer feedback (for details on the techniques and sources of feedback see our systematic literature review in Paper [E]). ‘Feature Lifecycle Model’ enables companies to identify critical points in a feature lifecycle (e.g. when to introduce a feature to a product, how to pro-ject the value of the feature over time, and when to remove it from the product). ‘Feature Differentiation Model’, on the other hand, enables practitioners to differentiate between feature types to be able to optimally prioritize the development activities (e.g. which features are differentiating or innovative and should be extensively developed, and which not).
Below, we discuss our contributions to each of the research ques-tions in detail. Contributions to the research questions RQ1: How can customer feedback and product data be col-lected and used in software-intensive companies? We addressed this research question in two streams in parallel. First, we conducted a systematic literature review of customer feedback and data collection techniques. We analyzed 71 papers on this subject and identified 15 high level feedback collection activi-ties, each with a number of techniques to collected feedback from 5 different sources of data. The sources of feedback that we recog-nized are: customers, users, regulators, product instrumentation and internal organization. We present them in detail in Table 2.
54

55
Source of feedback Description
Consumers / end-users Individuals that operate, interact and use the prod-
uct.
Customers People paying for the product, in B2B typically dif-
ferent from the ones that use or operate the prod-
uct.
Internal organization The learnings, documentation and other docu-
mented and undocumented knowledge within the
organization.
External organization(s) (1) Competitors and (2) standardization agencies,
policy makers, governments and auditors.
Product instrumentation Software within the product that is responsible for
generating logs, measuring in-product marketing
views and capturing results from e.g. in-product
surveys.
Media Source of product tests, customer sentiment, opin-
ions and other information from Instagram, Face-
book, etc.
Table 2. Sources of Feedback.
Next, we organize the activities in three groups following the stag-es of a product development cycle. First, we list and describe the activities and data collection techniques that are used early in the development cycle, i.e. in the pre-development stage. We recog-nized five high-level activities in this stage with a number of feed-back techniques under each of the activities. We briefly describe them in Table 3.
55

56
Activity name Techniques Description
Requirements
elicitation
Interviews, user studies,
viewpoints, scenarios, use
cases, ethnography
Elicitation, analysis, valida-
tion and management of
product requirements.
Storyboarding User stories capturing, notes
keeping, card or post-its sort-
ing exercises
Graphically organizing illus-
trations or images displayed
in sequence to simulate a
product behavior.
Experience que-
rying
Exchanging e-mails, reading
content from internal sites,
browsing customer relation-
ship databases
The different ways that dev.
organization communicates
and exchanges knowledge
about the customers and
previous products.
Usability study-
ing
Usability Interviews Monitoring how end-users
perform specific tasks, focus-
ing on identifying gaps and
situations that confuse the
end-users.
Voting Hand-held device voting,
theater voting
Quantify customer wishes
and ideas.
Table 3. Pre-development stage collection activities.
56
57
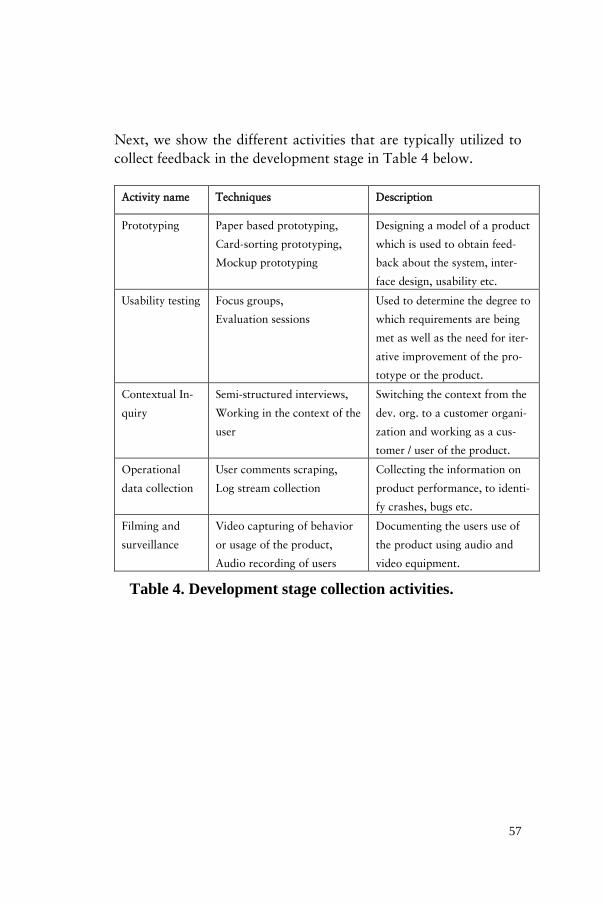
Next, we show the different activities that are typically utilized to collect feedback in the development stage in Table 4 below.
Activity name Techniques Description
Prototyping Paper based prototyping,
Card-sorting prototyping,
Mockup prototyping
Designing a model of a product
which is used to obtain feed-
back about the system, inter-
face design, usability etc.
Usability testing Focus groups,
Evaluation sessions
Used to determine the degree to
which requirements are being
met as well as the need for iter-
ative improvement of the pro-
totype or the product.
Contextual In-
quiry
Semi-structured interviews,
Working in the context of the
user
Switching the context from the
dev. org. to a customer organi-
zation and working as a cus-
tomer / user of the product.
Operational
data collection
User comments scraping,
Log stream collection
Collecting the information on
product performance, to identi-
fy crashes, bugs etc.
Filming and
surveillance
Video capturing of behavior
or usage of the product,
Audio recording of users
Documenting the users use of
the product using audio and
video equipment.
Table 4. Development stage collection activities.
57

58
Finally, we list and describe the activities that are used in the post-deployment stage in Table 5.
Activity name Techniques Description
Consumer Re-
viewing
Web-scraping of consumer
reviews
Retrieve a collection of opin-
ions regarding a product or a
feature, its quality, perfor-
mance, or missing features
wished by the consumers.
User Profiling Similarity techniques such
as k-means clustering, rec-
ommendation systems
Classifying end-users into
groups based on the actions
they perform with the product.
Observations Observing users of the de-
veloped product
Direct study of contextualized
actions by observing the prod-
uct usage.
Sentiment analy-
sis
Analyzing customer senti-
ment, extracting feedback
and aggregating opinions
exploiting user feedback to
make the use of sentiment data
easier
Controlled ex-
perimentation
Signal processing,
Metric calculation,
p-value calculation
Calculating statistical signifi-
cance between slightly different
versions of the identical feature
in order to determine the opti-
mal one.
Table 5. Post-deployment stage collection activities.
In addition to the literature review, we collected an inventory of data collection techniques used in practice, where we identified three techniques of feedback collection that were previously not recognized in the research literature. The additional techniques are: market analysis (e.g. identifying what other organizations are suc-cessful in selling), personas generation (defining a few groups of people with similar needs) and trend analysis (predicting how the needs and competitors will change over time). We list the activities that we identified empirically in Table 6 below.
58

59
Roles that collect customer feedback
Common customer feedback collection techniques
Common types of customer feedback collected
Pre-
Dev
elop
men
t
Strategy specialists, Product managers, Product owners
Reading of industry press, Reading of standards, Reading of internal reports, Reading customer visit re-views
Customer wishes, Short/Long market trends, Competitors ability of deliv-ering the product
Strategy specialists, Feature owners
Telephone interviews, Face-to-face interviews, Conducting group interviews
Existing product satisfaction, Future product specification, Personas and User Journeys
Dev
elop
men
t
UX specialists, Software Engineers
System Usability Scale Form, Asking open ended questions, Demonstrating prototypes, Filming of users' product use
Acceptance of the prototype, Eye behavior and focus time, Points of pain, Bottlenecks and constrains, Interaction design sketches
System managers, System architects, Software engineers
Consolidate feedback from other projects, Reading prototype log entries
Small improvement wishes, Configuration data, Product operational data
Post
-Dep
loym
ent
Release managers, Service managers Software engineers
Reading of customer reports, Analyzing incidents, Aggregating customer re-quests, Analyzing product log files
Number of incid. and req., Duration of incid. and req., Product operational data, Product performance data
Sales managers Reading articles in the media, Sentimental analysis Customer events participa-tion, Reading industry press, Performing trend analysis
Opinions about the appeal of the product, Performance of the product, Business case descriptions
Table 6. Feedback collection in our case companies.
59

60
And although customer feedback is being extensively collected, the use of it lacks structure. In Paper [B], we recognize that feedback data that is collected does not succeed in being shared across the company in a way that others could benefit from it. Individuals in-dependently collect increasing amounts of customer feedback, analyze the data they obtained, and store their findings on local repositories. Although these findings are occasionally presented at meetings, the lack of transparency and tools prevents others in the organization to use and benefit from the data. Instead of sharing the already collect-ed information across the organization, practitioners tend to share it within the department and the development stage that they work in. The only data that is successfully shared among people and de-velopment phases is quantitative data representing those things that can be easily measured. We illustrate this situation on Figure 2 below.
Figure 2. Feedback Sharing Model from Paper [B].
60

61
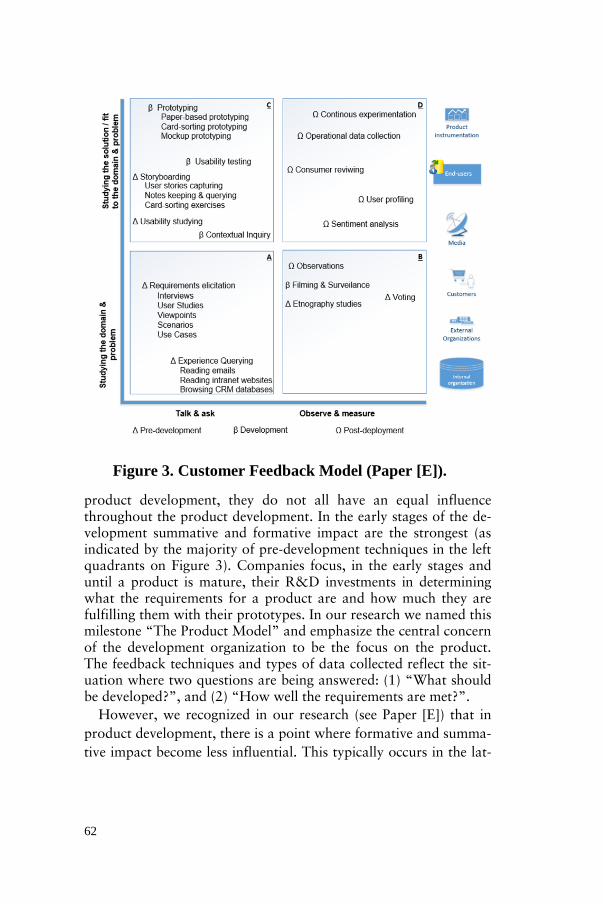
RQ2: How does customer feedback impact R&D activities in software-intensive companies and how does this impact evolve over time? In our research, we identified four distinct ways of customer im-pacts on the development activities in companies. First, we identi-fied Formative Impact (A). This is the customer feedback collected early in the development of a product and focuses on functional requirements, steering of prioritization decisions and shaping of the feature or a product before the actual development. Next, Adaptive impact (B) is the feedback that impacts products capabilities, de-sign decisions and identifying missing features. Summative impact (C) is another type of customer feedback role in product develop-ment. It is used to verify whether and to what extent the developed software meets the defined criteria (as defined by the Formative impact). Finally, we identify value impact (D). It is used to identify the value of a certain feature or product for a customer. These four types of feedback impact and distinguishing between them enable companies to prioritize collection activities based on the needs and maturity of the product. We illustrated the four impacts by plotting the different ways that customer feedback is being collected and used on a 2-2 model. We present them on Figure 3.
61
62
And although all of the four impacts are important for successful
product development, they do not all have an equal influence throughout the product development. In the early stages of the de-velopment summative and formative impact are the strongest (as indicated by the majority of pre-development techniques in the left quadrants on Figure 3). Companies focus, in the early stages and until a product is mature, their R&D investments in determining what the requirements for a product are and how much they are fulfilling them with their prototypes. In our research we named this milestone “The Product Model” and emphasize the central concern of the development organization to be the focus on the product. The feedback techniques and types of data collected reflect the sit-uation where two questions are being answered: (1) “What should be developed?”, and (2) “How well the requirements are met?”.
However, we recognized in our research (see Paper [E]) that in product development, there is a point where formative and summa-tive impact become less influential. This typically occurs in the lat-
Figure 3. Customer Feedback Model (Paper [E]).
62

63
er stages of product development. At that point, the focus of R&D activities moves from monitoring how the product meets require-ments towards monitoring how much value it generates. Instead of identifying what is missing or needs to be developed, the central focus moves towards customer value and how to use the feedback to measure this value, and increase it over time. The emphasis of feedback collection is moving to quantitative techniques and quan-titative data. Specifically, how to reflect the changes in e.g. metrics that reflect customer value. The feedback techniques and types of data collected reflect this situation by primarily focusing on an-swering two types of questions: (1) “What is customer value?”, and (2) “How to adapt the product to increase this value?”. We illustrate this evolution over time on Figure 4 below.
However, and although this evolution is bringing companies closer to identifying what is valuable for their customers, there is a risk of encountering a pitfall that we recognized in Paper [B]. As compa-nies are becoming better in identifying what brings value to cus-tomers and present this in a form of a metric, they risk to neglect the qualitative input. Focusing on quantifying the measurable caus-es practitioners to optimize the product based on what is captured by the metric. This pitfall causes that validation of customer value becomes a self-fulfilling prophecy. Although more research will be needed, we argue that adaptive feedback (which is primary of qual-
Figure 4. Evolution from Product Model to Prod. Value.
63

64
itative type) should be collected jointly with the value feedback on a periodic basis, which could enable maintenance of the measure-ments that represent customer value. RQ3: How can software-intensive companies use customer feedback to steer feature development? As illustrated above, companies collect and use customer feedback throughout product development. Software products, however, consist of features that are developed to different extents and exist in the product because of various strategic decisions. In our re-search, and to answer RQ3, we provide a conceptual framework to distinguish between different types of features and a single-metric based approach to model their value over time. We recognize that typically four different types of features are being developed in large-software companies, and provide guidelines on the types of the development activities for each of them.
We visualize our framework for feature differentiation and their value modelling on Figure 5 and describe the components of the framework in the remainder of this section.
64

67
Figu
re 5
. The
Fea
ture
Diff
eren
tiatio
n an
d V
alue
Mod
ellin
g Fr
amew
ork.
65
Fig-ure 5. The Fea-ture Differ-entiation and Value Mod-elling Framework.
65

66
The Feature Differentiation and Value Modelling Framework Our framework consists of four components. The first component is a model that enables companies to distinguish between different types of features that are being developed. Second, we list the sug-gested development activities for each of the feature types. Togeth-er, the two components form the “Activity Stream” of the frame-work. Next, and based on a single-metric approach, we provide value quantification equation that helps companies in modeling feature value. This equation is used in illustrating the typically fea-ture lifecycle over time illustrated in the bottom right quadrant of the framework. The two components together form the “Value Stream” part of the framework.
In the remainder of the section, we discuss each of the frame-works’ four components.
A - Feature Differentiation: In our research, we identified four dif-ferent types of features that are being developed by companies to-day. The companies recognize (1) “Duty” features (e.g. those re-quired by policies and regulators), (2) “Wow” features (e.g. those that the product is being sold for, however, rarely used), (3) “Checkbox” features (e.g. the features that are needed because the competitor has them in their portfolio), and (4) “Flow” features (product features regularly used). We visualize the four types of feature in the ‘Feature Differentiation Model’ on Figure 5.A. In this model, we distinguish between five characteristic points that enable the practitioners to differentiate between feature types. The charac-teristics are; the stakeholder (e.g. the requestor of the feature), fea-ture engagement (e.g. the expected level of feature usage), the source of the feedback (e.g. the stakeholder generating the most feedback), the focus of the feature (e.g. is the feature indenting to minimally satisfy a known need, or to innovate in a new area?) and its impact on driving sales (is it a feature focusing on the customer paying for the product?).
66

67
B – Activity Prioritization: Identifying which type of the feature is being developed, however, is not valuable without knowing which development activities to prioritize for each of the four types of features. We provide guidance on the development approaches on Figure 6. The activities that differ among the four types are the fol-lowing: developing extent (the extent of how much the feature should be developed), ambition driver (the main stakeholder providing the requirements to set and update the developing ex-tent), feedback sources (the input channels to query for feedback), feedback methods (the techniques to collect feedback), activities with high investment (the resource demanding activities), deploy-ment (the recommended frequency of deploying new feature ver-sions), and Infrastructure impact (the investment in infrastructure for the type of a feature).
The models on Figure 5.A and 5B enable practitioners to priori-tize the development activities based on the type of feature that they are developing. Our approach prioritizes features that should be extensively developed and provide value to the product. C - Value Quantification: To calculate the realized value of the fea-tures and know when to stop developing them, we provide the fea-ture value quantification equation. It complements the ‘Feature dif-ferentiation model’ by providing the time dimension. Our equation can be used to estimate feature value over time as a single-metric approach. We defined it as a matrix product between value factors (e.g. KPI measures such as ‘engagement’, ‘performance’, etc.), their relative weights and an interaction matrix.
67

68
D – Feature Lifecycle: The equation above can be used to calculate feature value in distinct points in time. In response to this calcula-tion, we identify five stages of a feature lifecycle and illustrate them on Figure 5.D. The stages are: Feature Infancy (e.g. the stage where formative customer impact determines what to develop, however, no value has been realized), Feature Deployment (e.g. the stage where feature is gradually deployed and verified with test custom-ers), Feature Inflation (e.g. the stage with wide customer adoption and constant continuous experimentation to increase the value of the feature), Feature Recession (e.g. the constant decrease of fea-ture value characterized by a negative derivative of the regression function), and finally Feature Removal (removing the feature be-fore its operation costs more than removal). We detail the feature lifecycle in Paper [C]. In summary, the ‘Feature Differentiation and Value Modelling Framework’ enables companies to identify what type of feature they are developing and which activities to prioritize in every stage of the feature lifecycle. In parallel, it provides a single-metric ap-proach in modelling the value of the features under development and informs product development on the optimal times for feature introduction and removal.
Figure 6. Feature value quantification.
68

69
Future work The work in this thesis is a first step forward towards providing guidance on how to gather and use evidence in order to become data-driven. So far, we provided an understanding of the different ways that customer feedback and product data are being collected and used in product development. The work has been prevalently explorative, resulting in a compelling set of techniques that are used in different types of features in order to asses’ feature value over time. However, and since our goal is to close the ‘open loop’ between the product development and customers [8], more work needs to be done in this area. In particular, we include the follow-ing options:
• Democratizing feedback data access: As identified in our empirical study with a number of companies (see e.g. Paper [B]), sharing of learnings is limited to people working with-in one stage of a product development. Between the phases, only quantitative data is shared. We aim to explore the ways in which this sharing can be improved and validate our hypothesis in future case studies. Based on our previ-ous experience, we believe that enabling the sharing of data will be a twofold problem involving a cultural and instru-mental change.
• Further validation of our work: The models that form the Feature Differentiation and Value Modelling Framework have been inductively constructed throughout the longitu-dinal multiple-case study. Although based on the case companies that represent the current state-of-practice in large-scale software development, we intend to further val-idate our development models and the framework in future sprints which will include also other case companies.
69

70
• Providing practical guidance on how to evolve from com-
panies with data to data-driven companies: During the longitudinal study, we identified that companies already collect large quantities of data, however, do not efficiently use it (Paper [B]). We believe that one of the core reasons on why the evolution from the “proof-of-concept” phase towards being data-driven “at scale” does not happen lies in the lack of understanding of how this transformation is done in practice. To provide guidance on this, we intend to study other case companies that succeeded in the data-driven transformation and report on the steps involved, the pitfalls occurred, and the learnings obtained.
70

71
CONCLUSION
The collection of customer feedback has always been important for R&D teams in order to better understand what customers want [3], [4]. Interviews, surveys, observations and focus groups are on-ly a few techniques that have regularly been used to involve with the customers and collect feedback on software products. Today, they are being complemented with quantitative and automated da-ta collection [5], [2], [6], [7]. More data is available today than ev-er before to learn about customer habits, needs and preferences [11]–[13]. Although aware of the data and the potential impact that it can have, companies struggle to efficiently collect customer feedback and benefit from these increasing amounts of data [3], [8]. Second, they fail to differentiate between features [22] and model how the value of features in products changes over time.
In this thesis, we address these challenges through three research questions. The first research question is concerning the issue of how to systematically collect customer feedback and product data in software-intensive companies. The second research question is addressing the impact that this data has on the development activi-ties in software product companies over time. Finally, the third re-search question is focusing on using the feedback to model the val-ue of software features early in the development and throughout their lifecycle.
71

72
Motivated by our research questions that address challenges re-lated to large-scale software development companies, we conduct-ed a longitudinal multi-case study over a period of two years in case companies and complemented this work with a systematic lit-erature review. In our work, we identify and confirm that large-software companies today collect vast amounts of feedback data, however, struggle to effectively use it.
Our contribution is threefold. First, we present a comprehensive review of activities and techniques used to collect customer feed-back and product data in software product development (based on Paper [E]). Next, we show that the impact of customer feedback evolves over time, however, and due to the lack of sharing of the collected data, companies do not fully benefit from this feedback. (based on Paper [E], [A], and [B]). Finally, we provide an im-provement framework for practitioners to differentiate, track and model feature value over time (based on Paper [C] and Paper [D]).
The work in this thesis is a step forward towards providing guidance on how to gather and use evidence in order to become data-driven. In our future work, we plan to further validate our contributions, address the challenges that we identified with the sharing of customer feedback in large-scale software organizations, and provide guidance that will enable software companies to evolve towards data-driven decision making at scale.
72

73
BIBLIOGRAPHY
[1] L. Williams and A. Cockburn, “Introduction: Agile Software Development: Its About Feedback and Change,” Computer, vol. 36, no. 6. p. 39, 2003.
[2] P. Bosch-Sijtsema and J. Bosch, “User Involvement throughout the Innovation Process in High-Tech Industries,” J. Prod. Innov. Manag., vol. 32, no. 5, pp. 1–36, 2014.
[3] H. H. Olsson, H. Alahyari, and J. Bosch, “Climbing the ‘Stairway to heaven’ - A mulitiple-case study exploring barriers in the transition from agile development towards continuous deployment of software,” in Proceedings - 38th EUROMICRO Conference on Software Engineering and Advanced Applications, SEAA 2012, 2012, pp. 392–399.
[4] J. Kabbedijk, S. Brinkkemper, S. Jansen, and B. Van Der Veldt, “Customer involvement in requirements management: Lessons from mass market software development,” Proc. IEEE Int. Conf. Requir. Eng., no. Section 2, pp. 281–286, 2009.
[5] H. H. Olsson and J. Bosch, “Towards Data-Driven Product Development: A Multiple Case Study on Post-deployment Data Usage in Software-Intensive Embedded Systems,” in Lean Enterprise Software and Systems - Proceedings of the 4th International Conference on Lean Enterprise Software and Systems, LESS 2013, Galway, Ireland, December 1-4, 2013, 2014, pp. 152–164.
[6] R. Kohavi, R. Longbotham, D. Sommerfield, and R. M. Henne, “Controlled experiments on the web: Survey and practical guide,” Data Min. Knowl. Discov., vol. 18, pp. 140–181, 2009.
73

74
[7] E. Johansson, D. Bergdahl, J. Bosch, and H. H. Olsson, “Requirement Prioritization with Quantitative Data - a case study,” in International Conference on Product-Focused Software Process Improvement, 2015, vol. 9459, pp. 89–104.
[8] H. H. Olsson and J. Bosch, “From opinions to data-driven software R&D: A multi-case study on how to close the ‘open loop’ problem,” in Proceedings - 40th Euromicro Conference Series on Software Engineering and Advanced Applications, SEAA 2014, 2014, pp. 9–16.
[9] J. Stark, Product Lifecycle Management. Cham: Springer International Publishing, 2015.
[10] H. H. Olsson and J. Bosch, The HYPEX model: From opinions to data-driven software development. 2014.
[11] H. Chen and V. C. Storey, “Business Intelligence and Analyrics: From Big Data to Big Impact,” vol. 36, no. 4, pp. 1165–1188, 2012.
[12] C. Bizer, P. Boncz, M. L. Brodie, and O. Erling, “The meaningful use of big data: Four perspectives - Four challenges,” SIGMOD Rec., vol. 40, no. 4, pp. 56–60, 2011.
[13] T. Harford, “Big data: A big mistake?,” Significance, vol. 11, no. 5, pp. 14–19, Dec. 2014.
[14] W. Maalej, H.-J. Happel, and A. Rashid, “When Users Become Collaborators: Towards Continuous and Context-Aware User Input,” in OOPSLA ’09 Proceedings of the 24th ACM SIGPLAN conference companion on Object oriented programming systems languages and applications, 2009, pp. 981–990.
[15] X. Y. Chen, C. H. Chen, and K. F. Leong, “A novel virtual design platform for product innovation through customer involvement,” IEEE Int. Conf. Ind. Eng. Eng. Manag., pp. 342–346, 2011.
[16] H. H. Olsson and J. Bosch, “Ecosystem-Driven Software Development: A Case Study on the Emerging Challenges in Inter-organizational R&D,” Softw. Bus. Towar. Contin. Value Deliv., vol. 182, pp. 16–26, 2014.
[17] K. Schneider, “Focusing spontaneous feedback to support system evolution,” in Proceedings of the 2011 IEEE 19th International Requirements Engineering Conference, RE 2011, 2011, pp. 165–174.
[18] M. Kim, T. Zimmermann, R. DeLine, and A. Begel, “The Emerging Role of Data Scientists on Software Development Teams,” no. MSR-TR-2015-30, pp. 0–10, 2015.
74

75
[19] B. Boehm, “Value-based software engineering: reinventing,” SIGSOFT Softw. Eng. Notes, vol. 28, no. 2, p. 3–, 2003.
[20] S. Biffl, A. Aurum, B. Boehm, H. Erdogmus, and P. Grünbacher, Value-based software engineering. 2006.
[21] M. Khurum, T. Gorschek, and M. Wilson, “The software value map - an exhaustive collection of value aspects for the development of software intensive products,” J. Softw. Evol. Process, vol. 25, no. 7, pp. 711–741, Jul. 2013.
[22] J. Bosch, “Achieving Simplicity with the Three-Layer Product Model,” Computer (Long. Beach. Calif)., vol. 46, no. 11, pp. 34–39, Nov. 2013.
[23] D. A. Norman, The Design of Everyday Things, vol. 16, no. 4. 2002.
[24] E. Lindgren and J. Münch, “Software development as an experiment system: A qualitative survey on the state of the practice,” in Lecture Notes in Business Information Processing, 2015, vol. 212, pp. 117–128.
[25] H. H. Olsson and J. Bosch, “Towards Continuous Customer Validation : A conceptual model for combining qualitative customer feedback with quantitative customer observation,” LNBIP, vol. 210, pp. 154–166, 2015.
[26] F. Fagerholm, A. S. Guinea, H. Mäenpää, and J. Münch, “The RIGHT model for Continuous Experimentation,” J. Syst. Softw., vol. 0, pp. 1–14, 2015.
[27] E. von Hippel, “Lead Users: A Source of Novel Product Concepts,” Manage. Sci., vol. 32, no. 7, pp. 791–805, 1986.
[28] E. von Hippel, “Democratizing Innovation, MIT,” Soc. Secur. Bull., vol. 71, no. 3, pp. 133–148, 2011.
[29] D. Mahr, A. Lievens, and V. Blazevic, “The value of customer cocreated knowledge during the innovation process,” J. Prod. Innov. Manag., vol. 31, no. 3, pp. 599–615, 2014.
[30] A. Fabijan, H. H. Olsson, and J. Bosch, “Customer Feedback and Data Collection Techniques in Software R&D: A Literature Review,” in Software Business, ICSOB 2015, 2015, vol. 210, pp. 139–153.
[31] H. Davenport, Thomas, “How to Design Smart Business Experiments,” Harvard Business Review, 2009.
[32] R. Kohavi and R. Longbotham, “Online Controlled Experiments and A/B Tests,” in Encyclopedia of Machine Learning and Data Mining, no. Ries 2011, 2015, pp. 1–11.
75

76
[33] N. Mack, C. Woodsong, K. M. McQueen, G. Guest, and E. Namey, Qualitative Research Methods: A data collector’s field guide. 2011.
[34] D. Bahn and J. Naumann, “Conversation about software requirements with prototypes and scenarios,” Next Gener. Inf., vol. 2382, pp. 147–157, 2002.
[35] R. B. Everhart, D. M. Fetterman, J. P. Goetz, and M. D. Le Compte, “Ethnography and Qualitative Design in Educational Research.,” Contemp. Sociol., vol. 15, no. 3, p. 450, 1986.
[36] D. Leffingwell and D. Widrig, “Managing software requirements: a unified approach,” Addison-Wesley Longman Publ. Co., Inc. Boston, MA, USA, vol. 10, no. 4, p. 491, 1999.
[37] S. Henninger, “Tool support for experience-based methodologies,” Lect. Notes Comput. Sci. (including Subser. Lect. Notes Artif. Intell. Lect. Notes Bioinformatics), vol. 2640, pp. 44–59, 2003.
[38] Thomas Tullis, William Albert, T. Tullis, and B. Albert, “Chapter 3 - Planning a Usability Study,” in Measuring the User Experience; Collecting, Analyzing, and Presenting Usability Metrics Interactive Technologies 2013, T. Tullis and B. Albert, Eds. San Francisco: Morgan Kaufmann, 2013, pp. 41–62.
[39] T. Barik, R. Deline, S. Drucker, and D. Fisher, “The Bones of the System: A Case Study of Logging and Telemetry at Microsoft,” 2016.
[40] B. Pang and L. Lee, “Opinion Mining and Sentiment Analysis,” Found. Trends® InformatioPang, B., Lee, L. (2006). Opin. Min. Sentim. Anal. Found. Trends® Inf. Retrieval, 1(2), 91–231. doi10.1561/1500000001n Retr., vol. 1, no. 1, pp. 91–231, 2006.
[41] S. Cohan, “Successful customer collaboration resulting in the right product for the end user,” Proc. - Agil. 2008 Conf., pp. 284–288, 2008.
[42] E. Ries, The Lean Startup: How Today’s Entrepreneurs Use Continuous Innovation to Create Radically Successful Businesses. 2011.
[43] F. Fagerholm, A. S. Guinea, H. Mäenpää, and J. Münch, “Building Blocks for Continuous Experimentation,” Proc. 1st Int. Work. Rapid Contin. Softw. Eng., pp. 26–35, 2014.
[44] S. Blank, “Why the Lean Start Up Changes Everything,” Harv. Bus. Rev., vol. 91, no. 5, p. 64, May 2013.
76

77
[45] A. F. Payne, K. Storbacka, and P. Frow, “Managing the co-creation of value,” J. Acad. Mark. Sci., vol. 36, no. 1, pp. 83–96, 2008.
[46] M. E. Porter, “Competitive Advantage,” Strategic Management, vol. May-June. pp. 1–580, 1985.
[47] J. Hemilä, J. Vilko, E. Kallionpää, and J. Rantala, “Value creation in product-service supply networks,” in The Proceedings of 19th International Symposium on Logistics (ISL 2014), 6.-9.7.2014., Ho Chi Minh City, Vietnam, Nottingham University Business School, 2014, pp. 168–175.
[48] T. Bebensee, I. Van De Weerd, and S. Brinkkemper, “Binary priority list for prioritizing software requirements,” in Lecture Notes in Computer Science (including subseries Lecture Notes in Artificial Intelligence and Lecture Notes in Bioinformatics), 2010, vol. 6182 LNCS, pp. 67–78.
[49] D. L. Parnas, “Software aging,” 16th Int. Conf. Softw. Eng., pp. 279–287, 1994.
[50] D. E. Perry and A. L. Wolf, “Foundations for the study of software architecture,” ACM SIGSOFT Softw. Eng. Notes, vol. 17, no. 4, pp. 40–52, 1992.
[51] E. M. Goldratt and J. Cox, The Goal: A Process of Ongoing Improvement, vol. 2nd rev. e, no. 337 p. 2004.
[52] D. Ståhl and J. Bosch, “Continuous integration flows,” in Continuous software engineering, vol. 9783319112, 2014, pp. 107–115.
[53] P. Rodríguez, A. Haghighatkhah, L. E. Lwakatare, S. Teppola, T. Suomalainen, J. Eskeli, T. Karvonen, P. Kuvaja, J. M. Verner, and M. Oivo, “Continuous Deployment of Software Intensive Products and Services: A Systematic Mapping Study,” J. Syst. Softw., 2015.
[54] R. K. Yin, Case Study Research: Design and Methods, vol. 5, no. 5. 2009.
[55] P. Runeson and M. Höst, “Guidelines for conducting and reporting case study research in software engineering,” Empir. Softw. Eng., vol. 14, no. 2, pp. 131–164, 2008.
[56] K. M. Eisenhardt, “Building Theories from Case Study Research.,” Acad. Manag. Rev., vol. 14, no. 4, pp. 532–550, 1989.
77

78
[57] L. Aaboen, A. Dubois, and F. Lind, “Capturing processes in longitudinal multiple case studies,” Ind. Mark. Manag., vol. 41, no. 2, pp. 235–246, 2012.
[58] A. B. Sandberg, “Agile Collaborative Collaboration,” IEEE Comput. Soc., vol. 28, no. 4, pp. 74–84, 2011.
[59] H.-F. Hsieh and S. E. Shannon, “Three approaches to qualitative content analysis.,” Qual. Health Res., vol. 15, no. 9, pp. 1277–88, Nov. 2005.
78

79
APPENDIX
Included publications
79

80
80
81
PAPER [A]
Fabijan, A., Olsson, H.H. and Bosch, J. “Early Value Argu-mentation and Prediction: An Iterative Approach to Quanti-fying Feature Value”.
Shorter version of this paper appeared in: Proceedings of the 16th International Conference on Product-Focused Software Process Improvement. pp. 16–23. Springer, Bolzano, Italy. (2015).
81

82
82

83
Early Value Argumentation and Prediction in
Product R&D: An Iterative Approach to Quantifying Feature Value
Aleksander Fabijan1, Helena Holmström Olsson1, Jan Bosch2
1 Malmö University, Faculty of Technology and Society, Nordenskiöldsgatan 1,
211 19 Malmö, Sweden {Aleksander.Fabijan, Helena.Holmstrom.Olsson}@mah.se
2 Chalmers University of Technology, Department of Computer Science & Engi-neering, Hörselgången 11, 412 96 Göteborg, Sweden
Abstract. Companies continuously improve their practices by e.g. developing only those features in products that deliver value to the customer. Knowing early how to validate the value of the feature under development is what the organizations are striving for today. To overcome this, we (1) develop an actionable technique that prac-titioners in organizations can use to validate feature value early in the development cycle, (2) validate if and if so to what extent the expected value is experienced by the customers, (3) know when to stop further development of the feature and (4) identity unexpected business value early during development and redirect R&D effort to capture this value. The technique has been validated in four experi-ments in three case companies. Our findings show that predicting value for features under development helps product management in large organizations to correctly re-prioritize R&D investments and allocate resources to value-capturing projects.
Keywords: continuous experimentation, EVAP, Qualita-tive/Quantitative Customer-driven Development, data-driven devel-opment
83

84
1 Introduction
By introducing agile development practices [1], companies have taken the first step in being able to better cope with continuously changing market requirements [2], [3]. However, although agile practices allow for closer collaboration with customers to better capture their needs, they typically fail in representing a large customer base where re-quirements are very different and where access to customers is scarce [4]. Therefore, and in order to increase learning about customers and how they use software products, organizations are aggressively adopting methods of collecting customer and product data throughout the product development cycle [5]. At the same time, they are striving to find systematic instructions on how to use this data in order to guide them in reprioritizing feature developments and assuring them to stop developing features when they don’t deliver value to customers. What companies aim for is a way to validate and predict feature value be-fore it is fully developed in order to better identify where to invest R&D efforts, or when to stop developing a certain feature [3], [6]. To run customer experiments, and to use data collected from these to validate feature value is a common practice in the Business-to-Consumer (B2C) domain, while it is still to gain momentum in the Business-to-Business (B2B) domain. Data collection techniques in the B2B domain are typically designed for operational purposes and do not explicitly reveal the information such as e.g. feature usage, role of the user, intention of usage, experience, etc. If we consider as an ex-ample the embedded systems domain, where until recently limited connectivity to the Internet has been possible, significant efforts had to be invested in order to collect customer feedback. Today however, embedded systems connect and communicate over the Internet. This enables customer experimentation also in B2B organizations [3], [7]. In this paper, and based on case study research in three B2B software-intensive companies, we expand on our previous research on early value prediction in feature development [4], [8]. Traditionally, feature
84

85
value has been validated in later stages of the development, e.g. after the development has been done [3], [6]. In this paper, however, we aim to help practitioners predict and validate the proposed feature value already during development. For this purpose, we detail the Early Value Argumentation and Prediction (EVAP) technique [8] and validate it three case companies. We use the QCD model [4] that en-ables integration of both qualitative and quantitative customer feed-back to steer feature prioritization decisions [4], as a foundation for this research. More specifically, we look into one aspect of it, e.g. how to validate hypotheses about feature value using customer feedback and product data. The contribution of this paper is the detailed development and valida-tion of the EVAP technique. In particular, we provide the organiza-tions with (1) an actionable implementation of one of the aspects of the QCD model that practitioners can use to validate the value of product functionality that is under development, (2) validate if and if so to what extent the expected value is experienced by customers, (3) know when to stop further development of the feature and (4) identity unexpected business value early during development and redirect R&D effort to capture this value. The paper is structured as follows. After introducing the context, we present the QCD model as an instrument that helps companies move away from early specification of requirements and towards continuous validation of hypotheses. In section 2, we propose EVAP technique as one aspect of the QCD model in section 3. Section 4 is the research method, followed by a validation of the EVAP technique in section 5. We conclude the paper with Section 6, where we discuss how the use of the technique helped the case companies overcome the problems experienced.
85

86
2 Background
Companies such as Microsoft, Google, IBM etc. continuously run ex-periments with the people that use their products [9]. Von Hippel [10], coined the term ‘Lead Users’ in order to show that customers with strong needs often appear to be ahead of the market and that companies should involve them in order to validate concepts or emerge with new ideas. Learning and validating with users of the products is becoming increasingly important and organizations need to connect with their customers and take this source of feature valida-tion into account [11], [12]. First seen in the B2C domain and recently also in B2B domain [13], products are becoming connected and by having data collection techniques in place, numerous new options for using this feedback are available. 2.1 The QCD model: Qualitative and Quantitative Customer Valida-tion Recently, and as a model to help companies move away from early specification of requirements and towards continuous validation of hypotheses, the QCD model was introduced [4]. The model identifies a number of customer feedback techniques (CFT’s) that can be used to validate feature value with customers, and it presents the validation cycles as ways in which the organization decides on whether to con-tinue development of a specific feature, whether to change direction and implement an alternative, or whether to abandon development of the feature. As can be seen in the model (Figure 1), hypotheses are de-rived from business strategies, innovation initiatives, qualitative and quantitative customer feedback and results from on-going customer validation cycles. This allows the development organization to validate concepts and ideas that are generated internally in the organization as well as by external sources and from previous validation cycles with customers. Once a hypothesis has been selected for validation, the company selects a customer feedback technique (CFT) that is then used to run the validation. The CFT can be of a qualitative nature and
86
87
as a result, capture a rich but smaller data set from a number of se-lected customers. Or, the CFT can be of a quantitative nature and cap-ture product usage from metrics instrumented in the products. The validation cycle typically involves a limited number of selected and “friendly” customers, or it can be deployed directly in existing prod-ucts in the field. The CFT data is used to decide whether to re-prioritize the hypothesis and put it back into the backlog, run another validation cycle using a different CFT, or abandon the hypothesis due to lack of customer value. The development approach as pictured in the QCD model, expands further on the ideas that have been previously published [14], [3], [15], [16], [17]. Basili et al. [14] in their Experience Factory presented the Quality Im-provement Paradigm, which is an approach for building software competencies and supplying them on-demand in an experimentation set-up. As a way to introduce the “experiment mind-set” in large organiza-tions, Olsson et al. developed the HYPEX model [3] in which they outline the process of initiating, running and evaluating a feature ex-periment focusing solely on the quantitative product data. Similarly, Fagerholm et al. [15] present an approach that help companies collect continuous feedback from customers while developing product func-tionality. Also, the goals of feature experiments can be further linked to organizational strategies using, for example, GQM+ concepts [17]. In the QCD model, quantitative as well as qualitative feedback tech-niques are recognized. This allows for a wide range of data sources to inform the development. Typically, and to initiate and experiment, a hypothesis is selected and validated on a set of customers. To support this process, numerous customer feedback collection techniques have been identified in the literature [5], [18]. Either qualitative or quantita-tive, the QCD model allows these techniques to be used in parallel, feeding the outputs back to the experimenter who cyclically builds an understanding of the phenomena under investigation. In addition to
87

88
the validation and confirmation of existing hypotheses, the data col-lected allows new hypothesis to be formed, making the QCD model an instrument for value discovery and for prediction of feature value.
Figure 1. The Qualitative/Quantitative Customer-driven Development (QCD)
model [4].
88

89
2.2 Value Determinants Customer value is an increasingly studied concept in the literature [19], [20]. Previous researchers distinguish between four different types of customer value: Functional, Economic, Emotional and Sym-bolic [20]. In this paper, however, we focus on two of the values, i.e. the functional and economic value, which we describe in Table 1 bel-low. These are the two types that companies are more eager to vali-date and predict [19].
Table 7. Value determinants for functional and economic customer value.
Value Type Description
Functional Focus on the functionality and offerings. Traditionally,
value preposition was based on the functional features of
product or services. Here, the value for the customer is e.g.
new feature in the product or an improvement of the exist-
ing.
Economic Focus on price. Here, customers are e.g. offered the product
or service functionality under a lower price than before or
compared to the competitor.
3 Early Value Argumentation and Prediction Technique
Typically, and as recognized in previous research [6], product man-agement (PdM) has to wait until the feature is fully developed in order to validate its expected value. To overcome this problem, we further detail in our previous research developed ‘Early Value Argumentation and Prediction’ (EVAP) technique [8]. We define value argumentation to be the ability to explicitly specify what the value of the feature will be when fully developed. The EVAP technique is one of several techniques that the QCD model uses in or-der to help validate feature content and customer value. In particular,
89

90
it works as a support to help companies move away from early re-quirements specification and towards dynamic prioritization of fea-tures.
Figure 2. ‘EVAP’ technique in the QCD model.
As a result of using the technique, companies can predict the value of a feature being developed, and decisions on whether to continue de-velopment or not can be taken based on real-time customer data. 3.2 EVAP: Iteration Steps Our technique consists of four steps, which we describe in detail bel-low: Feature selection: There are no pre-conditions for selecting a feature for experimentation using the EVAP technique. Any feature that is under development and that PdM considers uncertain with respect to its customer value is eligible. To start, we recommend selecting fea-tures on which customer feedback is already being collected. This re-quires less investment into resources that follow in the next steps. Feature value proposition: In step two, expected value of the feature is proposed as a hypothesis. This is done by either estimating the finan-cial gain the feature will produce when implemented, or by using any other feature relevant estimation of a metric that is already utilized in the organization (for related or similar features). Table 1 with value determinants can be used to elicit different types of customer value. Although the feature may not have been even partially developed yet, by collecting the feedback and analyzing it, the accuracy of the pre-dicted value can already be increased.
90
91
Feature value argumentation: The argumentation consists of a measur-ing proxy with three actionable steps: (1) measuring the value of the feature in the current iteration, (2) comparing it with the value of the previous iteration, and (3) measur-ing the distance between the current and expected value. Although in many cases the measurement consists of reading a counter or aggregat-ing the collected feedback, powerful measurement methods exist for any intangible as well [21]. Whenever possible and economically fea-sible, as many measurements as possible should be performed that re-late to answering potential questions of interest of a stakeholder. The value argumentation step typically requires several iterations in which a minimal viable feature (MVF) is being developed. We annotate them with ‘i*t(im)’ on Figure 3, where ‘i’ denotes the number of iterations, before the expected value is confirmed and ‘t(im)’ the average time for one iteration. The time between identification of feature expected value ‘t(ex)’ and its confirmation ‘t(va)’, is the ‘value gap time’ anno-tated with t(gap). This is the period where companies decide, using measured value, whether to continue developing the functionality or stop and redirect R&D efforts. Feature pivoting: The measure proxy of customer value is the critical element of the iteration and all decisions are taken based on the out-come of the measurements. For the decision to either develop further, pivot or stop developing to be objective, EVAP requires holistic com-putation of both feature expected value metrics (e.g. those that are di-rectly related to the feature and expected to change) as well as the company valuable metrics that are not directly related to the feature (e.g. those that are known to deliver value). The combined sum of both expected and unexpected value feeds into the QCD cycle of hy-pothesis generation and decision making regarding further develop-ment and pivoting of the feature [21]. Technically, this can be mod-elled as a map of tuples consisting of features and a historical vector of measured customer value.
91

92
We illustrate the steps of the EVAP method on Figure 3 below, where we show the typical process of feature value argumentation.
Figure 3 ‘Early Value Argumentation and Prediction’ (EVAP) technique.
3.2 EVAP: Feedback Stream Customer feedback, both qualitative and quantitative, is used to per-form the measurement. When the feature under development is in its early stages, e.g. the pre-development phase, the measurement and validation are more qualitative. Typically, the feedback at this time consists of e.g. user stories, mockups or/and interview data. Several statistical techniques [22] which are not the focus of this paper can be used to statistically sample the data, aggregate and quantify the feed-back. When the product is in its later stages, e.g. development or post-deployment, the measurement and validation is more quantitative. Product feedback then consists of e.g. product operational perform-ance, usage data or/and sales input which contribute to the accuracy of predicted value. In the remainder of this paper, and based on the increasing need for feature value validation and prediction in software development or-ganizations, we validate the ‘Early Value Argumentation and Predic-tion’ (EVAP) technique, in four feature experiments in three case com-panies.
92
93
4 Research Method
We validated our model on a multiple-case study [23] that took place between December 2014 and November 2015 and it builds on an on-going work with three companies involved in large-scale development of software products. Case study methodology is an empirical method aimed at investigating contemporary phenomena in their context, and it is well suited for this kind of software engineering research [23]. This is due to the fact that objects of this study are hard to study in isolation and case studies are by definition conducted in real world settings. Based on experience from previous projects on how to advance be-yond agile practices [3], [5], we conducted 25 individual interviews and held two joint workshops with all the companies involved in this research, and two individual workshops in-between. The aim of the first joint workshop was to identify and initiate a new feature experi-ment. To achieve this, we presented the key findings from our previ-ous work on customer driven development. Here, we gave an option to the companies to decide on the type of the feature experimentation instrument. And since all participating companies collect quantitative as well as qualitative data, QCD model was the selected instrument. However, what companies struggled with during the experimentation process and what we detail in this paper, is an actionable implementa-tion of one the aspects of the QCD model. The second and third workshops were at the individual companies and were an opportunity for the companies to update us on how they are planning to conduct a feature validation experiment. Finally, the last workshop was where companies presented to researchers and other companies how the experiments were conducted.
93

94
Table 2. Description of the companies and the representatives that we met with.
Company and their domain Representatives
Company A is a provider of telecommunication systems and
equipment, communications networks and multimedia solu-
tions for mobile and fixed network operators. The company
has several sites and for the purpose of this study, we col-
laborated with representatives from two company sites. The
primary site in the study, is located in Sweden whereas the
other site, with which we had virtual meetings, is located in
China. Together with company A, we performed one fea-
ture experiment with a network feature.
1 Product Owner
1 Product Manager
1 Line Manager
3 System Managers
1 Software Engineer.
1 Release Manager
Company B is a software company specializing in naviga-
tional information, operations management and optimiza-
tion solutions. In company B, we performed two feature ex-
periments. The first one was an on-going experiment with a
feature for adjusting schedule that started before December
2014, whereas the second feature experiment was with the
long term KPI visualization.
1 System Architect
1 Portfolio Manager
1 UX Designer
1 Product Owner
1 Software Engineer
1 Service Manager
Company C is a manufacturer and supplier of transport so-
lutions for commercial use. In this company we recently ini-
tiated and are running an ongoing feature experiment with
a maintenance feature.
2 Brand Managers
2 UX Managers
5 Feature Specialists
1 Tech. Specialist
1 Product Owner
4.1 Data Collection and Analysis The main data collection method in both of the joint workshops was semi-structured group interviews with open-ended questions. In addi-tion to the workshops, we had a number of Skype meetings, individual company visits and communicated via e-mail or Lync. In total, we met twice on joint workshops, twice at each of the companies individually, and communicated via emails at least once per month. All workshops and individual visits were conducted in English and lasted between two and three hours. During the meetings with company A (site 1) and
94
95
company B, we were always two researchers sharing the responsibility of asking questions and facilitating the group discussion. Notes were taken by one of the researches and after each interview these notes were shared among the other researchers and company representatives (shown in Table 2). We asked the interviewees both contextual infor-mation about the reasons of selecting the particular feature for the ex-perimentation as well as the technical details regarding feature state, performance and other relevant counters. During analysis, the summary notes were used when coding the data, and as soon as any questions or potential misunderstandings occurred, we verified the information with the other researcher and participating representatives from the companies. The notes and workshop meeting minutes were analyzed following the qualitative content analysis ap-proach [24]. 4.2 Validity considerations We took a number of steps to improve the study’s construct validity. First, we used semi-structured interviews with company representa-tives working in several different roles and companies. This enabled us at the same time to ask clarifying questions and prevent misunder-standings, and on the other side, to study the effect of the method from different angles. Second, and since this study builds on an ongo-ing work with companies involved in large-scale development of soft-ware products, all parties were familiar with the concepts of con-trolled feature experimentation. The overall expectations and goals between the researchers and companies were therefore aligned. The results of the validation cannot directly translate to other compa-nies and contexts. However, considering external validity, we illustrate how continuous feature experimentation can be conducted and what the effects of using the EVAP are in the case companies we work with. Due to the fact that these companies represent the current state of the embedded systems industry [3], we consider the results to be well grounded in practice and useful for similar organizations.
95

96
5 Validation of the EVAP technique
This section presents how we validated the EVAP technique in our case companies. Although different in nature, validation experiments followed the pat-tern in the EVAP technique by first selecting a feature, defining the hypothesized value, and identifying the relevant metrics that measure the actual value that it delivers. We describe the problems that the case companies had been experienc-ing and show how they validated and predicted feature value using the ‘EVAP technique’ in a table that follows the problem description. 5. 1 Company A: Network Feature Company A has clearly defined processes in place when it comes to implementing new product functionality. Before development starts, the monetary value of the new feature is defined and demonstrated. For this experiment, Company A selected a network feature that was at the time under development. Problem Experienced: During a network connection problem between a node and a gateway, a large amount of users gets detached from the network. Company A wished to reduce the number of detach requests, hence they started to develop a feature that would seemingly establish the broken connection between the node and the gateway.
Table 3. Company A: Validation of the EVAP technique on the Network Feature.
Value Proposition
Company A believed that this feature increases economic value of the product by
improving the quality of experience for the customers’ subscribers with reducing the
number of detach requests. This was the expected economic value of the feature that
they wished to validate. At the same time, and following the EVAP technique, they
assessed system performance counters that do not directly related to this feature in
order to find out if another value, e.g. functional value, could be predicted during
the validation process.
96

97
Data Collection and Customer Feedback Techniques Selection
Quantitative technique of collecting product operational data was used to collect the
total amount of detach request and the total number of active users at the moment
(sending / receiving data). Improvement in these two metrics were the expected eco-
nomic value estimations for company A.
Additionally, the CPU and Memory load counters on the processors of the system
were retrieved for the value prediction purposes. Both data inputs were collected
from a simulation that mimics a real-life network of a larger mobile network pro-
vider.
Value Argumentation
Company A started to implement the selected feature in a system and monitored
how the operational behavior of the product changes in every iteration. They per-
formed several iterations with different setting of the feature properties, until a sig-
nificant difference in the measured metric (a counter of the number of detach re-
quests on link failure) was visible. Instead of the initial 90000 detach requests in a
system without the feature, only several hundreds were measured. After the count of
detaches stabilized, they were confident that the expected value of the feature was
confirmed.
However, while validating this features expected value and following the EVAP
technique by assessing metrics that are not directly related to the feature (e.g. overall
system performance, which relate to product functional value) company A moni-
tored how the CPU and MEM counters change in time. Interestingly, they discov-
ered that this feature reduces the CPU load.
Feature Pivoting
Company A selected a metric that is relevant for the feature under development and
was able to iteratively validate the expected value. Due to the EVAP technique, they
were able to find changes in the CPU load, which gave them the foundations to pre-
dict new, functional value for this feature (e.g. the % of CPU computational power
saved for other operations). This was a surprise and it was not an expected behav-
ior. Although the initial goal of having less detach requests is important and was
validated, the unexpected and predicted functional value realized in CPU decrease
significantly raised the importance of the feature and re-directed the resources into
further development. The feature has be highly prioritized.
97
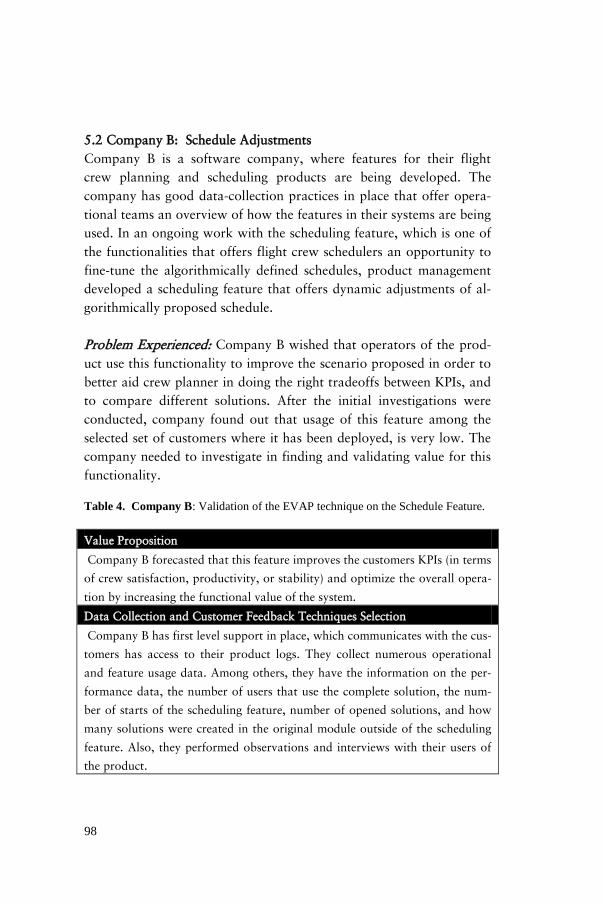
98
5.2 Company B: Schedule Adjustments Company B is a software company, where features for their flight crew planning and scheduling products are being developed. The company has good data-collection practices in place that offer opera-tional teams an overview of how the features in their systems are being used. In an ongoing work with the scheduling feature, which is one of the functionalities that offers flight crew schedulers an opportunity to fine-tune the algorithmically defined schedules, product management developed a scheduling feature that offers dynamic adjustments of al-gorithmically proposed schedule. Problem Experienced: Company B wished that operators of the prod-uct use this functionality to improve the scenario proposed in order to better aid crew planner in doing the right tradeoffs between KPIs, and to compare different solutions. After the initial investigations were conducted, company found out that usage of this feature among the selected set of customers where it has been deployed, is very low. The company needed to investigate in finding and validating value for this functionality.
Table 4. Company B: Validation of the EVAP technique on the Schedule Feature.
Value Proposition
Company B forecasted that this feature improves the customers KPIs (in terms
of crew satisfaction, productivity, or stability) and optimize the overall opera-
tion by increasing the functional value of the system.
Data Collection and Customer Feedback Techniques Selection
Company B has first level support in place, which communicates with the cus-
tomers has access to their product logs. They collect numerous operational
and feature usage data. Among others, they have the information on the per-
formance data, the number of users that use the complete solution, the num-
ber of starts of the scheduling feature, number of opened solutions, and how
many solutions were created in the original module outside of the scheduling
feature. Also, they performed observations and interviews with their users of
the product.
98

99
Value Argumentation
After the initial release of the selected feature, company B started to investi-
gate the operational and feature usage data. There, they detected a low num-
ber of feature executions. They observed the customers using the system and
came up with adjustments of the feature setting that they deployed in the next
iteration. After another observation of the data collected, combined with the
roles of users using this feature, they had enough evidence to argument that
this feature delivers the functional value that was hypothesized. That is, the
individual KPI improvements when manually adjusting a schedule.
Feature Pivoting
Company B conducted this experiment in order to validate what value does
the feature bring to their customers. After investigating the feature usage and
system data, they found out that having deployed such a feature, KPIs of their
customers became, due to feature nature of fine-tuning the proposed schedule,
easier to achieve and more visible in the management perspective. This was
evidence that the hypothesized feature value of improving customers KPIs was
validated. Also, company B found out that it is necessary to identify the roles
of the users that open the scheduling feature in order to better tailor the func-
tionality. Company B pivoted in the direction of developing this feature to
more customers. They have fully developed this functionality and achieved
better deployment and acceptance among customers. 5.3 Company B: Long Term KPI Visualization Company B started during the period that this research took place an-other experiment. Being successful in validating the value of the fea-ture above, they started to develop a new feature that will visualize the current performance indicators such as crew satisfaction and produc-tivity in an interactive dashboard, making them visible to their cus-tomers’ management and increase the functional value. Problem Experienced: In company B they often experience that their customers do not use their latest, and at the same time the most ad-vanced version of the product. Instead, what they see is that customers
99

100
accept new releases very slowly due to the fact that they do not see the benefits explicitly. At the same time, and due to this reason of not adopting the newest release, company B did not know how well their feature improvements perform in reaching customers’ KPIs. Company B decided to validate if they can motivate their customers to adopt new releases by developing a feature that visualizes customers’ key performance indicators.
Table 5. Company B: Validation of the EVAP technique on the KPI Vis. Feature.
Value Proposition
Company B hypothesized that by having this feature in place, they would find out how well
their system is performing at a certain customer, which would give them the information
on which improvements to suggest to their customers. This was the expected functional
value of the feature. However, and following the EVAP technique, they hypothesized that
this feature will also motivate the customers to adopt the new release of the product, in-
creasing the feature’ functional value.
Data Collection and Customer Feedback Techniques Selection
For this experiment, company B collected the number of times the KPI dashboard was
opened and the role of the user that opened the dashboard. They collected this data from
product log which was submitted to Service Center, a department that takes care of the
customer support.
Value Argumentation
Company B started to iteratively develop this functionality and show it to a test customer.
At first, company B visualized, as part of this feature, the KPIs that they considered impor-
tant and will have an effect on customer feature usage. After analyzing the collected prod-
uct data about feature usage, they did not see any significant difference in behavior of the
customer. In the next iteration, Company B improved the feature by closely cooperating
with the test customer and changed the visualizations so they reflect what companies con-
sider as an important KPI. Now, customers are interested to adopt this functionality and
cooperating with Company B.
Feature Pivoting
Company B increased the accuracy of the predicted economical value of this feature to be
the ability to recommend customers product improvements due to the visualization of cus-
100

101
tomers’ KPI. This motivates the customers in adopting the new release. Also, they learned
that developing such a feature cannot be done without a launching customer. However,
during the experiment company B also discovered, by using the EVAP technique, that the
actual value of the feature is that the customers will share their Key Performance Indicators
with them when taking the release. This gives company B the knowledge needed in order to
know where to improve the overall solution for a certain customer, which was not the ex-
pected value of this particular feature up-front.
101

102
5.4 Company C: Maintenance Feature Company C recently decided to initiate a feature experiment using the EVAP technique for a maintenance feature that is planned in one of the future products. They are aware, from the data that they collect, that vehicle uptime is a very important factor that defines customer value and are constantly working in improving this KPI. Problem Experienced: Company C is collecting various operational data from their test vehicle products and regularly scheduled mainte-nance visits. However, and what they see in the field, is a variation of time between times to failure, occasionally forcing the customer to bring the vehicle earlier into a workshop and redirect the transport ac-tivity to their other vehicles.
Table 6. Company C: Validation of the EVAP technique on the Maintenance Fea-ture.
Value Proposition
Company C hypothesized that it could be possible to raise the accuracy of the
prediction of certain part failures by utilizing the usage data. By giving a better
estimate on when a certain part in the product will fail, they could advise their
customers an early maintenance which would limit the downtime of the trans-
port vehicle. And since minimizing the unexpected downtime is one of the
highest priorities for company C, a feature as such would be of high value for
many of their customers. They defined the expected economic value of the
new feature under development to be the increase of the customer KPI on up-
time by having the ability to direct the customer vehicles into early mainte-
nance visits.
Data Collection and Customer Feedback Techniques Selection
In order to raise the accuracy of the hypothesis, company C started to con-
sider which signals they need to collect. They decided to utilize the Vehicle
Log Database which contains technical data such as feature usage, mainte-
nance windows and others. In order to better understand the data, they de-
cided to start visualizing trends on different feature usages.
102

103
Value Argumentation
Company C started to develop this feature and are at the moment in a very
early stage. They are visualizing the trends and collecting various performance
data from the vehicle log database. However, while considering the EVAP
technique with the respect to predicting value, they discovered that there is
additional value in this feature. Not only they can direct the necessary vehicles
to an early maintenance visit, they could, with this feature in place and inves-
tigating into the patterns and trends of usage, prolong vehicle uptime periods
by advising a later visit of a workshop for certain customers. For their cus-
tomers this delivers a higher uptime of the vehicle and long term savings on
maintenance expenses.
Feature Pivoting
Although the Company C just recently started this feature experiment, they
are becoming more precise in predicting the value of the feature. They are able
to better predict the economical value of the Maintenance feature and will
continue to use the EVAP technique in order to validate it in later develop-
ment stages and post-deployment.
103

104
Table 7. Summary of the experiments.
Company /
Experiment CFT and Collected
data Expected and
validated value Predicted value
Network
Feature Product logs that
contain number of
detaches, active
users and sys. load
Reduced the
number of detach
requests
Reduces CPU load
during a network
hiccup
Scheduling
feature Service Center logs
with counts of fea-
ture usage
Improving an
individual KPI Feature trade-offs
and improvements
Long term
KPI visuali-
zation
Service Center logs
with counts of
dashboard open-
ings / interviews
Visualization of
KPI that will
cause companies
to take releases
Better Alignment of
the customers KPIs
that results in over-
all solution im-
provements. Maintenance
Feature Vehicle Log Data-
base validation in
progress Predicting mainte-
nance time
6 Discussion and Conclusion
Companies are increasingly connecting with the people that use their products and try to collect customer feedback in order to better learn from them [10], [13], [18]. In this way, they can identify the extent to which the feature that they are developing will actually deliver value to their customers. However, to be able to predict and validate feature value early in the development cycle, organizations have to adapt con-cepts of continuous experimentation and implement their practices across the company. The QCD model, due to its nature of being very dynamic when form-ing hypotheses and able to handle both quantitative as well as qualita-tive data [4], is the current ‘state of the art’ instrument for continuous experimentation. By adopting QCD practices i.e. EVAP, companies can validate their hypotheses derived from the business objectives.
104

105
In this paper, we present the EVAP technique in depth and validate it as an actionable realization of one aspects of the QCD model. Com-panies can use this technique to: (1) Improve the value of product functionality that is under develop-ment. We illustrate this in the four feature experiments with the three case companies, showing how they both developed valuable functionalities. For example, company A successfully developed the network feature by proving that the number of detach requests iteratively reduced by validation on a test system. Similarly, company B developed the scheduling feature, by iteratively running feature experiments with their customers and validating the value. At the same time, and due to positive feedback from this experiment, company B started to develop the KPI visualization feature, which is showing positive validation re-sults, giving company B a reason to continue developing this function-ality. (2) Stop when the amount of additional value created in each iteration falls below a predefined threshold. While iterating with the network feature, company A validated the functionality on the test system that mimics real-life environment and found out that by comparing the results of two consecutive iterations, the number of detach requests converged and developing further would not bring more value to the product. They stopped developing the parts of the feature that would further reduce detach request times. Similarly, company B stopped developing the scheduling functionality after they confirmed that it delivers the expected value and no meas-urable value could be predicted after a number of iterations. (3) Stop development of a feature and remove it from the system when expected value is not realized. Although this has not been the case during this research, companies could stop developing a feature and remove the already implemented
105

106
parts from the system, if they had identified that measurable value of the feature is lower as expected after a pre-defined number of itera-tions. (4) Identify unexpected business value early during development and redirect R&D effort immediately to capture this value. We can see from the experiments that all companies predicted the value of the feature even before they fully developed it. In Company A, for example, they correctly predicted the CPU load decrease and in-creasingly invested in further developing this functionality in order to capture this value. Similarly, they are predicting the value of the main-tenance feature in Company C. Also, Company B predicted the value of their second experiment to be the customer knowledge gain. To conclude, we have demonstrated how continuous feature experi-mentation can be conducted in three large B2B companies in order to use the benefits of being customer-driven to validate and predict fea-ture value. We do this by exploring the QCD validation cycle and de-veloping an iterative technique that practitioners in organizations can use to dynamically develop valuable product functionality. By continuously validating with the customers, the technique allows teams to develop features only until it is still valuable, or remove it from the system when it is not. By using this method, organizations can predict and identify unexpected business value early during the development and redirect R&D efforts to capture it. In future research we plan to further develop the various techniques that are used as part of the QCD model, and we intend to validate these in our case companies. In this way, we will provide in-depth process support for companies interested in adopting a dynamic de-velopment approach based on continuous customer validation cus-tomers.
106

107
References
[1] L. Williams and A. Cockburn, “Introduction: Agile Software
Development: Its About Feedback and Change,” Computer, vol. 36, no.
6. p. 39, 2003.
[2] N. D. Fogelström, T. G. M. Svahnberg, and P. Olsson, “The impact of
agile principles on market-driven software product development,” J.
Softw. Maint. Evol., vol. 22, no. 1, pp. 53–80, 2010.
[3] H. H. Olsson and J. Bosch, “From opinions to data-driven software
R&D: A multi-case study on how to close the ‘open loop’
problem,” in Proceedings - 40th Euromicro Conference Series on
Software Engineering and Advanced Applications, SEAA 2014, pp. 9–
16, 2014.
[4] H. H. Olsson and J. Bosch, “Towards Continuous Customer Validation : A conceptual model for combining qualitative customer feedback with
quantitative customer observation,” LNBIP, vol. 210, pp. 154–166,
2015.
[5] A. Fabijan, H. H. Olsson, and J. Bosch, “Customer Feedback and Data
Collection Techniques in Software R&D: A Literature Review,” Softw.
Business, Icsob 2015, vol. 210, pp. 139–153, 2015.
[6] E. Johansson, D. Bergdahl, J. Bosch, and H. H. Olsson, “Requirement
Prioritization with Quantitative Data - a case study,” in International
Conference on Product-Focused Software Process Improvement, vol.
9459, pp. 89–104, 2015.
[7] E. Lindgren and J. Münch, Software development as an experiment
system: A qualitative survey on the state of the practice, vol. 212. Cham:
Springer, 2015.
[8] A. Fabijan, H. H. Olsson, and J. Bosch, “Early Value Argumentation
and Prediction : an Iterative Approach to Quantifying Feature Value,” in
Product-Focused Software Process Improvement, 2015, vol. 9459, pp.
16–23, 2015.
[9] R. Kohavi, R. Longbotham, D. Sommerfield, and R. M. Henne,
“Controlled experiments on the web: Survey and practical guide,” Data
107

108
Min. Knowl. Discov., vol. 18, pp. 140–181, 2009.
[10] E. von Hippel, “Lead Users: A Source of Novel Product Concepts,”
Manage. Sci., vol. 32, no. 7, pp. 791–805, 1986.
[11] D. McKinley, “Design for Cont. Experimentation,” 2012. Available:
Http://mcfunley.com/design-for-Continuous-Experimentation.
[12] H. Davenport, Thomas, “How to Design Smart Business Experiments,”
Harvard Business Review, 2009.
[13] J. Bosch and U. Eklund, “Eternal embedded software: Towards
innovation experiment systems,” in Lecture Notes in Computer Science,
2012, vol. 7609 LNCS, no. PART 1, pp. 19–31, 2012.
[14] V. R. Basili, G. Caldiera, and H. D. Rombach, “Experience factory,”
Encycl. Softw. Eng., vol. 1, pp. 469–476, 1994.
[15] F. Fagerholm, H. Mäenpää, and J. Münch, “Building Blocks for
Continuous Experimentation Categories and Subject Descriptors,” pp.
26–35, 2014.
[16] E. Ries, The Lean Startup: How Today’s Entrepreneurs Use Continuous
Innovation to Create Radically Successful Businesses. 2011.
[17] V. Basili, J. Heidrich, M. Lindvall, J. Münch, M. Regardie, and A.
Trendowicz, “GQM+Strategies - Aligning business strategies with
software measurement,” in Proceedings - 1st International Symposium
on Empirical Software Engineering and Measurement, ESEM 2007,, pp.
488–490, 2007.
[18] J. Bosch, “Building products as innovation experiment systems,” Lect.
Notes Bus. Inf. Process., vol. 114 LNBIP, pp. 27–39, 2012.
[19] A. F. Payne, K. Storbacka, and P. Frow, “Managing the co-creation of
value,” J. Acad. Mark. Sci., vol. 36, no. 1, pp. 83–96, 2008.
[20] J. Hemilä, J. Vilko, E. Kallionpää, and J. Rantala, “Value creation in
product-service supply networks,” in The Proceedings of 19th
International Symposium on Logistics (ISL 2014), 6.-9.7.2014., Ho Chi
Minh City, Vietnam, 2014, pp. 168–175.
[21] D. W. Hubbard, How to measure anything: Finding the value of
intangibles in business. John Wiley & Sons, 2014.
[22] F. W. Young, “Quantitative analysis of qualitative data,”
Psychometrika, vol. 46, no. 4, pp. 357–388, 1981.
108

109
[23] P. Runeson and M. Höst, “Guidelines for conducting and reporting case
study research in software engineering,” Empir. Softw. Eng., vol. 14, no.
2, pp. 131 – 164, 2008.
[24] P. Mayring, “Qualitative content analysis - research instrument or mode
of interpretation,” in The Role of the Researcher in Qualitative
Psychology,, pp. 139–148, 2002.
109

110
110

111
PAPER [B]
Fabijan, A., Olsson, H.H. and Bosch, J. “The Lack of Sharing of Customer Data in Large Software Organizations: Chal-lenges and Implications”. In: Proceedings of the 17th International Conference on Agile Software Development XP2016. pp. 39–52. Springer, Edinburgh, Scotland. (2016).
111

112
112

113
The Lack of Sharing of Customer Data in Large Software Organizations: Challenges and
Implications
Aleksander Fabijan1, Helena Holmström Olsson1, Jan Bosch2
1 Malmö University, Faculty of Technology and Society, Nordenskiöldsgatan 1,
211 19 Malmö, Sweden {Aleksander.Fabijan, Helena.Holmstrom.Olsson}@mah.se
2 Chalmers University of Technology, Department of Computer Science & Engi-neering, Hörselgången 11, 412 96 Göteborg, Sweden
Abstract. With agile teams becoming increasingly multi-disciplinary and including all functions, the role of customer feed-back is gaining momentum. Today, companies collect feedback di-rectly from customers, as well as indirectly from their products. As a result, companies face a situation in which the amount of data from which they can learn about their customers is larger than ever before. In previous studies, the collection of data is often identified as chal-lenging. However, and as illustrated in our research, the challenge is not the collection of data but rather how to share this data among people in order to make effective use of it. In this paper, and based on case study research in three large software-intensive companies, we (1) provide empirical evidence that ‘lack of sharing’ is the prima-ry reason for insufficient use of customer and product data, and (2) develop a model in which we identify what data is collected, by whom data is collected and in what development phases it is used. In particular, the model depicts critical hand-overs where certain types of data get lost, as well as the implications associated with this. We conclude that companies benefit from a very limited part of the data they collect, and that lack of sharing of data drives inaccurate as-sumptions of what constitutes customer value.
Keywords: Customer feedback, product data, qualitative and quanti-tative data, data sharing practices, data-driven development.
113

114
1 Introduction
Traditional ‘waterfall-like’ methods of software development are pro-gressively being replaced by development approaches such as e.g. agile practices that support rapid and continuous delivery of customer value [20]. Although the collection of customer feedback has always been important for R&D teams in order to better understand what custom-ers want, it is today, when R&D teams are becoming increasingly multi-disciplinary to include all functions, that the full potential of customer data can be utilized [21]. In recent years, increasing attention has been put on the many different techniques that companies use to collect customer feedback. With connected products, and trends such as ‘Big Data’ [1] and ‘Internet of Things’ [19], the qualitative tech-niques such as e.g. customer surveys, interviews and observations, are being complemented with quantitative logging and automated data collection techniques. For most companies, the increasing opportuni-ties to collect data has resulted in rapidly growing amounts of data re-vealing contextual information about customer experiences and tasks, and technical information revealing system performance and opera-tion. However, and as recognized in recent research [8], the challenge is no longer about how to collect data. Rather, the challenge is about how to make efficient use of the large volumes of data that are continu-ously collected and that have the potential to reveal customer behav-iors as well as product performance [1], [6], [7], [9]. Although having access to large amounts of data, most companies experience insuffi-cient use of the data they collect, and as a result weak impact on deci-sion-making and processes. In this paper, we explore data collection practices in three large soft-ware-intensive companies, and we identify that ‘lack of sharing’ of data is the primary reason for insufficient use and impact of collected data. While the case companies collect large amounts of data from customers and from products in the field, they suffer from lack of practices that help them share data between people and development
114

115
phases. As a result, decision-making and prioritization processes do not improve based on an accumulated data set that evolves through-out the development cycle, and organizations risk repetition of work due to lack of traceability. The contribution of the paper is twofold. First, we identify that ‘lack of sharing’ is the primary reason for insufficient use of data and we provide empirical evidence on the challenges and implications involved in sharing of data in large software organizations. Second, and based on our empirical findings, we develop a model in which we identify what data is collected, by whom data is collected and in what devel-opment phases it is used. Our model depicts critical hand-overs where certain types of data get lost, and how this causes a situation where data does not accumulate and evolve throughout the development process. By capturing ‘current state-of-practice’, and by identifying critical hand-overs where data gets lost, the model supports companies in identifying what challenges they experience, and what implications this will result in. The awareness that the model helps create can work as valuable input when deciding what actions to take to improve shar-ing of data in large software-intensive organizations.
2 Background
2.1 Collection of Customer Feedback In most companies, customer feedback is collected on a frequent basis in order to learn about how customers use products, what features th-ey appreciate and what functionality they would like to see in new products [6], [5]. Typically, a wide range of different techniques are used to collect this feedback, spanning from qualitative techniques capturing customer experiences and behaviors [6], [7], [10], to quanti-tative techniques capturing product performance and operation [11], [12], [10]. While the qualitative techniques are used primarily in the early stages of development in order to understand the context in
115
116
which the customer operates, the quantitative techniques are used post-deployment in order to understand the actual usage of products. Starting with the pre-development stage, companies typically collect qualitative customer feedback using customer journeys, interviews, questionnaires and surveys [6], [7], forming the basis for the require-ments generation [13]. At this stage, contextual information on the purpose of the product or a feature with functional characteristics and means of use are typically collected by customer representatives. Typi-cally, this information is used to both define functional requirements as well as to form customer groups with similar needs and priorities, also known as personas [17]. During development, customer feedback is typically collected in proto-typing sessions in which customers test the prototype, discuss it with the developers and user experience (UX) specialists, and suggest modi-fications of e.g. the user interface [6], [7], [14], As a result, developers get feedback on product behaviors and initial performance data. Cus-tomer feedback is typically mixed and consists of both qualitative in-formation on e.g. design decisions and quantitative operational data [6]. In the post-deployment stage, and when the product has been released to its customers, a number of techniques are used to collect customer and product data. First, and since the products are increasingly being connected to the Internet and equipped with data collection mecha-nisms, operational data, and data revealing feature usage is collected [14], [15], [6]. Typically, this data is of quantitative type and collected by the engineers that operate the product and service centers that sup-port it. Second, if customers generate incident requests and attach the product log revealing the state of the product, error message and other details. These are important sources of information for the support engineers when troubleshooting and improving the product [10]. Also, and as recognized in previous research [16], [15], A/B testing is a commonly deployed technique to collect quantitative feedback in con-nected products on which version of the feature offers a better conver-sion or return of investment. And although increasing amounts of data
116

117
are being collected, very little is actually being used. The challenges in aggregating and analyzing this data in an efficient way prevent higher levels of the organization from benefiting from it [12]. 2.2 Impact and Use of Customer Data Companies operating within transportation, telecommunications, re-tailing, hospitality, travel, or health care industries already today gather and store large amounts of valuable customer data [19]. These data, in combination with a holistic understanding of the resources needed in customer value-creating processes and practices, can provide the companies that fully utilize it a competitive advantage on the mar-ket [18]. However, challenges with meaningfully combining and analyzing these customer data in an efficient way are preventing companies from util-izing the full potential from it [1], [8]. Instead of a complete organiza-tion benefiting from an accumulated knowledge, it is mostly only the engineers and technicians that have an advantage in using this data for operational purposes [12]. Higher levels in the organization such as product management or customer relationship departments need to find ways of better utilizing customer data in order to unlock its po-tential and use it for prioritization and customer value-actualization processes [18].
1 Research Method
This research builds on an ongoing work with three case companies that use agile methods and are involved in large-scale development of software products. The study was conducted between August 2015 and December 2015. We selected the case study methodology as an empirical method because it aims at investigating contemporary phe-nomena in their context, and it is well suited for this kind of software engineering research [22]. This is due to the fact that objects of this
117

118
study are hard to study in isolation and case studies are by definition conducted in real world settings. Based on experience from previous projects on how to advance be-yond agile practices [3], [4], we held three individual workshops with all the companies involved in this research, following up with twenty-two individual interviews. We list the participants and their roles in Table 1.
Table 1. Description of the companies and the representatives that we met with.
Company and their domain Representatives
Company A is a provider of telecommunication systems and
equipment, communications networks and multimedia solutions
for mobile and fixed network operators. The company has sev-
eral sites and for the purpose of this study, we collaborated with
representatives from one company site. The company has ap-
proximately 25.000 Employees in R&D.
The participants marked with an asterisk (*) attended the work-
shop and were not available for a follow up-interview.
1 Product Owner
1 Product Manager
2 System Managers
2 Software Engi-
neer
1 Release Manager
1 Area Prod. Mng.*
1 Lean Coach*
1 Section Mng.*
Company B is a software company specializing in navigational
information, operations management and optimization solutions.
Company B has approximately 3.000 Employees in R&D.
All the participants attended the workshop and were interviewed.
1 Product Owner
1 System Architect
1 UX Designer
1 Service Manager
Company C is a manufacturer and supplier of transport solutions
construction technology and vehicles for commercial use.
The company has approximately 20.000 Employees in R&D.
All the participants that attended the workshop were interviewed.
In addition, one sales manager and one technology specialist
wished to join the project at a later stage, and were interviewed.
1 Product Owner
2 Product Strate-
gists
2 UX Managers
2 Function Owners
1 Feature Coord.
1 Sales Manager
2 Technology Spec.
118

119
3.1 Data Collection During the group workshops with the companies, we were always three researchers sharing the responsibility of asking questions and fa-cilitating the group discussion. Notes were taken by two of the re-searches and after each workshop, these notes were consolidated and shared to the third researcher and company representatives. First, we conducted a workshop with an exercise with the post-it notes that build our inventory of the customer feedback techniques. Second, we held semi-structured group interviews with open-ended questions [2] during the workshop. These questions were asked by on of the re-searcher while two of the researchers were taking notes. In addition to the workshops, we conducted twenty-two individual interviews that lasted one hour in average, and were recorded using an iPhone Memo application. Individual Interviews were conducted and transcribed by one of the researchers. In total, we collected 13 pages of workshop notes, 176 post-it notes, 138 pages of interview transcriptions, and 9 graphical illustrations from the interviewees. All workshops and indi-vidual interviews were conducted in English. 3.2 Data Analysis During analysis, the workshop notes, post-it notes, interview tran-scriptions and graphical illustrations were used when coding the data. The data collected were analyzed following the conventional qualitative content analysis approach where we derived the codes directly from the text data. This type of design is appropriate when striving to describe a phenomenon where existing theory or re-search literature is limited. Two of the researchers first independ-ently and then jointly analyzed the collected data and derived the final codes that were consolidated with the third and independent researcher who also participated at the workshops. As soon as any questions or potential misunderstandings occurred, we verified the information with the other researcher and participating representa-tives from the companies.
119

120
3.3 Validity considerations To improve the study’s construct validity, we conducted the exercise with the post-it notes and semi-structured interviews at the workshops with representatives working in several different roles and companies. This enabled us to ask clarifying questions, prevent misinterpretations, and study the phenomena from different angles. Next, we combined the workshop interviews with individual interviews. Workshop and interview notes were independently assessed by two researchers, guar-anteeing inter-rater reliability. And since this study builds on ongoing work, the overall expectations between the researchers and companies were aligned and well understood. The results of the validation cannot directly translate to other compa-nies. However, considering external validity, and since these compa-nies represent the current state of large-scale software development of embedded systems industry [3], we believe that the results can be gen-eralized to other large-scale software development companies.
4 Findings
In this section, we present our empirical findings. In accordance with our research interests, we first outline the generalized data collection practices in the three case companies, i.e. what types of data that is collected in the different development phases, and by whom. Second, we identify the challenges that are associated with sharing of data in these organizations. Finally, we explore their implications. 4.1 Data Collection Practices: Current State In the case companies, data is collected throughout the develop-ment cycle and by different roles in the organization. Typically, people working in the early phases of development collect qualita-tive data from customers reflecting customer environments, cus-tomer experience and customer tasks. The later in the development cycle, the more quantitative data is collected, reflecting system per-
120

121
formance and operation when in the field. In tables 2-4, we illus-trate the data collection practices, together with the customer feed-back methods and types of data that different roles collect in each of the development stages.
Table 2. Customer data collection practices in the pre-development stage.
Roles that collect
customer feedback
Common customer feed-
back collection tech-
niques
Common types of cus-
tomer feedback collected
Pre
-Dev
elop
men
t
Strategy special-
ists,
Product managers,
Product owners
Reading of industry press,
Reading of published
standards,
Reading of internal re-
ports, Reading customer
visit reviews
Customer wishes,
Short/Long market
trends,
Competitors ability of
delivering the product
Strategy special-
ists,
Feature owners
Telephone interviews,
Face-to-face interviews,
Conducting group inter-
views
Existing product satis-
faction,
Future product specifica-
tion,
Personas and User Jour-
neys
121

122
Table 3. Customer data collection practices in the development stage.
Roles that collect
customer feed-
back
Common customer feed-
back collection techniques
Common types of cus-
tomer feedback collected
Dev
elop
men
t
UX specialists,
Software Engi-
neers
System Usability Scale
Form,
Asking open ended ques-
tions,
Demonstrating prototypes,
Filming of users' product
use
Acceptance of the proto-
type,
Eye behavior and focus
time,
Points of pain,
Bottlenecks and con-
strains,
Interaction design
sketches
System managers,
System architects,
Software engi-
neers
Consolidate feedback from
other projects,
Reading prototype log en-
tries
Small improvement
wishes,
Configuration data,
Product operational
data
122

123
Table 4. Customer data collection practices in the post-deployment stage.
Roles that collect
customer feedback
Common customer feed-
back collection techniques
Common types of cus-
tomer feedback col-
lected
Post
-Dep
loym
ent
Release managers,
Service managers
Software engi-
neers
Reading of customer re-
ports,
Analyzing incidents,
Aggregating customer re-
quests,
Analyzing product log files
Number of incid. and
req.,
Duration of incid. and
req.,
Product operational
data,
Product performance
data
Sales managers Reading articles in the
media,
Sentimental analysis
Customer events participa-
tion,
Reading industry press,
Performing trend analysis
Opinions about the ap-
peal of the product,
Performance of the
product,
Business case descrip-
tions
4.2 Data Sharing Practices: Challenges Based on our interviews, we see that there are a number of chal-lenges associated with sharing of data in large organizations. For example, our interviewees all report of difficulties in getting access to data that was collected by someone else and in a different devel-opment phase. Below, we identify the main challenges associated with sharing of data in the case companies:
• Fragmented collection and storage of data Individuals independently collect increasing amounts of customer feedback, analyze the data they obtained, and store their findings on local repositories. Although these findings are occasionally pre-sented at meetings, the lack of transparency and tools prevents
123

124
others in the organization to use and benefit from the data. With so many different roles collecting and storing data, systematic shar-ing across development phases becomes almost impossible. As a result, only those roles that work in close collaboration share data, and benefit from the analysis of this data. This situation is illus-trated in the following quotes: “… it is all in my head more or less.” -Product owner, Company B “Information exists but we don’t know where it is.” –UX Specialist from Company C “I do not know everyone... So I contact only the person who is next in line.” -Sales manager from Company C.
• Filtering of customer data
People collect data, and share it only within the development stage they typically work in. For example, practitioners in the develop-ment phase actively exchange product log data, interaction design sketches, quality statistics and trouble reports. Similarly, those working in the post-deployment phase exchange release notes, business case descriptions and management system issues. Attempts to communicate the significance of customer feedback and their findings across development stages are typically unsuccessful. Feedback that is shared is filtered quantitative data. “It is like there is a wall in-between. There is a tradition that we should not talk to each other.” -Product Owner from Company C.
• Arduous to measure means hard to share.
The only data that is successfully shared among people and develop-ment phases, is quantitative data representing those things that can be easily measured such as e.g. system performance and operation. The case companies are successful in sharing transaction records, incident figures, feature usage data and other technical feedback that can be easily measured. However, qualitative data such as user stories, fea-ture purpose, or the intention of a certain requirement typically stay
124

125
with the people that collected that feedback. As a result, and instead of benefitting from an accumulated set of data that evolves over time, companies run the risk of using fragmented data sets that misrepre-sent the customer and provides an insufficient understanding of what constitutes customer value.
“Maybe 10% of information is shared. It is very difficult. It takes so much time, to, you need to write a novel more or less and distribute it” -Product manager from Company A. 4.3 Data Sharing Practices: Implications Due to very limited amounts of data being shared among people and across the development phases, the case companies experience a num-ber of implications. Below, we present the implications:
• Non-evolving and non-accumulating data. Although quantitative data describing operational and perform-ance requirements is typically shared, the lack of qualitative infor-mation with the context describing where, how and why a certain feature or a product is needed and how it will be used cause dis-crepancies in understanding the overall purpose. As a result, the data forming customer knowledge across the development stages does not accumulate and evolve. Consequently, practitioners de-veloping the product do not fully understand the overall purpose of the product or a feature under development and develop subopti-mal products that can be different from the customer wishes. “I think now a lot of thing are developed in a sub optimized way.” -Technology Spec. from company C. “We get feature which is broken down and then this value some-how got lost when it was broken down, then it is harder to under-stand what they really need it for.” –Software engineer from Com-pany B.
125

126
• Repetition of work. Due to the lack of access to the qualitative feedback that is col-lected in the early stages of development, roles in later stages that seek contextual understanding of a feature are sometimes required to collect identical feedback to the one that was already collected. Consequently, resources are spent on repeating the work that has already been done once. “You cannot build on what is already there since you don’t know. You then repeat an activity that was already made by someone else.” –UX specialist from Company C.
• Inaccurate models of customer value.
Since the qualitative customer feedback is not shared across the de-velopment phases, companies risk to use only the available quanti-tative customer feedback to build or update the understanding of the customer. This results in inaccurate assumptions on what con-stitutes customer value. And as a consequence of using the feed-back for prioritization on the product management level, projects that create waste risk to get prioritized. “You think one thing is important but you don’t realize that there is another thing that was even more important.” -Technology Spec. from company C.
• Validation of customer value is a “self-fulfilling prophecy”. Due to the fact that only quantitative customer feedback is ex-changed across the development phases and development organiza-tion, companies risk to validate their products using only the ef-fortlessly quantifiable feedback, and neglecting the rest. Instead of using the accumulated customer feedback and holistically asses their products, the validation of customer value becomes a “self-fulfilling prophecy” in that it focuses on developing and verifying things that can be quantified and provide tangible evidence.
126

127
We map the challenges with their implications for the companies and the products they develop, and summarize them in Table 5.
Table 5. The mapping of identified challenges to their implications.
Challenge Description Company implications Product implica-
tions
Fragmented
collection and
storage of
data
Sharing of data is
limited across the
development
stages.
No evolving and accu-
mulating of customer
data and understand-
ing.
Suboptimal prod-
ucts are being de-
veloped.
Filtering of
customer
data.
Only roles that
work in close
cooperation ex-
change feedback.
Inaccurate assumptions
on customer value and
repeating work.
Risk of developing
wasteful features.
Arduous to
measure
means hard
to share.
What can easily
be measured and
quantified is
shared.
Validation of customer
value is a “self-
fulfilling prophecy”.
Product maximizes
partial models of
customer value.
5 Discussion
Multi-disciplinary teams involved in the development of a software product are using customer feedback to develop and improve the product or a feature they are responsible for. Previous research [6], [8], [9] and our empirical findings show that companies collect in-creasingly large amounts of customer data. Both using the qualitative techniques are used primarily in the early stages of development [6], [7], [10] to construct an understanding of the customer and the con-text they operate in, and quantitative techniques that are used post-deployment to monitor the actual usage of products in the field [11], [12], [10. And although companies gather and store large amounts of valuable customer data [19], challenges with meaningfully combining
127

128
and analyzing it in an efficient way [1], [8] are preventing companies from evolving the data across the development stages and accumulat-ing the customer knowledge. 5.1. The Model: From Quantifiable Feedback to Partial Customer Value In response to the challenges and implications presented above, we illustrate our findings and challenges in a descriptive model on Fig-ure 1. In the development process, the model advocates an approach in which an internal model of customer value in companies is being created. We illustrate that companies in fragments collect a com-plete understating of the customer and their wishes, however, bene-fit only from a part of the understanding. In our model, we distinguish between three development stages, i.e. pre-development, development and post-deployment. Although we recognize that this is a simplified view, and that most development processes are of an iterative nature, we use these stages as they typi-cally involve similar roles, techniques, and types of feedback collected. On Figure 1, we list a few roles that collect customer feedback (A) and different methods of how they perform the collection (B). Within each of the development stages we list the types of feedback being shared across the stages with a solid green lines and those that are not with a dashed red lines. Between development stages we identify three criti-cal hand-over points where customer data that could and should get shared, dissipates. Instead of accumulating data being handed over, gaps across stages appear (illustrated with “?”symbols in blocks on Figure 1).
128

129
Fig. 1. Customer feedback sharing practices model.
5.1.1 The Vaporization of Customer Data. We identify three criti-cal hand-over blocks that cause data to disappear and prevent practitioners on project to build-on. (1) The PreDev Block: While there is extensive collection of qualitative customer feedback such as user journeys and product satisfaction sur-veys (Illustrated with C on Figure 1), roles working in the pre-development stage do not sufficiently supply the development part of the organization with the information they collect. Qualitative data that would inform the development stage on the context of the prod-uct under development, how it is going to be used, and who the differ-ent user groups perishes in the hand-over process between product owners and managers on one side, and software engineers and UX specialist on the other (Illustrated with D on Figure 1). Specifically, personas, user journeys and customer wishes are the types of feedback that should be handed over to the development stage, however, they are not. Consequently, the development part of the organization is forced to repeat collection activities in order to obtain this information when in need, or continue developing the product following only the specifications / requirements that were handed to them. (2) The DevOps Block: UX specialists and software engineers collect feedback on prototypes and their acceptance, as well as where the constraints are. However, this information is only used within the de-velopment stage. As a consequence of not handing it over to the post-
129
130
deployment stage service managers and software engineers (Illustrated with E on Figure 1), operators of the product do not understand the reason behind a certain configuration when solving a problem, and at the same time, suggest alternative solutions that were already known to be unacceptable to the developers. (3)The OpsDev Block: In the post-deployment stage, release and ser-vice managers collect and exchange operational and performance data, hover, do not share it with the development stage to software engi-neers and system managers. (Illustrated with F on Figure 1). This pre-vents the roles in the development stage such as system architects from e.g. deciding on an optimal architecture for a certain type of product and customer size. 5.1.2 Unidirectional Flow of Feedback. Illustrated with red and dashed arrows on Figure 1, the flow of feedback from the earlier stages of the development to the ones in the later stages is very lim-ited. On the other hand, the flow of feedback from the later stages to the early ones is extensive. This both supports our finding about extensive sharing of quantitative data, which is typically available in the later stages, as well as implies that it is easier to share data about earlier releases of the software under development compared to sharing feedback about the current release. Validating the value of the current release is consequently done very late. 5.1.3 Shadow Representation of Customer Value. In the absence of the accumulated data being accessible and shared across the devel-opment stages (illustrated with missing data symbol “?” on Figure 1), people in later stages base their prioritizations and decisions on shadow beliefs existing in the organization. Consequently, and in-stead of having a unique understanding of what constitutes cus-tomer value, individual development stages and roles prioritize based on their best intuition and shared quantitative data. If shar-ing of customer data in the direction towards the later stages is en-abled, roles across the development stages will be able to conduct data-informative decisions. As seen in our findings, hazards of be-
130

131
ing purely quantitative data-driven are extensive. And with qualita-tive data being as accessible as quantitative, validation of customer data could be coherent, not a ‘self-fulfilling prophecy’ as it is to-day.
6 Conclusion
By moving away from traditional waterfall development practices and with agile teams becoming increasingly multi-disciplinary and including all functions from R&D to product management and sales [21], the role of customer feedback is increasingly gaining momentum. And although the collection of data has previously been identified as challenging, we show in our research that the challenge is not its collection, but rather how to share this data in order to make effective use of it. In this paper, we explore the data collection practices in three large software-intensive organizations, and we identify that lack of sharing of data is the main inhibitor for effective product development and improvement. Based on our case study findings, we see that currently (1) companies benefit from a very limited part of the data they collect due to a lack of sharing of data across development phases and organ-izational units, (2) companies form inaccurate assumptions on what constitutes customer value and waste resources on repeating the activi-ties that have already been performed, and (3) validation of customer in companies today is a “self-fulfilling prophecy” in that it focuses on quantifiable things that provide tangible evidence.
131

137
References
1. Chen H., Chiang R.H., Storey V.C.: Business intelligence and analytics: From big data to big impact. 36, 1165-1188 (2012).
2. Dzamashvili Fogelström, N., Gorschek, T., Svahnberg, M. et al.: The Impact of Agile Principles on Market-Driven Software Product Devel-opment. Journal of Software Maintenance and Evolution: Research and Practice, 22 (2010) 53-80
3. Olsson, H. H., & Bosch, J.: From Opinions to Data-Driven Software R&D: A Multi-Case Study on how to Close the 'Open Loop' Problem. Software Engineering and Advanced Applications (SEAA), 2014 40th EUROMICRO Conference on, (2014) 9-16
4. Olsson, H. H., & Bosch, J.: Towards Continuous Customer Validation: A Conceptual Model for Combining Qualitative Customer Feedback with Quantitative Customer Observation. In: Anonymous Software Business, pp. 154-166. Springer (2015)
5. Von Hippel, E.: Lead Users: A Source of Novel Product Concepts. Eter-nal embedded software: Towards innovation experiment systems. In: Anonymous Leveraging Applications of Formal Methods, Verification and Management sci, (1986)
6. Fabijan, A., Olsson, H., Bosch, J.: Customer Feedback and Data Collec-tion Techniques in Software R&D: A Literature Review. pp. 139-153. Springer International Publishing (2015)
7. Cockburn, A., & Williams, L.: Agile Software Development: It's about Feedback and Change. Computer, 36 (2003) 0039-43
8. Bizer. Bizer C., Boncz P., Brodie M.L., Erling O.: The meaningful use of big data: Four perspectives--four challenges. 40, 56-60 (2012).
9. Fabijan, A., Olsson, H. H., Bosch, J.: Early Value Argumentation and Prediction: An Iterative Approach to Quantifying Feature Value. In: Product-Focused Software Process Improvement, pp. 16-23. Springer (2015)
10.Bosch‐Sijtsema P., Bosch J.: User involvement throughout the innova-tion process in High‐Tech industries. J.Prod.Innovation Manage. (2014).
11.Olsson H.H., Bosch J.: Post-deployment data collection in software-intensive embedded products. In: Continuous software engineering, pp. 143-154. Springer (2014).
12 Olsson H.H., Bosch J.: Towards data-driven product development: A multiple case study on post-deployment data usage in software-intensive embedded systems. In: Lean enterprise software and systems, pp. 152-164. Springer (2013).
132
138
13.Sommerville, I., Kotonya, G.: Requirements engineering: processes and techniques. John Wiley & Sons, Inca., (1998)
14.Sampson, S. E.: Ramifications of Monitoring Service Quality Through Passively Solicited Customer Feedback. In Decision Sciences Volume 27, Issue 4, pp 601-622, (1996)
15. Bosch, J.: Building Products as Innovations Experiment Systems. In Proceedings of 3rd International Conference on Software Business, June 18-20, Massachusetts, (2012)
16. Kohavi, R. Longbotham, R., Sommerfield, D., Henne, R. M.: Controlled experiments on the web: survey and practice guide, Data mining and knowledge discovery, pp. 140-181, (2009)
17. Aoyama M.: Persona-and-scenario based requirements engineering for software embedded in digital consumer products. pp. 85-94 (2005).
18. Saarijärvi H., Karjaluoto H., Kuusela H.: Customer relationship man-agement: The evolving role of customer data. 31, 584-600 (2013).
19. Atzori L., Iera A., Morabito G.: The internet of things: A survey. 54, 2787-2805 (2010).
20. 1. Rodríguez P., Haghighatkhah A., Lwakatare L.E., Teppola S., Su-omalainen T., Eskeli J., Karvonen T., Kuvaja P., Verner J.M., Oivo M.: Continuous deployment of software intensive products and services: A systematic mapping study. J.Syst.Software (2015).
21.Olsson, H. H., Alahyari, H., Bosch, J.: Climbing the “Stairway to Heav-en”, in Software Engineering and Advanced Applications (SEAA), 2012 38th EUROMICRO Conference on Software Engineering and Ad-vanced Applications, Izmir, Turkey (2012)
22.Runeson,P., Höst,M.: “Guidelines for conducting and reporting case study research in software engineering,” Empir. Softw. Eng., vol. 14, no. 2, pp. 131 – 164, (2008).
133132

138
13.Sommerville, I., Kotonya, G.: Requirements engineering: processes and techniques. John Wiley & Sons, Inca., (1998)
14.Sampson, S. E.: Ramifications of Monitoring Service Quality Through Passively Solicited Customer Feedback. In Decision Sciences Volume 27, Issue 4, pp 601-622, (1996)
15. Bosch, J.: Building Products as Innovations Experiment Systems. In Proceedings of 3rd International Conference on Software Business, June 18-20, Massachusetts, (2012)
16. Kohavi, R. Longbotham, R., Sommerfield, D., Henne, R. M.: Controlled experiments on the web: survey and practice guide, Data mining and knowledge discovery, pp. 140-181, (2009)
17. Aoyama M.: Persona-and-scenario based requirements engineering for software embedded in digital consumer products. pp. 85-94 (2005).
18. Saarijärvi H., Karjaluoto H., Kuusela H.: Customer relationship man-agement: The evolving role of customer data. 31, 584-600 (2013).
19. Atzori L., Iera A., Morabito G.: The internet of things: A survey. 54, 2787-2805 (2010).
20. 1. Rodríguez P., Haghighatkhah A., Lwakatare L.E., Teppola S., Su-omalainen T., Eskeli J., Karvonen T., Kuvaja P., Verner J.M., Oivo M.: Continuous deployment of software intensive products and services: A systematic mapping study. J.Syst.Software (2015).
21.Olsson, H. H., Alahyari, H., Bosch, J.: Climbing the “Stairway to Heav-en”, in Software Engineering and Advanced Applications (SEAA), 2012 38th EUROMICRO Conference on Software Engineering and Ad-vanced Applications, Izmir, Turkey (2012)
22.Runeson,P., Höst,M.: “Guidelines for conducting and reporting case study research in software engineering,” Empir. Softw. Eng., vol. 14, no. 2, pp. 131 – 164, (2008).
133133

134
134

135
PAPER [C]
Fabijan, A., Olsson, H.H. and Bosch, J. “Time to Say 'Good Bye': Feature Lifecycle”.
To appear in: Proceedings of the 42nd Euromicro Conference on Software Engineering and Advanced Applications, SEAA 2016. Limassol, Cyprus. (2016). © 2016 IEEE. Reprinted, with permission, from Aleksander Fabijan, Helena Holmström Olsson and Jan Bosch, Time to Say “Good Bye”: Feature Lifecycle, August 2016
135

136
136
137
Time to say ‘Good bye’: Feature Lifecycle
Aleksander Fabijan1, Helena Holmström Olsson1, Jan Bosch2
1 Malmö University, Faculty of Technology and Society, Nordenskiöldsgatan 1,
211 19 Malmö, Sweden {Aleksander.Fabijan, Helena.Holmstrom.Olsson}@mah.se
2 Chalmers University of Technology, Department of Computer Science & Engi-neering, Hörselgången 11, 412 96 Göteborg, Sweden
Abstract. With continuous deployment of software functionality, a constant flow of new features to products is enabled. Although new functionality has potential to deliver improvements and possibilities that were previously not available, it does not necessary generate business value. On the contrary, with fast and increasing system complexity that is associated with high operational costs, more waste than value risks to be created. Validating how much value a feature actually delivers, project how this value will change over time, and know when to remove the feature from the product are the challeng-es large software companies increasingly experience today. We pro-pose and study the concept of a software feature lifecycle from a value point of view, i.e. how companies track feature value through-out the feature lifecycle. The contribution of this paper is a model that illustrates how to determine (1) when to add the feature to a product, (2) how to track and (3) project the value of the feature dur-ing the lifecycle, and how to (4) identify when a feature is obsolete and should be removed from the product.
Keywords: customer feedback; feature lifecycle; value modelling.
1 Introduction
Starting with agile development [1] and evolving towards Con-tinuous Deployment [2], software companies seemingly improve existing functionality and deliver new features to products quicker than ever before. In this way, value is assumed to be generated to customers and users continuously with every update and deploy-
137
138
ment [2]. However, although companies are adopting techniques to validate the value of the features during development, shortly after and while they are being deployed [3], [4], [5], [6], [7], very little is known on how to track feature value over its lifetime and what ac-tions to perform when a feature no longer adds value to the prod-uct. As new software features are being introduced, existing products and features age and become over time less and less amenable to necessary adaptation and change [8], [9]. And by fulfilling the functional requirements of a new feature, certain costs are typically introduced to a system. Let it be higher maintenance cost or in-creased product complexity for the overall system, new functional-ity increases the complexity of managing and operating a product [10]. As a consequence, and what we explore in this paper, is that the value of the feature changes over time and, eventually, becomes negative. In that case, it is more beneficial for a company to re-move the feature from the system than to keep maintaining it. Based on the case study research in three large software companies, we study how feature value can be continuously validated during its lifetime and which actions to perform when the value that it de-livers reaches or falls under a certain threshold. We recognize that the value of the feature is not measured over time and that it is not unique for all stakeholders across the organization. The contribu-tion of this paper is a model that illustrates how to determine (1) when to add the feature to a product, (2) how to track and (3) pro-ject the value of the feature during its lifetime, and how to (4) iden-tify when a feature no longer adds value to the product and how it should be removed. The remainder of this paper proceeds as follows. In section II we present the background on product lifecycle and prior research on feature value. In III, we describe our case companies and the re-search methodology that we applied in this paper. In section IV, we present the findings of this study and their challenges, which we address in section V with the introduction of the feature lifecycle model. Finally, section VI discusses the conclusions and future work possibilities.
138
139
2 Background
In software development a feature is a component of additional functionality, additional to the core software. Typically, features are added incrementally, at various stages in the lifecycle, usually by different groups of developers [11]. Ongoing expansion or addition of new features in software prod-ucts, known also as feature creep or ‘featuritis’ , is a well seen pat-tern in software companies today, [12] [13], [14]. As new software features are being introduced, existing products and features age and become over time less and less amenable to necessary adapta-tion and change [8], [9]. Norman [15] recognized that software complexity increases as the square of the new features being intro-duced. Therefore, and in order to control the evolvement of a product and manage its development, we investigate product life-cycle management research literature.
Product Lifecycle Product Lifecycle Management is a business activity of managing, in the most effective way, the product all the way across its lifecy-cle [16]. It is a process that starts with the very first idea about the product and lasts all the way throughout development and until its retirement. Although it is mainly associated with engineering tasks, it also involves marketing, product portfolio management [17] and new product development [18] activities. A traditional product lifecycle consist of four stages i.e. the intro-duction, growth, maturity and decline [19]. In the introduction stage, the companies seek to build product awareness and identify the market and potential customers. The value hypotheses about the features are proposed and being tested with potential custom-ers, primarily with more qualitative feedback collection techniques such as interviews, focus groups and customer journeys [20]. During the growth, the companies strive for reaching a wider mar-ket share by expanding their products and introducing new func-tionality. Customer feedback is typically collected in prototyping sessions in which customers test the prototype, discuss it with the developers and user experience specialists. At the same time, the
139

140
initial hypothesis about product value are updated with new in-formation [20], [21]. When the product is in its mature stage, companies implement strategies to maintain the market share by e.g. promoting the dif-ferentiating functionality that attracts and locks the customers. And although the companies are aware that more than a half of the features that already exist in their products are never used [22], they increasingly invest into developing new functionality. This re-sults in a situation where many features attract similar amount of attention and receives an equal amount of R&D investments. As a result, more and more legacy exists in products, and companies spend increasing amounts of effort and resources for managing the product and maintaining it [8], [9]. The decline stage is where the cost and interest of investing into functionality that is not appreciated by the customers is being paid. At this time, companies are aware that functionality in the prod-ucts is costing more to be maintained as it delivers revenue and are forced to either reduce costs and continue to offer it, possibly to a loyal niche segment, or completely remove it from the portfolio [19], [17]. And although the companies are aware that some features, at some point in time, cost more than what they add in terms of value, they do not have the data to support this and to understand when this happens. Assessing of feature value is, so far, an ad-hoc process with limited traceability and poor tool support [23].
140

141
Feature Value Value from the customer point of view is an increasingly studied concept in the literature [24], [25], [26]. Porter’s [25] value chain framework, for example, analyzes value creation at the companies level that identifies the activities of the firm and then studies the economic implications of those activities. Hemilä et al. [26] divide the benefits of a product or a feature among four types, i.e. func-tional, economic, emotional and symbolic value. Functional feature value focuses on the functionality and offerings. Traditionally, value preposition was based on the functional fea-tures of product or services. Here, the value for the customer is e.g. new feature in the product or an improvement of the existing solu-tion. Economic feature value focuses on price. Here, customers are e.g. offered the product or service functionality under a lower price than before or compared to the competitor. Emotional feature value focuses on customer experience. The meanings of emotions and feelings have already been important in e.g. automotive indus-try [26]. Today, however, they are increasingly becoming impor-tant also in the service system value creation [26]. Symbolic feature value focuses on the meaning. In the last years, consumers increas-ingly prefer to purchase products that are produced from recycla-ble material or run on green energy. To measure, asses and visualize how much of value a feature deliv-ers over time, multiple approaches are seen in the literature. The single metric approach described by Roy [27] treats feature value as a weighted combination of objectives and is highly desired and recommended for situations with a clear strategy. A single metric forces tradeoffs to be made once for multiple goals and aligns the organization behind a clear objective [3]. On the other hand, and when there are multiple strategies in the company, Kaplan et al. [28] suggests a balanced scorecard approach. This approach is valuable when there are multiple objectives in the companies’ strat-egy and need to be fulfilled independently [29]. These objectives can then be linked back to organizational strategies using, for ex-ample, GQM+ concepts [30]. In this paper, however, we recognize that despite the awareness of the increasing system complexity, feature value is not being sys-tematically and continuously validated. This results in a situation
141

142
where features are never removed and start to have, after a certain time, a negative effect on the product. We propose a concept of ‘feature lifecycle’ to demonstrate how the value of a feature in con-nected products can be assessed over time in order to be more pro-active in conducting feature management decisions. The contribu-tion of this paper is a model that illustrates how to determine to add the feature to a product, how to track and project the value of the feature during the lifecycle, and how to identify when a feature is obsolete and should be removed from the product.
3 Research Method
This research builds on an ongoing work with three case compa-nies involved in large-scale development of software products and it was conducted between August 2015 and December 2015. For the purpose of this research, we selected the case study methodol-ogy as an empirical method [31]. Since research in software engi-neering is to a large extent a multidisciplinary area aimed to inves-tigate how development and maintenance of software features is conducted from a value point of view, we found the case study ap-proach appropriate for this research [31]. To objectively obtain the detailed information on how companies perceive feature lifecycles, track and validated feature value, a real world setting was re-quired. Based on experience from previous projects on how to advance in continuous validation of customer value [6], [4], we held three separate workshops with each of the companies individually. After the workshops, we performed an interview study in which we met with a total of 22 people from the companies involved in this study. We list the participants and their roles in Table 1 below.
142

143
Table 1. Description of the companies. Company and their domain Representatives
Company A is a provider of telecommunication systems
and equipment, communications networks and multime-
dia solutions for mobile and fixed network operators. The
company has approximately 25.000 Employees in R&D.
Participants marked with an asterisk (*) attended the
workshop and were not available for a follow up-
interview.
1 Product Owner
1 Product Manager
2 System Managers
2 Sftw. Engineers
1 Release Manager
1 Area Prod. Mng.*
1 Lean Coach*
1 Section Mng.*
Company B is a software company specializing in naviga-
tional information and optimization solutions. Company
B has approximately 3.000 Employees in R&D.
All workshop participants were interviewed.
1 Product Owner
1 System Architect
1 UX Designer
1 Service Manager
Company C is a manufacturer and supplier of transport
solutions construction technology and vehicles for com-
mercial use. The company has approximately 20.000 Em-
ployees in R&D.
All the participants that attended the workshop were in-
terviewed. In addition, a sales manager and one technol-
ogy specialist were interviewed.
1 Product Owner
2 Product Strategists
2 UX Managers
2 Function Owners
1 Feature Coord.
1 Sales Manager
2 Technology Spec.
Data Collection During the group workshops with the companies, we were always three researchers sharing the responsibility of asking questions and facilitating the group discussion. Notes were taken by two of the researches. After each of the workshops, the notes were consoli-dated and shared to the third researcher. We held semi-structured group interviews with open-ended ques-tions [31]. These questions were asked by one of the researcher while two of the researchers were taking notes. In addition to the workshops, we conducted 22 interviews that lasted one hour and were primarily recorded using an iPhone Memo recording app. In-
143

144
dividual Interviews were conducted and transcribed by one of the researchers. In total, we collected 13 pages of workshop notes, 138 pages of interview transcriptions, and 9 graphical illustrations from the interviewees. All workshops and individual interviews were conducted in English and lasted three and one hour respectively.
Data Analysis During analysis, the workshop notes, interview transcriptions and graphical illustrations were used when coding the data. The data collected were analyzed following the conventional qualitative con-tent analysis approach [32] where we derived the codes directly from the text data. This type of design is appropriate when striving to describe a phenomenon where existing theory or research litera-ture is limited. Two of the researchers first independently and then jointly analyzed the collected data and derived the final codes that were consolidated with the third and independent researcher who also participated at the workshops. For example, when the inter-viewee referred to value of the feature, we marked this text and la-belled it with a code ‘feature value’. Similarly, we labelled the re-mainder of our interview transcriptions. As soon as any questions or potential misunderstandings occurred, we verified the informa-tion with the other researcher and participating representatives from the companies.
Validity considerations Construct validity: We conducted two types of interviews. First, the group semi-structured interviews at the workshops and second, individual interviews with representatives working in several dif-ferent roles and companies. This enabled us to ask clarifying ques-tions, prevent misinterpretations, and study the phenomena from different angles. We combined the workshop interviews data with individual interviews. Two researchers, guaranteeing inter-rater re-liability, independently assessed the notes. And since this study builds on ongoing work on feature value tracking and validation throughout the product lifecycle, the overall expectations between the researchers and company representatives were aligned and well understood upfront. External validity: The results of the validation cannot directly translate to other companies. However, and since these companies
144

145
represent the current state of large-scale software development of embedded systems industry [6], [4] we believe that the results can be generalized to other large-scale software development compa-nies.
4 Findings
In this section, we present our empirical findings. In accordance with our research interests, we first outline the current state of as-sessing feature value throughout the feature lifecycle in our three case companies. Second, we list the challenges that are associated with these practices. We support each of the sections with illustra-tive quotes from our case companies.
Current State In the case companies the value of the features is being assessed unsystematically and ad-hoc. Consequently, features are added to the product when they are built and removed when the manage-ment assumes no one uses them. • Tracking of feature value: Our case companies collect cus-
tomer feedback as distinct points in the development cycle. They aggregate these data to build an understanding of feature value at feature prioritization time and after it is deployed in the field. However, and although various roles posses the par-tial data about individual values of the feature, they do not consolidate this information or monitor how it changes over time. As a consequence, and since every team looks at a differ-ent factor of the feature, the value differs throughout the or-ganization, teams and units. An objective measure of the value is thus never calculated, leaving the organizations with several different understandings of feature value for every factor that they analyze it for. This situation is illustrated in the following quotes:
145

146
“The problem is that I don’t really see all the counters explic-itly… I only see some specific parameters. It is not really all.” – System Manager from Company A.
• Adding features to products: Our case companies continu-ously develop new features for their products. To validate the prototypes and steer development, they extensively collect cus-tomer feedback from the customers, users of the product, and directly from the products. When the development is done, this success typically becomes celebrated with as early de-ployment to the customers as possible. “When things are working good, we are having a launching customer.” - System Architect from Company B
• Feature value is assessed ad-hoc: Initially validated value of the feature after its completion of development and deploy-ment is assumed to remain near constant throughout its lifecy-cle. The next time the value of the feature is assessed again is when a customer experiences a problem with the feature. “Normally we take the results that we see if we really deviate in one area, we hear it from customers.” - Product Strategists from Company C.
• Features are seldom removed from the products: Once the fea-tures are build and deployed to the customer, they typically stay in the product. This causes the companies an increase in complexity and expenses for operations of the product. “We could remove features. To remove the complexity! We are always increasing the complexity and that is a big prob-lem.” - System Manager from Company A.
Challenges Based on our interviews, we see that there are a number of chal-lenges associated with not being able to continuously asses feature value throughout its lifecycle. For example, our interviewees all re-port difficulties in identifying the value of the feature and using this information to identify the next actions, i.e. when to deploy the functionality or remove it from the system.
• Tracking and projecting feature value over time: Since there is
no traceability between one measurement of feature value and
146

147
the second one, knowing whether a new version of the feature is better or not is not intuitive. This situation is illustrated in the following quotes: “We get feature which is broken down and then this value somehow got lost when it was broken down.” – Software engineer from Company B. “I would like to be able to provide the sales force with more description of the actual features products benefits services in a simple speech, but also the quantitative figures, in what situation, what segment…”
- Sales manager from Company C.
• Identifying when it is valuable to deploy features: Although the principles of lean methodology stress early deployments and learnings, features should be deployed not when they are ready but when it is valuable to do so, i.e. when they will de-liver value greater than a certain threshold defined by the strategy. Since the traceability of feature value is limited, fea-tures in our case companies are deployed even though they don’t deliver enough value in that moment. We illustrate this situation in the following quote:
“It would be great if we could draw those possibilities on a whiteboard and get the percentage.” -Product Manager from Company A
• Identifying when to remove features from the product: Due to a lack of objectively assessing feature value and projecting it over time, it is very difficult for our case companies to know when the feature does not deliver any more value as it costs to have it in the product. Consequently, removing the features from the product is done unsystematically and with conse-quences. Moreover, our case companies report that features stay in the products even though they are aware that no one is using them, buying the product because of them, or serve any compliance purpose. This situation is illustrated in the follow-ing quotes:
147

148
“A developer wants to know if the code is being used so he knows if he or she can remove the code. How big the impact will be or what value should we set for that.” - Software Engineer from Company A
“Can we obsolete certain parts of the system that we maintain for backward compatibility reasons but maybe they are not used or maybe they can be replaced by something else?” - Service Manager from Company B “If we go 5 years back, we see that we have many features that have never been tested or used. It is a beauty contest.” - Product Owner from Company A
148

149
5 Feature Lifecycle Model
To assess feature value and model how to track it over its lifecycle, we first provide a feature value equation. Based on a single metric approach that consolidates multiple factors, this equation captures quantitative value for features in their lifetime. Second, we present the general feature lifecycle model as a function of value equation over a typical lifetime of a feature. Feature Value Equation Typically, companies initiate new feature development with a strategy decision. At this time, high-level requirements yield an idea about the feature purpose and what the net benefits will be for the company when this particular feature is in the product. We describe the calculation of feature value ‘V’ over time ‘t’ as a single metric approach and define it as a matrix product between value factors ‘F’, their relative weights ‘W’ and an interaction ma-trix ‘I’. We illustrate this with Equation 1 below.
𝑉(𝑡)𝑖×𝑖 = (𝐹(𝑡)𝑖×𝑗 ∙ 𝑊(𝑡)𝑗×𝑖) ∙ 𝐼𝑖×𝑖 Equation 1. The number of lines ‘i’ in factor Matrix ‘F’ equals to the number of features being assessed. Every line ‘i’ in matrix ‘F’ contains factors that relate to feature ‘i’. The number of columns ‘j’ equals to the number of these factors that constitute feature value. They origi-nate from the Key Performance Indicators (KPIs) and high-level strategy guidelines that are available within the organization, and need to be normalized Examples of these factors are capacity, sys-tem load, latency, net profit, market demand, feature usage, etc. Previous researchers abstract these factors and distinguish, as we describe above, between four different types: Functional, Eco-nomic, Emotional and Symbolic [26]. In our model, and in order to be aligned with the distinction, we recommend arranging related factors in matrix ‘F’ together (i.e. keeping columns that resemble functional value on the beginning of the matrix, followed by col-umns with factors that resemble economic, emotional and symbolic value).
149

150
Since not all of the factors are of equal importance, we weigh them with the corresponding column from matrix ‘W’. In each column in ‘W’, the weights represent the relative importance of each of the factors for a certain value. Although the weights can differ throughout the matrix ‘W’ (e.g. a certain factor can have more im-portance for one feature, and another factor for yet another fea-ture), the weights are required to be allocated in a normalized fash-ion. Consequently, the sum of values in every column in matrix ‘W’ equals to one. We name the third matrix to be the interaction matrix ‘I’, which takes into the consideration the interaction between new and exist-ing features in the product under development. Features are typi-cally developed and tested in isolation, or with a particular product use-case. However, when several features are added to a product, there may be interactions (i.e. behavioral modifications) between both the features already in the product, as well as with features in a related product. Adding a new feature which interacts with other, existing features implies more effort in the development and testing phases. And although the focus of this research is not to study how features interact with each other (for that see e.g. [11], [33]), we believe that the possibility to take the interaction into the calcula-tion of the feature value should exist. When the interaction is non-existent, i.e. between features that do not change the behavior of each other, the interaction matrix is an identity matrix (ones in the diagonal and zeroes elsewhere). On the other hand, when the in-teraction is recognized, the relative contribution between pairs of features increases from zero to the percentage detected in the inter-action. We provide an example calculation of feature value using Equation 1 for three features that do not interact with each-other on Fig 1. Fig. 1. An example calculation of feature value using Equation 1.
150

151
In this example, and by using standard matrix multiplication be-tween the factor matrix ‘F’ weight matrix W, the factor line ‘F11, F12, F13’ is multiplied with its relative importance column ‘W11, W21, Wi3’. The result is a square matrix multiplied with an inter-action matrix. The later in this particular case is an identity matrix as no interaction is assumed. The result is an array of values ‘V1, V2, V3’ for every feature. Should there be interaction between fea-tures, the final calculation would capture the proportion of the in-teraction in each of the values due to the matrix multiplication ef-fect.
Feature Lifecycle Model In this paper, we focus on how value of a feature changes over time and what actions can be taken at certain milestones. We illustrate an example lifecycle of a typical software feature on Figure 2 be-low. On the horizontal axis we list the most important milestones in a feature lifecycle i.e. feature development start – t0, first de-ployment – t1, adoption – t2, peak – t3, equilibrium – t4, removal optimum – t5 and finally, the removal of the feature – t6. On the vertical axis, we plot feature value over its lifecycle. Al-though illustrated as a parabolic arc for a better presentation, dot-ted lines around the descending curve on Figure 2 should remind the reader that in practice the value does not necessary increase or descend as an exact parabolic function of time. Time segments be-tween value changes can be shorter or longer, depending on practi-tioners’ development practices, feature feedback collection intensity etc. Consequently, the value of the function may alternate to a cer-tain extent within the segments, both due to the development prac-tices and natural variation of the collected data.
151

152
Fig. 2. Feature Lifecycle Model.
We describe the segments of the feature lifecycle model, which we label on Fig. 2 with A-E, in the paragraphs below.
A – Feature Infancy: In the early phases of pre-development, com-panies start to construct an understanding of what will the value of the feature constitute of. We label the time t0 to be the moment in time when feature first appears at the strategy level, where early hypotheses are being formed. During the period A, which lasts from the moment t0 until the feature is deployed to the first cus-tomer t1, companies collect qualitative customer feedback using customer journeys, interviews, questionnaires and survey forms to hypothesize what their customers’ needs are. At this stage, contex-tual information on the purpose of the feature with functional characteristics and means of use are typically collected by customer representatives. Typically, this information is used to form func-tional value requirements of the feature, which translate to factors ‘F’ in Equation 1. At the same time as the factors are defined, weights in ‘W’ are determined. For example, if the feature is facing the user, more weight might be assigned to usability, experience and similar factors. On the other hand, and if the feature being
152

153
modeled is satisfying a regulation, usability and experience receive less weight, which is instead assigned to i.e. compliancy. The development units in the company develop early prototypes of the feature and measure how close the realized product is in com-parison to the requirements. Since no customer is actually using the feature in this period A, no value for the company is generated (il-lustrated with a flat line on Fig. 2).
B - Feature Deployment: When a minimal feature instance is devel-oped to the extent that it can be validated, practitioners can deploy it to a test customer, and for the first time, asses how well their implementations realize the expectations in the field. Typically, at this moment companies would deploy the feature in a ‘silent mode’ to the customers to maintains integrity and activate it incremen-tally with the test customer. We label the point in time when the first real customers adopt the feature with t1. The feedback at this moment is typically mixed and needs to be quantified. Typically, it consists of both qualitative information on e.g. design decisions and quantitative operational data [20]. With new input, the values of the factors in matrix ‘F’ are continuously updated using the quantified customer input. As a result, practitioners get feedback on product behaviours and initial performance data that can be used to calculate the current value of the feature.
C – Feature Inflation: After the first deployment t1, customer adoption of the feature intensifies. Companies strive to provide marginal improvements that will differentiate them from the com-petitors. For this purpose, they continuously experiment with the customers to identify the version of the feature that delivers the most value. New iterations of the feature are continuously de-ployed and controlled A/B experiments can be performed to iden-tify the gain [20], [34]. Due to the approach in Equation 1 with a single metric that forces tradeoffs to be made once for multiple goals, companies are enabled to determine whether the incremental improvement actually delivers more value compared to the version before [3]. Again, and with new input, the values of the factors in matrix F need to be continuously updated using the customer feed-back. The feature development stops completely at the moment
153

154
when there is no statistical difference in feature value between se-quential iterative versions of the feature.
D – Feature Recession: Customers will typically stop paying for ex-isting features in favor of something newer and better. At a certain point in time, the value of the function will reach the peak, which we label on Fig.2 as t3. Finding the maximum of the value function is the goal of mathematical optimization. And since feature value is calculated on an ongoing basis, companies can store the historical values and use them for projection trends. By identifying the equa-tion of the curve using e.g. polynomial regression, practitioners can find the point when the value starts to steadily decline. The peak value t3 is the point where the first derivative of the regression function equals to zero and the second derivative is negative. From hereafter, the directional coefficient of the first derivative is nega-tive, projecting a decline of feature value. There may be several reasons for the value of a function to start steadily decreasing. Although the aim of this research is to confirm this phenomenon and not to address its causes, we name a few of them. Features age and occasionally lose their purpose over time. Customers might churn to the competitors or use existing alterna-tive functionality. Also, and since new features are increasingly be-ing introduced to the product, existing features get replaced or even interact negatively with the new ones [33]. Consequently, they cause increase in operational expenses [8], [9]. As an example of reducing system complexity and consequently, lowering the costs of the operation, companies might consider to start commoditizing and opening the features to a wider commu-nity [10]. By open-sourcing the features, resources are freed from maintenance and support. Consequently, and by lowering the op-erational costs, the derivative of the value function becomes less negative, which enables maintaining the value of the feature at a higher level for a longer time (the slope after t3 in Fig 2 is decreas-ing at a slower pace).
E – Feature Removal: Regardless of the restructuring and efforts made into reducing feature costs, the value of the feature essen-tially becomes equal to the costs of its operation and maintenance. We label this point in time on Fig. 2 as t4 - value equilibrium. Al-
154
155
though not yet costing, product management should already con-sider ways of removing this feature from the product. Ultimately, product managers should seek to identify any feature whose re-moval would have no impact on the value of the overall product. When the monetary value of the feature falls bellow the maintain-ing and supporting cost, as the feature presents a liability to the product and detracts the customers from other value-adding fea-tures. At this time, and until point in time t5, the cost of removal of the feature is lower or equal to the operational costs of the fea-ture. The point t5 is the point in time where the cost of removal a feature is lower as the interest the company will pay by not remov-ing the feature after this time.
155

156
6 Discussion
Ongoing expansion and addition of new features in software prod-ucts, is a well seen pattern in software companies today [12] [13], [14]. With many new features being introduced on a continuous basis, existing features age and become over time less and less amenable to necessary adaptation and change [8], [9]. And al-though the companies are aware that some features, at some point in time, cost more than what they add in terms of value, they do not have the data to support this and to understand when this happens. Assessing feature value has, so far, been an ad-hoc proc-ess with limited traceability and poor tool support [23]. As a con-sequence, companies do not deploy features when they deliver value or remove them from the product when they stop being valu-able. In response to the challenges and implications presented above, we suggest the feature lifecycle model. There, we illustrate how feature value can be defined as a linear combination of factors and weights and validated over time. This helps companies in knowing when to deploy a feature or remove it from a product. In particular, the model helps companies with:
1. Validating feature value over time: The single metric approach
in our value equation is a compact method of combining fea-ture factors that constitute the value of the feature with their weights. In particular, this approach allows that there might be several variables that constitute feature value (factors), each with a different importance (weight). Moreover, the model combines in a single metric weights and factors for multiple features, taking into consideration the possibilities with alter-nating weights and feature interaction. As a result, the equa-tion yields feature value as numbers which are effortless to compare in-between. This is especially useful in situations when smaller increments of the feature are being tested and product management requires fast-feedback whether the new increment actually delivers more value in comparison to the old versions of the feature.
2. Projecting feature value over time: By accumulating feature value that was calculated using our model, practitioners are
156

157
enabled to use the data to project future trends. For this, sev-eral supervised machine learning algorithms can be used. Polynomial regressions, which we mention in our paper is one of them. Essentially, the projection of feature value can both help companies to better plan their resources for possible fea-ture maintenance or removal, as well as to better estimate the future gain or loss of value.
3. Deploying features when it is valuable to do so: With a clear calculation of feature value using a single metric, companies can deploy features when they deliver the value, instead of when they are developed. Our model suggests the deployment in a ‘silent mode’ to allow for a timely validation with test cus-tomers and revealing the feature to other customers only when its value is above a threshold defined by the strategy. By pro-jecting feature value over time, the practitioners are better aware how they are progressing and which factors require more attention.
4. Removing features from the product: The feature lifecycle model raises awareness about software features and changes the perception about their lifecycle. It illustrates that the value of the feature not only drops over time, but also becomes negative. The model helps practitioners to identify when the equilibrium will change to imbalance, costing the product and organization. In particular, it enables practitioners to plan the removal before the negative value of the feature costs more than the actual process of removing the feature.
157

158
6 Conclusions and Future Work
With continuous deployment of software features, a constant flow of new features to products is enabled. As a result, and with fast and increasing system complexity that is associated with high op-erational costs, more waste than value risks to be created over time. To help companies asses feature value throughout the lifecycle, and to avoid situations with features in products with negative impact, we propose and study the concept of a software feature lifecycle from a value point of view. Based on the three case companies, we demonstrate how to track feature value throughout its lifecycle. The contribution of this paper is a model that illustrates a feature lifecycle. It helps companies to determine (1) when to add a feature to the product, (2) how to track and (3) project the value of the feature during the lifecycle, and how to (4) identify when a feature is obsolete and should be removed from the product. In future work, we intend to (I) detail the feature lifecycle model by studying the differences in feature value between distinct types of features (e.g. commodity features vs. innovative features), and (II) validate our feature lifecycle model in other software intensive companies.
6 References
[1] R. C. Martin, Agile Software Development, Principles, Patterns, and
Practices. 2002.
[2] P. Rodríguez, A. Haghighatkhah, L. E. Lwakatare, S. Teppola, T.
Suomalainen, J. Eskeli, T. Karvonen, P. Kuvaja, J. M. Verner, and M.
Oivo, “Continuous Deployment of Software Intensive Products and
Services: A Systematic Mapping Study,” J. Syst. Softw., 2015.
[3] R. Kohavi, R. Longbotham, D. Sommerfield, and R. M. Henne,
“Controlled experiments on the web: Survey and practical guide,” Data
Min. Knowl. Discov., vol. 18, pp. 140–181, 2009.
[4] A. Fabijan, H. H. Olsson, and J. Bosch, “Early Value Argumentation
and Prediction: An Iterative Approach to Quantifying Feature Value,” in
158

159
Product-Focused Software Process Improvement - Proceedings of the
16th International Conference on Product-Focused Software Process
Improvement (PROFES 2015), Bolzano, Italy, December 2-4, 2015,
2015, vol. LNCS 9459, pp. 16–23.
[5] F. Fagerholm, H. Mäenpää, and J. Münch, “Building Blocks for
Continuous Experimentation Categories and Subject Descriptors,” pp.
26–35, 2014.
[6] H. H. Olsson and J. Bosch, “Towards Continuous Customer Validation :
A conceptual model for combining qualitative customer feedback with
quantitative customer observation,” LNBIP, vol. 210, pp. 154–166,
2015.
[7] E. Ries, The Lean Startup: How Today’s Entrepreneurs Use Continuous
Innovation to Create Radically Successful Businesses. 2011.
[8] D. L. Parnas, “Software aging,” 16th Int. Conf. Softw. Eng., pp. 279–
287, 1994.
[9] D. E. Perry and A. L. Wolf, “Foundations for the study of software
architecture,” ACM SIGSOFT Softw. Eng. Notes, vol. 17, no. 4, pp. 40–
52, 1992.
[10] J. Bosch, “Achieving Simplicity with the Three-Layer Product Model,”
Computer (Long. Beach. Calif)., vol. 46, no. 11, pp. 34–39, Nov. 2013.
[11] M. Calder, M. Kolberg, E. H. Magill, and S. Reiff-Marganiec, “Feature
interaction: A critical review and considered forecast,” Computer
Networks, vol. 41, no. 1. pp. 115–141, 2003.
[12] J. M. Sullivan, “Impediments to and Incentives for Automation in the
Air Force,” in Proceedings of ISTAS 2005, International Symposium on
Technology and Society. Weapons and Wires: Prevention and Safety in a
Time of Fear, 2005, pp. 102–110.
[13] E. Lindgren and J. Münch, “Software development as an experiment
system: A qualitative survey on the state of the practice,” in Lecture
Notes in Business Information Processing, 2015, vol. 212, pp. 117–128.
[14] H. H. Olsson, H. Alahyari, and J. Bosch, “Climbing the ‘Stairway to
heaven’ - A mulitiple-case study exploring barriers in the transition from
agile development towards continuous deployment of software,” in
159

160
Proceedings - 38th EUROMICRO Conference on Software Engineering
and Advanced Applications, SEAA 2012, 2012, pp. 392–399.
[15] D. A. Norman, The Design of Everyday Things, vol. 16, no. 4. 2002.
[16] J. Stark, Product Lifecycle Management. Cham: Springer International
Publishing, 2015.
[17] R. G. Cooper, S. J. Edgett, and E. J. Kleinschmidt, “New product
portfolio management: practices and performance,” J. Prod. Innov.
Manag., vol. 16, no. 4, pp. 333–351, 1999.
[18] D. Leonard-Barton, “Core capabilities and core rigidities: A paradox in
managing new product development,” Strateg. Manag. J., vol. 13, pp.
111–125, 1992.
[19] L. Gorchels, The Product Manager’s Handbook. McGraw Hill
Professional, 2000.
[20] A. Fabijan, H. H. Olsson, and J. Bosch, “Customer Feedback and Data
Collection Techniques in Software R&D: A Literature Review,” in
Software Business, ICSOB 2015, 2015, vol. 210, pp. 139–153.
[21] S. E. Sampson, “Ramifications of Monitoring Service Quality Through
Passively Solicited Customer Feedback,” Decis. Sci., vol. 27, no. 4, pp.
601–622, 1996.
[22] D. Cohen, G. Larson, and B. Ware, “Improving software investments
through requirements validation,” Proc. 26th Annu. NASA Goddard
Softw. Eng. Work., pp. 106–114, 2001.
[23] A. Fabijan, H. H. Olsson, and J. Bosch, “The Lack of Sharing of
Customer Data in Large Software Organizations: Challenges and
Implications,” in Agile Processes, in Software Engineering, and Extreme
Programming, 2016, pp. 39–52.
[24] A. F. Payne, K. Storbacka, and P. Frow, “Managing the co-creation of
value,” J. Acad. Mark. Sci., vol. 36, no. 1, pp. 83–96, 2008.
[25] M. E. Porter, “Competitive Advantage,” Strategic Management, vol.
May-June. pp. 1–580, 1985.
[26] J. Hemilä, J. Vilko, E. Kallionpää, and J. Rantala, “Value creation in
product-service supply networks,” in The Proceedings of 19th
International Symposium on Logistics (ISL 2014), 6.-9.7.2014., Ho Chi
Minh City, Vietnam, Nottingham University Business School, 2014, pp.
160
161
168–175.
[27] R. Roy, “Design of Experiments Using the Taguchi Approach.pdf,”
Technometrics, vol. 44, no. 3. pp. 289–289, 2001.
[28] R. S. Kaplan and D. P. Norton, “The Balanced Scorecard: Translating
Strategy Into Action,” Harvard Business School Press. pp. 1–311, 1996.
[29] J. S. Pinegar, “What Customers Want: Using Outcome-Driven
Innovation to Create Breakthrough Products and Services by Anthony
W. Ulwick,” J. Prod. Innov. Manag., vol. 23, no. 5, pp. 464–466, 2006.
[30] V. Basili, J. Heidrich, M. Lindvall, J. Münch, M. Regardie, and A.
Trendowicz, “GQM+Strategies - Aligning business strategies with
software measurement,” in Proceedings - 1st International Symposium
on Empirical Software Engineering and Measurement, ESEM 2007,
2007, pp. 488–490.
[31] P. Runeson and M. Höst, “Guidelines for conducting and reporting case
study research in software engineering,” Empir. Softw. Eng., vol. 14, no.
2, pp. 131 – 164, 2008.
[32] H.-F. Hsieh and S. E. Shannon, “Three approaches to qualitative content
analysis.,” Qual. Health Res., vol. 15, no. 9, pp. 1277–88, Nov. 2005.
[33] M. Jackson and M. Pamela Zave, “Distributed feature composition: A
virtual architecture for telecommunications services,” IEEE Trans. Softw.
Eng., vol. 24, no. 10, pp. 831–847, 1998.
[34] P. Bosch-Sijtsema and J. Bosch, “User Involvement throughout the
Innovation Process in High-Tech Industries,” J. Prod. Innov. Manag.,
vol. 32, no. 5, pp. 1–36, 2014.
161

162
162

163
PAPER [D]
Fabijan, A., Olsson, H.H. and Bosch, J. “Commodity Eats Innovation for Breakfast: A Model for Differentiating Fea-ture Realisation”.
Shorter version of this paper to appear in: Proceedings of the 17th International Conference on Product-Focused Software Process Improvement. Trondheim, Norway. (2016).
163

164
164
165
Commodity Eats Innovation for Breakfast: A Model for Differentiating Feature Realization
Aleksander Fabijan1, Helena Holmström Olsson1, Jan Bosch2
1 Malmö University, Faculty of Technology and Society, Nordenskiöldsgatan 1,
211 19 Malmö, Sweden {Aleksander.Fabijan, Helena.Holmstrom.Olsson}@mah.se
2 Chalmers University of Technology, Department of Computer Science & Engi-neering, Hörselgången 11, 412 96 Göteborg, Sweden
Abstract. Once supporting the electrical and mechanical functionali-ty, software today became the main competitive advantage in prod-ucts. However, in the companies that we study, the way in which software features are developed still reflects the traditional ‘require-ments over the wall’ approach. As a consequence, individual de-partments prioritize what they believe is the most important and are unable to identify which features are regularly used – ‘flow’, there to be bought – ‘wow’, differentiating and that add value to customers, or which are regarded commodity. In this paper, and based on case study research in three large software-intensive companies, we (1) provide empirical evidence that companies do not distinguish be-tween different types of features, which causes poor allocation of R&D efforts and suppresses innovation, and (2) develop a model in which we depict the activities for differentiating and working with different types of features and stakeholders. With this model, com-panies can develop only the amount of feature that is required for commoditized functionality and, on the other hand, maximize their investments in innovative features that will deliver the most value.
Keywords: Customer feedback, innovation, commodity, wow fea-ture, flow feature, duty feature, checkbox feature
165

166
1 Introduction
The amount of software in products is rapidly increasing. At first, software functionality was predominately required in order to sup-port tangible electrical, hardware and mechanical solutions with-out delivering any other perceptible value for the customers. Or-ganizations developed the software as a necessary cost, leaving the prioritization part to the responsible engineering, hardware and mechanical departments, without exploring the value of software features as such [1]. Today, systems that used to be isolated sys-tems with hardware-only components such as e.g. cars and house-hold appliances, contain functionality that allows them to connect to the Internet, exchange information and even self-improve over time. Software functionality is rapidly becoming the main competi-tive advantage of the product, and what delivers value to the cus-tomers [2]. However, the way in which software features are being developed, and how they are prioritized is still a challenge for most organizations. Often, and due to immaturity and lack of experience in software development, companies treat software features simi-larly to electronics or mechanics components, with the risk of be-ing unable to identify what features are differentiating and that add value to customers, and what features are regarded commodity by customers. As a consequence individual departments continue to prioritize what they find the most important and miss the opportu-nities to minimize and share the investments into commodity fea-tures [3], [4]. In this paper, we explore how large software-intensive companies invest in the development activities for different types of features. Our findings show that companies do not distinguish between commodity, differentiating and innovative features. This leads to a situation where companies invest the majority of software R&D resources in commodity functionality. What we would like to see is a situation in which companies devote less effort and investment in commodity and instead allocate R&D efforts to what differentiates
166

167
them from competitors. We identify that the lack of distinguishing between different types of features is the primary reason for ineffi-cient resource allocation that, in the end, make innovation initia-tives suffer. The contribution of the paper is twofold. First, we give guidelines on how to distinguish between different types of features that are being developed and we provide empirical evidence on the chal-lenges and implications involved in this. Second, we present a con-ceptual model to guide practitioners in prioritizing the develop-ment activities for each of the feature types. With this model, com-panies can develop only the amount of feature that is required for commoditized functionality and, on the other hand, free the re-sources to maximize their investments in innovative features that will deliver the most value. The remainder of this paper is organized as follows. In section 2, we present the background and the motivation for this study. In section 3, we describe our research method and case companies in-volved in this study. We list our empirical findings in section 4. In section 5, we present our model for feature differentiation and dis-cuss how it addresses the challenges identified in our case compa-nies in section 6. Finally, we conclude the paper in section 7.
2 Background
In most companies, customer feedback is collected on a frequent basis in order to learn about how customers use products, what features they appreciate and what functionality they would like to see in new products [5]. Typically, a wide range of different tech-niques is used to collect this feedback, spanning from qualitative techniques capturing customer experiences and behaviors [5], [6], [7], to quantitative techniques capturing product performance and operation [8], [7].
167

168
The number of requests and ideas that originate from this feedback often outnumbers available engineering resources and prevents companies from realizing all of them [9]. Rigorous steps that a typical software feature goes through require investments in limited development, testing, validation and other resources and activities. And to help practitioners control the information overload origi-nating from customer feedback, Knauss et al. [10] propose a feed-back-centric requirements approach, together with a tool that elic-its the most important information. Recently, Johansson et al., [11] stressed the importance of complementing the qualitative customer feedback with quantitative input by showing its implications on the product managers prioritization decisions. Moreover, and in order to further develop only those requirements that will deliver the most business value, various prioritization techniques have been introduced in requirement engineering and product development literature. Priority Groups Method [12] for example, is among the most tradi-tional classification techniques for ranking requirements in catego-ries, typically in three types of importance: high for mission critical importance, medium for supporting necessary, and low for ‘nice to have’. Binary Search Tree [12], Planning Game [13], 100 Points Method [14], ACH [15] and their combinations are examples of non-grouping techniques that provide a ranked list of requirements according to user preferences. One of the limitations of the techniques listed above is that they do not consider market factors such as the availability of the features being assessed in competitors products [16]. The Dual Questioning Technique addresses this challenge by first asking the consumers which features they consider important and then identifying how they perceive this feature as differing among the competitors’ products [16]. However, and although prioritization can be im-proved using this technique or its hybrid variations, very little is known on how to prioritize the development activities for different types of features.
168

169
To recognize the importance of distinguishing between different types of functionality from a complexity point of view, Bosch [17] developed the ‘Three Layer Product Model’. The model provides a high-level understanding of the three different layers of features, i.e. commodity, differentiating and innovative, however, does not give guidance on how to distinguish between the different types, neither which activities to invest into for each of them. We present the model as the foundation for our research in detail below. 2.1 The Three-layer product model (3LPM) The ‘Three Layer Product Model’ (3LPM) was developed with the aim to help companies understand the complexity of different fea-ture types and layers of functionality in their products [17]. While its original purpose is to reduce this architectural complexity, it recognizes the importance of distinguishing between different types of functionality. In our view, this distinction is equally helpful in order for companies to better understand what features are key dif-ferentiators and that add value to customers, and what features are regarded commodity and that are taken for granted by customers. With such an understanding, companies can improve feature pri-oritization and R&D allocation. The model distinguishes between three types of functionality lay-ers, i.e. commoditized, differentiating and innovative functionality.
• Commoditized functionality: This layer comprises func-tionality necessary for system operation that customers take for granted. It often combines proprietary software with commercial and open source software solutions.
• Differentiating functionality: The middle layer of the model comprises functionality that differentiates the product from its competitors and also appeals to customers. A product’s market success or failure results from the functionality that resides on this layer. The development teams responsible for the differentiating functionality layer are the ones that continuously add new value to the product.
169

170
• Innovation and experimental functionality: In this layer, innovative functionality is developed either by internal de-velopment or by collaborating with external partners. Functionality in this layer can provide significant value and ultimately differentiate a system or product from its com-petitors. Such activities could involve creating new product features requested by a lead customers or lead users [18] or conducting trials for extending existing functionality into new markets.
Fig. 1. The Three-layer product model [17].
However, and although the Three-layer product model emphasizes the need to distinguish between different types of features, we see that the prioritization of development activities in agile develop-ment is mostly based on the business value [6]. That is, the highest priority features get implemented early so that most business value is realized. However, using business value, which is often focused on time-to-market as the primary criterion for requirements priori-tization, may cause problems. For example, it may cause issues with architectural scalability by building a system that is unable to accommodate requirements that may appear secondary at the be-ginning of the project, but become critical for operational success in the future [19]. And although there are techniques that take other, e.g. market factors into account when prioritizing features,
170
171
there is a need of better distinguishing between different types of functionality and identifying methods to treat them separately from the beginning of development. In this way, development resources can be redirected towards innovative functionality instead of being equally distributed to, e.g. commoditized functionality that is taken for granted by the customer.
3 Research Method
This research builds on an ongoing work with three case compa-nies involved in large-scale development of software products and it was conducted between August- December 2015. The companies that participated in this research started and developed their busi-ness as a mechanical or electrical company. Throughout the last years, however, they transitioned away from developing the me-chanical and electrical functionality as their main focus. Today, they are becoming mature software companies with agile practices integrated in their daily work. And by selecting the case study methodology [20], we could investigate their software development practices in real world setting. In the context of this research, we conducted three individual workshops with the case companies involved in this research. And to better understand and study the development practices from several angles, we held individual in-depth interviews with the company participants shortly after each of the workshops. In total, we held twenty-two interviews that lasted one hour in average. We provide the complete list of participants and their roles in Table 1.
171

172
Table 1. Description of the companies and the representatives.
Company and their domain Representatives
Company A is a provider of telecommunication systems
and equipment, communications networks and multimedia
solutions for mobile and fixed network operators. The
company has several sites and for the purpose of this study,
we collaborated with representatives from one company
site.
The participants marked with an asterisk (*) attended the
workshop and were not available for a follow up-interview.
1 Product Owner
1 Product Manager
2 System Managers
2 Software Engineer
1 Release Manager
1 Area Prod. Mng.*
1 Lean Coach*
1 Section Mng.*
Company B is a software company specializing in naviga-
tional information, operations management and optimiza-
tion solutions.
All the participants attended the workshop and were inter-
viewed.
1 Product Owner
1 System Architect
1 UX Designer
1 Service Manager
Company C is a manufacturer and supplier of transport
solutions, construction technology and vehicles for com-
mercial use.
All the participants that attended the workshop were inter-
viewed. In addition, one sales manager and one technology
specialist wished to join the project at a later stage, and
were interviewed.
1 Product Owner
2 Product Strategists
2 UX Managers
2 Function Owners
1 Feature Coord.
1 Sales Manager
2 Technology Spec.
3.1 Data Collection During the group workshops with the companies, we were always three researchers sharing the responsibility of asking questions and facilitating the group discussion. Notes were taken by two of the researches and after each workshop, these notes were consolidated and shared to the third researcher and company representatives.
172

173
First, we conducted a workshop at each of the companies. Second, we held semi-structured group interviews with open-ended ques-tions [20]. These questions were asked by on of the researcher while two of the researchers were taking notes. In addition to the workshops, we conducted twenty-two interviews that lasted one hour and were primarily recorded using an iPhone Memo re-cording app. Individual Interviews were conducted and transcribed by one of the researchers. In total, we collected 13 pages of work-shop notes, 138 pages of interview transcriptions, and 9 graphical illustrations from the interviewees. All workshops and individual interviews were conducted in English and lasted three and one hour respectively. 3.2 Data Analysis During analysis, the workshop notes, post-it notes, interview tran-scriptions and graphical illustrations were used when coding the data. The data collected were analyzed following the conventional qualitative content analysis approach [22] where we derived the codes directly from the text data. Two of the researchers first inde-pendently and then jointly analyzed the collected data and derived the final codes that were consolidated with the third and independ-ent researcher. As soon as any questions or potential misunder-standings occurred, we verified the information with the other re-searcher and participating representatives from the companies. 3.3 Validity considerations To improve the study’s construct validity, we conducted semi-structured interviews at the workshops with representatives work-ing in several different roles and companies. This enabled us to ask clarifying questions, prevent misinterpretations, and study the phe-nomena from different angles. Next, we combined the workshop interviews with individual interviews. The notes were independ-ently assessed by two researchers, guaranteeing inter-rater reliabil-
173
174
ity. Since this study builds on an ongoing work, the overall expec-tations between the stakeholders were aligned and well under-stood. Our results cannot directly translate to other companies. However, considering external validity, and since these companies represent the current state of large-scale software development of embedded systems industry, we believe that the results can be generalized to other large-scale software development companies. Specifically, the results of this research are valid for companies that have transi-tioned or are transitioning from mechanical or electrical towards software focused companies.
4 Findings
In this section, we present our empirical findings. We performed an exploratory case study in which we, we were interested in (1) iden-tifying how companies differentiate between different types of fea-tures and (2) how they prioritize the development activities with respect to the type of the feature that they are developing. First, to understand the current development practices in our case companies to identify the type and the extent of the feature that they are developing, we outline the current customer data collec-tion practices in the three case companies. We recognize that the practices to collect customer data do not differ with respect to the feature being developed, but rather depend on the perceived need of information ad-hoc. Next, we identify the challenges that are as-sociated with distinguishing between the different feature types. Fi-nally, we explore their implications. 4.1 Feature Realization: Current State of Feature Differentiation In the case companies, products and features that are being devel-oped are handed over from one development stage to another, to-gether with their requirements and priorities. Although our case
174

175
companies acknowledge that they are aware of the different types of features, i.e. commodity, differentiating and innovative, this in-formation does not get communicated in the hand over process. The differentiation strategy is unclear to the practitioners develop-ing the features. And as a consequence, setting the development in-vestment level for a feature does not vary with respect to the type of the feature, allowing the prioritization strategy to be in favour of commodity features. We illustrate and describe the current state with description and quotes from our case companies in Table 2.
175
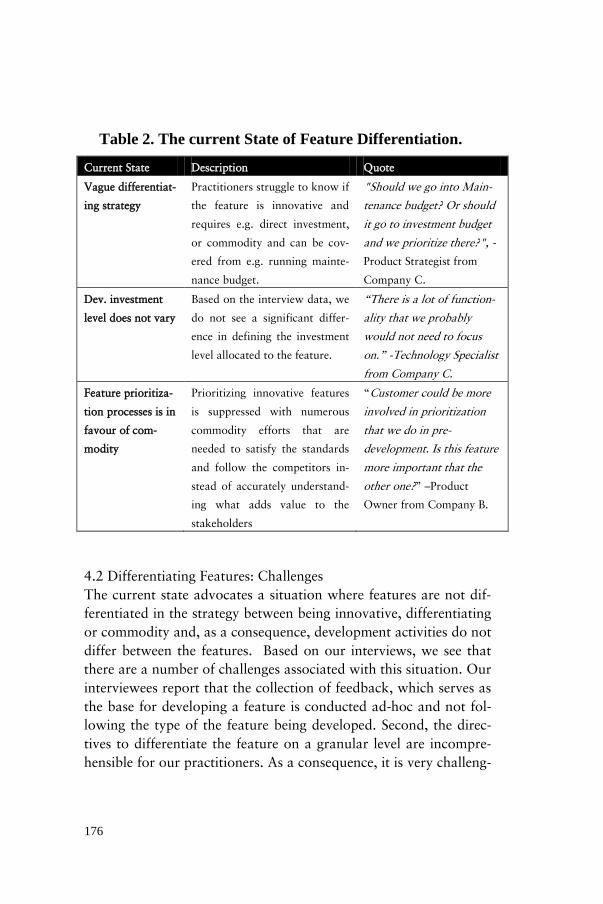
176
Table 2. The current State of Feature Differentiation.
Current State Description Quote
Vague differentiat-
ing strategy
Practitioners struggle to know if
the feature is innovative and
requires e.g. direct investment,
or commodity and can be cov-
ered from e.g. running mainte-
nance budget.
"Should we go into Main-
tenance budget? Or should
it go to investment budget
and we prioritize there?", -
Product Strategist from
Company C.
Dev. investment
level does not vary
Based on the interview data, we
do not see a significant differ-
ence in defining the investment
level allocated to the feature.
“There is a lot of function-
ality that we probably
would not need to focus
on.” -Technology Specialist
from Company C.
Feature prioritiza-
tion processes is in
favour of com-
modity
Prioritizing innovative features
is suppressed with numerous
commodity efforts that are
needed to satisfy the standards
and follow the competitors in-
stead of accurately understand-
ing what adds value to the
stakeholders
“Customer could be more
involved in prioritization
that we do in pre-
development. Is this feature
more important that the
other one?” –Product
Owner from Company B.
4.2 Differentiating Features: Challenges The current state advocates a situation where features are not dif-ferentiated in the strategy between being innovative, differentiating or commodity and, as a consequence, development activities do not differ between the features. Based on our interviews, we see that there are a number of challenges associated with this situation. Our interviewees report that the collection of feedback, which serves as the base for developing a feature is conducted ad-hoc and not fol-lowing the type of the feature being developed. Second, the direc-tives to differentiate the feature on a granular level are incompre-hensible for our practitioners. As a consequence, it is very challeng-
176
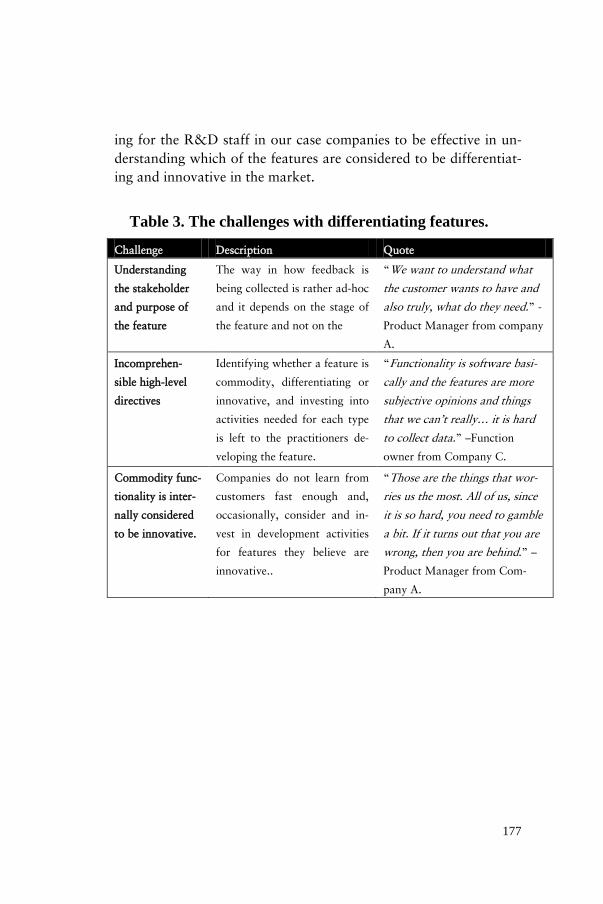
177
ing for the R&D staff in our case companies to be effective in un-derstanding which of the features are considered to be differentiat-ing and innovative in the market.
Table 3. The challenges with differentiating features.
Challenge Description Quote
Understanding
the stakeholder
and purpose of
the feature
The way in how feedback is
being collected is rather ad-hoc
and it depends on the stage of
the feature and not on the
“We want to understand what
the customer wants to have and
also truly, what do they need.” -
Product Manager from company
A.
Incomprehen-
sible high-level
directives
Identifying whether a feature is
commodity, differentiating or
innovative, and investing into
activities needed for each type
is left to the practitioners de-
veloping the feature.
“Functionality is software basi-
cally and the features are more
subjective opinions and things
that we can’t really… it is hard
to collect data.” –Function
owner from Company C.
Commodity func-
tionality is inter-
nally considered
to be innovative.
Companies do not learn from
customers fast enough and,
occasionally, consider and in-
vest in development activities
for features they believe are
innovative..
“Those are the things that wor-
ries us the most. All of us, since
it is so hard, you need to gamble
a bit. If it turns out that you are
wrong, then you are behind.” –
Product Manager from Com-
pany A.
177

178
4.3 Feature Realization: Implications Due to an unclear differentiating strategy, our case companies ex-perience a number of implications during the development process of a feature. The companies consider the stakeholders that the fea-tures are being developed for as a uniform group and not differen-tiating the development extent of the features based on the type of the feature and stakeholder. This leads to a situation where re-sources are used in developing and optimizing the features that might never get used by a customer to a similar extent as the ones that are regularly utilized. As a consequence, commodity sup-presses resources that could be better used to develop features in the innovation layer.
178
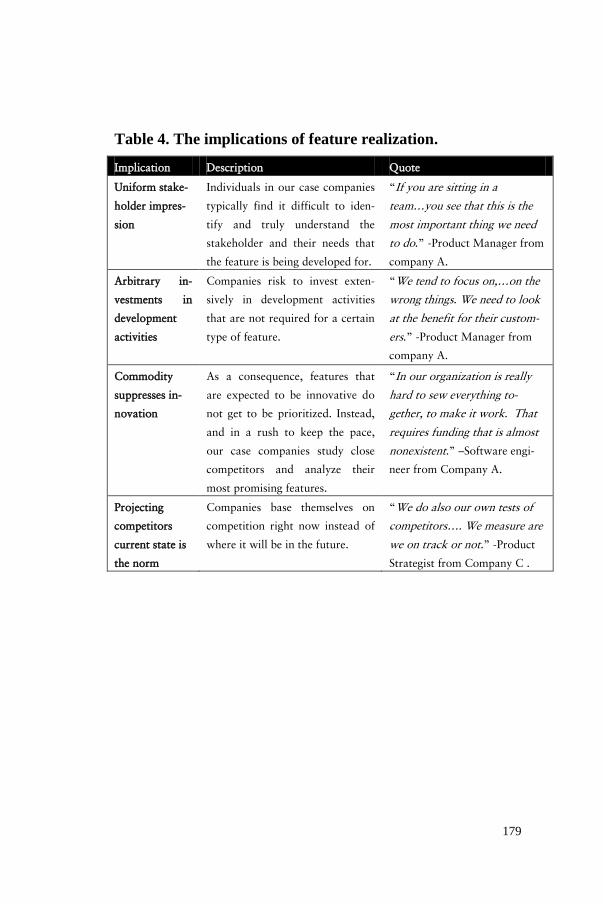
179
Table 4. The implications of feature realization.
Implication Description Quote
Uniform stake-
holder impres-
sion
Individuals in our case companies
typically find it difficult to iden-
tify and truly understand the
stakeholder and their needs that
the feature is being developed for.
“If you are sitting in a
team…you see that this is the
most important thing we need
to do.” -Product Manager from
company A.
Arbitrary in-
vestments in
development
activities
Companies risk to invest exten-
sively in development activities
that are not required for a certain
type of feature.
“We tend to focus on,…on the
wrong things. We need to look
at the benefit for their custom-
ers.” -Product Manager from
company A.
Commodity
suppresses in-
novation
As a consequence, features that
are expected to be innovative do
not get to be prioritized. Instead,
and in a rush to keep the pace,
our case companies study close
competitors and analyze their
most promising features.
“In our organization is really
hard to sew everything to-
gether, to make it work. That
requires funding that is almost
nonexistent.” –Software engi-
neer from Company A.
Projecting
competitors
current state is
the norm
Companies base themselves on
competition right now instead of
where it will be in the future.
“We do also our own tests of
competitors…. We measure are
we on track or not.” -Product
Strategist from Company C .
179

180
4.4 Feature Realization: Summary We map the challenges with their implications for the companies and the features they develop, and summarize them in Table 5.
Table 5. The implications of feature realization.
Current state Challenges Implications
Vague differentiating
strategy
Understanding the stake-
holder and purpose of the
feature
Stakeholders treated uni-
formly, not reflecting their
differing business value
Dev. investment level
does not vary be-
tween features
Incomprehensible high-level
directives
Arbitrary investments in
development activities
Feature prioritization
processes is in favour
of commodity
Commodity functionality is
internally considered to be
innovative
Commodity suppresses in-
novation
Projecting competitors cur-
rent state is the norm
5 The Feature Differentiation Model
In response to the empirical data from our case companies, com-bined with the findings and the implications that we presented above, we expand the 3LPM model to a new dimension and pre-sent our model for feature differentiation in the following section. The contribution of our model is twofold. First, we provide four different categories of features and their characteristics in order to give practitioners an ability to better differentiate features early in the development cycle. Second, and as a guidance for practitioners after classifying a feature, we provide a summary of development activities for every type of feature. Practitioners can use the guid-ance in prioritizing the development activities for the features that they are developing. With this model, companies can develop only the amount of feature that is required for commoditized function-ality and, on the other hand, free the resources to maximize their investments in innovative features that will deliver the most value.
180
181
5.1 Differentiating Characteristics of New Feature Development Our model advocates an approach in which four fundamentally different types of features are being developed. We name them “duty”, “wow”, “checkbox” and “flow” types of features. With “duty”, we label the type of features that are needed in the prod-ucts due to a policy or regulation requirement. “Checkbox” fea-tures are the features that companies need to provide in order to be on par with the competition that provides similar functionality. With “wow”, we label the differentiating features that are the de-ciding factor for buying a product. Finally, and with “flow”, we label the features in the product that are regularly used. We depict the four types of features on Figure 2, where we place each of the types in relation to the 3LPM commodity-differentiating-innovative categorization.
181

182
Fig. 2. The Feature Differentiation Model.
On the horizontal axis, we indicate the development extent for the features, ranging from “Satisfy” to “Maximize”. We discuss the intention of this axis in the next section. On the vertical axis, how-ever, we indicate the distinction between primarily “User-centric” and “3rd party-centric” features. By this, we divide between fea-tures that are primarily being developed for users of the product (hence “User-centric”) and other, 3rd parties-centric features, which are not directly used by the users. And to help practitioners catego-rize a feature on these axis, we distinguish between five characteris-tic points; the stakeholder, feature engagement, the source of the feedback, the focus of the feature and its impact on driving sales We describe the characteristics below.
182
183
Stakeholder: We recognize four types of fundamentally different stakeholders that are targeted with new feature development. Product users (D), the competitor developing or already selling a similar feature (C), the customer purchasing and asking for a fea-ture (B), or a regulatory entity imposing it (A). Feature Engagement: This characteristic describes the level of en-gagement expected with the feature. Features are primarily used by the end-users (D) and occasionally by the customers directly (B). The engagement with the features is therefore expected for these two groups. Regulators and competitors, however, typically do not use the features directly. Instead, and what we see in our case com-panies is that verify the documents or tests demonstrating the exis-tence or compliance of the feature. The actual expected exposure to the feature for regulators and competitors is therefore low. Feedback: Feedback data that is collected about features under de-velopment is of various types. For example, the “Flow” features’ (D) will be regularly used by users and should be equipped with automatic feedback collection mechanisms to retrieve customer data about feature usage. The “Checkbox” features’(C) source are the competitors that are being analyzed for a similar offering. In the case of “Wow” features, (B), the primary stakeholders are cus-tomers, whom companies study extensively through market analy-sis and available reports. Finally, and in the case of the regulation and standardization services (A), companies query regulation agen-cies for regulatory requirements that are necessary for offering of the future. Focus: “Flow” features (D) focus on the user and maximizing user value. Practitioners in this case develop and iterate features that are validated with the users. For “Wow” features (B), practitioners use their own technical ability in order to maximize the technical
183

184
outcome of the feature. Here, for example companies use their simulators to test the speed of the software or its stability. For “Checkbox” features (C), practitioners compare the feature under development towards the ones from the competitors. In this case, the objective of the development organization is to develop a fea-ture that is matching or improving the competitors’ feature. Com-panies continuously compare towards competition and intention-ally slows down if they are performing better as expected. Simi-larly, in the case of “duty” features (A), it is the regulators compli-ance that the companies are required to satisfy by developing the feature. Sales Impact: The greatest influence on driving sales have the fea-tures that focus on the customer - “Wow” features (B) and features that focus on the user - “Flow” features (D). Both types are differ-entiating or innovative. However, in B2B markets, the user of the product is different from the customer and hence “Flow” features are less of a deciding factor for potential customers. As an exam-ple, users communicate and show satisfaction with a product to their managers and departments that purchase the features and products. Their opinions have the possibility to indirectly influence the opinion of the customer. “Duty” and “Checkbox” features have very low or no impact at all for choosing a product over the one from a competitor. 5.2 The Development Process In order to improve the development process and avoid investing R&D efforts in wasteful activities, we suggest a generic, high-level approach to new feature development. First, and for each of the four feature categories, we suggest how to set the extent of the fea-ture that should be developed. Here, the extent of the feature can be either defined once (constant) or dynamically adjusted during development and operation (floating - alternates, following- fol-lows the competitors or open - no limitation). Second, the sources
184

185
that contain the information required to set the development extent need to be defined, together with the techniques that make it pos-sible for the practitioners to collect relevant customer feedback. Next, we suggest the most important activities for each of the fea-ture categories for feature realization. They are followed by the ac-tivities that do not deliver value for that type of feature and should be avoided. Finally, we suggest how to set the deployment fre-quency. We describe the approach with the differences for every feature-type in detail below. A-Duty features: The development extent for this type of features is constant and defined by the regulators. In order to identify it, prac-titioners can use research institutions, standardization industries and industry publishers as a source of feedback in order to get ac-cess to various standardization reports, vendor communications and obtain the regulation requirements. For this type of features, identifying regulatory requirements and developing them until they satisfy the requirements are the two main activities. UX optimiza-tion, investments in marketing activities developing infrastructure and other similar activities for this type of features should be minimized. Deployment of this type of features is single. B-Wow features: For this type of feature, development extent is dynamically set using the feedback from the market. Practitioners query social media, marketing agencies, customer reports, requests, and interviews to identify business cases and sentimental opinions about the product. The two most important activities for this type are the identification of technical selling points and selling charac-teristic of the product, and maximizing investments in technical development of the feature and marketing it. The feature's quanti-fiable value should be maximized with periodically scheduled de-ployment increments.
185
186
C-Checkbox features: This type of features should be developed following a “sliding bar” extent that follows the competitor’s trend. Practitioners should guarantee to be on par with the indica-tive trend collected from industry test magazines and internal evaluation of customer products. It is essential to read articles in the media, consolidative question the customers, participate on customer events and perform trend analysis. Practitioners should perform competitor analysis to determine feature characteristics and develop the feature incrementally following the trend. Since features of this type will not be used extensively by the actual us-ers, investments in improving user experience and interaction with the feature can be minimized. Deployment should be frequent and scheduled. D-Flow features: Innovation occurs where there is no upper limit on the development extent. With this type of features and the am-bition to discover new and innovative concepts, practitioners should continuously deploy changes to their products, collect product feedback, analyze it, and perform A/B test to rank alterna-tives. The two most important activities for this type of feature are the defining of an evaluation criteria and maximizing the number of experiments. Interviewing the stakeholders or gathering qualita-tive information should be of secondary value and used for inter-preting results. Also, and due to the continuous deployment, there is a high impact on the infrastructure to process this data and skills required to interpret it.
186

187
We summarize the most important differences between each ap-proach in Figure 3.
Fig. 3. The summary of the 4 different development approaches for each of the
feature types.
6 Discussion
Multi-disciplinary teams involved in the development of a software product are increasingly using customer feedback to develop and improve their products and features. Typically, qualitative tech-niques are used to capture customer experiences and their behav-iors [5], [6], [7]. On the other hand, quantitative techniques are used to collect product performance and operation details [8], [7]. Previous research shows that the number of requests and ideas that originate from this feedback often outnumbers available engineer-ing resources [9]. And with increasing amount of ideas, prioritizing development resources and identifying which features to develop to what extent is a crucial step in new feature development process. Bosch [17] recognized the importance of dividing functionality be-tween commodity, differentiating and innovative to reduce com-plexity of the systems. However, and as shown in our empirical
187

188
findings, companies still struggle to distinguish between the feature types and, consequently, invest into development activities that do not deliver value to the stakeholders. Innovative features are, as a consequence suppressed with not so valuable commodity efforts and resources spent on improving the wrong features. To address the concerns above, we develop the Feature Differentia-tion model. There, we illustrate how development activities depend on the type of the feature being developed with respect to charac-teristics. The model helps companies to (1) differentiate between the four types of the features, and (2) prioritize the necessary de-velopment activities. 6.2 Feature Differentiation Model: Solving the Challenges Our model for differentiating features addresses a number of chal-lenges and implications that large software companies experience and that we presented above: • Effortless Differentiation: One of the key challenges for compa-
nies is to identify whether a feature is commodity, differentiat-ing or innovative. With the feature differentiation model, we enable practitioners to perform this distinction based on the five key characteristics described in 5.1. By passing through the characteristics, practitioners can determine in which of the four quadrants their feature under development belongs to.
• Comprehensible directives: With actionable steps in the devel-opment process illustrated in 5.2, we give practitioners in large software companies the ability to define the right ambition level for a certain type of the feature, the preferred methods of col-lecting customer feedback, and provide them with instructions on which development activities to focus on. The high-level strategy can, in this way, be communicated in a comprehensible manner to individual units.
• Distinguishing Innovative Features: With a clear separation be-tween different types of features, our model model enables prac-titioners to prioritize innovative functionality and invest in meaningful activities, e.g. running continuous controlled ex-periments with customers for “Flow” features, or prioritizing investments into identifying regulation requirements for “Duty” features. This helps product owners and managers to reduce the
188

189
number of arbitrary investments by giving guidelines on which activities are beneficial for a certain type of features. Also, we provide guidelines on which features need to follow a trend from e.g. competitors in order to better estimate where the competitor is going to be in the future. This prevents companies from anchoring themselves to a norm of the competitors’ cur-rent state.
7 Findings
Software is today the main competitive advantage in products. However, the way in which software features are developed, and due to the immaturity and lack of experience of the companies that transitioned from mechanical and electrical functionalities to soft-ware functionality, still reflects the traditional handing of require-ments. As a consequence, individual departments prioritize what they believe is the most important and are unable to identify what features are differentiating and that add value to customers, and what features are regarded commodity by customers and hence, should require less R&D effort. In this paper, and based on case study research in three large soft-ware-intensive companies, we (1) provide empirical evidence that companies do not distinguish between different types of features, i.e. they don’t know what is innovation, differentiation or com-modity, which is the main problem that causes poor allocation of R&D efforts and suppresses innovation. We (2) develop a model in which we depict the activities for differentiating and working with different types of features and stakeholders. With this model, com-panies can (1) categorize the features that are under development into one of the four types and invest into activities that are relevant for that type, and (2) maximize the resource allocation for innova-tive features that will deliver the most value.
189

190
In future work, we intend to strengthen the validation of the fea-ture differentiating model by studying other companies that em-ploy similar principles and validating our model with them.
References
1. Boehm, B.: Value-based software engineering: reinventing. SIGSOFT
Softw. Eng. Notes. 28, 3– (2003).
2. Khurum, M., Gorschek, T., Wilson, M.: The software value map - an
exhaustive collection of value aspects for the development of software
intensive products. J. Softw. Evol. Process. 25, 711–741 (2013).
3. Lindgren, E., Münch, J.: Software development as an experiment system:
A qualitative survey on the state of the practice. Springer International
Publishing, Cham (2015).
4. Olsson, H.H., Bosch, J.: Towards Continuous Customer Validation : A
conceptual model for combining qualitative customer feedback with
quantitative customer observation. LNBIP. 210, 154–166 (2015).
5. Fabijan, A., Olsson, H.H., Bosch, J.: Customer Feedback and Data
Collection Techniques in Software R&D: A Literature Review. Softw.
Business, Icsob 2015. 210, 139–153 (2015).
6. Williams, L., Cockburn, A.: Agile software development: It’s about
feedback and change, (2003).
7. Bosch-Sijtsema, P., Bosch, J.: User Involvement throughout the Innovation
Process in High-Tech Industries. J. Prod. Innov. Manag. 1–36 (2014).
8. Olsson, H.H., Bosch, J.: Towards Data-Driven Product Development: A
Multiple Case Study on Post-deployment Data Usage in Software-Intensive
Embedded Systems. In: Lean Enterprise Software and Systems, LESS 2013,
Galway, Ireland (2014).
9. Bebensee, T., Van De Weerd, I., Brinkkemper, S.: Binary priority list for
prioritizing software requirements. In: Lecture Notes in Computer Science
(including subseries Lecture Notes in Artificial Intelligence and Lecture
Notes in Bioinformatics). pp. 67–78 (2010).
10. Knauss, E., Lubke, D., Meyer, S.: Feedback-driven requirements
190
191
engineering: The Heuristic Requirements Assistant. In: 2009 IEEE 31st
International Conference on Software Engineering. pp. 587–590. IEEE
(2009).
11. Johansson, E., Bergdahl, D., Bosch, J., Olsson, H.H.: Requirement
Prioritization with Quantitative Data - a case study. In: International
Conference on Product-Focused Software Process Improvement. pp. 89–
104. Springer International Publishing, Bolzano (2015).
12. Wiegers, K.E.: Automating requirements management. Softw. Dev. 7, 1–5
(1999).
13. Karlsson, L., Thelin, T., Regnell, B., Berander, P., Wohlin, C.: Pair-wise
comparisons versus planning game partitioning. Empir. Softw. Eng. 12, 3–
33 (2007).
14. Leffingwell, D., Widrig, D.: Managing software requirements: a unified
approach. Addison-Wesley Longman Publ. Co., Inc. Boston, MA, USA.
10, 491 (1999).
15. Karlsson, J., Ryan, K.: A cost-value approach for prioritizing
requirements. IEEE Softw. 14, 67–74 (1997).
16. Kakar, A.K.: OF THE USER , BY THE USER , FOR THE USER : ENGAGING USERS IN INFORMATION SYSTEMS PRODUCT. In:
SAIS 2014 Proceedings (2014).
17. Bosch, J.: Achieving Simplicity with the Three-Layer Product Model.
Computer (Long. Beach. Calif). 46, 34–39 (2013).
18. von Hippel, E.: Lead Users: A Source of Novel Product Concepts. Manage.
Sci. 32, 791–805 (1986).
19. Ramesh, B., Cao, L., Baskerville, R.: Agile requirements engineering
practices and challenges: an empirical study. Inf. Syst. J. 20, 449–480
(2010).
20. Runeson, P., Höst, M.: Guidelines for conducting and reporting case study
research in software engineering. Empir. Softw. Eng. 14, 131 – 164
(2008).
21. Fabijan, A., Olsson, H.H., Bosch, J.: Early Value Argumentation and
Prediction : an Iterative Approach to Quantifying Feature Value. In:
Product-Focused Software Process Improvement. pp. 16–23. Springer,
191

192
Braga (2015).
22. Hsieh, H.-F., Shannon, S.E.: Three approaches to qualitative content
analysis. Qual. Health Res. 15, 1277–88 (2005).
192

193
PAPER [E]
Fabijan, A., Olsson, H.H. and Bosch, J. “Customer Feedback and Data Collection Techniques: A Systematic Literature Re-view on the Role and Impact of Feedback in Software Product Development”.
Paper is submitted to a journal.
193

194
194

195
Customer Feedback and Data Collection Techniques: A Sys-tematic Literature Review on the Role and Impact of Feed-
back in Software Product Development
Aleksander Fabijan, Dep. of Computer Science, Malmö University, Malmö, Sweden (C)
Helena Holmström Olsson, Dep. of Computer Science, Malmö Uni-versity, Malmö, Sweden
Jan Bosch, Chalmers University of Technology, Dep. of Computer Science & Eng. Göteborg, Sweden
Abstract. Background: Customer feedback is critical for successful product development. Software companies continuously collect it in order to become more data-driven. By understanding how these feedback data are collected, companies’ ability to accumulate and synthesize the learnings, and correctly prioritize product develop-ment decisions increases. Objective: The purpose of this study is to (1) provide an overview of the sources and feedback collection tech-niques, (2) demonstrate the impact that customer and product data have on product development, and (3) provide the open research challenges on this topic. Method: We performed a systematic litera-ture review of customer feedback and data collection techniques, analyzing 71 papers on the subject taken from a gross collection of 1298. Results: We (1) identify the different customer feedback techniques and sources where these data originate and summarize them in the “Customer Feedback Model”. Next, we show the (2) im-pact that the customer feedback has on the overall development process. Finally, we (3) conclude with future research challenges. Conclusions: Our research reveals a compelling set of feedback data collection techniques that can be used throughout the develop-ment stages of software products. The identified challenges, howev-er, indicate that the use of feedback today is fragmented and with limited tool support. Keywords: customer feedback; customer data; customer value; ‘Customer Feedback Model’
195

196
1 Introduction
Over the last two decades, product development has evolved in or-ders of magnitude. Ranging from online applications to physical devices such as cars, home appliances and other connected devices, there is a fundamental shift of perspective in the methods that are being used to realize these products, as well as in how they are be-ing deployed to customers and users. Development practices in companies typically follow a pattern. First, companies are increasingly inheriting the Agile principles (Martin, 2002) on the development part of the organization and throughout the other departments (Olsson et al., 2012). Next, companies focus on various lean concepts such as e.g. eliminating waste (Mujtaba et al., 2010), removing constraints (Goldratt and Cox, 2004) and advancing towards continuous integration(Ståhl and Bosch, 2014) and continuous deployment (Rodríguez et al., 2015). Today however, the spotlight is returning to customers and how to involve them effectively in the product development process (Ries, 2011), (Olsson and Bosch, 2015; Yli-Huumo et al., 2015). Although customer involvement is important and indeed something that can be achieved with increasing customer feedback opportuni-ties, the actual product usage data has the potential to make the prioritization process in product development more accurate. The reason for that is that is the continuous collection of customer ac-tivity, which focuses on what customers do rather than what they say (Kohavi et al., 2009). In this light, continuous engineering and practices associated with the concept that the term describes are increasingly gaining momentum (Bosch, 2014; Fitzgerald and Stol, 2015). In this process, customer feedback plays a central role for both de-fining what should be developed, as well as validating how well it has been built (Williams and Cockburn, 2003), (Kohavi et al., 2009). And although the opportunities to learn about customers and customer behaviors are increasing (Fabijan et al., 2015), most
196

197
software-intensive companies experience the road mapping, re-quirements prioritization, and value validation process of features under development as complex (Lindgren and Münch, 2015), (Fabijan et al., 2016). On one hand, product management often finds it difficult to get timely and accurate feedback about the behavior of the features and products wished by their customers. We described this situa-tion in our previous research as the ‘open loop’ problem, referring to a situation in which product management has difficulty in get-ting access to customer feedback that can help them in e.g. feature prioritization processes (Olsson and Bosch, 2014). On the other hand, the development organizations often lacks contextual infor-mation about the purpose, intention and goals of the products and features that they are developing (Fabijan et al., 2016). Not sur-prisingly, the final result are are sub-optimal products in which half of the features are never used by customers. This situation was acknowledged already in 1995 by the Standish Group’s CHAOS report (The Standish Group, 1995) confirming that most software project failures are caused by value-oriented shortfalls such as the lack of customer feedback, and can as well be seen in recent studies today (Marciuska et al., 2013), (Marciuska et al., 2014). More re-cently, this was confirmed in a study revealing very limited use of the majority of the features in a web portal system (Backlund et al., 2014). To maximize the overall effectiveness of the R&D activities, soft-ware companies continuously collect customer feedback from their users and customers and are becoming more data-driven (Fabijan et al., 2015). In the early stages of development, qualitative feed-back guides the companies in requirements engineering and rank-ing of ideas and suggestions. In the later stages, the feedback is be-coming prevalently quantitative. With light prototypes, which are also known as ‘Minimal Viable Products (MVPs)’, companies ex-periment with their customers and users. By performing split tests
197

198
(‘A/B/n testing’ or simply, ‘continuous experimentation’), compa-nies continuously deploy new versions of the identical product and measure the conversion difference among them (Fagerholm et al., 2014), (Kohavi and Longbotham, 2015). Customers expect that the products improve over time and are, consequently, increasingly willing to contribute to this learning process (von Hippel, 2011). The learnings that originate from the feedback are intended to help product management with maximizing the effectiveness of R&D departments by e.g. prioritizing the features that deliver the most value. However, and although the feedback obtained in every step of the development aids in steering the features and products de-velopment ad-hoc, companies fail to benefit from the aggregated learnings (Fabijan et al., 2016; Lindgren and Münch, 2015). And although the practitioners in companies are aware that customer feedback is being collected in various stages of the development cy-cle, they have no oversight on the different feedback collection ac-tivities and techniques, neither are aware of what impact they have. As a consequence, there is a risk to prioritize features based on the feedback that is accessible, known and provide tangible evidence, instead of exploring what customers really value and validate how well this has been achieved (Fabijan et al., 2016). We provide a ‘state of the art’ systematic literature review on the topic of customer feedback and product data. We (1) identify the different customer feedback activities and techniques to collect feedback. In the next step, we (2) provide the ‘Customer Feedback Model’ and show the impact that feedback has on the overall de-velopment process of a product. Finally, we (3) conclude with fu-ture research challenges. Our model can be used to identify and complement different data sources and techniques used to collect feedback with the purpose of using this information in conducting data-driven decisions in product development. The remainder of this paper is organized as follows. In section 2, we present related studies on customer feedback and product data. In section 3, we describe our research method. We list our findings
198
199
on the sources of feedback and activities with techniques on how it is collected in section 4. In section 5, we present our ‘Customer Feedback Model’ in which we summarize our findings and the dif-ferent impacts that customer feedback has on the product devel-opment. We present a number of open research challenges on the topic of customer feedback and product data in section 6. Finally, we conclude the paper in section 7.
2 Background
This section is twofold. First, we recognize and summarize the role and impact of customer feedback and product data in management literature, information systems, human computer interaction, par-ticipatory design and ‘start-up’ building disciplines. Second, we provide an overview of existing studies that focus on these topics. The issue of how to involve customers and users of products in the product development has gained much attention and is a well-established topic within these research traditions. Customer feed-back, as the name depicts is collected from the customers and users of a product. Product data on the other hand, is collected from products used by the customers and users. 2.1 The role of Feedback In information systems research literature, customer feedback has been a prominent research topic for decades, with a special focus on the organizational and social contexts that influence customers and their behavior (Henfridsson and Lindgren, 2010). In human computer interaction (Hess et al., 2013) and as well as in participa-tory design (Hess et al., 2008), the focus is primarily on methods, activities and distinct techniques for improving usefulness, ease of use and user satisfaction.
199

200
In product management (PdM) literature (von Hippel, 1986), (von Hippel, 2011), (Bosch-Sijtsema and Bosch, 2014), customer feedback is used as a major source of knowledge for various purposes. The disciplines’ impact of customer feedback is twofold. In one way, the feedback that is being collected is used as input to steer development activities of ongoing and existing products (Bosch-Sijtsema and Bosch, 2014). On the other hand, PdM literature also recognises that customer feedback provides companies with a competitive advantage during the innovation process (Mahr et al., 2014). The later was recognized already by Von Hippel (von Hippel, 1986) in 1986. He discovered that certain groups of users, namely ‘lead users’ experiment with the products and services, and that they should be considered as a source of feedback used for innovating new features or products, a cocept that is used today in various product and service companies. The term feedback is becoming widely used in Requirements Engi-neering (Kabbedijk et al., 2009) research to refer to the comments and evaluations that users express upon having experienced the use of a software application or service. In the ‘start-up’ literature, Eric Ries, known as the author of ‘The Lean Startup’ approach for product development (Ries, 2011), recently recognized and advo-cated a scientific approach for creating, managing, and deploying a desired product to customers’. And as one of the core components of the approach that he presents, known as the ‘Build-Measure-Learn’ loop, he emphasizes one particular component as signifi-cantly important. This component is customer feedback, which en-ables companies to identify the problem they need to solve for their customer, and at the same time, the component that informs them whether and how much they have succeeded. This component is customer feedback and the overall topic of involving customers and users of products into product development to become more data informed.
200
201
2.2 Existing studies on Feedback Customer feedback appears in several literature reviews that are focused on individual software engineering practices and use it for various purposes such as e.g. in continuous deployment. To our knowledge, this topic has not been studied in detail and its impact for the overall product development is unknown. In one of the recent mapping studies on the topic of continuous deployment of software intensive products, Rodriquez et al. (Rodríguez et al., 2015) recognized fourteen studies that address the importance and benefits of continuous feedback. In continuous deployment, which is recognized as the situation where companies deploy new product versions continuously to their customers (Olsson et al., 2012), the authors confirm the intuition that al-though customer involvement is highly relevant in the software in-dustry today, it has been relatively unexplored in contexts that are gaining momentum today. They identified that as a consequence of continuous deployment, rapid customer feedback enables faster is-sue resolving and cheaper development. In a recent attempt to summarize the involvement of customers in product development, Yaman et al. (Yaman et al., 2016) con-ducted a systematic literature review, which is also focusing on the collection of customer feedback and involvement of users during the continuous deployment phase of the product development cy-cle. Although they do not research how customer feedback is being collected before or during the development of a product, they iden-tify that already in the stage of continuous deployment, the impact and use of customer feedback is an under investigated area. In our first attempt to provide an overview of the research on cus-tomer feedback, we conducted a literature review on this topic fo-cusing only on the existing work within the software engineering domain (Fabijan et al., 2015). In that paper, we distinguish be-tween two types of customer feedback. The first type, and as the name ‘user feedback’ depicts, is collected from users of the prod-
201

202
uct. The second type, namely ‘product feedback’ originates from the products that are under development or were deployed in the field. We discuss the differences between user and product feed-back, and how they are being collected and complemented throughout the product development cycle. We identified existing customer feedback and data collection techniques, revealing a set of methods and times when they can be used. For example, we rec-ognized that in the early phases of the development cycle, i.e. the pre-development phase, customer feedback that is being collected is mostly of qualitative nature collected by interviews, focus groups etc. Not surprisingly, and as recognized in other theoretical re-search contributions (Kohavi and Longbotham, 2015), (Bosch-Sijtsema and Bosch, 2014) and empirical studies (Fabijan et al., 2016; Lindgren and Münch, 2015), we identified that the feedback that is collected in the later stages of the development cycle prevails to be of quantitative nature, collected mostly via automated feed-back retrieval channels such as e.g. product logs. Since the focus of that paper is scoped to the software engineering domain, the identi-fied techniques are not comprehensive and we did not identify the impact that the techniques have on the development of a product. To summarize, and although of critical relevance for any software development process, the topic of customer feedback and its im-pact on software R&D activities has not been comprehensibly re-searched. A limited number of research contributions on individual parts of the product development cycle do not provide us with a holistic understanding of collection, use and impact of customer feedback. Therefore, and as a way to assess the current ‘state-of the art’ lit-erature on customer feedback, we conduct a systematic literature review with an aim to provide an understanding of collection, use and impact of customer feedback.
202

203
3 Review Method
The applied review protocol is based on the guidelines of Kitchen-ham and Charters (Kitchenham and Charters, 2007). The estab-lishment of the review protocol is necessary for ensuring the litera-ture review to be systematic and to minimize researcher bias. We focus this literature review on a set of research questions below that serve the aim of this work. 3.1 Review Protocol
As a systematic approach to searching, selecting and reviewing papers, the Systematic Literature Review method provides us with a basic structure for identifying recent research with relevance for exploring our research questions. As their main characteristic, sys-tematic literature reviews are formally planned and methodically executed. Initially developed in medicine, the method has been widely adopted in other disciplines such as criminology, social pol-icy and economics, and recently it has gained momentum also in research domains such as e.g. information systems and software engineering (Manikas and Hansen, 2013), (Zarour et al., 2015).
The reminder of this section is structured as follows. In 2.1 we list the research questions that we investigate in this paper. In sub-section 2.2, we describe the paper literature extraction strategy in-cluding the list of resource libraries and the search query. In 2.3 we describe the inclusion and exclusion criteria, together with the strategy on how they were applied.
3.2 Research Questions RQ1: How can customer feedback and product data be collected in software-intensive companies?
• RQ1.1: What are the sources of feedback and product data in software–intensive companies?
203

204
• RQ1:2 What are the techniques that current literature iden-tifies for collecting feedback and product data?
RQ2: What type of impact does customer feedback have on R&D activities in software-intensive companies? RQ3: What are the future research challenges with collection and use of customer and product feedback in software-intensive com-panies?
3.3 The Literature Body – Search Strategy and Data Sources The strategy for collecting the relevant literature is a keyword search in a list of popular scientific indexing libraries listed below: SCOPUS Web of Science Science Direct We constructed the search query from three parts described in de-tail in Table 1 below. First, and to narrow our results to be within the software industry, we selected an inclusive keyword ‘software’ as the first part of our search string. The second part combined the inclusive search terms associated with customer feedback con-nected with an “OR” statement. The third part of the query con-sists of the exclusive keywords that appeared frequently in our re-sults and indicated papers obviously addressing other topics in early iterations of the search process.
204

205
Category Keywords Inclusive “software” Inclusive "customer* feedback", "customer* data", "user*
feedback", "user* data", "consumer* feedback", "consumer* data", “customer monitoring”, “user monitoring”, “customer opinion”, “customer opinion”.
Exclusive "cloud", "security", "computing", "algorithm", "mobile"
Table 1. Search keywords. The search query is intentionally kept simple in order for us to be able to extract the maximum number of papers containing the terms. Also, and for the purpose of identifying recent research, we decided to limit our search to include only papers that were pub-lished between January 2005 and March 2016. 3.4 Collecting the Literature Body This section summarizes the results of our literature search process in a quest to answer our research questions. To obtain the literature body of our review, we apply the system-atic literature review (SLR) protocol described in Section 2 with the extraction date of March 21, 2016. We applied the search query with the keywords above and obtained 1298 results. 721 results were from SCOPUS, 296 from Web of Science and 281 from Sci-ence Direct. However, and since the query was intentionally kept simple, not all of the extracted results were relevant for our research interests. For this reasons, we defined the following inclusion criteria that the lit-erature should commit to:
• IC1: The literature should address at least one method of customer feedback collection. Therefore, the published ar-ticle should contain at least one keyword from the search
205

206
string as a whole (e.g. “customer feedback”) in at least one of the following fields: title, keywords or abstract.
• IC2: Be a research paper or a publication in a distinguished magazine, i.e., be published in a scientific peer reviewed venue.
• IC3: Be published between January 2005 and March 2016 • IC4: Be written in English.
The inclusion criteria IC1-IC4 were applied during the second step of the search process by limiting each of the search queries. We ex-tracted the results in ‘.bib’ format from the three libraries, which we further parsed into a column separated document that formed our local database of research papers. To preserve only the research papers relevant to our research inter-ests, we define the following exclusion criteria:
• EC1: Duplicate search results, • EC2: Studies obviously addressing other topics, as judged
by their title, keywords or abstract. We applied the exclusion criteria in three steps. Duplicate results (EC1) were removed manually by comparing the titles of the pa-pers and deleting any repeated occurrence. Studies addressing other topics (EC2), however, were identified and removed using a two level process. First, we (1) identified pa-pers related to our search objectives and used a machine learning algorithm that was implemented for the purpose of this research in python programming language by one of the researchers to guide the selection. We describe the algorithm processes in 2.3.1 below. Second, we (2) manually processed the results of the algorithm and further narrowed the selection of papers and removed the remain-der of studies that were clearly addressing other topics.
206

207
3.4.1 ML Classification
Labelling: After applying IC1-IC3 and EC1, we first selected a ran-dom subset of papers form the set of literature contributions. The random selection was achieved using an intuitive script written in python, programmed to randomly select 50 papers among the complete set extracted from the databases. The subset consisted of contributions with their titles, keywords and abstracts. Second, one of the researchers read the abstracts of the 50 ran-domly selected papers and identified whether the paper should be excluded from our research by applying the exclusion criterion EC2. The papers that were identified to be excluded were labelled with ‘0 ‘– not relevant. On the other hand, the papers that were identified to be relevant for our research interest were labelled with ‘1’ - relevant. From the 50 randomly selected papers, 39 were recognized as not relevant by obviously addressing other topics, judged by their ab-stract. On the other hand, 11 were recognized as highly relevant and were labelled as relevant. Training: We used the labelled set of 50 research papers to train our program to recognize context for the exclusion criterion EC2. For this purpose, we used an open source implementation of Naïve Bayes Classifier, available in a ‘TexBlob’ python library. Naïve Bayes is a probabilistic learning method extensively used in natural language processing and classification (Fabrizio 2002). TextBlob is an open-source available Python library for processing textual data (Loria, 2014). It provides an interface for diving into common natural language processing (NLP) tasks such as part-of-speech tagging, noun phrase extraction, sentiment analysis, classifi-cation, etc. This particular library is widely used in the Machine Learning community and since one of its intended uses is to classify blocks of text, it was aligned with our objective of identifying stud-ies based on the type of topic they address.
207

208
The process of training the classifier consisted of two steps. First, we feed the algorithm with abstracts of the manually labelled pa-pers. Second, we further improved the accuracy of the algorithm by limiting the feature selection of the algorithm to twenty features to avoid an over fit to the training set. This was an experimentally identified number that both guaranteed a high accuracy of the clas-sifier on the training set (74%) and a pessimistic approach by lean-ing towards false positives and preventing false negatives. We veri-fied this by randomly selecting a new set of 50 papers, different from the one we trained the algorithm on. As a result, the classifier did not label a single paper with ‘0 - not relevant’ that researcher had previously considered to be relevant. 3.4.2 Manual Classification: After performing the automatic classi-fication using the algorithm described above on the abstracts of the papers, we manually processed the results. The papers’ abstracts that were labelled with ‘1 - relevant’ were read by one of the re-searchers, who manually decided whether the paper really voids the EC2 criterion. On the other hand, and since this is the first approach with auto-matic classification that we are aware of, the papers that were al-gorithmically considered as not relevant (labelled as 0 by the algo-rithm) were not directly removed. Instead, we read their titles and keywords to verify that none of the algorithmically rejected papers were relevant. We summarize the overall literature body collection in Figure 1 be-low. Extraction and classification of papers is shown in table 2 be-low. In total, the ensemble of algorithm and researcher judgment identified 63 papers that satisfy the inclusion criteria IC1-IC4 and exclusion criteria EC1-EC2. In addition to the initial search process, we started snowballing for related papers. We applied forward snowballing (search in papers that cited the paper) and backward snowballing (search in the ref-erence list of the paper). We identified 13 additional papers that
208

209
satisfy both the inclusion criteria and the exclusion criteria, with the exception of the date of publishing (IC3). The final round was to verify the literature body for duplicate en-tries. Two papers extracted from Web of Science and three papers extracted from Science Direct were duplicate entries and were re-moved. The final number of papers identified in this research re-sulted to be 71. Selected papers P1-P71 are listed in Annex A at the end of this paper.
Figure 1. Literature body extraction process.
Scopus Web of
Science
Science Di-
rect Total
Initial extraction 721 296 281 1298
After ML classification 270 130 77 477
After manual classification 27 22 14 63
After snowballing 40 22 14 76
Final number of papers after
removing duplicate entries 40 20 11 71
Table 2. Search results and selection.
209

210
4 Customer Feedback and Product Data In accordance with the research questions RQ1.1-RQ1.2, we first outline the sources of customer feedback collection and second, the techniques that are being used to collect this feedback.
4.1 Sources of customer feedback and product data Feedback that is being collected originates from different sources, locations and times. In this section, and based on the data ex-tracted from the literature body, we identify six different sources of data collection and present the differences between them; users, customers, internal organizations, external organizations, products and media. In Table 3, we summarize our findings and list the pa-pers in which these were identified. Users: First and frequently emphasized as the most important source of feedback are the users of the product. These are the indi-viduals that operate with the product, interact with its functional-ity and experience it first-hand. In most organizations that are Business-to-Customer (B2C) focused, the users of the products are also the customers that bought the product. Gaining access to this source can be both challenging and costly, as well as effortless and inexpensive. By asking the users, companies collect feature reviews [P1], [P9], [P65], [P67], knowledge about the features and their purpose [P3], [P5], [P6], [P12], [P23], [P70], what actions they take to use the feature and their opinions and improvement suggestions [P4], [P15], [P28], [P35], [P53], [P57]. Customers: The second source of feedback is the individuals and organizational representatives that are responsible for purchasing the product. Compared to users in B2C organizations, in Business-to-Consumer (B2C) organizations the individuals responsible for purchasing a product are not necessary the users of the product. By asking customers, which is recognized as resource demanding ac-tivity, companies collect functional and non-functional require-ments [P17], [P32], [P33], [P36], [P40], [P41], [P50], [P62], [P64],
210

211
[P68], [P71], [P48], feature requests [P19], [P61], [P60] and story-boards [P47], [P67]. Internal Organizations: With experience on building products and services, organizations strive to capture the understanding of the customers and their business. The internal knowledge within or-ganization, also known as “institutional knowledge” has been a topic of discussions for many years. Starting with the first intranet solutions focusing on categorizing internal knowledge and pro-gressing with modern knowledgebase such as “wiki’s” and “stack-overflows”, organizations today not only document how they work, but also internally provide their knowledge of customer and user understanding [P3], [P5], [P6], [P12], [P23], [P70]. These sys-tems typically contain internal customer and product data that is intended to be shared within the organization and can benefit companies in getting access to technical documentation, organiza-tional data, existing customer experiences etc. External Organizations: We identify three types of external organi-zations as sources of feedback for software development organiza-tions [P9], [P16], [P18], [P22], [P29], [P53], [P63], [P67], [P70]. The first group are the competitors, i.e. the companies developing or starting to develop a similar product. The second group is or-ganizations providing patents and regulatory entities imposing re-quirements, policies and auditing services towards compliancy standards. The third type of external organizations is institutions, such as research centers, universities and governments. Product Instrumentation: Products are increasingly being con-nected to the Internet and equipped with data collection mecha-nisms, operational data, performance data and data revealing fea-ture usage is collected. If customer experience problems with the product, they generate automatic incident reports that contain support data that are important sources of information for the de-velopers when troubleshooting and improving the product. Besides the operational data that is continuously collected from products
211

212
to identify crashes and scalability issues [P5], [P5], [P51], [P22], [P53], [P63], [P67], [P10], [P21], [P25], [P45], [P49], [P51], [P18], [P65], companies also collect user information and product usage patterns [P2], information on feature usage, time spent using the product and other signals that are used to calculate product metrics [P51], [P22], [P53], [P63], [P67]. Media: Both traditional press such as magazines and newspapers, as well as digital and online channels such as social platforms, are recognized in the literature as sources of feedback for software de-velopment organizations. The feedback that these channels gener-ate shapes the course of both larger and well established companies as well as provides recognition to newly established companies. Through media channels, companies collect user opinions, market-ing interest, and customer sentiment [P27], [P31], [P38], [P52], [P54], [P58], [P67].
212

213
Source of feedback Description Recognized as a source of feedback in
paper / study
Consumers / end-users Individuals that operate, interact
and use the product.
P1, P2, P4, P5, P6, P8, P11, P13, P16,
P17, P18, P20, P22, P24, P26, P28,
P32, P33, P35, P36, P37, P39, P42,
P43, P46, P50, P51, P53, P55, P56,
P57, P59, P60, P62, P63, P64, P65,
P66, P67, P68, P69, P70, P71
Customers People paying for the product, in
B2B typically different from the
ones that use or operate the
product.
P5, P7, P11, P12, P13, P15, P16, P17,
P18, P22, P26, P29, P39, P40, P41,
P45, P46, P47, P48, P50, P53, P57,
P59, P60, P62, P63, P64, P65, P67,
P70
Internal organization The learnings, documentation
and other documented and un-
documented knowledge within
the organization.
P3, P5, P16, P18, P22, P23, P29, P30,
P34, P37, P53, P63, P67, P70
External organization(s) (1) Competitors and (2) stan-
dardization agencies, policy mak-
ers, governments and auditors.
P9, P16, P18, P22, P29, P53, P63,
P67, P70
Product instrumentation Software within the product that
is responsible for generating logs,
measuring in-product marketing
views and capturing results from
e.g. in-product surveys.
P1, P2, P5, P9, P10, P13, P14, P18,
P19, P21, P22, P25, P26, P27, P29,
P31, P35, P39, P44, P45, P49, P52,
P53, P54, P55, P61, P63, P65, P67
Media Source of product tests, customer
sentiment, opinions and other
information from Instagram,
Facebook, etc.
P9, P16, P18, P27, P31, P38, P58,
P65, P67,
Table 3. Sources of customer feedback and Product Data
213

214
4.2 Customer Feedback and Product Data Collection Techniques
In this section, and to answer RQ1.2, we present the different ac-tivities and techniques that are used to collect customer feedback and product data. We organize the activities in three groups following the stages of a product development cycle. First, we list and describe the ones that are used early in the development cycle, i.e. in the pre-development stage. Next, we show the different activities that are typically util-ized to collect feedback in the development stage. Finally, we list and describe the activities that are used in the post-deployment stage. In each of the sections we summarize the identified activities and underlying techniques in a table. Although we are aware that some of the activities and collection techniques can stretch across different development stages (e.g. the notion of continuous re-quirements elicitation and engineering is gaining momentum), we categorize the techniques in the stage where they are utilized the most. Pre-Development stage: We recognize five distinct high-level activities used to collect feed-back very early in the development cycle. The first and one of the core activities that is typically used to collect feedback from cus-tomers and users very early in the development cycle is Require-ments elicitation. Determining the requirements for new software is a significant problem because it is dependent upon effective con-versation between software designers and users [17]. Requirements are statements of what the product must do, how it must behave, the properties it must exhibit, the qualities it must possess, and the constraints that the product and its development must satisfy. In our literature body, we can see that requirements engineering can be divided into smaller actionable steps. For example, Britton et.al [P41] divide the Requirements Engineering into 3 phases. First, there is the elicitation, where requirements are gathered from clients and users of the system using interviews, user studies, view-
214

215
points, scenarios, use-cases, and ethnography. Next, there is speci-fication, where the requirements are documented. Finally, there is the validation, when the requirements documentation is checked to ensure that the clients' and users' needs and wishes have been accu-rately recorded using reviews, test-case generation and prototyping. Commonly, the phases are preceded with feasibility study and an overall requirements management process [41], [40], |17]. Re-cently, there have been studies published on scaling the method so it fits into the Agile development process [P40] and advancing its concepts from desktop-based applications towards web informa-tion systems [P32], [P36], [P62]. Overall, requirements engineering is a well-established technique and research area in the literature, recognized in 12 out of 71 papers in our literature review. Second, our literature body identifies Storyboarding as a popular activity to collect user and customer feedback. It is an activity where step-by-step images of how, i.e. a new product will work, are created. These images are called storyboards and they include manual steps, rough user interface components, system activity and automation, and documentation use. Storyboards generally act like high-level use cases and are equivalent to future scenarios. Story-boards essentially take the broad view of the vision, and work out in detail how one can accomplish specific tasks in the new design [P47]. Under Storyboarding, we categorize the different techniques that are used to generate the storyboards such as e.g. user stories capturing [P37], [P47], notes keeping [42], [43] and card-sorting exercises where participants are asked to arrange related com-mands under a common heading in order to identify structure [43]. Our literature review body contains references towards using al-ready collected feedback for e.g. a previous product or similar fea-ture in the early phases of a new product development. We name this activity Experience Querying and aggregate under its umbrella the different ways that developers, designers, product owners and managers communicate and exchange knowledge about the cus-
215

216
tomers and previous products. This activity includes exchanging e-mails, reading content from internal sites, browsing databases etc. Organizations produce value for customers and gain competitive advantage by creating meaningful experiences for consumers and users of products and services. Documentation and information plays a central role in the experience of users, particularly with software applications and the Web [P6]. Next, we recognize usability studying as a method to conduct structured interviews focused on specific features in an interface prototype. The core of these interview activity is a series of tasks that are performed by the interface's evaluator, which distinguish this activity from classical interviewing techniques [P46]. Using us-ability tests, the development team can immediately see whether people understand their designs as they are supposed to understand them. As usability testing is best at seeing how people perform spe-cific tasks, it should be used to examine the functionality of indi-vidual features and the way they are presented to the intended user. It is better used to highlight potential misunderstanding or errors inherent in the way features are implemented rather than to evalu-ate the entire user experience. Finally, we recognize Individual voting as a distinct activity to col-lect feedback very early in the development cycle. It is a technique that aims to quantify customer wishes and ideas with the goal of identifying an optimal prioritization backlog. The realization of this activity varies in the literature from a studio setting with vot-ing devices available for the participants in that particular envi-ronment, and on the other hand of custom designed tools that can be taken into customers’ working context. Bummer et. al [P61] proposed a technique and a system for silent feedback collection that enables users to cast their vote and opinion in a secure and private way with a hand-size ball with sensors. Overall, the activities discussed in this section primarily use three sources of feedback as their input; customers, internal organiza-tions and external organizations.
216
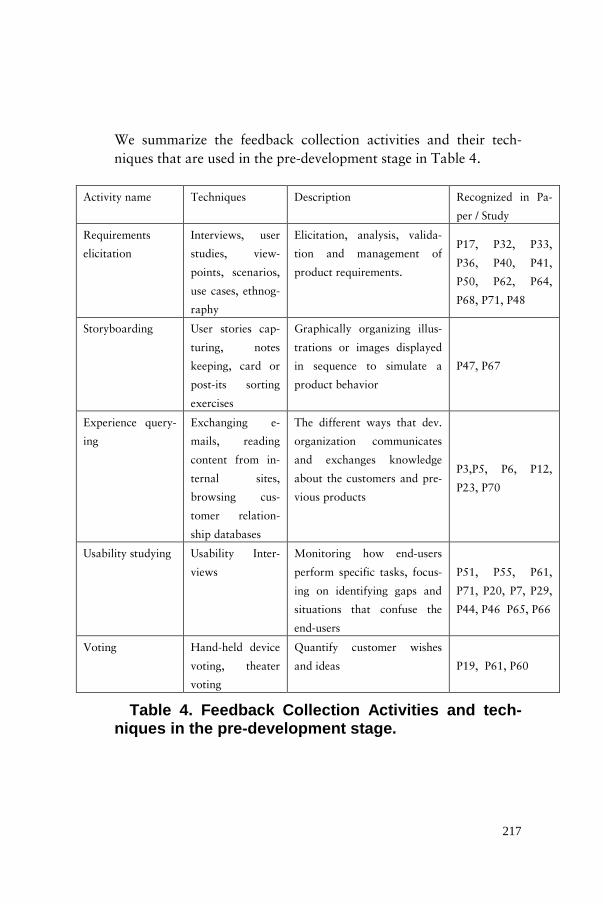
217
We summarize the feedback collection activities and their tech-niques that are used in the pre-development stage in Table 4.
Activity name Techniques Description Recognized in Pa-
per / Study
Requirements
elicitation
Interviews, user
studies, view-
points, scenarios,
use cases, ethnog-
raphy
Elicitation, analysis, valida-
tion and management of
product requirements.
P17, P32, P33,
P36, P40, P41,
P50, P62, P64,
P68, P71, P48
Storyboarding User stories cap-
turing, notes
keeping, card or
post-its sorting
exercises
Graphically organizing illus-
trations or images displayed
in sequence to simulate a
product behavior
P47, P67
Experience query-
ing
Exchanging e-
mails, reading
content from in-
ternal sites,
browsing cus-
tomer relation-
ship databases
The different ways that dev.
organization communicates
and exchanges knowledge
about the customers and pre-
vious products
P3,P5, P6, P12,
P23, P70
Usability studying Usability Inter-
views
Monitoring how end-users
perform specific tasks, focus-
ing on identifying gaps and
situations that confuse the
end-users
P51, P55, P61,
P71, P20, P7, P29,
P44, P46 P65, P66
Voting Hand-held device
voting, theater
voting
Quantify customer wishes
and ideas P19, P61, P60
Table 4. Feedback Collection Activities and tech-niques in the pre-development stage.
217

218
Development stage: We identify five high-level activities of collecting customer feed-back during the development stage of a product; prototyping, focus groups and evaluation sessions with usability testing, contextual inquiry, operational data collection and filming and surveillance. Under each of the five activities, we categorize a number of tech-niques that appear in the literature and enable practitioners in or-ganizations to collect feedback. First, and one of the most popular activity that our literature rec-ognizes is prototyping. This activity is a part of a larger process that leads to a working model of a product or a feature, which is used to obtain feedback about the system, interface design, usabil-ity etc. Prototyping can help in increasing communication, provid-ing valuable feedback in the design process, and improving good-will on the user side [P9], [P24]. Moreover, prototypes have been advocated to improve the specification and communication of software requirements [P17], [P44]. The activity execution varies from paper based prototypes techniques [P37], card sorting of con-cepts [P43] to online use of mockup tools [P36], [P19]. In the last year, and with the introduction of the “lean startup” methodology and decreasing costs of building features, prototyping is gaining momentum [P57], [P18]. Second activity, and typically used to validate early prototypes is usability testing. Typically, the activity consists of two techniques; focus groups and evaluation sessions. They are recognized in the literature as techniques for collecting feedback from users and cus-tomers of a product. They enable the product team to determine the degree to which requirements are being met as well as the need for iterative improvement of prototype [P44], [P14]. Interviews and focus groups are typically used for adapting the product and re-viewing its early versions (e.g. prototypes) [P49]. Usability testing allows validation of the designed user-experience, including the visual, emotive, responsive, and navigational experience [P44]. Fo-cus-group sessions are useful for validating the interpretation of
218
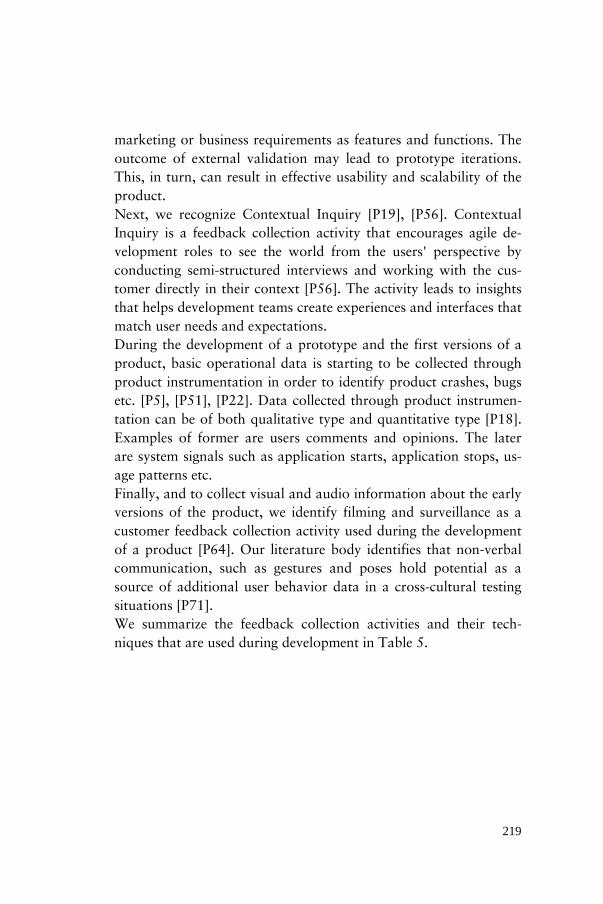
219
marketing or business requirements as features and functions. The outcome of external validation may lead to prototype iterations. This, in turn, can result in effective usability and scalability of the product. Next, we recognize Contextual Inquiry [P19], [P56]. Contextual Inquiry is a feedback collection activity that encourages agile de-velopment roles to see the world from the users' perspective by conducting semi-structured interviews and working with the cus-tomer directly in their context [P56]. The activity leads to insights that helps development teams create experiences and interfaces that match user needs and expectations. During the development of a prototype and the first versions of a product, basic operational data is starting to be collected through product instrumentation in order to identify product crashes, bugs etc. [P5], [P51], [P22]. Data collected through product instrumen-tation can be of both qualitative type and quantitative type [P18]. Examples of former are users comments and opinions. The later are system signals such as application starts, application stops, us-age patterns etc. Finally, and to collect visual and audio information about the early versions of the product, we identify filming and surveillance as a customer feedback collection activity used during the development of a product [P64]. Our literature body identifies that non-verbal communication, such as gestures and poses hold potential as a source of additional user behavior data in a cross-cultural testing situations [P71]. We summarize the feedback collection activities and their tech-niques that are used during development in Table 5.
219
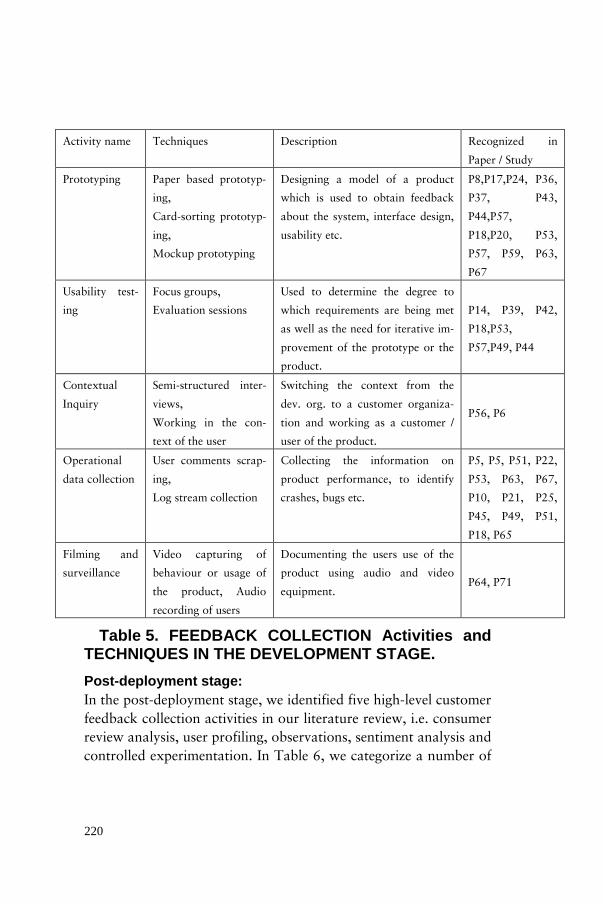
220
Activity name Techniques Description Recognized in
Paper / Study
Prototyping Paper based prototyp-
ing,
Card-sorting prototyp-
ing,
Mockup prototyping
Designing a model of a product
which is used to obtain feedback
about the system, interface design,
usability etc.
P8,P17,P24, P36,
P37, P43,
P44,P57,
P18,P20, P53,
P57, P59, P63,
P67
Usability test-
ing
Focus groups,
Evaluation sessions
Used to determine the degree to
which requirements are being met
as well as the need for iterative im-
provement of the prototype or the
product.
P14, P39, P42,
P18,P53,
P57,P49, P44
Contextual
Inquiry
Semi-structured inter-
views,
Working in the con-
text of the user
Switching the context from the
dev. org. to a customer organiza-
tion and working as a customer /
user of the product.
P56, P6
Operational
data collection
User comments scrap-
ing,
Log stream collection
Collecting the information on
product performance, to identify
crashes, bugs etc.
P5, P5, P51, P22,
P53, P63, P67,
P10, P21, P25,
P45, P49, P51,
P18, P65
Filming and
surveillance
Video capturing of
behaviour or usage of
the product, Audio
recording of users
Documenting the users use of the
product using audio and video
equipment. P64, P71
Table 5. FEEDBACK COLLECTION Activities and TECHNIQUES IN THE DEVELOPMENT STAGE. Post-deployment stage: In the post-deployment stage, we identified five high-level customer feedback collection activities in our literature review, i.e. consumer review analysis, user profiling, observations, sentiment analysis and controlled experimentation. In Table 6, we categorize a number of
220

221
techniques that appear in the literature and enable practitioners in organizations to collect feedback under the five high-level feedback collection activities. Consumer Reviews Analysis is an activity designed to retrieve end-user opinions about the final product. Modern web technologies enable end-users of a product to publish a large number of con-sumer reviews about products and services on various websites. Major product features extracted from consumer reviews may let product providers find what features are mostly cared by consum-ers, and also may help potential consumers to make purchasing de-cisions. Product companies can use the information that is col-lected with this activity to identify missing features or quality issues [P65]. The realization of this activity is typically done by software techniques that scrape and extract user comments from websites advertising or selling the product, company websites or third party retail websites [P9]. The outcome of the techniques is a collection of opinions regarding a product or a feature, its quality, perform-ance, or missing features wished by the consumers. Second, we identify User Profiling as an activity of collecting feed-back. User Profiling is a method typically used to classify end-users into groups based on the actions they perform with the product. The goal is to analyze user behavior in order to understand its rela-tion to the user preference [P2]. Typically, customer data that is analyzed has to be collected through product instrumentation and aggregated in a way to construct a complete and comprehensive view of user behaviors. And by classifying similar users together, product companies can understand and better predict future behav-ior of the end-user. Next, our literature body identifies Observations. Pierce [P15] fo-cuses on observations and other means of direct communication with customers, and leveraging their input to help drive change. He states that seeking direct input from customers and learning how they use a product are the most effective activities for generating
221

222
ideas for enhancements and innovations to the technical content that supports a product, as well as to the product itself [P15]. Bosch-Sijtsema [P67] and Olsson [P53] acknowledge that observa-tions can provide unique insights into the day-to-day working practices because of its emphasis on the direct study of contextual-ized actions. To conduct structured observations, Dray et. al pre-sent a tutorial for observations in the context of the user [P4], [P28]. Social media is impacting the way service and product offerings are deployed and delivered [P67]. At the same time, it serves as a source of Sentiment Analysis Collection, an activity aimed to col-lect and devise customer sentiment from social networks. Compa-nies, with increasing presence on various channels track how their products are accepted and used among their customers. Bajic et. al [P27] analyzed how companies use the social media by pivoting on four factors: company size, transparency, software deployment, and number of social media tools in use. Park et. al [P38] presented a web content summarization method that creates a text summary by exploiting user feedback to make the use of sentiment data eas-ier for product developers. In other studies, see e.g. [P52], [P58] they suggest tools to capture this feedback effectively from social platforms such as YouTube and use it to construct knowledgebase and innovate [P67]. Finally, our literature review identifies controlled experimentation as an activity of quantitative customer feedback collec-tion [P22], [P53], [P63]. Known from medicine and drug trials, controlled experimentation is a method where population is ran-domly split between groups and these groups are exposed to slightly different versions of the same product [P67]. Metrics of in-terest are collected from the product instrumentation and statistical significance between the versions is calculated. Performance met-rics, for example, characterize what the user does and include measures such as task success, task time, and the amount of effort required to achieve a desired outcome [P51]. Satisfaction metrics,
222

223
on the other hand, relate to what users think or feel about their experience [P51]. We summarize the feedback collection activities and their tech-niques that are used in the post-deployment stage in Table 6.
223

224
Activity name Techniques Description Recognized in Pa-
per / Study
Consumer Re-
viewing
Web-scraping of
consumer re-
views
Retrieve a collection of
opinions regarding a
product or a feature, its
quality, performance, or
missing features wished
by the consumers.
P1, P9, P65, P67
User Profiling Similarity tech-
niques such as k-
means clustering,
recommendation
systems
Classifying end-users into
groups based on the ac-
tions they perform with
the product.
P2
Observations Observing users
of the developed
product
Direct study of contextu-
alized actions by observ-
ing the end-product us-
age.
P4, P15, P28, P35,
P53 ,P57
Sentiment
analysis
Analyzing cus-
tomer sentiment,
extracting feed-
back and aggre-
gating opinions
exploiting user feedback
to make the use of senti-
ment data easier P27, P31, P38, P52,
P54, P58, P67
Controlled ex-
perimentation
Signal process-
ing,
Metric calcula-
tion,
p-value calcula-
tion
Calculating statistical sig-
nificance between slightly
different versions of the
identical feature in order
to determine the optimal
one.
P51, P22, P53, P63,
P67
Table 6. FEEDBACK Collection TECHNIQUES IN THE Post-Deployment STAGE.
224
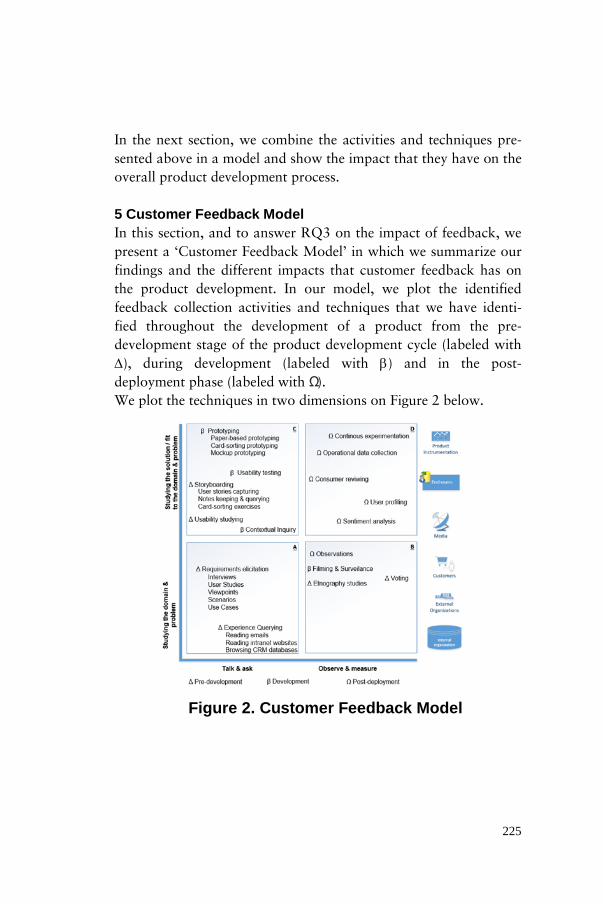
225
In the next section, we combine the activities and techniques pre-sented above in a model and show the impact that they have on the overall product development process. 5 Customer Feedback Model In this section, and to answer RQ3 on the impact of feedback, we present a ‘Customer Feedback Model’ in which we summarize our findings and the different impacts that customer feedback has on the product development. In our model, we plot the identified feedback collection activities and techniques that we have identi-fied throughout the development of a product from the pre-development stage of the product development cycle (labeled with ∆), during development (labeled with β) and in the post-deployment phase (labeled with Ω ). We plot the techniques in two dimensions on Figure 2 below.
Figure 2. Customer Feedback Model
225

226
The horizontal axis indicates the transition from primarily qualita-tive and and questioning-based techniques towards primarily quan-titative, observable and measurable. As an example, interviewing and studying end-users are techniques where sources of feedback are being queried and interacted with by talking to them. Ethnog-raphy studies and operational data collection, on the other hand, are techniques where data is captured by observing or measuring a quantity. On the right side of the model, we present the sources of feedback that are used as the primary source by the techniques on the same level. The vertical axis, indicates the transition from problem-identification and understating of the domain towards solution fit studying. As an example, Requirements elicitation is an activity that involves conversations between software designers and users, resulting with requirements or statements of what the product must do, how it must behave, the properties it must exhibit, the qualities it must possess, and the constraints that the product and its development must satisfy. On the other hand, prototyping tech-niques are used to determine how well the working model satisfies those requirements. To summarize, the feedback collection activities and techniques in the ‘Customer Feedback Model’ are categorized based on the phase of the development that they are mostly used, the type of the col-lection (i.e. qualitative vs. quantitative), and based on the topic studied (i.e. the problem domain vs. the fit of the solution). The model with the four quadrants on Figure 2 (labeled with A-D), however, is also a framework for differentiating the different im-pact types. They are based on the literature body as defined by [P5], [P6], [P22], [P41], [P52] and [P65], and they present four fundamentally different types of feedback impacts: A-Formative [P41], [P52], B-adaptive [P41], [P65], C-Summative [P41], [P52], and D-Value impact [P5], [P6], [P22]. We present their role in product development below.
226
227
• A - Formative Impact: First, the feedback that is collected early in the development cycle is typically being used for constructive purpose [P41]. Data that are being collected focus on the functional requirements, steer prioritization decisions and shape the feature or a product even before the development begins. We name this type of influence of customer feedback to be formative impact. Cordasco et. al [P52] recognize the formative impact of feedback data and state that feedback is used to form and improve product design.
• B - Adaptive Impact: Finally, we recognize adaptive impact of customer feedback [P41]. This type of customer feed-back impacts products’ capabilities, design decisions and other characteristics that are aligned with the customer value model. Pagano et al. [P65] identified that adaptive impact helps to improve software quality and to identify missing features.
• C - Summative Impact: Second, and for the purpose of validating whether the product or a feature is solving the defined problem, another type of customer feedback is be-ing collected. We name this type of influence of customer feedback summative impact [P41]. This type of feedback is collected in order to verify how well the developed soft-ware meets the defined criteria. Cordasco et al. [P52] rec-ognize the summative impact of feedback data to measure the extent to which certain target goals were achieved.
• D - Value Impact: We name the customer feedback that has an impact on identifying the value of the feature for a customer over time to be value impact. This type of feed-back impact is recognized in recent literature body [P5], [P6], [P22]. Olsson et. al [P5] for example state that value impact helps companies to respond rapidly and dynami-cally to any changes to the use of the products, as well as
227
228
to emerging customer requests. Fabijan et. al [P22] state that value feedback helps product management in large or-ganizations to correctly re-prioritize R&D investments by continuing to develop only the appreciated features. Signals such as click-through-rate, application starts etc. are col-lected and aggregated over units such as time or users into metrics such as e.g. happiness, engagement, adoption, re-tention, or task success (Rodden et al., 2010). This type of feedback is used to construct and update these metrics that represent and measure the customer value.
On a high level, and based on the four types of impacts above, we recognize two fundamentally different milestones that software de-velopment companies pass in their process of developing a product. First, and in the early stages of the development where summative and formative impact are the strongest (as indicated by the major-ity of pre-development techniques in the left quadrants on Figure 2), companies focus their R&D investments in determining what the requirements for a product are and how much they are fulfill-ing them with their prototypes. We name this milestone “The Product Model” and emphasize the central concern of the devel-opment organization to be the focus on the product. The feedback techniques and types of data collected reflect the situation where two questions are being answered: (1) “What should be devel-oped?”, and (2) “How well the requirements are met?”. In the later stages of product development, a fundamental shift oc-curs in the way customer feedback has an impact on the R&D process. Here, the focus shifts from the product and moves closer to the value for the customer. Instead of identifying what is missing or needs to be developed, the central focus moves towards what is valuable for the customer, how to use the feedback to measure the value, and increase it over time. The emphasis is moving to quanti-tative techniques and quantitative data, and how to reflect the changes in e.g. metrics. The feedback techniques and types of data
228

229
collected reflect this situation by primarily focusing on answering two types of questions: (1) “What is customer value?”, and (2) “How to adapt the product to increase this value?”. We illustrate this situation graphically on Figure 3 below.
FIGURE 3. Focus of feedback impact
Figure 3 reveals that, on a high level, customer feedback and prod-uct data first impact software companies on focusing to collect what is required from their product. With the data collected, soft-ware companies construct what we label as the ‘Product Model’. In later stages of the development, however, the focus of feedback moves to what of the required is actually valuable and appreciated. On Figure 3, we label this as the ‘Product Value’ and illustrate with the arrow the direction in which the focus moves. In the next section, we identify a number of future research chal-lenges. Although not mentioned explicitly, the situation with the Product Model and Product Value being separated as illustrated on figure 5 is one of the reasons for a number of challenges below.
229

230
6 Open Research Challenges with the Feedback Based on the literature body, and to answer our final research question on the future research challenges with the collection and use of customer feedback, we identify a number of challenges and describe them below. Consolidative learning: Companies collect feedback throughout the development cycle of a product or a feature. We identify in our lit-erature review 15 high-level activities to collect feedback from six major sources of customer, user and product data. And although different techniques provide practitioners with feedback on de-mand, we did not identify references or frameworks on how to ef-ficiently consolidate the collected data and learn from previously collected feedback. Holtzblatt et. al [P42] recognize this as a prob-lem and suggest to organize interpretation sessions within 48 hours after colleting feedback, conducted by a cross-functional team chartered with designing the product. The knowledge of feedback data is, however, often limited to the people participating in the collection sessions and their capabilities to take notes. Cumulative learning: Maalej et. al [P33] recognize the importance of sharing the feedback and propose a continuous and context-aware approach for communicating user input to engineering teams. Context-awareness is, in their words, the aggregation of the domain instrumentation and the interpretation of automatically collected context information. They suggest to use this approach in order to be more proactive in collecting Formative feedback, to better structure the product requirements. And although the two approaches are a step forward in accumulating Formative customer feedback, very little is known on how to use the feedback data at a later stage and for other purposes in comparison to the one it was collected for. Long-term value: Using value impact feedback to construct and update metrics that represent customer and product value is dis-cussed very seldom in our literature body. Customer feedback has traditionally been used to construct and validate requirements. To-
230
231
day, however, the value and adaptive impact are gaining momen-tum and this is being reflected in the recent literature. Olsson et. al [P5] presented the Hypothesis Experiment Data-Driven Develop-ment model where quantitative customer feedback is used to define expected behavior of a feature and measure the actual and realized progress towards the defined goal. Fabijan et. al [P22] developed an actionable technique that utilizes value product feedback to validate feature value early in the development cycle. How to use the feedback data gathered from the many techniques to identify and update metrics that measure the long-term value is a field yet to be researched. Data aging: Collected feedback is, in the literature that we re-viewed, assumed to be valid indefinitely. However, with continu-ous deployments of new features, and with customers habits changing faster than ever before (Wood et al., 2005), feedback that represents the customer appears to be still valid indefinitely. This is a problem as development organizations risk to develop products with outdated models of what constitutes customer and product value. Experience based approaches [P3] can be prone to this phe-nomena and research is recognizing the need of evolving feedback that continuously changes and updates the understanding of cus-tomers and users [P11]. Data management: Various tools for e.g. organizing. searching and sharing customer and product data feedback were identified or de-veloped in a number of publications [P3], [P19], [P20], [P23], [P25], [P27], [P29], [P30], [P32], [P52], [P55], [P58]. However, and although these tools succeed in supporting individual process such as e.g. using social network tools to elicit requirements [P32] or video content analysis of product use [P71], there is no indica-tion of a tool that connects the different segments of customer feedback collection together. Implications of this vary from ineffi-cient use of resources that need to repeat the collection of the same
231

232
feedback to a suboptimal product developed with limited knowl-edge that was available (Fabijan et al., 2016). Data Privacy: Collecting feedback information from customers and users of products raises questions about privacy and control [P21], [P33], [P60], [P65], [P67]. The challenge is therefore to use the sen-sitive information and still ensure that it will not be abused. Trade-offs between sharing and allowing to share might emerge (e.g. the user is asked to confirm particular operations). We argue that this challenge can change with products moving to a service space where contracts between customers and producers of software cover the collection of feedback.
7 Conclusions The learnings that originate from the customer feedback collected through the overall development process help product management with maximizing the effectiveness of R&D departments by e.g. prioritizing the features that deliver the most value. Faster feedback loops are opening new possibilities to become significantly more data-driven and actual product usage data has the potential to make the prioritization process in product development more accu-rate. However, and although the feedback obtained in every step of the development aids in steering the features and products devel-opment ad-hoc, companies fail to identify and efficiently synthesize these data in order to learn from the accumulated data (Fabijan et al., 2016; Lindgren and Münch, 2015). In this paper, we conduct a systematic literature review and iden-tify a number of different customer feedback collection techniques that are used throughout a software product development cycle with the aim to provide a systematic guidance on the available op-tions. Our contribution is the “Customer Feedback Model” that summarizes the different feedback collection techniques and the impact that they have on the overall product development process.
232
233
We conclude with future research challenges that indicate that the use of feedback today is fragmented and with limited tool support. In future work, we aim to address some the challenges that we identified in this paper, focusing on the value impact of customer feedback and how to effectively share it across organization.
References Backlund, E., Bolle, M., Tichy, M., Olsson, H.H., Bosch, J., 2014. Automated
user interaction analysis for workflow-based web portals, in: Lecture Notes in Business Information Processing. pp. 148–162. doi:10.1007/978-3-319-08738-2
Bosch-Sijtsema, P., Bosch, J., 2014. User Involvement throughout the Innova-tion Process in High-Tech Industries. J. Prod. Innov. Manag. 32, 1–36. doi:doi: 10.1111/jpim.12233
Bosch, J., 2014. Continuous Software Engineering, Continuous software engi-neering. doi:10.1007/978-3-319-11283-1
Fabijan, A., Olsson, H.H., Bosch, J., 2016. The Lack of Sharing of Customer Data in Large Software Organizations: Challenges and Implications, in: Agile Processes, in Software Engineering, and Extreme Programming. Springer, Edinburgh, Scotland, pp. 39–52.
Fabijan, A., Olsson, H.H., Bosch, J., 2015. Customer Feedback and Data Col-lection Techniques in Software R&D: A Literature Review, in: Software Business, ICSOB 2015. Braga, Portugal, pp. 139–153. doi:10.1007/978-3-319-19593-3_12
Fagerholm, F., Guinea, A.S., Mäenpää, H., Münch, J., 2014. Building Blocks for Continuous Experimentation. Proc. 1st Int. Work. Rapid Contin. Softw. Eng. 26–35. doi:10.1145/2593812.2593816
Fitzgerald, B., Stol, K.-J., 2015. Continuous software engineering: A roadmap and agenda. J. Syst. Softw. -. doi:http://dx.doi.org/10.1016/j.jss.2015.06.063
Goldratt, E.M., Cox, J., 2004. The Goal: A Process of Ongoing Improvement, North. doi:10.2307/3184217
Henfridsson, O., Lindgren, R., 2010. User involvement in developing mobile and temporarily interconnected systems. Inf. Syst. J. 20, 119–135. doi:10.1111/j.1365-2575.2009.00337.x
Hess, J., Offenberg, S., Pipek, V., 2008. Community Driven Development as participation? - Involving User Communities in a Software Design Proc-ess. … Conf. Particip. Des. 2008 31–40.
Hess, J., Randall, D., Pipek, V., Wulf, V., 2013. Involving users in the wild—Participatory product development in and with online communities. Int. J. Hum. Comput. Stud. 71, 570–589. doi:10.1016/j.ijhcs.2013.01.003
233
234
Kabbedijk, J., Brinkkemper, S., Jansen, S., Van Der Veldt, B., 2009. Customer involvement in requirements management: Lessons from mass market software development. Proc. IEEE Int. Conf. Requir. Eng. 281–286. doi:10.1109/RE.2009.28
Kitchenham, B., Charters, S., 2007. Guidelines for performing Systematic Lit-erature Reviews in Software Engineering. Engineering 2, 1051. doi:10.1145/1134285.1134500
Kohavi, R., Longbotham, R., 2015. Online Controlled Experiments and A/B Tests, in: Encyclopedia of Machine Learning and Data Mining. pp. 1–11.
Kohavi, R., Longbotham, R., Sommerfield, D., Henne, R.M., 2009. Con-trolled experiments on the web: Survey and practical guide. Data Min. Knowl. Discov. 18, 140–181. doi:10.1007/s10618-008-0114-1
Lindgren, E., Münch, J., 2015. Software development as an experiment sys-tem: A qualitative survey on the state of the practice, in: Lassenius, C., Dingsøyr, T., Paasivaara, M. (Eds.), Lecture Notes in Business Informa-tion Processing, Lecture Notes in Business Information Processing. Springer International Publishing, Cham, pp. 117–128. doi:10.1007/978-3-319-18612-2_10
Loria, S., 2014. TextBlob: Simplified Text Processing [WWW Document]. URL https://textblob.readthedocs.org/en/dev/ (accessed 4.7.16).
Mahr, D., Lievens, A., Blazevic, V., 2014. The value of customer cocreated knowledge during the innovation process. J. Prod. Innov. Manag. 31, 599–615. doi:10.1111/jpim.12116
Manikas, K., Hansen, K.M., 2013. Software ecosystems – A systematic litera-ture review. J. Syst. Softw. 86, 1294–1306. doi:10.1016/j.jss.2012.12.026
Marciuska, S., Gencel, C., Abrahamsson, P., 2014. Feature usage as a value indicator for decision making. Proc. Aust. Softw. Eng. Conf. ASWEC 124–131. doi:10.1109/ASWEC.2014.16
Marciuska, S., Gencel, C., Abrahamsson, P., 2013. Exploring How Feature Usage Relates to Customer Perceived Value: A Case Study in a Startup Company, in: Lecture Notes in Business Information Processing. pp. 166–177. doi:10.1007/978-3-642-39336-5_16
Martin, R.C., 2002. Agile Software Development, Principles, Patterns, and Practices, Book. doi:10.1007/BF03250842
Mujtaba, S., Feldt, R., Petersen, K., 2010. Waste and lead time reduction in a software product customization process with value stream maps, in: Proceedings of the Australian Software Engineering Conference, ASWEC. pp. 139–148. doi:10.1109/ASWEC.2010.37
Olsson, H.H., Alahyari, H., Bosch, J., 2012. Climbing the “Stairway to heaven” - A mulitiple-case study exploring barriers in the transition from agile development towards continuous deployment of software, in: Proceedings - 38th EUROMICRO Conference on Software Engineering and Advanced Applications, SEAA 2012. pp. 392–399. doi:10.1109/SEAA.2012.54
234

235
Olsson, H.H., Bosch, J., 2015. Towards Continuous Customer Validation : A conceptual model for combining qualitative customer feedback with quantitative customer observation. LNBIP 210, 154–166. doi:10.1007/978-3-319-19593-3_13
Olsson, H.H., Bosch, J., 2014. From opinions to data-driven software R&D: A multi-case study on how to close the “open loop” problem, in: Pro-ceedings - 40th Euromicro Conference Series on Software Engineering and Advanced Applications, SEAA 2014. IEEE, pp. 9–16. doi:10.1109/SEAA.2014.75
Ries, E., 2011. The Lean Startup: How Today’s Entrepreneurs Use Continu-ous Innovation to Create Radically Successful Businesses, Crown Busi-ness. doi:23
Rodden, K., Hutchinson, H., Fu, X., 2010. Measuring the User Experience on a Large Scale : User-Centered Metrics for Web Applications. Proc. SIG-CHI Conf. Hum. Factors Comput. Syst. 2395–2398. doi:10.1145/1753326.1753687
Rodríguez, P., Haghighatkhah, A., Lwakatare, L.E., Teppola, S., Suomalainen, T., Eskeli, J., Karvonen, T., Kuvaja, P., Verner, J.M., Oivo, M., 2015. Continuous Deployment of Software Intensive Products and Services: A Systematic Mapping Study. J. Syst. Softw. doi:http://dx.doi.org/10.1016/j.jss.2015.12.015
Ståhl, D., Bosch, J., 2014. Continuous integration flows, in: Continuous Soft-ware Engineering. pp. 107–115. doi:10.1007/978-3-319-11283-1-9
The Standish Group, 1995. The standish group report. Chaos 49, 1–8. doi:10.1145/1145287.1145301
von Hippel, E., 2011. Democratizing Innovation, MIT. Soc. Secur. Bull. 71, 133–148. doi:10.1002/jca.20247
von Hippel, E., 1986. Lead Users: A Source of Novel Product Concepts. Man-age. Sci. 32, 791–805. doi:10.1287/mnsc.32.7.791
Williams, L., Cockburn, A., 2003. Agile software development: It’s about feedback and change. Computer (Long. Beach. Calif). 36, 39. doi:10.1109/MC.2003.1204373
Wood, W., Witt, M.G., Tam, L., 2005. Changing circumstances, disrupting habits. J. Pers. Soc. Psychol. 88, 918–33. doi:10.1037/0022-3514.88.6.918
Yaman, S.G., Sauvola, T., Riungu-Kalliosaari, L., Hokkanen, L., Kuvaja, P., Oivo, M., Männistö, T., 2016. Customer Involvement in Continuous Deployment: A Systematic Literature Review, in: Daneva, M., Pastor, O. (Eds.), Requirements Engineering: Foundation for Software Quality: 22nd International Working Conference, REFSQ 2016, March 14-17, 2016. Springer International Publishing, Gothenburg, Sweden, pp. 249–265. doi:10.1007/978-3-319-30282-9_18
Yli-Huumo, J., Rissanen, T., Maglyas, A., Smolander, K., Sainio, L.-M., 2015. The Relationship Between Business Model Experimentation and Techni-
235

236
cal Debt. Softw. Business, Icsob 2015 210, 17–29. Zarour, M., Abran, A., Desharnais, J.M., Alarifi, A., 2015. An investigation
into the best practices for the successful design and implementation of lightweight software process assessment methods: A systematic litera-ture review. J. Syst. Softw. 101, 180–192. doi:10.1016/j.jss.2014.11.041
236

250
APPENDIX A – LITERATURE SELECTION
[P1] S. K. Li, Z. Guan, L. Y. Tang, and Z. Chen, “Exploiting consumer reviews for product feature ranking,” in Journal of Computer Sci-ence and Technology, 2012, vol. 27, no. 3, pp. 635–649.
[P2] L. Mazzola and R. Mazza, “An Infrastructure for Creating Graphical Indicators of the Learner Profile by Mashing Up Different Sources,” in Proceedings of the International Conference on Ad-vanced Visual Interfaces, 2010, pp. 329–332.
[P3] S. Henninger, “Tool support for experience-based methodologies,” Lect. Notes Comput. Sci. (including Subser. Lect. Notes Artif. In-tell. Lect. Notes Bioinformatics), vol. 2640, pp. 44–59, 2003.
[P4] S. M. Dray, “Structured observation: techniques for gathering in-formation about users in their own world,” in Conference on Hu-man Factors in Computing Systems - Proceedings, 1996, vol. 3, no. 1971, pp. 334–335.
[P5] H. H. Olsson and J. Bosch, The HYPEX model: From opinions to data-driven software development. 2014.
[P6] K. Smart and D. Norton, “Creating effective and enjoyable docu-mentation: Enhancing the experience of users by aligning infor-mation with strategic direction and customer insights,” in SIGDOC 2001: Special Interest Group for Documentation Proceedings of the 19th Annual International Conference on Systems Documentation Communication in the New Millenium, 2001, p. 220.
[P7] M. Sumrell, “From waterfall to agile - How does a QA team transi-tion?,” in Proceedings - AGILE 2007, 2007, pp. 291–294.
[P8] E. L. Wagner and G. Piccoli, “Moving beyond user participation to achieve successful IS design,” Commun. ACM, vol. 50, no. 12, pp. 51–55, Dec. 2007.
[P9] W. Zhou and W. Duan, “An empirical study of how third-party
237

251
websites influence the feedback mechanism between online Word-of-Mouth and retail sales,” Decis. Support Syst., vol. 76, pp. 14–23, 2015.
[P10] L. Peska, “User feedback and preferences mining,” in Lecture Notes in Computer Science (including subseries Lecture Notes in Artificial Intelligence and Lecture Notes in Bioinformatics), 2012, vol. 7379 LNCS, pp. 382–386.
[P11] T. Sauvola, L. E. Lwakatare, T. Karvonen, P. Kuvaja, H. H. Olsson, J. Bosch, and M. Oivo, “Towards Customer-Centric Software De-velopment: A Multiple-Case Study,” 2015 41st Euromicro Conf. Softw. Eng. Adv. Appl., pp. 9–17, 2015.
[P12] G. Lohan, K. Conboy, and M. Lang, “Examining Customer Focus in IT Project Management.,” Scand. J. Inf. Syst., vol. 23, no. 2, pp. 29–58, 2011.
[P13] H. H. . Olsson, J. . Bosch, and H. . Alahyari, “Towards R&D as in-novation experiment systems: A framework for moving beyond ag-ile software development,” in IASTED Multiconferences - Pro-ceedings of the IASTED International Conference on Software Engineering, SE 2013, 2013, pp. 798–805.
[P14] S. . Carter, F. . Chen, A. S. . Muralidharan, and J. . Pickens, “DiG: A task-based approach to product search,” in International Confer-ence on Intelligent User Interfaces, Proceedings IUI, 2011, pp. 303–306.
[P15] R. Pierce, “Using customer input to drive change in user assis-tance,” in Proceedings of the 26th annual ACM international con-ference on Design of communication - SIGDOC ’08, 2008, p. 23.
[P16] A. Fabijan, H. H. Olsson, and J. Bosch, “Data-driven decision-making in product R&D,” Lect. Notes Bus. Inf. Process., vol. 212, pp. 350–351, 2015.
[P17] D. Bahn and J. Naumann, “Conversation about software require-ments with prototypes and scenarios,” Next Gener. Inf., vol. 2382, pp. 147–157, 2002.
[P18] H. H. Olsson, H. Alahyari, and J. Bosch, “Climbing the ‘Stairway to heaven’ - A mulitiple-case study exploring barriers in the transition from agile development towards continuous deployment of soft-ware,” in Proceedings - 38th EUROMICRO Conference on Soft-ware Engineering and Advanced Applications, SEAA 2012, 2012, pp. 392–399.
[P19] D. Kutetsky and V. Gritsyuk, “KSU feedback service as a tool for getting feedback in educational institutions. perspectives of use in government organizations and commercial companies,” in CEUR
238
252
Workshop Proceedings, 2012, vol. 848, pp. 134–146. [P20] C. M. Pancake, “Can users play an effective role in parallel tools
research?,” Int. J. High Perform. Comput. Appl., vol. 11, no. 2, pp. 84–94, 1997.
[P21] D. Zumstein, A. Drobnjak, and A. Meier, “Data privacy in web ana-lytics: An empirical study and declaration model of data collection on websites,” in WEBIST 2011 - Proceedings of the 7th Interna-tional Conference on Web Information Systems and Technologies, 2011, pp. 466–472.
[P22] A. Fabijan, H. H. Olsson, and J. Bosch, “Early Value Argumenta-tion and Prediction: An Iterative Approach to Quantifying Feature Value,” in Product-Focused Software Process Improvement - Pro-ceedings of the 16th International Conference on Product-Focused Software Process Improvement (PROFES 2015), Bolzano, Italy, De-cember 2-4, 2015, 2015, vol. LNCS 9459, pp. 16–23.
[P23] S. Henninger, “Tool Support for Experience-Based Software De-velopment Methodologies,” Adv. Comput., vol. 59, no. C, pp. 29–82, 2003.
[P24] H. R. Hartson and E. C. Smith, “Rapid prototyping in human-computer interface development,” Interact. Comput., vol. 3, no. 1, pp. 51–91, Apr. 1991.
[P25] J. . De Castro Lima, T. G. . De Senna Carneiro, R. M. . Pagliares, J. C. . Ferreira, E. T. . Yano, and J. B. M. . Sobral, “Archcollect: A set of components towards web users’ interaction,” in ICEIS 2003 - Proceedings of the 5th International Conference on Enterprise In-formation Systems, 2003, vol. 4, pp. 308–316.
[P26] U. Eklund and J. Bosch, “Architecture for large-scale innovation experiment systems,” in Proceedings of the 2012 Joint Working Conference on Software Architecture and 6th European Confer-ence on Software Architecture, WICSA/ECSA 2012, 2012, pp. 244–248.
[P27] D. Bajic and K. Lyons, “Leveraging Social Media to Gather User Feedback for Software Development,” Proc. 2nd Int. Work. Web 2.0 Softw. Eng., pp. 1–6, 2011.
[P28] S. M. Dray, “Practical observation skills for understanding users and their work in context,” in CHI ’99 extended abstracts on Hu-man factors in computing systems - CHI '99, 1999, pp. 106–107.
[P29] R. Teusner, M. Perscheid, M. Appeltauer, J. Enderlein, T. Kling-beil, and M. Kusber, “Populaid: In-memory test data generation,” in Lecture Notes in Computer Science (including subseries Lecture Notes in Artificial Intelligence and Lecture Notes in Bioinformat-ics), 2015, vol. 8991, pp. 101–108.
239

253
[P30] D. Adebanjo, “Evaluating the effects of Customer Relationship Management using modelling and simulation techniques,” in 2006 IEEE International Conference on Management of Innovation and Technology, 2006, vol. 1, pp. 451–454.
[P31] A. Viswanathan, P. Venkatesh, B. Vasudevan, R. Balakrishnan, and L. Shastri, “Suggestion mining from customer reviews,” in 17th Americas Conference on Information Systems 2011, AMCIS 2011, 2011, vol. 2, pp. 1351–1359.
[P32] H. Yang and J. Tang, “A three‐stage model of requirements elicita-tion for Web‐based information systems,” Ind. Manag. Data Syst., vol. 103, no. 6, pp. 398–409, 2003.
[P33] W. Maalej, H.-J. Happel, and A. Rashid, “When Users Become Collaborators: Towards Continuous and Context-Aware User In-put,” in OOPSLA ’09 Proceedings of the 24th ACM SIGPLAN conference companion on Object oriented programming systems languages and applications, 2009, pp. 981–990.
[P34] E. L. May and B. A. Zimmer, “The evolutionary development mod-el for software,” Hewlett-Packard J., vol. 47, no. 4, pp. 39–45, 1996.
[P35] D. Harrell, The influence of consumer-generated content on cus-tomer experiences and consumer behavior. 2008.
[P36] J. Zhang and J. Chung, “Mockup-driven fast-prototyping method-ology for Web application development,” Softw. Pract. Exp., vol. 33, no. 13, pp. 1251–1272, Nov. 2003.
[P37] A. Lancaster, “Paper Prototyping: The Fast and Easy Way to De-sign and Refine User Interfaces,” Ieee Trans. Prof. Commun., vol. 47, no. 4, pp. 335–336, Dec. 2003.
[P38] J. Park, T. Fukuhara, I. Ohmukai, H. Takeda, and S. Lee, “Web content summarization using social bookmarks,” in Proceeding of the 10th ACM workshop on Web information and data manage-ment - WIDM ’08, 2008, no. 6, p. 103.
[P39] D. Consoli, C. Diamantini, and D. Potena, “Improving the custom-er intelligence with customer enterprise customer model,” in ICEIS 2008 - 10th International Conference on Enterprise Infor-mation Systems, Proceedings, 2008, vol. SAIC, pp. 323–326.
[P40] M. Kumar, M. Shukla, and S. Agarwal, “A Hybrid Approach of Re-quirement Engineering in Agile Software Development,” 2013 Int. Conf. Mach. Intell. Res. Adv., pp. 515–519, 2013.
[P41] J. D. Carol Britton, “2 – Requirements for the Wheels case study system,” in A Student Guide to Object-Oriented Development, C. Britton and J. Doake, Eds. Oxford: Butterworth-Heinemann, 2005, pp. 21–38.
240
254
[P42] K. Holtzblatt, J. B. Wendell, and S. Wood, “Contextual Interview Interpretation Session,” Power, pp. 101–122, 2005.
[P43] J. Arnowitz, M. Arent, and N. Berger, “Chapter 14 - Card Sorting Prototyping,” in Effective Prototyping for Software Makers, J. Ar-nowitz, M. Arent, and N. Berger, Eds. San Francisco: Morgan Kaufmann, 2007, pp. 250–271.
[P44] J. Arnowitz, M. Arent, and N. Berger, “Chapter 12 - Validate and Iterate the Prototype,” in Effective Prototyping for Software Mak-ers, J. Arnowitz, M. Arent, and N. Berger, Eds. San Francisco: Morgan Kaufmann, 2007, pp. 234–241.
[P45] E. B. Seufert, “Analytics and Freemium Products,” Free. Econ., pp. 29–46, 2014.
[P46] C. Wilson, User Experience Re-Mastered. Boston: Elsevier, 2010. [P47] K. Holtzblatt, J. B. Wendell, and S. Wood, “Chapter 12 - Story-
boarding,” in Rapid Contextual Design, K. Holtzblatt, J. B. Wen-dell, and S. Wood, Eds. San Francisco: Morgan Kaufmann, 2005, pp. 229–243.
[P48] R. Hoda, J. Noble, and S. Marshall, “The impact of inadequate cus-tomer collaboration on self-organizing Agile teams,” Inf. Softw. Technol., vol. 53, no. 5, pp. 521–534, 2011.
[P49] D. Nicholas, P. Huntington, H. R. Jamali, and A. Watkinson, “The information seeking behaviour of the users of digital scholarly journals,” Inf. Process. Manag., vol. 42, no. 5, pp. 1345–1365, 2006.
[P50] K. Holtzblatt, J. B. Wendell, and S. Wood, “Chapter 15 - Rapid CD and Other Methodologies,” in Interactive Technologies, K. Holtzblatt, J. B. Wendell, and S. Wood, Eds. San Francisco: Mor-gan Kaufmann, 2005, pp. 279–290.
[P51] Thomas Tullis, William Albert, T. Tullis, and B. Albert, “Chapter 3 - Planning a Usability Study,” in Measuring the User Experience; Collecting, Analyzing, and Presenting Usability Metrics Interactive Technologies 2013, T. Tullis and B. Albert, Eds. San Francisco: Morgan Kaufmann, 2013, pp. 41–62.
[P52] G. Cordasco, M. T. Riviello, V. Capuano, I. Baldassarre, and A. Es-posito, “Youtube emotional database: How to acquire user feed-back to build a database of emotional video stimuli,” in 4th IEEE International Conference on Cognitive Infocommunications, CogInfoCom 2013 - Proceedings, 2013, pp. 381–386.
[P53] H. H. Olsson and J. Bosch, “Towards Continuous Customer Vali-dation�: A conceptual model for combining qualitative customer feedback with quantitative customer observation,” LNBIP, vol. 210, pp. 154–166, 2015.
[P54] I. Morales-ramirez, A. Perini, and R. S. S. Guizzardi, “An ontology
241
255
of online user feedback in software engineering,” Appl. Ontol., vol. 10, no. 3–4, pp. 297–330, 2015.
[P55] M. Rauschenberger, S. Olschner, M. P. Cota, M. Schrepp, and J. Thomaschewski, “Measurement of user experience A Spanish Lan-guage Version of the User Experience Questionnaire (UEQ),” Sist. Y Tecnol. Inf. Vols 1 2, pp. 471–476, 2012.
[P56] J. Evnin and M. Pries, “Are you sure? Really? A contextual ap-proach to agile user research,” in Proceedings - Agile 2008 Confer-ence, 2008, pp. 537–542.
[P57] S. Blank, “Why the Lean Start Up Changes Everything,” Harv. Bus. Rev., vol. 91, no. 5, p. 64, May 2013.
[P58] A. Caione, R. Paiano, A. L. Guido, M. Fait, and P. Scorrano, Tech-nological Tools Integration and Ontologies for Knowledge Extrac-tion from Unstructured Sources: A Case of Study for Marketing in Agri-Food Sector. Rome, Italy, 2013.
[P59] J. Yli-Huumo, T. Rissanen, A. Maglyas, K. Smolander, and L.-M. Sainio, “The Relationship Between Business Model Experimenta-tion and Technical Debt,” Softw. Business, Icsob 2015, vol. 210, pp. 17–29, 2015.
[P60] M. Almaliki, C. Ncube, and R. Ali, “The Design of Adaptive Acqui-sition of Users Feedback: an Empirical Study,” in 2014 Ieee Eighth International Conference on Research Challenges in Information Science (Rcis), 2014.
[P61] K. Blumer, N. AlGharibeh, and M. Eid, “TOP: Tactile Opinion Poll System for Silent Feedback,” 2014 Ieee Int. Symp. Haptic, Audio Vis. Environ. Games, 2014.
[P62] I. Morales-Ramirez, A. Perini, and R. Guizzardi, “Providing Foun-dation for User Feedback Concepts by Extending a Communica-tion Ontology,” Lect. Notes Comput. Sci., vol. 8824, pp. 305–312, 2014.
[P63] H. H. Olsson and J. Bosch, “From opinions to data-driven software R&D: A multi-case study on how to close the ‘open loop’ prob-lem,” in Proceedings - 40th Euromicro Conference Series on Soft-ware Engineering and Advanced Applications, SEAA 2014, 2014, pp. 9–16.
[P64] B. Bruegge, O. Creighton, M. Reiß, and H. Stangl, “Applying a vid-eo-based requirements engineering technique to an airport scenar-io,” in 2008 3rd International Workshop on Multimedia and Enjoy-able Requirements Engineering, MERE’08, 2008, p. 11.
[P65] D. Pagano and B. Bruegge, “User involvement in software evolu-tion practice: A case study,” in 2013 35th International Conference
242

256
on Software Engineering (ICSE), 2013, pp. 953–962. [P66] S. R. Humayoun, Y. Dubinsky, and T. Catarci, “UEMan: A tool to
manage user evaluation in development environments,” in Pro-ceedings - International Conference on Software Engineering, 2009, pp. 551–554.
[P67] P. Bosch-Sijtsema and J. Bosch, “User Involvement throughout the Innovation Process in High-Tech Industries,” J. Prod. Innov. Manag., vol. 32, no. 5, pp. 1–36, 2014.
[P68] D. Wu, D. Yang, and B. Boehm, “Finding success in rapid collabo-rative requirements negotiation using wiki and shaper,” in Pro-ceedings of the Annual Hawaii International Conference on Sys-tem Sciences, 2010, pp. 1–10.
[P69] B. Grubaugh, S. Thomas, and J. Weinberg, The Effects of the Testing Environment on User Performance in Software Usability Testing. 2005.
[P70] N. P. Singh and R. Soni, “Agile software: Ensuring quality assur-ance and processes,” Commun. Comput. Info. Sci., vol. 169 CCIS. pp. 640–648, 2011.
[P71] P. G. Yammiyavar, T. Clemmensen, and J. Kumar, “Influence of Cultural Background on Non-verbal Communication in a Usability Testing Situation,” Int. J. Des., vol. 2, no. 2, pp. 31–40, Dec. 2008.
243


MALMÖ UNIVERSITY
205 06 MALMÖ, SWEDEN
WWW.MAH.SE
isbn 978-91-7104-736-6 (print)
isbn 9978-91-7104-737-3 (pdf)
AL
EK
SA
ND
ER
FA
BIJA
N
MA
LM
Ö U
NIV
ER
SIT
Y 2
01
6D
EV
ELO
PIN
G T
HE
RIG
HT
FE
AT
UR
ES
: TH
E R
OL
E A
ND
IMP
AC
T O
F C
US
TO
ME
R A
ND
PR
OD
UC
T D
ATA
IN S
OF
TW
AR
E P
RO
DU
CT
DE
VE
LOP
ME
NT
L I C