alcohol and drug-crash problem in canada 2012...
TRANSCRIPT
CCMTA Road Safety Research Report Series
Alcohol and Drug-Crash Problem in Canada
2012 Report
Prepared for the Canadian Council of Motor Transport Administrators by the Traffic Injury Research Foundation of Canada


iii
December 2015 © Canadian Council of Motor Transport Administrators Prepared by: S.W. Brown, W.G.M. Vanlaar, and R.D. Robertson The Traffic Injury Research Foundation of Canada Ottawa, Ontario This publication may be reproduced without permission provided that its use is solely for the purposes of private study, research, criticism, review or newspaper summary and the source if fully acknowledged. ISBN# 978-1-927993-17-0
iv
ABSTRACT
This report describes the magnitude and characteristics of the alcohol-crash and drug-crash problems in Canada during 2012 as well as trends in these problems.
Information contained in this report was drawn from two national databases compiled and maintained by the Traffic Injury Research Foundation (TIRF) and funded jointly by the Public Health Agency of Canada and State Farm. One database contains information on persons fatally injured in motor vehicle crashes; the other has information on persons seriously injured in motor vehicle crashes.
This report is prepared on behalf of the Canadian Council of Motor Transport Administrators (CCMTA). This report examines: data on alcohol in fatally injured drivers and pedestrians; the number and percent of people who died in alcohol-related crashes; alcohol involvement in those crashes in which someone was seriously injured but not killed; and data on drugs in fatally injured drivers.
Thus, in the report, various indicators are used to estimate the magnitude and extent of the alcohol-crash problem and drug-crash problem in Canada during 2012 as well as changes in these problems over the past few years. The indicators include:
> the number and percent of people who were killed in crashes that involved alcohol;
> the number and percent of fatally injured drivers who had been drinking;
> the number and percent of fatally injured pedestrians who had been drinking;
> the number and percent of drivers in serious injury crashes that involved alcohol; and
> the number and percent of fatally injured drivers who were positive for drugs.
As well, these indicators are presented separately for each province and territory.
Finally, this report also examines the degree to which there has been a reduction in: (1) fatalities and serious injuries in collisions involving a drinking driver; and (2) the presence of drugs among fatally injured drivers. Analysis is provided for Canada and each province/territory. An average of the 2011 and 2012 data are compared to data from the 2006-2010 baseline period.
The opinions expressed in this report are those of the authors and do not necessarily represent the views or opinions of the reviewers, jurisdictions or CCMTA, who commissioned this report.
v
TABLE OF CONTENTS
ABSTRACT ..................................................................................................................................................................... iii
ACKNOWLEDGEMENTS ................................................................................................................................................. ix
1.0 INTRODUCTION........................................................................................................................................................ 1
2.0 DATA SOURCES AND INDICATORS OF THE ALCOHOL-CRASH PROBLEM ................................................................. 3 2.1 Sources of the data .............................................................................................................................................. 3 2.2 Indicators of the problem .................................................................................................................................... 9
3.0 CANADA ................................................................................................................................................................. 13 3.1 Deaths in alcohol-related crashes ..................................................................................................................... 13 3.2 Alcohol in fatally injured drivers ........................................................................................................................ 16 3.3 Alcohol in fatally injured pedestrians ................................................................................................................ 24 3.4 Drivers involved in alcohol-related serious injury crashes ................................................................................ 28 3.5 Drug use among fatally injured drivers.............................................................................................................. 30 3.6 Trends in alcohol and drug-impaired driving ..................................................................................................... 32
4.0 BRITISH COLUMBIA ................................................................................................................................................ 43 4.1 Deaths in alcohol-related crashes ..................................................................................................................... 43 4.2 Alcohol in fatally injured drivers ........................................................................................................................ 45 4.3 Drivers involved in alcohol-related serious injury crashes ................................................................................ 48 4.4 Drug use among fatally injured drivers.............................................................................................................. 50 4.5 Trends in alcohol and drug-impaired driving ..................................................................................................... 51
5.0 ALBERTA ................................................................................................................................................................. 59 5.1 Deaths in alcohol-related crashes ..................................................................................................................... 59 5.2 Alcohol in fatally injured drivers ........................................................................................................................ 61 5.3 Drivers involved in alcohol-related serious injury crashes ................................................................................ 64 5.4 Drug use among fatally injured drivers.............................................................................................................. 66 5.5 Trends in alcohol and drug-impaired driving ..................................................................................................... 66
6.0 SASKATCHEWAN .................................................................................................................................................... 75 6.1 Deaths in alcohol-related crashes ..................................................................................................................... 75 6.2 Alcohol in fatally injured drivers ........................................................................................................................ 77 6.3 Drivers involved in alcohol-related serious injury crashes ................................................................................ 80 6.4 Drug use among fatally injured drivers.............................................................................................................. 82 6.5 Trends in alcohol and drug-impaired driving ..................................................................................................... 82
7.0 MANITOBA ............................................................................................................................................................. 91 7.1 Deaths in alcohol-related crashes ..................................................................................................................... 91 7.2 Alcohol in fatally injured drivers ........................................................................................................................ 93 7.3 Drivers involved in alcohol-related serious injury crashes ................................................................................ 96 7.4 Drug use among fatally injured drivers.............................................................................................................. 97 7.5 Trends in alcohol and drug-impaired driving ..................................................................................................... 98
8.0 ONTARIO .............................................................................................................................................................. 107

vi
8.1 Deaths in alcohol-related crashes ................................................................................................................... 107 8.2 Alcohol in fatally injured drivers ...................................................................................................................... 109 8.3 Drivers involved in alcohol-related serious injury crashes .............................................................................. 112 8.4 Drug use among fatally injured drivers............................................................................................................ 113 8.5 Trends in alcohol and drug-impaired driving ................................................................................................... 114
9.0 QUEBEC ................................................................................................................................................................ 123 9.1 Deaths in alcohol-related crashes ................................................................................................................... 123 9.2 Alcohol in fatally injured drivers ...................................................................................................................... 125 9.3 Drivers involved in alcohol-related serious injury crashes .............................................................................. 128 9.4 Drug use among fatally injured drivers............................................................................................................ 129 9.5 Trends in alcohol and drug-impaired driving ................................................................................................... 130
10.0 NEW BRUNSWICK .............................................................................................................................................. 139 10.1 Deaths in alcohol-related crashes.................................................................................................................. 139 10.2 Alcohol in fatally injured drivers .................................................................................................................... 141 10.3 Drivers involved in alcohol-related serious injury crashes ............................................................................ 144 10.4 Drug use among fatally injured drivers.......................................................................................................... 145 10.5 Trends in alcohol and drug-impaired driving ................................................................................................. 146
11.0 NOVA SCOTIA ..................................................................................................................................................... 155 11.1 Deaths in alcohol-related crashes.................................................................................................................. 155 11.2 Alcohol in fatally injured drivers .................................................................................................................... 157 11.3 Drivers involved in alcohol-related serious injury crashes ............................................................................ 160 11.4 Drug use among fatally injured drivers.......................................................................................................... 161 11.5 Trends in alcohol and drug-impaired driving ................................................................................................. 162
12.0 PRINCE EDWARD ISLAND ................................................................................................................................... 171 12.1 Deaths in alcohol-related crashes.................................................................................................................. 171 12.2 Alcohol in fatally injured drivers .................................................................................................................... 173 12.3 Drivers involved in alcohol-related serious injury crashes ............................................................................ 176 12.4 Drug use among fatally injured drivers.......................................................................................................... 177 12.5 Trends in alcohol and drug-impaired driving ................................................................................................. 178
13.0 NEWFOUNDLAND AND LABRADOR ................................................................................................................... 187 13.1 Deaths in alcohol-related crashes.................................................................................................................. 187 13.2 Alcohol in fatally injured drivers .................................................................................................................... 189 13.3 Drivers involved in alcohol-related serious injury crashes ............................................................................ 192 13.4 Drug use among fatally injured drivers.......................................................................................................... 193 13.5 Trends in alcohol and drug-impaired driving ................................................................................................. 194
14.0 YUKON ............................................................................................................................................................... 203 14.1 Deaths in alcohol-related crashes.................................................................................................................. 203 14.2 Alcohol in fatally injured drivers .................................................................................................................... 203 14.3 Drivers involved in alcohol-related serious injury crashes ............................................................................ 203 14.4 Drug use among fatally injured drivers.......................................................................................................... 205 14.5 Trends in alcohol and drug-impaired driving ................................................................................................. 205
15.0 NORTHWEST TERRITORIES................................................................................................................................. 209 15.1 Deaths in alcohol-related crashes.................................................................................................................. 209 15.2 Alcohol use among fatally injured drivers ..................................................................................................... 209 15.3 Drivers involved in alcohol-related serious injury crashes ............................................................................ 209
vii
15.4 Drug use among fatally injured drivers.......................................................................................................... 210 15.5 Trends in alcohol and drug-impaired driving ................................................................................................. 210
16.0 NUNAVUT .......................................................................................................................................................... 215 16.1 Deaths in alcohol-related crashes.................................................................................................................. 215 16.2 Alcohol in fatally injured drivers .................................................................................................................... 215 16.3 Drivers involved in alcohol-related serious injury crashes ............................................................................ 215 16.4 Drug use among fatally injured drivers.......................................................................................................... 217 16.5 Trends in alcohol and drug-impaired driving ................................................................................................. 217
17.0 REFERENCES ....................................................................................................................................................... 221


ix
ACKNOWLEDGEMENTS
The Traffic Injury Research Foundation of Canada (TIRF) has compiled data on alcohol use among motor vehicle fatalities since the 1973 calendar year. Beginning in 1995, TIRF has also compiled data on alcohol use in serious injury motor vehicle crashes. All aspects of this work, particularly the development, maintenance, and extension of the Fatality Database and the Serious Injury Database, would have been impossible without the generous support and co-operation of sponsors and collaborating agencies.
The maintenance and extension of the Fatality Database and the Serious Injury Database are co-funded by the Public Health Agency of Canada and State Farm. This report was prepared on behalf of the Canadian Council of Motor Transport Administrators.
We gratefully acknowledge the following individuals, their organizations and members of their staff for ensuring that complete and accurate data were made available to us:
S. Senghera Manager, Road Safety Policy and Programming Insurance Corp. of British Columbia
L. Lapointe Chief Coroner Office of the Chief Coroner British Columbia
W. Doyle Executive Director Office of Traffic Safety Alberta Transportation
A. Sauvageau, M.D. Chief Medical Examiner Alberta Attorney General
R. Brenner Traffic Accident Information System Saskatchewan Government Insurance
K. Stewart Chief Coroner Saskatchewan Justice
W.A. Keith Registrar of Motor Vehicles Manitoba Public Insurance
T. Balachandra, M.D. Chief Medical Examiner Manitoba Justice
H. Francis Director Safety Policy and Education Branch Ontario Ministry of Transportation
D. Huyer, M.D. Interim Chief Coroner for Ontario Ontario Ministry of the Solicitor General
L. Vézina Directrice des études et des stratégies en sécurité routière Société de l'assurance automobile du Québec
Dre L. Nolet Le coroner en chef Bureau du Coroner Québec
C. O’Connell Registrar of Motor Vehicles Department of Public Safety New Brunswick
G. Forestell Chief Coroner Department of Public Safety New Brunswick

x
P. Arsenault Registrar of Motor Vehicles Service Nova Scotia & Municipal Relations Nova Scotia
M. Bowes, M.D. Chief Medical Examiner Department of the Attorney General Nova Scotia
C. Burggraaf Registrar of Motor Vehicles Department of Government Services and Lands Newfoundland and Labrador
Dr. S. Avis Chief Medical Examiner Newfoundland and Labrador
M. Conway Director Road Licensing and Safety Division Dept. of Transportation Northwest Territories
C. Menard Chief Coroner Department of Justice Northwest Territories
T. Bendera Manager, Motor Vehicles Yukon Department of Motor Vehicles
K. MacDonald Chief Coroner Yukon Department of Justice
G. Miner Director, Highway Safety Department of Transportation and Public Works Prince Edward Island
H. Khanam, M.D. Director of Laboratory Medicine Queen Elizabeth Hospital Prince Edward Island
L. Gee Director, Motor Vehicle Division Nunavut
C. Trainor, M.D. Chief Medical Examiner Prince Edward Island
P. Suramala Chief Coroner Nunavut
1
1.0 INTRODUCTION
This report describes the magnitude and characteristics of the alcohol-crash and drug-crash problems in Canada during 2012 as well as trends in these problems. It includes data on alcohol in fatally injured drivers and pedestrians as well as data on drugs in fatally injured drivers derived from the Fatality Database. For the past two and a half decades, the Fatality Database, developed and maintained by the Traffic Injury Research Foundation (TIRF), has provided objective data on alcohol use among persons fatally injured in motor vehicle crashes. Each year, TIRF compiles information from coroner and medical examiners files on the results of toxicological tests for alcohol and drugs in the blood of fatally injured drivers and pedestrians. Given a high testing rate for alcohol in all jurisdictions, particularly among fatally injured drivers, the Fatality Database has proven a valid and reliable source of descriptive data on the magnitude and characteristics of the alcohol-fatal crash problem, a means for monitoring changes/trends in the problem as well as a valuable tool for research on alcohol-impaired driving. Previously, funding for the maintenance of the Fatality Database and the publication of a related report, The Alcohol-Crash Problem in Canada, was co-funded by Transport Canada and the Canadian Council of Motor Transport Administrators (CCMTA). Presently, the data collection component of the Fatality Database is co-funded by the Public Health Agency of Canada and State Farm. This report was prepared on behalf of the Canadian Council of Motor Transport Administrators (CCMTA) who provided funding for its publication.
This report also uses supplemental data obtained from police collision reports and coroner files to examine the number and percent of people who died in alcohol-related crashes and the number and percent of drivers testing positive for drugs in Canada. Thus, it extends the focus beyond fatally injured drivers to include all persons killed in road crashes, to provide a better indication of the magnitude and nature of the alcohol-crash problem and drug-crash problem.
This report also examines alcohol involvement in those crashes in which someone was seriously injured but not killed. For this purpose, relevant information is derived from a Serious Injury Database that is constructed and maintained by TIRF. Funding for the construction of the Serious Injury Database was initially provided by Transport Canada and CCMTA as part of a previous project. The continued support of the Serious Injury Database is provided by the Public Health Agency of Canada and State Farm. Since few drivers involved in serious injury crashes are tested for alcohol, a surrogate or indirect measure is used to assess the incidence of alcohol involvement in these crashes.
The report is divided into the following fifteen sections:
Section 2.0 briefly describes the sources of the data – the Fatality Database and Serious Injury Database – and the various indicators of the alcohol-crash problem and drug-crash problem used in this report.
Section 3.0 provides descriptive data on the incidence of alcohol involvement in fatal and serious injury crashes and drug involvement in fatal crashes in Canada during 2012 as well as trends in the problem.
In subsequent sections (4.0 through 16.0), descriptive data on alcohol involvement in fatal and serious injury crashes and drug use by fatally injured drivers in each province and territory are summarized. Trends
2
in the problem and comparisons between the 2011-2012 period and the 2006-2010 baseline period are also examined. Caution should be exercised in interpreting some of the numbers and percentages in Sections 4.0 through 16.0 as some of the subgroups examined are small in number.
3
2.0 DATA SOURCES AND INDICATORS OF THE ALCOHOL-CRASH PROBLEM
Information contained in this report was drawn from two national databases compiled and maintained by TIRF and funded jointly by the Public Health Agency of Canada and State Farm. One database contains information on persons fatally injured in motor vehicle crashes; the other has information on persons seriously injured in motor vehicle crashes. These two sources of information are described in this section of the report.
The section also describes the various indicators that are used to estimate the magnitude and extent of the alcohol-fatal, alcohol-serious injury and drug-fatal crash problems in Canada during 2012 as well as changes in the problem over the past few years. The indicators include:
> the number and percent of people who were killed in crashes that involved alcohol;
> the number and percent of fatally injured drivers who had been drinking;
> the number and percent of fatally injured pedestrians who had been drinking;
> the number and percent of drivers in serious injury crashes that involved alcohol; and,
> the number and percent of fatally injured drivers who were positive for drugs.
2.1 Sources of the data
Two national databases were used to generate the statistics for this report – the Fatality Database and the Serious Injury Database. The Fatality Database was initially developed in the early 1970s to provide a comprehensive source of objective data on alcohol use among persons fatally injured in motor vehicle crashes occurring on and off public highways in Canada. It is historically intact from 1973 to 2011, inclusive, for seven provinces – British Columbia, Alberta, Saskatchewan, Manitoba, Ontario, New Brunswick, and Prince Edward Island. Beginning with 1987, data are available from all jurisdictions in Canada.
The Serious Injury Database was initially constructed in the mid-1990s to examine the incidence of alcohol in crashes that involve a serious injury – i.e., a crash that resulted in a person being admitted to a hospital. It was originally used as a means to assess the extent to which the federal-provincial/territorial Strategy to Reduce Impaired Driving initiatives (STRID 2001, STRID 2010 and now STRID 2015) achieved a reduction in alcohol-related serious injury crashes. Since 1995, relevant information on crashes that involve serious injury has been assembled from all jurisdictions in Canada.
2.1.1 The Fatality Database. The Fatality Database consists of case files (records) of persons fatally injured in motor vehicle crashes. Two sources of information provide data for most case files: (1) police reports on fatal motor vehicle collisions and (2) coroners and medical examiners reports. In general, both sources must be accessed to obtain complete data on victims, crashes, vehicles, and toxicology.

4
Police-reported data include characteristics of the victim (age and sex, position in the vehicle – driver, passenger) and details of the crash (type of vehicle(s) and collision, time, date). Objective, toxicological data on alcohol and drug use among victims are obtained from files in coroners' and medical examiners' offices. The alcohol and drug data are the results of chemical tests, performed on body fluid samples (typically blood) by recognized forensic laboratories or other facilities. Uniform and rigorous testing procedures in each jurisdiction ensure reliable and accurate data on the prior use of alcohol and drugs by victims of motor vehicle collisions. As will be discussed in a subsequent section, there is a high rate of testing for alcohol in most jurisdictions, especially among drivers fatally injured in motor vehicle collisions.
Details of the method used to access and collect relevant police-reported and coroner/medical examiner data on persons fatally injured in motor vehicle collisions as well as the approach used to create case files for the Fatality Database are contained in previous annual reports in this series (e.g., see Mayhew et al. 1999). The sections below provide a definition of a motor vehicle fatality, describe the number and type of victim contained in the Fatality Database, and discuss the testing rates for alcohol overall in Canada as well as in each jurisdiction.
Motor vehicle fatality. A motor vehicle fatality is defined in the data capture procedures, and in this report, as any person dying within 12 months as a result of injuries sustained in a collision involving a motor vehicle. This is different than the 30 day definition which is typically used by the jurisdictions. Out of 2,159 persons fatally injured in 2012 within 12 months of the collision in Canada, 2,118 (or 98.1%) died within 30 days of the collision.
Since this definition of a motor vehicle fatality differs somewhat from those of some coroners/medical examiners and some provincial transportation agencies, the number of fatalities included in the Fatality Database may also differ slightly from those reported by other official sources (see Mayhew et al. 1999 for a description of how these agencies define motor vehicle fatalities). The fatality data reported in Section 2 includes those persons dying within 12 months of the collision. However, in order to increase the compatibility of this report with other sources, data are provided for both victims dying within 12 months of the collision and those dying within 30 days of the collision in Sections 3 thru 16.
Number of fatalities: Official sources compared to the Fatality Database. The Fatality Database contains information on 2,159 persons fatally injured in motor vehicle collisions in Canada during 2012 (excluding British Columbia). This figure is higher than the number that would be obtained by adding together the fatalities officially reported in each jurisdiction in Canada. A key explanation of why the Fatality Database comprises more cases than those identified by transportation agencies is due to historical differences in reporting procedures. TIRF has included persons dying within 12 months (365 days) of the collision whereas transportation agencies have included persons dying within 30 days of the collision. To address this issue, several sections of this report provide data for both victims dying within 12 months and 30 days of the collision.
There are several other explanations why the Fatality Database has more cases than the transportation agencies. Cases that are not captured by transportation agencies yet account for fatalities within the Fatality Database include the following:

5
> Victims of motor vehicle crashes that occurred off-road (e.g., ATV, dirt bike, snowmobile, farm tractors, industrial motor vehicles);
> Victims in collisions which occur on private property, crown land, First Nations lands, or government property;
> Victims involved in a collision in one jurisdiction that die in another jurisdiction;
> Victims involved in a collision in one year that die in the subsequent year (e.g., collide in 2011, die in 2012), provided that the date of death is within 12 months (365 days) of the collision; and,
> Victims identified by the coroner/medical examiner that were coded as an injury or omitted from transportation agency databases (procedures for data collection available to coroners and medical examiners can be more robust and conducive to avoiding the underreporting of crashes).
Figure 2-1 provides a comparison of the number of traffic fatalities reported by transportation agencies with the number of motor vehicle fatalities included in the Fatality Database for 2012. For most of the jurisdictions, the number of cases in the TIRF database is higher than that officially reported by transportation agencies. Data shown exclude British Columbia, whose 2012 fatality data were not available at the time of the publication of this report.
Type of victim. The Fatality Database contains information on three types of victims fatally injured in motor vehicle crashes – drivers/riders, passengers, and pedestrians. Drivers include operators of all types of vehicles, both on road (automobiles, trucks/vans, motorcycles, buses, emergency vehicles) and off-road (bicycles, all-terrain vehicles, dirt bikes, snowmobiles, and farm tractors). Similarly, passengers include other

6
vehicle occupants as well as persons riding on vehicles (motorcycles, bicycles, ATVs) but not driving or operating them. And, finally, pedestrians are those individuals travelling on foot that were struck and fatally injured by a motor vehicle.
In Canada during 2012, almost 2 out of every 3 fatalities were operators of motor vehicles (64.6%); 20.0% were passengers; and 15.4% were pedestrians. From this perspective, vehicle occupants, particularly drivers, remain the major road-user group of concern.
Testing rates for alcohol. The inclusion of objective data on the presence of alcohol among traffic victims represents an important feature of the Fatality Database. The value of this information depends greatly on the frequency with which tests for the presence of alcohol are performed on the body fluids of victims.
In Canada during 2012, fatally injured drivers were tested most frequently (83.1%), followed by pedestrians (65.5%) and passengers (38.5%). The testing rate among fatally injured pedestrians and passengers increases slightly if victims under the age of 16, who are less often tested, are excluded (68.6% and 40.2%, respectively). Testing rates also increase among fatally injured pedestrians if the analyses focus only on persons dying less than six hours after the crash (applying this restriction, the testing rate among pedestrians increases to 82.2%).
The rate of testing for alcohol varies not only as a function of the type of victim but by jurisdiction as well. This is illustrated graphically in Figure 2-2, which shows the rate of testing for alcohol among fatally injured drivers in the various jurisdictions.
Most jurisdictions test over 80.0% of the driver fatalities. In some jurisdictions, there is clearly room for improvement – the testing rates need to be increased to enhance the reliability and utility of the information. In those jurisdictions with a high rate of testing for fatally injured drivers, there are various reasons why tests are not done on some drivers. This occurs, for example, when the victim survived the initial crash and died much later – the alcohol results at that time would be of little value. Or, if extensive transfusions were given to the victim prior to death, there is little point in taking a blood sample for an

7
alcohol test. And, if the victim were incinerated in a vehicle fire, or massive injuries resulted in exsanguination (i.e., excessive loss of blood), body fluids may not be available for testing.
Figure 2-3 shows the rate of testing for alcohol among fatally injured pedestrians in the various jurisdictions. As can be seen, there is considerable variation in the rate of testing – from 50.0% in Nova Scotia and Newfoundland and Labrador to 100.0% in Prince Edward Island and the Northwest Territories.
2.1.2 The Serious Injury Database. The Serious Injury Database contains information on persons seriously injured in crashes and on all drivers involved in these crashes, whether the driver was injured or not. The data come from motor vehicle crash reports completed by investigating police officers. The information compiled for each seriously injured person and crash-involved driver includes: personal characteristics (age and sex); factors contributing to the crash, including police-reported alcohol involvement; type of vehicle driven/occupied (e.g., automobile, truck/van, motorcycle) and the details of the crash (time, date, type of collision – multiple vehicle/single vehicle).
To construct the database, annual motor vehicle collision data are obtained from each jurisdiction in Canada. These data are either provided to TIRF by the relevant agency in the jurisdiction or, in some cases, provided to TIRF by Transport Canada who received the collision data from the jurisdiction. Relevant information on collisions in which someone was seriously injured is extracted from the provincial/territorial data files and then aggregated into the national Serious Injury Database.
The Serious Injury Database provides data from 1995 to 2012 for most jurisdictions. Only since 1998 in the Yukon and 2005 in British Columbia have investigating officers been able to record on the police report form whether the crash involved a serious injury or, at the person level, the severity of the injury a person sustained in the crash. Accordingly, it was not possible to identify persons who sustained a serious injury or drivers involved in serious injury crashes in those jurisdictions prior to the dates indicated. For this reason, the Canadian trend data presented in Section 3.6.4 include only data from 2005 to 2012. However, for other jurisdictions, trend data are available since 1995.
8
In the case of British Columbia (17.6%), Newfoundland and Labrador (2.9%), and the Northwest Territories (2.7%), some injury severities are recorded as “unspecified”, so the number of drivers in serious injury crashes used in this report for these three jurisdictions might be underestimated.
The sections below provide a definition of a serious injury crash, describe the number and type of cases contained in the Serious Injury Database, and discuss the use of a surrogate or indirect measure to assess alcohol involvement in these crashes.
Serious injury. A serious injury crash is one that resulted in at least one person being admitted to a hospital. The serious injury may have been sustained by a driver, passenger or pedestrian involved in the crash (i.e., the driver involved in a serious injury crash may not have been the person seriously injured).
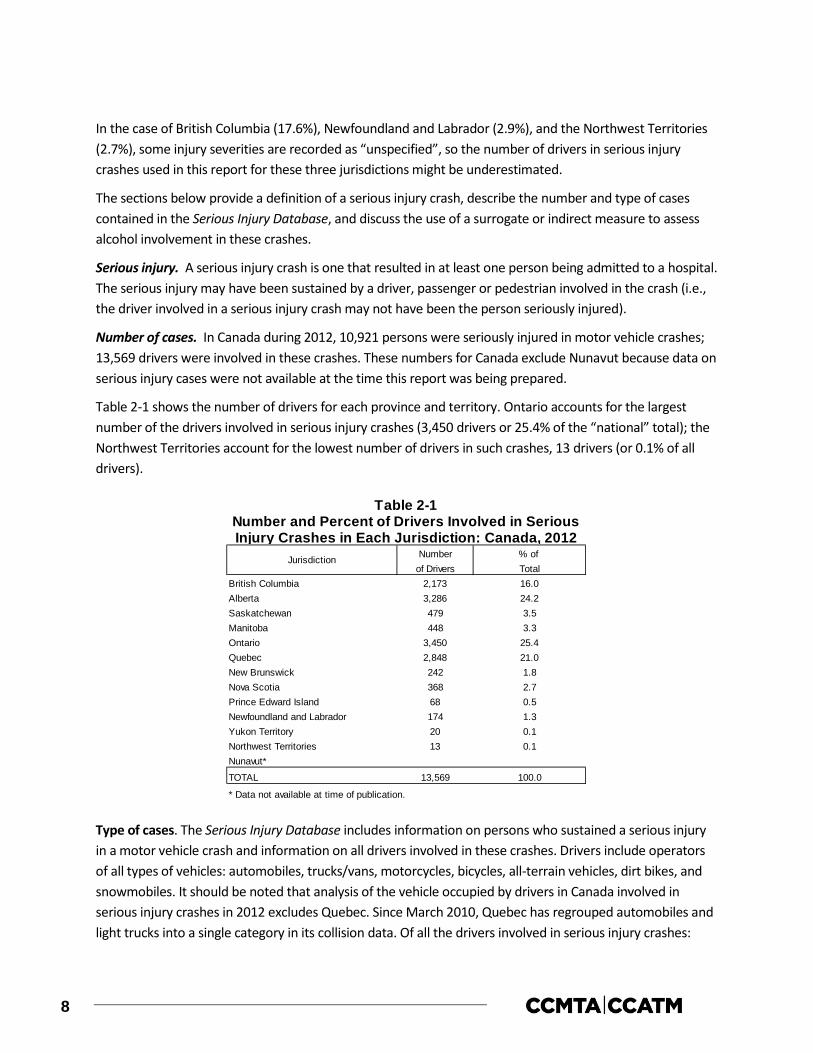
Number of cases. In Canada during 2012, 10,921 persons were seriously injured in motor vehicle crashes; 13,569 drivers were involved in these crashes. These numbers for Canada exclude Nunavut because data on serious injury cases were not available at the time this report was being prepared.
Table 2-1 shows the number of drivers for each province and territory. Ontario accounts for the largest number of the drivers involved in serious injury crashes (3,450 drivers or 25.4% of the “national” total); the Northwest Territories account for the lowest number of drivers in such crashes, 13 drivers (or 0.1% of all drivers).
Type of cases. The Serious Injury Database includes information on persons who sustained a serious injury in a motor vehicle crash and information on all drivers involved in these crashes. Drivers include operators of all types of vehicles: automobiles, trucks/vans, motorcycles, bicycles, all-terrain vehicles, dirt bikes, and snowmobiles. It should be noted that analysis of the vehicle occupied by drivers in Canada involved in serious injury crashes in 2012 excludes Quebec. Since March 2010, Quebec has regrouped automobiles and light trucks into a single category in its collision data. Of all the drivers involved in serious injury crashes:
Number % of of Drivers Total
British Columbia 2,173 16.0Alberta 3,286 24.2Saskatchewan 479 3.5Manitoba 448 3.3Ontario 3,450 25.4Quebec 2,848 21.0New Brunswick 242 1.8Nova Scotia 368 2.7Prince Edward Island 68 0.5Newfoundland and Labrador 174 1.3Yukon Territory 20 0.1Northwest Territories 13 0.1Nunavut*
TOTAL 13,569 100.0
* Data not available at time of publication.
Table 2-1Number and Percent of Drivers Involved in SeriousInjury Crashes in Each Jurisdiction: Canada, 2012
Jurisdiction

9
almost half were automobile drivers (47.6%); one-third were truck/van drivers (33.5%); 8.7% were motorcycle riders; 5.0% were off-road vehicle drivers (e.g., snowmobiles, all-terrain vehicles, dirt bikes); 3.4% were tractor-trailer drivers; and 1.2% were drivers of other types of highway vehicles (e.g., buses, emergency vehicles).
A surrogate measure of alcohol involvement. Drivers in serious injury crashes are seldom tested for alcohol. The investigating police officer may, however, indicate the condition of each of the drivers involved in the crash (e.g., whether or not they had been drinking), or in the case of Quebec, if alcohol was “a probable cause” in the crash. Unfortunately, a judgement by police about the drivers’ use of alcohol is not always made. In addition, the investigating police officer may determine that some other factor – e.g., driver fatigue, medical or physical defect – would more accurately describe the condition of the driver. Thus, relying exclusively on police-reported alcohol involvement would underestimate the magnitude of the alcohol-related serious injury crash problem.
To overcome this data limitation, a surrogate or indirect measure of alcohol involvement is used in this report. A description of this surrogate measure is provided in the next section.
2.2 Indicators of the problem
The indicators used to describe the magnitude and nature of the alcohol-related fatal and serious injury crash problem include:
> the number and percent of people who are killed in alcohol-related crashes;
> the number and percent of fatally injured drivers who had been drinking or were legally impaired;
> the number and percent of pedestrians who had been drinking;
> the number and percent of drivers in serious injury crashes that involved alcohol.
In addition, the following indicator is used to describe the magnitude and nature of the drug-crash problem:
> the number and percent of fatally injured drivers who were positive for drugs.
Each of these indicators of the problem is described briefly below.
2.2.1 The number and percent of people killed in alcohol-related crashes. For each person killed in a motor vehicle crash, it was possible to determine if alcohol was a factor in the crash. A motor vehicle fatality was considered to be alcohol-related if there was at least one drinking driver or drinking pedestrian in the fatal crash.
To determine if alcohol was involved in the fatal crash, information on the BAC of fatally injured drivers and pedestrians from the Fatality Database was supplemented with any other evidence of alcohol in the fatal crash identified from either the coroner’s report or from the police collision report – e.g., the police reported that a driver or pedestrian in the fatal crash had consumed alcohol. The review of coroner files and police reports provided information on the presence of alcohol among drivers who died but were not

10
chemically tested for alcohol; drivers who survived (virtually all of whom are not tested), and pedestrians who were not tested.
Among all the people who died in motor vehicle crashes both on- and off-road in Canada during 2012, it was possible to determine if alcohol was a factor in the crash in 91.8% of the cases.
In addition, for Canada and each jurisdiction, this report describes characteristics and trends in the number of deaths in crashes involving a drinking driver. This particular indicator only considers a fatality to be alcohol-related if at least one driver (either killed or surviving) had been drinking. For this variable, only fatalities occurring on public roadways are included. Furthermore, at least one of the vehicles involved must be a principal highway vehicle (e.g., automobile, truck, van, motorcycle, tractor trailer, etc.).
Among the people who died in motor vehicles crashes on public roadways that involved at least one principal highway vehicle, it was possible to determine if a drinking driver had been involved in 93.1% of the cases.
2.2.2 The number and percent of fatally injured drivers who had been drinking. The magnitude of the alcohol-fatal crash problem is usually stated in terms of the number and percent of fatally injured drivers who were positive for alcohol. As mentioned previously, this indicator of the problem is useful because of its validity and because the requisite data have been routinely compiled each year as part of the Fatality Database project.
The indicator is a highly valid and reliable measure of the problem because almost all drivers who are killed in crashes are tested for the presence of alcohol – i.e., similar to previous years, there was a high testing rate in Canada during 2012, with 83.2% of fatally injured drivers being tested for alcohol.
Although it is not provided in Sections 2 and 3 of this report, some trend tables and figures dealing with alcohol use among fatally injured drivers is limited to those drivers who died within six hours of the collision. The six-hour window is used since it represents the average amount of time that would be required for drivers with BACs of 80 mg% to metabolize the alcohol in their bloodstream.
2.2.3 The number and percent of fatally injured pedestrians who had been drinking. Drinking pedestrians not just drinking drivers contribute to the overall magnitude of the alcohol-fatal crash problem each year in Canada. This occurs because walking on or beside the highways after drinking is extremely risky. Accordingly, this report uses information from the Fatality Database to examine the number and percent of fatally injured drinking pedestrians. This is possible because testing for alcohol, especially among those over 16 years of age is reasonably high – 65.5% overall, which increases to 68.6% if victims under the age of 16 are excluded.
Descriptive data on fatally injured drinking pedestrians are provided in the Canada section (3.0) but not in the provincial/territorial sections (4.0 through 16.0) of the report. The number of fatally injured pedestrians in most jurisdictions is relatively small, so detailed results for these jurisdictions would not be reliable. Jurisdictional results are also not reported to protect privacy. However, data on the overall incidence of fatally injured drinking pedestrians in each jurisdiction are presented in the Canada section of the report (3.3).

11
2.2.4 The number and percent of drivers in serious injury crashes that involved alcohol. The extent to which alcohol is involved in serious injury crashes is not well documented and, consequently, poorly understood for two primary reasons. First, drivers involved in such crashes are seldom tested for the presence of alcohol. Second, investigating police officers do not always report the presence of alcohol in these crashes – see Mayhew et al. (1997) for a discussion of the limitations of information on alcohol involvement contained in police collision reports.
For these reasons, a surrogate or indirect measure of the alcohol-related serious injury crash problem has been used. A driver is identified as having been involved in an alcohol-related serious injury crash if the crash in which someone was seriously injured involved a single vehicle at night, from 9:00 pm to 6:00 am (SVN), or if, in the case of a non-SVN serious injury crash, the police reported alcohol involvement – i.e., at least one drinking driver in the crash.
Surrogate measures have been shown to correlate strongly with more direct measures of the alcohol-crash problem – e.g., the number of drinking driver fatalities as determined by chemical tests in blood – and provide a reasonably reliable estimate of trends in alcohol-related serious injury crashes. Such measures, however, have limited validity – i.e., not all drinking drivers are identified – so this measure likely provides a “conservative” estimate of the magnitude of the problem (see Mayhew et al. 1997).
2.2.5 The number and percent of fatally injured drivers who were positive for drugs. The magnitude of the drug-fatal crash problem is usually stated in terms of the number and percent of fatally injured drivers who tested positive for drugs. This indicator of the problem has become more valid as more historical data on this indicator have been compiled in TIRF’s Fatality Database.
The indicator is a relatively reliable measure of the problem as a growing percentage of drivers who are killed in crashes are tested for the presence of drugs – i.e., similar to previous years, there was a respectable testing rate in Canada during 2012, with 75.3% of fatally injured drivers being tested for drugs.
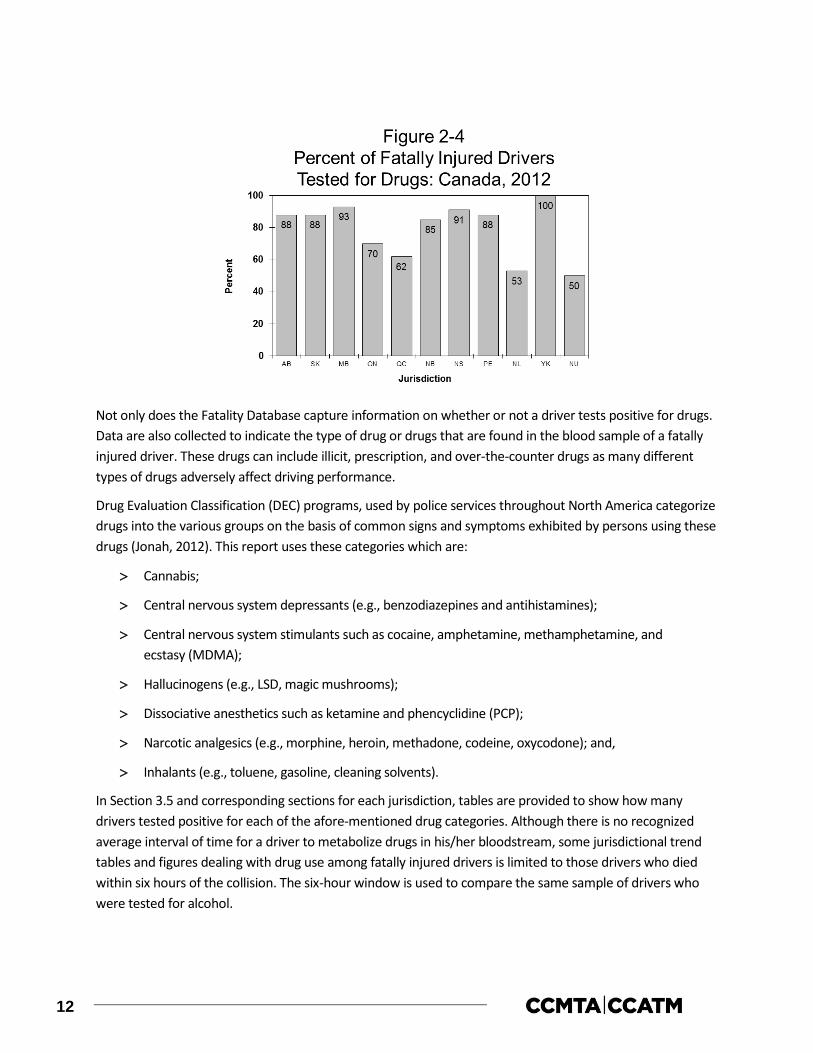
The rate of testing for alcohol varies by jurisdiction. Figure 2-4 shows the rate of testing for drugs among fatally injured drivers in the various jurisdictions. Testing rates vary from 50.0% in Nunavut to 100.0% in the Yukon.
12
Not only does the Fatality Database capture information on whether or not a driver tests positive for drugs. Data are also collected to indicate the type of drug or drugs that are found in the blood sample of a fatally injured driver. These drugs can include illicit, prescription, and over-the-counter drugs as many different types of drugs adversely affect driving performance.
Drug Evaluation Classification (DEC) programs, used by police services throughout North America categorize drugs into the various groups on the basis of common signs and symptoms exhibited by persons using these drugs (Jonah, 2012). This report uses these categories which are:
> Cannabis;
> Central nervous system depressants (e.g., benzodiazepines and antihistamines);
> Central nervous system stimulants such as cocaine, amphetamine, methamphetamine, and ecstasy (MDMA);
> Hallucinogens (e.g., LSD, magic mushrooms);
> Dissociative anesthetics such as ketamine and phencyclidine (PCP);
> Narcotic analgesics (e.g., morphine, heroin, methadone, codeine, oxycodone); and,
> Inhalants (e.g., toluene, gasoline, cleaning solvents).
In Section 3.5 and corresponding sections for each jurisdiction, tables are provided to show how many drivers tested positive for each of the afore-mentioned drug categories. Although there is no recognized average interval of time for a driver to metabolize drugs in his/her bloodstream, some jurisdictional trend tables and figures dealing with drug use among fatally injured drivers is limited to those drivers who died within six hours of the collision. The six-hour window is used to compare the same sample of drivers who were tested for alcohol.
13
3.0 CANADA
This section of the report reviews the major findings on alcohol involvement in fatal and serious injury motor vehicle collisions as well as drug involvement in fatal motor vehicle collisions in Canada. It describes data on:
> people who were killed in alcohol-related crashes (Section 3.1);
> alcohol use among fatally injured drivers (Section 3.2);
> alcohol use among fatally injured pedestrians (Section 3.3);
> drivers involved in alcohol-related serious injury crashes (Section 3.4);
> drug use among fatally injured drivers (Section 3.5); and,
> trends in the alcohol-crash and drug-crash problems (Section 3.6).
3.1 Deaths in alcohol-related crashes
Table 3-1 presents information on people who died in alcohol-related crashes in Canada during 2012 for persons dying within 12 months of the collision (one calendar year) and for persons dying within 30 days of the collision. At the time this report was being prepared, 2012 coroner data from British Columbia were not available. For this reason, 2012 data reported in this section excludes this jurisdiction. This report will be updated when these data become available. Motor vehicle deaths are categorized in terms of the victim’s age, gender, type (i.e., driver, passenger, pedestrian) and the type of vehicle they occupied. In each section, the first column in the table presents the number of deaths. The next two columns show the number and percent of these fatalities in which sufficient information was available to determine if alcohol was involved. A motor vehicle fatality was considered to be alcohol involved if there was at least one drinking driver or drinking pedestrian in the fatal crash.
For example, within the first section, it can be seen that among persons dying within 12 months of the collision, 207 people aged 16-19 were killed in motor vehicle crashes in Canada during 2012. And, in 193 cases (93.2%) it was possible to determine if alcohol was a factor in the crash. The next column shows the number of people killed in crashes that were known to be alcohol-involved. For example, 75 people aged 16-19 died in alcohol-related crashes in Canada during 2012. The next column expresses this as a percentage – i.e., 38.9% of the 16-19 year olds who were killed died in an alcohol-related crash.
The final column (percent of all alcohol-related deaths) expresses the number of deaths in alcohol-related crashes as a percent of all the deaths in such crashes. For example, the alcohol-related deaths among 16-19 year olds represent 10.6% of all the people killed in alcohol-related crashes in Canada during 2012.
An examination of the section for persons dying within 30 days of the collision shows that 205 persons aged 16-19 died in motor vehicle crashes. In 191 of these cases (93.2%), it was possible to determine if alcohol

14
was a factor in the crash. Among these persons, 74 (38.7%) were alcohol-related deaths. And 16-19 year olds accounted for 10.5% of people dying in alcohol-related crashes.
The totals at the bottom of the table provide a summary. As can be seen, 2,159 persons died within 12 months of a motor vehicle crash in Canada during 2012. In 1,984 (91.9%) of these cases, it was possible to determine if alcohol was a factor. Of these known cases, 707 (35.6%) involved alcohol. Extrapolating this figure to the total number of motor vehicle fatalities (2,159 x .356) it can be estimated that in Canada (excluding British Columbia) during 2012, 769 persons died in alcohol-related crashes within 12 months of the collision.
Among the 2,118 persons dying within 30 days of the collision, it was possible to determine if alcohol was a factor in 92.5% of the cases. Of these known cases, 703 (35.9%) involved alcohol. Extrapolating this figure to
Age Group<16 87 66 75.9 5 7.6 0.7 86 65 75.6 5 7.7 0.716-19 207 193 93.2 75 38.9 10.6 205 191 93.2 74 38.7 10.520-25 329 315 95.7 157 49.8 22.2 329 315 95.7 157 49.8 22.326-35 315 300 95.2 159 53.0 22.5 313 298 95.2 158 53.0 22.536-45 253 237 93.7 113 47.7 16.0 250 235 94.0 112 47.7 15.946-55 331 302 91.2 117 38.7 16.5 326 299 91.7 117 39.1 16.6>55 637 571 89.6 81 14.2 11.5 609 556 91.3 80 14.4 11.4
GenderMale 1539 1418 92.1 566 39.9 80.1 1510 1402 92.8 564 40.2 80.2Female 620 566 91.3 141 24.9 19.9 608 557 91.6 139 25.0 19.8
Victim TypeDriver/ Operator 1394 1319 94.6 469 35.6 66.3 1375 1308 95.1 469 35.9 66.7Passenger 431 386 89.6 137 35.5 19.4 425 381 89.6 135 35.4 19.2Pedestrian 333 279 83.8 101 36.2 14.3 317 270 85.2 99 36.7 14.1Unknown 1 0 0.0 0 0.0 0.0 1 0 0.0 0 0.0 0.0
Vehicle OccupiedAutomobiles 909 852 93.7 273 32.0 38.6 897 845 94.2 273 32.3 38.8Trucks/Vans 467 437 93.6 181 41.4 25.6 460 431 93.7 179 41.5 25.5Motorcycles 163 154 94.5 38 24.7 5.4 161 152 94.4 38 25.0 5.4Other Hwy Vehicles 43 39 90.7 6 15.4 0.8 42 38 90.5 6 15.8 0.9Off-road Vehicles 241 222 92.1 107 48.2 15.1 240 222 92.5 107 48.2 15.2(Pedestrians) 333 279 83.8 101 36.2 14.3 317 270 85.2 99 36.7 14.1unknown 3 1 33.3 1 100.0 0.1 1 1 100.0 1 100.0 0.1
Collision LocationPublic Road 1956 1823 93.2 624 34.2 88.3 1923 1800 93.6 620 34.4 88.2Off-road 203 161 79.3 83 51.6 11.7 195 159 81.5 83 52.2 11.8
TOTAL 2159 1984 91.9 707 35.6 100.0 2118 1959 92.5 703 35.9 100.0
* excluding British Columbia
No. of Deaths No.
Alcohol Use Known
% of total
No.
Persons Dying Within 30 Days of Collision
% of known
Table 3-1Deaths in Alcohol-Related Crashes: Canada, 2012*
Alcohol-Related Deaths (ARDs)
Alcohol-Related Deaths (ARDs)
% of all ARDs
% of all ARDs
Persons Dying Within 12 Months of Collision
% of known
No. of Deaths
Alcohol Use Known
No. % of total
No.Category of Victim

15
the total number of motor vehicle fatalities (2,118 x .359) it can be estimated that in Canada (excluding British Columbia) during 2012, 760 persons died in alcohol-related crashes within 30 days of the collision.
3.1.1 Victim age. Of all the people who died in alcohol-related crashes within 12 months of the collision (see last column in the first section), 22.5% were aged 26-35; 22.2% were aged 20-25; 16.5% were aged 46-55; 16.0% were aged 36-45; 11.5% were over 55; and 10.6% were aged 16-19. The youngest (<16) group accounted for only 0.7% of all people who died in alcohol-related crashes.
Figure 3-1 shows the percent of alcohol-related deaths within each age group. The highest incidence of alcohol involvement occurred in the crashes in which persons aged 26-35 and 20-25 died (53.0% and 49.8%, respectively). The lowest incidence of alcohol involvement was found among the youngest and oldest fatalities as only 7.6% of persons under 16 and 14.2% of persons over 55 years of age died in crashes involving alcohol.
3.1.2 Gender. Of all the people who died in alcohol-related crashes within 12 months of the collision, 80.1% were males. The incidence of alcohol in crashes in which a male died (39.9%) was greater than the incidence of alcohol in crashes in which a female died (24.9%).
3.1.3 Victim type. Of all the people who died in alcohol-related crashes within 12 months of the collision, 66.3% were drivers/operators of a vehicle; 19.4% were passengers; and 14.3% were pedestrians. Within each of these victim types, there are some differences in alcohol involvement. Among the principal victim types, the highest incidence of alcohol involvement (36.2%) occurred in the crashes in which a pedestrian died. Alcohol was involved in 35.6% of the crashes in which a driver/operator died and 35.5% of those in which a passenger died.
3.1.4 Type of vehicle occupied. Of all the people who died in alcohol-related crashes within 12 months of the collision, two-fifths (38.6%) were in an automobile; 25.6% were in a truck/van; 15.1% were on an off-road vehicle (e.g., bicycle, snowmobile, all-terrain vehicle); and 5.4% were on a motorcycle.
16
The incidence of alcohol involvement in which a truck/van occupant died was greater than the incidence of alcohol in crashes in which an automobile occupant died (41.4% versus 32.0%). The incidence of alcohol involvement in which a motorcycle occupant died was 24.7%. Alcohol was involved in 48.2% of the crashes in which an off-road vehicle occupant died.
3.1.5 Collision location. Of all the people who died in alcohol-related crashes within 12 months of the collision, 88.3% died in a collision which occurred on a public road and 11.7% died in an off-road collision. However, the incidence of alcohol involvement in which a victim died in an alcohol-related crash was greater for those dying in off-road collisions (51.6%) than it was for persons dying in a collision which occurred on a public road (34.2%).
3.2 Alcohol in fatally injured drivers
This section presents information on the presence of alcohol, exclusively among drivers fatally injured in Canada during 2012. At the time this report was being prepared, 2012 coroner data from British Columbia were not available. For this reason, 2012 data reported in this section excludes this jurisdiction. Table 3-2 shows the information by age group, gender, vehicle type, collision type (single vs. multiple), and duration between crash time and death time (within 12 months vs. within 30 days of the collision). The data are presented for drivers of the principal types of vehicles (i.e., automobiles, trucks, vans, motorcycles, tractor-trailers) who died in public road and off-road collisions.
The first column in the table shows the number of drivers killed. The next two columns show the number and percent of these victims who were tested for alcohol. The remaining columns provide information on the results of the alcohol tests – this includes the percent of those tested who were positive for alcohol in each of five blood alcohol concentration (BAC) levels.
To illustrate, among 20-25 year olds there were 185 drivers killed during 2012; 160 of these fatally injured drivers (86.5%) were tested for alcohol. Of those who were tested, 57.5% showed no evidence of alcohol, 3.1% had BACs below 50 mg%, 3.8% had BACs from 50 to 80 mg%, 8.8% had BACs from 81 to 160 mg%, and 26.9% had BACs over 160 mg%.
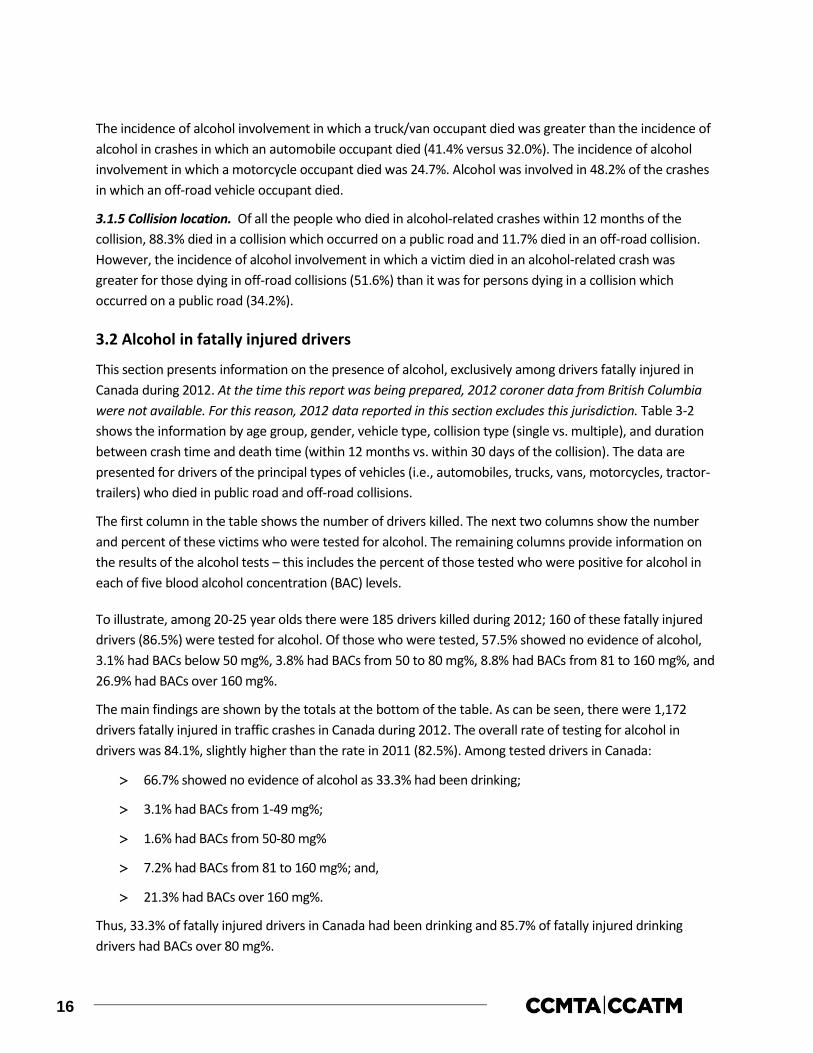
The main findings are shown by the totals at the bottom of the table. As can be seen, there were 1,172 drivers fatally injured in traffic crashes in Canada during 2012. The overall rate of testing for alcohol in drivers was 84.1%, slightly higher than the rate in 2011 (82.5%). Among tested drivers in Canada:
> 66.7% showed no evidence of alcohol as 33.3% had been drinking;
> 3.1% had BACs from 1-49 mg%;
> 1.6% had BACs from 50-80 mg%
> 7.2% had BACs from 81 to 160 mg%; and,
> 21.3% had BACs over 160 mg%.
Thus, 33.3% of fatally injured drivers in Canada had been drinking and 85.7% of fatally injured drinking drivers had BACs over 80 mg%.

17
In Figure 3-2, the BAC distribution for tested fatally injured drivers is extrapolated to reflect the BAC distribution for all fatally injured drivers. In this figure, 389 of 1,172 drivers (33.2%) have a positive BAC. And among fatally injured drinking drivers, 334 (85.9%) have BACs over 80 mg%.
Category Number Percent of Tested Drivers with BACs of:of of % of
Driver Drivers* total Zero 1-49 50-80 81-160 >160
Age<20** 86 72 83.7 65.3 5.6 4.2 11.1 13.920-25 185 160 86.5 57.5 3.1 3.8 8.8 26.926-35 197 176 89.3 47.7 5.1 0.0 11.9 35.236-45 162 146 90.1 63.0 3.4 0.7 8.2 24.746-55 195 168 86.2 65.5 1.8 1.8 5.4 25.6>55 347 264 76.1 88.3 1.9 1.1 2.7 6.1
GenderMale 907 772 85.1 64.1 3.5 1.7 7.8 22.9Female 265 214 80.8 76.2 1.9 1.4 5.1 15.4
Vehicle TypeAutomobile 661 537 81.2 68.5 2.6 1.3 8.6 19.0Motorcycle 155 128 82.6 73.4 5.5 2.3 3.9 14.8Tractor Trailer 33 31 93.9 87.1 6.5 0.0 0.0 6.5Heavy Truck1 4 4 100.0 100.0 0.0 0.0 0.0 0.0Van 82 73 89.0 67.1 2.7 4.1 2.7 23.3Light Truck2 232 209 90.1 53.6 2.9 1.4 8.6 33.5Other Truck3 3 2 66.7 100.0 0.0 0.0 0.0 0.0Other Hwy. Vehicle4 2 2 100.0 100.0 0.0 0.0 0.0 0.0
Collision TypeSingle-Vehicle 537 445 82.9 48.1 3.1 2.0 11.9 34.8
Multiple-Vehicle 635 541 85.2 82.1 3.1 1.3 3.3 10.2Duration Between Crash and Death TimeWithin 30 Days 1158 984 85.0 66.7 3.2 1.6 7.2 21.3> 30 Days 14 2 0.0 100.0 0.0 0.0 0 0.0
TOTAL 1172 986 84.1 66.7 3.1 1.6 7.2 21.3
* Excludes operators of bicycles, snowmobiles, farm tractors and other non-highway vehicles.** Drivers in multiple age groups have been aggregated to ensure that an individual will not be identified.1 Trucks over 4500 kg.2 e.g., pickup trucks.3 Motorhomes, utility vehicles, plows and trucks of unknown type.4 Emergency vehicles and buses.
Note: The vehicle types that appear in the shaded area correspond to the truck/van category used in the jurisdictional sections of this report.
Table 3-2Alcohol Use Among Fatally Injured Drivers of Highway Vehicles:
Canada, 2012 (excluding British Columbia)Drivers Tested
Number
18
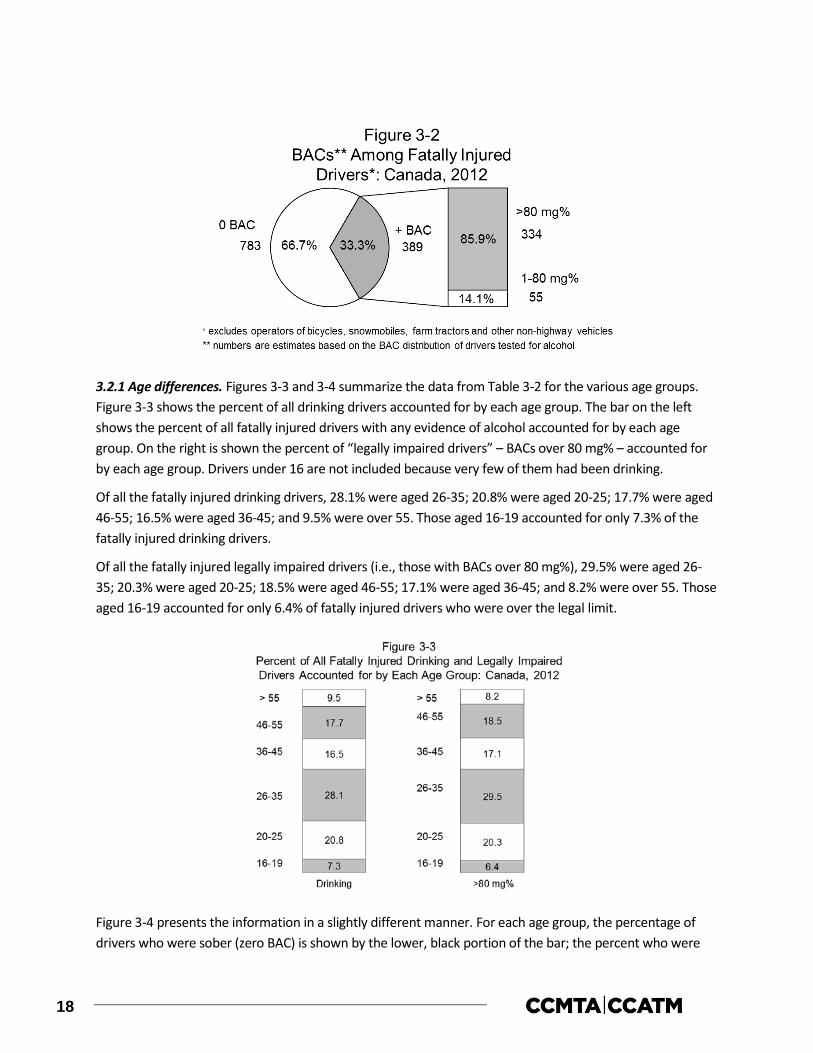
3.2.1 Age differences. Figures 3-3 and 3-4 summarize the data from Table 3-2 for the various age groups. Figure 3-3 shows the percent of all drinking drivers accounted for by each age group. The bar on the left shows the percent of all fatally injured drivers with any evidence of alcohol accounted for by each age group. On the right is shown the percent of “legally impaired drivers” – BACs over 80 mg% – accounted for by each age group. Drivers under 16 are not included because very few of them had been drinking.
Of all the fatally injured drinking drivers, 28.1% were aged 26-35; 20.8% were aged 20-25; 17.7% were aged 46-55; 16.5% were aged 36-45; and 9.5% were over 55. Those aged 16-19 accounted for only 7.3% of the fatally injured drinking drivers.
Of all the fatally injured legally impaired drivers (i.e., those with BACs over 80 mg%), 29.5% were aged 26-35; 20.3% were aged 20-25; 18.5% were aged 46-55; 17.1% were aged 36-45; and 8.2% were over 55. Those aged 16-19 accounted for only 6.4% of fatally injured drivers who were over the legal limit.
Figure 3-4 presents the information in a slightly different manner. For each age group, the percentage of drivers who were sober (zero BAC) is shown by the lower, black portion of the bar; the percent who were

19
positive for alcohol but whose BAC was below the legal limit (1-80 mg%) is shown by the white section in the middle, and the percent with BACs over the legal limit (>80 mg%) is shown by the upper, grey part of the bar.
Fatally injured drivers age 26-35 were the most likely to have been drinking – 52.3% of drivers in this age group had been drinking. By contrast, only 11.7% of tested drivers over age 55 had been drinking.
3.2.2 Gender differences. Males dominate the picture – they account for 84.4% of all the fatally injured drivers who had been drinking and 84.3% of all of the fatally injured drivers who were legally impaired. Males dominate the picture largely because they account for 77.4% of the drivers who are killed (907 of the 1,172 fatalities are males).
A comparison in the prevalence of alcohol use among male and female fatally injured drivers is shown in Figure 3-5. The pie chart shows within each gender, the percent who were sober (i.e., 0 BAC) and positive for alcohol (+ BAC). The bar to the right of the pie chart shows the distribution of alcohol levels found among those who were drinking – the percent who had alcohol levels above and below the legal limit. Percentages are given inside the figures; the absolute number of cases is shown adjacent to the figure.
Fatally injured male drivers were considerably more likely to have been drinking than female drivers (35.9% and 23.8%, respectively). And, most of the male and female drivers who were drinking had BACs over the legal limit (85.6% and 86.3%, respectively).

20
3.2.3 Vehicle differences. Table 3-3 shows the number and percent of drinking and legally impaired drivers accounted for by drivers of different types of vehicles. Of all the fatally injured drinking drivers (i.e., those with a positive BAC), 51.5% were automobile drivers; 29.6% were light truck drivers; 10.4% were motorcycle riders; 7.3% were van drivers; and 1.2% were tractor-trailer drivers.
Of all the fatally injured legally impaired drivers (i.e., those with BACs over 80 mg%), 52.7% were automobile drivers; 31.3% were light truck drivers; 8.5% were motorcycle riders; 6.8% were van drivers; and 0.7% were tractor-trailer drivers.
Table 3-3Number and Percent of Fatally Injured Drinking and Legally Impaired Drivers
Accounted for by Drivers* of Different Vehicle Types: Canada, 2012Vehicle Number of % of All Number of Legally % of All Legally
Type Drinking Drivers Drinking Drivers Impaired Drivers Impaired DriversAutomobile 169 51.5 148 52.7Motorcycle 34 10.4 24 8.5Tractor-Trailer 4 1.2 2 0.7Heavy Truck1 0 0.0 0 0.0Van 24 7.3 19 6.8Light Truck2 97 29.6 88 31.3
TOTAL 328 100.0 281 100.0
* Excludes operators of bicycles, snowmobiles, farm tractors and other non-highway vehicles.1 Trucks over 4500 kg.2 e.g., pickup trucks.
21
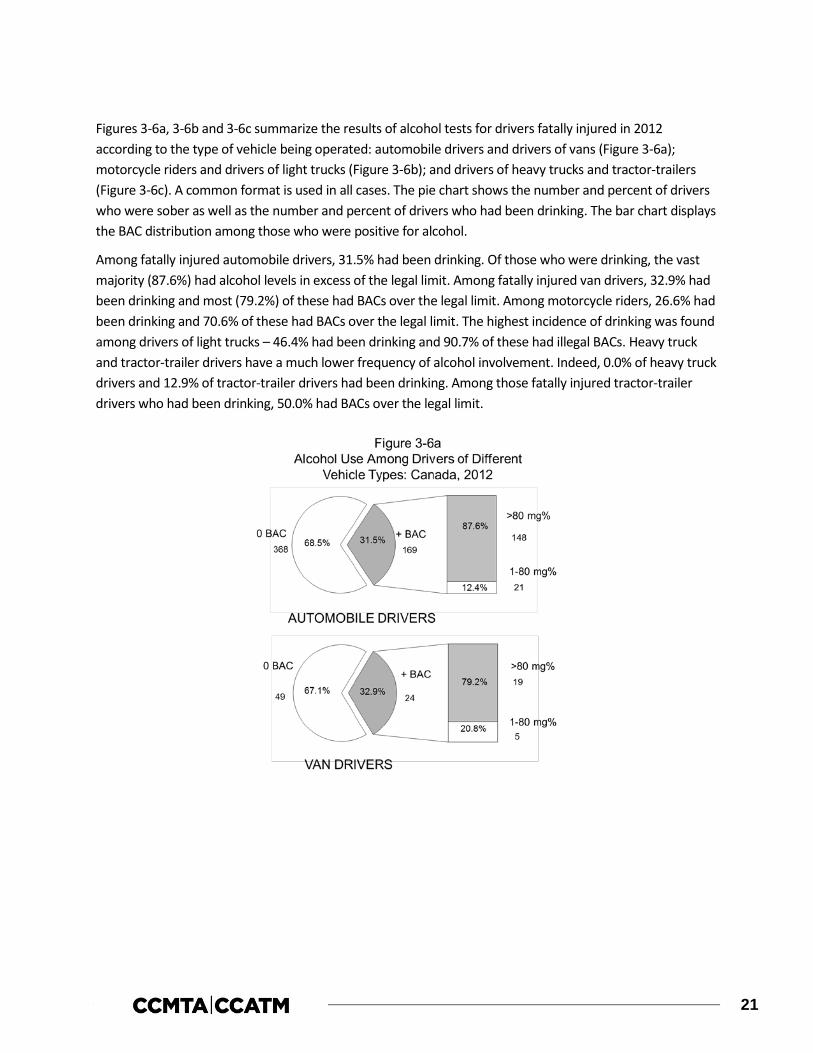
Figures 3-6a, 3-6b and 3-6c summarize the results of alcohol tests for drivers fatally injured in 2012 according to the type of vehicle being operated: automobile drivers and drivers of vans (Figure 3-6a); motorcycle riders and drivers of light trucks (Figure 3-6b); and drivers of heavy trucks and tractor-trailers (Figure 3-6c). A common format is used in all cases. The pie chart shows the number and percent of drivers who were sober as well as the number and percent of drivers who had been drinking. The bar chart displays the BAC distribution among those who were positive for alcohol.
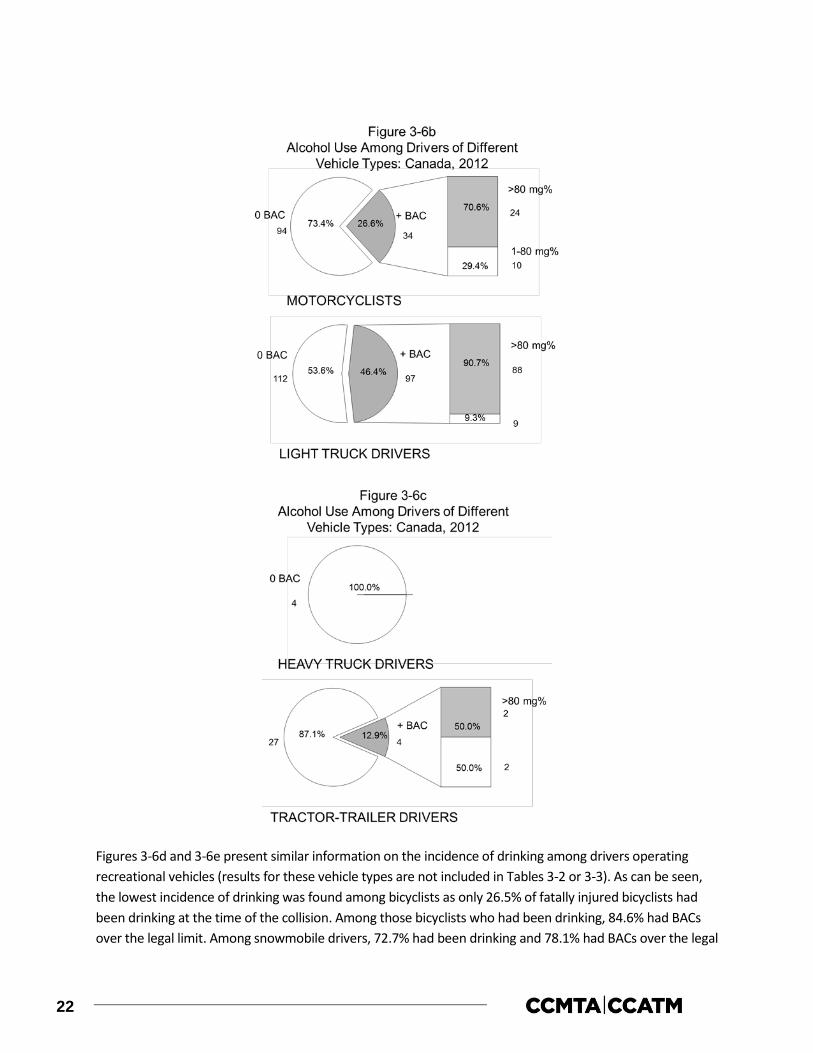
Among fatally injured automobile drivers, 31.5% had been drinking. Of those who were drinking, the vast majority (87.6%) had alcohol levels in excess of the legal limit. Among fatally injured van drivers, 32.9% had been drinking and most (79.2%) of these had BACs over the legal limit. Among motorcycle riders, 26.6% had been drinking and 70.6% of these had BACs over the legal limit. The highest incidence of drinking was found among drivers of light trucks – 46.4% had been drinking and 90.7% of these had illegal BACs. Heavy truck and tractor-trailer drivers have a much lower frequency of alcohol involvement. Indeed, 0.0% of heavy truck drivers and 12.9% of tractor-trailer drivers had been drinking. Among those fatally injured tractor-trailer drivers who had been drinking, 50.0% had BACs over the legal limit.
22
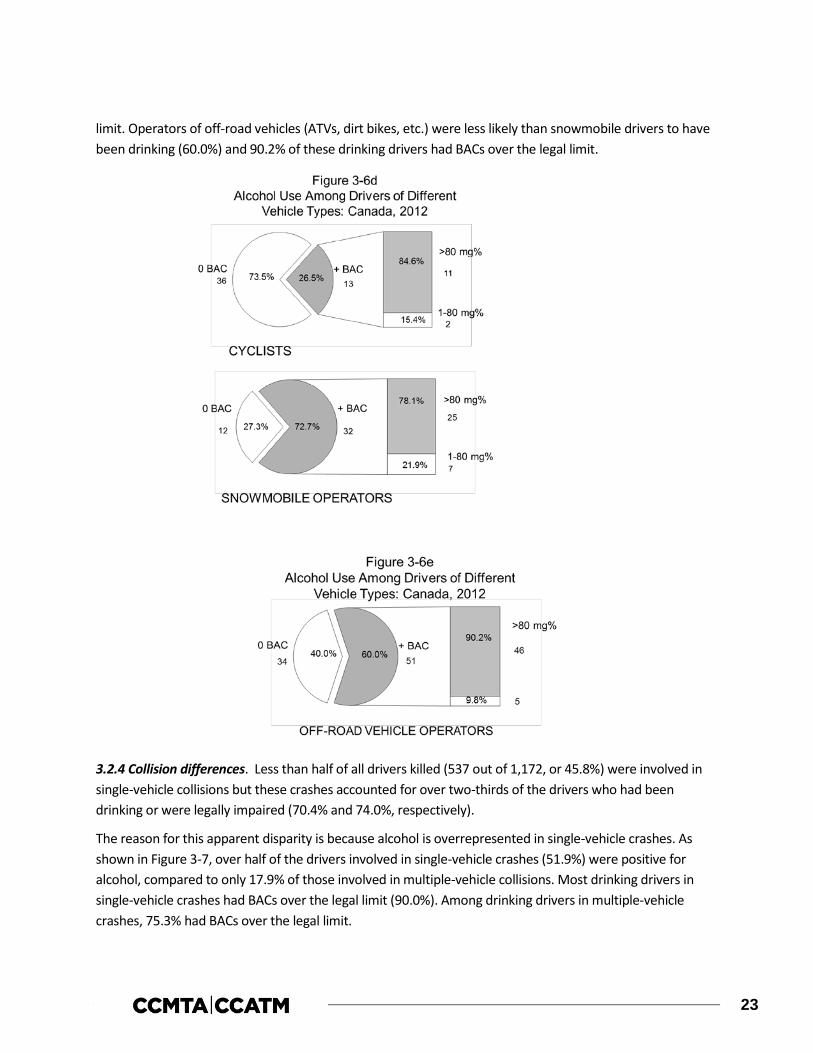
Figures 3-6d and 3-6e present similar information on the incidence of drinking among drivers operating recreational vehicles (results for these vehicle types are not included in Tables 3-2 or 3-3). As can be seen, the lowest incidence of drinking was found among bicyclists as only 26.5% of fatally injured bicyclists had been drinking at the time of the collision. Among those bicyclists who had been drinking, 84.6% had BACs over the legal limit. Among snowmobile drivers, 72.7% had been drinking and 78.1% had BACs over the legal
23
limit. Operators of off-road vehicles (ATVs, dirt bikes, etc.) were less likely than snowmobile drivers to have been drinking (60.0%) and 90.2% of these drinking drivers had BACs over the legal limit.
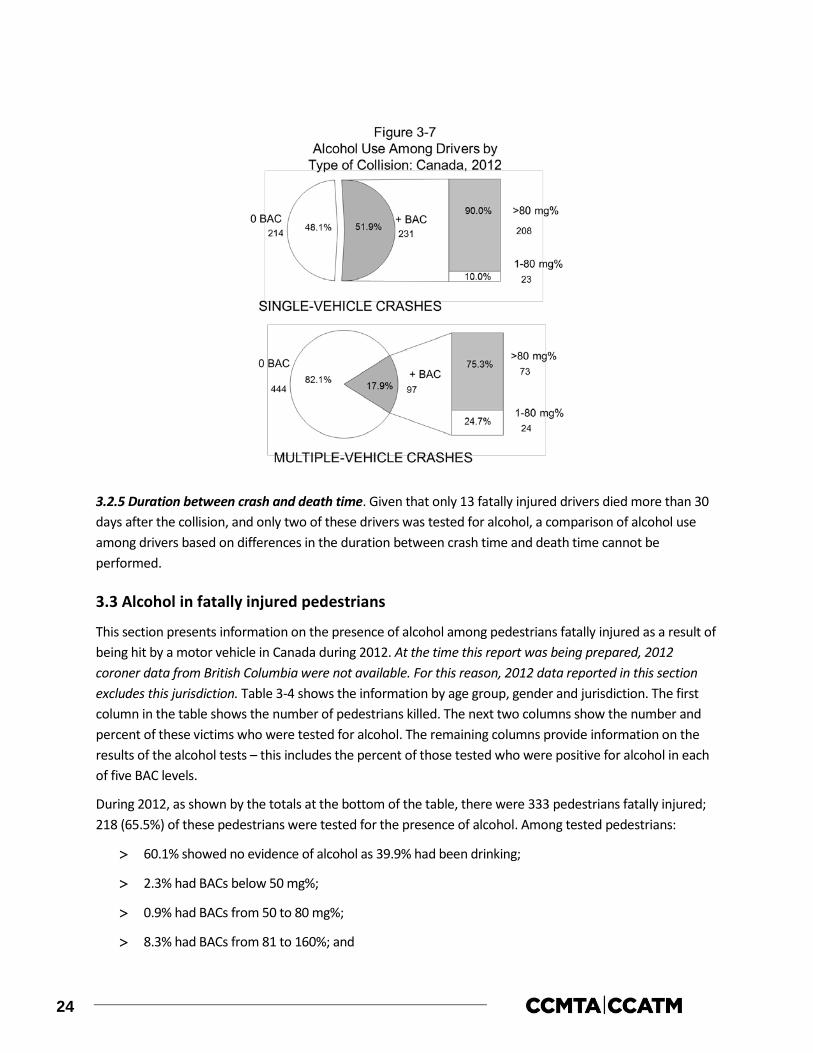
3.2.4 Collision differences. Less than half of all drivers killed (537 out of 1,172, or 45.8%) were involved in single-vehicle collisions but these crashes accounted for over two-thirds of the drivers who had been drinking or were legally impaired (70.4% and 74.0%, respectively).
The reason for this apparent disparity is because alcohol is overrepresented in single-vehicle crashes. As shown in Figure 3-7, over half of the drivers involved in single-vehicle crashes (51.9%) were positive for alcohol, compared to only 17.9% of those involved in multiple-vehicle collisions. Most drinking drivers in single-vehicle crashes had BACs over the legal limit (90.0%). Among drinking drivers in multiple-vehicle crashes, 75.3% had BACs over the legal limit.
24
3.2.5 Duration between crash and death time. Given that only 13 fatally injured drivers died more than 30 days after the collision, and only two of these drivers was tested for alcohol, a comparison of alcohol use among drivers based on differences in the duration between crash time and death time cannot be performed.
3.3 Alcohol in fatally injured pedestrians
This section presents information on the presence of alcohol among pedestrians fatally injured as a result of being hit by a motor vehicle in Canada during 2012. At the time this report was being prepared, 2012 coroner data from British Columbia were not available. For this reason, 2012 data reported in this section excludes this jurisdiction. Table 3-4 shows the information by age group, gender and jurisdiction. The first column in the table shows the number of pedestrians killed. The next two columns show the number and percent of these victims who were tested for alcohol. The remaining columns provide information on the results of the alcohol tests – this includes the percent of those tested who were positive for alcohol in each of five BAC levels.
During 2012, as shown by the totals at the bottom of the table, there were 333 pedestrians fatally injured; 218 (65.5%) of these pedestrians were tested for the presence of alcohol. Among tested pedestrians:
> 60.1% showed no evidence of alcohol as 39.9% had been drinking;
> 2.3% had BACs below 50 mg%;
> 0.9% had BACs from 50 to 80 mg%;
> 8.3% had BACs from 81 to 160%; and
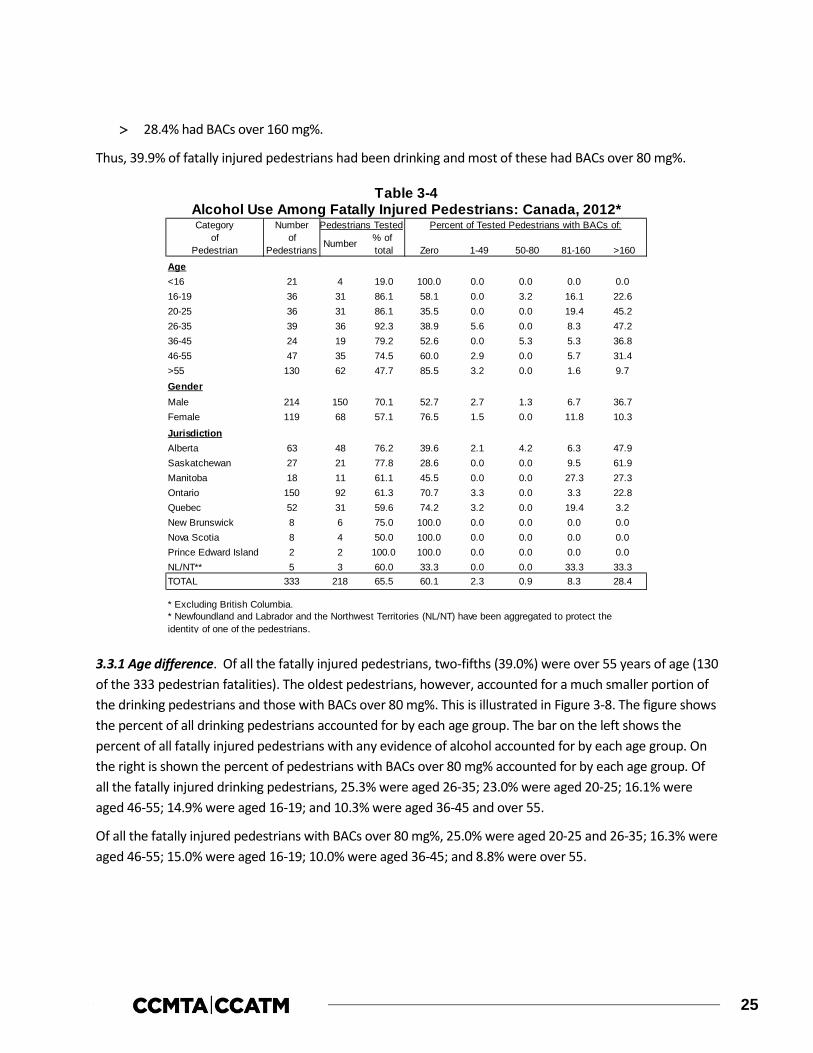
25
> 28.4% had BACs over 160 mg%.
Thus, 39.9% of fatally injured pedestrians had been drinking and most of these had BACs over 80 mg%.
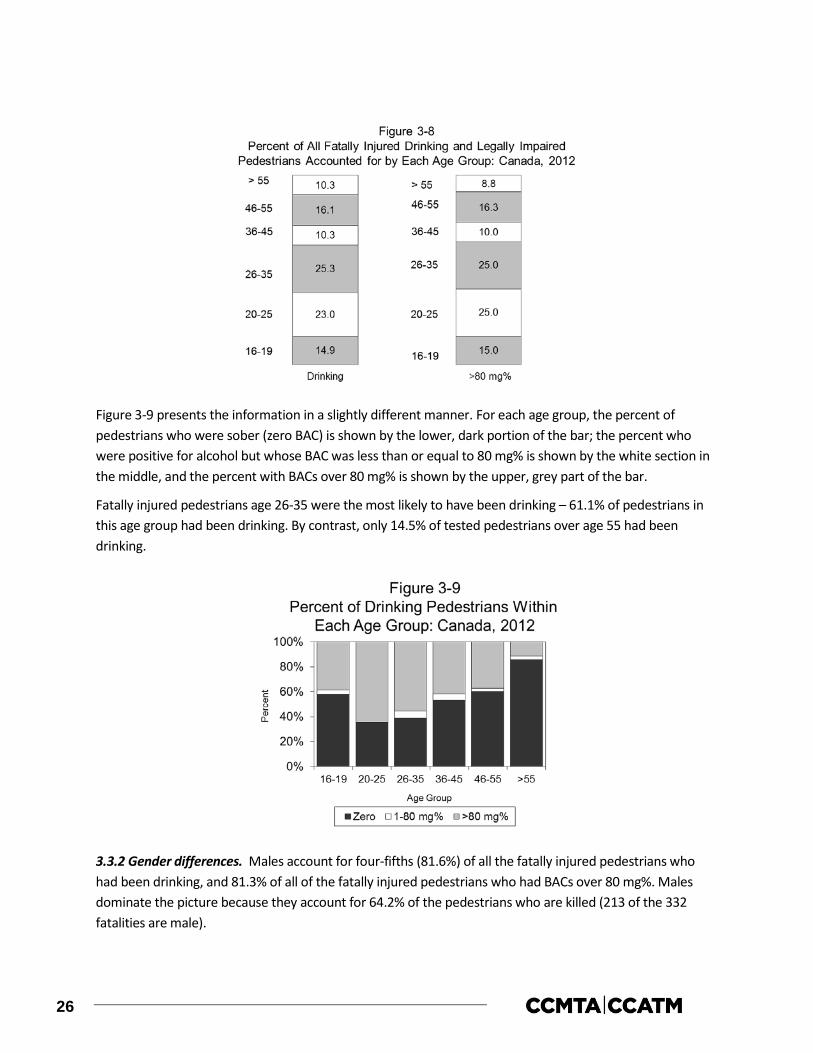
3.3.1 Age difference. Of all the fatally injured pedestrians, two-fifths (39.0%) were over 55 years of age (130 of the 333 pedestrian fatalities). The oldest pedestrians, however, accounted for a much smaller portion of the drinking pedestrians and those with BACs over 80 mg%. This is illustrated in Figure 3-8. The figure shows the percent of all drinking pedestrians accounted for by each age group. The bar on the left shows the percent of all fatally injured pedestrians with any evidence of alcohol accounted for by each age group. On the right is shown the percent of pedestrians with BACs over 80 mg% accounted for by each age group. Of all the fatally injured drinking pedestrians, 25.3% were aged 26-35; 23.0% were aged 20-25; 16.1% were aged 46-55; 14.9% were aged 16-19; and 10.3% were aged 36-45 and over 55.
Of all the fatally injured pedestrians with BACs over 80 mg%, 25.0% were aged 20-25 and 26-35; 16.3% were aged 46-55; 15.0% were aged 16-19; 10.0% were aged 36-45; and 8.8% were over 55.
Category Number Pedestrians Tested Percent of Tested Pedestrians with BACs of:of of % of
Pedestrian Pedestrians total Zero 1-49 50-80 81-160 >160
Age<16 21 4 19.0 100.0 0.0 0.0 0.0 0.016-19 36 31 86.1 58.1 0.0 3.2 16.1 22.620-25 36 31 86.1 35.5 0.0 0.0 19.4 45.226-35 39 36 92.3 38.9 5.6 0.0 8.3 47.236-45 24 19 79.2 52.6 0.0 5.3 5.3 36.846-55 47 35 74.5 60.0 2.9 0.0 5.7 31.4>55 130 62 47.7 85.5 3.2 0.0 1.6 9.7GenderMale 214 150 70.1 52.7 2.7 1.3 6.7 36.7Female 119 68 57.1 76.5 1.5 0.0 11.8 10.3
JurisdictionAlberta 63 48 76.2 39.6 2.1 4.2 6.3 47.9Saskatchewan 27 21 77.8 28.6 0.0 0.0 9.5 61.9Manitoba 18 11 61.1 45.5 0.0 0.0 27.3 27.3Ontario 150 92 61.3 70.7 3.3 0.0 3.3 22.8Quebec 52 31 59.6 74.2 3.2 0.0 19.4 3.2New Brunswick 8 6 75.0 100.0 0.0 0.0 0.0 0.0Nova Scotia 8 4 50.0 100.0 0.0 0.0 0.0 0.0Prince Edward Island 2 2 100.0 100.0 0.0 0.0 0.0 0.0NL/NT** 5 3 60.0 33.3 0.0 0.0 33.3 33.3TOTAL 333 218 65.5 60.1 2.3 0.9 8.3 28.4
* Excluding British Columbia.
Alcohol Use Among Fatally Injured Pedestrians: Canada, 2012*Table 3-4
Number
* Newfoundland and Labrador and the Northwest Territories (NL/NT) have been aggregated to protect the identity of one of the pedestrians.
26
Figure 3-9 presents the information in a slightly different manner. For each age group, the percent of pedestrians who were sober (zero BAC) is shown by the lower, dark portion of the bar; the percent who were positive for alcohol but whose BAC was less than or equal to 80 mg% is shown by the white section in the middle, and the percent with BACs over 80 mg% is shown by the upper, grey part of the bar.
Fatally injured pedestrians age 26-35 were the most likely to have been drinking – 61.1% of pedestrians in this age group had been drinking. By contrast, only 14.5% of tested pedestrians over age 55 had been drinking.
3.3.2 Gender differences. Males account for four-fifths (81.6%) of all the fatally injured pedestrians who had been drinking, and 81.3% of all of the fatally injured pedestrians who had BACs over 80 mg%. Males dominate the picture because they account for 64.2% of the pedestrians who are killed (213 of the 332 fatalities are male).

27
Figure 3-10 summarizes the findings for alcohol use among fatally injured male and female pedestrians. The pie chart shows the proportion of those pedestrians who were sober (0 BAC) and those positive for alcohol (+ BAC). The bar to the right of the pie chart shows the distribution of alcohol levels found among those who had been drinking; the percent who had BACs above and below 80 mg%. Percentages are given inside the figures; the absolute number of cases is shown adjacent to the figure.
Among fatally injured male pedestrians, 47.3% had been drinking and 91.5% of these pedestrians had BACs over 80 mg%. Among fatally injured female pedestrians, 23.5% had been drinking and 93.8% had BACs over 80 mg%.
3.3.3 Jurisdictional differences. Pedestrians from Newfoundland and Labrador and the Northwest Territories have been regrouped into a single category (NL/NT) to protect the identity of an individual pedestrian. Of all the fatally injured pedestrians, 45.1% were killed in Ontario, 18.9% were killed in Alberta, and 15.6% were killed in Quebec. Alberta accounted for 33.3%, Ontario accounted for 31.0%, and Saskatchewan accounted for17.2% of the fatally injured drinking pedestrians. Alberta accounted for 32.5% and Ontario accounted for 30.0% of the fatally injured pedestrians with BACs over 80 mg%. It should be noted that the figures for drinking and legally impaired pedestrians in Quebec are underestimated because they are based on tested pedestrians and the rate of testing for alcohol is low in this jurisdiction – e.g., only 59.6% of pedestrians fatally injured in Quebec were tested, compared to 100.0% in Prince Edward Island, 77.8% in Saskatchewan, and 76.2% in Alberta.
As shown in Table 3-4, the highest incidence of alcohol in fatally injured pedestrians, however, was in Saskatchewan (71.4%). The lowest incidence of alcohol in fatally injured pedestrians was in New Brunswick, Nova Scotia and Prince Edward Island where 0.0% had been drinking.

28
3.4 Drivers involved in alcohol-related serious injury crashes
This section presents information on drivers involved in alcohol-related crashes in which someone was seriously injured in 2012 in Canada, excluding Nunavut because data from this jurisdiction were not available at the time this report was being prepared. A “surrogate” or “indirect” measure is used to estimate alcohol involvement because drivers in serious injury crashes are seldom tested for alcohol. A driver is identified as having been involved in an alcohol-related serious injury crash if the crash in which someone was seriously injured involved a single vehicle, at night (SVN), or if, in the case of a non-SVN serious injury crash, the police reported alcohol involvement – i.e., they noted that at least one drinking driver was involved in the crash.
The results are shown in Table 3-5 for drivers grouped in terms of age, gender, type of vehicle driven, and type of collision. The first column shows the number of drivers involved in serious injury crashes. The number and percent of drivers in such crashes that involved alcohol is shown in the next two columns. The final column expresses the number of drivers involved in alcohol-related serious injury crashes in any row as a percent of all drivers involved in alcohol-related serious injury crashes.
% of % of all drivers inNumber total alcohol-related crashes
Age<16 90 8 8.9 0.316-19 974 239 24.5 10.320-25 1929 504 26.1 21.826-35 2500 534 21.4 23.136-45 2139 341 15.9 14.746-55 2363 335 14.2 14.5>55 2760 222 8.0 9.6unknown 814 131 16.1 5.7
GenderMale 9302 1749 18.8 75.6Female 3961 490 12.4 21.2unknown 306 75 24.5 3.2
Vehicle Type**Auto 5104 962 18.8 53.1Truck/Van 3588 591 16.5 32.6Motorcycle 936 120 12.8 6.6Tractor Trailer 368 50 13.6 2.8Other Hwy. Vehicle 128 17 13.3 0.9Off-Road 541 60 11.1 3.3Unknown 56 12 21.4 0.7
Collision TypeSingle-Vehicle 4595 1662 36.2 71.8Multiple-Vehicle 8974 652 7.3 28.2
TOTAL 13569 2314 17.1 100.0
* Excluding data from Nunavut.** Vehicle type section excludes Quebec since this jurisdiction has grouped automobiles and light trucks together in its collision data since March 2010.
Table 3-5Drivers in Alcohol-Related Serious Injury Crashes:
Canada, 2012*Category of Drivers Number of
Drivers
Alcohol-Related

29
As shown, by the totals at the bottom of the table, 13,569 drivers were involved in crashes in which someone was seriously injured. Among these, 17.1% were alcohol-related crashes.
3.4.1 Driver age. Of all the drivers involved in alcohol-related serious injury crashes, 23.1% were aged 26-35; 21.8% were aged 20-25; and 14.7% were aged 36-45. Drivers under the age of 16 accounted for only 0.3% of all those involved in alcohol-related crashes. Figure 3-11 shows for each age group the percent of drivers who were in a serious injury crash that involved alcohol. The highest incidence of alcohol involvement was found for drivers aged 20-25 (26.1%). The lowest incidence of involvement in alcohol-related crashes was found for the youngest and oldest age groups of drivers as 8.9% of drivers under 16 and 8.0% of drivers over 55 were in a serious injury crash that involved alcohol.
3.4.2 Driver gender. Of all the drivers involved in alcohol-related serious injury crashes, 75.6% were males. The incidence of involvement in alcohol-related serious injury crashes was also greater for males than for females (18.8% and 12.4%, respectively).
3.4.3 Type of vehicle driven. The numbers and percentages in the vehicle type section exclude Quebec since this jurisdiction has grouped automobiles and light trucks together in its collision data since March 2010. Of all the drivers involved in alcohol-related serious injury crashes, 53.1% were automobile drivers and 32.6% were truck/van drivers.
Almost one out of five serious injury crashes involving automobile drivers were alcohol related (18.8%). The percentage of involvement in alcohol-related serious injury crashes was 16.5% for truck/van drivers, 13.6% for tractor-trailer drivers, 13.3% for drivers of other highway vehicles, and 12.8% for motorcycle riders. The lowest incidence of involvement in alcohol-related serious injury crashes was found among off-road vehicle drivers (11.1%).
3.4.4 Type of collision. Of all the drivers involved in alcohol-related serious injury crashes, 71.8% of them were in single-vehicle crashes. The highest incidence of involvement in alcohol-related serious injury crashes

30
was also found among drivers in single-vehicle crashes (36.2%) compared to only 7.3% for drivers involved in multiple-vehicle crashes.
3.5 Drug use among fatally injured drivers
This section presents information on the presence of drugs, exclusively among drivers fatally injured in Canada during 2012. At the time this report was being prepared, 2012 coroner data from British Columbia were not available. For this reason, 2012 data reported in this section excludes this jurisdiction. Table 3-6 shows the information by age group, gender, vehicle type, collision type (single vs. multiple), and duration between crash time and death time (within 12 months vs. within 30 days of the collision). The data are presented for drivers of the principal types of vehicles (i.e., automobiles, trucks, vans, motorcycles, tractor-trailers) who died in public road and off-road collisions.
The first column in the table shows the number of drivers killed. The next two columns show the number and percent of these victims who were tested for drugs. The remaining columns provide information on the results of the drug tests – this includes the number and percent of those tested who were positive for drugs.
As can be seen, in 2012, 77.4% of fatally injured drivers in Canada were tested for drug use. Among fatally injured tested drivers, 363 out of 907 (40.0%) were positive for drugs.
3.5.1 Age differences. Fatally injured drivers aged 26-35 were the most likely to have been positive for drugs – 45.7% of drivers in this age group were positive for drugs. By contrast, 31.2% of tested drivers over 55 were positive for drugs.
3.5.2 Gender differences. Males dominate the picture as they account for 79.9% of all the fatally injured drivers who were positive for drugs. Males dominate the picture largely because they account for 77.4% of the drivers who are killed (907 of the 1,172 fatalities are males). Fatally injured male drivers were more likely to have been positive for drugs than female drivers (40.8% and 37.1%, respectively).
3.5.3 Vehicle differences. Within each of the principal vehicle types, 47.5% of fatally injured light truck drivers, 40.3% of van drivers, 38.4% of automobile drivers, and 36.8% of motorcyclists tested positive for drugs. Among drivers of principal vehicle types, the lowest percentage of drivers testing positive for drugs were heavy truck drivers (0.0%) and tractor trailer drivers (34.5%).
3.5.4 Collision differences. Almost half of the drivers who were killed in single-vehicle collisions (48.2%) tested positive for drugs compared to 33.2% of those involved in multiple vehicle crashes.
3.5.5 Duration between crash and death time. Given that only 13 fatally injured drivers died more than 30 days after the collision, and only three of these drivers were tested for drugs, a comparison of drug use among drivers based on differences in the duration between crash time and death time cannot be performed.
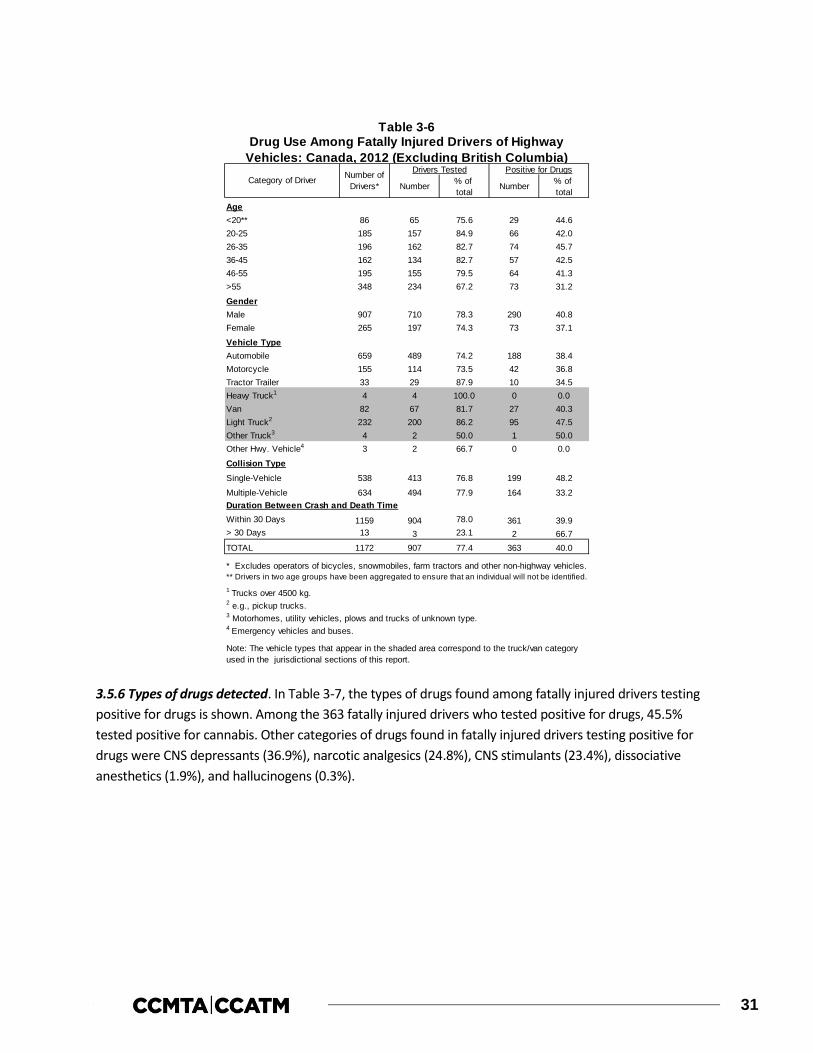
31
3.5.6 Types of drugs detected. In Table 3-7, the types of drugs found among fatally injured drivers testing positive for drugs is shown. Among the 363 fatally injured drivers who tested positive for drugs, 45.5% tested positive for cannabis. Other categories of drugs found in fatally injured drivers testing positive for drugs were CNS depressants (36.9%), narcotic analgesics (24.8%), CNS stimulants (23.4%), dissociative anesthetics (1.9%), and hallucinogens (0.3%).
% of % of total total
Age<20** 86 65 75.6 29 44.620-25 185 157 84.9 66 42.026-35 196 162 82.7 74 45.736-45 162 134 82.7 57 42.546-55 195 155 79.5 64 41.3>55 348 234 67.2 73 31.2
GenderMale 907 710 78.3 290 40.8Female 265 197 74.3 73 37.1
Vehicle TypeAutomobile 659 489 74.2 188 38.4Motorcycle 155 114 73.5 42 36.8Tractor Trailer 33 29 87.9 10 34.5Heavy Truck1 4 4 100.0 0 0.0Van 82 67 81.7 27 40.3Light Truck2 232 200 86.2 95 47.5Other Truck3 4 2 50.0 1 50.0Other Hwy. Vehicle4 3 2 66.7 0 0.0
Collision TypeSingle-Vehicle 538 413 76.8 199 48.2
Multiple-Vehicle 634 494 77.9 164 33.2Duration Between Crash and Death TimeWithin 30 Days 1159 904 78.0 361 39.9> 30 Days 13 3 23.1 2 66.7TOTAL 1172 907 77.4 363 40.0
* Excludes operators of bicycles, snowmobiles, farm tractors and other non-highway vehicles.** Drivers in two age groups have been aggregated to ensure that an individual will not be identified.1 Trucks over 4500 kg.2 e.g., pickup trucks.3 Motorhomes, utility vehicles, plows and trucks of unknown type.4 Emergency vehicles and buses.
Note: The vehicle types that appear in the shaded area correspond to the truck/van category used in the jurisdictional sections of this report.
Table 3-6Drug Use Among Fatally Injured Drivers of Highway
Vehicles: Canada, 2012 (Excluding British Columbia)Drivers Tested
Number Number
Positive for DrugsCategory of Driver Number of
Drivers*
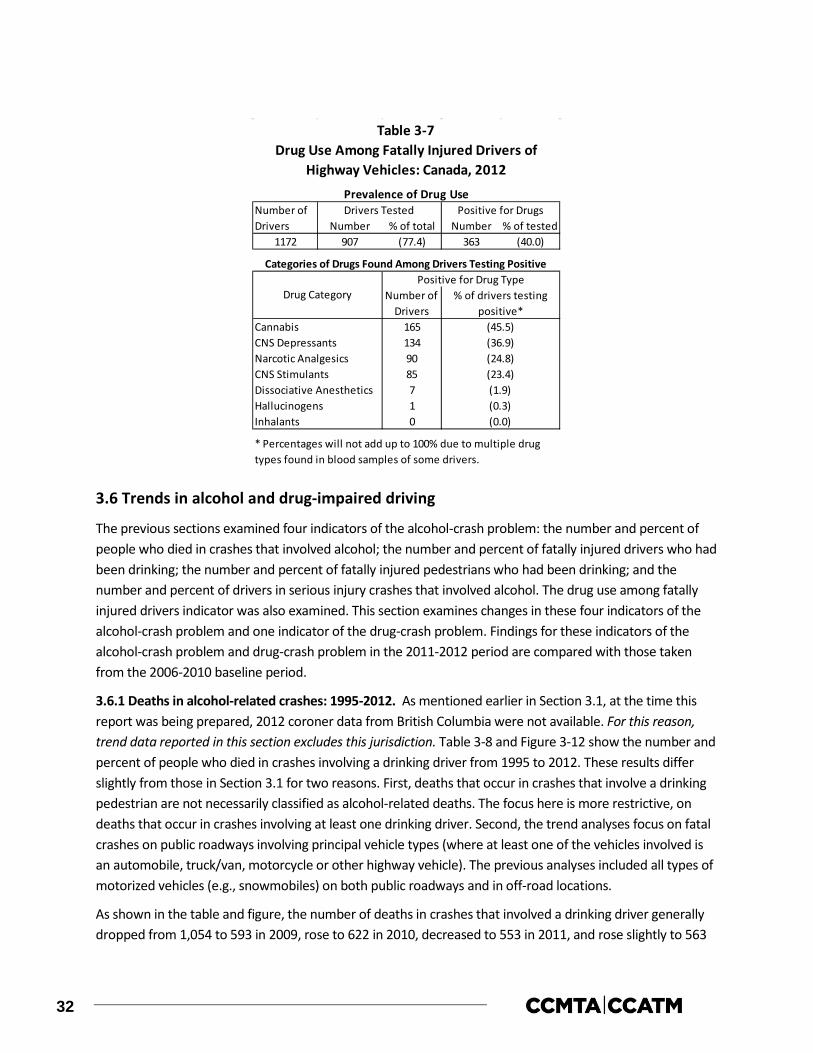
32
3.6 Trends in alcohol and drug-impaired driving
The previous sections examined four indicators of the alcohol-crash problem: the number and percent of people who died in crashes that involved alcohol; the number and percent of fatally injured drivers who had been drinking; the number and percent of fatally injured pedestrians who had been drinking; and the number and percent of drivers in serious injury crashes that involved alcohol. The drug use among fatally injured drivers indicator was also examined. This section examines changes in these four indicators of the alcohol-crash problem and one indicator of the drug-crash problem. Findings for these indicators of the alcohol-crash problem and drug-crash problem in the 2011-2012 period are compared with those taken from the 2006-2010 baseline period.
3.6.1 Deaths in alcohol-related crashes: 1995-2012. As mentioned earlier in Section 3.1, at the time this report was being prepared, 2012 coroner data from British Columbia were not available. For this reason, trend data reported in this section excludes this jurisdiction. Table 3-8 and Figure 3-12 show the number and percent of people who died in crashes involving a drinking driver from 1995 to 2012. These results differ slightly from those in Section 3.1 for two reasons. First, deaths that occur in crashes that involve a drinking pedestrian are not necessarily classified as alcohol-related deaths. The focus here is more restrictive, on deaths that occur in crashes involving at least one drinking driver. Second, the trend analyses focus on fatal crashes on public roadways involving principal vehicle types (where at least one of the vehicles involved is an automobile, truck/van, motorcycle or other highway vehicle). The previous analyses included all types of motorized vehicles (e.g., snowmobiles) on both public roadways and in off-road locations.
As shown in the table and figure, the number of deaths in crashes that involved a drinking driver generally dropped from 1,054 to 593 in 2009, rose to 622 in 2010, decreased to 553 in 2011, and rose slightly to 563
Number % of total Number % of tested1172 907 (77.4) 363 (40.0)
1651349085710
(36.9)
Categories of Drugs Found Among Drivers Testing Positive
Drug Category % of drivers testing positive*
Drug Use Among Fatally Injured Drivers of Highway Vehicles: Canada, 2012
Table 3-7
Drivers TestedNumber of Drivers
Positive for DrugsPrevalence of Drug Use
* Percentages will not add up to 100% due to multiple drug types found in blood samples of some drivers.
Positive for Drug TypeNumber of
Drivers(45.5)
(24.8)
HallucinogensDissociative Anesthetics
Inhalants(0.3)(1.9)
(0.0)
CNS Stimulants (23.4)
Cannabis
Narcotic AnalgesicsCNS Depressants

33
in 2012. The percentage of alcohol-related fatalities generally decreased from 37.2% in 1995 to a low of 28.6% in 2005, eventually rose to 33.8% in 2010, and decreased to 29.9% in 2012.
As shown at the bottom of the table, during the 2006-2010 baseline period there was an average of 671 fatalities involving a drinking driver and they accounted for 32.7% of all fatalities. This means that the percent of fatalities involving a drinking driver decreased by 7.0% from 32.7% in the baseline period (2006-2010) to 30.4% in the 2011-2012 period. And in terms of the number of persons killed in crashes involving a drinking driver, there has been a 16.8% decrease from an average of 671 in the baseline period (2006-2010) to 558 in the 2011-2012 period.
Number % of total Number % of total1995 2832 1054 37.2 2785 1041 37.4
1996 2573 885 34.4 2540 876 34.5
1997 2648 880 33.2 2603 871 33.5
1998 2469 815 33.0 2415 803 33.3
1999 2576 783 30.4 2534 771 30.4
2000 2452 731 29.8 2388 718 30.1
2001 2257 731 32.4 2181 716 32.8
2002 2399 688 28.7 2293 667 29.1
2003 2327 768 33.0 2272 752 33.1
2004 2240 677 30.2 2184 663 30.4
2005 2409 689 28.6 2358 681 28.9
2006 2345 763 32.5 2303 757 32.9
2007 2250 713 31.7 2205 705 32.0
2008 1986 664 33.4 1951 655 33.6
2009 1842 593 32.2 1791 583 32.6
2010 1841 622 33.8 1806 614 34.0
2011 1787 553 30.9 1765 549 31.1
2012 1881 563 29.9 1850 558 30.22006-2010baseline
2011-2012period
** only on public roadways involving principal vehicle types.*** excludes British Columbia.
30.71834 558 30.4 1807 554
* numbers are estimates based on the percent of deaths for which information was available to determine alcohol use.
Number of Deaths
Alcohol-Related Deaths
Persons Dying Within 30 Days of Collision
Table 3-8Number* and Percent of Motor Vehicle Deaths** Involving a
Drinking Driver: Canada, 1995-2012***
Alcohol-Related Deaths
Persons Dying Within 12 Months of Collision
Year of Death
Number of Deaths
2053 671 32.7 2011 663 33.0

34
3.6.2 Alcohol use among fatally injured drivers: 1987-2012. As mentioned earlier in Section 3.2, at the time this report was being prepared, 2011and 2012 coroner data from British Columbia were not available. For this reason, trend data reported in this section excludes this jurisdiction. Data on alcohol use among fatally injured drivers over the 26-year period from 1987 to 2012 are shown in Table 3-9. Trends are illustrated in Figure 3-13 which shows changes in the percent of fatally injured drivers who: (1) showed no evidence of alcohol – represented by the white area; (2) had BACs below the legal limit – shown by the light grey area; and (3) had BACs over the legal limit – the dark grey area.
The number of fatally injured drivers with BACs over the legal limit (> 80 mg%) generally declined from 618 to 317 between 1987 and 2004, rose to 373 in 2005, fell to a low of 260 in 2011, and rose again to 280 in 2012. The percent of fatally injured drivers with BACs over the legal limit generally decreased from 43.3% to 27.7% between 1987 and 2004, rose to 32.5% in 2009, declined again to 28.1% in 2011, and rose slightly to 28.4% in 2012.
By contrast, the number of fatally injured drivers with zero BACs has fluctuated over this 26-year period, from 665 in 1987 to a high of 873 in 1999. In 2012, there were 658 fatally injured drivers with zero BACs. The percent of fatally injured drivers with zero BACs generally increased from 46.6% to 67.6% between 1987 and 1999, remained stable until 2007, decreased to 61.8% in 2009, and rose again to 66.8% in 2012.
The number of fatally injured drivers with BACs between 1-80 mg% generally declined from 145 to 69 between 1987 and 2005, rose to 85 in 2007, and decreased to 47 in 2012. The percent of fatally injured drivers with BACs between 1 and 80 mg% generally dropped from 10.2% in 1987 to 5.5% in 2005, rose in 2007 (7.2%), and decreased to its lowest level in 2012 (4.8%).
When compared to the 2006-2010 baseline period shown at the bottom of Table 3-9, the percentage of fatally injured drivers with zero BACs in the 2011-2012 period increased by 5.9% (from 62.6% to 66.3%). Among drivers with BACs from 1-80 mg%, there was a 17.2% decrease (from 6.4% to 5.3%). And among those with BACs over 80 mg%, there was an 8.4% decrease (from 30.9% to 28.3%).
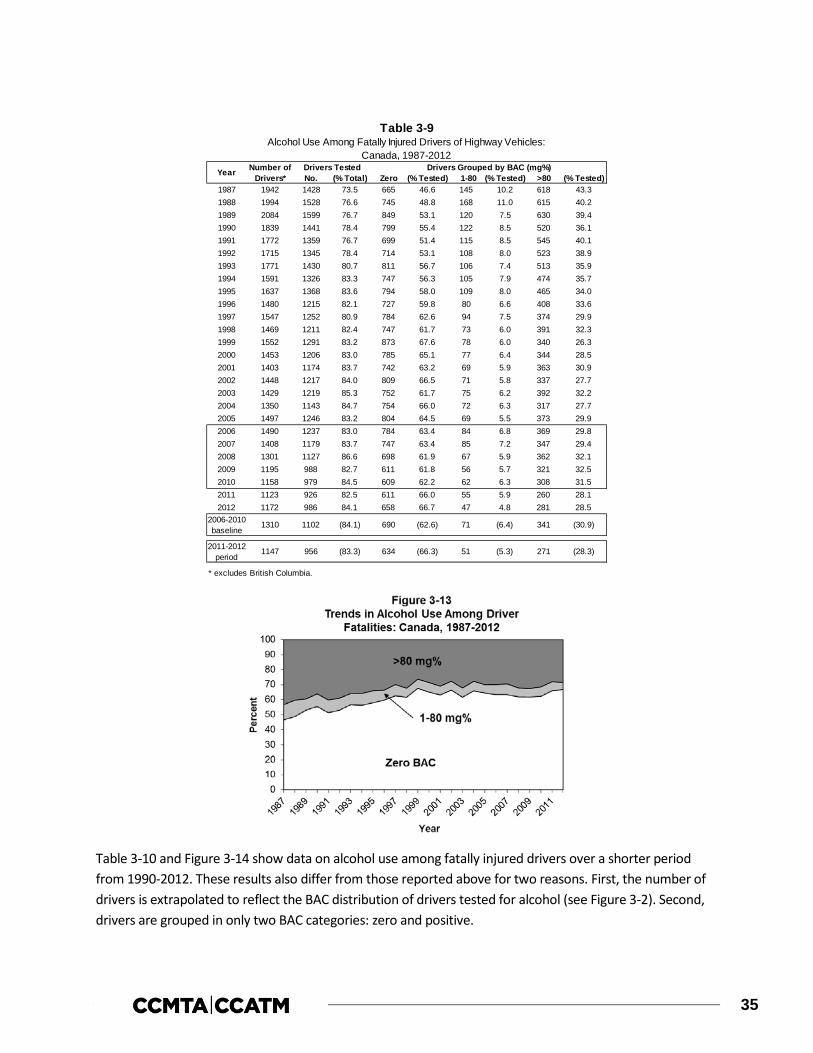
35
Table 3-10 and Figure 3-14 show data on alcohol use among fatally injured drivers over a shorter period from 1990-2012. These results also differ from those reported above for two reasons. First, the number of drivers is extrapolated to reflect the BAC distribution of drivers tested for alcohol (see Figure 3-2). Second, drivers are grouped in only two BAC categories: zero and positive.
No. (% Total) Zero (% Tested) 1-80 (% Tested) >80 (% Tested)1987 1942 1428 73.5 665 46.6 145 10.2 618 43.31988 1994 1528 76.6 745 48.8 168 11.0 615 40.21989 2084 1599 76.7 849 53.1 120 7.5 630 39.41990 1839 1441 78.4 799 55.4 122 8.5 520 36.11991 1772 1359 76.7 699 51.4 115 8.5 545 40.11992 1715 1345 78.4 714 53.1 108 8.0 523 38.91993 1771 1430 80.7 811 56.7 106 7.4 513 35.91994 1591 1326 83.3 747 56.3 105 7.9 474 35.71995 1637 1368 83.6 794 58.0 109 8.0 465 34.01996 1480 1215 82.1 727 59.8 80 6.6 408 33.61997 1547 1252 80.9 784 62.6 94 7.5 374 29.91998 1469 1211 82.4 747 61.7 73 6.0 391 32.31999 1552 1291 83.2 873 67.6 78 6.0 340 26.32000 1453 1206 83.0 785 65.1 77 6.4 344 28.52001 1403 1174 83.7 742 63.2 69 5.9 363 30.92002 1448 1217 84.0 809 66.5 71 5.8 337 27.72003 1429 1219 85.3 752 61.7 75 6.2 392 32.22004 1350 1143 84.7 754 66.0 72 6.3 317 27.72005 1497 1246 83.2 804 64.5 69 5.5 373 29.92006 1490 1237 83.0 784 63.4 84 6.8 369 29.82007 1408 1179 83.7 747 63.4 85 7.2 347 29.42008 1301 1127 86.6 698 61.9 67 5.9 362 32.12009 1195 988 82.7 611 61.8 56 5.7 321 32.52010 1158 979 84.5 609 62.2 62 6.3 308 31.52011 1123 926 82.5 611 66.0 55 5.9 260 28.12012 1172 986 84.1 658 66.7 47 4.8 281 28.5
2006-2010baseline
2011-2012period
* excludes British Columbia.
51 (5.3) 271 (28.3)1147 956 (83.3) 634 (66.3)
Table 3-9
Drivers Grouped by BAC (mg%)
Alcohol Use Among Fatally Injured Drivers of Highway Vehicles:Canada, 1987-2012
690 (62.6) 71 (6.4) 341 (30.9)
Year Number of Drivers*
Drivers Tested
1310 1102 (84.1)

36
As can be seen at the bottom of Table 3-10, the percentage of fatally injured drivers testing positive for alcohol from 2006-2010, the baseline period, is 37.3%. In the 2011-2012 period, 33.7% of fatally injured drivers tested positive for alcohol, which represents a 9.7% decrease from the baseline period.
Zero (% Tested) Positive (% Tested)1990 1827 1011 (55.3) 816 (44.7)
1991 1765 907 (51.4) 858 (48.6)
1992 1715 909 (53.0) 806 (47.0)
1993 1771 1003 (56.6) 768 (43.4)
1994 1591 896 (56.3) 695 (43.7)
1995 1637 949 (58.0) 688 (42.0)
1996 1480 883 (59.7) 597 (40.3)
1997 1547 966 (62.4) 581 (37.6)
1998 1469 905 (61.6) 564 (38.4)
1999 1552 1049 (67.6) 503 (32.4)
2000 1453 945 (65.0) 508 (35.0)
2001 1404 888 (63.2) 516 (36.8)
2002 1447 962 (66.5) 485 (33.5)
2003 1429 882 (61.7) 547 (38.3)
2004 1350 891 (66.0) 459 (34.0)
2005 1496 965 (64.5) 531 (35.5)
2006 1490 944 (63.4) 546 (36.6)
2007 1408 892 (63.4) 516 (36.6)
2008 1301 806 (62.0) 495 (38.0)
2009 1195 740 (61.9) 455 (38.1)
2010 1158 723 (62.4) 435 (37.6)
2011 1123 739 (65.8) 384 (34.2)
2012 1172 783 (66.8) 389 (33.2)2006-2010baseline
2011-2012period
* numbers are estimates based on the BAC distribution of drivers tested for alcohol** excludes British Columbia
Table 3-10Alcohol Use Among Fatally Injured Drivers of Highway Vehicles*:
Canada, 1990-2012**
Year Number of Drivers
Drivers Grouped by BAC (mg%)
1310 821 (62.7) 489 (37.3)
1147 761 (66.3) 386 (33.7)
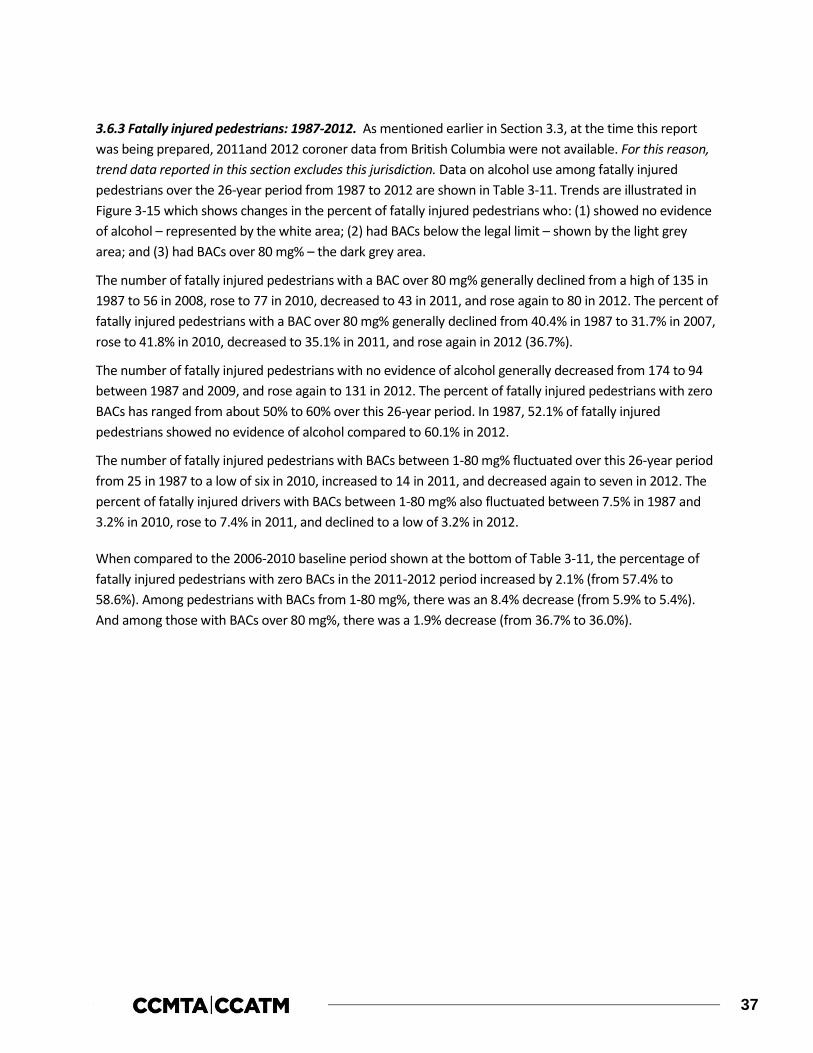
37
3.6.3 Fatally injured pedestrians: 1987-2012. As mentioned earlier in Section 3.3, at the time this report was being prepared, 2011and 2012 coroner data from British Columbia were not available. For this reason, trend data reported in this section excludes this jurisdiction. Data on alcohol use among fatally injured pedestrians over the 26-year period from 1987 to 2012 are shown in Table 3-11. Trends are illustrated in Figure 3-15 which shows changes in the percent of fatally injured pedestrians who: (1) showed no evidence of alcohol – represented by the white area; (2) had BACs below the legal limit – shown by the light grey area; and (3) had BACs over 80 mg% – the dark grey area.
The number of fatally injured pedestrians with a BAC over 80 mg% generally declined from a high of 135 in 1987 to 56 in 2008, rose to 77 in 2010, decreased to 43 in 2011, and rose again to 80 in 2012. The percent of fatally injured pedestrians with a BAC over 80 mg% generally declined from 40.4% in 1987 to 31.7% in 2007, rose to 41.8% in 2010, decreased to 35.1% in 2011, and rose again in 2012 (36.7%).
The number of fatally injured pedestrians with no evidence of alcohol generally decreased from 174 to 94 between 1987 and 2009, and rose again to 131 in 2012. The percent of fatally injured pedestrians with zero BACs has ranged from about 50% to 60% over this 26-year period. In 1987, 52.1% of fatally injured pedestrians showed no evidence of alcohol compared to 60.1% in 2012.
The number of fatally injured pedestrians with BACs between 1-80 mg% fluctuated over this 26-year period from 25 in 1987 to a low of six in 2010, increased to 14 in 2011, and decreased again to seven in 2012. The percent of fatally injured drivers with BACs between 1-80 mg% also fluctuated between 7.5% in 1987 and 3.2% in 2010, rose to 7.4% in 2011, and declined to a low of 3.2% in 2012.
When compared to the 2006-2010 baseline period shown at the bottom of Table 3-11, the percentage of fatally injured pedestrians with zero BACs in the 2011-2012 period increased by 2.1% (from 57.4% to 58.6%). Among pedestrians with BACs from 1-80 mg%, there was an 8.4% decrease (from 5.9% to 5.4%). And among those with BACs over 80 mg%, there was a 1.9% decrease (from 36.7% to 36.0%).
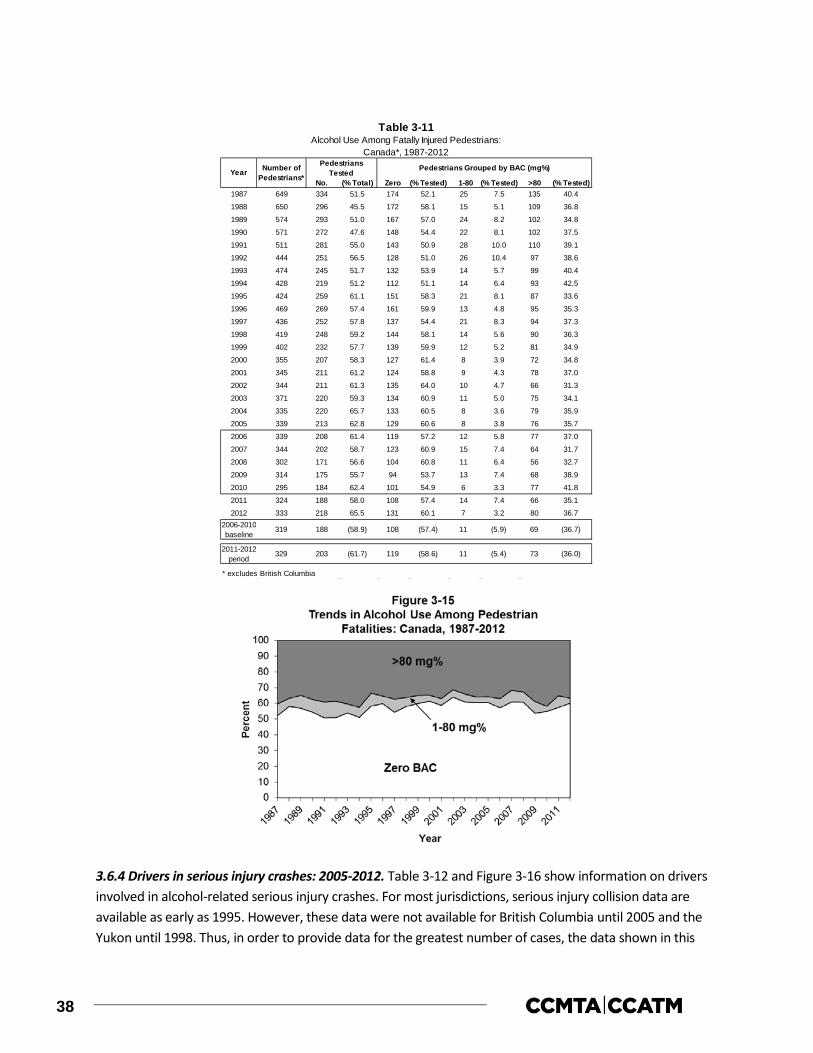
38
3.6.4 Drivers in serious injury crashes: 2005-2012. Table 3-12 and Figure 3-16 show information on drivers involved in alcohol-related serious injury crashes. For most jurisdictions, serious injury collision data are available as early as 1995. However, these data were not available for British Columbia until 2005 and the Yukon until 1998. Thus, in order to provide data for the greatest number of cases, the data shown in this
No. (% Total) Zero (% Tested) 1-80 (% Tested) >80 (% Tested)1987 649 334 51.5 174 52.1 25 7.5 135 40.4
1988 650 296 45.5 172 58.1 15 5.1 109 36.8
1989 574 293 51.0 167 57.0 24 8.2 102 34.8
1990 571 272 47.6 148 54.4 22 8.1 102 37.5
1991 511 281 55.0 143 50.9 28 10.0 110 39.1
1992 444 251 56.5 128 51.0 26 10.4 97 38.6
1993 474 245 51.7 132 53.9 14 5.7 99 40.4
1994 428 219 51.2 112 51.1 14 6.4 93 42.5
1995 424 259 61.1 151 58.3 21 8.1 87 33.6
1996 469 269 57.4 161 59.9 13 4.8 95 35.3
1997 436 252 57.8 137 54.4 21 8.3 94 37.3
1998 419 248 59.2 144 58.1 14 5.6 90 36.3
1999 402 232 57.7 139 59.9 12 5.2 81 34.9
2000 355 207 58.3 127 61.4 8 3.9 72 34.8
2001 345 211 61.2 124 58.8 9 4.3 78 37.0
2002 344 211 61.3 135 64.0 10 4.7 66 31.3
2003 371 220 59.3 134 60.9 11 5.0 75 34.1
2004 335 220 65.7 133 60.5 8 3.6 79 35.9
2005 339 213 62.8 129 60.6 8 3.8 76 35.7
2006 339 208 61.4 119 57.2 12 5.8 77 37.0
2007 344 202 58.7 123 60.9 15 7.4 64 31.7
2008 302 171 56.6 104 60.8 11 6.4 56 32.7
2009 314 175 55.7 94 53.7 13 7.4 68 38.9
2010 295 184 62.4 101 54.9 6 3.3 77 41.8
2011 324 188 58.0 108 57.4 14 7.4 66 35.1
2012 333 218 65.5 131 60.1 7 3.2 80 36.72006-2010baseline
2011-2012period
* excludes British Columbia
11 (5.9) 69 (36.7)319 188 (58.9) 108 (57.4)
Pedestrians Tested Pedestrians Grouped by BAC (mg%)
Table 3-11Alcohol Use Among Fatally Injured Pedestrians:
Canada*, 1987-2012
Year Number of Pedestrians*
11 (5.4) 73 (36.0)329 203 (61.7) 119 (58.6)

39
table cover the 2005-2012 period. However, there are still some jurisdictions that did not have data available at the time this report was being prepared. These jurisdictions include Newfoundland and Labrador (2009-2011), and Nunavut (2011-2012). Thus Table 3-12 and Figure 3-16 exclude these two jurisdictions.
As can be seen, the incidence of alcohol-involvement in serious crashes has declined only slightly. Between 2005 and 2006 the number of drivers in serious injury crashes that involved alcohol rose from 3,673 to 3,768. This number gradually decreased to 2,282 in 2011 and remained at this level in 2012. The number of drivers in alcohol-related serious injury crashes from 2009 to 2012, however, is an underestimate since data exclude the following jurisdictions- Newfoundland and Labrador and Nunavut. The percentage of drivers in serious injury crashes that involved alcohol generally rose from 19.1% to 20.3% in 2006, decreased in 2008 (19.8%), rose in 2009 (20.1%), and decreased until 2012 (17.0%).
In the baseline period, an average of 19.9% of drivers in serious injury crashes were in an alcohol-involved crash. In the 2011-2012 period, the incidence of drivers in alcohol-involved crashes declined to 17.2%, a decrease of 13.6%.
Year Number of Drivers
Number in Alcohol-Involved Crashes Percent
2005 19183 3673 (19.1)2006 18587 3768 (20.3)2007 17083 3464 (20.3)2008 15687 3104 (19.8)2009 14488 2912 (20.1)2010 14471 2731 (18.9)2011 13149 2282 (17.4)2012 13395 2282 (17.0)
2006-2010baseline
2011-2012period
** Excludes data from Newfoundland and Labrador and Nunavut.
* single-vehicle nighttime crashes (SVN) as well as non-SVN crashes that have police-reported alcohol involvement
Table 3-12Number and Percent of All Drivers in Serious Injury Crashes*
that Involved Alcohol: Canada, 2005-2012**
16063 3196 (19.9)
13272 2282 (17.2)
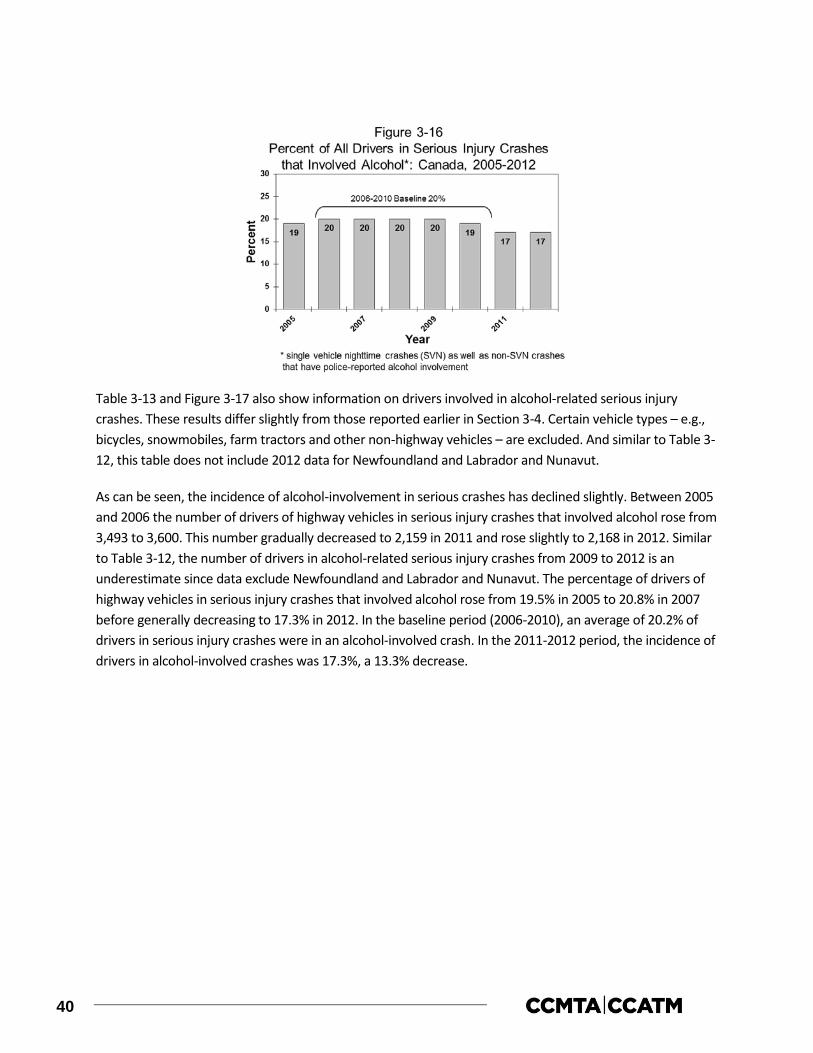
40
Table 3-13 and Figure 3-17 also show information on drivers involved in alcohol-related serious injury crashes. These results differ slightly from those reported earlier in Section 3-4. Certain vehicle types – e.g., bicycles, snowmobiles, farm tractors and other non-highway vehicles – are excluded. And similar to Table 3-12, this table does not include 2012 data for Newfoundland and Labrador and Nunavut.
As can be seen, the incidence of alcohol-involvement in serious crashes has declined slightly. Between 2005 and 2006 the number of drivers of highway vehicles in serious injury crashes that involved alcohol rose from 3,493 to 3,600. This number gradually decreased to 2,159 in 2011 and rose slightly to 2,168 in 2012. Similar to Table 3-12, the number of drivers in alcohol-related serious injury crashes from 2009 to 2012 is an underestimate since data exclude Newfoundland and Labrador and Nunavut. The percentage of drivers of highway vehicles in serious injury crashes that involved alcohol rose from 19.5% in 2005 to 20.8% in 2007 before generally decreasing to 17.3% in 2012. In the baseline period (2006-2010), an average of 20.2% of drivers in serious injury crashes were in an alcohol-involved crash. In the 2011-2012 period, the incidence of drivers in alcohol-involved crashes was 17.3%, a 13.3% decrease.

41
3.6.5 Drug use among fatally injured drivers: 2000-2012. As mentioned earlier in Section 3.5, at the time this report was being prepared, 2011and 2012 coroner data from British Columbia were not available. For this reason, trend data reported in this section excludes this jurisdiction. Data on drug use among fatally injured drivers of highway vehicles over the 13-year period from 2000 to 2012 are shown in Table 3-14. Trends are illustrated in Figure 3-18 which shows changes in the percent of fatally injured drivers who tested positive for drugs.
Unlike trends in the number of fatally injured drivers testing positive for alcohol, the corresponding trends in the number of drivers testing positive for drugs is more difficult to analyse since testing rates for drugs are less consistent than those for alcohol. For example, in 2000, only 36.3% of fatally injured drivers were tested for drugs compared to 77.4% in 2012.
Year Number of Drivers
Number in Alcohol-Involved Crashes Percent
2005 17873 3493 (19.5)2006 17452 3600 (20.6)2007 15986 3331 (20.8)2008 14579 2934 (20.1)2009 13498 2743 (20.3)2010 13367 2537 (19.0)2011 12223 2159 (17.7)2012 12507 2168 (17.3)
2006-2010baseline
2011-2012period
** Excludes data from Newfoundland and Labrador and Nunavut.
** single-vehicle nighttime crashes (SVN) as well as non-SVN crashes that have police-reported alcohol involvement.
Table 3-13Number and Percent of Drivers* of Highway Vehicles in Serious
Injury Crashes** that Involved Alcohol: Canada, 2005-2012***
14976 3029 (20.2)
12365 2164 (17.5)
* excludes operators of bicycles, snowmobiles, farm tractors, and other non-highway vehicles.
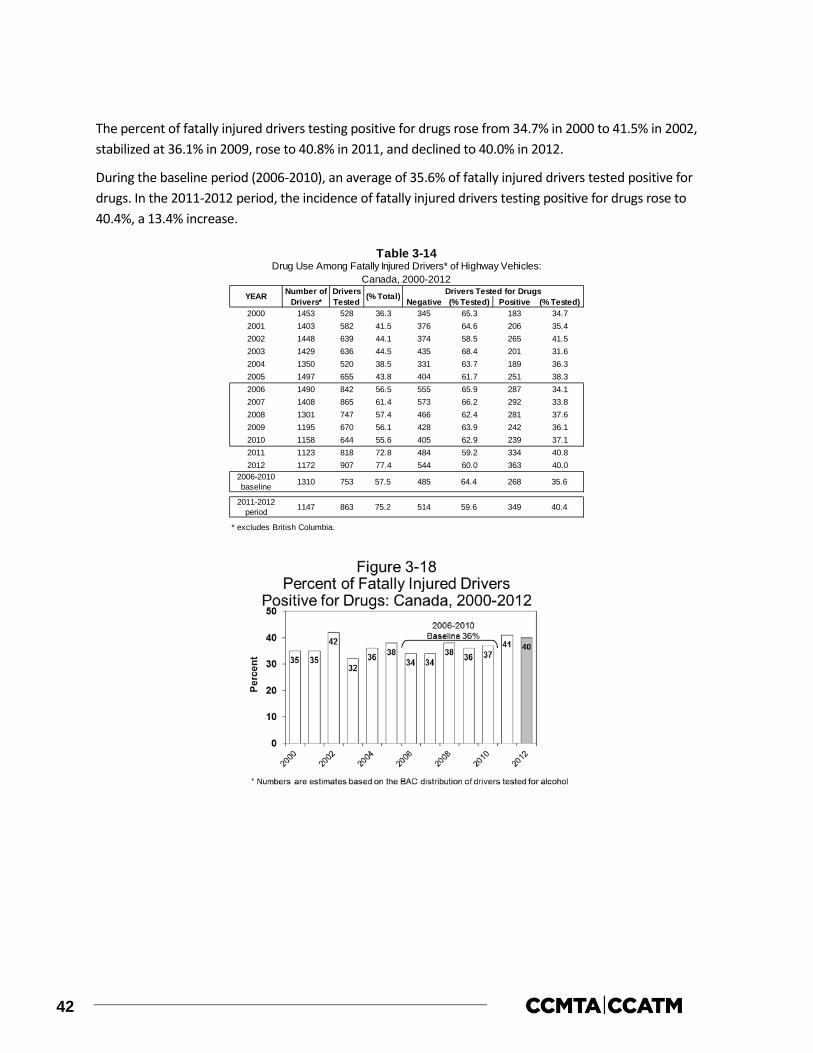
42
The percent of fatally injured drivers testing positive for drugs rose from 34.7% in 2000 to 41.5% in 2002, stabilized at 36.1% in 2009, rose to 40.8% in 2011, and declined to 40.0% in 2012.
During the baseline period (2006-2010), an average of 35.6% of fatally injured drivers tested positive for drugs. In the 2011-2012 period, the incidence of fatally injured drivers testing positive for drugs rose to 40.4%, a 13.4% increase.
Negative (% Tested) Positive (% Tested)2000 1453 528 36.3 345 65.3 183 34.72001 1403 582 41.5 376 64.6 206 35.42002 1448 639 44.1 374 58.5 265 41.52003 1429 636 44.5 435 68.4 201 31.62004 1350 520 38.5 331 63.7 189 36.32005 1497 655 43.8 404 61.7 251 38.32006 1490 842 56.5 555 65.9 287 34.12007 1408 865 61.4 573 66.2 292 33.82008 1301 747 57.4 466 62.4 281 37.62009 1195 670 56.1 428 63.9 242 36.12010 1158 644 55.6 405 62.9 239 37.12011 1123 818 72.8 484 59.2 334 40.82012 1172 907 77.4 544 60.0 363 40.0
2006-2010baseline
2011-2012period
* excludes British Columbia.
349 40.41147 863 75.2 514 59.6
268 35.6
Drug Use Among Fatally Injured Drivers* of Highway Vehicles: Canada, 2000-2012
1310 753 57.5 485 64.4
Table 3-14
YEAR Number of Drivers*
Drivers Tested (% Total) Drivers Tested for Drugs

43
4.0 BRITISH COLUMBIA
This section of the report reviews the major findings on alcohol involvement in fatal and serious injury motor vehicle collisions as well as drug involvement in fatal motor vehicle collisions in British Columbia. It describes data on:
> people who were killed in alcohol-related crashes (Section 4.1);
> alcohol use among fatally injured drivers (Section 4.2);
> drivers involved in alcohol-related serious injury crashes (Section 4.3);
> drug use among fatally injured drivers (Section 4.4); and,
> trends in the alcohol-crash and drug-crash problems (Section 4.5).
4.1 Deaths in alcohol-related crashes
Table 4-1 presents information on people who died in alcohol-related crashes in British Columbia during 2010 for persons dying within 12 months of the collision (one calendar year) and for persons dying within 30 days of the collision. At the time this report was being prepared, 2011and 2012 coroner data from British Columbia were not available. For this reason, 2010 data will be reported in this section. Motor vehicle deaths are categorized in terms of the victim’s age, gender, type (i.e., driver, passenger, pedestrian) and the type of vehicle they occupied. In each section, the first column in the table presents the number of deaths. The next two columns show the number and percent of these fatalities in which sufficient information was available to determine if alcohol was involved. A motor vehicle fatality was considered to be alcohol involved if there was at least one drinking driver or drinking pedestrian in the fatal crash.
For example, within the first section, it can be seen that among persons dying within 12 months of the collision, 26 people aged 16-19 were killed in motor vehicle crashes in British Columbia during 2010. And, in 25 cases (96.2%) it was possible to determine if alcohol was a factor in the crash. The next column shows the number of people killed in crashes that were known to be alcohol-involved. For example, 15 people aged 16-19 died in alcohol-related crashes in British Columbia during 2010. The next column expresses this as a percentage – i.e., 60.0% of the 16-19 year olds who were killed died in an alcohol-related crash.
The final column (percent of all alcohol-related deaths) expresses the number of deaths in alcohol-related crashes as a percent of all the deaths in such crashes. For example, the alcohol-related deaths among 16-19 year olds represent 10.5% of all the people killed in alcohol-related crashes in British Columbia during 2010.
An examination of the section for persons dying within 30 days of the collision shows that 25 persons aged 16-19 died in motor vehicle crashes. In 24 of these cases (96.0%), it was possible to determine if alcohol was a factor in the crash. Among these persons, 15 (62.5%) were alcohol-related deaths. And 16-19 year olds accounted for 10.7% of people dying in alcohol-related crashes.

44
The totals at the bottom of the table provide a summary. As can be seen, 387 persons died within 12 months of a motor vehicle crash in British Columbia during 2010. In 365 (94.3%) of these cases, it was possible to determine if alcohol was a factor. Of these known cases, 143 (39.2%) involved alcohol. Extrapolating this figure to the total number of motor vehicle fatalities (387 x .392) it can be estimated that in British Columbia during 2010, 152 persons died in alcohol-related crashes within 12 months of the collision.
Among the 373 persons dying within 30 days of the collision, it was possible to determine if alcohol was a factor in 94.4% of the cases. Of these known cases, 140 (39.8%) involved alcohol. Extrapolating this figure to the total number of motor vehicle fatalities (373 x .398) it can be estimated that in British Columbia during 2010, 148 persons died in alcohol-related crashes within 30 days of the collision.
4.1.1 Victim age. Of all the people who died in alcohol-related crashes within 12 months of the collision, 24.5% (see last column in the first section) were aged 26-35; 20.3% were aged 46-55; 16.1% were aged 20-25 and 36-45; 11.2% were over age 55; 10.5% were aged 16-19; and 1.4% were under age 16.
The highest incidence of alcohol involvement occurred in the crashes in which a person aged 26-35 and 20-25 died (61.4% and 60.5%, respectively). The lowest incidence of alcohol involvement was found among the
Age Group<16 17 15 88.2 2 13.3 1.4 16 14 87.5 1 7.1 0.716-19 26 25 96.2 15 60.0 10.5 25 24 96.0 15 62.5 10.720-25 39 38 97.4 23 60.5 16.1 37 36 97.3 21 58.3 15.026-35 59 57 96.6 35 61.4 24.5 58 56 96.6 35 62.5 25.036-45 51 50 98.0 23 46.0 16.1 49 49 100.0 23 46.9 16.446-55 75 73 97.3 29 39.7 20.3 74 72 97.3 29 40.3 20.7>55 120 107 89.2 16 15.0 11.2 114 101 88.6 16 15.8 11.4
GenderMale 256 244 95.3 103 42.2 72.0 246 234 95.1 100 42.7 71.4Female 131 121 92.4 40 33.1 28.0 127 118 92.9 40 33.9 28.6
Victim TypeDriver/ Operator 229 216 94.3 80 37.0 55.9 222 210 94.6 78 37.1 55.7Passenger 95 89 93.7 39 43.8 27.3 95 89 93.7 39 43.8 27.9Pedestrian 63 60 95.2 24 40.0 16.8 56 53 94.6 23 43.4 16.4
Vehicle OccupiedAutomobiles 155 144 92.9 60 41.7 42.0 154 143 92.9 60 42.0 42.9Trucks/Vans 103 99 96.1 38 38.4 26.6 100 96 96.0 37 38.5 26.4Motorcycles 37 36 97.3 11 30.6 7.7 36 35 97.2 11 31.4 7.9Other Hwy Vehicles 12 11 91.7 1 9.1 0.7 11 11 100.0 1 9.1 0.7Off-road Vehicles 17 15 88.2 9 60.0 6.3 16 14 87.5 8 57.1 5.7(Pedestrians) 63 60 95.2 24 40.0 16.8 56 53 94.6 23 43.4 16.4
Collision LocationPublic Road 375 354 94.4 136 38.4 95.1 361 341 94.5 133 39.0 95.0Off-road 12 11 91.7 7 63.6 4.9 12 11 91.7 7 63.6 5.0
TOTAL 387 365 94.3 143 39.2 100.0 373 352 94.4 140 39.8 100.0
No. of Deaths No.
Alcohol Use Known
% of total
No.
Persons Dying Within 30 Days of Collision
% of known
Table 4-1Deaths in Alcohol-Related Crashes: British Columbia, 2010
Alcohol-Related Deaths (ARDs)
Alcohol-Related Deaths (ARDs)
% of all ARDs
% of all ARDs
Persons Dying Within 12 Months of Collision
% of known
No. of Deaths
Alcohol Use Known
No. % of total
No.Category of Victim
45
oldest and youngest fatalities – 13.3% of persons under 16 and 15.0% of the fatalities over 55 years of age died in crashes involving alcohol.
4.1.2 Gender. Of all the people who died in alcohol-related crashes within 12 months of the collision, 72.0% were males. The incidence of alcohol in crashes in which a male died (42.2%) was greater than the incidence of alcohol in crashes in which a female died (33.1%).
4.1.3 Victim type. Of all the people who died in alcohol-related crashes within 12 months of the collision, 55.9% were drivers/operators of a vehicle; 27.3% were passengers; and 16.8% were pedestrians.
Within each of the victim types, the highest incidence of alcohol involvement (43.8%) occurred in the crashes in which a passenger died. Alcohol was involved in 40.0% of the crashes in which a pedestrian died and 37.0% of those in which a driver/operator died.
4.1.4 Type of vehicle occupied. Of all the people who died in alcohol-related crashes within 12 months of the collision, 42.0% were in an automobile; 26.6% were in a truck/van; 7.7% were motorcyclists; 6.3% were off-road vehicle occupants; and 0.7% were occupants of other highway vehicles.
Within each of these vehicle types, the incidence of alcohol involvement in which an automobile occupant died was greater than the incidence of alcohol in crashes in which a truck/van occupant or motorcyclist died (41.7% versus 38.4% and 30.6%). Among off-road vehicle occupants, 60.0% were in an alcohol-related crash.
4.1.5 Collision location. Of all the people who died in alcohol-related crashes within 12 months of the collision, 95.1% died in a collision which occurred on a public road and 4.9% died in an off-road collision. However, the incidence of alcohol involvement in which a victim died in an alcohol-related crash was greater for those dying in off-road collisions (63.3%) than it was for persons dying in a collision which occurred on a public road (38.4%).
4.2 Alcohol in fatally injured drivers
This section presents information on the presence of alcohol, exclusively among drivers fatally injured in British Columbia during 2010. At the time this report was being prepared, 2011and 2012 coroner data from British Columbia were not available. For this reason, 2010 data will be reported in this section. Table 4-2 shows the information by age group, gender, vehicle type, collision type (single vs. multiple), and duration between crash time and death time (within 12 months vs. within 30 days of the collision).
The first column in the table shows the number of drivers killed. The next columns show the number and percent of these victims who were tested for alcohol. The remaining columns provide information on the results of the alcohol tests: the first three of these present results for drivers who showed any evidence of alcohol; the last three columns present information on drivers who had BACs over the statutory limit of 80 mg%.
To illustrate, among 16-19 year olds there were 13 drivers killed during 2010; 11 of these fatally injured drivers (84.6%) were tested for alcohol. Of those who were tested, three (27.3%) were positive for alcohol.

46
This means that 16-19 year old fatally injured drinking drivers accounted for 4.8% of all drinking drivers who were killed.
Then, in the final three columns, it can be seen that three of the 11 (27.3%) fatally injured 16-19 year olds who were tested for alcohol had BACs in excess of 80 mg%. This means that all three of the drivers who were positive for alcohol had BACs in excess of the legal limit. The final column expresses the number of drivers with illegal BACs as a percent of all drivers with BACs over the limit. Thus, 16-19 year old drivers accounted for 5.8% of all the drivers with BACs over the legal limit.
The main findings are shown by the totals at the bottom of the table. British Columbia had a high testing rate in 2010, with 84.1% of fatally injured drivers being tested for alcohol use.
In British Columbia, 35.0% had been drinking and 52 of 63 (82.5%) fatally injured drinking drivers had BACs over 80 mg%. Although not shown in the table, more refined analyses by different BAC categories show that among tested drivers:
> 65.0% had BACs of zero mg%;
> 2.2% had BACs from 1-49 mg%;
> 3.9% had BACs from 50-80 mg%
Age Group<16 1 1 100.0 0 0.0 0.0 0 0.0 0.016-19 13 11 84.6 3 27.3 4.8 3 27.3 5.820-25 19 15 78.9 8 53.3 12.7 8 53.3 15.426-35 35 32 91.4 18 56.3 28.6 15 46.9 28.836-45 32 27 84.4 13 48.1 20.6 11 40.7 21.246-55 49 42 85.7 13 31.0 20.6 12 28.6 23.1>55 65 52 80.0 8 15.4 12.7 3 5.8 5.8Gender
Male 162 135 83.3 48 35.6 76.2 39 28.9 75.0Female 52 45 86.5 15 33.3 23.8 13 28.9 25.0
Vehicle TypeAutomobiles 101 90 89.1 32 35.6 50.8 26 28.9 50.0Truck/Van 70 56 80.0 22 39.3 34.9 19 33.9 36.5Motorcycles 33 26 78.8 8 30.8 12.7 6 23.1 11.5Tractor Trailer 8 8 100.0 1 12.5 1.6 1 12.5 1.9Other Vehicle 2 0 0.0 0 0.0 0.0 0 0.0 0.0
Collision TypeSingle vehicle 121 97 80.2 51 52.6 81.0 45 46.4 86.5Multiple vehicle 93 83 89.2 12 14.5 19.0 7 8.4 13.5Duration Between Crash and Death TimeWithin 30 Days 208 180 86.5 63 35.0 100.0 52 28.9 100.0> 30 Days 6 0 0.0 0 0.0 0.0 0 0.0 0.0
TOTAL 214 180 84.1 63 35.0 100.0 52 28.9 100.0
% of tested
Table 4-2Alcohol Use Among Fatally Injured Drivers of Highway Vehicles:
British Columbia, 2010Positive BAC BAC >80 mg%
% of all drivers with
+BAC
% of all drivers with BAC >80
mg%
% of tested No.
Category of Driver
No. of Drivers No.
Drivers Tested
% of total No.

47
> 7.8% had BACs from 81 to 160 mg%; and,
> 21.1% had BACs over 160 mg%.
In Figure 4-1, the BAC distribution for tested fatally injured drivers is extrapolated to reflect the BAC distribution for all fatally injured drivers. In this figure, 75 of 214 (35.0%) fatally injured drivers have a positive BAC. And among fatally injured drinking drivers, 62 (82.7%) have BACs over 80 mg%.
According to the British Columbia member jurisdiction of CCMTA, where information is presented on blood alcohol concentration (BAC) levels of deceased drivers (e.g., Figure 3-2 on page 18, Figure 4-1 on page 47 reflecting British Columbia data), the following must be taken into account:
BAC values presented in these figures only represent BAC values for deceased drivers exclusively and therefore represent only a subset of the BAC levels of drivers involved in motor vehicle crashes that cause deaths and injuries. For example, where a driver is assigned alcohol as a contributing factor to a crash and that driver survives that crash but, another road user is killed (pedestrian, cyclist or another driver or occupants of any vehicle), that driver’s BAC level is not reflected in the figures shown above or the similar figures assembled for other Canadian provinces and territories. Furthermore, where a driver is assigned alcohol as a contributing factor to a crash and that driver survives that crash but are themselves injured or another road user is injured (pedestrian, cyclist or any driver or occupants of any vehicle involved in the crash), that driver’s BAC level is again NOT reflected in the figures 3-2, 4-1, or the similar figures assembled for other Canadian provinces and territories. This is a major and prevailing limitation of these data and the BAC values represented herein. This means that the BAC levels reflected in these tables do not reflect the full range of BAC levels of drivers involved in serious crashes and should not be relied upon to draw conclusions about BAC levels and motor vehicle crash risk. In order to understand BAC levels and motor vehicle crash risk, a number of research studies exist to do that. Based on an extensive amount of research, there is overwhelming evidence that even BAC levels as low as .02 impair driving abilities and at .04 to .05 BAC there is a clear relationship between crash risk and alcohol (see Zador et al. 2000; Blomberg et al. 2009; Moskowitz et al. 2000).

48
4.2.1 Age differences. Of all the fatally injured drinking drivers (i.e., those with a positive BAC), 28.6% were aged 26-35; 20.6% were aged 36-45 and 46-55; 12.7% were aged 20-25 and over 55; and 4.8% were aged 16-19.
Of all the fatally injured legally impaired drivers (i.e., those with BACs over 80 mg%), 28.8% were aged 26-35; 23.1% were aged 46-55; 21.2% were aged 36-45; 15.4% were aged 20-25; and 5.8% were aged 16-19 and over age 55.
When comparing the incidence of drinking and driving among fatally injured drivers by age group, fatally injured drivers aged 26-35 were the most likely to have been drinking (56.3%). By contrast, the lone tested driver under 16 had not been drinking and only 15.4% of the tested drivers aged over 55 had been drinking.
4.2.2 Gender differences. Males dominate the picture – they account for 76.2% of all the fatally injured drivers who had been drinking, and 75.0% of all of the fatally injured drivers who were legally impaired.
Males dominate the picture largely because they account for most of the drivers who are killed (162 of the 214 fatalities or 75.7% are males). Fatally injured male drivers were slightly more likely to have been drinking than female drivers (35.6% and 33.3%, respectively). And, 81.3% of the male and 86.7% of the female drivers who were drinking had BACs over the legal limit.
4.2.3 Vehicle differences. Of all the fatally injured drinking drivers (i.e., those with a positive BAC), 50.8% were automobile drivers; 34.9% were truck/van drivers; 12.7% were motorcyclists; and 1.6% were tractor-trailer drivers.
Of all the fatally injured legally impaired drivers (i.e., those with BACs over 80 mg%), 50.0% were automobile drivers, 36.5% were truck/van drivers; 11.5% were motorcyclists; and 1.9% were tractor-trailer drivers.
Within each of the vehicle types, 39.3% of fatally injured drivers of truck/vans, 35.6% of automobile drivers, 30.8% of motorcyclists, and 12.5% of tractor-trailer drivers were found to have been drinking.
4.2.4 Collision differences. Just over half of the drivers killed (121 of the 214) were involved in single-vehicle collisions but these crashes accounted for four-fifths of the drivers who had been drinking or were legally impaired (81.0% and 86.5%, respectively).
The reason for this apparent disparity is because alcohol is overrepresented in single-vehicle crashes. Over half of the drivers involved in single-vehicle crashes (52.6%) were positive for alcohol, compared to only 14.5% of those involved in multiple-vehicle collisions.
4.2.5 Duration between crash and death time. Given that only six fatally injured drivers died more than 30 days after the collision, and none of these drivers were tested for alcohol, a comparison of alcohol use among drivers based on differences in the duration between crash time and death time cannot be performed.
4.3 Drivers involved in alcohol-related serious injury crashes
This section presents information on drivers involved in alcohol-related crashes in which someone was seriously injured in 2012 in British Columbia. A “surrogate” or “indirect” measure is used to estimate alcohol
49
involvement because drivers in serious injury crashes are seldom tested for alcohol. A driver is identified as having been involved in an alcohol-related serious injury crash if the crash in which someone was seriously injured involved a single vehicle at night (SVN), or if, in the case of a non-SVN serious injury crash, the police reported alcohol involvement – i.e., at least one drinking driver in the crash (see Section 2.2.4).
The results are shown in Table 4-3 for drivers grouped in terms of age, gender, type of vehicle driven, and type of collision. The first column shows the number of drivers involved in serious injury crashes. The number and percent of drivers in such crashes that involved alcohol is shown in the next two columns. The final column expresses the number of drivers involved in alcohol-related serious injury crashes in any row as a percent of all drivers involved in alcohol- related serious injury crashes.
As shown, by the totals at the bottom of the table, 2,173 drivers were involved in crashes in which someone was seriously injured, and among these 20.0% were alcohol-related crashes.
4.3.1 Driver age. Of all the drivers involved in alcohol-related serious injury crashes, 21.4% were aged 46-55, 20.5% were aged 26-35; and 19.4% were aged 20-25. Drivers under 16 and 16-19 respectively accounted for only 0.3% and 6.2% of those involved in alcohol-related serious injury crashes.
Almost one-third (31.0%) of the drivers aged 20-25 were involved in alcohol-related serious injury crashes. The lowest incidence of involvement in alcohol-related crashes was found for those under 16 years of age (0.0%) and over 55 (8.4%).
4.3.2 Driver gender. Of all the drivers involved in alcohol-related serious injury crashes, 74.4% were males. The incidence of involvement in alcohol-related serious injury crashes was also greater for males than for females (21.2% and 15.7%, respectively).
4.3.3 Type of vehicle driven. Of all the drivers involved in alcohol-related serious injury crashes, 50.7% were automobile drivers; 31.6% were truck/van drivers; 8.3% were motorcyclists; 3.7% were tractor-trailer drivers; 3.5% were off-road vehicle drivers; and 1.4% were drivers of other highway vehicles.
The highest incidence of involvement in alcohol-related serious injury crashes was found for automobile drivers (23.1%), compared to 21.4% for drivers of other highway vehicles; 18.7% for truck/van drivers; 16.8% for tractor-trailer drivers; and 16.0% for motorcyclists. Among off-road vehicle drivers, 11.8% were involved in alcohol-related crashes.
4.3.4 Type of collision. Of all the drivers involved in alcohol-related serious injury crashes, 68.4% of them were in single-vehicle crashes. The highest incidence of involvement in alcohol-related serious injury crashes was also found among drivers in single-vehicle crashes – 37.0% of these drivers, compared to only 10.0% for drivers involved in multiple-vehicle crashes.

50
4.4 Drug use among fatally injured drivers
This section presents information on the presence of drugs, exclusively among drivers fatally injured in British Columbia during 2010. At the time this report was being prepared, 2011and 2012 coroner data from British Columbia were not available. For this reason, 2010 data will be reported in this section. Table 4-4 shows the prevalence of drug use among fatally injured drivers of highway vehicles as well as the number of drivers who tested positive for various categories of drugs.
As can be seen, British Columbia had a high testing rate in 2010, with 80.4% of fatally injured drivers being tested for drug use.
Among fatally injured tested drivers, 80 out of 209 (38.3%) were positive for drugs. The most common category of drugs found within drivers testing positive for drug use was cannabis (52.1%). Other categories of drugs found in fatally injured drivers testing positive for drugs were CNS depressants (43.7%), CNS stimulants (28.2%), narcotic analgesics (14.1%), and dissociative anesthetics (2.8%).
% of % of all drivers inNumber total alcohol-related crashes
Age<16 10 0 0.0 0.016-19 115 27 23.5 6.220-25 271 84 31.0 19.426-35 380 89 23.4 20.536-45 360 77 21.4 17.746-55 423 93 22.0 21.4>55 560 47 8.4 10.8unknown 54 17 31.5 3.9
GenderMale 1523 323 21.2 74.4Female 605 95 15.7 21.9unknown 45 16 35.6 3.7
Vehicle TypeAuto 952 220 23.1 50.7Truck/Van 733 137 18.7 31.6Motorcycle 225 36 16.0 8.3Tractor Trailer 95 16 16.8 3.7Other Hwy. Vehicle 28 6 21.4 1.4Off-Road 127 15 11.8 3.5Unknown 13 4 30.8 0.9
Collision TypeSingle-Vehicle 803 297 37.0 68.4Multiple-Vehicle 1370 137 10.0 31.6
TOTAL 2173 434 20.0 100.0
Table 4-3Drivers in Alcohol-Related Serious Injury Crashes:
British Columbia, 2012Category of Drivers Number of
Drivers
Alcohol-Related
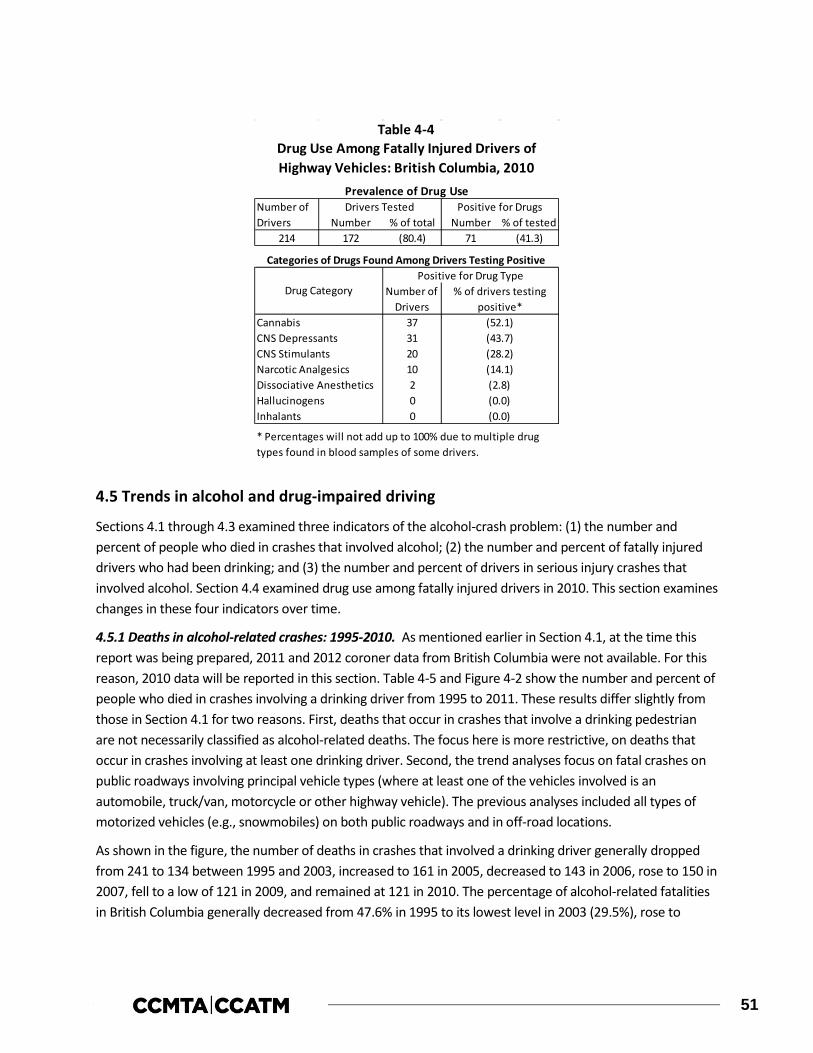
51
4.5 Trends in alcohol and drug-impaired driving
Sections 4.1 through 4.3 examined three indicators of the alcohol-crash problem: (1) the number and percent of people who died in crashes that involved alcohol; (2) the number and percent of fatally injured drivers who had been drinking; and (3) the number and percent of drivers in serious injury crashes that involved alcohol. Section 4.4 examined drug use among fatally injured drivers in 2010. This section examines changes in these four indicators over time.
4.5.1 Deaths in alcohol-related crashes: 1995-2010. As mentioned earlier in Section 4.1, at the time this report was being prepared, 2011 and 2012 coroner data from British Columbia were not available. For this reason, 2010 data will be reported in this section. Table 4-5 and Figure 4-2 show the number and percent of people who died in crashes involving a drinking driver from 1995 to 2011. These results differ slightly from those in Section 4.1 for two reasons. First, deaths that occur in crashes that involve a drinking pedestrian are not necessarily classified as alcohol-related deaths. The focus here is more restrictive, on deaths that occur in crashes involving at least one drinking driver. Second, the trend analyses focus on fatal crashes on public roadways involving principal vehicle types (where at least one of the vehicles involved is an automobile, truck/van, motorcycle or other highway vehicle). The previous analyses included all types of motorized vehicles (e.g., snowmobiles) on both public roadways and in off-road locations.
As shown in the figure, the number of deaths in crashes that involved a drinking driver generally dropped from 241 to 134 between 1995 and 2003, increased to 161 in 2005, decreased to 143 in 2006, rose to 150 in 2007, fell to a low of 121 in 2009, and remained at 121 in 2010. The percentage of alcohol-related fatalities in British Columbia generally decreased from 47.6% in 1995 to its lowest level in 2003 (29.5%), rose to
Number % of total Number % of tested214 172 (80.4) 71 (41.3)
37312010200
* Percentages will not add up to 100% due to multiple drug types found in blood samples of some drivers.
Positive for Drug TypeNumber of
Drivers
(28.2)
Dissociative AnestheticsHallucinogensInhalants
(2.8)(0.0)(0.0)
Narcotic Analgesics (14.1)
Drug Use Among Fatally Injured Drivers of Highway Vehicles: British Columbia, 2010
Table 4-4
CNS Stimulants
Drivers TestedNumber of Drivers
Positive for DrugsPrevalence of Drug Use
Cannabis (52.1)CNS Depressants (43.7)
Categories of Drugs Found Among Drivers Testing Positive
Drug Category % of drivers testing positive*
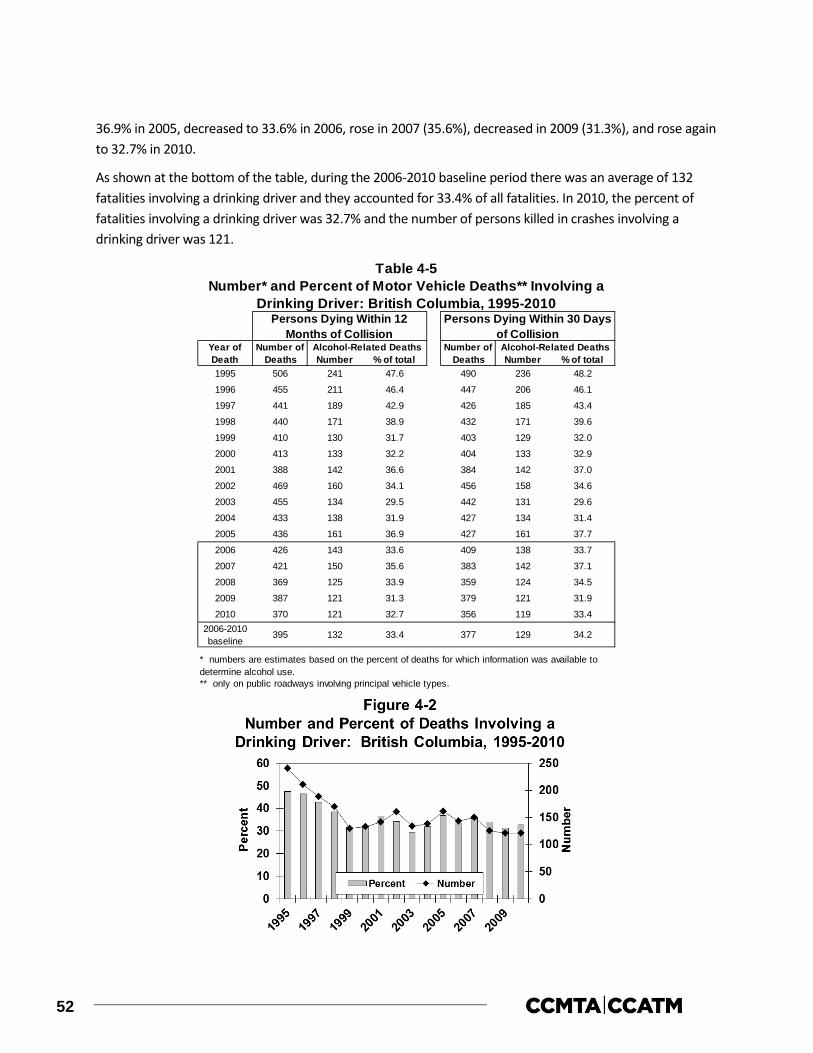
52
36.9% in 2005, decreased to 33.6% in 2006, rose in 2007 (35.6%), decreased in 2009 (31.3%), and rose again to 32.7% in 2010.
As shown at the bottom of the table, during the 2006-2010 baseline period there was an average of 132 fatalities involving a drinking driver and they accounted for 33.4% of all fatalities. In 2010, the percent of fatalities involving a drinking driver was 32.7% and the number of persons killed in crashes involving a drinking driver was 121.
Number % of total Number % of total1995 506 241 47.6 490 236 48.2
1996 455 211 46.4 447 206 46.1
1997 441 189 42.9 426 185 43.4
1998 440 171 38.9 432 171 39.6
1999 410 130 31.7 403 129 32.0
2000 413 133 32.2 404 133 32.9
2001 388 142 36.6 384 142 37.0
2002 469 160 34.1 456 158 34.6
2003 455 134 29.5 442 131 29.6
2004 433 138 31.9 427 134 31.4
2005 436 161 36.9 427 161 37.7
2006 426 143 33.6 409 138 33.7
2007 421 150 35.6 383 142 37.1
2008 369 125 33.9 359 124 34.5
2009 387 121 31.3 379 121 31.9
2010 370 121 32.7 356 119 33.42006-2010baseline
** only on public roadways involving principal vehicle types.
* numbers are estimates based on the percent of deaths for which information was available to determine alcohol use.
Number of Deaths
Alcohol-Related Deaths
Persons Dying Within 30 Days of Collision
Table 4-5Number* and Percent of Motor Vehicle Deaths** Involving a
Drinking Driver: British Columbia, 1995-2010
Alcohol-Related Deaths
Persons Dying Within 12 Months of Collision
Year of Death
Number of Deaths
395 132 33.4 377 129 34.2

53
4.5.2 Alcohol use among fatally injured drivers: As mentioned earlier in Section 4.2, at the time this report was being prepared, 2011and 2012 coroner data from British Columbia were not available. For this reason, 1987-2010 data will be reported in this section in Table 4-6. Trends are illustrated in Figure 4-3 which shows changes in the percent of fatally injured drivers who: (1) showed no evidence of alcohol (represented by the white area); (2) had BACs below the legal limit (shown by the light grey area); and (3) had BACs over the legal limit (the dark grey area). The data reported here are restricted to drivers who died in less than six hours after the crash (see Section 2.2.2).
As can be seen, the percent of fatally injured drivers with BACs over the legal limit generally increased from 1989 (36.1%) to 1993 (50.4%), dropped to a low of 29.2% in 2004, rose to 36.6% in 2005, decreased in 2006 (32.6%), rose in 2007 (38.8%), and decreased in 2010 (28.9%). The percent of fatally injured drivers with zero BACs decreased from 1989 (55.0%) to its lowest point in 1992 (44.8%), generally increased until 2004 (62.2%), declined in 2005 (57.7%), increased in 2006 (60.0%), declined in 2007 (52.7%), and peaked in 2009 (65.1%), and decreased slightly in 2010 (64.8%). The percent of fatally injured drivers with BACs between 1 and 80 mg% was at its highest level in 1987 (10.2%), dropped to its lowest mark in 1991 (4.0%), remained stable from 1992 to 2005 (5.6%), rose in 2007 (8.5%), decreased in 2009 (4.2%), and rose again in 2010 (6.3%).
During the 2006-2010 baseline period, the percentage of fatally injured drivers was 59.7% for drivers with zero BACs, 6.5% for drivers with BACs from 1-80 mg%, and 33.9% for drivers with BACs over 80 mg%.
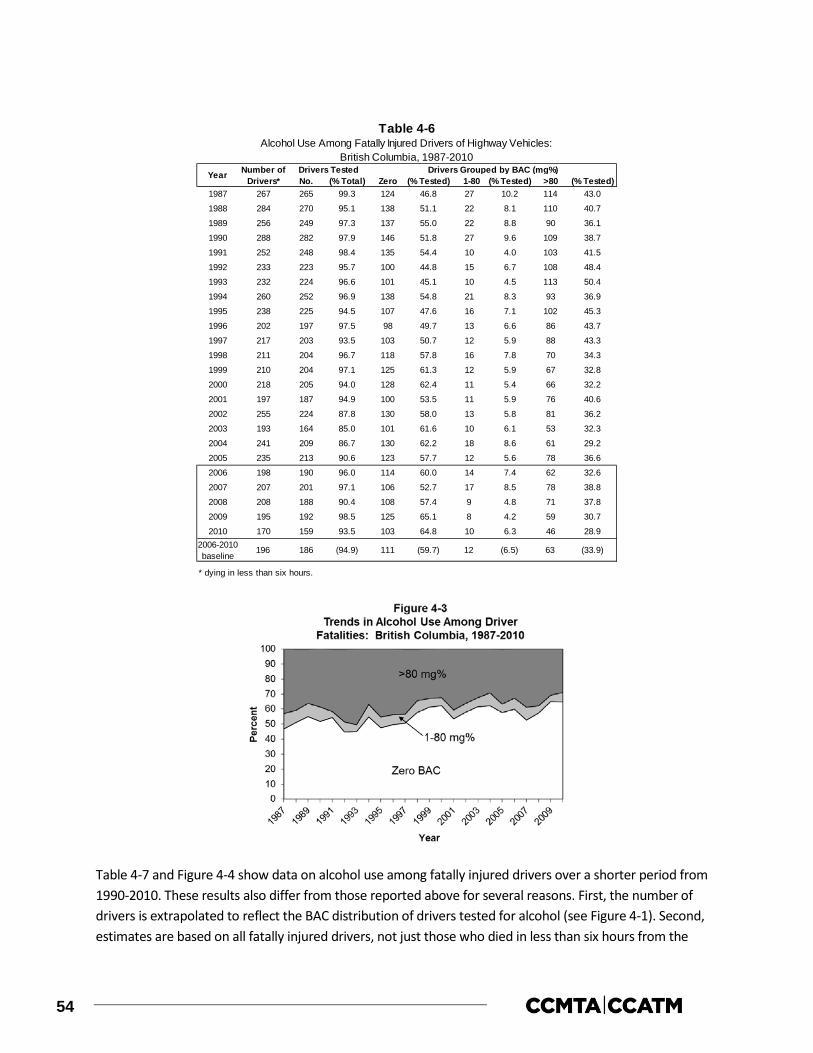
54
Table 4-7 and Figure 4-4 show data on alcohol use among fatally injured drivers over a shorter period from 1990-2010. These results also differ from those reported above for several reasons. First, the number of drivers is extrapolated to reflect the BAC distribution of drivers tested for alcohol (see Figure 4-1). Second, estimates are based on all fatally injured drivers, not just those who died in less than six hours from the
No. (% Total) Zero (% Tested) 1-80 (% Tested) >80 (% Tested)1987 267 265 99.3 124 46.8 27 10.2 114 43.0
1988 284 270 95.1 138 51.1 22 8.1 110 40.7
1989 256 249 97.3 137 55.0 22 8.8 90 36.1
1990 288 282 97.9 146 51.8 27 9.6 109 38.7
1991 252 248 98.4 135 54.4 10 4.0 103 41.5
1992 233 223 95.7 100 44.8 15 6.7 108 48.4
1993 232 224 96.6 101 45.1 10 4.5 113 50.4
1994 260 252 96.9 138 54.8 21 8.3 93 36.9
1995 238 225 94.5 107 47.6 16 7.1 102 45.3
1996 202 197 97.5 98 49.7 13 6.6 86 43.7
1997 217 203 93.5 103 50.7 12 5.9 88 43.3
1998 211 204 96.7 118 57.8 16 7.8 70 34.3
1999 210 204 97.1 125 61.3 12 5.9 67 32.8
2000 218 205 94.0 128 62.4 11 5.4 66 32.2
2001 197 187 94.9 100 53.5 11 5.9 76 40.6
2002 255 224 87.8 130 58.0 13 5.8 81 36.2
2003 193 164 85.0 101 61.6 10 6.1 53 32.3
2004 241 209 86.7 130 62.2 18 8.6 61 29.2
2005 235 213 90.6 123 57.7 12 5.6 78 36.6
2006 198 190 96.0 114 60.0 14 7.4 62 32.6
2007 207 201 97.1 106 52.7 17 8.5 78 38.8
2008 208 188 90.4 108 57.4 9 4.8 71 37.8
2009 195 192 98.5 125 65.1 8 4.2 59 30.7
2010 170 159 93.5 103 64.8 10 6.3 46 28.92006-2010baseline
* dying in less than six hours.
Table 4-6
Drivers Grouped by BAC (mg%)
Alcohol Use Among Fatally Injured Drivers of Highway Vehicles:British Columbia, 1987-2010
111 (59.7) 12 (6.5) 63 (33.9)
Year Number of Drivers*
Drivers Tested
196 186 (94.9)
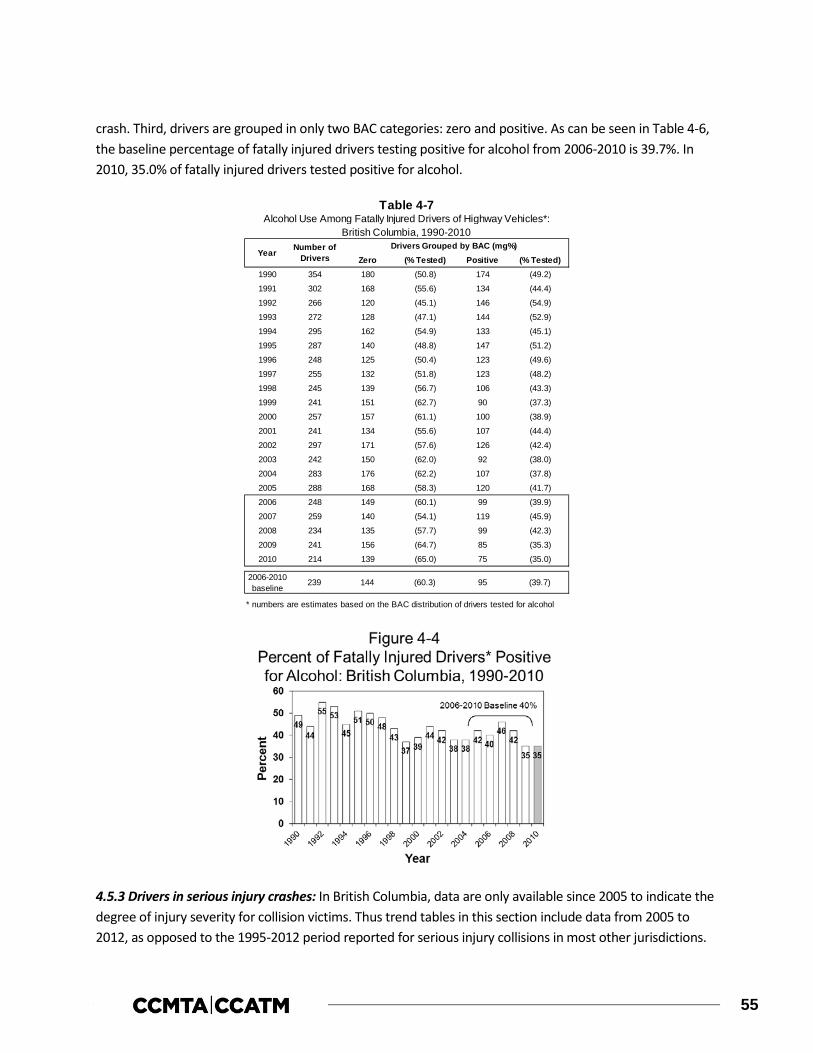
55
crash. Third, drivers are grouped in only two BAC categories: zero and positive. As can be seen in Table 4-6, the baseline percentage of fatally injured drivers testing positive for alcohol from 2006-2010 is 39.7%. In 2010, 35.0% of fatally injured drivers tested positive for alcohol.
4.5.3 Drivers in serious injury crashes: In British Columbia, data are only available since 2005 to indicate the degree of injury severity for collision victims. Thus trend tables in this section include data from 2005 to 2012, as opposed to the 1995-2012 period reported for serious injury collisions in most other jurisdictions.
Zero (% Tested) Positive (% Tested)1990 354 180 (50.8) 174 (49.2)
1991 302 168 (55.6) 134 (44.4)
1992 266 120 (45.1) 146 (54.9)
1993 272 128 (47.1) 144 (52.9)
1994 295 162 (54.9) 133 (45.1)
1995 287 140 (48.8) 147 (51.2)
1996 248 125 (50.4) 123 (49.6)
1997 255 132 (51.8) 123 (48.2)
1998 245 139 (56.7) 106 (43.3)
1999 241 151 (62.7) 90 (37.3)
2000 257 157 (61.1) 100 (38.9)
2001 241 134 (55.6) 107 (44.4)
2002 297 171 (57.6) 126 (42.4)
2003 242 150 (62.0) 92 (38.0)
2004 283 176 (62.2) 107 (37.8)
2005 288 168 (58.3) 120 (41.7)
2006 248 149 (60.1) 99 (39.9)
2007 259 140 (54.1) 119 (45.9)
2008 234 135 (57.7) 99 (42.3)
2009 241 156 (64.7) 85 (35.3)
2010 214 139 (65.0) 75 (35.0)
2006-2010baseline
* numbers are estimates based on the BAC distribution of drivers tested for alcohol
239 144 (60.3) 95 (39.7)
Table 4-7Alcohol Use Among Fatally Injured Drivers of Highway Vehicles*:
British Columbia, 1990-2010
Year Number of Drivers
Drivers Grouped by BAC (mg%)
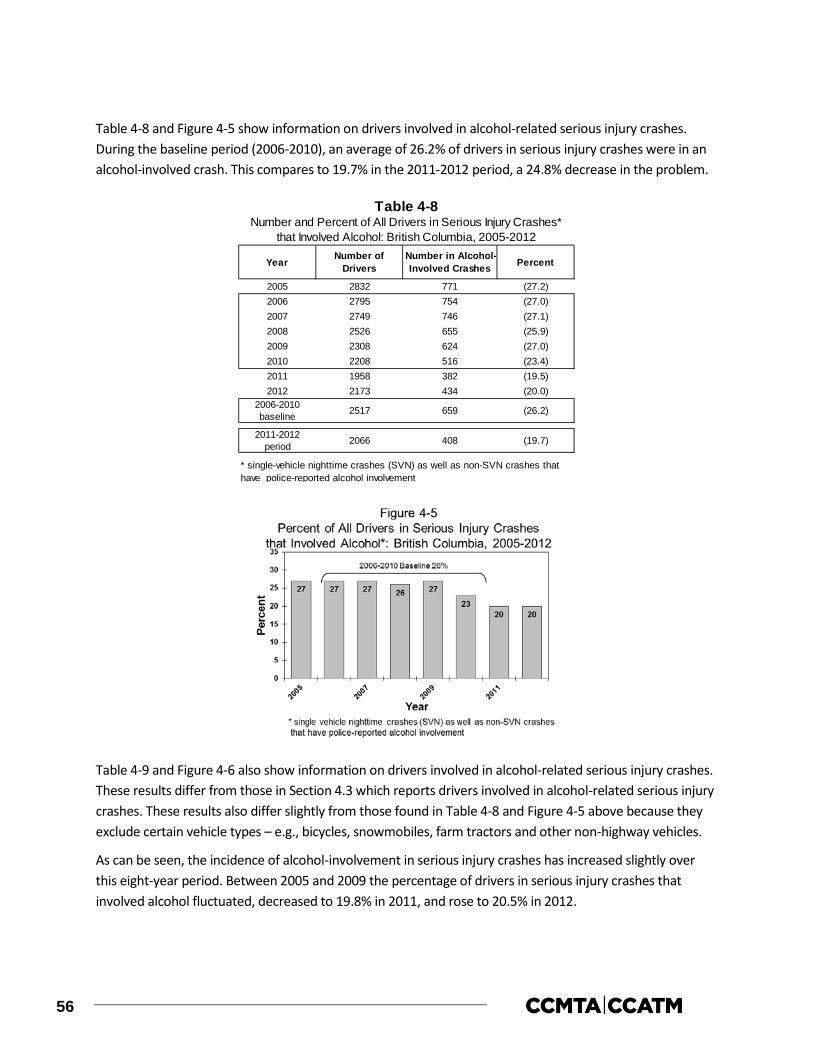
56
Table 4-8 and Figure 4-5 show information on drivers involved in alcohol-related serious injury crashes. During the baseline period (2006-2010), an average of 26.2% of drivers in serious injury crashes were in an alcohol-involved crash. This compares to 19.7% in the 2011-2012 period, a 24.8% decrease in the problem.
Table 4-9 and Figure 4-6 also show information on drivers involved in alcohol-related serious injury crashes. These results differ from those in Section 4.3 which reports drivers involved in alcohol-related serious injury crashes. These results also differ slightly from those found in Table 4-8 and Figure 4-5 above because they exclude certain vehicle types – e.g., bicycles, snowmobiles, farm tractors and other non-highway vehicles.
As can be seen, the incidence of alcohol-involvement in serious injury crashes has increased slightly over this eight-year period. Between 2005 and 2009 the percentage of drivers in serious injury crashes that involved alcohol fluctuated, decreased to 19.8% in 2011, and rose to 20.5% in 2012.
Year Number of Drivers
Number in Alcohol-Involved Crashes Percent
2005 2832 771 (27.2)2006 2795 754 (27.0)2007 2749 746 (27.1)2008 2526 655 (25.9)2009 2308 624 (27.0)2010 2208 516 (23.4)2011 1958 382 (19.5)2012 2173 434 (20.0)
2006-2010baseline
2011-2012period
* single-vehicle nighttime crashes (SVN) as well as non-SVN crashes that have police-reported alcohol involvement
Table 4-8Number and Percent of All Drivers in Serious Injury Crashes*
that Involved Alcohol: British Columbia, 2005-2012
2517 659 (26.2)
2066 408 (19.7)

57
As shown in Table 4-9, in the baseline period (2006-2010), an average of 26.5% of drivers in serious injury crashes were in an alcohol-involved crash. In the 2011-2012 period, the incidence of drivers in alcohol-involved serious injury crashes declined to 20.1%, an 24.2% decrease.
4.5.4 Drug use among fatally injured drivers: Table 4-10 and Figure 4-7 show data on drug use among fatally injured drivers over an 11-year period (2000-2010). At the time of publication, drug use data among fatally injured drivers in British Columbia for 2011 and 2012 was not yet available. Similar to Table 4-6, these results are based on fatally injured drivers of highway vehicles who died less than six hours after the crash (see Section 2.2.5).
As can be seen at the bottom of Table 4-10, the percentage of fatally injured drivers testing positive for drugs from 2006-2010, the baseline period, is 46.4%. In 2010, 42.0% of fatally injured drivers tested positive for drugs.
Number ofDrivers
2005 2655 730 (27.5)
2006 2653 716 (27.0)
2007 2630 723 (27.5)
2008 2397 633 (26.4)
2009 2195 597 (27.2)
2010 2072 494 (23.8)
2011 1837 363 (19.8)
2012 2046 419 (20.5)2006-2010baseline
2011-2012period
Table 4-9Number and Percent of Drivers* of Highway Vehicles in Serious
Injury Crashes** that Involved Alcohol: British Columbia, 2005-2012
Year PercentNumber in Alcohol-Involved Crashes
** single-vehicle nighttime crashes (SVN) as well as non-SVN crashes that have police-reported alcohol involvement
* excludes operators of bicycles, snowmobiles, farm tractors, and other non-highway vehicles.
2389 633 (26.5)
1942 391 (20.1)

58
Negative (% Tested) Positive (% Tested)2000 218 134 61.5 102 76.1 32 23.9
2001 197 125 63.5 82 65.6 43 34.4
2002 255 128 50.2 91 71.1 37 28.9
2003 193 111 57.5 77 69.4 34 30.6
2004 241 198 82.2 116 58.6 82 41.4
2005 235 200 85.1 121 60.5 79 39.5
2006 199 183 92.0 109 59.6 74 40.4
2007 207 182 87.9 88 48.4 94 51.6
2008 208 186 89.4 95 51.1 91 48.9
2009 195 187 95.9 99 52.9 88 47.1
2010 170 157 92.4 91 58.0 66 42.0
2006-2010baseline
* dying in less than six hours.
83 46.4
Drug Use Among Fatally Injured Drivers* of Highway Vehicles: British Columbia, 2000-2010
196 179 91.3 96 53.6
Table 4-10
YEAR Number of Drivers*
Drivers Tested (% Total) Drivers Tested for Drugs

59
5.0 ALBERTA
This section of the report reviews the major findings on alcohol involvement in fatal and serious injury motor vehicle collisions as well as drug involvement in fatal motor vehicle collisions in Alberta. It describes data on:
> people who were killed in alcohol-related crashes (Section 5.1);
> alcohol use among fatally injured drivers (Section 5.2);
> drivers involved in alcohol-related serious injury crashes (Section 5.3);
> drug use among fatally injured drivers (Section 5.4); and,
> trends in the alcohol-crash and drug-crash problems (Section 5.5).
5.1 Deaths in alcohol-related crashes
Table 5-1 presents information on people who died in alcohol-related crashes in Alberta during 2012 for persons dying within 12 months of the collision (one calendar year) and for persons dying within 30 days of the collision. Motor vehicle deaths are categorized in terms of the victim’s age, gender, type (i.e., driver, passenger, pedestrian) and the type of vehicle they occupied. In each section, the first column in the table presents the number of deaths. The next two columns show the number and percent of these fatalities in which sufficient information was available to determine if alcohol was involved. A motor vehicle fatality was considered to be alcohol involved if there was at least one drinking driver or drinking pedestrian in the fatal crash.
For example, within the first section, 36 people age 16-19 were killed in motor vehicle crashes in Alberta during 2012. And, in 32 cases (88.9%) it was possible to determine if alcohol was a factor in the crash.
The next column shows the number of people killed in crashes that were known to be alcohol-involved. For example, 19 people aged 16-19 died in alcohol-related crashes in Alberta during 2012. The next column expresses this as a percentage – i.e., 59.4% of the 16-19 year olds who were killed died in an alcohol-related crash.
The final column (percent of all alcohol-related deaths) expresses the number of deaths in alcohol-related crashes as a percent of all the deaths in such crashes. For example, the alcohol-related deaths among 16-19 year olds represent 13.0% of all the people killed in alcohol-related crashes in Alberta during 2012.
The totals at the bottom of the table provide a summary. As can be seen, 366 persons died within 12 months of a motor vehicle crash in Alberta during 2012. In 337 (92.1%) of these cases, it was possible to determine if alcohol was a factor. Of these known cases, 146 (43.3%) involved alcohol. Extrapolating this figure to the total number of motor vehicle fatalities (366 x .433) it can be estimated that in Alberta during 2012, 159 persons died in alcohol-related crashes within 12 months of the collision.

60
Among the 365 persons dying within 30 days of the collision, it was possible to determine if alcohol was a factor in 92.3% of the cases. Of these known cases, 146 (43.3%) involved alcohol. Extrapolating this figure to the total number of motor vehicle fatalities (365 x .433) it can be estimated that in Alberta during 2012, 158 persons died in alcohol-related crashes within 30 days of the collision.
5.1.1 Victim age. Of all the people who died in alcohol-related crashes within 12 months of the collision, 23.3% (see last column in the first section) were aged 20-25 and 26-35; 15.8% were aged 36-45; 14.4% were aged 46-55; 13.0% were aged 16-19; 9.6% were over age 55; and 0.7% were under 16.
The highest incidence of alcohol involvement occurred in the crashes in which a person aged 16-19 and 46-55 died (59.4% and 53.8%, respectively). The lowest incidence of alcohol involvement was found among the youngest and oldest fatalities – 19.2% of persons over 55 and 10.0% of the fatalities under age 16 died in crashes involving alcohol.
5.1.2 Gender. Of all the people who died in alcohol-related crashes within 12 months of the collision, 79.5% were males. The incidence of alcohol in crashes in which a male died (47.0%) was greater than the incidence of alcohol in crashes in which a female died (33.3%).
Age Group<16 16 10 62.5 1 10.0 0.7 16 10 62.5 1 10.0 0.716-19 36 32 88.9 19 59.4 13.0 36 32 88.9 19 59.4 13.020-25 71 70 98.6 34 48.6 23.3 71 70 98.6 34 48.6 23.326-35 68 64 94.1 34 53.1 23.3 68 64 94.1 34 53.1 23.336-45 51 49 96.1 23 46.9 15.8 51 49 96.1 23 46.9 15.846-55 42 39 92.9 21 53.8 14.4 42 39 92.9 21 53.8 14.4>55 82 73 89.0 14 19.2 9.6 81 73 90.1 14 19.2 9.6
GenderMale 265 247 93.2 116 47.0 79.5 265 247 93.2 116 47.0 79.5Female 101 90 89.1 30 33.3 20.5 100 90 90.0 30 33.3 20.5
Victim TypeDriver/ Operator 236 226 95.8 85 37.6 58.2 235 226 96.2 85 37.6 58.2Passenger 67 60 89.6 29 48.3 19.9 67 60 89.6 29 48.3 19.9Pedestrian 63 51 81.0 32 62.7 21.9 63 51 81.0 32 62.7 21.9
Vehicle OccupiedAutomobiles 118 113 95.8 38 33.6 26.0 118 113 95.8 38 33.6 26.0Trucks/Vans 133 125 94.0 59 47.2 40.4 132 125 94.7 59 47.2 40.4Motorcycles 21 19 90.5 7 36.8 4.8 21 19 90.5 7 36.8 4.8Other Hwy Vehicles 12 12 100.0 2 16.7 1.4 12 12 100.0 2 16.7 1.4Off-road Vehicles 19 17 89.5 8 47.1 5.5 19 17 89.5 8 47.1 5.5(Pedestrians) 63 51 81.0 32 62.7 21.9 63 51 81.0 32 62.7 21.9
Collision LocationPublic Road 341 318 93.3 136 42.8 93.2 340 318 87.1 136 42.8 93.2Off-road 25 19 76.0 10 52.6 6.8 25 19 76.0 10 52.6 6.8
TOTAL 366 337 92.1 146 43.3 100.0 365 337 92.3 146 43.3 100.0
Persons Dying Within 30 Days of Collision
% of known
Table 5-1Deaths in Alcohol-Related Crashes: Alberta, 2012
Alcohol-Related Deaths (ARDs)
Alcohol-Related Deaths (ARDs)
% of all ARDs
% of all ARDs
Persons Dying Within 12 Months of Collision
% of known
No. of Deaths
Alcohol Use Known
No. % of total
No.Category of Victim No. of
Deaths No.
Alcohol Use Known
% of total
No.

61
5.1.3 Victim type. Of all the people who died in alcohol-related crashes within 12 months of the collision, 58.2% were drivers/operators of a vehicle; 21.9% were pedestrians; and 19.9% were passengers.
Within each of the principal victim types, the highest incidence of alcohol involvement (62.7%) occurred in the crashes in which a pedestrian died. Alcohol was involved in 48.3% of the crashes in which a passenger died and 37.6% of those in which a driver/operator died.
5.1.4 Type of vehicle occupied. Of all the people who died in alcohol-related crashes within 12 months of the collision, 40.4% were in a truck/van; 26.0% were in an automobile; 5.5% were off-road vehicle occupants; 4.8% were motorcyclists; and 1.4% were occupants of other highway vehicles.
Within each of these vehicle types, the incidence of alcohol involvement in which a truck/van occupant died was greater than the incidence of alcohol in crashes in which a motorcyclist or automobile occupant died (47.2% versus 36.8% and 33.6%). Among fatally injured off-road vehicle occupants, 47.1% were involved in an alcohol-related crash.
5.1.5 Collision location. Of all the people who died in alcohol-related crashes within 12 months of the collision, 93.2% died in a collision which occurred on a public road and 6.8% died in an off-road collision. However, the incidence of alcohol involvement in which a victim died in an alcohol-related crash was greater for those dying in off-road collisions (52.6%) than it was for persons dying in a collision which occurred on a public road (42.8%).
5.2 Alcohol in fatally injured drivers
This section presents information on the presence of alcohol, exclusively among drivers fatally injured in Alberta during 2012. Table 5-2 shows the information by age group, gender, vehicle type, collision type (single vs. multiple), and duration between crash time and death time (within 12 months vs. within 30 days of the collision).
The first column in the table shows the number of drivers killed. The next columns show the number and percent of these victims who were tested for alcohol. The remaining columns provide information on the results of the alcohol tests – the first three of these present results for drivers who showed any evidence of alcohol; the last three columns present information on drivers who had BACs over the statutory limit of 80 mg%.
To illustrate, among 16-19 year olds there were 17 drivers killed during 2012; 16 of these fatally injured drivers (94.1%) were tested for alcohol. Of those who were tested, seven (43.8%) were positive for alcohol. This means that 16-19 year old fatally injured drinking drivers accounted for 9.9% of all drinking drivers who were killed.

62
Then, in the final three columns, it can be seen that four of the 16 (25.0%) fatally injured 16-19 year olds who were tested for alcohol had BACs in excess of 80 mg%. This means that four of the seven drivers who were positive for alcohol had BACs in excess of the legal limit. The final column expresses the number of drivers with illegal BACs as a percent of all drivers with BACs over the limit. As can be seen, 16-19 year old drivers accounted for 6.2% of all the drivers with BACs over the legal limit.
The main findings are shown by the totals at the bottom of the table. Alberta had a very high testing rate in 2012, with 96.4% of fatally injured drivers being tested for alcohol use.
In Alberta, 33.5% had been drinking and 65 of 71 (91.5%) fatally injured drinking drivers had BACs over 80 mg%. Although not shown in the table, more refined analyses by different BAC categories show that among tested drivers:
> 66.5% had BACs of zero mg%;
> 0.9% had BACs from 1-49 mg%;
> 1.9% had BACs from 50-80 mg%
> 8.0% had BACs from 81 to 160 mg%; and,
> 22.6% had BACs over 160 mg%.
Age Group16-19 17 16 94.1 7 43.8 9.9 4 25.0 6.220-25 40 38 95.0 15 39.5 21.1 13 34.2 20.026-35 45 44 97.8 23 52.3 32.4 23 52.3 35.436-45 38 37 97.4 10 27.0 14.1 10 27.0 15.446-55 30 30 100.0 10 33.3 14.1 9 30.0 13.8>55 50 47 94.0 6 12.8 8.5 6 12.8 9.2Gender
Male 174 169 97.1 63 37.3 88.7 58 34.3 89.2Female 46 43 93.5 8 18.6 11.3 7 16.3 10.8
Vehicle TypeAutomobiles 88 85 96.6 25 29.4 35.2 24 28.2 36.9Truck/Van 100 95 95.0 39 41.1 54.9 35 36.8 53.8Motorcycles 21 21 100.0 6 28.6 8.5 5 23.8 7.7Tractor Trailer 11 11 100.0 1 9.1 1.4 1 9.1 1.5
Collision TypeSingle vehicle 96 92 95.8 59 64.1 83.1 54 58.7 83.1Multiple vehicle 124 120 96.8 12 10.0 16.9 11 9.2 16.9Duration Between Crash and Death TimeWithin 30 Days 219 212 96.8 71 33.5 100.0 65 30.7 100.0> 30 Days 1 0 0.0 0 0.0 0.0 0 0.0 0.0
TOTAL 220 212 96.4 71 33.5 100.0 65 30.7 100.0
% of tested
Table 5-2Alcohol Use Among Fatally Injured Drivers of Highway Vehicles:
Alberta, 2012Positive BAC BAC >80 mg%
% of all drivers with
+BAC
% of all drivers with BAC >80
mg%
% of tested No.
Category of Driver
No. of Drivers No.
Drivers Tested
% of total No.

63
In Figure 5-1, the BAC distribution for tested fatally injured drivers is extrapolated to reflect the BAC distribution for all fatally injured drivers. In this figure, 74 of 220 (33.6%) fatally injured drivers have a positive BAC. And among fatally injured drinking drivers, 68 (91.9%) have BACs over 80 mg%.
5.2.1 Age differences. Of all the fatally injured drinking drivers (i.e., those with a positive BAC), 32.4% were aged 26-35; 21.1% were aged 20-25; 14.1% were aged 36-45 and 46-55; 9.9% were aged 16-19; and 8.5% were over age 55.
Of all the fatally injured legally impaired drivers (i.e., those with BACs over 80 mg%), 35.4% were aged 26-35; 20.0% were aged 20-25; 15.4% were aged 36-45; 13.8% were aged 46-55; and 9.2% were over 55. Of the fatally injured drivers who were over the legal limit, 6.2% were aged 16-19.
When comparing the incidence of drinking and driving among fatally injured drivers by age group, fatally injured drivers aged 26-35 were the most likely to have been drinking (52.3%). By contrast, only 12.8% of the tested drivers over age 55 had been drinking.
5.2.2 Gender differences. Males dominate the picture – they account for 88.7% of all the fatally injured drivers who had been drinking, and 89.2% of all of the fatally injured drivers who were legally impaired.
Males dominate the picture largely because they account for most of the drivers who are killed (174 of the 220 or 79.1% of the fatalities are males). Fatally injured male drivers were more likely to have been drinking than female drivers (37.3% and 18.6%, respectively). And, 92.1% of the male and 87.5% of the female drivers who were drinking had BACs over the legal limit.
5.2.3 Vehicle differences. Of all the fatally injured drinking drivers (i.e., those with a positive BAC), 54.9% were truck/van drivers; 35.2% were automobile drivers; 8.5% were motorcyclists and 1.4% were tractor-trailer drivers.
Of all the fatally injured legally impaired drivers (i.e., those with BACs over 80 mg%), 53.8% were truck/van drivers; 36.9% were automobile drivers; 7.7% were motorcyclists and 1.5% were tractor-trailer drivers.

64
Within each of the vehicle types, 41.1% of fatally injured truck/van drivers, 29.4% of automobile drivers, 28.6% of motorcyclists, and 9.1% of tractor-trailer drivers had been drinking.
5.2.4 Collision differences. Two-fifths of the drivers killed (96 of the 220) were involved in single-vehicle collisions but these crashes accounted for a majority of the drivers who had been drinking or were legally impaired (64.1% and 83.1%, respectively).
The reason for this apparent disparity is because alcohol is overrepresented in single-vehicle crashes. Almost two-thirds of the drivers involved in single-vehicle crashes (64.1%) were positive for alcohol, compared to only 10.0% of those involved in multiple-vehicle collisions.
5.2.5 Duration between crash and death time. Given that only one fatally injured driver died more than 30 days after the collision and was not tested for alcohol, a comparison of alcohol use among drivers based on differences in the duration between crash time and death time cannot be performed.
5.3 Drivers involved in alcohol-related serious injury crashes
This section presents information on drivers involved in alcohol-related crashes in which someone was seriously injured in 2012 in Alberta. A “surrogate” or “indirect” measure is used to estimate alcohol involvement because drivers in serious injury crashes are seldom tested for alcohol. A driver is identified as having been involved in an alcohol-related serious injury crash if the crash in which someone was seriously injured involved a single vehicle at night (SVN), or if, in the case of a non-SVN serious injury crash, the police reported alcohol involvement – i.e., at least one drinking driver in the crash (see Section 2.2.4).
The results are shown in Table 5-3 for drivers grouped in terms of age, gender, type of vehicle driven, and type of collision. The first column shows the number of drivers involved in serious injury crashes. The number and percent of drivers in such crashes that involved alcohol is shown in the next two columns. The final column expresses the number of drivers involved in alcohol-related serious injury crashes in any row as a percent of all drivers involved in alcohol-related serious injury crashes.
As shown, by the totals at the bottom of the table, 3,286 drivers were involved in crashes in which someone was seriously injured, and among these 15.5% were alcohol-related crashes.
5.3.1 Driver age. Of all the drivers involved in alcohol-related serious injury crashes, 26.8% were aged 26-35, 20.1% were aged 20-25; and 14.8% were aged 36-45. Drivers under 16 and over 55 accounted for only 0.0% and 9.4%, respectively, of those involved in alcohol-related serious injury crashes.
Almost one-quarter of the drivers aged 16-19 were involved in alcohol-related serious injury crashes (26.1%). The lowest incidence of involvement in alcohol-related crashes was found for those under 16 (0.0%).
5.3.2 Driver gender. Of all the drivers involved in alcohol-related serious injury crashes, 74.2% were males. The incidence of involvement in alcohol-related serious injury crashes was also greater for males than for females (17.0% and 12.0%, respectively).

65
5.3.3 Type of vehicle driven. Of all the drivers involved in alcohol-related serious injury crashes, 48.6% were truck/van drivers; 39.8% were automobile drivers; 5.7% were motorcyclists; 3.0% were off-road vehicle drivers; 2.4% were tractor-trailer drivers; and 0.4% were drivers of other highway vehicles.
The highest incidence of involvement in alcohol-related serious injury crashes was found for automobile drivers as 17.2% of these drivers were in crashes that involved alcohol, compared to 15.5% for truck/van drivers; 13.2% for motorcyclists; 10.7% for tractor-trailer drivers; and 10.1% for off-road vehicle drivers. Among drivers of other highway vehicles, 7.7% were involved in alcohol-related crashes.
5.3.4 Type of collision. Of all the drivers involved in alcohol-related serious injury crashes, 69.9% of them were in single-vehicle crashes. The highest incidence of involvement in alcohol-related serious injury crashes was also found among drivers in single-vehicle crashes – 35.8% of these drivers, compared to only 6.7% for drivers involved in multiple-vehicle crashes.
% of % of all drivers inNumber total alcohol-related crashes
Age<16 24 0 0.0 0.016-19 276 72 26.1 14.220-25 490 102 20.8 20.126-35 726 136 18.7 26.836-45 564 75 13.3 14.846-55 559 67 12.0 13.2>55 601 48 8.0 9.4unknown 46 8 17.4 1.6
GenderMale 2222 377 17.0 74.2Female 1024 123 12.0 24.2unknown 40 8 20.0 1.6
Vehicle TypeAuto 1177 202 17.2 39.8Truck/Van 1594 247 15.5 48.6Motorcycle 220 29 13.2 5.7Tractor Trailer 112 12 10.7 2.4Other Hwy. Vehicle 26 2 7.7 0.4Off-Road 148 15 10.1 3.0Unknown 9 1 11.1 0.2
Collision TypeSingle-Vehicle 992 355 35.8 69.9Multiple-Vehicle 2294 153 6.7 30.1
TOTAL 3286 508 15.5 100.0
Table 5-3Drivers in Alcohol-Related Serious Injury Crashes:
Alberta, 2012Category of Drivers Number of
Drivers
Alcohol-Related
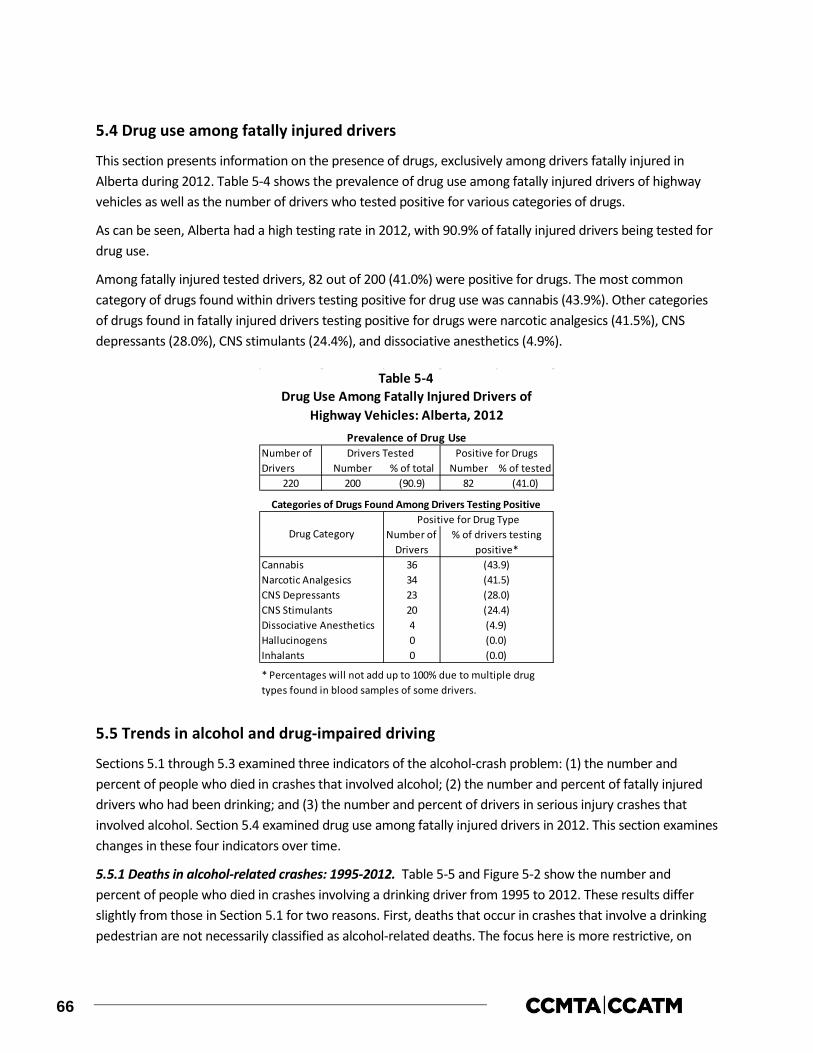
66
5.4 Drug use among fatally injured drivers
This section presents information on the presence of drugs, exclusively among drivers fatally injured in Alberta during 2012. Table 5-4 shows the prevalence of drug use among fatally injured drivers of highway vehicles as well as the number of drivers who tested positive for various categories of drugs.
As can be seen, Alberta had a high testing rate in 2012, with 90.9% of fatally injured drivers being tested for drug use.
Among fatally injured tested drivers, 82 out of 200 (41.0%) were positive for drugs. The most common category of drugs found within drivers testing positive for drug use was cannabis (43.9%). Other categories of drugs found in fatally injured drivers testing positive for drugs were narcotic analgesics (41.5%), CNS depressants (28.0%), CNS stimulants (24.4%), and dissociative anesthetics (4.9%).
5.5 Trends in alcohol and drug-impaired driving
Sections 5.1 through 5.3 examined three indicators of the alcohol-crash problem: (1) the number and percent of people who died in crashes that involved alcohol; (2) the number and percent of fatally injured drivers who had been drinking; and (3) the number and percent of drivers in serious injury crashes that involved alcohol. Section 5.4 examined drug use among fatally injured drivers in 2012. This section examines changes in these four indicators over time.
5.5.1 Deaths in alcohol-related crashes: 1995-2012. Table 5-5 and Figure 5-2 show the number and percent of people who died in crashes involving a drinking driver from 1995 to 2012. These results differ slightly from those in Section 5.1 for two reasons. First, deaths that occur in crashes that involve a drinking pedestrian are not necessarily classified as alcohol-related deaths. The focus here is more restrictive, on
Number % of total Number % of tested220 200 (90.9) 82 (41.0)
36342320400
* Percentages will not add up to 100% due to multiple drug types found in blood samples of some drivers.
Positive for Drug TypeNumber of
Drivers
(28.0)
Dissociative AnestheticsHallucinogensInhalants
(4.9)(0.0)(0.0)
CNS Stimulants (24.4)
Drug Use Among Fatally Injured Drivers of Highway Vehicles: Alberta, 2012
Table 5-4
CNS Depressants
Drivers TestedNumber of Drivers
Positive for DrugsPrevalence of Drug Use
Cannabis (43.9)Narcotic Analgesics (41.5)
Categories of Drugs Found Among Drivers Testing Positive
Drug Category % of drivers testing positive*
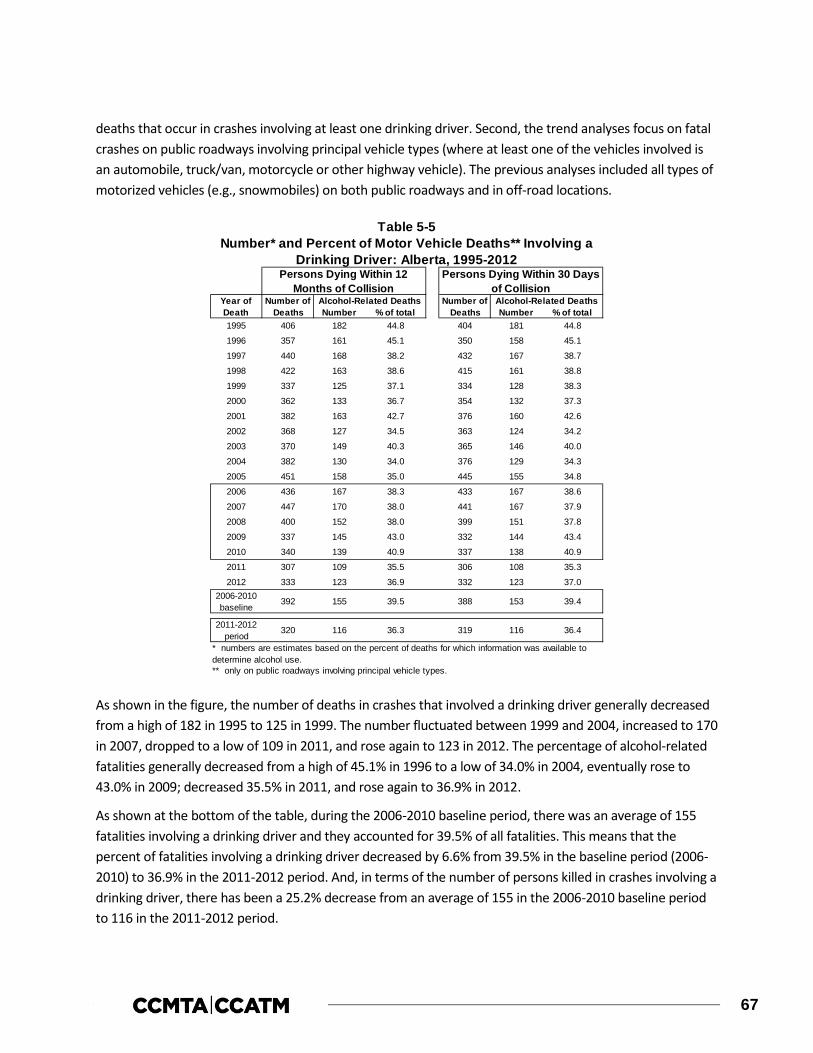
67
deaths that occur in crashes involving at least one drinking driver. Second, the trend analyses focus on fatal crashes on public roadways involving principal vehicle types (where at least one of the vehicles involved is an automobile, truck/van, motorcycle or other highway vehicle). The previous analyses included all types of motorized vehicles (e.g., snowmobiles) on both public roadways and in off-road locations.
As shown in the figure, the number of deaths in crashes that involved a drinking driver generally decreased from a high of 182 in 1995 to 125 in 1999. The number fluctuated between 1999 and 2004, increased to 170 in 2007, dropped to a low of 109 in 2011, and rose again to 123 in 2012. The percentage of alcohol-related fatalities generally decreased from a high of 45.1% in 1996 to a low of 34.0% in 2004, eventually rose to 43.0% in 2009; decreased 35.5% in 2011, and rose again to 36.9% in 2012.
As shown at the bottom of the table, during the 2006-2010 baseline period, there was an average of 155 fatalities involving a drinking driver and they accounted for 39.5% of all fatalities. This means that the percent of fatalities involving a drinking driver decreased by 6.6% from 39.5% in the baseline period (2006-2010) to 36.9% in the 2011-2012 period. And, in terms of the number of persons killed in crashes involving a drinking driver, there has been a 25.2% decrease from an average of 155 in the 2006-2010 baseline period to 116 in the 2011-2012 period.
Number % of total Number % of total1995 406 182 44.8 404 181 44.8
1996 357 161 45.1 350 158 45.1
1997 440 168 38.2 432 167 38.7
1998 422 163 38.6 415 161 38.8
1999 337 125 37.1 334 128 38.3
2000 362 133 36.7 354 132 37.3
2001 382 163 42.7 376 160 42.6
2002 368 127 34.5 363 124 34.2
2003 370 149 40.3 365 146 40.0
2004 382 130 34.0 376 129 34.3
2005 451 158 35.0 445 155 34.8
2006 436 167 38.3 433 167 38.6
2007 447 170 38.0 441 167 37.9
2008 400 152 38.0 399 151 37.8
2009 337 145 43.0 332 144 43.4
2010 340 139 40.9 337 138 40.9
2011 307 109 35.5 306 108 35.3
2012 333 123 36.9 332 123 37.02006-2010baseline
2011-2012period
** only on public roadways involving principal vehicle types.
* numbers are estimates based on the percent of deaths for which information was available to determine alcohol use.
Number of Deaths
Alcohol-Related Deaths
Persons Dying Within 30 Days of Collision
Table 5-5Number* and Percent of Motor Vehicle Deaths** Involving a
Drinking Driver: Alberta, 1995-2012
Alcohol-Related Deaths
Persons Dying Within 12 Months of Collision
Year of Death
Number of Deaths
392 155 39.5 388 153 39.4
36.4320 116 36.3 319 116

68
5.5.2 Alcohol use among fatally injured drivers: Data on alcohol use among fatally injured drivers over the 26-year period from 1987-2012 are shown in Table 5-6. Trends are illustrated in Figure 5-3 which shows changes in the percent of fatally injured drivers who: (1) showed no evidence of alcohol (represented by the white area); (2) had BACs below the legal limit (shown by the light grey area); and (3) had BACs over the legal limit (the dark grey area). The data reported here are restricted to drivers who died in less than six hours after the crash (see Section 2.2.2).
As can be seen, the percent of fatally injured drivers with BACs over the legal limit generally declined from 1987 (41.1%) to 2004 (28.5%), rose to 36.4% in 2007, dropped to 35.3% in 2008, rose slightly to 35.6% in 2009, decreased to 26.6% in 2011, and rose again in 2012 (31.8%). The percent of fatally injured drivers with zero BACs generally increased from 1987 (51.0%) to a peak of 67.9% in 1997, stabilized between 1999 and 2002, rose in 2004 (66.8%), decreased in 2007 (58.9%), rose in 2008 (60.1%) decreased in 2010 (58.3%), and rose again in 2012 (66.2%). The percent of fatally injured drivers with BACs between 1 and 80 mg% peaked in 1988 (9.3%), fell to 3.1% in 2001, rose in 2003 (7.0%), remained stable until 2008 (4.8%), rose until 2010 (7.8%), and decreased to its lowest level in 2012 (2.1%).
When compared to the 2006-2010 baseline period shown at the bottom of Table 5-6, the percentage of fatally injured drivers with zero BACs in the 2011-2012 period increased by 10.8% (from 59.3% to 65.7%). Among drivers with BACs from 1-80 mg%, there was a 21.4% decrease (from 5.6% to 4.4%). And among those with BACs over 80 mg%, there was a 15.3% decrease (from 35.2% to 29.8%).

69
Table 5-7 and Figure 5-4 show data on alcohol use among fatally injured drivers over a shorter period from 1990-2012. These results also differ from those reported above for several reasons. First, the number of drivers is extrapolated to reflect the BAC distribution of drivers tested for alcohol (see Figure 5-1). Second,
Table 5-6
No. (% Total) Zero (% Tested) 1-80 (% Tested) >80 (% Tested)1987 265 253 95.5 129 51.0 20 7.9 104 41.11988 236 215 91.1 111 51.6 20 9.3 84 39.11989 235 229 97.4 130 56.8 10 4.4 89 38.91990 195 189 96.9 114 60.3 12 6.3 63 33.31991 192 180 93.8 99 55.0 11 6.1 70 38.91992 171 165 96.5 93 56.4 15 9.1 57 34.51993 185 177 95.7 117 66.1 15 8.5 45 25.41994 194 189 97.4 117 61.9 8 4.2 64 33.91995 201 195 97.0 131 67.2 9 4.6 55 28.21996 170 168 98.8 100 59.5 13 7.7 55 32.71997 231 224 97.0 152 67.9 11 4.9 61 27.21998 206 200 97.1 117 58.5 16 8.0 67 33.51999 188 188 100.0 121 64.4 9 4.8 58 30.92000 175 173 98.9 108 62.4 10 5.8 55 31.82001 199 194 97.5 119 61.3 6 3.1 69 35.62002 199 197 99.0 124 62.9 13 6.6 60 30.52003 207 201 97.1 117 58.2 14 7.0 70 34.82004 197 193 98.0 129 66.8 9 4.7 55 28.52005 254 248 97.6 150 60.5 10 4.0 88 35.52006 252 248 98.4 148 59.7 12 4.8 88 35.52007 235 231 98.3 136 58.9 11 4.8 84 36.42008 224 218 97.3 131 60.1 10 4.6 77 35.32009 192 191 99.5 112 58.6 11 5.8 68 35.62010 195 192 98.5 112 58.3 15 7.8 65 33.92011 170 167 98.2 109 65.3 13 7.8 45 26.92012 198 195 98.5 129 66.2 4 2.1 62 31.8
2006-2010baseline
2011-2012period
* dying in less than six hours.
Drivers Grouped by BAC (mg%)
Alcohol Use Among Fatally Injured Drivers of Highway Vehicles:Alberta, 1987-2012
128 (59.3) 12 (5.6) 76 (35.2)
Year Number of Drivers*
Drivers Tested
220 216 (98.2)
8 (4.4) 54 (29.8)184 181 (98.4) 119 (65.7)
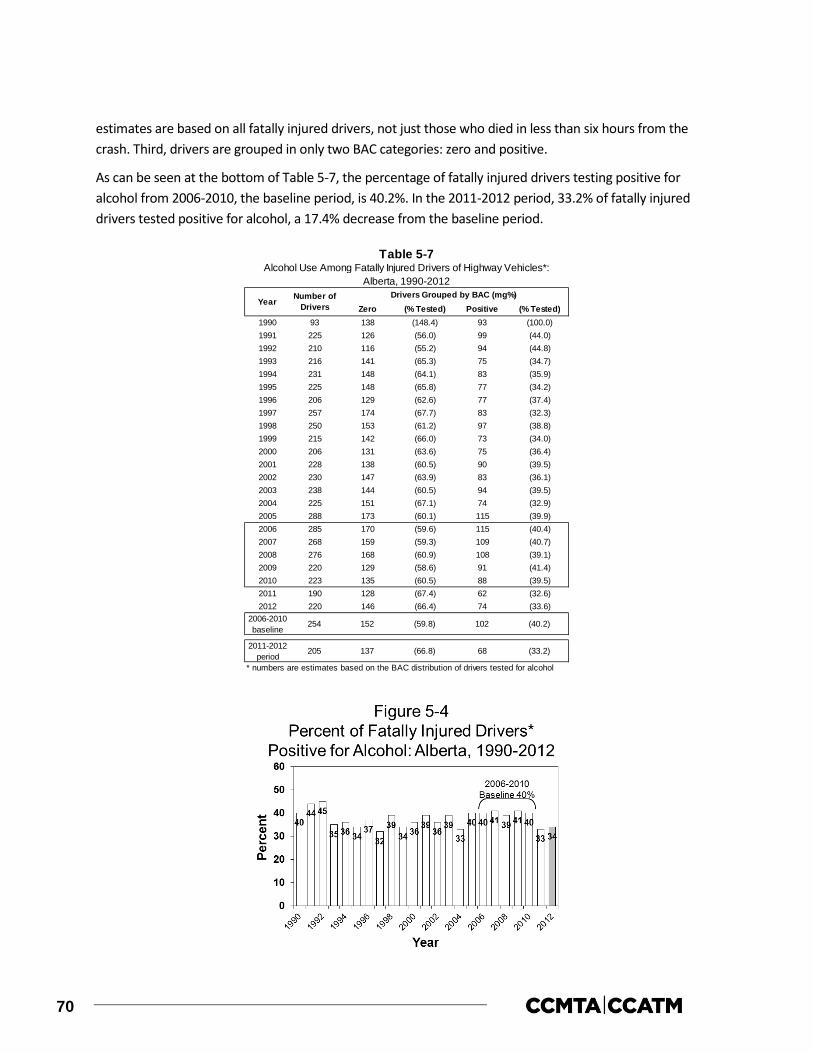
70
estimates are based on all fatally injured drivers, not just those who died in less than six hours from the crash. Third, drivers are grouped in only two BAC categories: zero and positive.
As can be seen at the bottom of Table 5-7, the percentage of fatally injured drivers testing positive for alcohol from 2006-2010, the baseline period, is 40.2%. In the 2011-2012 period, 33.2% of fatally injured drivers tested positive for alcohol, a 17.4% decrease from the baseline period.
Zero (% Tested) Positive (% Tested)1990 93 138 (148.4) 93 (100.0)1991 225 126 (56.0) 99 (44.0)1992 210 116 (55.2) 94 (44.8)1993 216 141 (65.3) 75 (34.7)1994 231 148 (64.1) 83 (35.9)1995 225 148 (65.8) 77 (34.2)1996 206 129 (62.6) 77 (37.4)1997 257 174 (67.7) 83 (32.3)1998 250 153 (61.2) 97 (38.8)1999 215 142 (66.0) 73 (34.0)2000 206 131 (63.6) 75 (36.4)2001 228 138 (60.5) 90 (39.5)2002 230 147 (63.9) 83 (36.1)2003 238 144 (60.5) 94 (39.5)2004 225 151 (67.1) 74 (32.9)2005 288 173 (60.1) 115 (39.9)2006 285 170 (59.6) 115 (40.4)2007 268 159 (59.3) 109 (40.7)2008 276 168 (60.9) 108 (39.1)2009 220 129 (58.6) 91 (41.4)2010 223 135 (60.5) 88 (39.5)2011 190 128 (67.4) 62 (32.6)2012 220 146 (66.4) 74 (33.6)
2006-2010baseline
2011-2012period
* numbers are estimates based on the BAC distribution of drivers tested for alcohol
Table 5-7Alcohol Use Among Fatally Injured Drivers of Highway Vehicles*:
Alberta, 1990-2012
Year Number of Drivers
Drivers Grouped by BAC (mg%)
254 152 (59.8) 102 (40.2)
205 137 (66.8) 68 (33.2)

71
5.5.3 Drivers in serious injury crashes: Table 5-8 and Figure 5-5 show information on drivers involved in alcohol-related serious injury crashes. As shown in Table 5-8, during the baseline period (2006-2010), an average of 19.8% of drivers in serious injury crashes were in an alcohol-involved crash. This compares to 16.0% in the 2011-2012 period, a 19.2% decrease in the problem.
Year Number of Drivers
Number in Alcohol-Involved Crashes Percent
1995 2762 669 (24.2)1996 2964 603 (20.3)1997 2970 741 (24.9)1998 3454 843 (24.4)1999 3298 755 (22.9)2000 3408 760 (22.3)2001 3670 851 (23.2)2002 3899 811 (20.8)2003 3768 758 (20.1)2004 3845 792 (20.6)2005 4024 829 (20.6)2006 4588 981 (21.4)2007 4139 826 (20.0)2008 3996 788 (19.7)2009 3744 709 (18.9)2010 3778 698 (18.5)2011 3198 530 (16.6)2012 3286 508 (15.5)
2006-2010baseline
2011-2012period
* single-vehicle nighttime crashes (SVN) as well as non-SVN crashes that have police-reported alcohol involvement
Table 5-8Number and Percent of All Drivers in Serious Injury Crashes*
that Involved Alcohol: Alberta, 1995-2012
4049 800 (19.8)
3242 519 (16.0)

72
Table 5-9 and Figure 5-6 also show information on drivers involved in alcohol-related serious injury crashes. These results differ slightly from those in Section 5.3 and in Table 5-8 and Figure 5-5 above because they exclude certain vehicle types – e.g., bicycles, snowmobiles, farm tractors, and other non-highway vehicles.
As can be seen, the incidence of alcohol-involvement in serious injury crashes has been relatively stable. Between 1995 and 2005 the percentage of drivers in serious injury crashes that involved alcohol generally dropped from 24.4% to 20.6%, rose to 21.8% in 2006, and decreased again to 15.7% in 2012.
As shown Table 5-9, in the baseline period (2006-2010) an average of 19.7% of drivers in serious injury crashes were in an alcohol-involved crash. In the 2011-2012 period, the incidence of drivers in alcohol-involved crashes decreased to 16.2%, a 17.8% decrease.
Number ofDrivers
1995 2692 656 (24.4)
1996 3023 622 (20.6)
1997 2938 749 (25.5)
1998 3332 821 (24.6)
1999 3178 742 (23.3)
2000 3269 741 (22.7)
2001 3534 817 (23.1)
2002 3777 784 (20.8)
2003 3587 727 (20.3)
2004 3641 755 (20.7)
2005 3826 788 (20.6)
2006 4382 954 (21.8)
2007 3967 795 (20.0)
2008 3776 737 (19.5)
2009 3537 660 (18.7)
2010 3564 641 (18.0)
2011 3024 504 (16.7)
2012 3129 492 (15.7)2006-2010baseline
2011-2012period
Table 5-9Number and Percent of Drivers* of Highway Vehicles in Serious
Injury Crashes** that Involved Alcohol: Alberta, 1995-2012
Year PercentNumber in Alcohol-Involved Crashes
** single-vehicle nighttime crashes (SVN) as well as non-SVN crashes that have police-reported alcohol involvement
* excludes operators of bicycles, snowmobiles, farm tractors, and other non-highway vehicles.
3845 757 (19.7)
3077 498 (16.2)

73
5.5.4 Drug use among fatally injured drivers: Table 5-10 and Figure 5-7 show data on drug use among fatally injured drivers over a 13-year period (2000-2012). Similar to Table 5-6, these results are based on fatally injured drivers of highway vehicles who died less than six hours after the crash (see Section 2.2.5).
As can be seen at the bottom of Table 5-10, the percentage of fatally injured drivers testing positive for drugs from 2006-2010, the baseline period, is 40.5%. The percentage of fatally injured drivers testing positive for drugs was 36.1% in 2011 and 40.4% in 2012. From 2011 to 2012, the average percentage of fatally injured drivers testing positive for drugs was 38.6%, a 4.7% decrease from the baseline period.
Negative (% Tested) Positive (% Tested)2000 175 41 23.4 21 51.2 20 48.8
2001 199 32 16.1 18 56.3 14 43.8
2002 199 47 23.6 33 70.2 14 29.8
2003 207 47 22.7 23 48.9 24 51.1
2004 197 34 17.3 19 55.9 15 44.1
2005 254 57 22.4 31 54.4 26 45.6
2006 252 168 66.7 88 52.4 80 47.6
2007 235 211 89.8 138 65.4 73 34.6
2008 224 204 91.1 120 58.8 84 41.2
2009 192 182 94.8 109 59.9 73 40.1
2010 195 186 95.4 111 59.7 75 40.3
2011 170 158 92.9 101 63.9 57 36.1
2012 198 183 92.4 109 59.6 74 40.42006-2010baseline
2011-2012period
* dying in less than six hours.
66 38.6184 171 92.9 105 61.4
Table 5-10
YEAR Number of Drivers*
Drivers Tested (% Total) Drivers Tested for Drugs
77 40.5
Drug Use Among Fatally Injured Drivers* of Highway Vehicles: Alberta, 2000-2012
220 190 86.4 113 59.5
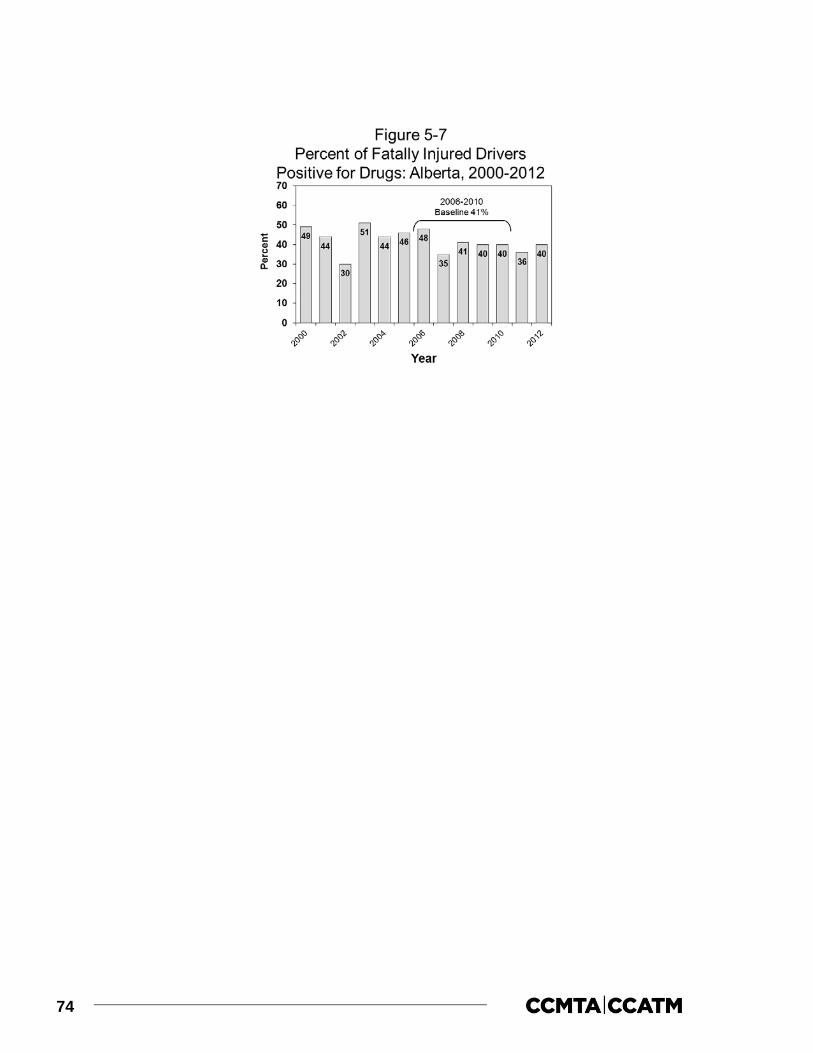
74

75
6.0 SASKATCHEWAN
This section of the report reviews the major findings on alcohol involvement in fatal and serious injury motor vehicle collisions as well as drug involvement in fatal motor vehicle collisions in Saskatchewan during 2012. It describes data on:
> people who were killed in alcohol-related crashes (Section 6.1);
> alcohol use among fatally injured drivers (Section 6.2);
> drivers involved in alcohol-related serious injury crashes (Section 6.3);
> drug use among fatally injured drivers (Section 6.4); and,
> trends in the alcohol-crash and drug-crash problems (Section 6.5).
6.1 Deaths in alcohol-related crashes
Table 6-1 presents information on people who died in alcohol-related crashes in Saskatchewan during 2012 for persons dying within 12 months of the collision (one calendar year) and for persons dying within 30 days of the collision. Motor vehicle deaths are categorized in terms of the victim’s age, gender, type (i.e., driver, passenger, pedestrian) and the type of vehicle they occupied. In each section, the first column in the table presents the number of deaths. The next two columns show the number and percent of these fatalities in which sufficient information was available to determine if alcohol was involved. A motor vehicle fatality was considered to be alcohol involved if there was at least one drinking driver or drinking pedestrian in the fatal crash.
For example, within the first section, it can be seen that among persons dying within 12 months of the collision, 18 people aged 16-19 were killed in motor vehicle crashes in Saskatchewan during 2012. And, in 17 cases (94.4%) it was possible to determine if alcohol was a factor in the crash. The next column shows the number of people killed in crashes that were known to be alcohol-involved. There were nine people aged 16-19 who died in alcohol-related crashes in Saskatchewan during 2012. The next column expresses this as a percentage – i.e., 52.9% of the 16-19 year olds who were killed died in an alcohol-related crash.
The final column (percent of all alcohol-related deaths) expresses the number of deaths in alcohol-related crashes as a percent of all the deaths in such crashes. For example, the alcohol-related deaths among 16-19 year olds represent 10.2% of all the people killed in alcohol-related crashes in Saskatchewan during 2012.
An examination of the section for persons dying within 30 days of the collision shows that 18 persons aged 16-19 died in motor vehicle crashes. In 17 of these cases (94.4%), it was possible to determine if alcohol was a factor in the crash. Among these persons, nine (52.9%) were alcohol-related deaths. And 16-19 year olds accounted for 10.5% of people dying in alcohol-related crashes.
The totals at the bottom of the table provide a summary. As can be seen, 203 persons died within 12 months of a motor vehicle crash in Saskatchewan during 2012. In 191 (94.1%) of these cases, it was possible

76
to determine if alcohol was a factor. Of these known cases, 88 (46.1%) involved alcohol. Extrapolating this figure to the total number of motor vehicle fatalities (203 x .461) it can be estimated that in Saskatchewan during 2012, 94 persons died in alcohol-related crashes within 12 months of the collision.
Among the 200 persons dying within 30 days of the collision, it was possible to determine if alcohol was a factor in 94.0% of the cases. Of these known cases, 86 (45.7%) involved alcohol. Extrapolating this figure to the total number of motor vehicle fatalities (200 x .457) it can be estimated that in Saskatchewan during 2012, 91 persons died in alcohol-related crashes within 30 days of the collision.
6.1.1 Victim age. Of all the people who died in alcohol-related crashes within 12 months of the collision, 31.8% (see last column in the first section) were aged 26-35; 18.2% were aged 36-45; 17.0% were aged 20-25; 12.5% were aged 46-55; 10.2% were aged 16-19; 9.1% were over age 55; and 1.1% were under 16.
The highest incidence of alcohol involvement occurred in the crashes in which a person aged 26-35 and 20-25 died (70.0% and 55.6%, respectively). The lowest incidence of alcohol involvement was found among the youngest and oldest fatalities – 0.0% of persons under 16 and 21.1% of the fatalities over 55 years of age died in crashes involving alcohol.
Age Group<16 12 8 66.7 1 0.0 1.1 12 8 66.7 1 0.0 1.216-19 18 17 94.4 9 52.9 10.2 18 17 94.4 9 52.9 10.520-25 28 27 96.4 15 55.6 17.0 28 27 96.4 15 55.6 17.426-35 40 40 100.0 28 70.0 31.8 40 40 100.0 28 70.0 32.636-45 36 33 91.7 16 48.5 18.2 35 32 91.4 15 46.9 17.446-55 30 28 93.3 11 39.3 12.5 29 27 93.1 11 40.7 12.8>55 39 38 97.4 8 21.1 9.1 38 37 97.4 7 18.9 8.1
GenderMale 141 132 93.6 65 49.2 73.9 140 131 93.6 65 49.6 75.6Female 62 59 95.2 23 39.0 26.1 60 57 95.0 21 36.8 24.4
Victim TypeDriver/ Operator 114 111 97.4 45 40.5 51.1 113 110 97.3 45 40.9 52.3Passenger 62 57 91.9 25 43.9 28.4 61 56 91.8 24 42.9 27.9Pedestrian 27 23 85.2 18 78.3 20.5 26 22 84.6 17 77.3 19.8
Vehicle OccupiedAutomobiles 71 69 97.2 26 37.7 29.5 71 69 97.2 26 37.7 30.2Trucks/Vans 81 76 93.8 34 44.7 38.6 80 75 93.8 33 44.0 38.4Motorcycles 7 7 100.0 1 14.3 1.1 6 6 100.0 1 16.7 1.2Other Hwy Vehicles 3 3 100.0 0 0.0 0.0 3 3 100.0 0 0.0 0.0Off-road Vehicles 14 13 92.9 9 69.2 10.2 14 13 92.9 9 69.2 10.5(Pedestrians) 27 23 85.2 18 78.3 20.5 26 22 84.6 17 77.3 19.8
Collision LocationPublic Road 177 170 96.0 68 40.0 77.3 174 167 96.0 66 39.5 76.7Off-road 26 21 80.8 20 95.2 22.7 26 21 80.8 20 95.2 23.3
TOTAL 203 191 94.1 88 46.1 100.0 200 188 94.0 86 45.7 100.0
No. of Deaths No.
Alcohol Use Known
% of total
No.
Persons Dying Within 30 Days of Collision
% of known
Table 6-1Deaths in Alcohol-Related Crashes: Saskatchewan, 2012
Alcohol-Related Deaths (ARDs)
Alcohol-Related Deaths (ARDs)
% of all ARDs
% of all ARDs
Persons Dying Within 12 Months of Collision
% of known
No. of Deaths
Alcohol Use Known
No. % of total
No.Category of Victim

77
6.1.2 Gender. Of all the people who died in alcohol-related crashes within 12 months of the collision, 73.9% were males. The incidence of alcohol in crashes in which a male died (49.2%) was greater than the incidence of alcohol in crashes in which a female died (39.0%).
6.1.3 Victim type. Of all the people who died in alcohol-related crashes within 12 months of the collision, 51.1% were drivers/operators of a vehicle; 28.4% were passengers; and 20.5% were pedestrians.
Within each of the victim types, the highest incidence of alcohol involvement (78.3%) occurred in the crashes in which a pedestrian died. Alcohol was involved in 43.9% of the crashes in which a passenger died and 40.5% of those in which a driver/operator died.
6.1.4 Type of vehicle occupied. Of all the people who died in alcohol-related crashes within 12 months of the collision, 38.6% were truck/van occupants; 29.5% were automobile occupants; 10.2% were off-road vehicle occupants; and 1.1% were motorcyclists.
Within each of these vehicle types, the incidence of alcohol involvement in which an off-road vehicle occupant died (69.2%) was greater than the incidence of alcohol crashes in which a truck/van occupant, automobile occupant or motorcyclist died (44.7%, 37.7% and 14.3%, respectively).
6.1.5 Collision location. Of all the people who died in alcohol-related crashes within 12 months of the collision, 77.3% died in a collision which occurred on a public road and 22.7% died in an off-road collision. However, the incidence of alcohol involvement in which a victim died in an alcohol-related crash was much greater for those dying in off-road collisions (95.2%) than it was for persons dying in a collision which occurred on a public road (40.0%).
6.2 Alcohol in fatally injured drivers
This section presents information on the presence of alcohol, exclusively among drivers fatally injured within 12 months of the collision in Saskatchewan during 2012. Table 6-2 shows the information by age group, gender, vehicle type, collision type (single vs. multiple), and duration between crash time and death time (within 12 months vs. within 30 days of the collision).
The first column in the table shows the number of drivers killed. The next columns show the number and percent of these victims who were tested for alcohol. The remaining columns provide information on the results of the alcohol tests: the first three of these present results for drivers who showed any evidence of alcohol; the last three columns present information on drivers who had BACs over the statutory limit of 80 mg%.
To illustrate, among 20-25 year olds there were 11 drivers killed during 2012; all 11 of these fatally injured drivers (100.0%) were tested for alcohol. Of those who were tested, six (54.5%) were positive for alcohol. This means that fatally injured drinking drivers aged 20-25 accounted for 18.2% of all drinking drivers who were killed.
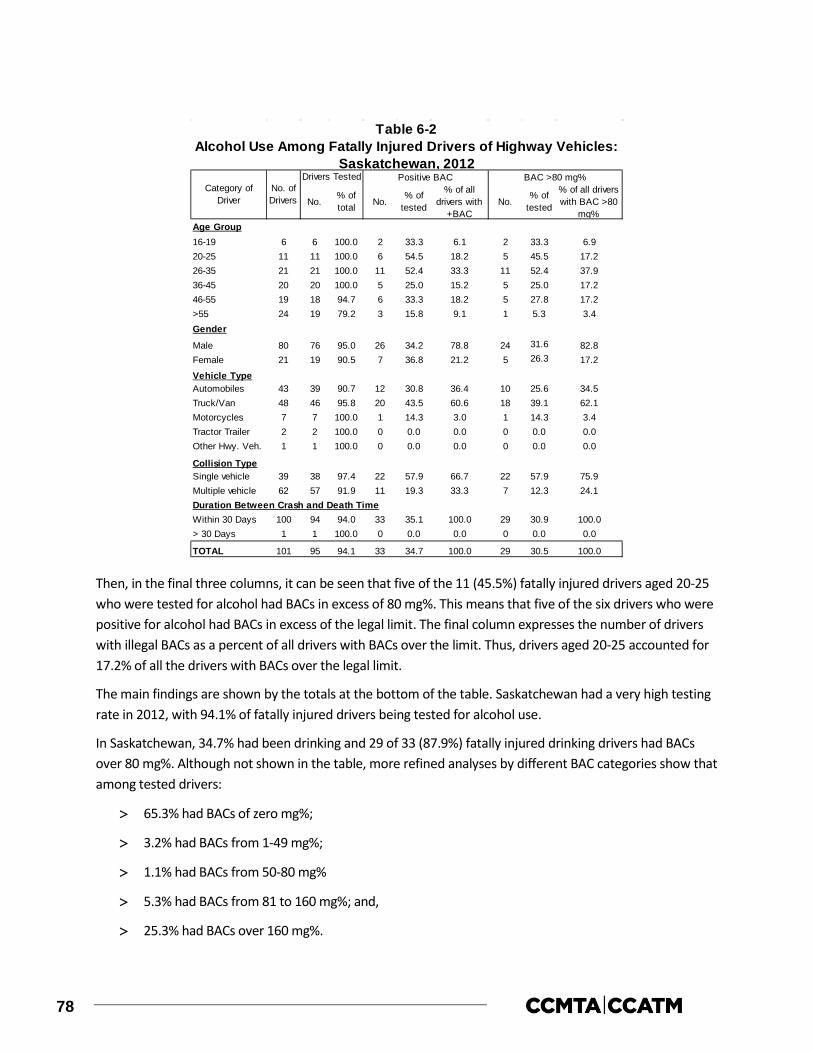
78
Then, in the final three columns, it can be seen that five of the 11 (45.5%) fatally injured drivers aged 20-25 who were tested for alcohol had BACs in excess of 80 mg%. This means that five of the six drivers who were positive for alcohol had BACs in excess of the legal limit. The final column expresses the number of drivers with illegal BACs as a percent of all drivers with BACs over the limit. Thus, drivers aged 20-25 accounted for 17.2% of all the drivers with BACs over the legal limit.
The main findings are shown by the totals at the bottom of the table. Saskatchewan had a very high testing rate in 2012, with 94.1% of fatally injured drivers being tested for alcohol use.
In Saskatchewan, 34.7% had been drinking and 29 of 33 (87.9%) fatally injured drinking drivers had BACs over 80 mg%. Although not shown in the table, more refined analyses by different BAC categories show that among tested drivers:
> 65.3% had BACs of zero mg%;
> 3.2% had BACs from 1-49 mg%;
> 1.1% had BACs from 50-80 mg%
> 5.3% had BACs from 81 to 160 mg%; and,
> 25.3% had BACs over 160 mg%.
Age Group16-19 6 6 100.0 2 33.3 6.1 2 33.3 6.920-25 11 11 100.0 6 54.5 18.2 5 45.5 17.226-35 21 21 100.0 11 52.4 33.3 11 52.4 37.936-45 20 20 100.0 5 25.0 15.2 5 25.0 17.246-55 19 18 94.7 6 33.3 18.2 5 27.8 17.2>55 24 19 79.2 3 15.8 9.1 1 5.3 3.4Gender
Male 80 76 95.0 26 34.2 78.8 24 31.6 82.8Female 21 19 90.5 7 36.8 21.2 5 26.3 17.2
Vehicle TypeAutomobiles 43 39 90.7 12 30.8 36.4 10 25.6 34.5Truck/Van 48 46 95.8 20 43.5 60.6 18 39.1 62.1Motorcycles 7 7 100.0 1 14.3 3.0 1 14.3 3.4Tractor Trailer 2 2 100.0 0 0.0 0.0 0 0.0 0.0Other Hwy. Veh. 1 1 100.0 0 0.0 0.0 0 0.0 0.0
Collision TypeSingle vehicle 39 38 97.4 22 57.9 66.7 22 57.9 75.9Multiple vehicle 62 57 91.9 11 19.3 33.3 7 12.3 24.1Duration Between Crash and Death TimeWithin 30 Days 100 94 94.0 33 35.1 100.0 29 30.9 100.0> 30 Days 1 1 100.0 0 0.0 0.0 0 0.0 0.0
TOTAL 101 95 94.1 33 34.7 100.0 29 30.5 100.0
% of tested
Table 6-2Alcohol Use Among Fatally Injured Drivers of Highway Vehicles:
Saskatchewan, 2012Positive BAC BAC >80 mg%
% of all drivers with
+BAC
% of all drivers with BAC >80
mg%
% of tested No.
Category of Driver
No. of Drivers No.
Drivers Tested
% of total No.
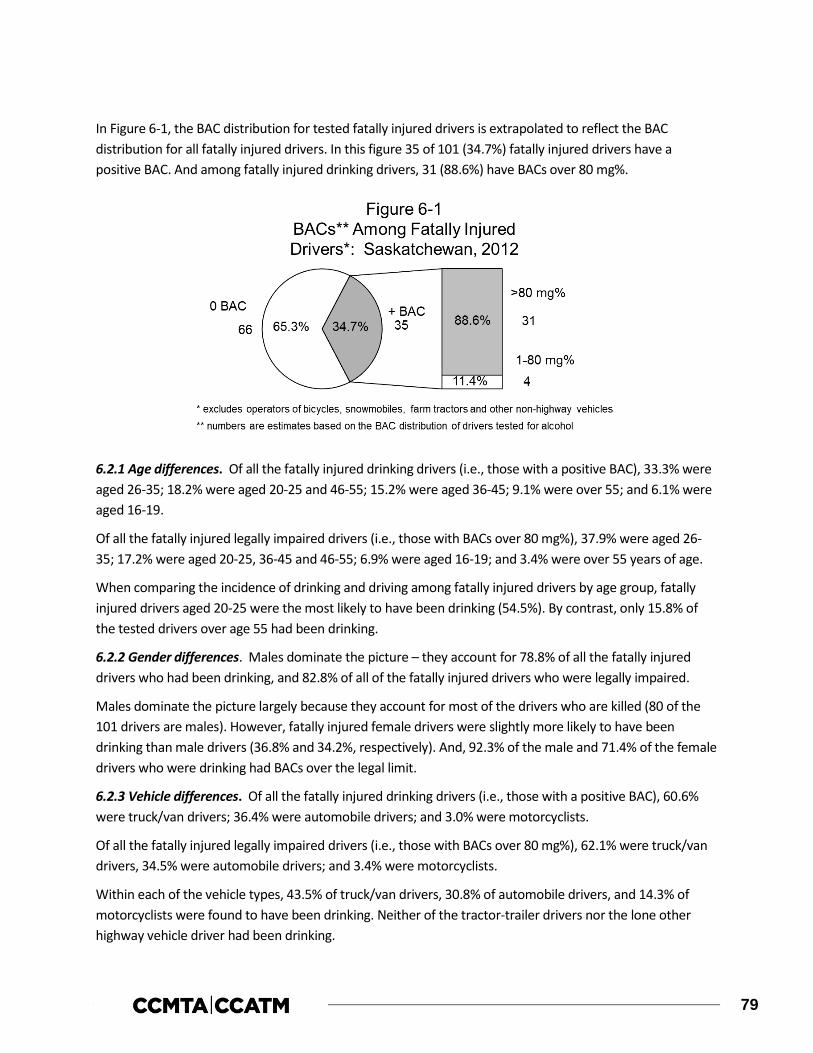
79
In Figure 6-1, the BAC distribution for tested fatally injured drivers is extrapolated to reflect the BAC distribution for all fatally injured drivers. In this figure 35 of 101 (34.7%) fatally injured drivers have a positive BAC. And among fatally injured drinking drivers, 31 (88.6%) have BACs over 80 mg%.
6.2.1 Age differences. Of all the fatally injured drinking drivers (i.e., those with a positive BAC), 33.3% were aged 26-35; 18.2% were aged 20-25 and 46-55; 15.2% were aged 36-45; 9.1% were over 55; and 6.1% were aged 16-19.
Of all the fatally injured legally impaired drivers (i.e., those with BACs over 80 mg%), 37.9% were aged 26-35; 17.2% were aged 20-25, 36-45 and 46-55; 6.9% were aged 16-19; and 3.4% were over 55 years of age.
When comparing the incidence of drinking and driving among fatally injured drivers by age group, fatally injured drivers aged 20-25 were the most likely to have been drinking (54.5%). By contrast, only 15.8% of the tested drivers over age 55 had been drinking.
6.2.2 Gender differences. Males dominate the picture – they account for 78.8% of all the fatally injured drivers who had been drinking, and 82.8% of all of the fatally injured drivers who were legally impaired.
Males dominate the picture largely because they account for most of the drivers who are killed (80 of the 101 drivers are males). However, fatally injured female drivers were slightly more likely to have been drinking than male drivers (36.8% and 34.2%, respectively). And, 92.3% of the male and 71.4% of the female drivers who were drinking had BACs over the legal limit.
6.2.3 Vehicle differences. Of all the fatally injured drinking drivers (i.e., those with a positive BAC), 60.6% were truck/van drivers; 36.4% were automobile drivers; and 3.0% were motorcyclists.
Of all the fatally injured legally impaired drivers (i.e., those with BACs over 80 mg%), 62.1% were truck/van drivers, 34.5% were automobile drivers; and 3.4% were motorcyclists.
Within each of the vehicle types, 43.5% of truck/van drivers, 30.8% of automobile drivers, and 14.3% of motorcyclists were found to have been drinking. Neither of the tractor-trailer drivers nor the lone other highway vehicle driver had been drinking.
80
6.2.4 Collision differences. Less than two-fifths of the drivers killed (39 of the 101) were involved in single-vehicle collisions but these crashes accounted for over two-thirds of the drivers who had been drinking or were legally impaired (66.7% and 75.9%, respectively).
The reason for this apparent disparity is because alcohol is overrepresented in single-vehicle crashes. Over half of the drivers involved in single-vehicle crashes (57.9%) were positive for alcohol, compared to only 19.3% of those involved in multiple-vehicle collisions.
6.2.5 Duration between crash and death time. Only one fatally injured driver died more than 30 days after the collision, and this person tested negative for alcohol. Thus, a comparison of alcohol use among drivers based on differences in the duration between crash time and death time cannot be performed.
6.3 Drivers involved in alcohol-related serious injury crashes
This section presents information on drivers involved in alcohol-related crashes in which someone was seriously injured in 2012 in Saskatchewan. A “surrogate” or “indirect” measure is used to estimate alcohol involvement because drivers in serious injury crashes are seldom tested for alcohol. A driver is identified as having been involved in an alcohol-related serious injury crash if the crash in which someone was seriously injured involved a single vehicle at night (SVN), or if, in the case of a non-SVN serious injury crash, the police reported alcohol involvement – i.e., at least one drinking driver in the crash (see Section 2.2.4).
The results are shown in Table 6-3 for drivers grouped in terms of age, gender, type of vehicle driven, and type of collision. The first column shows the number of drivers involved in serious injury crashes. The number and percent of drivers in such crashes that involved alcohol is shown in the next two columns. The final column expresses the number of drivers involved in alcohol-related serious injury crashes in any row as a percent of all drivers involved in alcohol-related serious injury crashes.
As shown, by the totals at the bottom of the table, 479 drivers were involved in crashes in which someone was seriously injured, and among these 28.2% were alcohol-related crashes.
6.3.1 Driver age. Of all the drivers involved in alcohol-related serious injury crashes, 25.2% were aged 20-25, 23.7% were aged 26-35; and 16.3% were aged 16-19. Drivers under 16 and over 55 accounted for only 0.0% and 5.9% respectively of those involved in alcohol-related serious injury crashes.
Two-fifths of the drivers aged 16-19 and 20-25 were involved in alcohol-related serious injury crashes (41.5% and 40.5%, respectively). The lowest incidence of involvement in alcohol-related crashes was found for those aged under 16 and over 55 (0.0% and 11.1%, respectively).

81
6.3.2 Driver gender. Of all the drivers involved in alcohol-related serious injury crashes, 73.3% were males. The incidence of involvement in alcohol-related serious injury crashes was also greater for males than for females (29.8% and 21.5%, respectively).
6.3.3 Type of vehicle driven. Of all the drivers involved in alcohol-related serious injury crashes, 45.9% were automobile drivers; 41.5% were truck/van drivers; 4.4% were motorcyclists; and 3.7% were tractor-trailer drivers and off-road vehicle drivers.
The highest incidence of involvement in alcohol-related serious injury crashes was found for automobile drivers – 40.5% of these drivers were in crashes that involved alcohol, compared to 26.5% for truck/van drivers; 20.8% for off-road vehicle drivers; 16.2% for motorcyclists; and 10.6% for tractor-trailer drivers.
6.3.4 Type of collision. Of all the drivers involved in alcohol-related serious injury crashes, 72.6% of them were in single-vehicle crashes. The highest incidence of involvement in alcohol-related serious injury crashes was also found among drivers in single-vehicle crashes – 50.3% of these drivers, compared to only 13.0% for drivers involved in multiple-vehicle crashes.
% of % of all drivers inNumber total alcohol-related crashes
Age<16 6 0 0.0 0.016-19 53 22 41.5 16.320-25 84 34 40.5 25.226-35 85 32 37.6 23.736-45 73 12 16.4 8.946-55 90 19 21.1 14.1>55 72 8 11.1 5.9unknown 16 8 50.0 5.9
GenderMale 332 99 29.8 73.3Female 130 28 21.5 20.7unknown 17 8 47.1 5.9
Vehicle TypeAuto 153 62 40.5 45.9Truck/Van 211 56 26.5 41.5Motorcycle 37 6 16.2 4.4Tractor Trailer 47 5 10.6 3.7Other Hwy. Vehicle 3 0 0.0 0.0Off-Road 24 5 20.8 3.7Unknown 4 1 25.0 0.7
Collision TypeSingle-Vehicle 195 98 50.3 72.6Multiple-Vehicle 284 37 13.0 27.4
TOTAL 479 135 28.2 100.0
Table 6-3Drivers in Alcohol-Related Serious Injury Crashes:
Saskatchewan, 2012Category of Drivers Number of
Drivers
Alcohol-Related

82
6.4 Drug use among fatally injured drivers
This section presents information on the presence of drugs, exclusively among drivers fatally injured in Saskatchewan during 2012. Table 6-4 shows the prevalence of drug use among fatally injured drivers of highway vehicles as well as the number of drivers who tested positive for various categories of drugs.
As can be seen, Saskatchewan had a high testing rate in 2012, with 88.1% of fatally injured drivers being tested for drug use.
Among fatally injured tested drivers, 34 out of 89 (38.2%) were positive for drugs. The most common category of drugs found within drivers testing positive for drug use was CNS depressants (41.2%). Other categories of drugs found in fatally injured drivers testing positive for drugs were cannabis (32.4%), CNS stimulants (17.6%), and narcotic analgesics (14.7%).
6.5 Trends in alcohol and drug-impaired driving
Sections 6.1 through 6.3 examined three indicators of the alcohol-crash problem: (1) the number and percent of people who died in crashes that involved alcohol (within 12 months and 30 days of the collision); (2) the number and percent of fatally injured drivers who had been drinking; and (3) the number and percent of drivers in serious injury crashes that involved alcohol. Section 6.4 examined drug use among fatally injured drivers in 2012. This section examines changes in these four indicators over time.
6.5.1 Deaths in alcohol-related crashes: 1995-2012. Table 6-5 and Figure 6-2 show the number and percent of people who died in crashes involving a drinking driver from 1995 to 2012. These results differ slightly from those in Section 6.1 for two reasons. First, deaths that occur in crashes that involve a drinking
Number % of total Number % of tested101 89 (88.1) 34 (38.2)
141165000
Drug Use Among Fatally Injured Drivers of Highway Vehicles: Saskatchewan, 2012
Table 6-4
CNS Depressants
Narcotic Analgesics
Drivers TestedNumber of Drivers
Positive for DrugsPrevalence of Drug Use
Cannabis (32.4)CNS Stimulants (17.6)
Categories of Drugs Found Among Drivers Testing Positive
Drug Category % of drivers testing positive*
* Percentages will not add up to 100% due to multiple drug types found in blood samples of some drivers.
Positive for Drug TypeNumber of
Drivers(41.2)
(14.7)HallucinogensDissociative AnestheticsInhalants
(0.0)(0.0)(0.0)

83
pedestrian are not necessarily classified as alcohol- related deaths. The focus here is more restrictive, on deaths that occur in crashes involving at least one drinking driver. Second, the trend analyses focus on fatal crashes on public roadways involving principal vehicle types (where at least one of the vehicles involved is an automobile, truck/van, motorcycle or other highway vehicle). The previous analyses included all types of motorized vehicles (e.g., snowmobiles) on both public roadways and in off-road locations.
As shown in the table and figure, the number of deaths in crashes that involved a drinking driver generally decreased from 64 in 1995 to a low of 44 in 2004, increased to 74 in 2008, decreased to 63 in 2009, rose to 68 in 2010, and decreased again to 62 in 2011 and 2012. The percentage of alcohol-related fatalities generally decreased from 43.8% in 1995 to a low of 31.3% in 2005, peaked at 51.0% in 2008, and generally decreased to 36.0% in 2012.
As shown at the bottom of the table, during the 2006-2010 baseline period there was an average of 62 fatalities involving a drinking driver and they accounted for 43.4% of all fatalities. This means that the percent of fatalities involving a drinking driver decreased by 10.1% from 43.4% in the baseline period (2006-2010) to 39.0% in the 2011-2012 period. And, in terms of the number of persons killed in crashes involving a
Number % of total Number % of total1995 146 64 43.8 144 64 44.4
1996 127 52 40.9 126 51 40.5
1997 155 54 34.8 154 54 35.1
1998 147 62 42.2 146 61 41.8
1999 178 79 44.4 177 78 44.1
2000 143 49 34.3 142 49 34.5
2001 147 70 47.6 145 69 47.6
2002 131 45 34.4 130 45 34.6
2003 137 55 40.1 136 54 39.7
2004 121 44 36.4 121 44 36.4
2005 147 46 31.3 144 46 31.9
2006 126 49 38.9 123 49 39.8
2007 132 54 40.9 131 54 41.2
2008 145 74 51.0 144 73 50.7
2009 155 63 40.6 154 63 40.9
2010 155 68 43.9 155 68 43.9
2011 146 62 42.5 145 62 42.8
2012 172 62 36.0 169 59 34.92006-2010baseline
2011-2012period
** only on public roadways involving principal vehicle types.
38.9159 62 39.0 157 61
* numbers are estimates based on the percent of deaths for which information was available to determine alcohol use.
Number of Deaths
Alcohol-Related Deaths
Persons Dying Within 30 Days of Collision
Table 6-5Number* and Percent of Motor Vehicle Deaths** Involving a
Drinking Driver: Saskatchewan, 1995-2011
Alcohol-Related Deaths
Persons Dying Within 12 Months of Collision
Year of Death
Number of Deaths
143 62 43.4 141 61 43.3
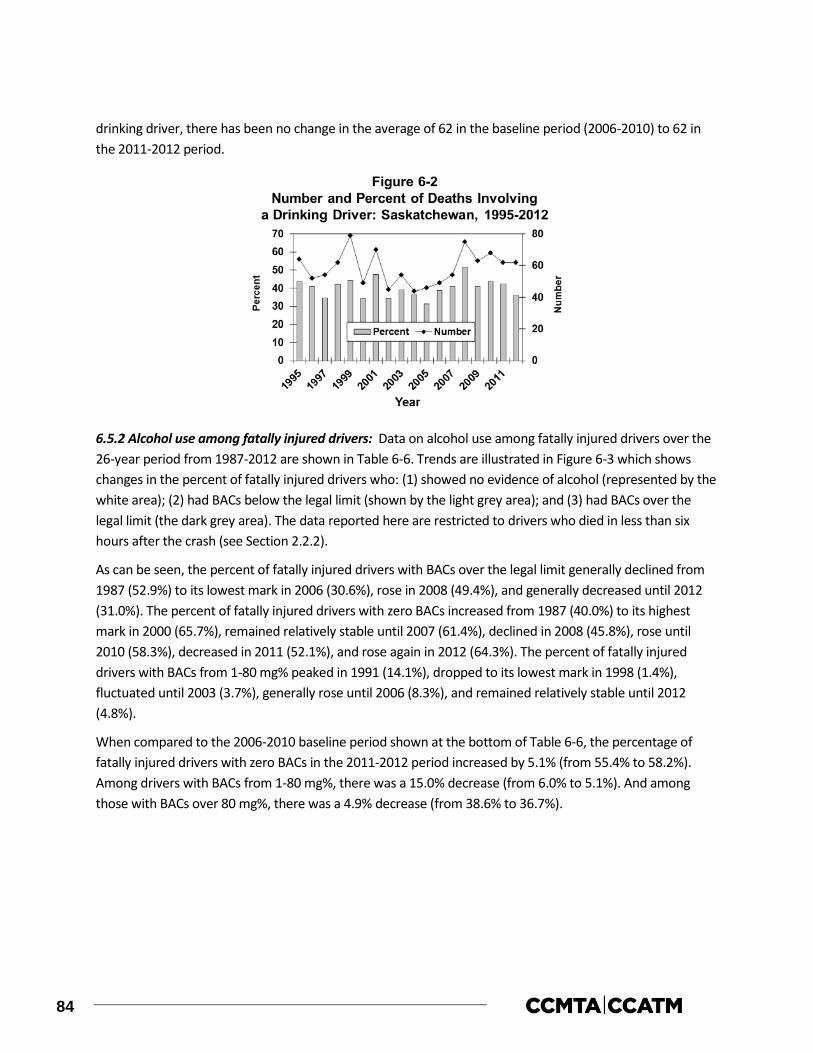
84
drinking driver, there has been no change in the average of 62 in the baseline period (2006-2010) to 62 in the 2011-2012 period.
6.5.2 Alcohol use among fatally injured drivers: Data on alcohol use among fatally injured drivers over the 26-year period from 1987-2012 are shown in Table 6-6. Trends are illustrated in Figure 6-3 which shows changes in the percent of fatally injured drivers who: (1) showed no evidence of alcohol (represented by the white area); (2) had BACs below the legal limit (shown by the light grey area); and (3) had BACs over the legal limit (the dark grey area). The data reported here are restricted to drivers who died in less than six hours after the crash (see Section 2.2.2).
As can be seen, the percent of fatally injured drivers with BACs over the legal limit generally declined from 1987 (52.9%) to its lowest mark in 2006 (30.6%), rose in 2008 (49.4%), and generally decreased until 2012 (31.0%). The percent of fatally injured drivers with zero BACs increased from 1987 (40.0%) to its highest mark in 2000 (65.7%), remained relatively stable until 2007 (61.4%), declined in 2008 (45.8%), rose until 2010 (58.3%), decreased in 2011 (52.1%), and rose again in 2012 (64.3%). The percent of fatally injured drivers with BACs from 1-80 mg% peaked in 1991 (14.1%), dropped to its lowest mark in 1998 (1.4%), fluctuated until 2003 (3.7%), generally rose until 2006 (8.3%), and remained relatively stable until 2012 (4.8%).
When compared to the 2006-2010 baseline period shown at the bottom of Table 6-6, the percentage of fatally injured drivers with zero BACs in the 2011-2012 period increased by 5.1% (from 55.4% to 58.2%). Among drivers with BACs from 1-80 mg%, there was a 15.0% decrease (from 6.0% to 5.1%). And among those with BACs over 80 mg%, there was a 4.9% decrease (from 38.6% to 36.7%).

85
Table 6-7 and Figure 6-4 show data on alcohol use among fatally injured drivers over a shorter period from 1990-2012. These results also differ from those reported above for several reasons. First, the number of drivers is extrapolated to reflect the BAC distribution of drivers tested for alcohol (see Figure 6-1). Second, estimates are based on all fatally injured drivers, not just those who died in less than six hours from the crash. Third, drivers are grouped in only two BAC categories: zero and positive.
Table 6-6
No. (% Total) Zero (% Tested) 1-80 (% Tested) >80 (% Tested)1987 94 85 90.4 34 40.0 6 7.1 45 52.91988 88 86 97.7 44 51.2 12 14.0 30 34.91989 110 103 93.6 51 49.5 7 6.8 45 43.71990 80 78 97.5 44 56.4 5 6.4 29 37.21991 83 78 94.0 37 47.4 11 14.1 30 38.51992 66 63 95.5 32 50.8 4 6.3 27 42.91993 80 79 98.8 47 59.5 6 7.6 26 32.91994 68 68 100.0 41 60.3 8 11.8 19 27.91995 77 76 98.7 40 52.6 5 6.6 31 40.81996 68 67 98.5 40 59.7 4 6.0 23 34.31997 65 64 98.5 38 59.4 5 7.8 21 32.81998 73 73 100.0 45 61.6 1 1.4 27 37.01999 86 84 97.7 45 53.6 8 9.5 31 36.92000 73 67 91.8 44 65.7 2 3.0 21 31.32001 88 82 93.2 41 50.0 6 7.3 35 42.72002 62 58 93.5 30 51.7 4 6.9 24 41.42003 84 81 96.4 48 59.3 3 3.7 30 37.02004 62 60 96.8 34 56.7 4 6.7 22 36.72005 70 62 88.6 38 61.3 4 6.5 20 32.32006 79 72 91.1 44 61.1 6 8.3 22 30.62007 86 83 96.5 51 61.4 5 6.0 27 32.52008 87 83 95.4 38 45.8 4 4.8 41 49.42009 94 93 98.9 51 54.8 5 5.4 37 39.82010 89 84 94.4 49 58.3 4 4.8 31 36.92011 76 73 96.1 38 52.1 3 4.1 32 43.82012 89 84 94.4 54 64.3 4 4.8 26 31.0
2006-2010baseline
2011-2012period
* dying in less than six hours.
Drivers Grouped by BAC (mg%)
Alcohol Use Among Fatally Injured Drivers of Highway Vehicles:Saskatchewan, 1987-2012
46 (55.4) 5 (6.0) 32 (38.6)
Year Number of Drivers*
Drivers Tested
87 83 (95.4)
4 (5.1) 29 (36.7)83 79 (95.2) 46 (58.2)

86
As can be seen at the bottom of Table 6-7, the percentage of fatally injured drivers testing positive for alcohol from 2006-2010, the baseline period, is 44.3%. In the 2011-2012 period, 39.6% of fatally injured drivers tested positive for alcohol, an 10.6% decrease from the baseline period.
Zero (% Tested) Positive (% Tested)1990 93 53 (57.0) 40 (43.0)1991 88 42 (47.7) 46 (52.3)1992 74 38 (51.4) 36 (48.6)1993 90 54 (60.0) 36 (40.0)1994 79 47 (59.5) 32 (40.5)1995 81 43 (53.1) 38 (46.9)1996 73 43 (58.9) 30 (41.1)1997 78 48 (61.5) 30 (38.5)1998 85 54 (63.5) 31 (36.5)1999 96 51 (53.1) 45 (46.9)2000 83 54 (65.1) 29 (34.9)2001 99 49 (49.5) 50 (50.5)2002 75 39 (52.0) 36 (48.0)2003 92 56 (60.9) 36 (39.1)2004 72 39 (54.2) 33 (45.8)2005 82 49 (59.8) 33 (40.2)2006 88 54 (61.4) 34 (38.6)2007 97 60 (61.9) 37 (38.1)2008 96 43 (44.8) 53 (55.2)2009 103 58 (56.3) 45 (43.7)2010 100 55 (55.0) 45 (45.0)2011 90 50 (55.6) 40 (44.4)2012 101 66 (65.3) 35 (34.7)
2006-2010baseline
2011-2012period
* numbers are estimates based on the BAC distribution of drivers tested for alcohol
Table 6-7Alcohol Use Among Fatally Injured Drivers of Highway Vehicles*:
Saskatchewan, 1990-2012
Year Number of Drivers
Drivers Grouped by BAC (mg%)
97 54 (55.7) 43 (44.3)
96 58 (60.4) 38 (39.6)
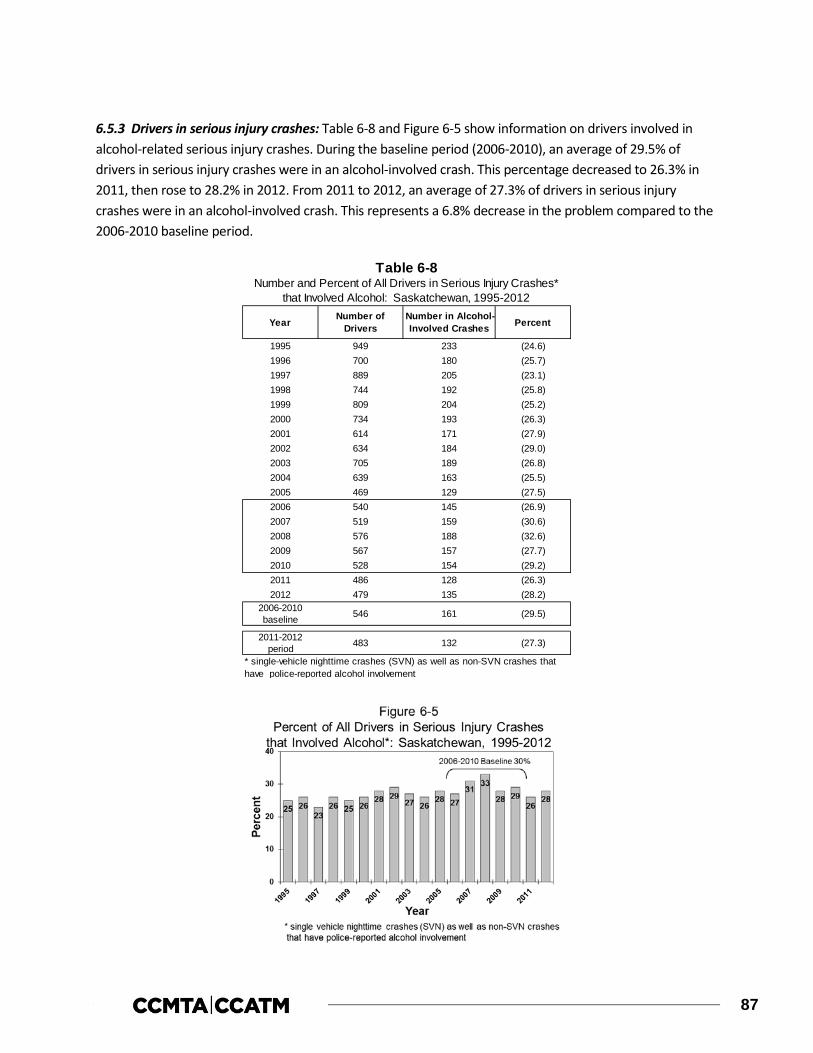
87
6.5.3 Drivers in serious injury crashes: Table 6-8 and Figure 6-5 show information on drivers involved in alcohol-related serious injury crashes. During the baseline period (2006-2010), an average of 29.5% of drivers in serious injury crashes were in an alcohol-involved crash. This percentage decreased to 26.3% in 2011, then rose to 28.2% in 2012. From 2011 to 2012, an average of 27.3% of drivers in serious injury crashes were in an alcohol-involved crash. This represents a 6.8% decrease in the problem compared to the 2006-2010 baseline period.
Year Number of Drivers
Number in Alcohol-Involved Crashes Percent
1995 949 233 (24.6)1996 700 180 (25.7)1997 889 205 (23.1)1998 744 192 (25.8)1999 809 204 (25.2)2000 734 193 (26.3)2001 614 171 (27.9)2002 634 184 (29.0)2003 705 189 (26.8)2004 639 163 (25.5)2005 469 129 (27.5)2006 540 145 (26.9)2007 519 159 (30.6)2008 576 188 (32.6)2009 567 157 (27.7)2010 528 154 (29.2)2011 486 128 (26.3)2012 479 135 (28.2)
2006-2010baseline
2011-2012period
* single-vehicle nighttime crashes (SVN) as well as non-SVN crashes that have police-reported alcohol involvement
Table 6-8Number and Percent of All Drivers in Serious Injury Crashes*
that Involved Alcohol: Saskatchewan, 1995-2012
546 161 (29.5)
483 132 (27.3)

88
Table 6-9 and Figure 6-6 also show information on drivers involved in alcohol-related serious injury crashes. These results differ slightly from those in Section 6.3 and in Table 6-8 and Figure 6-5 above because they exclude certain vehicle types – e.g., bicycles, snowmobiles, farm tractors and other non-highway vehicles.
As can be seen, the incidence of alcohol-involvement in serious injury crashes has increased gradually until 2002, declined until 2004, and generally increased in the past six years. Between 1995 and 2002 the percentage of all drivers in serious injury crashes that involved alcohol generally rose from 25.0% to 29.5%, peaked at 33.2% in 2008, decreased to 27.7% in 2009, rose to 28.9% in 2010, decreased in 2011 (27.8%), and rose again in 2012 (28.6%).
In the baseline period (2006-2010), an average of 29.5% of highway vehicle drivers in serious injury crashes were in an alcohol-involved crash. From 2011 to 2012, the average percentage of drivers in alcohol-involved crashes declined to 28.3%, a 4.1% decrease from the baseline period.
Number ofDrivers
1995 885 221 (25.0)1996 656 168 (25.6)1997 843 197 (23.4)1998 703 185 (26.3)1999 757 195 (25.8)2000 693 183 (26.4)2001 583 164 (28.1)2002 599 177 (29.5)2003 667 177 (26.5)2004 606 154 (25.4)2005 443 122 (27.5)2006 507 136 (26.8)2007 492 151 (30.7)2008 542 180 (33.2)2009 528 146 (27.7)2010 492 142 (28.9)2011 460 128 (27.8)2012 451 129 (28.6)
2006-2010baseline
2011-2012period
** single-vehicle nighttime crashes (SVN) as well as non-SVN crashes that have police-reported alcohol involvement
* excludes operators of bicycles, snowmobiles, farm tractors, and other non-highway vehicles.
512 151 (29.5)
456 129 (28.3)
Table 6-9Number and Percent of Drivers* of Highway Vehicles in Serious
Injury Crashes** that Involved Alcohol: Saskatchewan, 1995-2012
Year PercentNumber in Alcohol-Involved Crashes

89
6.5.4 Drug use among fatally injured drivers: Table 6-10 and Figure 6-7 show data on drug use among fatally injured drivers over a 13-year period (2000-2012). Similar to Table 6-6, these results are based on fatally injured drivers of highway vehicles who died less than six hours after the crash (see Section 2.2.5).
As can be seen at the bottom of Table 6-10, the percentage of fatally injured drivers testing positive for drugs from 2006-2010, the baseline period, is 37.8%. The percentage of fatally injured drivers testing positive for drugs was 42.5% in 2011 and 42.0% in 2012. From 2011 to 2012, the average percentage of fatally injured drivers testing positive for drugs was 42.3%, an 11.9% increase from the baseline period.
Negative (% Tested) Positive (% Tested)2000 73 62 84.9 55 88.7 7 11.3
2001 88 79 89.8 58 73.4 21 26.6
2002 62 55 88.7 32 58.2 23 41.8
2003 84 80 95.2 60 75.0 20 25.0
2004 62 55 88.7 41 74.5 14 25.5
2005 70 60 85.7 38 63.3 22 36.7
2006 79 71 89.9 47 66.2 24 33.8
2007 86 83 96.5 59 71.1 24 28.9
2008 87 83 95.4 49 59.0 34 41.0
2009 94 92 97.9 61 66.3 31 33.7
2010 89 83 93.3 41 49.4 42 50.6
2011 76 73 96.1 42 57.5 31 42.5
2012 89 81 91.0 47 58.0 34 42.02006-2010baseline
2011-2012period
* dying in less than six hours.
33 42.383 78 94.0 45 57.7
Table 6-10
YEAR Number of Drivers*
Drivers Tested (% Total) Drivers Tested for Drugs
31 37.8
Drug Use Among Fatally Injured Drivers* of Highway Vehicles: Saskatchewan, 2000-2012
87 82 94.3 51 62.2

90
91
7.0 MANITOBA
This section of the report reviews the major findings on alcohol involvement in fatal and serious injury motor vehicle collisions as well as drug involvement in fatal motor vehicle collisions in Manitoba during 2012. It describes data on:
> people who were killed in alcohol-related crashes (Section 7.1);
> alcohol use among fatally injured drivers (Section 7.2);
> drivers involved in alcohol-related serious injury crashes (Section 7.3);
> drug use among fatally injured drivers (Section 7.4); and,
> trends in the alcohol-crash and drug-crash problems (Section 7.5).
7.1 Deaths in alcohol-related crashes
Table 7-1 presents information on people who died in alcohol-related crashes in Manitoba during 2012 for persons dying within 12 months of the collision (one calendar year) and for persons dying within 30 days of the collision. Motor vehicle deaths are categorized in terms of the victim’s age, gender, type (i.e., driver, passenger, pedestrian) and the type of vehicle they occupied. In each section, the first column in the table presents the number of deaths. The next two columns show the number and percent of these fatalities in which sufficient information was available to determine if alcohol was involved. A motor vehicle fatality was considered to be alcohol involved if there was at least one drinking driver or drinking pedestrian in the fatal crash.
For example, within the first section, it can be seen that among persons dying within 12 months of the collision, 19 people aged 26-35 were killed in motor vehicle crashes in Manitoba during 2012. And, in 19 cases (100.0%) it was possible to determine if alcohol was a factor in the crash. The next column shows the number of people killed in crashes that were known to be alcohol-involved. Thirteen people aged 26-35 died in alcohol-related crashes in Manitoba during 2012. The next column expresses this as a percentage – i.e., 68.4% of the 26-35 year olds who were killed died in an alcohol-related crash.
The final column (percent of all alcohol-related deaths) expresses the number of deaths in alcohol-related crashes as a percent of all the deaths in such crashes. For example, the alcohol-related deaths among 26-35 year olds represent 26.0% of all the people killed in alcohol-related crashes in Manitoba during 2012.
An examination of the section for persons dying within 30 days of the collision shows that 19 persons aged 26-35 died in motor vehicle crashes. In 19 of these cases (100.0%), it was possible to determine if alcohol was a factor in the crash. Among these persons, 13 (68.4%) were alcohol-related deaths. And 26-35 year olds accounted for 26.0% of people dying in alcohol-related crashes.
The totals at the bottom of the table provide a summary. As can be seen, 115 persons died within 12 months of a motor vehicle crash in Manitoba during 2012. In 110 (95.7%) of these cases, it was possible to

92
determine if alcohol was a factor. Of these known cases, 50 (45.5%) involved alcohol. Extrapolating this figure to the total number of motor vehicle fatalities (115 x .455) it can be estimated that in Manitoba during 2012, 53 persons died in alcohol-related crashes within 12 months of the collision.
Among the 110 persons dying within 30 days of the collision, it was possible to determine if alcohol was a factor in 97.3% of the cases. Of these known cases, 50 (46.7%) involved alcohol. Extrapolating this figure to the total number of motor vehicle fatalities (110 x .467) it can be estimated that in Manitoba during 2012, 51 persons died in alcohol-related crashes within 30 days of the collision.
7.1.1 Victim age. Of all the people who died in alcohol-related crashes within 12 months of the collision, 26.0% (see last column of the first section) were aged 20-25 and 26-35; 18.0% were aged 36-45; 16.0% were aged 16-19; 8.0% were aged 46-55; and 6.0% were over age 55.
The highest incidence of alcohol involvement occurred in the crashes in which a person aged 36-45 died (81.8%). The lowest incidence of alcohol involvement was found among the youngest and oldest fatalities as only 0.0% of fatalities among those under 16 and 11.1% of the fatalities over 55 years of age died in crashes involving alcohol.
Age Group<16 10 9 90.0 0 0.0 0.0 9 8 88.9 0 0.0 0.016-19 15 15 100.0 8 53.3 16.0 15 15 100.0 8 53.3 16.020-25 20 19 95.0 13 68.4 26.0 20 19 95.0 13 68.4 26.026-35 19 19 100.0 13 68.4 26.0 19 19 100.0 13 68.4 26.036-45 12 11 91.7 9 81.8 18.0 11 11 100.0 9 81.8 18.046-55 12 10 83.3 4 40.0 8.0 11 10 90.9 4 40.0 8.0>55 27 27 100.0 3 11.1 6.0 25 25 100.0 3 12.0 6.0
GenderMale 77 73 94.8 43 58.9 86.0 73 71 97.3 43 60.6 86.0Female 38 37 97.4 7 18.9 14.0 37 36 97.3 7 19.4 14.0
Victim TypeDriver/ Operator 68 67 98.5 33 49.3 66.0 67 66 98.5 33 50.0 66.0Passenger 28 28 100.0 11 39.3 22.0 27 27 100.0 11 40.7 22.0Pedestrian 18 15 83.3 6 40.0 12.0 15 14 93.3 6 42.9 12.0Unknown 1 0 0.0 0 0.0 0.0 1 0 0.0 0 0.0 0.0
Vehicle OccupiedAutomobiles 48 48 100.0 18 37.5 36.0 46 46 100.0 18 39.1 36.0Trucks/Vans 28 28 100.0 14 50.0 28.0 28 28 100.0 14 50.0 28.0Other Vehicles* 20 18 90.0 11 61.1 22.0 20 18 90.0 11 61.1 22.0(Pedestrians) 18 15 83.3 6 40.0 12.0 15 14 93.3 6 42.9 12.0Unknown 1 1 100.0 1 100.0 2.0 1 1 100.0 1 0.0 2.0
Collision LocationPublic Road 99 98 99.0 43 43.9 86.0 95 95 100.0 43 45.3 86.0Off-road 16 12 75.0 7 58.3 14.0 15 12 80.0 7 58.3 14.0
TOTAL 115 110 95.7 50 45.5 100.0 110 107 97.3 50 46.7 100.0
Persons Dying Within 30 Days of Collision
% of known
Table 7-1Deaths in Alcohol-Related Crashes: Manitoba, 2012
Alcohol-Related Deaths (ARDs)
Alcohol-Related Deaths (ARDs)
% of all ARDs
% of all ARDs
Persons Dying Within 12 Months of Collision
% of known
No. of Deaths
Alcohol Use Known
No. % of total
No.No.
* Motorcyclists and off-road vehicle occupants have been aggregated to ensure that an individual will not be identified.
Category of Victim No. of Deaths No.
Alcohol Use Known
% of total

93
7.1.2 Gender. Of all the people who died in alcohol-related crashes within 12 months of the collision, 86.0% were males. The incidence of alcohol in crashes in which a male died (58.9%) was greater than the incidence of alcohol in crashes in which a female died (18.9%).
7.1.3 Victim type. Of all the people who died in alcohol-related crashes within 12 months of the collision, 66.0% were drivers/operators of a vehicle; 22.0% were passengers; and 12.0% were pedestrians.
Within each of the victim types, the highest incidence of alcohol involvement (49.3%) occurred in the crashes in which a driver/operator died. Alcohol was involved in 40.0% of the crashes in which a pedestrian died and 39.3% of those in which a passenger died.
7.1.4 Type of vehicle occupied. Motorcyclists and off-road vehicle occupants have been regrouped into ‘other vehicles’ to ensure that individuals cannot be identified. Of all the people who died in alcohol-related crashes within 12 months of the collision, 36.0% were automobile occupants; 28.0% were truck/van occupants; and 22.0% were occupants of other vehicles.
Within each of these vehicle types, the incidence of alcohol involvement in which an occupant of another vehicle died was greater than the incidence of alcohol in crashes in which a truck/van occupant or automobile occupant died (61.1% versus 50.0% and 37.5%).
7.1.5 Collision location. Of all the people who died in alcohol-related crashes within 12 months of the collision, 86.0% died in a collision which occurred on a public road and 14.0% died in an off-road collision. However, the incidence of alcohol involvement in which a victim died in an alcohol-related crash was greater for those dying in off-road collisions (58.3%) than it was for persons dying in collisions on public roads (43.9%).
7.2 Alcohol in fatally injured drivers
This section presents information on the presence of alcohol, exclusively among drivers fatally injured within 12 months of the collision in Manitoba during 2012. Table 7-2 shows the information by age group, gender, vehicle type, collision type (single vs. multiple), and duration between crash time and death time (within 12 months vs. within 30 days of the collision).
The first column in the table shows the number of drivers killed. The next columns show the number and percent of these victims who were tested for alcohol. The remaining columns provide information on the results of the alcohol tests – the first three of these present results for drivers who showed any evidence of alcohol; the last three columns present information on drivers who had BACs over the statutory limit of 80 mg%.
To illustrate, among those aged 16-19 there were five drivers killed during 2012; all five of these fatally injured drivers (100.0%) were tested for alcohol. Of those who were tested, two (40.0%) were positive for alcohol. This means fatally injured drinking drivers aged 16-19 accounted for 8.3% of all drinking drivers who were killed.
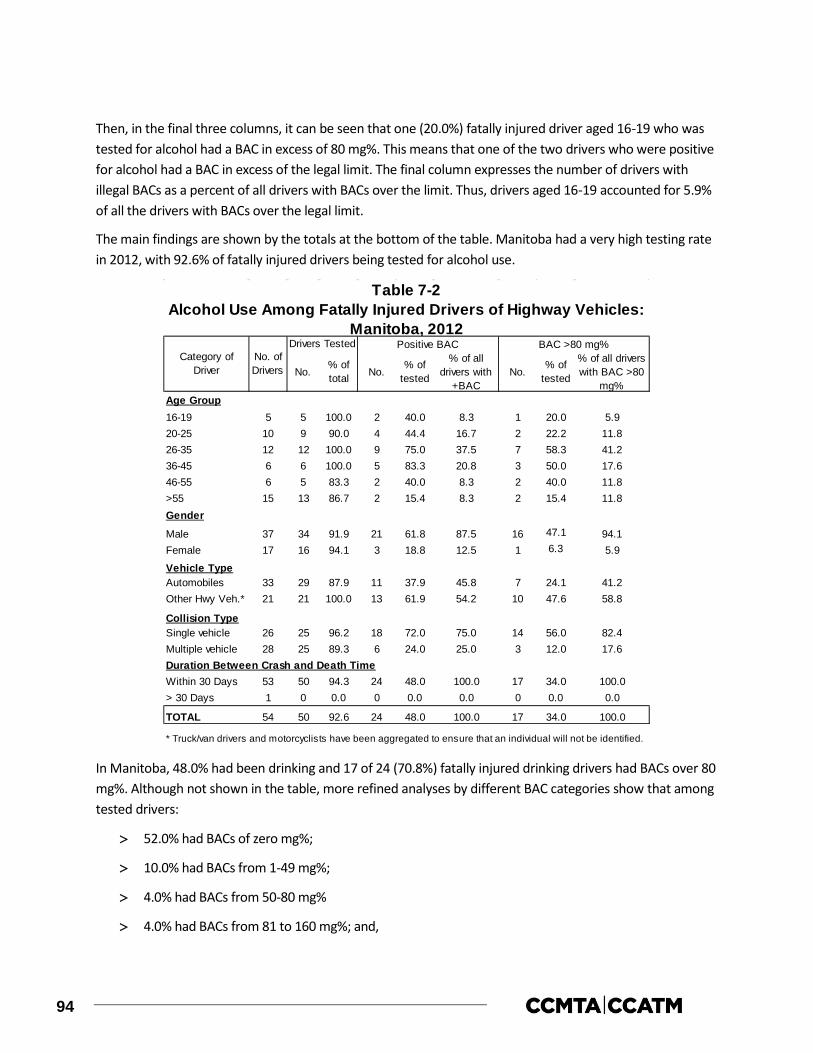
94
Then, in the final three columns, it can be seen that one (20.0%) fatally injured driver aged 16-19 who was tested for alcohol had a BAC in excess of 80 mg%. This means that one of the two drivers who were positive for alcohol had a BAC in excess of the legal limit. The final column expresses the number of drivers with illegal BACs as a percent of all drivers with BACs over the limit. Thus, drivers aged 16-19 accounted for 5.9% of all the drivers with BACs over the legal limit.
The main findings are shown by the totals at the bottom of the table. Manitoba had a very high testing rate in 2012, with 92.6% of fatally injured drivers being tested for alcohol use.
In Manitoba, 48.0% had been drinking and 17 of 24 (70.8%) fatally injured drinking drivers had BACs over 80 mg%. Although not shown in the table, more refined analyses by different BAC categories show that among tested drivers:
> 52.0% had BACs of zero mg%;
> 10.0% had BACs from 1-49 mg%;
> 4.0% had BACs from 50-80 mg%
> 4.0% had BACs from 81 to 160 mg%; and,
Age Group16-19 5 5 100.0 2 40.0 8.3 1 20.0 5.920-25 10 9 90.0 4 44.4 16.7 2 22.2 11.826-35 12 12 100.0 9 75.0 37.5 7 58.3 41.236-45 6 6 100.0 5 83.3 20.8 3 50.0 17.646-55 6 5 83.3 2 40.0 8.3 2 40.0 11.8>55 15 13 86.7 2 15.4 8.3 2 15.4 11.8Gender
Male 37 34 91.9 21 61.8 87.5 16 47.1 94.1Female 17 16 94.1 3 18.8 12.5 1 6.3 5.9
Vehicle TypeAutomobiles 33 29 87.9 11 37.9 45.8 7 24.1 41.2Other Hwy Veh.* 21 21 100.0 13 61.9 54.2 10 47.6 58.8
Collision TypeSingle vehicle 26 25 96.2 18 72.0 75.0 14 56.0 82.4Multiple vehicle 28 25 89.3 6 24.0 25.0 3 12.0 17.6Duration Between Crash and Death TimeWithin 30 Days 53 50 94.3 24 48.0 100.0 17 34.0 100.0> 30 Days 1 0 0.0 0 0.0 0.0 0 0.0 0.0
TOTAL 54 50 92.6 24 48.0 100.0 17 34.0 100.0
* Truck/van drivers and motorcyclists have been aggregated to ensure that an individual will not be identified.
% of tested
Table 7-2Alcohol Use Among Fatally Injured Drivers of Highway Vehicles:
Manitoba, 2012Positive BAC BAC >80 mg%
% of all drivers with
+BAC
% of all drivers with BAC >80
mg%
% of tested No.
Category of Driver
No. of Drivers No.
Drivers Tested
% of total No.

95
> 30.0% had BACs over 160 mg%.
In Figure 7-1, the BAC distribution for tested fatally injured drivers is extrapolated to reflect the BAC distribution for all fatally injured drivers. In this figure, 26 of 54 (48.1%) fatally injured drivers have a positive BAC. And among fatally injured drinking drivers, 18 (69.2%) have BACs over 80 mg%.
7.2.1 Age differences. Of all the fatally injured drinking drivers (i.e., those with a positive BAC), 37.5% were aged 26-35; 20.8% were aged 36-45; 16.7% were aged 20-25; and 8.3% were aged 16-19, 46-55 and over 55.
Of all the fatally injured legally impaired drivers (i.e., those with BACs over 80 mg%), 41.2% were aged 26-35; 17.6% were aged 36-45; 11.8% were aged 20-25, 46-55 and over 55; and 5.9% were aged 16-19.
When comparing the incidence of drinking and driving among fatally injured drivers by age group, fatally injured drivers aged 36-45 were the most likely to have been drinking (83.3%). By contrast, 15.4% of the tested drivers over age 55 had been drinking.
7.2.2 Gender differences. Males dominate the picture as they account for 87.5% of all the fatally injured drivers who had been drinking and 94.1% of all of the fatally injured drivers who were legally impaired.
Males dominate the picture largely because they account for 37 of the 54 drivers (68.5%) who are killed. Fatally injured male drivers were more likely to have been drinking than female drivers (61.8% and 18.8%, respectively). And, 76.2% of the male drivers and 33.3% of the female drivers who were drinking had BACs over the legal limit.
7.2.3 Vehicle differences. Truck/van drivers and motorcyclists have been regrouped into ‘other highway vehicles’ to ensure that individuals cannot be identified. Of all the fatally injured drinking drivers (i.e., those with a positive BAC), 54.2% were drivers of other highway vehicles and 45.8% were automobile drivers. Of all the fatally injured legally impaired drivers (i.e., those with BACs over 80 mg%), 58.8% were drivers of other highway vehicles and 41.2% were automobile drivers.
Within each of the vehicle types, 61.9% of fatally injured drivers of other highway vehicles and 37.9% of automobile drivers had been drinking.
96
7.2.4 Collision differences. Less than half of the drivers killed (26 of the 54) were involved in single-vehicle collisions but these crashes accounted for a vast majority of the drivers who had been drinking or were legally impaired (75.0% and 82.4%, respectively).
The reason for this apparent disparity is because alcohol is overrepresented in single-vehicle crashes. Almost three-quarters of the drivers involved in single-vehicle crashes (72.0%) were positive for alcohol compared to 24.0% of those involved in multiple-vehicle collisions.
7.2.5 Duration between crash and death time. Given that only one fatally injured driver died more than 30 days after the collision, and this driver was not tested for alcohol, a comparison of alcohol use among drivers based on differences in the duration between crash time and death time cannot be performed.
7.3 Drivers involved in alcohol-related serious injury crashes
This section presents information on drivers involved in alcohol-related crashes in which someone was seriously injured in 2012 in Manitoba. A “surrogate” or “indirect” measure is used to estimate alcohol involvement because drivers in serious injury crashes are seldom tested for alcohol. A driver is identified as having been involved in an alcohol-related serious injury crash if the crash in which someone was seriously injured involved a single vehicle at night (SVN), or if, in the case of a non-SVN serious injury crash, the police reported alcohol involvement – i.e., at least one drinking driver in the crash (see Section 2.2.4).
The results are shown in Table 7-3 for drivers grouped in terms of age, gender, type of vehicle driven, and type of collision. The first column shows the number of drivers involved in serious injury crashes. The number and percent of drivers in such crashes that involved alcohol is shown in the next two columns. The final column expresses the number of drivers involved in alcohol-related serious injury crashes in any row as a percent of all drivers involved in alcohol- related serious injury crashes.
As shown, by the totals at the bottom of the table, 448 drivers were involved in crashes in which someone was seriously injured, and among these 10.7% were alcohol-related crashes.
7.3.1 Driver age. Of all the drivers involved in alcohol-related serious injury crashes, 29.2% were aged 20-25; 18.8% were aged 26-35 and over 55; and 14.6% were aged 16-19 and 36-45. Drivers aged 46-55 accounted for 4.2% of those involved in alcohol-related serious injury crashes.
Approximately one-fifth of the drivers aged 20-25 were involved in alcohol-related serious injury crashes (20.3%). The lowest incidence of involvement in alcohol-related crashes was found for those under 16 (0.0%).
7.3.2 Driver gender. Of all the drivers involved in alcohol-related serious injury crashes, 66.7% were males. The incidence of involvement in alcohol-related serious injury crashes was greater for males than for females (11.9% and 8.9%).
7.3.3 Type of vehicle driven. Of all the drivers involved in alcohol-related serious injury crashes, 62.5% were automobile drivers; 31.3% were truck/van drivers; 4.2% were motorcyclists; and 2.1% were off-road vehicle drivers.
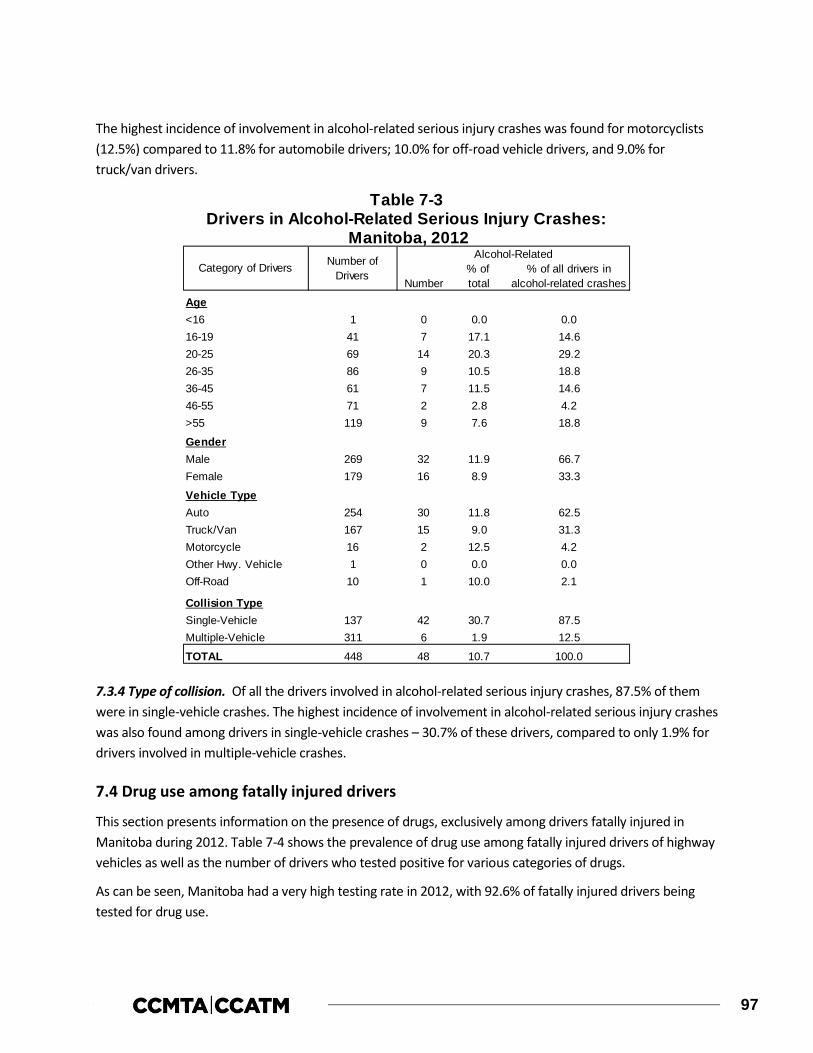
97
The highest incidence of involvement in alcohol-related serious injury crashes was found for motorcyclists (12.5%) compared to 11.8% for automobile drivers; 10.0% for off-road vehicle drivers, and 9.0% for truck/van drivers.
7.3.4 Type of collision. Of all the drivers involved in alcohol-related serious injury crashes, 87.5% of them were in single-vehicle crashes. The highest incidence of involvement in alcohol-related serious injury crashes was also found among drivers in single-vehicle crashes – 30.7% of these drivers, compared to only 1.9% for drivers involved in multiple-vehicle crashes.
7.4 Drug use among fatally injured drivers
This section presents information on the presence of drugs, exclusively among drivers fatally injured in Manitoba during 2012. Table 7-4 shows the prevalence of drug use among fatally injured drivers of highway vehicles as well as the number of drivers who tested positive for various categories of drugs.
As can be seen, Manitoba had a very high testing rate in 2012, with 92.6% of fatally injured drivers being tested for drug use.
% of % of all drivers inNumber total alcohol-related crashes
Age<16 1 0 0.0 0.016-19 41 7 17.1 14.620-25 69 14 20.3 29.226-35 86 9 10.5 18.836-45 61 7 11.5 14.646-55 71 2 2.8 4.2>55 119 9 7.6 18.8
GenderMale 269 32 11.9 66.7Female 179 16 8.9 33.3
Vehicle TypeAuto 254 30 11.8 62.5Truck/Van 167 15 9.0 31.3Motorcycle 16 2 12.5 4.2Other Hwy. Vehicle 1 0 0.0 0.0Off-Road 10 1 10.0 2.1
Collision TypeSingle-Vehicle 137 42 30.7 87.5Multiple-Vehicle 311 6 1.9 12.5
TOTAL 448 48 10.7 100.0
Table 7-3Drivers in Alcohol-Related Serious Injury Crashes:
Manitoba, 2012Category of Drivers Number of
Drivers
Alcohol-Related
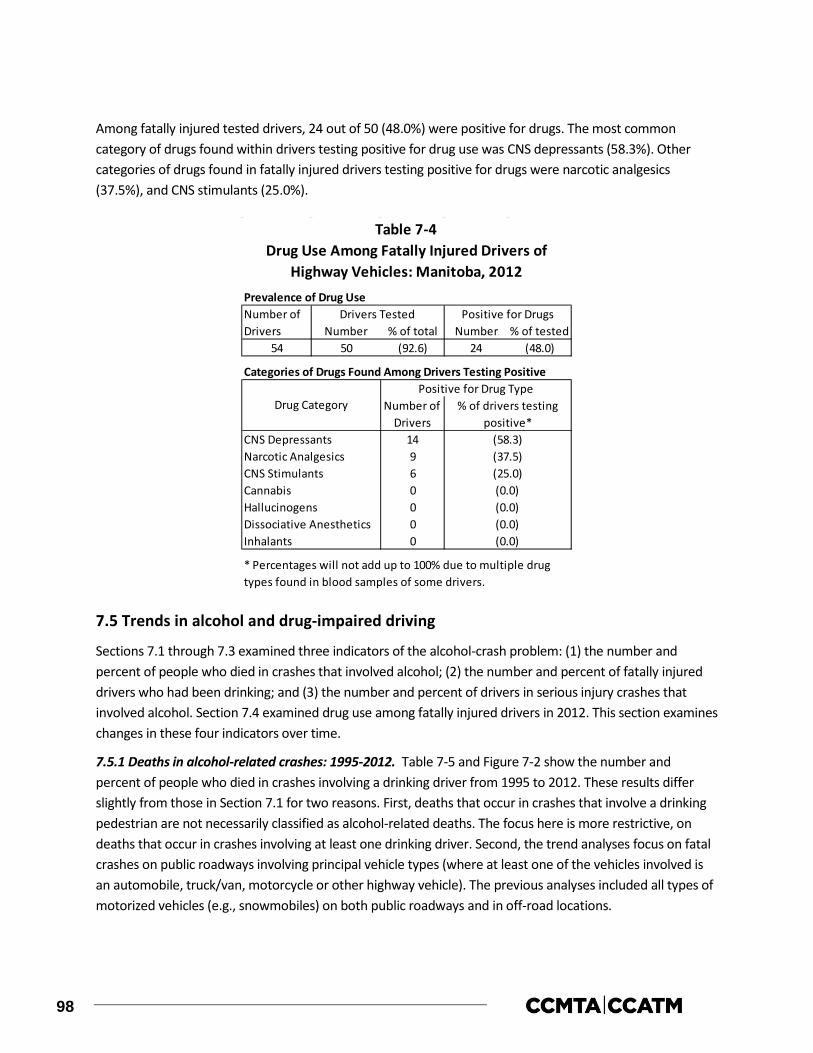
98
Among fatally injured tested drivers, 24 out of 50 (48.0%) were positive for drugs. The most common category of drugs found within drivers testing positive for drug use was CNS depressants (58.3%). Other categories of drugs found in fatally injured drivers testing positive for drugs were narcotic analgesics (37.5%), and CNS stimulants (25.0%).
7.5 Trends in alcohol and drug-impaired driving
Sections 7.1 through 7.3 examined three indicators of the alcohol-crash problem: (1) the number and percent of people who died in crashes that involved alcohol; (2) the number and percent of fatally injured drivers who had been drinking; and (3) the number and percent of drivers in serious injury crashes that involved alcohol. Section 7.4 examined drug use among fatally injured drivers in 2012. This section examines changes in these four indicators over time.
7.5.1 Deaths in alcohol-related crashes: 1995-2012. Table 7-5 and Figure 7-2 show the number and percent of people who died in crashes involving a drinking driver from 1995 to 2012. These results differ slightly from those in Section 7.1 for two reasons. First, deaths that occur in crashes that involve a drinking pedestrian are not necessarily classified as alcohol-related deaths. The focus here is more restrictive, on deaths that occur in crashes involving at least one drinking driver. Second, the trend analyses focus on fatal crashes on public roadways involving principal vehicle types (where at least one of the vehicles involved is an automobile, truck/van, motorcycle or other highway vehicle). The previous analyses included all types of motorized vehicles (e.g., snowmobiles) on both public roadways and in off-road locations.
Prevalence of Drug Use
Number % of total Number % of tested54 50 (92.6) 24 (48.0)
Categories of Drugs Found Among Drivers Testing Positive
149600
Dissociative Anesthetics 00
Drug Use Among Fatally Injured Drivers of Highway Vehicles: Manitoba, 2012
Table 7-4
CNS DepressantsNarcotic Analgesics
Cannabis (0.0)
Drivers TestedNumber of Drivers
Positive for Drugs
CNS Stimulants
Drug Category
Hallucinogens
% of drivers testing positive*
* Percentages will not add up to 100% due to multiple drug types found in blood samples of some drivers.
Positive for Drug TypeNumber of
Drivers(58.3)(37.5)(25.0)
Inhalants (0.0)
(0.0)(0.0)

99
As shown in the table and figure, the number of deaths in crashes that involved a drinking driver generally dropped from 46 to a low of 29 between 1995 and 2001. The number of alcohol-related fatalities generally increased to 46 in 2007, decreased to 34 in 2009, rose to 42 in 2011, and decreased to 38 in 2012. The percentage of alcohol-related fatalities increased from 34.8% in 1995 to 40.2% in 2003, decreased to a low of 28.0% in 2005, peaked in 2008 (55.7%), decreased to 38.2% in 2009, rose to 42.0% in 2010, decreased to 37.5% in 2011, and rose to 38.4% in 2012.
As shown at the bottom of the table, during the 2006-2010 baseline period there was an average of 41 fatalities involving a drinking driver and they accounted for 41.8% of all fatalities. This means that the percent of fatalities involving a drinking driver decreased by 9.8% from 41.8% in the baseline period (2006-2010) to 37.7% in the 2011-2012 period. In terms of the number of persons killed in crashes involving a drinking driver, there was a 2.4% decrease from an average of 41 in the baseline period (2006-2010) to 40 in the 2011-2012 period.
Number % of total Number % of total1995 132 46 34.8 129 45 34.9
1996 96 36 37.5 95 36 37.9
1997 115 42 36.5 115 42 36.5
1998 124 36 29.0 119 35 29.4
1999 114 39 34.2 113 39 34.5
2000 115 34 29.6 111 34 30.6
2001 94 29 30.9 93 29 31.2
2002 110 35 31.8 109 35 32.1
2003 107 43 40.2 105 42 40.0
2004 102 39 38.2 98 39 39.8
2005 107 30 28.0 107 30 28.0
2006 123 45 36.6 119 44 37.0
2007 109 46 42.2 107 45 42.1
2008 79 44 55.7 78 44 56.4
2009 89 34 38.2 88 34 38.6
2010 88 37 42.0 87 36 41.4
2011 112 42 37.5 109 41 37.6
2012 99 38 38.4 95 37 38.92006-2010baseline
2011-2012period
** only on public roadways involving principal vehicle types.
38.2106 40 37.7 102 39
* numbers are estimates based on the percent of deaths for which information was available to determine alcohol use.
Number of Deaths
Alcohol-Related Deaths
Persons Dying Within 30 Days of Collision
Table 7-5Number* and Percent of Motor Vehicle Deaths** Involving a
Drinking Driver: Manitoba, 1995-2012
Alcohol-Related Deaths
Persons Dying Within 12 Months of Collision
Year of Death
Number of Deaths
98 41 41.8 96 41 42.7
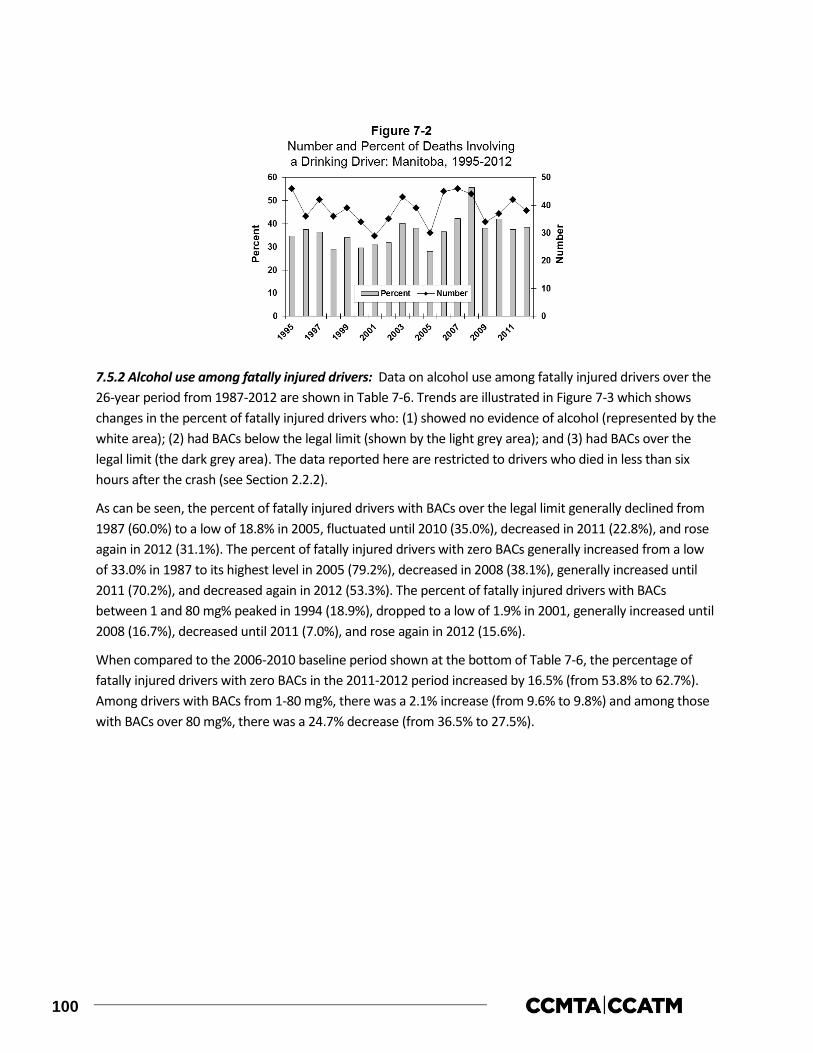
100
7.5.2 Alcohol use among fatally injured drivers: Data on alcohol use among fatally injured drivers over the 26-year period from 1987-2012 are shown in Table 7-6. Trends are illustrated in Figure 7-3 which shows changes in the percent of fatally injured drivers who: (1) showed no evidence of alcohol (represented by the white area); (2) had BACs below the legal limit (shown by the light grey area); and (3) had BACs over the legal limit (the dark grey area). The data reported here are restricted to drivers who died in less than six hours after the crash (see Section 2.2.2).
As can be seen, the percent of fatally injured drivers with BACs over the legal limit generally declined from 1987 (60.0%) to a low of 18.8% in 2005, fluctuated until 2010 (35.0%), decreased in 2011 (22.8%), and rose again in 2012 (31.1%). The percent of fatally injured drivers with zero BACs generally increased from a low of 33.0% in 1987 to its highest level in 2005 (79.2%), decreased in 2008 (38.1%), generally increased until 2011 (70.2%), and decreased again in 2012 (53.3%). The percent of fatally injured drivers with BACs between 1 and 80 mg% peaked in 1994 (18.9%), dropped to a low of 1.9% in 2001, generally increased until 2008 (16.7%), decreased until 2011 (7.0%), and rose again in 2012 (15.6%).
When compared to the 2006-2010 baseline period shown at the bottom of Table 7-6, the percentage of fatally injured drivers with zero BACs in the 2011-2012 period increased by 16.5% (from 53.8% to 62.7%). Among drivers with BACs from 1-80 mg%, there was a 2.1% increase (from 9.6% to 9.8%) and among those with BACs over 80 mg%, there was a 24.7% decrease (from 36.5% to 27.5%).
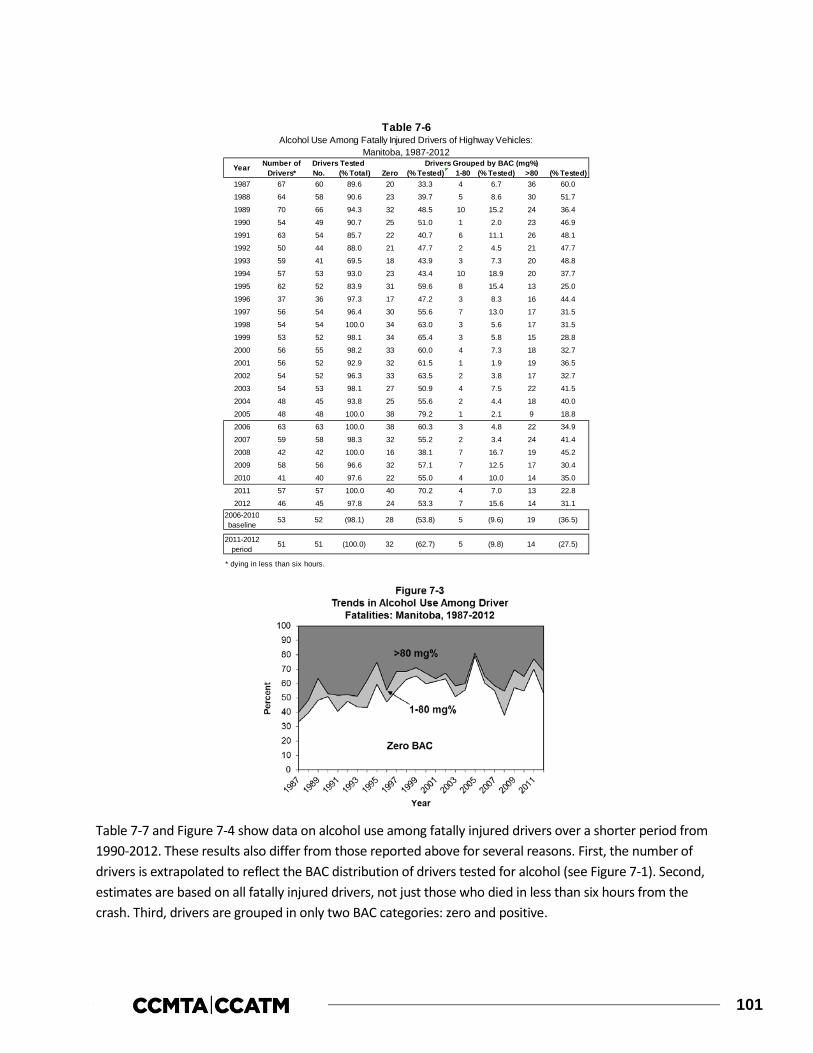
101
Table 7-7 and Figure 7-4 show data on alcohol use among fatally injured drivers over a shorter period from 1990-2012. These results also differ from those reported above for several reasons. First, the number of drivers is extrapolated to reflect the BAC distribution of drivers tested for alcohol (see Figure 7-1). Second, estimates are based on all fatally injured drivers, not just those who died in less than six hours from the crash. Third, drivers are grouped in only two BAC categories: zero and positive.
No. (% Total) Zero (% Tested) 1-80 (% Tested) >80 (% Tested)1987 67 60 89.6 20 33.3 4 6.7 36 60.0
1988 64 58 90.6 23 39.7 5 8.6 30 51.7
1989 70 66 94.3 32 48.5 10 15.2 24 36.4
1990 54 49 90.7 25 51.0 1 2.0 23 46.9
1991 63 54 85.7 22 40.7 6 11.1 26 48.1
1992 50 44 88.0 21 47.7 2 4.5 21 47.7
1993 59 41 69.5 18 43.9 3 7.3 20 48.8
1994 57 53 93.0 23 43.4 10 18.9 20 37.7
1995 62 52 83.9 31 59.6 8 15.4 13 25.0
1996 37 36 97.3 17 47.2 3 8.3 16 44.4
1997 56 54 96.4 30 55.6 7 13.0 17 31.5
1998 54 54 100.0 34 63.0 3 5.6 17 31.5
1999 53 52 98.1 34 65.4 3 5.8 15 28.8
2000 56 55 98.2 33 60.0 4 7.3 18 32.7
2001 56 52 92.9 32 61.5 1 1.9 19 36.5
2002 54 52 96.3 33 63.5 2 3.8 17 32.7
2003 54 53 98.1 27 50.9 4 7.5 22 41.5
2004 48 45 93.8 25 55.6 2 4.4 18 40.0
2005 48 48 100.0 38 79.2 1 2.1 9 18.8
2006 63 63 100.0 38 60.3 3 4.8 22 34.9
2007 59 58 98.3 32 55.2 2 3.4 24 41.4
2008 42 42 100.0 16 38.1 7 16.7 19 45.2
2009 58 56 96.6 32 57.1 7 12.5 17 30.4
2010 41 40 97.6 22 55.0 4 10.0 14 35.0
2011 57 57 100.0 40 70.2 4 7.0 13 22.8
2012 46 45 97.8 24 53.3 7 15.6 14 31.12006-2010baseline
2011-2012period
* dying in less than six hours.
Table 7-6
Drivers Grouped by BAC (mg%)
Alcohol Use Among Fatally Injured Drivers of Highway Vehicles:Manitoba, 1987-2012
28 (53.8) 5 (9.6) 19 (36.5)
Year Number of Drivers*
Drivers Tested
53 52 (98.1)
5 (9.8) 14 (27.5)51 51 (100.0) 32 (62.7)
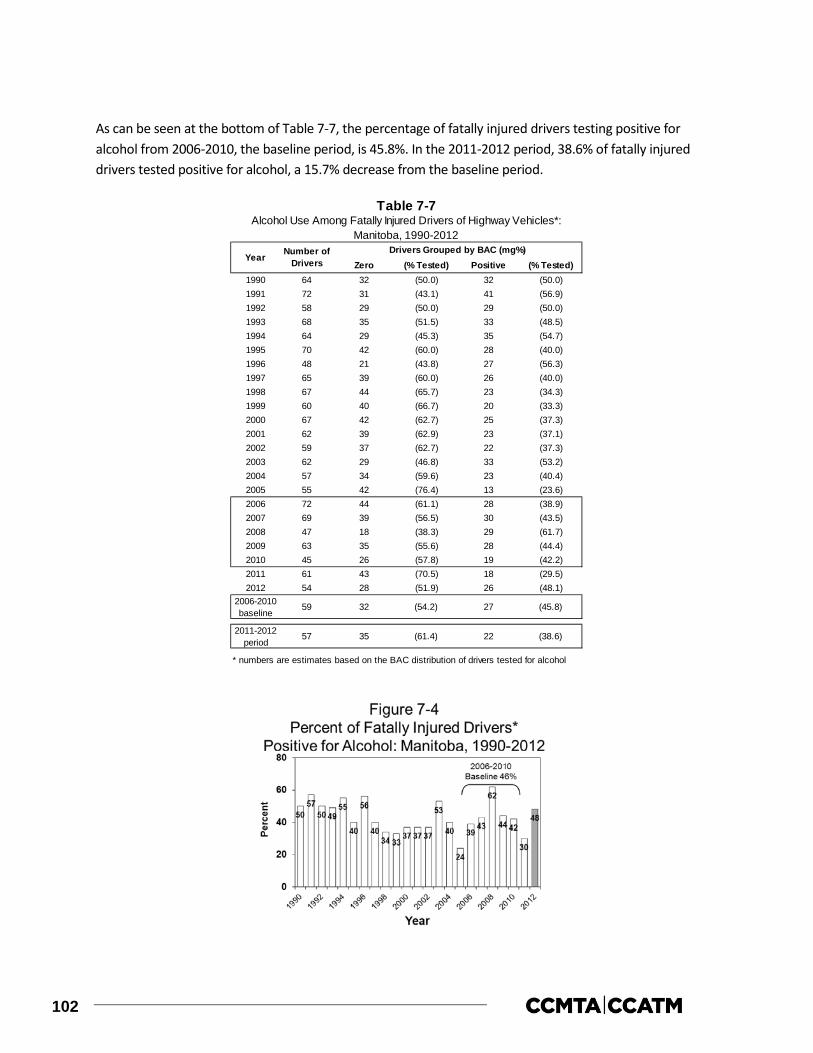
102
As can be seen at the bottom of Table 7-7, the percentage of fatally injured drivers testing positive for alcohol from 2006-2010, the baseline period, is 45.8%. In the 2011-2012 period, 38.6% of fatally injured drivers tested positive for alcohol, a 15.7% decrease from the baseline period.
Zero (% Tested) Positive (% Tested)1990 64 32 (50.0) 32 (50.0)1991 72 31 (43.1) 41 (56.9)1992 58 29 (50.0) 29 (50.0)1993 68 35 (51.5) 33 (48.5)1994 64 29 (45.3) 35 (54.7)1995 70 42 (60.0) 28 (40.0)1996 48 21 (43.8) 27 (56.3)1997 65 39 (60.0) 26 (40.0)1998 67 44 (65.7) 23 (34.3)1999 60 40 (66.7) 20 (33.3)2000 67 42 (62.7) 25 (37.3)2001 62 39 (62.9) 23 (37.1)2002 59 37 (62.7) 22 (37.3)2003 62 29 (46.8) 33 (53.2)2004 57 34 (59.6) 23 (40.4)2005 55 42 (76.4) 13 (23.6)2006 72 44 (61.1) 28 (38.9)2007 69 39 (56.5) 30 (43.5)2008 47 18 (38.3) 29 (61.7)2009 63 35 (55.6) 28 (44.4)2010 45 26 (57.8) 19 (42.2)2011 61 43 (70.5) 18 (29.5)2012 54 28 (51.9) 26 (48.1)
2006-2010baseline
2011-2012period
* numbers are estimates based on the BAC distribution of drivers tested for alcohol
Table 7-7Alcohol Use Among Fatally Injured Drivers of Highway Vehicles*:
Manitoba, 1990-2012
Year Number of Drivers
Drivers Grouped by BAC (mg%)
59 32 (54.2) 27 (45.8)
57 35 (61.4) 22 (38.6)
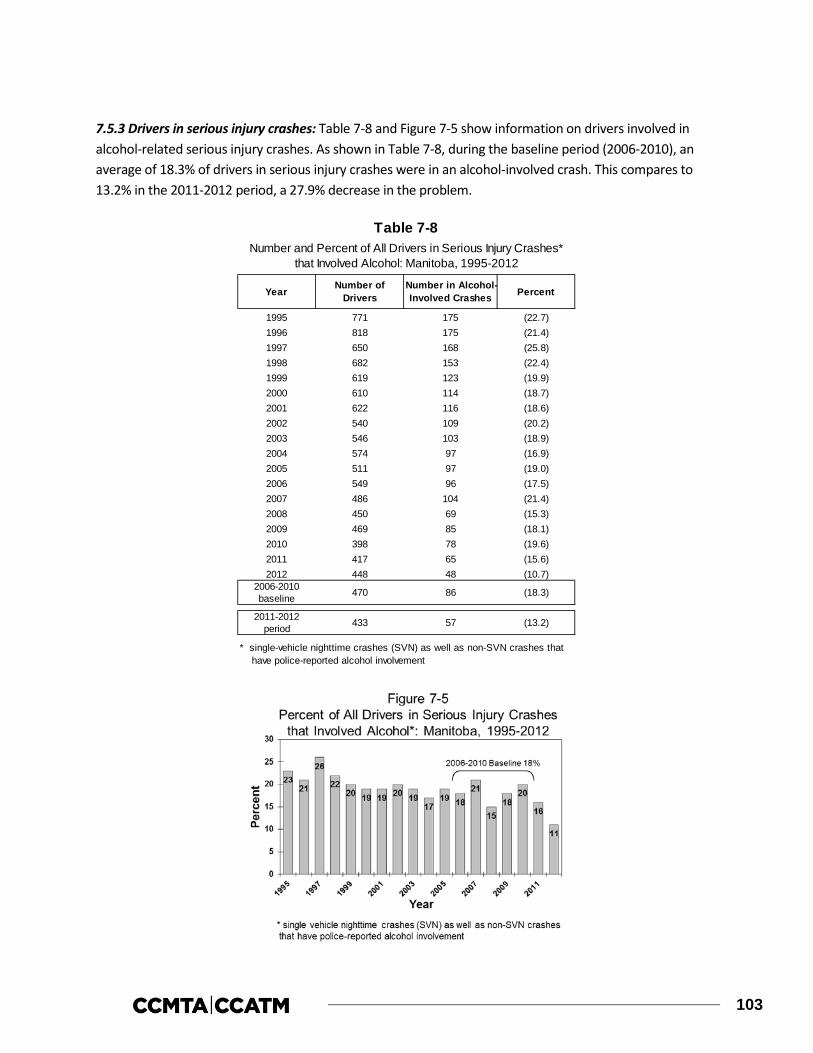
103
7.5.3 Drivers in serious injury crashes: Table 7-8 and Figure 7-5 show information on drivers involved in alcohol-related serious injury crashes. As shown in Table 7-8, during the baseline period (2006-2010), an average of 18.3% of drivers in serious injury crashes were in an alcohol-involved crash. This compares to 13.2% in the 2011-2012 period, a 27.9% decrease in the problem.
Year Number of Drivers
Number in Alcohol-Involved Crashes Percent
1995 771 175 (22.7)1996 818 175 (21.4)1997 650 168 (25.8)1998 682 153 (22.4)1999 619 123 (19.9)2000 610 114 (18.7)2001 622 116 (18.6)2002 540 109 (20.2)2003 546 103 (18.9)2004 574 97 (16.9)2005 511 97 (19.0)2006 549 96 (17.5)2007 486 104 (21.4)2008 450 69 (15.3)2009 469 85 (18.1)2010 398 78 (19.6)2011 417 65 (15.6)2012 448 48 (10.7)
2006-2010baseline
2011-2012period
* single-vehicle nighttime crashes (SVN) as well as non-SVN crashes that have police-reported alcohol involvement
433 57 (13.2)
Table 7-8Number and Percent of All Drivers in Serious Injury Crashes*
that Involved Alcohol: Manitoba, 1995-2012
470 86 (18.3)

104
Table 7-9 and Figure 7-6 also show information on drivers involved in alcohol-related serious injury crashes. These results differ slightly from those in Section 7.3 and in Table 7-8 and Figure 7-5 above because they exclude certain vehicle types – e.g., bicycles, snowmobiles, farm tractors and other non-highway vehicles.
As can be seen, the incidence of alcohol-involvement in serious injury crashes has generally declined. Between 1995 and 2004 the percentage of all drivers in serious injury crashes that involved alcohol generally decreased from 22.9% to 17.3%, rose to 22.1% in 2007, decreased to 15.6% in 2008, rose to 18.8% in 2009, and decreased again to 10.7% in 2012.
In the baseline period (2006-2010), an average of 18.4% of drivers in serious injury crashes were in an alcohol-involved crash. During the 2011-2012 period, the incidence of drivers in alcohol-involved crashes dropped to 13.1%, a 28.8% decrease.
Number ofDrivers
1995 743 170 (22.9)1996 804 174 (21.6)1997 630 162 (25.7)1998 657 151 (23.0)1999 595 120 (20.2)2000 587 110 (18.7)2001 597 115 (19.3)2002 525 108 (20.6)2003 532 102 (19.2)2004 550 95 (17.3)2005 482 92 (19.1)2006 526 91 (17.3)2007 467 103 (22.1)2008 437 68 (15.6)2009 452 85 (18.8)2010 341 63 (18.5)2011 403 63 (15.6)2012 438 47 (10.7)
2006-2010baseline
2011-2012period
** single-vehicle nighttime crashes (SVN) as well as non-SVN crashes that have police-reported alcohol involvement
* excludes operators of bicycles, snowmobiles, farm tractors, and other non-highway vehicles.
445 82 (18.4)
Table 7-9Number and Percent of Drivers* of Highway Vehicles in Serious
Injury Crashes** that Involved Alcohol: Manitoba, 1995-2012
Year PercentNumber in Alcohol-Involved Crashes
421 55 (13.1)
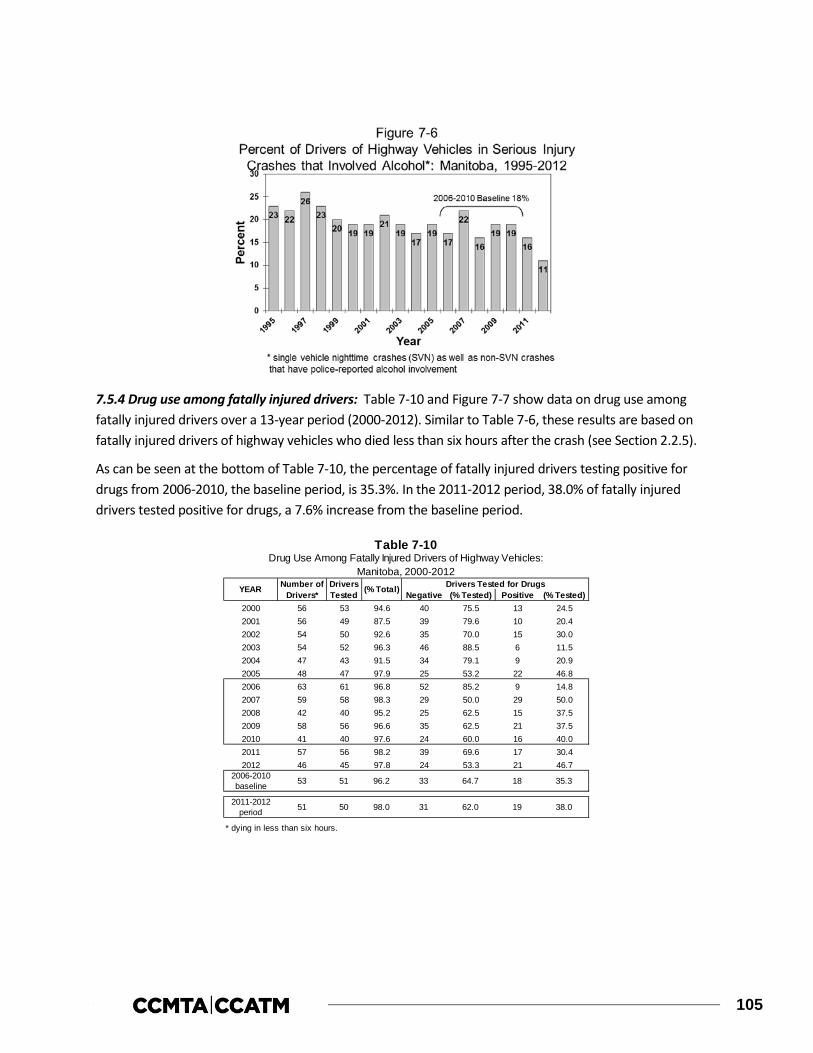
105
7.5.4 Drug use among fatally injured drivers: Table 7-10 and Figure 7-7 show data on drug use among fatally injured drivers over a 13-year period (2000-2012). Similar to Table 7-6, these results are based on fatally injured drivers of highway vehicles who died less than six hours after the crash (see Section 2.2.5).
As can be seen at the bottom of Table 7-10, the percentage of fatally injured drivers testing positive for drugs from 2006-2010, the baseline period, is 35.3%. In the 2011-2012 period, 38.0% of fatally injured drivers tested positive for drugs, a 7.6% increase from the baseline period.
Negative (% Tested) Positive (% Tested)2000 56 53 94.6 40 75.5 13 24.52001 56 49 87.5 39 79.6 10 20.42002 54 50 92.6 35 70.0 15 30.02003 54 52 96.3 46 88.5 6 11.52004 47 43 91.5 34 79.1 9 20.92005 48 47 97.9 25 53.2 22 46.82006 63 61 96.8 52 85.2 9 14.82007 59 58 98.3 29 50.0 29 50.02008 42 40 95.2 25 62.5 15 37.52009 58 56 96.6 35 62.5 21 37.52010 41 40 97.6 24 60.0 16 40.02011 57 56 98.2 39 69.6 17 30.42012 46 45 97.8 24 53.3 21 46.7
2006-2010baseline
2011-2012period
* dying in less than six hours.
Table 7-10
YEAR Number of Drivers*
Drivers Tested (% Total) Drivers Tested for Drugs
18 35.3
Drug Use Among Fatally Injured Drivers of Highway Vehicles: Manitoba, 2000-2012
53 51 96.2 33 64.7
19 38.051 50 98.0 31 62.0

106
107
8.0 ONTARIO
This section of the report reviews the major findings on alcohol involvement in fatal and serious injury motor vehicle collisions as well as drug involvement in fatal motor vehicle collisions in Ontario during 2012. It describes data on:
> people who were killed in alcohol-related crashes (Section 8.1);
> alcohol use among fatally injured drivers (Section 8.2);
> drivers involved in alcohol-related serious injury crashes (Section 8.3);
> drug use among fatally injured drivers (Section 8.4); and,
> trends in the alcohol-crash and drug-crash problems (Section 8.5).
8.1 Deaths in alcohol-related crashes
Table 8-1 presents information on people who died in alcohol-related crashes in Ontario during 2012 for persons dying within 12 months of the collision (one calendar year) and for persons dying within 30 days of the collision. Motor vehicle deaths are categorized in terms of the victim’s age, gender, type (i.e., driver, passenger, pedestrian) and the type of vehicle they occupied. In each section, the first column in the table presents the number of deaths. The next two columns show the number and percent of these fatalities in which sufficient information was available to determine if alcohol was involved. A motor vehicle fatality was considered to be alcohol involved if there was at least one drinking driver or drinking pedestrian in the fatal crash.
For example, within the first section, it can be seen that among persons dying within 12 months of the collision, 102 people aged 26-35 were killed in motor vehicle crashes in Ontario during 2012. And, in 94 cases (92.2%) it was possible to determine if alcohol was a factor in the crash. The next column shows the number of people killed in crashes that were known to be alcohol-involved. In 2012, 46 people aged 26-35 died in alcohol-related crashes in Ontario. The next column expresses this as a percentage – i.e., 48.9% of the 26-35 year olds who were killed died in an alcohol-related crash.
The final column (percent of all alcohol-related deaths) expresses the number of deaths in alcohol-related crashes as a percent of all the deaths in such crashes. For example, the alcohol-related deaths among 26-35 year olds represent 22.2% of all the people killed in alcohol-related crashes in Ontario during 2012.
An examination of the section for persons dying within 30 days of the collision shows that 102 persons aged 26-35 died in motor vehicle crashes. In 94 of these cases (92.2%), it was possible to determine if alcohol was a factor in the crash. Among these persons, 46 (48.9%) were alcohol-related deaths. And 26-35 year olds accounted for 22.2% of people dying in alcohol-related crashes.
The totals at the bottom of the table provide a summary. As can be seen, 728 persons died within 12 months of a motor vehicle crash in Ontario during 2012. In 651 (89.4%) of these cases, it was possible to
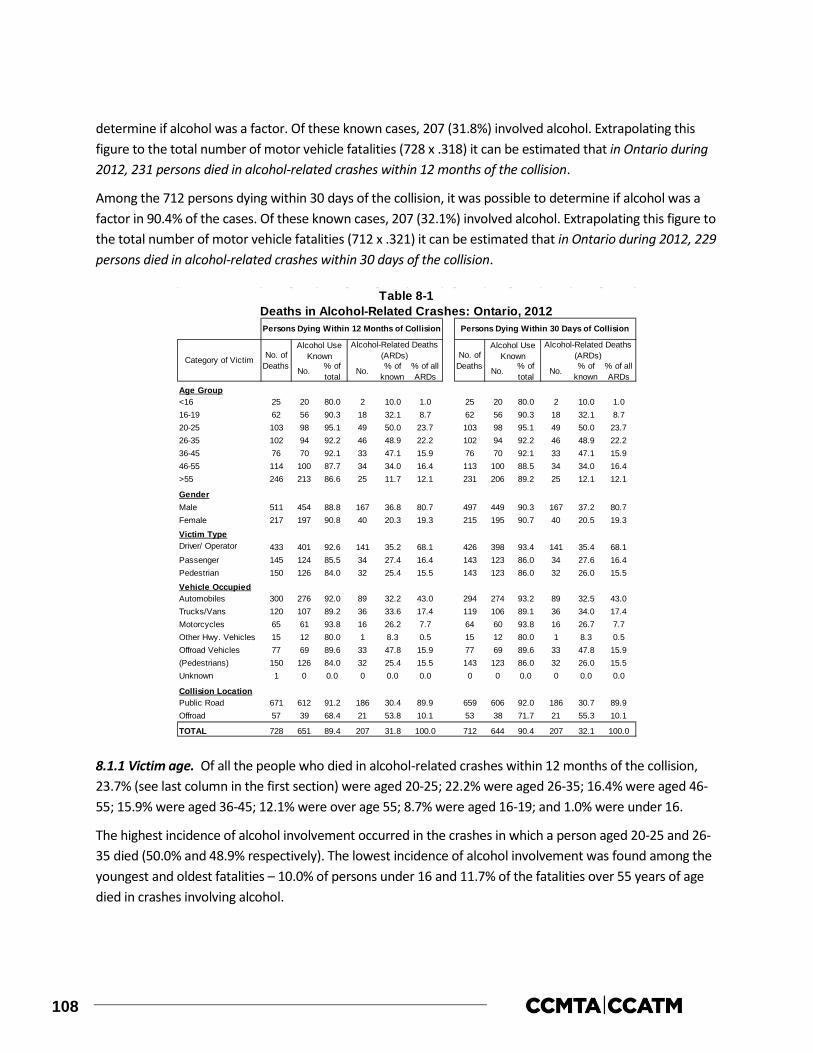
108
determine if alcohol was a factor. Of these known cases, 207 (31.8%) involved alcohol. Extrapolating this figure to the total number of motor vehicle fatalities (728 x .318) it can be estimated that in Ontario during 2012, 231 persons died in alcohol-related crashes within 12 months of the collision.
Among the 712 persons dying within 30 days of the collision, it was possible to determine if alcohol was a factor in 90.4% of the cases. Of these known cases, 207 (32.1%) involved alcohol. Extrapolating this figure to the total number of motor vehicle fatalities (712 x .321) it can be estimated that in Ontario during 2012, 229 persons died in alcohol-related crashes within 30 days of the collision.
8.1.1 Victim age. Of all the people who died in alcohol-related crashes within 12 months of the collision, 23.7% (see last column in the first section) were aged 20-25; 22.2% were aged 26-35; 16.4% were aged 46-55; 15.9% were aged 36-45; 12.1% were over age 55; 8.7% were aged 16-19; and 1.0% were under 16.
The highest incidence of alcohol involvement occurred in the crashes in which a person aged 20-25 and 26-35 died (50.0% and 48.9% respectively). The lowest incidence of alcohol involvement was found among the youngest and oldest fatalities – 10.0% of persons under 16 and 11.7% of the fatalities over 55 years of age died in crashes involving alcohol.
Age Group<16 25 20 80.0 2 10.0 1.0 25 20 80.0 2 10.0 1.016-19 62 56 90.3 18 32.1 8.7 62 56 90.3 18 32.1 8.720-25 103 98 95.1 49 50.0 23.7 103 98 95.1 49 50.0 23.726-35 102 94 92.2 46 48.9 22.2 102 94 92.2 46 48.9 22.236-45 76 70 92.1 33 47.1 15.9 76 70 92.1 33 47.1 15.946-55 114 100 87.7 34 34.0 16.4 113 100 88.5 34 34.0 16.4>55 246 213 86.6 25 11.7 12.1 231 206 89.2 25 12.1 12.1
GenderMale 511 454 88.8 167 36.8 80.7 497 449 90.3 167 37.2 80.7Female 217 197 90.8 40 20.3 19.3 215 195 90.7 40 20.5 19.3
Victim TypeDriver/ Operator 433 401 92.6 141 35.2 68.1 426 398 93.4 141 35.4 68.1Passenger 145 124 85.5 34 27.4 16.4 143 123 86.0 34 27.6 16.4Pedestrian 150 126 84.0 32 25.4 15.5 143 123 86.0 32 26.0 15.5
Vehicle OccupiedAutomobiles 300 276 92.0 89 32.2 43.0 294 274 93.2 89 32.5 43.0Trucks/Vans 120 107 89.2 36 33.6 17.4 119 106 89.1 36 34.0 17.4Motorcycles 65 61 93.8 16 26.2 7.7 64 60 93.8 16 26.7 7.7Other Hwy. Vehicles 15 12 80.0 1 8.3 0.5 15 12 80.0 1 8.3 0.5Offroad Vehicles 77 69 89.6 33 47.8 15.9 77 69 89.6 33 47.8 15.9(Pedestrians) 150 126 84.0 32 25.4 15.5 143 123 86.0 32 26.0 15.5Unknown 1 0 0.0 0 0.0 0.0 0 0 0.0 0 0.0 0.0
Collision LocationPublic Road 671 612 91.2 186 30.4 89.9 659 606 92.0 186 30.7 89.9Offroad 57 39 68.4 21 53.8 10.1 53 38 71.7 21 55.3 10.1
TOTAL 728 651 89.4 207 31.8 100.0 712 644 90.4 207 32.1 100.0
Persons Dying Within 30 Days of Collision
% of known
Table 8-1Deaths in Alcohol-Related Crashes: Ontario, 2012
Alcohol-Related Deaths (ARDs)
Alcohol-Related Deaths (ARDs)
% of all ARDs
% of all ARDs
Persons Dying Within 12 Months of Collision
% of known
No. of Deaths
Alcohol Use Known
No. % of total
No.Category of Victim No. of
Deaths No.
Alcohol Use Known
% of total
No.

109
8.1.2 Gender. Of all the people who died in alcohol-related crashes within 12 months of the collision, 80.7% were males. The incidence of alcohol in crashes in which a male died (36.8%) was greater than the incidence of alcohol in crashes in which a female died (20.3%).
8.1.3 Victim type. Of all the people who died in alcohol-related crashes within 12 months of the collision, 68.1% were driver/operators of a vehicle; 16.4% were passengers; and 15.5% were pedestrians.
Within each of the victim types, the highest incidence of alcohol involvement (35.2%) occurred in the crashes in which a driver/operator died. Alcohol was involved in 27.4% of the crashes in which a passenger died and 25.4% of the crashes in which a pedestrian died.
8.1.4 Type of vehicle occupied. Of all the people who died in alcohol-related crashes within 12 months of the collision, 43.0% were in an automobile; 17.4% were truck/van occupants; 15.9% were off-road vehicle occupants; and 7.7% were motorcyclists.
Within each of these vehicle types, the incidence of alcohol involvement in which a truck/van occupant died was greater than the incidence of alcohol in crashes in which an automobile occupant or motorcyclist died (33.6% versus 32.2% and 26.2%). Among off-road vehicle occupants, 47.8% were involved in an alcohol-related crash.
8.1.5 Collision location. Of all the people who died in alcohol-related crashes within 12 months of the collision, 89.9% died in a collision which occurred on a public road and 10.1% died in an off-road collision. However, the incidence of alcohol involvement in which a victim died in an alcohol-related crash was greater for those dying in off-road collisions (53.8%) than it was for persons dying in a collision which occurred on a public road (30.4%).
8.2 Alcohol in fatally injured drivers
This section presents information on the presence of alcohol, exclusively among drivers fatally injured within 12 months of the collision in Ontario during 2012. Table 8-2 shows the information by age group, gender, vehicle type, collision type (single vs. multiple), and duration between crash time and death time (within 12 months vs. within 30 days of the collision).
The first column in the table shows the number of drivers killed. The next columns show the number and percent of these victims who were tested for alcohol. The remaining columns provide information on the results of the alcohol tests: the first three of these present results for drivers who showed any evidence of alcohol; the last three columns present information on drivers who had BACs over the statutory limit of 80 mg%.
To illustrate, among 20-25 year olds there were 54 drivers killed during 2012; 50 of these fatally injured drivers (92.6%) were tested for alcohol. Of those who were tested, 21 (42.0%) were positive for alcohol. This means that 20-25 year old fatally injured drinking drivers accounted for 21.9% of all drinking drivers who were killed.
Then, in the final three columns, it can be seen that 18 of the 50 (36.0%) fatally injured 20-25 year olds who were tested for alcohol had BACs in excess of 80 mg%. This means that 18 of the 21 drivers who were
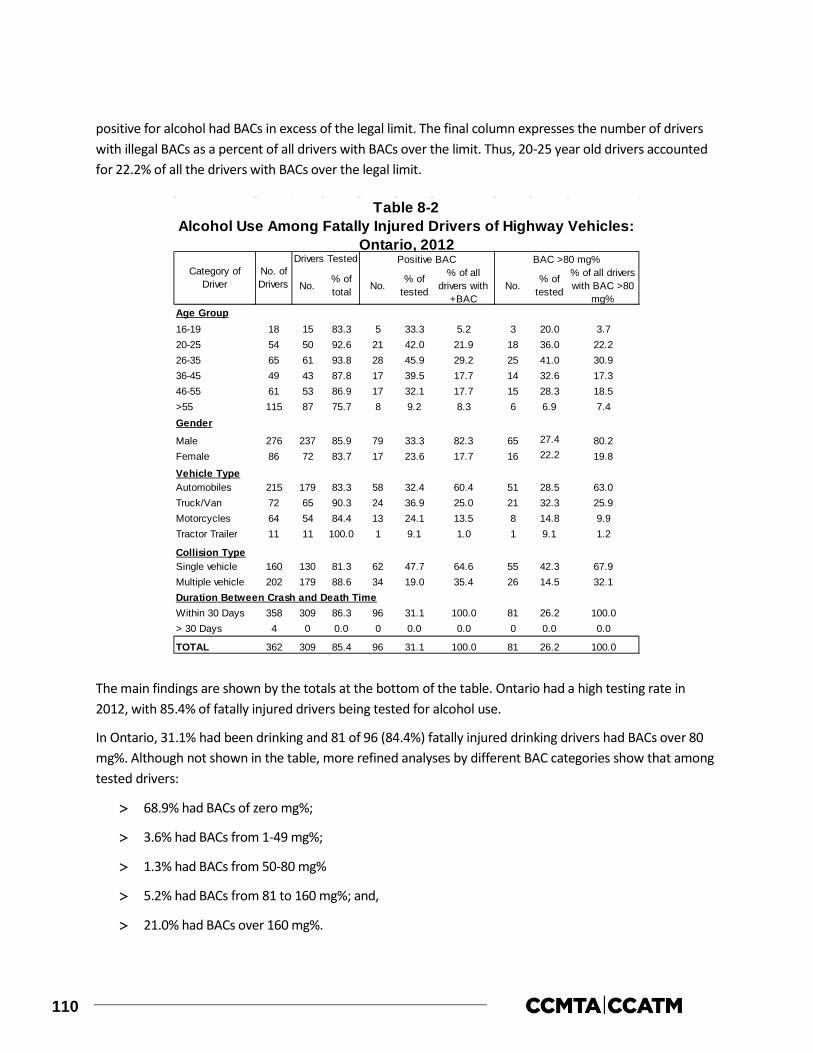
110
positive for alcohol had BACs in excess of the legal limit. The final column expresses the number of drivers with illegal BACs as a percent of all drivers with BACs over the limit. Thus, 20-25 year old drivers accounted for 22.2% of all the drivers with BACs over the legal limit.
The main findings are shown by the totals at the bottom of the table. Ontario had a high testing rate in 2012, with 85.4% of fatally injured drivers being tested for alcohol use.
In Ontario, 31.1% had been drinking and 81 of 96 (84.4%) fatally injured drinking drivers had BACs over 80 mg%. Although not shown in the table, more refined analyses by different BAC categories show that among tested drivers:
> 68.9% had BACs of zero mg%;
> 3.6% had BACs from 1-49 mg%;
> 1.3% had BACs from 50-80 mg%
> 5.2% had BACs from 81 to 160 mg%; and,
> 21.0% had BACs over 160 mg%.
Age Group16-19 18 15 83.3 5 33.3 5.2 3 20.0 3.720-25 54 50 92.6 21 42.0 21.9 18 36.0 22.226-35 65 61 93.8 28 45.9 29.2 25 41.0 30.936-45 49 43 87.8 17 39.5 17.7 14 32.6 17.346-55 61 53 86.9 17 32.1 17.7 15 28.3 18.5>55 115 87 75.7 8 9.2 8.3 6 6.9 7.4Gender
Male 276 237 85.9 79 33.3 82.3 65 27.4 80.2Female 86 72 83.7 17 23.6 17.7 16 22.2 19.8
Vehicle TypeAutomobiles 215 179 83.3 58 32.4 60.4 51 28.5 63.0Truck/Van 72 65 90.3 24 36.9 25.0 21 32.3 25.9Motorcycles 64 54 84.4 13 24.1 13.5 8 14.8 9.9Tractor Trailer 11 11 100.0 1 9.1 1.0 1 9.1 1.2
Collision TypeSingle vehicle 160 130 81.3 62 47.7 64.6 55 42.3 67.9Multiple vehicle 202 179 88.6 34 19.0 35.4 26 14.5 32.1Duration Between Crash and Death TimeWithin 30 Days 358 309 86.3 96 31.1 100.0 81 26.2 100.0> 30 Days 4 0 0.0 0 0.0 0.0 0 0.0 0.0
TOTAL 362 309 85.4 96 31.1 100.0 81 26.2 100.0
% of tested
Table 8-2Alcohol Use Among Fatally Injured Drivers of Highway Vehicles:
Ontario, 2012Positive BAC BAC >80 mg%
% of all drivers with
+BAC
% of all drivers with BAC >80
mg%
% of tested No.
Category of Driver
No. of Drivers No.
Drivers Tested
% of total No.

111
In Figure 8-1, the BAC distribution for tested fatally injured drivers is extrapolated to reflect the BAC distribution for all fatally injured drivers. In this figure, 113 of 362 (31.2%) fatally injured drivers have a positive BAC. And among fatally injured drinking drivers, 95 (84.1%) have BACs over 80 mg%.
8.2.1 Age differences. Of all the fatally injured drinking drivers (i.e., those with a positive BAC), 29.2% were aged 26-35; 21.9% were aged 20-25; 17.7% were aged 36-45 and 46-55; 8.3% were over 55; and 5.2% were aged 16-19.
Of all the fatally injured legally impaired drivers (i.e., those with BACs over 80 mg%), 30.9% were aged 26-35; 22.2% were aged 20-25; 18.5% were aged 46-55; 17.3% were aged 36-45; 7.4% were aged over 55; and 3.7% were aged 16-19.
When comparing the incidence of drinking and driving among fatally injured drivers by age group, fatally injured drivers aged 26-35 were the most likely to have been drinking (45.9%). By contrast, only 9.2% of the tested drivers aged over 55 had been drinking.
8.2.2 Gender differences. Males dominate the picture as they account for 82.3% of all the fatally injured drivers who had been drinking and 80.2% of all of the fatally injured drivers who were legally impaired.
Males dominate the picture largely because they account for most of the drivers who are killed (276 of the 362 drivers are males). Fatally injured male drivers were more likely to have been drinking than female drivers (33.3% and 23.6%, respectively). And, 82.3% of the male and 94.1% of the female drivers who were drinking had BACs over the legal limit.
8.2.3 Vehicle differences. Of all the fatally injured drinking drivers (i.e., those with a positive BAC), 60.4% were automobile drivers; 25.0% were truck/van drivers; 13.5% were motorcyclists; and 1.0% were tractor-trailer drivers.
Of all the fatally injured legally impaired drivers (i.e., those with BACs over 80 mg%), 63.0% were automobile drivers, 25.9% were truck/van drivers; 9.9% were motorcyclists; and 1.2% were tractor-trailer drivers.
Within each of the vehicle types, 36.9% of truck/van drivers, 32.4% of fatally injured automobile drivers, 24.1% of motorcyclists; and 9.1% of tractor-trailer drivers had been drinking.

112
8.2.4 Collision differences. Less than half of the drivers killed (160 of the 362) were involved in single-vehicle collisions but these crashes accounted for two-thirds of the drivers who had been drinking or were legally impaired (64.6% and 67.9%, respectively).
The reason for this apparent disparity is because alcohol is over represented in single-vehicle crashes. Almost half of the drivers involved in single-vehicle crashes (47.7%) were positive for alcohol, compared to only 19.0% of those involved in multiple-vehicle collisions.
8.2.5 Duration between crash and death time. Given that only four fatally injured drivers died more than 30 days after the collision, and none of these drivers were tested for alcohol, a comparison of alcohol use among drivers based on differences in the duration between crash time and death time cannot be performed.
8.3 Drivers involved in alcohol-related serious injury crashes
This section presents information on drivers involved in alcohol-related crashes in which someone was seriously injured in 2012 in Ontario. A “surrogate” or “indirect” measure is used to estimate alcohol involvement because drivers in serious injury crashes are seldom tested for alcohol. A driver is identified as having been involved in an alcohol-related serious injury crash if the crash in which someone was seriously injured involved a single vehicle at night (SVN), or if, in the case of a non-SVN serious injury crash, the police reported alcohol involvement – i.e., at least one drinking driver in the crash (see Section 2.2.4).
The results are shown in Table 8-3 for drivers grouped in terms of age, gender, type of vehicle driven, and type of collision. The first column shows the number of drivers involved in serious injury crashes. The number and percent of drivers in such crashes that involved alcohol is shown in the next two columns. The final column expresses the number of drivers involved in alcohol-related serious injury crashes in any row as a percent of all drivers involved in alcohol- related serious injury crashes.
As shown, by the totals at the bottom of the table, 3,450 drivers were involved in crashes in which someone was seriously injured, and among these 14.6% were alcohol-related crashes.
8.3.1 Driver age. Of all the drivers involved in alcohol-related serious injury crashes, 27.2% were aged 26-35, 21.3% were aged 20-25 and 15.3% were aged 36-45. Drivers under 16 accounted for 0.2% and drivers aged 16-19 accounted for only 8.3% of those involved in alcohol-related serious injury crashes.
One-quarter of the drivers under 16 years of age and 16-19 were involved in alcohol-related serious injury crashes (25.0% and 24.3%, respectively). The lowest incidence of involvement in alcohol-related crashes was found for those over 55 (6.8%).
8.3.2 Driver gender. Of all the drivers involved in alcohol-related serious injury crashes, 77.7% were males. The incidence of involvement in alcohol-related serious injury crashes was also greater for males than for females (16.4% and 10.5%, respectively).
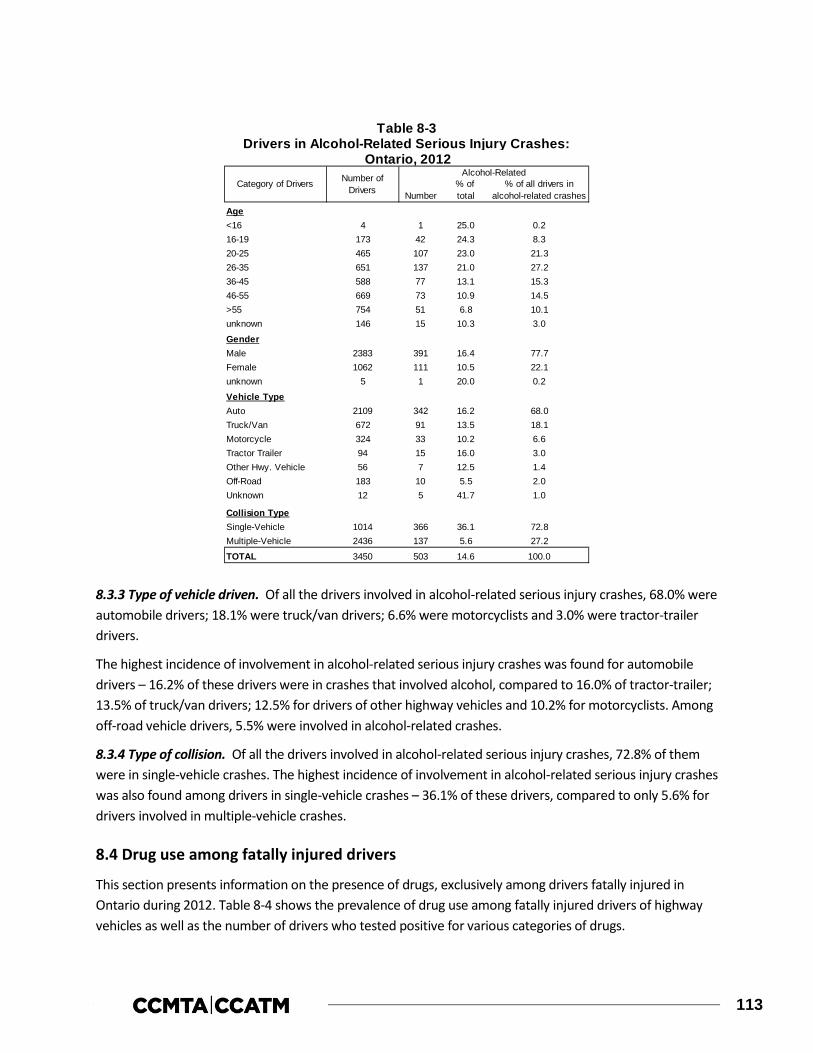
113
8.3.3 Type of vehicle driven. Of all the drivers involved in alcohol-related serious injury crashes, 68.0% were automobile drivers; 18.1% were truck/van drivers; 6.6% were motorcyclists and 3.0% were tractor-trailer drivers.
The highest incidence of involvement in alcohol-related serious injury crashes was found for automobile drivers – 16.2% of these drivers were in crashes that involved alcohol, compared to 16.0% of tractor-trailer; 13.5% of truck/van drivers; 12.5% for drivers of other highway vehicles and 10.2% for motorcyclists. Among off-road vehicle drivers, 5.5% were involved in alcohol-related crashes.
8.3.4 Type of collision. Of all the drivers involved in alcohol-related serious injury crashes, 72.8% of them were in single-vehicle crashes. The highest incidence of involvement in alcohol-related serious injury crashes was also found among drivers in single-vehicle crashes – 36.1% of these drivers, compared to only 5.6% for drivers involved in multiple-vehicle crashes.
8.4 Drug use among fatally injured drivers
This section presents information on the presence of drugs, exclusively among drivers fatally injured in Ontario during 2012. Table 8-4 shows the prevalence of drug use among fatally injured drivers of highway vehicles as well as the number of drivers who tested positive for various categories of drugs.
% of % of all drivers inNumber total alcohol-related crashes
Age<16 4 1 25.0 0.216-19 173 42 24.3 8.320-25 465 107 23.0 21.326-35 651 137 21.0 27.236-45 588 77 13.1 15.346-55 669 73 10.9 14.5>55 754 51 6.8 10.1unknown 146 15 10.3 3.0
GenderMale 2383 391 16.4 77.7Female 1062 111 10.5 22.1unknown 5 1 20.0 0.2
Vehicle TypeAuto 2109 342 16.2 68.0Truck/Van 672 91 13.5 18.1Motorcycle 324 33 10.2 6.6Tractor Trailer 94 15 16.0 3.0Other Hwy. Vehicle 56 7 12.5 1.4Off-Road 183 10 5.5 2.0Unknown 12 5 41.7 1.0
Collision TypeSingle-Vehicle 1014 366 36.1 72.8Multiple-Vehicle 2436 137 5.6 27.2
TOTAL 3450 503 14.6 100.0
Table 8-3Drivers in Alcohol-Related Serious Injury Crashes:
Ontario, 2012Category of Drivers Number of
Drivers
Alcohol-Related
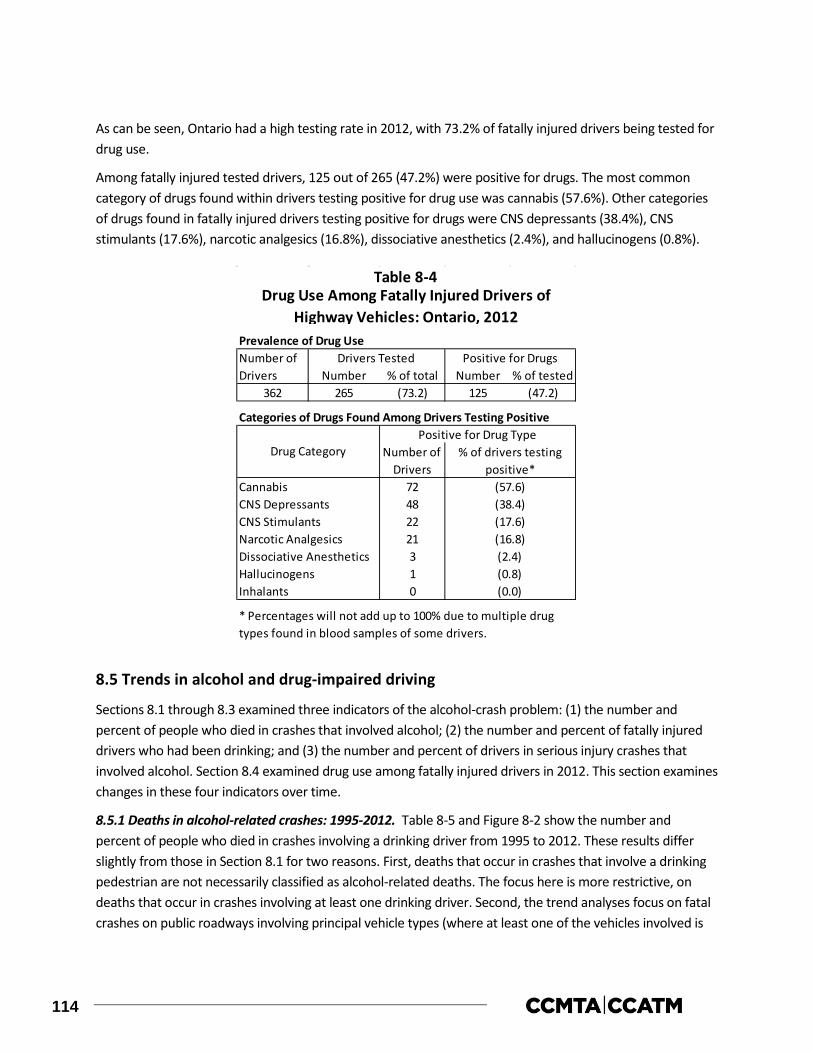
114
As can be seen, Ontario had a high testing rate in 2012, with 73.2% of fatally injured drivers being tested for drug use.
Among fatally injured tested drivers, 125 out of 265 (47.2%) were positive for drugs. The most common category of drugs found within drivers testing positive for drug use was cannabis (57.6%). Other categories of drugs found in fatally injured drivers testing positive for drugs were CNS depressants (38.4%), CNS stimulants (17.6%), narcotic analgesics (16.8%), dissociative anesthetics (2.4%), and hallucinogens (0.8%).
8.5 Trends in alcohol and drug-impaired driving
Sections 8.1 through 8.3 examined three indicators of the alcohol-crash problem: (1) the number and percent of people who died in crashes that involved alcohol; (2) the number and percent of fatally injured drivers who had been drinking; and (3) the number and percent of drivers in serious injury crashes that involved alcohol. Section 8.4 examined drug use among fatally injured drivers in 2012. This section examines changes in these four indicators over time.
8.5.1 Deaths in alcohol-related crashes: 1995-2012. Table 8-5 and Figure 8-2 show the number and percent of people who died in crashes involving a drinking driver from 1995 to 2012. These results differ slightly from those in Section 8.1 for two reasons. First, deaths that occur in crashes that involve a drinking pedestrian are not necessarily classified as alcohol-related deaths. The focus here is more restrictive, on deaths that occur in crashes involving at least one drinking driver. Second, the trend analyses focus on fatal crashes on public roadways involving principal vehicle types (where at least one of the vehicles involved is
Prevalence of Drug Use
Number % of total Number % of tested362 265 (73.2) 125 (47.2)
Categories of Drugs Found Among Drivers Testing Positive
72482221310
Hallucinogens
Drug Use Among Fatally Injured Drivers of Highway Vehicles: Ontario, 2012
Table 8-4
CNS DepressantsCNS StimulantsNarcotic Analgesics
Drivers TestedNumber of Drivers
Positive for Drugs
Drug Category
Cannabis (57.6)
% of drivers testing positive*
* Percentages will not add up to 100% due to multiple drug types found in blood samples of some drivers.
Positive for Drug TypeNumber of
Drivers
(38.4)(17.6)(16.8)
Inhalants (0.0)(0.8)(2.4)Dissociative Anesthetics
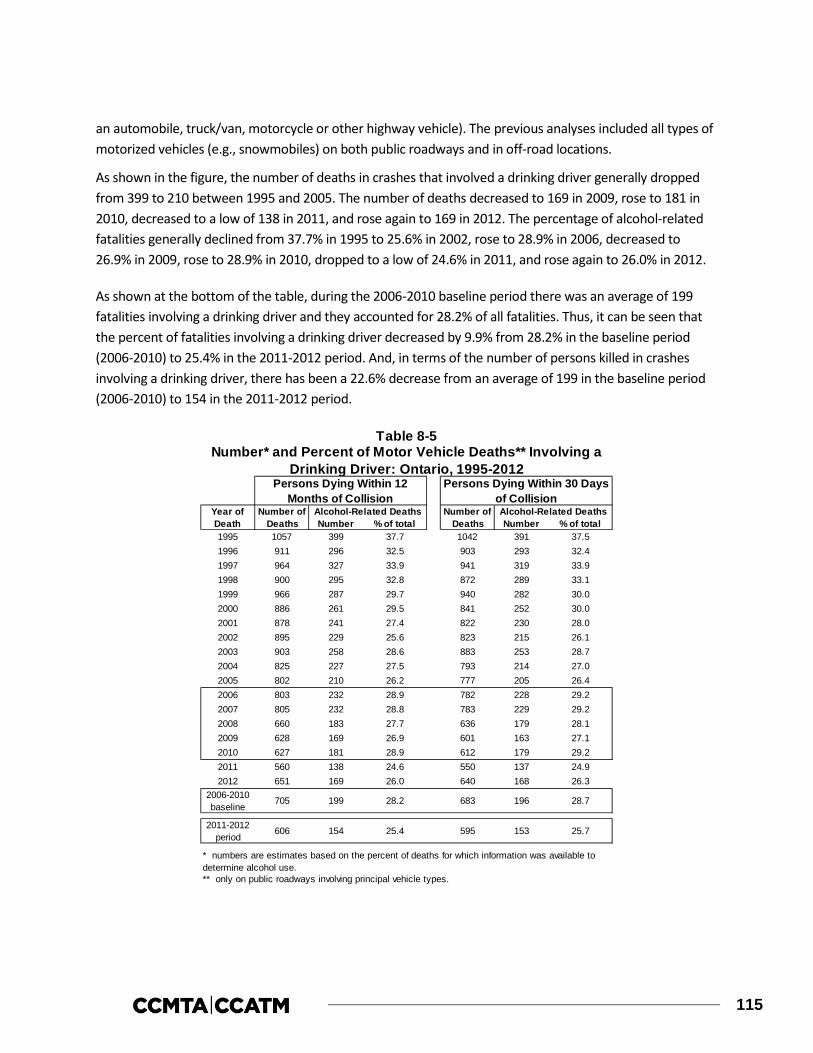
115
an automobile, truck/van, motorcycle or other highway vehicle). The previous analyses included all types of motorized vehicles (e.g., snowmobiles) on both public roadways and in off-road locations.
As shown in the figure, the number of deaths in crashes that involved a drinking driver generally dropped from 399 to 210 between 1995 and 2005. The number of deaths decreased to 169 in 2009, rose to 181 in 2010, decreased to a low of 138 in 2011, and rose again to 169 in 2012. The percentage of alcohol-related fatalities generally declined from 37.7% in 1995 to 25.6% in 2002, rose to 28.9% in 2006, decreased to 26.9% in 2009, rose to 28.9% in 2010, dropped to a low of 24.6% in 2011, and rose again to 26.0% in 2012.
As shown at the bottom of the table, during the 2006-2010 baseline period there was an average of 199 fatalities involving a drinking driver and they accounted for 28.2% of all fatalities. Thus, it can be seen that the percent of fatalities involving a drinking driver decreased by 9.9% from 28.2% in the baseline period (2006-2010) to 25.4% in the 2011-2012 period. And, in terms of the number of persons killed in crashes involving a drinking driver, there has been a 22.6% decrease from an average of 199 in the baseline period (2006-2010) to 154 in the 2011-2012 period.
Number % of total Number % of total1995 1057 399 37.7 1042 391 37.51996 911 296 32.5 903 293 32.41997 964 327 33.9 941 319 33.91998 900 295 32.8 872 289 33.11999 966 287 29.7 940 282 30.02000 886 261 29.5 841 252 30.02001 878 241 27.4 822 230 28.02002 895 229 25.6 823 215 26.12003 903 258 28.6 883 253 28.72004 825 227 27.5 793 214 27.02005 802 210 26.2 777 205 26.42006 803 232 28.9 782 228 29.22007 805 232 28.8 783 229 29.22008 660 183 27.7 636 179 28.12009 628 169 26.9 601 163 27.12010 627 181 28.9 612 179 29.22011 560 138 24.6 550 137 24.92012 651 169 26.0 640 168 26.3
2006-2010baseline
2011-2012period
** only on public roadways involving principal vehicle types.
* numbers are estimates based on the percent of deaths for which information was available to determine alcohol use.
Number of Deaths
Alcohol-Related Deaths
Persons Dying Within 30 Days of Collision
Table 8-5Number* and Percent of Motor Vehicle Deaths** Involving a
Drinking Driver: Ontario, 1995-2012
Alcohol-Related Deaths
Persons Dying Within 12 Months of Collision
Year of Death
Number of Deaths
705 199 28.2 683 196 28.7
25.7606 154 25.4 595 153
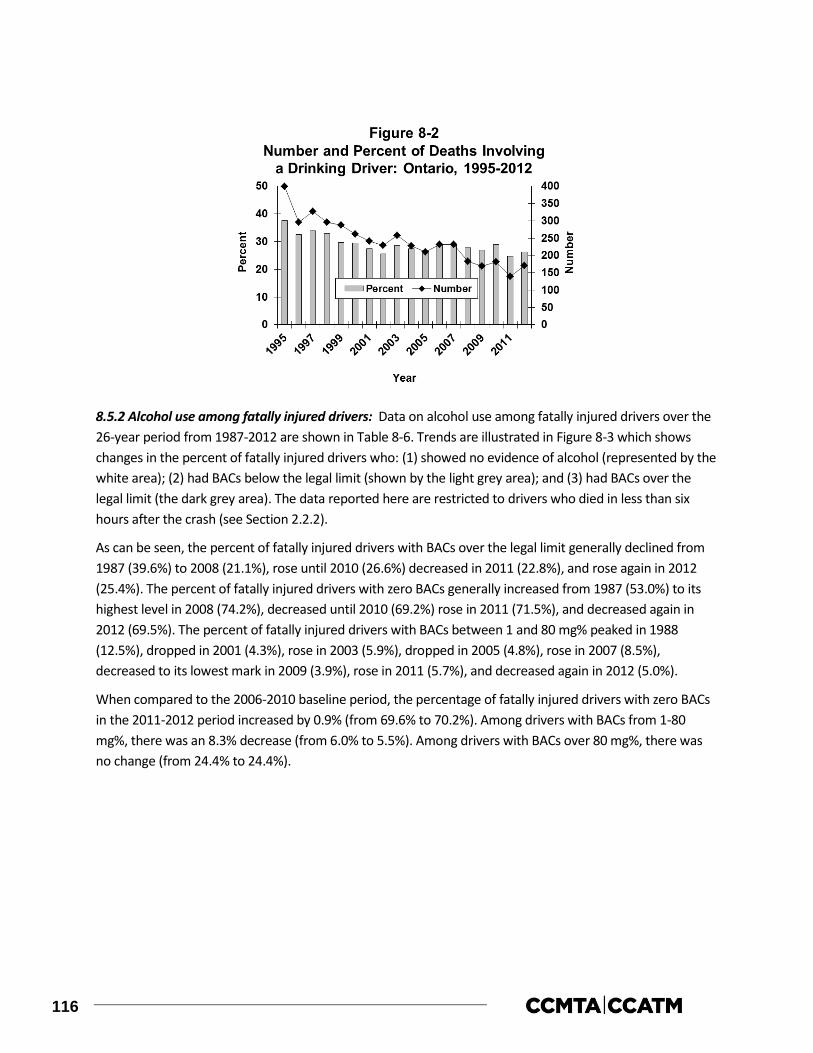
116
8.5.2 Alcohol use among fatally injured drivers: Data on alcohol use among fatally injured drivers over the 26-year period from 1987-2012 are shown in Table 8-6. Trends are illustrated in Figure 8-3 which shows changes in the percent of fatally injured drivers who: (1) showed no evidence of alcohol (represented by the white area); (2) had BACs below the legal limit (shown by the light grey area); and (3) had BACs over the legal limit (the dark grey area). The data reported here are restricted to drivers who died in less than six hours after the crash (see Section 2.2.2).
As can be seen, the percent of fatally injured drivers with BACs over the legal limit generally declined from 1987 (39.6%) to 2008 (21.1%), rose until 2010 (26.6%) decreased in 2011 (22.8%), and rose again in 2012 (25.4%). The percent of fatally injured drivers with zero BACs generally increased from 1987 (53.0%) to its highest level in 2008 (74.2%), decreased until 2010 (69.2%) rose in 2011 (71.5%), and decreased again in 2012 (69.5%). The percent of fatally injured drivers with BACs between 1 and 80 mg% peaked in 1988 (12.5%), dropped in 2001 (4.3%), rose in 2003 (5.9%), dropped in 2005 (4.8%), rose in 2007 (8.5%), decreased to its lowest mark in 2009 (3.9%), rose in 2011 (5.7%), and decreased again in 2012 (5.0%).
When compared to the 2006-2010 baseline period, the percentage of fatally injured drivers with zero BACs in the 2011-2012 period increased by 0.9% (from 69.6% to 70.2%). Among drivers with BACs from 1-80 mg%, there was an 8.3% decrease (from 6.0% to 5.5%). Among drivers with BACs over 80 mg%, there was no change (from 24.4% to 24.4%).

117
Table 8-7 and Figure 8-4 show data on alcohol use among fatally injured drivers over a shorter period from 1990-2012. These results also differ from those reported above for several reasons. First, the number of drivers is extrapolated to reflect the BAC distribution of drivers tested for alcohol (see Figure 8-1). Second, estimates are based on all fatally injured drivers, not just those who died in less than six hours from the crash. Third, drivers are grouped in only two BAC categories: zero and positive.
Number ofDrivers* No. (% Total) Zero (% Tested) 1-80 (% Tested) >80 (% Tested)
1987 613 540 88.1 286 53.0 40 7.4 214 39.61988 555 521 93.9 281 53.9 65 12.5 175 33.61989 642 586 91.3 345 58.9 49 8.4 192 32.81990 545 486 89.2 287 59.1 37 7.6 162 33.31991 531 462 87.0 255 55.2 37 8.0 170 36.81992 538 473 87.9 256 54.1 37 7.8 180 38.11993 604 519 85.9 287 55.3 41 7.9 191 36.81994 548 508 92.7 287 56.5 38 7.5 183 36.01995 532 480 90.2 278 57.9 42 8.8 160 33.31996 424 402 94.8 255 63.4 32 8.0 115 28.61997 478 434 90.8 282 65.0 34 7.8 118 27.21998 427 399 93.4 257 64.4 26 6.5 116 29.11999 487 443 91.0 316 71.3 24 5.4 103 23.32000 418 406 97.1 280 69.0 27 6.7 99 24.42001 424 419 98.8 293 69.9 18 4.3 108 25.82002 418 407 97.4 294 72.2 20 4.9 93 22.92003 435 421 96.8 288 68.4 25 5.9 108 25.72004 427 422 98.8 296 70.1 24 5.7 102 24.22005 387 374 96.6 260 69.5 18 4.8 96 25.72006 384 370 96.4 248 67.0 28 7.6 94 25.42007 429 414 96.5 283 68.4 35 8.5 96 23.22008 339 322 95.0 239 74.2 15 4.7 68 21.12009 294 280 95.2 196 70.0 11 3.9 73 26.12010 307 289 94.1 200 69.2 12 4.2 77 26.62011 275 263 95.6 188 71.5 15 5.7 60 22.82012 295 279 94.6 194 69.5 14 5.0 71 25.4
2006-2010baseline
2011-2012period
* dying in less than six hours.
Year Drivers Tested Drivers Grouped by BAC (mg%)
Table 8-6Alcohol Use Among Fatally Injured Drivers:
Ontario, 1987-2012
20 (6.0) 82 (24.4)351 335 (95.4) 233 (69.6)
15 (5.5) 66 (24.4)285 272 (95.4) 191 (70.2)

118
As can be seen in Table 8-7, the baseline percentage of fatally injured drivers testing positive for alcohol from 2006-2010 is 30.5%. In the 2011-2012 period, 30.3% of fatally injured drivers tested positive for alcohol, a 0.7% decrease from the baseline period.
Zero (% Tested) Positive (% Tested)1990 656 388 (59.1) 268 (40.9)1991 662 362 (54.7) 300 (45.3)1992 678 364 (53.7) 314 (46.3)1993 711 391 (55.0) 320 (45.0)1994 628 354 (56.4) 274 (43.6)1995 630 367 (58.3) 263 (41.7)1996 523 330 (63.1) 193 (36.9)1997 594 384 (64.6) 210 (35.4)1998 523 337 (64.4) 186 (35.6)1999 568 401 (70.6) 167 (29.4)2000 517 354 (68.5) 163 (31.5)2001 521 366 (70.2) 155 (29.8)2002 518 378 (73.0) 140 (27.0)2003 518 357 (68.9) 161 (31.1)2004 503 352 (70.0) 151 (30.0)2005 481 337 (70.1) 144 (29.9)2006 462 314 (68.0) 148 (32.0)2007 498 341 (68.5) 157 (31.5)2008 425 313 (73.6) 112 (26.4)2009 366 256 (69.9) 110 (30.1)2010 394 265 (67.3) 129 (32.7)2011 331 235 (71.0) 96 (29.0)2012 362 249 (68.8) 113 (31.2)
2006-2010baseline
2011-2012period
* numbers are estimates based on the BAC distribution of drivers tested for alcohol
347 242 (69.7) 105 (30.3)
Table 8-7Alcohol Use Among Fatally Injured Drivers of Highway Vehicles*:
Ontario, 1990-2012
Year Number of Drivers
Drivers Grouped by BAC (mg%)
429 298 (69.5) 131 (30.5)
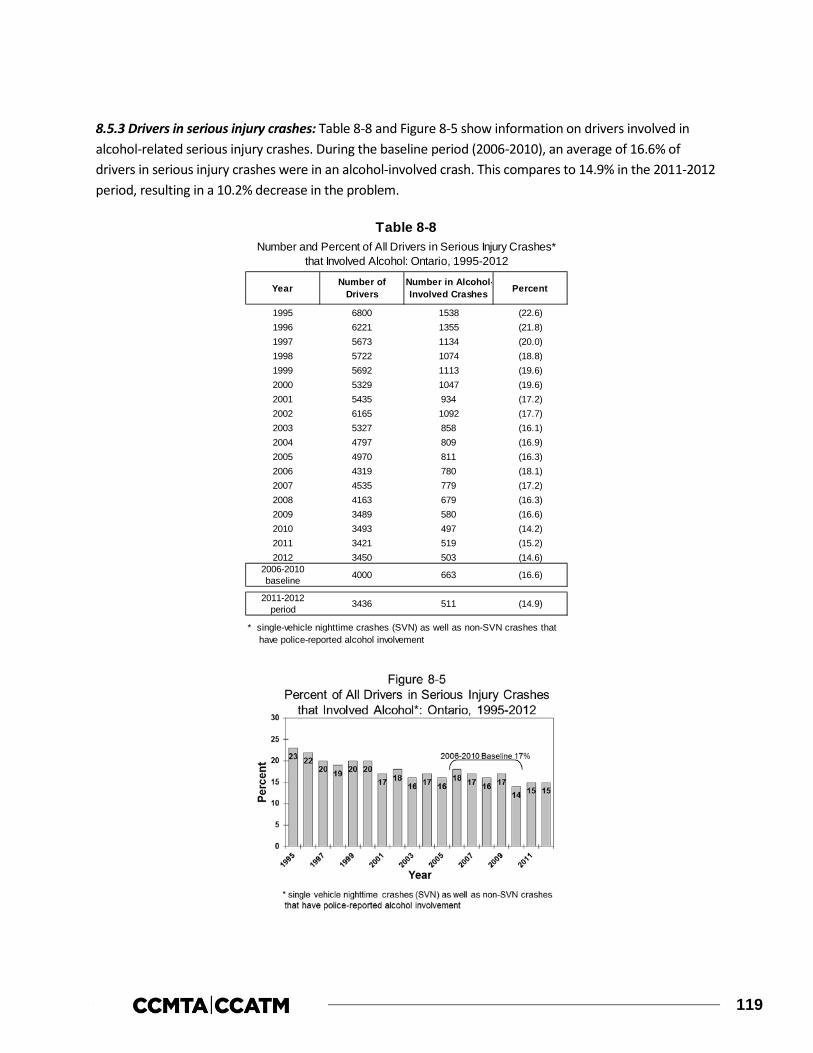
119
8.5.3 Drivers in serious injury crashes: Table 8-8 and Figure 8-5 show information on drivers involved in alcohol-related serious injury crashes. During the baseline period (2006-2010), an average of 16.6% of drivers in serious injury crashes were in an alcohol-involved crash. This compares to 14.9% in the 2011-2012 period, resulting in a 10.2% decrease in the problem.
Year Number of Drivers
Number in Alcohol-Involved Crashes Percent
1995 6800 1538 (22.6)1996 6221 1355 (21.8)1997 5673 1134 (20.0)1998 5722 1074 (18.8)1999 5692 1113 (19.6)2000 5329 1047 (19.6)2001 5435 934 (17.2)2002 6165 1092 (17.7)2003 5327 858 (16.1)2004 4797 809 (16.9)2005 4970 811 (16.3)2006 4319 780 (18.1)2007 4535 779 (17.2)2008 4163 679 (16.3)2009 3489 580 (16.6)2010 3493 497 (14.2)2011 3421 519 (15.2)2012 3450 503 (14.6)
2006-2010baseline
2011-2012period
* single-vehicle nighttime crashes (SVN) as well as non-SVN crashes that have police-reported alcohol involvement
3436 511 (14.9)
Table 8-8Number and Percent of All Drivers in Serious Injury Crashes*
that Involved Alcohol: Ontario, 1995-2012
4000 663 (16.6)
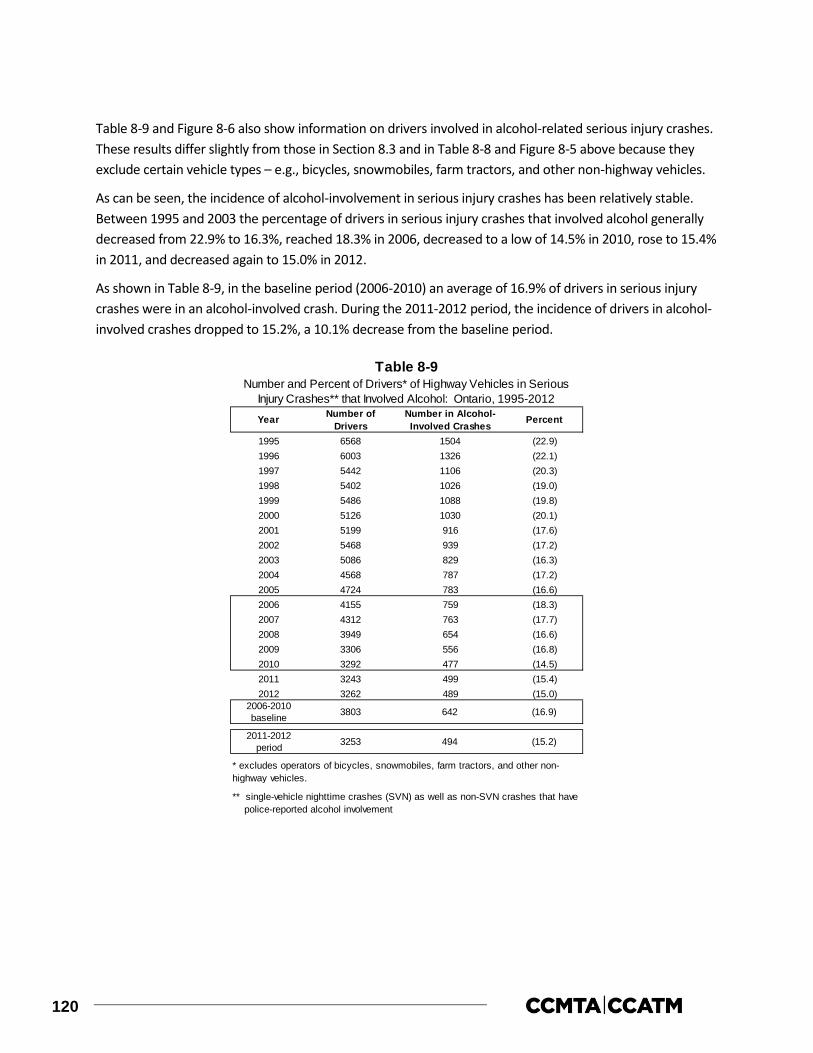
120
Table 8-9 and Figure 8-6 also show information on drivers involved in alcohol-related serious injury crashes. These results differ slightly from those in Section 8.3 and in Table 8-8 and Figure 8-5 above because they exclude certain vehicle types – e.g., bicycles, snowmobiles, farm tractors, and other non-highway vehicles.
As can be seen, the incidence of alcohol-involvement in serious injury crashes has been relatively stable. Between 1995 and 2003 the percentage of drivers in serious injury crashes that involved alcohol generally decreased from 22.9% to 16.3%, reached 18.3% in 2006, decreased to a low of 14.5% in 2010, rose to 15.4% in 2011, and decreased again to 15.0% in 2012.
As shown in Table 8-9, in the baseline period (2006-2010) an average of 16.9% of drivers in serious injury crashes were in an alcohol-involved crash. During the 2011-2012 period, the incidence of drivers in alcohol-involved crashes dropped to 15.2%, a 10.1% decrease from the baseline period.
Number ofDrivers
1995 6568 1504 (22.9)1996 6003 1326 (22.1)1997 5442 1106 (20.3)1998 5402 1026 (19.0)1999 5486 1088 (19.8)2000 5126 1030 (20.1)2001 5199 916 (17.6)2002 5468 939 (17.2)2003 5086 829 (16.3)2004 4568 787 (17.2)2005 4724 783 (16.6)2006 4155 759 (18.3)2007 4312 763 (17.7)2008 3949 654 (16.6)2009 3306 556 (16.8)2010 3292 477 (14.5)2011 3243 499 (15.4)2012 3262 489 (15.0)
2006-2010baseline
2011-2012period
** single-vehicle nighttime crashes (SVN) as well as non-SVN crashes that have police-reported alcohol involvement
* excludes operators of bicycles, snowmobiles, farm tractors, and other non-highway vehicles.
3803 642 (16.9)
Table 8-9Number and Percent of Drivers* of Highway Vehicles in Serious
Injury Crashes** that Involved Alcohol: Ontario, 1995-2012
Year PercentNumber in Alcohol-Involved Crashes
3253 494 (15.2)

121
8.5.4 Drug use among fatally injured drivers: Table 8-10 and Figure 8-7 show data on drug use among fatally injured drivers over a 13-year period (2000-2012). Similar to Table 8-6, these results are based on fatally injured drivers of highway vehicles who died less than six hours after the crash (see Section 2.2.5).
As can be seen at the bottom of Table 8-10, the percentage of fatally injured drivers testing positive for drugs from 2006-2010, the baseline period, is 38.8%. In the 2011-2012 period, 45.3% of fatally injured drivers tested positive for drugs, a 16.8% increase from the baseline period.
Negative (% Tested) Positive (% Tested)2000 418 63 15.1 26 41.3 37 58.72001 424 95 22.4 54 56.8 41 43.22002 418 96 23.0 47 49.0 49 51.02003 434 110 25.3 59 53.6 51 46.42004 427 111 26.0 50 45.0 61 55.02005 387 135 34.9 72 53.3 63 46.72006 384 147 38.3 86 58.5 61 41.52007 429 170 39.6 105 61.8 65 38.22008 339 39 11.5 23 59.0 16 41.02009 294 29 9.9 15 51.7 14 48.32010 312 38 12.2 29 76.3 9 23.72011 275 221 80.4 130 58.8 91 41.22012 295 251 85.1 128 51.0 123 49.0
2006-2010baseline
2011-2012period
* dying in less than six hours.
107 45.3285 236 82.8 129 54.7
Table 8-10
Year Number of Drivers*
Drivers Tested (% Total) Drivers Tested for Drugs
33 38.8
Drug Use Among Fatally Injured Drivers of Highway Vehicles: Ontario, 2000-2012
352 85 24.1 52 61.2
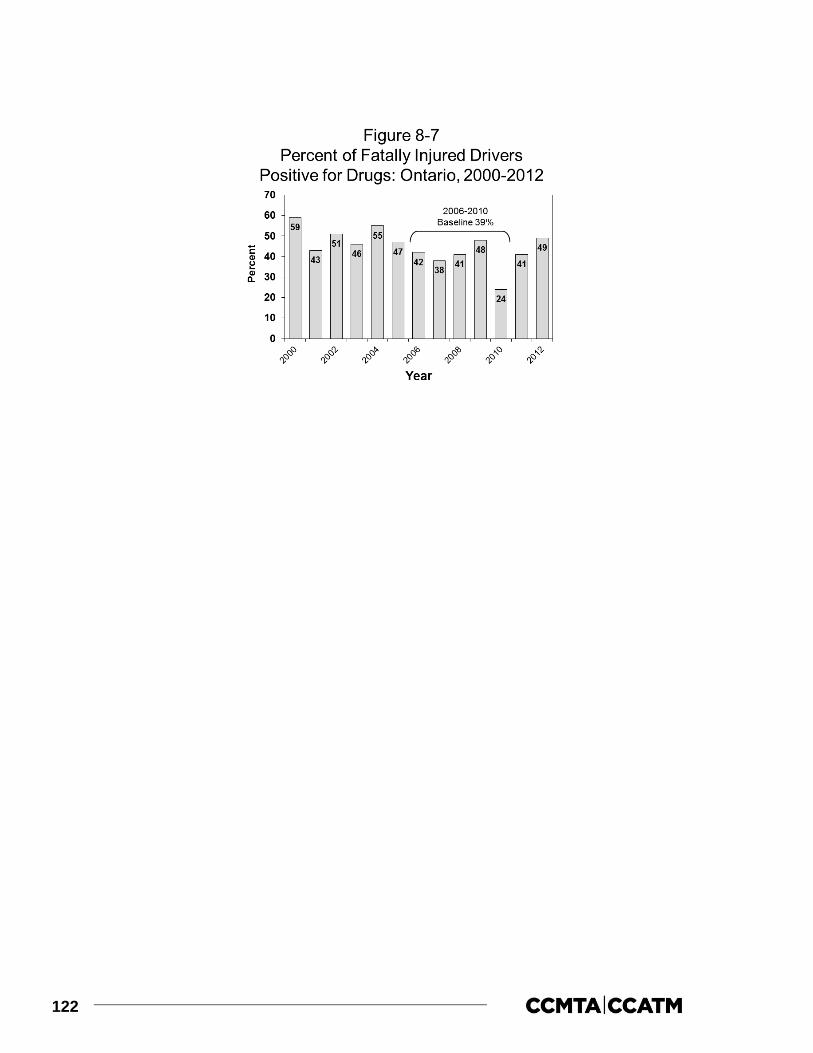
122
123
9.0 QUEBEC
This section of the report reviews the major findings on alcohol involvement in fatal and serious injury motor vehicle collisions as well as drug involvement in fatal motor vehicle collisions in Quebec during 2012. It describes data on:
> people who were killed in alcohol-related crashes (Section 9.1);
> alcohol use among fatally injured drivers (Section 9.2);
> drivers involved in alcohol-related serious injury crashes (Section 9.3);
> drug use among fatally injured drivers (Section 9.4); and,
> trends in the alcohol-crash and drug-crash problems (Section 9.5).
9.1 Deaths in alcohol-related crashes
Table 9-1 presents information on people who died in alcohol-related crashes in Quebec during 2012 for persons dying within 12 months of the collision (one calendar year) and for persons dying within 30 days of the collision. Motor vehicle deaths are categorized in terms of the victim’s age, gender, type (i.e., driver, passenger, pedestrian) and the type of vehicle they occupied. In each section, the first column in the table presents the number of deaths. The next two columns show the number and percent of these fatalities in which sufficient information was available to determine if alcohol was involved. A motor vehicle fatality was considered to be alcohol involved if there was at least one drinking driver or drinking pedestrian in the fatal crash.
For example, within the first section, it can be seen that among persons dying within 12 months of the collision, 63 people aged 26-35 were killed in motor vehicle crashes in Quebec during 2012. And, in 60 cases (95.2%) it was possible to determine if alcohol was a factor in the crash. The next column shows the number of people killed in crashes that were known to be alcohol-involved. In 2012, 24 people aged 26-35 died in alcohol-related crashes in Quebec. The next column expresses this as a percentage – i.e., 40.0% of the 26-35 year olds who were killed died in an alcohol-related crash.
The final column (percent of all alcohol-related deaths) expresses the number of deaths in alcohol-related crashes as a percent of all the deaths in such crashes. For example, the alcohol-related deaths among 26-35 year olds represent 18.5% of all the people killed in alcohol-related crashes in Quebec during 2012.
An examination of the section for persons dying within 30 days of the collision shows that 62 persons aged 26-35 died in motor vehicle crashes. In 59 of these cases (95.2%), it was possible to determine if alcohol was a factor in the crash. Among these persons, 24 (40.7%) were alcohol-related deaths. And 26-35 year olds accounted for 18.5% of people dying in alcohol-related crashes.
The totals at the bottom of the table provide a summary. As can be seen, 511 persons died within 12 months of a motor vehicle crash in Quebec during 2012. In 474 (92.8%) of these cases, it was possible to

124
determine if alcohol was a factor. Of these known cases, 130 (27.4%) involved alcohol. Extrapolating this figure to the total number of motor vehicle fatalities (511 x .274) it can be estimated that in Quebec during 2012, 140 persons died in alcohol-related crashes within 12 months of the collision.
Among the 503 persons dying within 30 days of the collision, it was possible to determine if alcohol was a factor in 92.8% of the cases. Of these known cases, 130 (27.8%) involved alcohol. Extrapolating this figure to the total number of motor vehicle fatalities (503 x .278) it can be estimated that in Quebec during 2012, 140 persons died in alcohol-related crashes within 30 days of the collision.
9.1.1 Victim age. Of all the people who died in alcohol-related crashes within 12 months of the collision, 23.8% (see last column in the first section) were aged 20-25; 21.5% were aged 46-55; 18.5% were aged 26-35; 14.6% were aged 36-45; 11.5% were over age 55; and 10.0% were aged 16-19.
The highest incidence of alcohol involvement occurred in the crashes in which persons aged 20-25 and 26-35 died (44.9% and 40.0% respectively). The lowest incidence of alcohol involvement was found among the youngest and oldest fatalities as 0.0% of persons under 16 and 9.9% of the fatalities over 55 years of age died in crashes involving alcohol.
Age Group<16 18 13 72.2 0 0.0 0.0 18 13 72.2 0 0.0 0.016-19 48 47 97.9 13 27.7 10.0 48 47 97.9 13 27.7 10.020-25 75 69 92.0 31 44.9 23.8 75 69 92.0 31 44.9 23.826-35 63 60 95.2 24 40.0 18.5 62 59 95.2 24 40.7 18.536-45 53 50 94.3 19 38.0 14.6 52 49 94.2 19 38.8 14.646-55 90 84 93.3 28 33.3 21.5 88 82 93.2 28 34.1 21.5>55 164 151 92.1 15 9.9 11.5 160 148 92.5 15 10.1 11.5
GenderMale 370 345 93.2 104 30.1 80.0 364 340 93.4 104 30.6 80.0Female 141 129 91.5 26 20.2 20.0 139 127 91.4 26 20.5 20.0
Victim TypeDriver/ Operator 371 349 94.1 100 28.7 76.9 365 344 94.2 100 29.1 76.9Passenger 88 78 88.6 19 24.4 14.6 88 78 88.6 19 24.4 14.6Pedestrian 52 47 90.4 11 23.4 8.5 50 45 90.0 11 24.4 8.5
Vehicle OccupiedAutomobiles 254 232 91.3 65 28.0 50.0 251 230 91.6 65 28.3 50.0Trucks/Vans 72 68 94.4 20 29.4 15.4 70 66 94.3 20 30.3 15.4Motorcycles 47 45 95.7 7 15.6 5.4 47 45 95.7 7 15.6 5.4Other Hwy. Vehicles 10 9 90.0 1 11.1 0.8 9 8 88.9 1 12.5 0.8Offroad Vehicles 76 73 96.1 26 35.6 20.0 76 73 96.1 26 35.6 20.0(Pedestrians) 52 47 90.4 11 23.4 8.5 50 45 90.0 11 24.4 8.5
Collision LocationPublic Road 454 421 92.7 115 27.3 88.5 448 415 92.6 115 27.7 88.5Offroad 57 53 93.0 15 28.3 11.5 55 52 94.5 15 28.8 11.5
TOTAL 511 474 92.8 130 27.4 100.0 503 467 92.8 130 27.8 100.0
Persons Dying Within 30 Days of Collision
% of known
Table 9-1Deaths in Alcohol-Related Crashes: Quebec, 2012
Alcohol-Related Deaths (ARDs)
Alcohol-Related Deaths (ARDs)
% of all ARDs
% of all ARDs
Persons Dying Within 12 Months of Collision
% of known
No. of Deaths
Alcohol Use Known
No. % of total
No.Category of Victim No. of
Deaths No.
Alcohol Use Known
% of total
No.

125
9.1.2 Gender. Of all the people who died in alcohol-related crashes within 12 months of the collision, 80.0% were males. The incidence of alcohol in crashes in which a male died (30.1%) was greater than the incidence of alcohol in crashes in which a female died (20.2%).
9.1.3 Victim type. Of all the people who died in alcohol-related crashes within 12 months of the collision, 76.9% were drivers/operators of a vehicle; 14.6% were passengers; and 8.5% were pedestrians.
Within each of the victim types, the highest incidence of alcohol involvement (28.7%) occurred in the crashes in which a driver/operator died. Alcohol was involved in 24.4% of the crashes in which a passenger died and 23.4% of those in which a pedestrian died.
9.1.4 Type of vehicle occupied. Of all the people who died in alcohol-related crashes within 12 months of the collision, 50.0% were in an automobile; 20.0% were off-road vehicle occupants; 15.4% were truck/van occupants; 5.4% were motorcyclists; and 0.8% were occupants of other highway vehicles.
Within each of these vehicle types, the incidence of alcohol involvement in which a truck/van occupant died was slightly greater than the incidence of alcohol in crashes in which an automobile occupant died (29.4% versus 28.0%). Among off-road vehicle occupants, 35.6% died in an alcohol-related crash compared to 15.6% of motorcyclists.
9.1.5 Collision location. Of all the people who died in alcohol-related crashes within 12 months of the collision, 88.5% died in a collision which occurred on a public road and 11.5% died in an off-road collision. However, the incidence of alcohol involvement in which a victim died in an alcohol-related crash was slightly greater for those dying in off-road collisions (28.3%) than it was for persons dying in collisions on public roads (27.3%).
9.2 Alcohol in fatally injured drivers
This section presents information on the presence of alcohol, exclusively among drivers fatally injured within 12 months of the collision in Quebec during 2012. Table 9-2 shows the information by age group, gender, vehicle type, collision type (single vs. multiple), and duration between crash time and death time (within 12 months vs. within 30 days of the collision).
The first column in the table shows the number of drivers killed. The next columns show the number and percent of these victims who were tested for alcohol. The remaining columns provide information on the results of the alcohol tests – the first three of these present results for drivers who showed any evidence of alcohol; the last three columns present information on drivers who had BACs over the statutory limit of 80 mg%.
To illustrate, among 16-19 year olds there were 27 drivers killed during 2012; 17 of these fatally injured drivers (63.0%) were tested for alcohol. Of those who were tested, five (29.4%) were positive for alcohol. This means that 16-19 year old fatally injured drinking drivers accounted for 7.6% of all drinking drivers who were killed.
Then, in the final three columns, it can be seen that five of the 15 (29.4%) fatally injured 16-19 year olds who were tested for alcohol had BACs in excess of 80 mg%. This means that all five of the drivers who were

126
positive for alcohol had BACs in excess of the legal limit. The final column expresses the number of drivers with illegal BACs as a percent of all drivers with BACs over the limit. Thus, 16-19 year old drivers accounted for 8.8% of all the drivers with BACs over the legal limit.
The main findings are shown by the totals at the bottom of the table. Quebec had a low testing rate in 2012, with 65.9% of fatally injured drivers being tested for alcohol use.
In Quebec, 33.2% had been drinking and 57 of 66 (86.4%) fatally injured drinking drivers had BACs over 80 mg%. Although not shown in the table, more refined analyses by different BAC categories show that among tested drivers:
> 66.8% had BACs of zero mg%;
> 3.0% had BACs from 1-49 mg%;
> 1.5% had BACs from 50-80 mg%
> 10.6% had BACs from 81 to 160 mg%; and,
> 18.1% had BACs over 160 mg%.
Age Group16-19 27 17 63.0 5 29.4 7.6 5 29.4 8.820-25 52 36 69.2 18 50.0 27.3 15 41.7 26.326-35 41 27 65.9 14 51.9 21.2 11 40.7 19.336-45 34 25 73.5 9 36.0 13.6 9 36.0 15.846-55 52 37 71.2 15 40.5 22.7 13 35.1 22.8>55 96 58 60.4 5 8.6 7.6 4 6.9 7.0Gender
Male 236 160 67.8 54 33.8 81.8 46 28.8 80.7Female 66 40 60.6 12 30.0 18.2 11 27.5 19.3
Vehicle TypeAutomobiles 194 125 64.4 41 32.8 62.1 36 28.8 63.2Truck/Van 60 45 75.0 17 37.8 25.8 16 35.6 28.1Motorcycles 40 24 60.0 7 29.2 10.6 5 20.8 8.8Tractor Trailer 7 5 71.4 1 20.0 1.5 0 0.0 0.0Other Hwy. Veh. 1 1 100.0 0 0.0 0.0 0 0.0 0.0
Collision TypeSingle vehicle 140 92 65.7 42 45.7 63.6 40 43.5 70.2Multiple vehicle 162 108 66.7 24 22.2 36.4 17 15.7 29.8Duration Between Crash and Death TimeWithin 30 Days 297 199 67.0 66 33.2 100.0 57 28.6 100.0> 30 Days 5 1 20.0 0 0.0 0.0 0 0.0 0.0
TOTAL 302 200 66.2 66 33.0 100.0 57 28.5 100.0
% of tested
Table 9-2Alcohol Use Among Fatally Injured Drivers of Highway Vehicles:
Quebec, 2012Positive BAC BAC >80 mg%
% of all drivers with
+BAC
% of all drivers with BAC >80
mg%
% of tested No.
Category of Driver
No. of Drivers No.
Drivers Tested
% of total No.

127
In Figure 9-1, the BAC distribution for tested fatally injured drivers is extrapolated to reflect the BAC distribution for all fatally injured drivers. In this figure, 100 of 302 (33.1%) fatally injured drivers have a positive BAC. And among fatally injured drinking drivers, 86 (86.0%) have BACs over 80 mg%.
9.2.1 Age differences. Of all the fatally injured drinking drivers (i.e., those with positive BAC), 27.3% were aged 20-25; 22.7% were aged 46-55; 21.2% were aged 26-35; 13.6% were aged 36-45; and 7.6% were aged 16-19 and over 55.
Of all the fatally injured legally impaired drivers (i.e., those with BACs over 80 mg%), 26.3% were aged 20-25; 22.8% were aged 46-55; 19.3% were aged 26-35; 15.8% were aged 36-45; 8.8% were aged 16-19; and 7.0% were over 55.
When comparing the incidence of drinking and driving among fatally injured drivers by age group, fatally injured drivers aged 26-35 were the most likely to have been drinking (51.9%). By contrast, only 8.8% of the tested drivers over 55 had been drinking.
9.2.2 Gender differences. Males dominate the picture as they account for 81.8% of all the fatally injured drivers who had been drinking and 80.7% of all of the fatally injured drivers who were legally impaired.
Males dominate the picture largely because they account for most of the drivers who are killed (236 of the 302 fatalities or 78.1% are males). Fatally injured male drivers were more likely to have been drinking than female drivers (34.0% and 30.0%, respectively). And, 85.2% of the male and 91.7% of the female drivers who were drinking had BACs over the legal limit.
9.2.3 Vehicle differences. Of all the fatally injured drinking drivers (i.e., those with a positive BAC), 62.1% were automobile drivers; 25.8% were truck/van drivers; 10.6% were motorcyclists; and 1.5% were tractor-trailer drivers.
Of all the fatally injured legally impaired drivers (i.e., those with BACs over 80 mg%), 63.2% were automobile drivers; 28.1% were truck/van drivers; and 8.8% were motorcyclists.

128
Within each of the vehicle types, 37.8% of fatally injured truck/van drivers, 32.8% of automobile drivers, 29.2% of motorcyclists, and 20.0% of tractor-trailer drivers had been drinking. The lone driver of another highway vehicle had not been drinking.
9.2.4 Collision differences. Less than half of the drivers killed (141 of the 302) were involved in single-vehicle collisions but these crashes accounted for two-thirds of the drivers who had been drinking or were legally impaired (65.2% and 70.2%, respectively). The reason for this apparent disparity is because alcohol is overrepresented in single-vehicle crashes. Almost half of the drivers involved in single-vehicle crashes (46.7%) were positive for alcohol, compared to only 21.5% of those involved in multiple-vehicle collisions.
9.2.5 Duration between crash and death time. Given that only six fatally injured drivers died more than 30 days after the collision, and only one of these drivers was tested for alcohol, a comparison of alcohol use among drivers based on differences in the duration between crash time and death time cannot be performed.
9.3 Drivers involved in alcohol-related serious injury crashes
This section presents information on drivers involved in alcohol-related crashes in which someone was seriously injured in 2012 in Quebec. A “surrogate” or “indirect” measure is used to estimate alcohol involvement because drivers in serious injury crashes are seldom tested for alcohol. A driver is identified as having been involved in an alcohol-related serious injury crash if the crash in which someone was seriously injured involved a single vehicle at night (SVN), or if, in the case of a non-SVN serious injury crash, the police reported alcohol involvement – i.e., at least one drinking driver in the crash (see Section 2.2.4).
The results are shown in Table 9-3 for drivers grouped in terms of age, gender, type of vehicle driven, and type of collision. The first column shows the number of drivers involved in serious injury crashes.
The number and percent of drivers in such crashes that involved alcohol is shown in the next two columns. The final column expresses the number of drivers involved in alcohol-related serious injury crashes in any row as a percent of all drivers involved in alcohol- related serious injury crashes.
As shown by the totals at the bottom of the table, 2,848 drivers were involved in crashes in which someone was seriously injured, and among these 17.6% were alcohol-related crashes.
9.3.1 Driver age. Of all the drivers involved in alcohol-related serious injury crashes, 23.7% were aged 20-25, 17.9% were aged 26-35; and 12.0% were aged 36-45. Drivers under 16 accounted for only 1.4% of those involved in alcohol-related serious injury crashes.
Over one-quarter of the drivers aged 20-25 were involved in alcohol-related serious injury crashes (28.5%). The lowest incidence of involvement in alcohol-related crashes was found for those over 55 (8.5%).
9.3.2 Driver gender. Of all the drivers involved in alcohol-related serious injury crashes, 75.5% were males. The incidence of involvement in alcohol-related serious injury crashes was also greater for males than for females (19.4% and 11.7%, respectively).
9.3.3 Type of vehicle driven. Drivers of automobiles and light trucks have been merged in this table as Quebec has regrouped these vehicle types into one category in its collision data since March 2010. Of all the
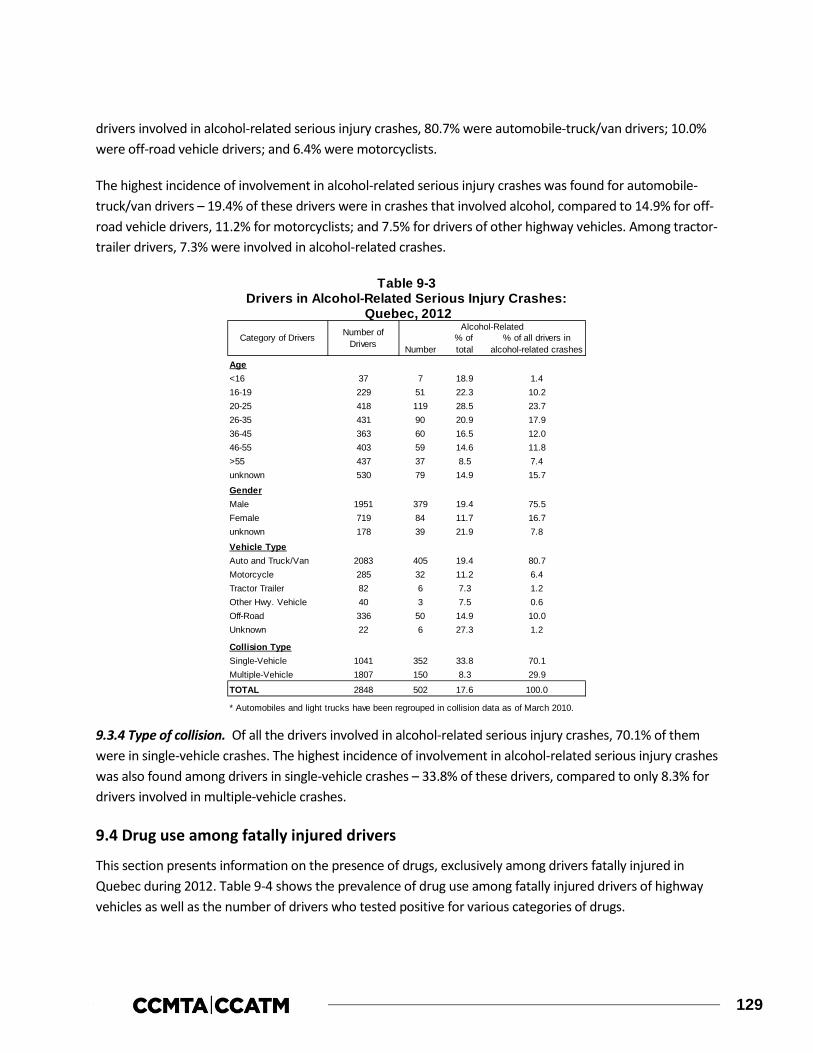
129
drivers involved in alcohol-related serious injury crashes, 80.7% were automobile-truck/van drivers; 10.0% were off-road vehicle drivers; and 6.4% were motorcyclists.
The highest incidence of involvement in alcohol-related serious injury crashes was found for automobile-truck/van drivers – 19.4% of these drivers were in crashes that involved alcohol, compared to 14.9% for off-road vehicle drivers, 11.2% for motorcyclists; and 7.5% for drivers of other highway vehicles. Among tractor-trailer drivers, 7.3% were involved in alcohol-related crashes.
9.3.4 Type of collision. Of all the drivers involved in alcohol-related serious injury crashes, 70.1% of them were in single-vehicle crashes. The highest incidence of involvement in alcohol-related serious injury crashes was also found among drivers in single-vehicle crashes – 33.8% of these drivers, compared to only 8.3% for drivers involved in multiple-vehicle crashes.
9.4 Drug use among fatally injured drivers
This section presents information on the presence of drugs, exclusively among drivers fatally injured in Quebec during 2012. Table 9-4 shows the prevalence of drug use among fatally injured drivers of highway vehicles as well as the number of drivers who tested positive for various categories of drugs.
% of % of all drivers inNumber total alcohol-related crashes
Age<16 37 7 18.9 1.416-19 229 51 22.3 10.220-25 418 119 28.5 23.726-35 431 90 20.9 17.936-45 363 60 16.5 12.046-55 403 59 14.6 11.8>55 437 37 8.5 7.4unknown 530 79 14.9 15.7
GenderMale 1951 379 19.4 75.5Female 719 84 11.7 16.7unknown 178 39 21.9 7.8
Vehicle TypeAuto and Truck/Van 2083 405 19.4 80.7Motorcycle 285 32 11.2 6.4Tractor Trailer 82 6 7.3 1.2Other Hwy. Vehicle 40 3 7.5 0.6Off-Road 336 50 14.9 10.0Unknown 22 6 27.3 1.2
Collision TypeSingle-Vehicle 1041 352 33.8 70.1Multiple-Vehicle 1807 150 8.3 29.9
TOTAL 2848 502 17.6 100.0
* Automobiles and light trucks have been regrouped in collision data as of March 2010.
Table 9-3Drivers in Alcohol-Related Serious Injury Crashes:
Quebec, 2012Category of Drivers Number of
Drivers
Alcohol-Related

130
As can be seen, Quebec had an average testing rate in 2012, with 65.2% of fatally injured drivers being tested for drug use.
Among fatally injured tested drivers, 62 out of 197 (31.5%) were positive for drugs. The most common category of drugs found within drivers testing positive for drug use was cannabis (45.2%). Other categories of drugs found in fatally injured drivers testing positive for drugs were CNS depressants (37.1%), CNS stimulants (33.9%), and narcotic analgesics (21.0%).
9.5 Trends in alcohol and drug-impaired driving
Sections 9.1 through 9.3 examined three indicators of the alcohol-crash problem: (1) the number and percent of people who died in crashes that involved alcohol; (2) the number and percent of fatally injured drivers who had been drinking; and (3) the number and percent of drivers in serious injury crashes that involved alcohol. Section 9.4 examined drug use among fatally injured drivers in 2012. This section examines changes in these four indicators over time.
9.5.1 Deaths in alcohol-related crashes: 1995-2012. Table 9-5 and Figure 9-2 show the number and percent of people who died in crashes involving a drinking driver from 1995 to 2012. These results differ slightly from those in Section 9.1 for two reasons. First, deaths that occur in crashes that involve a drinking pedestrian are not necessarily classified as alcohol-related deaths. The focus here is more restrictive, on deaths that occur in crashes involving at least one drinking driver. Second, the trend analyses focus on fatal crashes on public roadways involving principal vehicle types (where at least one of the vehicles involved is an automobile, truck/van, motorcycle or other highway vehicle). The previous analyses included all types of motorized vehicles (e.g., snowmobiles) on both public roadways and in off-road locations.
Prevalence of Drug Use
Number % of total Number % of tested302 198 (65.6) 62 (31.3)
Categories of Drugs Found Among Drivers Testing Positive
28232113000
* Percentages will not add up to 100% due to multiple drug types found in blood samples of some drivers.
Positive for Drug TypeNumber of
Drivers
(37.1)(33.9)(21.0)
Inhalants (0.0)(0.0)Hallucinogens(0.0)Dissociative Anesthetics
Drug Use Among Fatally Injured Drivers of Highway Vehicles: Quebec, 2012
Table 9-4
CNS DepressantsCNS StimulantsNarcotic Analgesics
Drivers TestedNumber of Drivers
Positive for Drugs
Drug Category
Cannabis (45.2)
% of drivers testing positive*
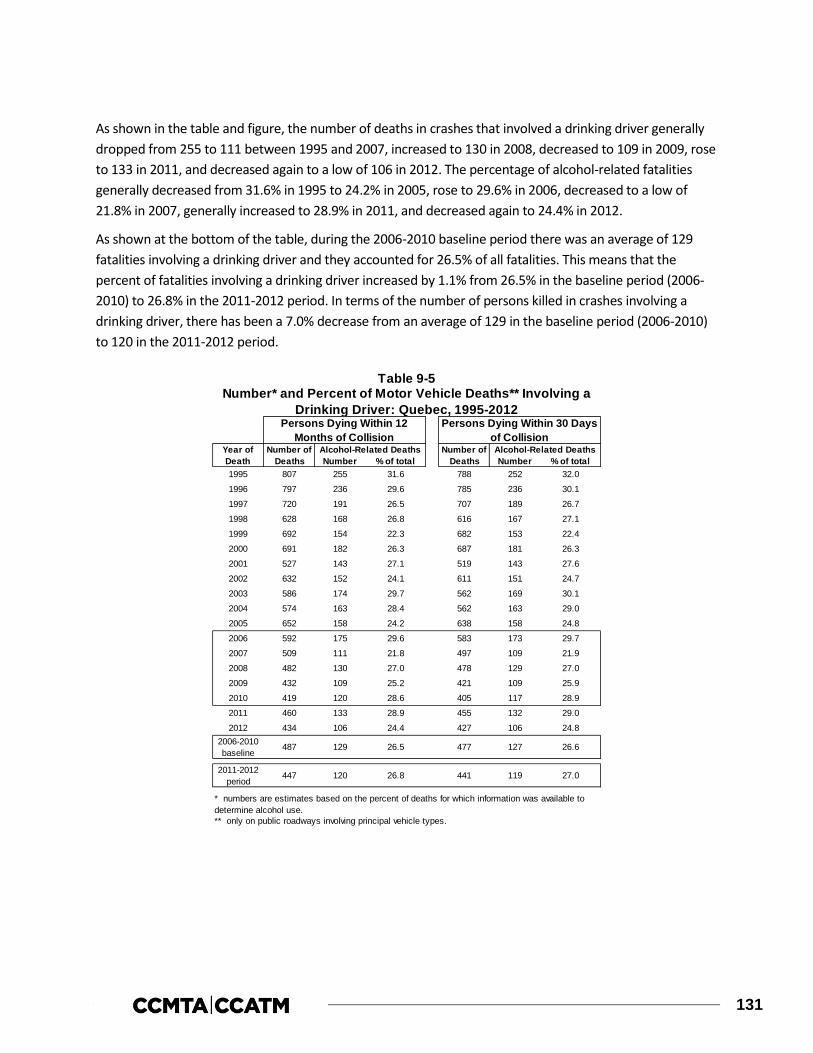
131
As shown in the table and figure, the number of deaths in crashes that involved a drinking driver generally dropped from 255 to 111 between 1995 and 2007, increased to 130 in 2008, decreased to 109 in 2009, rose to 133 in 2011, and decreased again to a low of 106 in 2012. The percentage of alcohol-related fatalities generally decreased from 31.6% in 1995 to 24.2% in 2005, rose to 29.6% in 2006, decreased to a low of 21.8% in 2007, generally increased to 28.9% in 2011, and decreased again to 24.4% in 2012.
As shown at the bottom of the table, during the 2006-2010 baseline period there was an average of 129 fatalities involving a drinking driver and they accounted for 26.5% of all fatalities. This means that the percent of fatalities involving a drinking driver increased by 1.1% from 26.5% in the baseline period (2006-2010) to 26.8% in the 2011-2012 period. In terms of the number of persons killed in crashes involving a drinking driver, there has been a 7.0% decrease from an average of 129 in the baseline period (2006-2010) to 120 in the 2011-2012 period.
Number % of total Number % of total1995 807 255 31.6 788 252 32.0
1996 797 236 29.6 785 236 30.1
1997 720 191 26.5 707 189 26.7
1998 628 168 26.8 616 167 27.1
1999 692 154 22.3 682 153 22.4
2000 691 182 26.3 687 181 26.3
2001 527 143 27.1 519 143 27.6
2002 632 152 24.1 611 151 24.7
2003 586 174 29.7 562 169 30.1
2004 574 163 28.4 562 163 29.0
2005 652 158 24.2 638 158 24.8
2006 592 175 29.6 583 173 29.7
2007 509 111 21.8 497 109 21.9
2008 482 130 27.0 478 129 27.0
2009 432 109 25.2 421 109 25.9
2010 419 120 28.6 405 117 28.9
2011 460 133 28.9 455 132 29.0
2012 434 106 24.4 427 106 24.82006-2010baseline
2011-2012period
** only on public roadways involving principal vehicle types.
27.0447 120 26.8 441 119
* numbers are estimates based on the percent of deaths for which information was available to determine alcohol use.
Number of Deaths
Alcohol-Related Deaths
Persons Dying Within 30 Days of Collision
Table 9-5Number* and Percent of Motor Vehicle Deaths** Involving a
Drinking Driver: Quebec, 1995-2012
Alcohol-Related Deaths
Persons Dying Within 12 Months of Collision
Year of Death
Number of Deaths
487 129 26.5 477 127 26.6

132
9.5.2 Alcohol use among fatally injured drivers: Data on alcohol use among fatally injured drivers over the 26-year period from 1987-2012 are shown in Table 9-6. Trends are illustrated in Figure 9-3 which shows changes in the percent of fatally injured drivers who: (1) showed no evidence of alcohol (represented by the white area); (2) had BACs below the legal limit (shown by the light grey area); and (3) had BACs over the legal limit (the dark grey area).
As can be seen, the percent of fatally injured drivers with BACs over the legal limit generally declined from 1987 (49.5%) to its lowest point in 1999 (22.3%), generally rose until 2003 (38.4%), declined in 2005 (29.6%), fluctuated until 2010 (31.0%), rose in 2011 (32.9%), and decreased again in 2012 (28.6%). The percent of fatally injured drivers with zero BACs generally increased from 1987 (30.9%) to 1999 (71.5%), fluctuated until 2010 (62.0%), decreased in 2011 (61.4%), and rose again in 2012 (66.8%). The percent of fatally injured drivers with BACs between 1 and 80 mg% peaked in 1987 (19.6%), fell to its lowest mark in 2002 (4.4%), fluctuated until 2009 (7.1%), and decreased until 2012 (4.5%).
When compared to the 2006-2010 baseline period shown at the bottom of Table 9-6, the percentage of fatally injured drivers with zero BACs in the 2011-2012 period increased by 3.7% (from 61.6% to 63.9%). Among drivers with BACs from 1-80 mg%, there was a 19.4% decrease (from 6.7% to 5.4%). And among those with BACs over 80 mg%, there was a 3.2% decrease (from 31.7% to 30.7%).

133
Table 9-7 and Figure 9-4 show data on alcohol use among fatally injured drivers over a shorter period from 1990-2012. These results also differ from those reported above for two reasons. First, the number of drivers is extrapolated to reflect the BAC distribution of drivers tested for alcohol (see Figure 9-1). Second, drivers are grouped in only two BAC categories: zero and positive.
Number ofDrivers* No. (% Total) Zero (% Tested) 1-80 (% Tested) >80 (% Tested)
1987 567 301 53.1 93 30.9 59 19.6 149 49.5
1988 631 392 62.1 162 41.3 41 10.5 189 48.2
1989 657 426 64.8 203 47.7 29 6.8 194 45.5
1990 582 395 67.9 193 48.9 40 10.1 162 41.0
1991 559 380 68.0 180 47.4 29 7.6 171 45.0
1992 512 383 74.8 209 54.6 28 7.3 146 38.1
1993 499 406 81.4 239 58.9 24 5.9 143 35.2
1994 448 334 74.6 184 55.1 31 9.3 119 35.6
1995 465 361 77.6 201 55.7 28 7.8 132 36.6
1996 474 355 74.9 205 57.7 19 5.4 131 36.9
1997 415 290 69.9 171 59.0 20 6.9 99 34.1
1998 398 276 69.3 164 59.4 15 5.4 97 35.1
1999 450 337 74.9 241 71.5 21 6.2 75 22.3
2000 427 322 75.4 206 64.0 25 7.8 91 28.3
2001 354 257 72.6 161 62.6 19 7.4 77 30.0
2002 421 315 74.8 209 66.3 14 4.4 92 29.2
2003 379 263 69.4 146 55.5 16 6.1 101 38.4
2004 367 252 68.7 153 60.7 22 8.7 77 30.6
2005 445 314 70.6 200 63.7 21 6.7 93 29.6
2006 427 289 67.7 176 60.9 24 8.3 89 30.8
2007 342 219 64.0 150 68.5 12 5.5 57 26.0
2008 321 245 76.3 146 59.6 13 5.3 86 35.1
2009 300 196 65.3 112 57.1 14 7.1 70 35.7
2010 268 171 63.8 106 62.0 12 7.0 53 31.0
2011 318 210 66.0 129 61.4 12 5.7 69 32.9
2012 302 199 65.9 133 66.8 9 4.5 57 28.62006-2010baseline
2011-2012period
Year Drivers Tested Drivers Grouped by BAC (mg%)
Table 9-6Alcohol Use Among Fatally Injured Drivers:
Quebec, 1987-2012
15 (6.7) 71 (31.7)332 224 (67.5) 138 (61.6)
11 (5.4) 63 (30.7)310 205 (66.1) 131 (63.9)
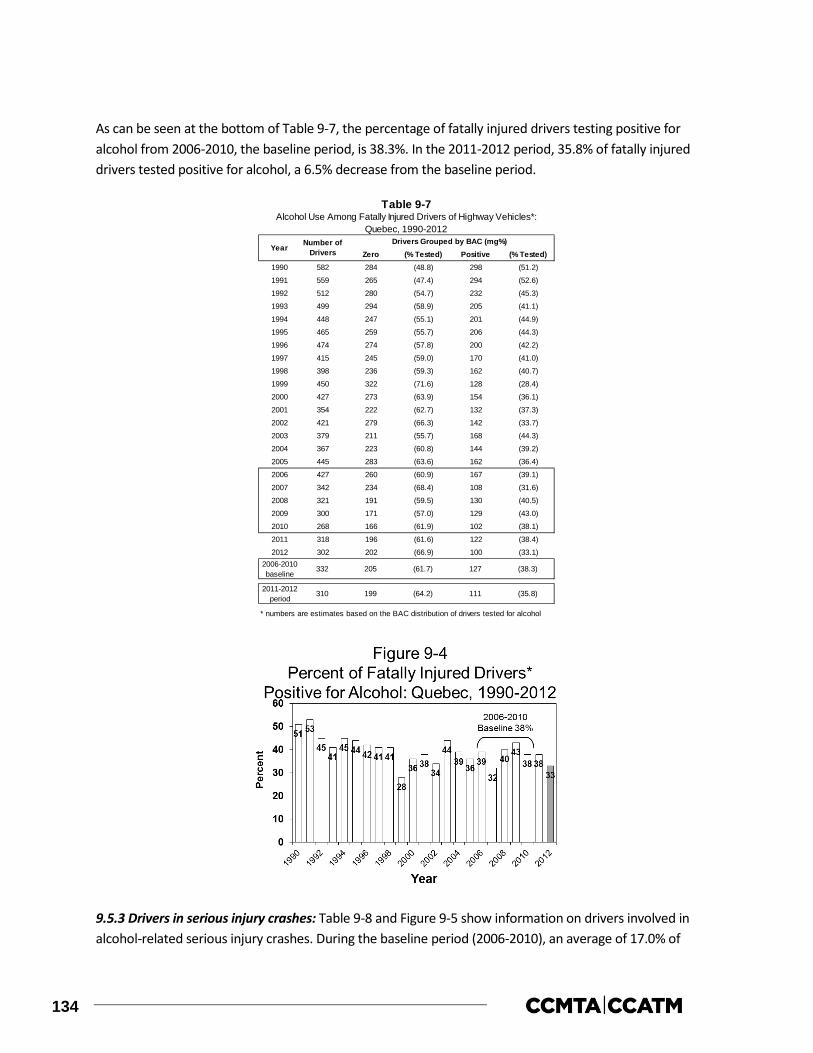
134
As can be seen at the bottom of Table 9-7, the percentage of fatally injured drivers testing positive for alcohol from 2006-2010, the baseline period, is 38.3%. In the 2011-2012 period, 35.8% of fatally injured drivers tested positive for alcohol, a 6.5% decrease from the baseline period.
9.5.3 Drivers in serious injury crashes: Table 9-8 and Figure 9-5 show information on drivers involved in alcohol-related serious injury crashes. During the baseline period (2006-2010), an average of 17.0% of
Zero (% Tested) Positive (% Tested)1990 582 284 (48.8) 298 (51.2)
1991 559 265 (47.4) 294 (52.6)
1992 512 280 (54.7) 232 (45.3)
1993 499 294 (58.9) 205 (41.1)
1994 448 247 (55.1) 201 (44.9)
1995 465 259 (55.7) 206 (44.3)
1996 474 274 (57.8) 200 (42.2)
1997 415 245 (59.0) 170 (41.0)
1998 398 236 (59.3) 162 (40.7)
1999 450 322 (71.6) 128 (28.4)
2000 427 273 (63.9) 154 (36.1)
2001 354 222 (62.7) 132 (37.3)
2002 421 279 (66.3) 142 (33.7)
2003 379 211 (55.7) 168 (44.3)
2004 367 223 (60.8) 144 (39.2)
2005 445 283 (63.6) 162 (36.4)
2006 427 260 (60.9) 167 (39.1)
2007 342 234 (68.4) 108 (31.6)
2008 321 191 (59.5) 130 (40.5)
2009 300 171 (57.0) 129 (43.0)
2010 268 166 (61.9) 102 (38.1)
2011 318 196 (61.6) 122 (38.4)
2012 302 202 (66.9) 100 (33.1)2006-2010baseline
2011-2012period
* numbers are estimates based on the BAC distribution of drivers tested for alcohol
Table 9-7Alcohol Use Among Fatally Injured Drivers of Highway Vehicles*:
Quebec, 1990-2012
Year Number of Drivers
Drivers Grouped by BAC (mg%)
332 205 (61.7) 127 (38.3)
310 199 (64.2) 111 (35.8)
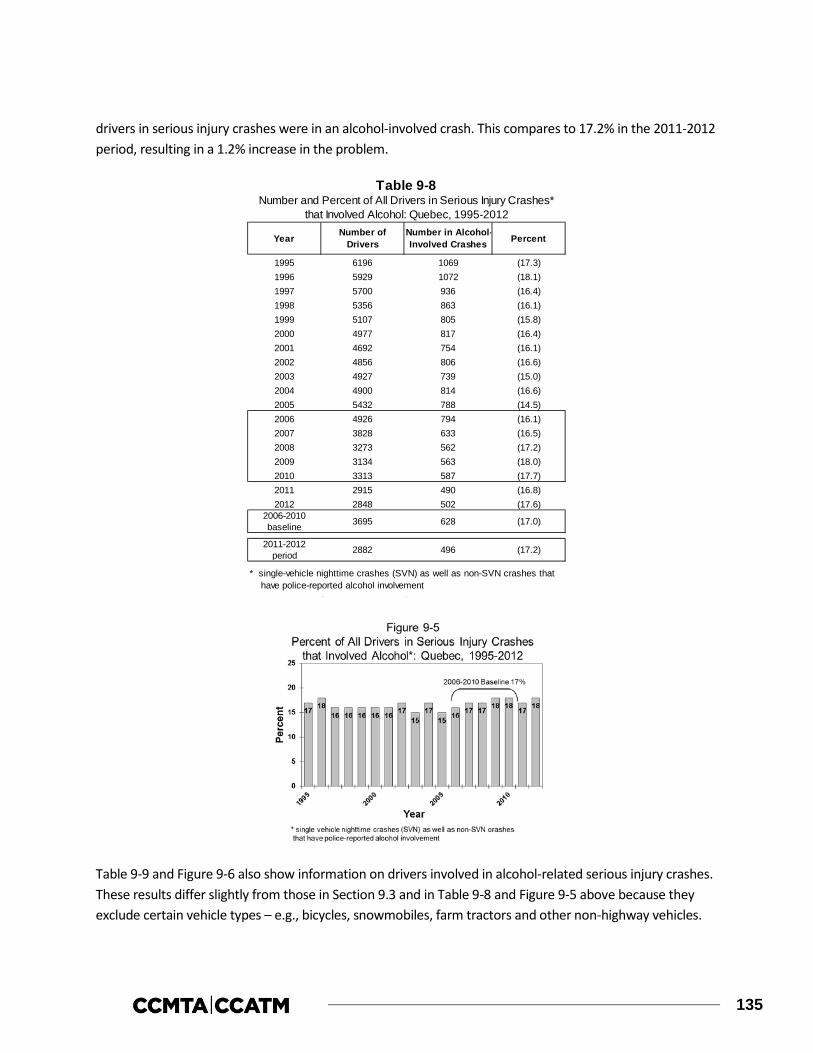
135
drivers in serious injury crashes were in an alcohol-involved crash. This compares to 17.2% in the 2011-2012 period, resulting in a 1.2% increase in the problem.
Table 9-9 and Figure 9-6 also show information on drivers involved in alcohol-related serious injury crashes. These results differ slightly from those in Section 9.3 and in Table 9-8 and Figure 9-5 above because they exclude certain vehicle types – e.g., bicycles, snowmobiles, farm tractors and other non-highway vehicles.
Year Number of Drivers
Number in Alcohol-Involved Crashes Percent
1995 6196 1069 (17.3)1996 5929 1072 (18.1)1997 5700 936 (16.4)1998 5356 863 (16.1)1999 5107 805 (15.8)2000 4977 817 (16.4)2001 4692 754 (16.1)2002 4856 806 (16.6)2003 4927 739 (15.0)2004 4900 814 (16.6)2005 5432 788 (14.5)2006 4926 794 (16.1)2007 3828 633 (16.5)2008 3273 562 (17.2)2009 3134 563 (18.0)2010 3313 587 (17.7)2011 2915 490 (16.8)2012 2848 502 (17.6)
2006-2010baseline
2011-2012period
* single-vehicle nighttime crashes (SVN) as well as non-SVN crashes that have police-reported alcohol involvement
2882 496 (17.2)
Table 9-8Number and Percent of All Drivers in Serious Injury Crashes*
that Involved Alcohol: Quebec, 1995-2012
3695 628 (17.0)

136
As can be seen, the incidence of alcohol-involvement in serious injury crashes has been relatively stable from 1997 until 2005 and then risen in the past three years. Between 1995 and 1996 the percentage of all drivers in serious injury crashes that involved alcohol rose only slightly from 17.7% to 18.9%. The incidence generally dropped to a low of 15.3% in 2005, rose to 18.8% in 2009, decreased to 17.4% in 2011, and rose again to 18.0% in 2012.
As shown in Table 9-9, in the baseline period (2006-2010), an average of 17.8% of drivers in serious injury crashes were in an alcohol-involved crash. During the 2011-2012 period, the incidence of drivers in alcohol-involved crashes was 17.7% – a 0.6% decrease.
Number ofDrivers
1995 5526 979 (17.7)
1996 5382 1018 (18.9)
1997 5146 871 (16.9)
1998 4782 800 (16.7)
1999 4557 740 (16.2)
2000 4455 750 (16.8)
2001 4179 699 (16.7)
2002 4323 746 (17.3)
2003 4386 679 (15.5)
2004 4337 761 (17.5)
2005 4856 745 (15.3)
2006 4404 741 (16.8)
2007 3350 584 (17.4)
2008 2812 508 (18.1)
2009 2740 515 (18.8)
2010 2895 531 (18.3)
2011 2543 443 (17.4)
2012 2507 451 (18.0)2006-2010baseline
2011-2012period
** single-vehicle nighttime crashes (SVN) as well as non-SVN crashes that have police-reported alcohol involvement
* excludes operators of bicycles, snowmobiles, farm tractors, and other non-highway vehicles.
3240 576 (17.8)
2525 447 (17.7)
Table 9-9Number and Percent of Drivers* of Highway Vehicles in Serious
Injury Crashes** that Involved Alcohol: Quebec, 1995-2012
Year PercentNumber in Alcohol-Involved Crashes
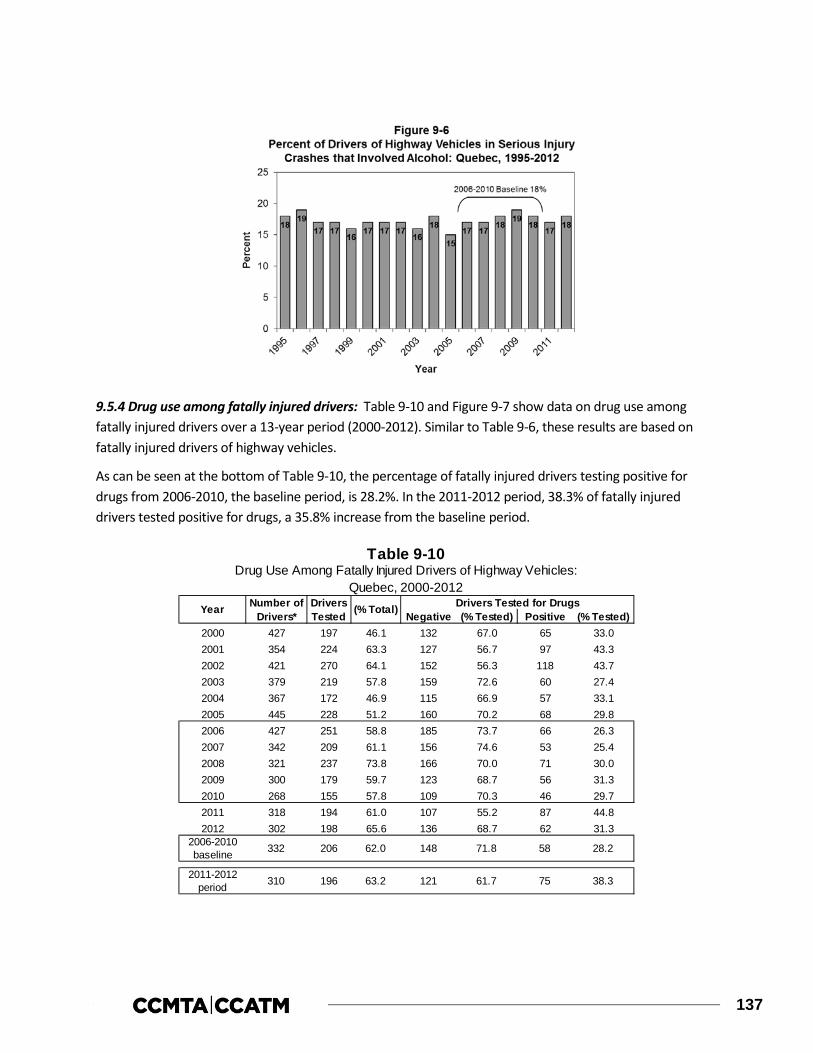
137
9.5.4 Drug use among fatally injured drivers: Table 9-10 and Figure 9-7 show data on drug use among fatally injured drivers over a 13-year period (2000-2012). Similar to Table 9-6, these results are based on fatally injured drivers of highway vehicles.
As can be seen at the bottom of Table 9-10, the percentage of fatally injured drivers testing positive for drugs from 2006-2010, the baseline period, is 28.2%. In the 2011-2012 period, 38.3% of fatally injured drivers tested positive for drugs, a 35.8% increase from the baseline period.
Negative (% Tested) Positive (% Tested)2000 427 197 46.1 132 67.0 65 33.02001 354 224 63.3 127 56.7 97 43.32002 421 270 64.1 152 56.3 118 43.72003 379 219 57.8 159 72.6 60 27.42004 367 172 46.9 115 66.9 57 33.12005 445 228 51.2 160 70.2 68 29.82006 427 251 58.8 185 73.7 66 26.32007 342 209 61.1 156 74.6 53 25.42008 321 237 73.8 166 70.0 71 30.02009 300 179 59.7 123 68.7 56 31.32010 268 155 57.8 109 70.3 46 29.72011 318 194 61.0 107 55.2 87 44.82012 302 198 65.6 136 68.7 62 31.3
2006-2010baseline
2011-2012period
Table 9-10
Year Number of Drivers*
Drivers Tested (% Total) Drivers Tested for Drugs
58 28.2
Drug Use Among Fatally Injured Drivers of Highway Vehicles: Quebec, 2000-2012
332 206 62.0 148 71.8
75 38.3310 196 63.2 121 61.7

138
139
10.0 NEW BRUNSWICK
This section of the report reviews the major findings on alcohol involvement in fatal and serious injury motor vehicle collisions as well as drug involvement in fatal motor vehicle collisions in New Brunswick during 2012. It describes data on:
> people who were killed in alcohol-related crashes (Section 10.1);
> alcohol use among fatally injured drivers (Section 10.2);
> drivers involved in alcohol-related serious injury crashes (Section 10.3);
> drug use among fatally injured drivers (Section 10.4); and,
> trends in the alcohol-crash and drug-crash problems (Section 10.5).
10.1 Deaths in alcohol-related crashes
Table 10-1 presents information on people who died in alcohol-related crashes in New Brunswick during 2012 for persons dying within 12 months of the collision (one calendar year) and for persons dying within 30 days of the collision. Motor vehicle deaths are categorized in terms of the victim’s age, gender, type (i.e., driver, passenger, pedestrian) and the type of vehicle they occupied. In each section, the first column in the table presents the number of deaths. The next two columns show the number and percent of these fatalities in which sufficient information was available to determine if alcohol was involved. A motor vehicle fatality was considered to be alcohol involved if there was at least one drinking driver or drinking pedestrian in the fatal crash.
For example, within the first section, it can be seen that among persons dying within 12 months of the collision, 12 people aged 16-19 were killed in motor vehicle crashes in New Brunswick during 2012. And, in 11 cases (91.7%) it was possible to determine if alcohol was a factor in the crash. The next column shows the number of people killed in crashes that were known to be alcohol-involved. There were three people aged 16-19 who died in alcohol-related crashes in New Brunswick during 2012. The next column expresses this as a percentage – i.e., 27.3% of the 16-19 year olds who were killed died in an alcohol-related crash.
The final column (percent of all alcohol-related deaths) expresses the number of deaths in alcohol-related crashes as a percent of all the deaths in such crashes. For example, the alcohol-related deaths among 16-19 year olds represent 9.4% of all the people killed in alcohol-related crashes in New Brunswick during 2012.
An examination of the section for persons dying within 30 days of the collision shows that 12 persons aged 16-19 died in motor vehicle crashes. In 11 of these cases (91.7%), it was possible to determine if alcohol was a factor in the crash. Among these persons, three (27.3%) were alcohol-related deaths. And 16-19 year olds accounted for 9.4% of people dying in alcohol-related crashes.
The totals at the bottom of the table provide a summary. As can be seen, 83 persons died within 12 months of a motor vehicle crash in New Brunswick during 2012. In 77 (92.8%) of these cases, it was possible to
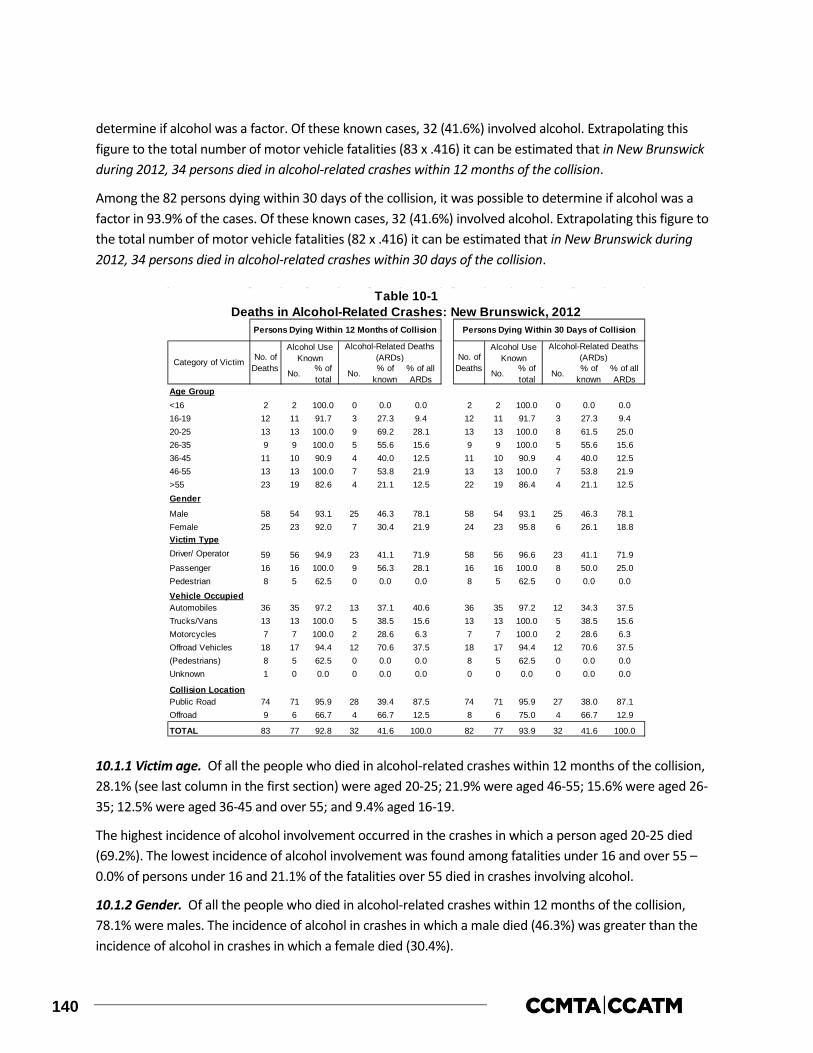
140
determine if alcohol was a factor. Of these known cases, 32 (41.6%) involved alcohol. Extrapolating this figure to the total number of motor vehicle fatalities (83 x .416) it can be estimated that in New Brunswick during 2012, 34 persons died in alcohol-related crashes within 12 months of the collision.
Among the 82 persons dying within 30 days of the collision, it was possible to determine if alcohol was a factor in 93.9% of the cases. Of these known cases, 32 (41.6%) involved alcohol. Extrapolating this figure to the total number of motor vehicle fatalities (82 x .416) it can be estimated that in New Brunswick during 2012, 34 persons died in alcohol-related crashes within 30 days of the collision.
10.1.1 Victim age. Of all the people who died in alcohol-related crashes within 12 months of the collision, 28.1% (see last column in the first section) were aged 20-25; 21.9% were aged 46-55; 15.6% were aged 26-35; 12.5% were aged 36-45 and over 55; and 9.4% aged 16-19.
The highest incidence of alcohol involvement occurred in the crashes in which a person aged 20-25 died (69.2%). The lowest incidence of alcohol involvement was found among fatalities under 16 and over 55 – 0.0% of persons under 16 and 21.1% of the fatalities over 55 died in crashes involving alcohol.
10.1.2 Gender. Of all the people who died in alcohol-related crashes within 12 months of the collision, 78.1% were males. The incidence of alcohol in crashes in which a male died (46.3%) was greater than the incidence of alcohol in crashes in which a female died (30.4%).
Age Group<16 2 2 100.0 0 0.0 0.0 2 2 100.0 0 0.0 0.016-19 12 11 91.7 3 27.3 9.4 12 11 91.7 3 27.3 9.420-25 13 13 100.0 9 69.2 28.1 13 13 100.0 8 61.5 25.026-35 9 9 100.0 5 55.6 15.6 9 9 100.0 5 55.6 15.636-45 11 10 90.9 4 40.0 12.5 11 10 90.9 4 40.0 12.546-55 13 13 100.0 7 53.8 21.9 13 13 100.0 7 53.8 21.9>55 23 19 82.6 4 21.1 12.5 22 19 86.4 4 21.1 12.5Gender
Male 58 54 93.1 25 46.3 78.1 58 54 93.1 25 46.3 78.1Female 25 23 92.0 7 30.4 21.9 24 23 95.8 6 26.1 18.8Victim TypeDriver/ Operator 59 56 94.9 23 41.1 71.9 58 56 96.6 23 41.1 71.9Passenger 16 16 100.0 9 56.3 28.1 16 16 100.0 8 50.0 25.0Pedestrian 8 5 62.5 0 0.0 0.0 8 5 62.5 0 0.0 0.0
Vehicle OccupiedAutomobiles 36 35 97.2 13 37.1 40.6 36 35 97.2 12 34.3 37.5Trucks/Vans 13 13 100.0 5 38.5 15.6 13 13 100.0 5 38.5 15.6Motorcycles 7 7 100.0 2 28.6 6.3 7 7 100.0 2 28.6 6.3Offroad Vehicles 18 17 94.4 12 70.6 37.5 18 17 94.4 12 70.6 37.5(Pedestrians) 8 5 62.5 0 0.0 0.0 8 5 62.5 0 0.0 0.0Unknown 1 0 0.0 0 0.0 0.0 0 0 0.0 0 0.0 0.0
Collision LocationPublic Road 74 71 95.9 28 39.4 87.5 74 71 95.9 27 38.0 87.1Offroad 9 6 66.7 4 66.7 12.5 8 6 75.0 4 66.7 12.9
TOTAL 83 77 92.8 32 41.6 100.0 82 77 93.9 32 41.6 100.0
No. of Deaths No.
Alcohol Use Known
% of total
No.
Persons Dying Within 30 Days of Collision
% of known
Table 10-1Deaths in Alcohol-Related Crashes: New Brunswick, 2012
Alcohol-Related Deaths (ARDs)
Alcohol-Related Deaths (ARDs)
% of all ARDs
% of all ARDs
Persons Dying Within 12 Months of Collision
% of known
No. of Deaths
Alcohol Use Known
No. % of total
No.Category of Victim

141
10.1.3 Victim type. Of all the people who died in alcohol-related crashes within 12 months of the collision, 71.9% were drivers/operators of a vehicle; 28.1% were passengers; and 0.0% were pedestrians.
Within each of the victim types, the highest incidence of alcohol involvement (56.3%) occurred in the crashes in which a passenger died. Alcohol was involved in 41.1% of the crashes in which a driver/operator died and 0.0% of those in which a pedestrian died.
10.1.4 Type of vehicle occupied. Of all the people who died in alcohol-related crashes within 12 months of the collision, 40.6% were automobile occupants; 37.5% were off-road vehicle occupants; 16.6% were truck/van occupants; and 6.3% were motorcyclists.
Within each of these vehicle types, the incidence of alcohol involvement in which an off-road vehicle occupant died was greater than the incidence of alcohol in crashes in which a truck/van occupant died (70.6% versus 38.5%). Among automobile occupants and motorcyclists, 37.1% and 28.6% died in alcohol-related crashes, respectively.
10.1.5 Collision location. Of all the people who died in alcohol-related crashes within 12 months of the collision, 87.5% died in a collision which occurred on a public road and 12.5% died in an off-road collision. However, the incidence of alcohol involvement in which a victim died in an alcohol-related crash was greater for those dying in off-road collisions (66.7%) than it was for persons dying in a collision which occurred on a public road (39.4%).
10.2 Alcohol in fatally injured drivers
This section presents information on the presence of alcohol, exclusively among drivers fatally injured within 12 months of the collision in New Brunswick during 2012. Table 10-2 shows the information by age group, gender, vehicle type, collision type (single vs. multiple), and duration between crash time and death time (within 12 months vs. within 30 days of the collision).
The first column in the table shows the number of drivers killed. The next columns show the number and percent of these victims who were tested for alcohol. The remaining columns provide information on the results of the alcohol tests: the first three of these present results for drivers who showed any evidence of alcohol; the last three columns present information on drivers who had BACs over the statutory limit of 80 mg%.
To illustrate, among 20-25 year olds there were four drivers killed during 2012; all four of these fatally injured drivers (100.0%) were tested for alcohol. Of those who were tested, one (25.0%) was positive for alcohol. This means that fatally injured drinking drivers aged 20-25 accounted for 8.3% of all drinking drivers who were killed.
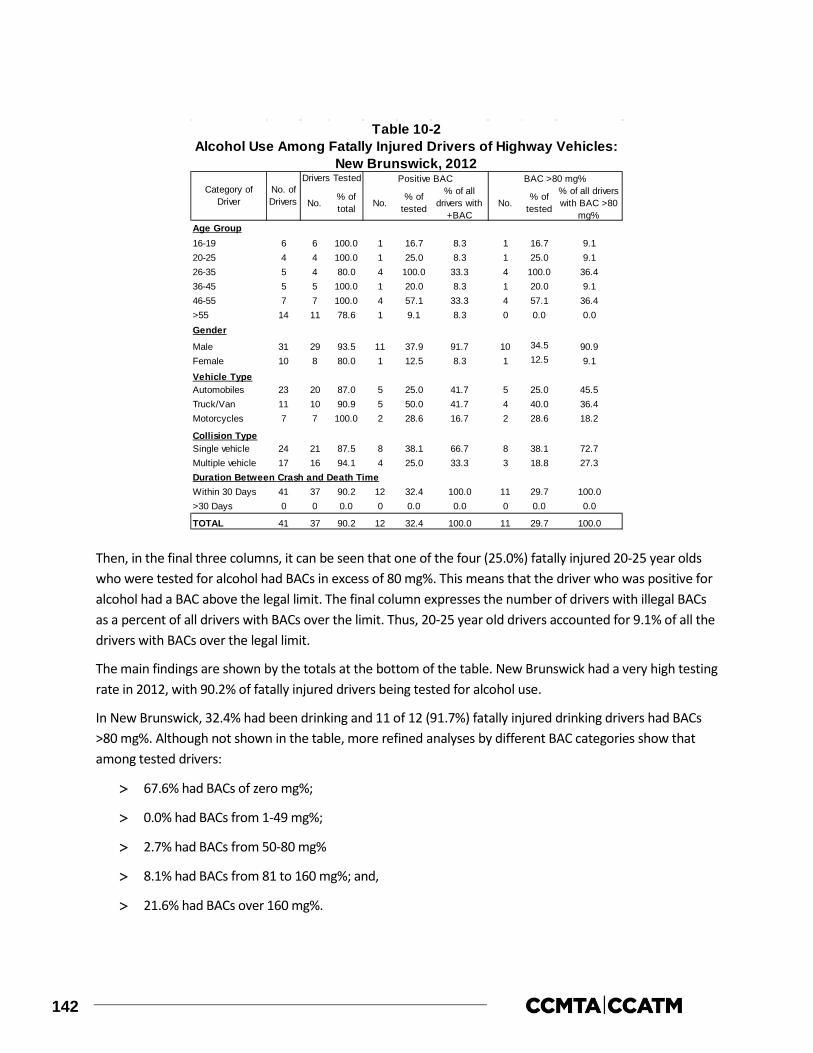
142
Then, in the final three columns, it can be seen that one of the four (25.0%) fatally injured 20-25 year olds who were tested for alcohol had BACs in excess of 80 mg%. This means that the driver who was positive for alcohol had a BAC above the legal limit. The final column expresses the number of drivers with illegal BACs as a percent of all drivers with BACs over the limit. Thus, 20-25 year old drivers accounted for 9.1% of all the drivers with BACs over the legal limit.
The main findings are shown by the totals at the bottom of the table. New Brunswick had a very high testing rate in 2012, with 90.2% of fatally injured drivers being tested for alcohol use.
In New Brunswick, 32.4% had been drinking and 11 of 12 (91.7%) fatally injured drinking drivers had BACs >80 mg%. Although not shown in the table, more refined analyses by different BAC categories show that among tested drivers:
> 67.6% had BACs of zero mg%;
> 0.0% had BACs from 1-49 mg%;
> 2.7% had BACs from 50-80 mg%
> 8.1% had BACs from 81 to 160 mg%; and,
> 21.6% had BACs over 160 mg%.
Age Group16-19 6 6 100.0 1 16.7 8.3 1 16.7 9.120-25 4 4 100.0 1 25.0 8.3 1 25.0 9.126-35 5 4 80.0 4 100.0 33.3 4 100.0 36.436-45 5 5 100.0 1 20.0 8.3 1 20.0 9.146-55 7 7 100.0 4 57.1 33.3 4 57.1 36.4>55 14 11 78.6 1 9.1 8.3 0 0.0 0.0Gender
Male 31 29 93.5 11 37.9 91.7 10 34.5 90.9Female 10 8 80.0 1 12.5 8.3 1 12.5 9.1
Vehicle TypeAutomobiles 23 20 87.0 5 25.0 41.7 5 25.0 45.5Truck/Van 11 10 90.9 5 50.0 41.7 4 40.0 36.4Motorcycles 7 7 100.0 2 28.6 16.7 2 28.6 18.2
Collision TypeSingle vehicle 24 21 87.5 8 38.1 66.7 8 38.1 72.7Multiple vehicle 17 16 94.1 4 25.0 33.3 3 18.8 27.3Duration Between Crash and Death TimeWithin 30 Days 41 37 90.2 12 32.4 100.0 11 29.7 100.0>30 Days 0 0 0.0 0 0.0 0.0 0 0.0 0.0
TOTAL 41 37 90.2 12 32.4 100.0 11 29.7 100.0
% of tested
Table 10-2Alcohol Use Among Fatally Injured Drivers of Highway Vehicles:
Positive BAC BAC >80 mg%% of all
drivers with +BAC
% of all drivers with BAC >80
mg%
% of tested No.
Category of Driver
No. of Drivers No.
Drivers Tested
% of total No.
New Brunswick, 2012

143
In Figure 10-1, the BAC distribution for tested fatally injured drivers is extrapolated to reflect the BAC distribution for all fatally injured drivers. In this figure 13 of 41 (31.7%) fatally injured drivers have a positive BAC. And among fatally injured drinking drivers, 12 (92.3%) have BACs over 80 mg%.
10.2.1 Age differences. Of all the fatally injured drinking drivers (i.e., those with positive BAC), 33.3% were aged 26-35 and 46-55; and 8.3% were aged 16-19, 20-25, 36-45 and over 55.
Of all the fatally injured legally impaired drivers (i.e., those with BACs over 80 mg%), 36.4% were aged 26-35 and 46-55; and 9.1% were aged 16-19, 20-25, and 36-45.
When comparing the incidence of drinking and driving among fatally injured drivers by age group, fatally injured drivers aged 26-35 were the most likely to have been drinking (100.0%). By contrast, 9.1% of the tested drivers over age 55 had been drinking.
10.2.2 Gender differences. Males dominate the picture – they account for 91.7% of the fatally injured drivers who had been drinking and 90.9% of those who were legally impaired.
Males dominate the picture largely because they account for most of the drivers who are killed (31 of the 41 fatalities or 75.6% are males). Fatally injured male drivers were more likely to have been drinking than female drivers (37.9% and 12.5%, respectively). And, 100.0% of the female drivers and 90.9% of the male drivers who were drinking had BACs over the legal limit.
10.2.3 Vehicle differences. Of all the fatally injured drinking drivers (i.e., those with a positive BAC), 41.7% were automobile drivers and truck/van drivers; and 16.7% were motorcyclists.
Of all the fatally injured legally impaired drivers (i.e., those with BACs over 80 mg%), 45.5% were automobile drivers, 36.4% were truck/van drivers; and 18.2% were motorcyclists.
Within each of the vehicle types, 50.0% of fatally injured truck/van drivers, 28.6% of motorcyclists and 25.0% of automobile drivers had been drinking.
10.2.4 Collision differences. Almost three-fifths of the drivers killed (24 of the 41) were involved in single-vehicle collisions but these crashes accounted two-thirds of the drivers who had been drinking or were legally impaired (66.7% and 72.7%, respectively).
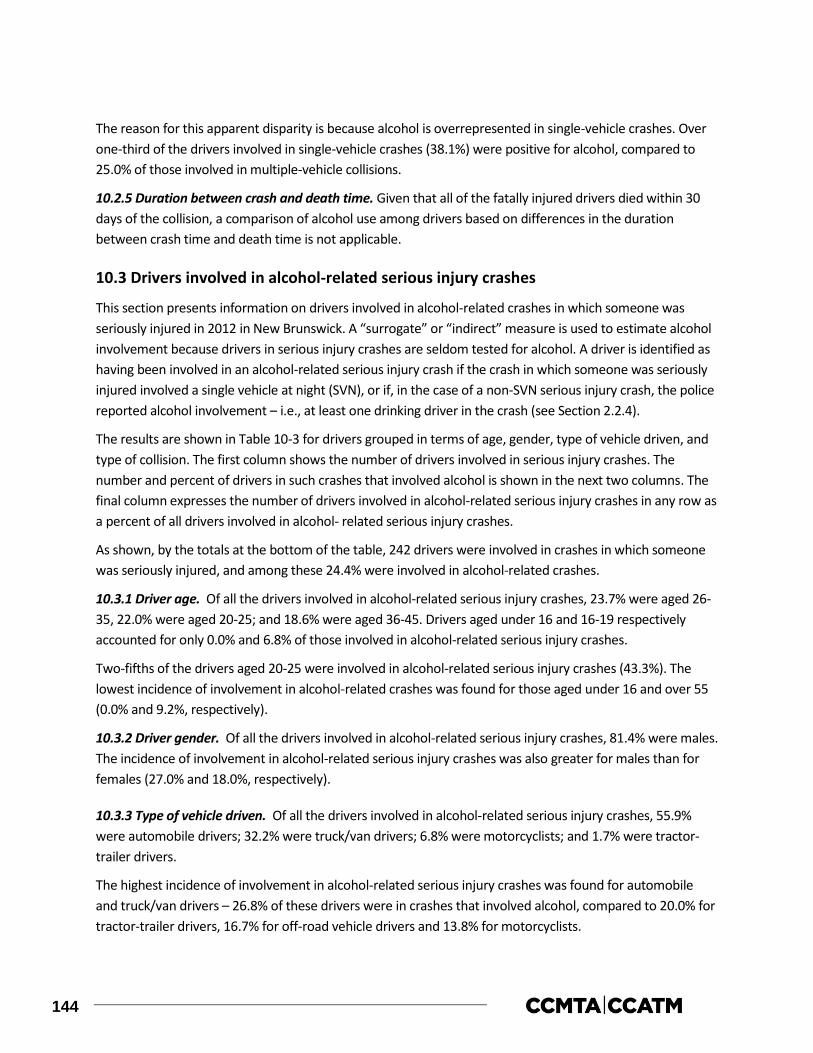
144
The reason for this apparent disparity is because alcohol is overrepresented in single-vehicle crashes. Over one-third of the drivers involved in single-vehicle crashes (38.1%) were positive for alcohol, compared to 25.0% of those involved in multiple-vehicle collisions.
10.2.5 Duration between crash and death time. Given that all of the fatally injured drivers died within 30 days of the collision, a comparison of alcohol use among drivers based on differences in the duration between crash time and death time is not applicable.
10.3 Drivers involved in alcohol-related serious injury crashes
This section presents information on drivers involved in alcohol-related crashes in which someone was seriously injured in 2012 in New Brunswick. A “surrogate” or “indirect” measure is used to estimate alcohol involvement because drivers in serious injury crashes are seldom tested for alcohol. A driver is identified as having been involved in an alcohol-related serious injury crash if the crash in which someone was seriously injured involved a single vehicle at night (SVN), or if, in the case of a non-SVN serious injury crash, the police reported alcohol involvement – i.e., at least one drinking driver in the crash (see Section 2.2.4).
The results are shown in Table 10-3 for drivers grouped in terms of age, gender, type of vehicle driven, and type of collision. The first column shows the number of drivers involved in serious injury crashes. The number and percent of drivers in such crashes that involved alcohol is shown in the next two columns. The final column expresses the number of drivers involved in alcohol-related serious injury crashes in any row as a percent of all drivers involved in alcohol- related serious injury crashes.
As shown, by the totals at the bottom of the table, 242 drivers were involved in crashes in which someone was seriously injured, and among these 24.4% were involved in alcohol-related crashes.
10.3.1 Driver age. Of all the drivers involved in alcohol-related serious injury crashes, 23.7% were aged 26-35, 22.0% were aged 20-25; and 18.6% were aged 36-45. Drivers aged under 16 and 16-19 respectively accounted for only 0.0% and 6.8% of those involved in alcohol-related serious injury crashes.
Two-fifths of the drivers aged 20-25 were involved in alcohol-related serious injury crashes (43.3%). The lowest incidence of involvement in alcohol-related crashes was found for those aged under 16 and over 55 (0.0% and 9.2%, respectively).
10.3.2 Driver gender. Of all the drivers involved in alcohol-related serious injury crashes, 81.4% were males. The incidence of involvement in alcohol-related serious injury crashes was also greater for males than for females (27.0% and 18.0%, respectively).
10.3.3 Type of vehicle driven. Of all the drivers involved in alcohol-related serious injury crashes, 55.9% were automobile drivers; 32.2% were truck/van drivers; 6.8% were motorcyclists; and 1.7% were tractor-trailer drivers.
The highest incidence of involvement in alcohol-related serious injury crashes was found for automobile and truck/van drivers – 26.8% of these drivers were in crashes that involved alcohol, compared to 20.0% for tractor-trailer drivers, 16.7% for off-road vehicle drivers and 13.8% for motorcyclists.
145
10.3.4 Type of collision. Of all the drivers involved in alcohol-related serious injury crashes, 76.3% of them were in single-vehicle crashes. The highest incidence of involvement in alcohol-related serious injury crashes was also found among drivers in single-vehicle crashes – 42.9% of these drivers, compared to only 10.2% for drivers involved in multiple-vehicle crashes.
10.4 Drug use among fatally injured drivers
This section presents information on the presence of drugs, exclusively among drivers fatally injured in New Brunswick during 2012. Table 10-4 shows the prevalence of drug use among fatally injured drivers of highway vehicles as well as the number of drivers who tested positive for various categories of drugs.
As can be seen, New Brunswick had a high testing rate in 2012, with 82.9% of fatally injured drivers being tested for drug use.
Among fatally injured tested drivers, nine out of 34 (26.5%) were positive for drugs. The most common category of drugs found within drivers testing positive for drug use was cannabis (44.4%). Other categories of drugs found in fatally injured drivers testing positive for drugs were narcotic analgesics and CNS depressants (33.3% each), and CNS stimulants (22.2%).
% of % of all drivers inNumber total alcohol-related crashes
Age<16 1 0 0.0 0.016-19 16 4 25.0 6.820-25 30 13 43.3 22.026-35 37 14 37.8 23.736-45 37 11 29.7 18.646-55 41 9 22.0 15.3>55 76 7 9.2 11.9unknown 4 1 25.0 1.7
GenderMale 178 48 27.0 81.4Female 61 11 18.0 18.6unknown 3 0 0.0 0.0
Vehicle TypeAuto 123 33 26.8 55.9Truck/Van 71 19 26.8 32.2Motorcycle 29 4 13.8 6.8Tractor Trailer 5 1 20.0 1.7Other Hwy. Vehicle 2 0 0.0 0.0Off-Road 12 2 16.7 3.4
Collision TypeSingle-Vehicle 105 45 42.9 76.3Multiple-Vehicle 137 14 10.2 23.7
TOTAL 242 59 24.4 100.0
Table 10-3Drivers in Alcohol-Related Serious Injury Crashes:
New Brunswick, 2012Category of Drivers Number of
Drivers
Alcohol-Related

146
10.5 Trends in alcohol and drug-impaired driving
Sections 10.1 through 10.3 examined three indicators of the alcohol-crash problem: (1) the number and percent of people who died in crashes that involved alcohol (within 12 months and 30 days of the collision); (2) the number and percent of fatally injured drivers who had been drinking; and (3) the number and percent of drivers in serious injury crashes that involved alcohol. Section 10.4 examined drug use among fatally injured drivers in 2012. This section examines changes in these four indicators over time.
10.5.1 Deaths in alcohol-related crashes: 1995-2012. Table 10-5 and Figure 10-2 show the number and percent of people who died in crashes involving a drinking driver from 1995 to 2012. These results differ slightly from those in Section 10.1 for two reasons. First, deaths that occur in crashes that involve a drinking pedestrian are not necessarily classified as alcohol-related deaths. The focus here is more restrictive, on deaths that occur in crashes involving at least one drinking driver. Second, the trend analyses focus on fatal crashes on public roadways involving principal vehicle types (where at least one of the vehicles involved is an automobile, truck/van, motorcycle or other highway vehicle). The previous analyses included all types of motorized vehicles (e.g., snowmobiles) on both public roadways and in off-road locations.
As shown in the figure, the number of deaths in crashes that involved a drinking driver generally dropped from 42 in 1995 to 25 in 2004, rose to 40 in 2010, fell to a low of 23 in 2011 and remained at this level in 2012. The percentage of alcohol-related fatalities generally decreased from 37.5% in 1995 to its lowest level in 2000 (27.4%), peaked at 41.2% in 2010, decreased to 34.8% in 2011, and rose to 36.5% in 2012.
As shown at the bottom of the table, during the 2006-2010 baseline period there was an average of 31 fatalities involving a drinking driver and they accounted for 35.2% of all fatalities. This means that the
Number % of total Number % of tested41 34 (82.9) 9 (26.5)
4332000
* Percentages will not add up to 100% due to multiple drug types found in blood samples of some drivers.
Positive for Drug TypeNumber of
Drivers(44.4)
(22.2)HallucinogensDissociative AnestheticsInhalants
(0.0)(0.0)(0.0)
Drug Use Among Fatally Injured Drivers of Highway Vehicles: New Brunswick, 2012
Table 10-4
Cannabis
CNS Stimulants
Drivers TestedNumber of Drivers
Positive for DrugsPrevalence of Drug Use
Narcotic Analgesics (33.3)CNS Depressants (33.3)
Categories of Drugs Found Among Drivers Testing
Drug Category % of drivers testing positive*

147
percent of fatalities involving a drinking driver increased by 0.6% from 35.2% in the baseline period (2006-2010) to 35.4% in the 2011-2012 period. However, in terms of the number of persons killed in crashes involving a drinking driver, there has been a 1.1% decrease from an average of 31 in the baseline period (2006-2010) to 23 in the 2011-2012 period.
Number % of total Number % of total1995 112 42 37.5 112 42 37.51996 96 33 34.4 96 33 34.41997 106 38 35.8 105 38 36.21998 96 31 32.3 96 31 32.31999 111 33 29.7 111 33 29.72000 95 26 27.4 93 25 26.92001 95 33 34.7 95 33 34.72002 109 38 34.9 106 37 34.92003 93 36 38.7 93 36 38.72004 76 25 32.9 75 25 33.32005 108 36 33.3 108 36 33.32006 105 30 28.6 105 30 28.62007 90 35 38.9 90 35 38.92008 74 26 35.1 73 25 34.22009 72 26 36.1 69 25 36.22010 97 40 41.2 95 39 41.12011 66 23 34.8 66 23 34.82012 63 23 36.5 63 23 36.5
2006-2010baseline
2011-2012period
** only on public roadways involving principal vehicle types.
35.465 23 35.4 65 23
* numbers are estimates based on the percent of deaths for which information was available to determine alcohol use.
Number of Deaths
Alcohol-Related Deaths
Persons Dying Within 30 Days of Collision
Table 10-5Number* and Percent of Motor Vehicle Deaths** Involving a
Drinking Driver: New Brunswick, 1995-2012
Alcohol-Related Deaths
Persons Dying Within 12 Months of Collision
Year of Death
Number of Deaths
88 31 35.2 86 31 36.0

148
10.5.2 Alcohol use among fatally injured drivers: Data on alcohol use among fatally injured drivers over the 26-year period from 1987-2012 are shown in Table 10-6. Trends are illustrated in Figure 10-3 which shows changes in the percent of fatally injured drivers who: (1) showed no evidence of alcohol (represented by the white area); (2) had BACs below the legal limit (shown by the light grey area); and (3) had BACs over the legal limit (the dark grey area). The data reported here are restricted to drivers who died in less than six hours after the crash (see Section 2.2.2).
As can be seen, the percentage of fatally injured drivers with BACs over the legal limit fluctuated, peaking in 1993 (56.0%), declining to its lowest mark in 2005 (27.5%), fluctuating until 2010 (42.0%), and decreasing until 2012 (26.5%). The percent of fatally injured drivers with zero BACs generally increased from 1987 (46.8%) to 2000 (66.7%), fluctuated until 2005 (66.7%), declined in 2007 (51.1%), and eventually peaked in 2012 (70.6%). The percent of fatally injured drivers with BACs between 1 and 80 mg% declined until 1990 (0.0%), peaked in 2007 (11.1%), decreased until 2011 (2.7%), and rose slightly in 2012 (2.9%).
When compared to the 2006-2010 baseline period shown at the bottom of Table 10-6, the percentage of fatally injured drivers with zero BACs in the 2011-2012 period increased by 22.2% (from 56.8% to 69.4%). Among drivers with BACs from 1-80 mg%, there was a 58.8% decrease (from 6.8% to 2.8%). And among drivers with BACs over 80 mg%, there was a 23.6% decrease (from 36.4% to 27.8%).
No. (% Total) Zero (% Tested) 1-80 (% Tested) >80 (% Tested)1987 73 62 84.9 29 46.8 6 9.7 27 43.51988 82 59 72.0 29 49.2 3 5.1 27 45.81989 68 46 67.6 23 50.0 2 4.3 21 45.71990 78 74 94.9 48 64.9 0 0.0 26 35.11991 51 50 98.0 25 50.0 4 8.0 21 42.01992 64 55 85.9 28 50.9 1 1.8 26 47.31993 70 50 71.4 18 36.0 4 8.0 28 56.01994 38 34 89.5 16 47.1 1 2.9 17 50.01995 61 52 85.2 28 53.8 4 7.7 20 38.51996 53 49 92.5 30 61.2 4 8.2 15 30.61997 54 51 94.4 28 54.9 5 9.8 18 35.31998 51 47 92.2 27 57.4 2 4.3 18 38.31999 54 49 90.7 32 65.3 2 4.1 15 30.62000 39 36 92.3 24 66.7 2 5.6 10 27.82001 44 37 84.1 17 45.9 4 10.8 16 43.22002 51 48 94.1 28 58.3 2 4.2 18 37.52003 54 52 96.3 31 59.6 4 7.7 17 32.72004 38 35 92.1 23 65.7 2 5.7 10 28.62005 53 51 96.2 34 66.7 3 5.9 14 27.52006 56 53 94.6 35 66.0 2 3.8 16 30.22007 45 45 100.0 23 51.1 5 11.1 17 37.82008 34 34 100.0 18 52.9 2 5.9 14 41.22009 39 39 100.0 23 59.0 2 5.1 14 35.92010 51 50 98.0 27 54.0 2 4.0 21 42.02011 39 37 94.9 25 67.6 1 2.7 11 29.72012 34 34 100.0 24 70.6 1 2.9 9 26.5
2006-2010baseline
2011-2012period
* dying in less than six hours.
Table 10-6
Drivers Grouped by BAC (mg%)
Alcohol Use Among Fatally Injured Drivers of Highway Vehicles:New Brunswick, 1987-2012
25 (56.8) 3 (6.8) 16 (36.4)
Year Number of Drivers*
Drivers Tested
45 44 (97.8)
1 (2.8) 10 (27.8)37 36 (97.3) 25 (69.4)
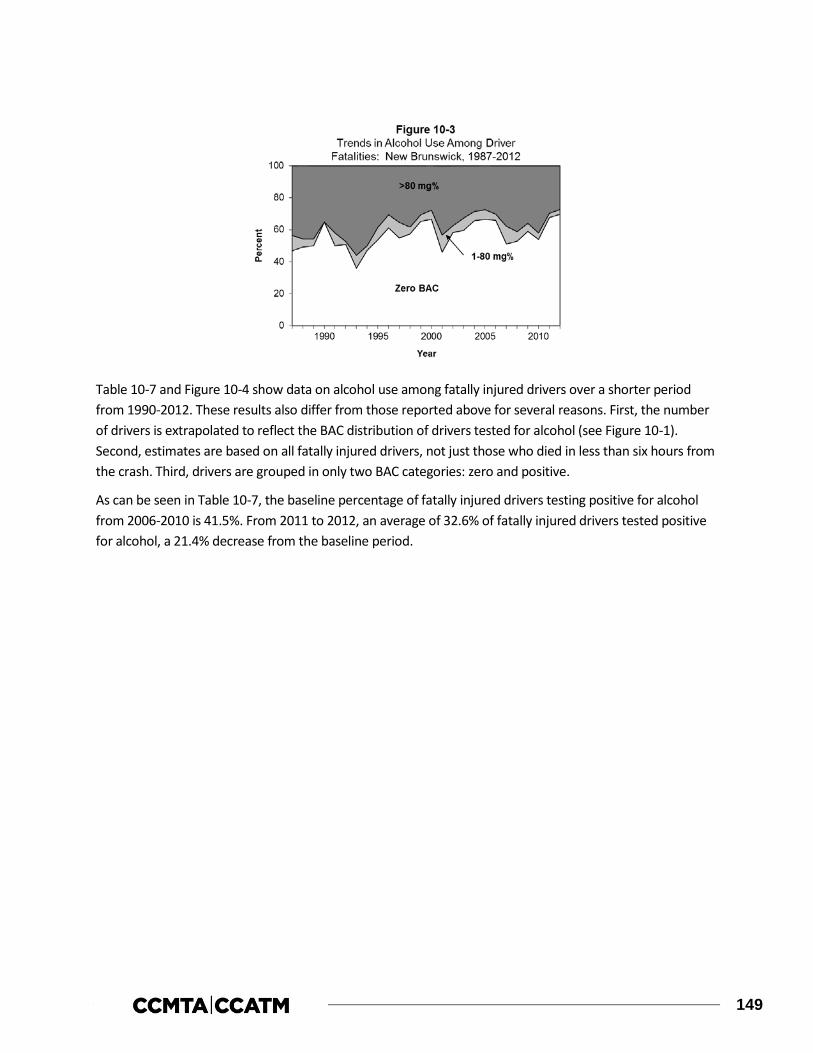
149
Table 10-7 and Figure 10-4 show data on alcohol use among fatally injured drivers over a shorter period from 1990-2012. These results also differ from those reported above for several reasons. First, the number of drivers is extrapolated to reflect the BAC distribution of drivers tested for alcohol (see Figure 10-1). Second, estimates are based on all fatally injured drivers, not just those who died in less than six hours from the crash. Third, drivers are grouped in only two BAC categories: zero and positive.
As can be seen in Table 10-7, the baseline percentage of fatally injured drivers testing positive for alcohol from 2006-2010 is 41.5%. From 2011 to 2012, an average of 32.6% of fatally injured drivers tested positive for alcohol, a 21.4% decrease from the baseline period.
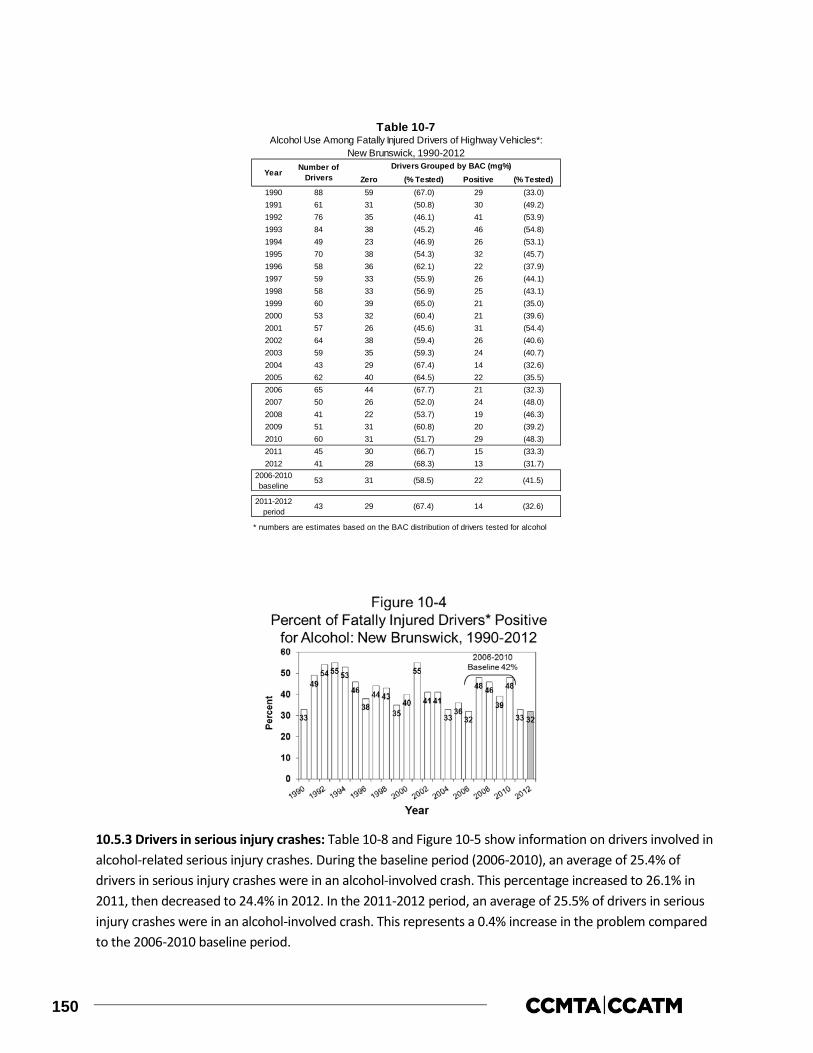
150
10.5.3 Drivers in serious injury crashes: Table 10-8 and Figure 10-5 show information on drivers involved in alcohol-related serious injury crashes. During the baseline period (2006-2010), an average of 25.4% of drivers in serious injury crashes were in an alcohol-involved crash. This percentage increased to 26.1% in 2011, then decreased to 24.4% in 2012. In the 2011-2012 period, an average of 25.5% of drivers in serious injury crashes were in an alcohol-involved crash. This represents a 0.4% increase in the problem compared to the 2006-2010 baseline period.
Zero (% Tested) Positive (% Tested)1990 88 59 (67.0) 29 (33.0)1991 61 31 (50.8) 30 (49.2)1992 76 35 (46.1) 41 (53.9)1993 84 38 (45.2) 46 (54.8)1994 49 23 (46.9) 26 (53.1)1995 70 38 (54.3) 32 (45.7)1996 58 36 (62.1) 22 (37.9)1997 59 33 (55.9) 26 (44.1)1998 58 33 (56.9) 25 (43.1)1999 60 39 (65.0) 21 (35.0)2000 53 32 (60.4) 21 (39.6)2001 57 26 (45.6) 31 (54.4)2002 64 38 (59.4) 26 (40.6)2003 59 35 (59.3) 24 (40.7)2004 43 29 (67.4) 14 (32.6)2005 62 40 (64.5) 22 (35.5)2006 65 44 (67.7) 21 (32.3)2007 50 26 (52.0) 24 (48.0)2008 41 22 (53.7) 19 (46.3)2009 51 31 (60.8) 20 (39.2)2010 60 31 (51.7) 29 (48.3)2011 45 30 (66.7) 15 (33.3)2012 41 28 (68.3) 13 (31.7)
2006-2010baseline
2011-2012period
* numbers are estimates based on the BAC distribution of drivers tested for alcohol
43 29 (67.4) 14 (32.6)
53 31 (58.5) 22 (41.5)
Table 10-7Alcohol Use Among Fatally Injured Drivers of Highway Vehicles*:
New Brunswick, 1990-2012
Year Number of Drivers
Drivers Grouped by BAC (mg%)
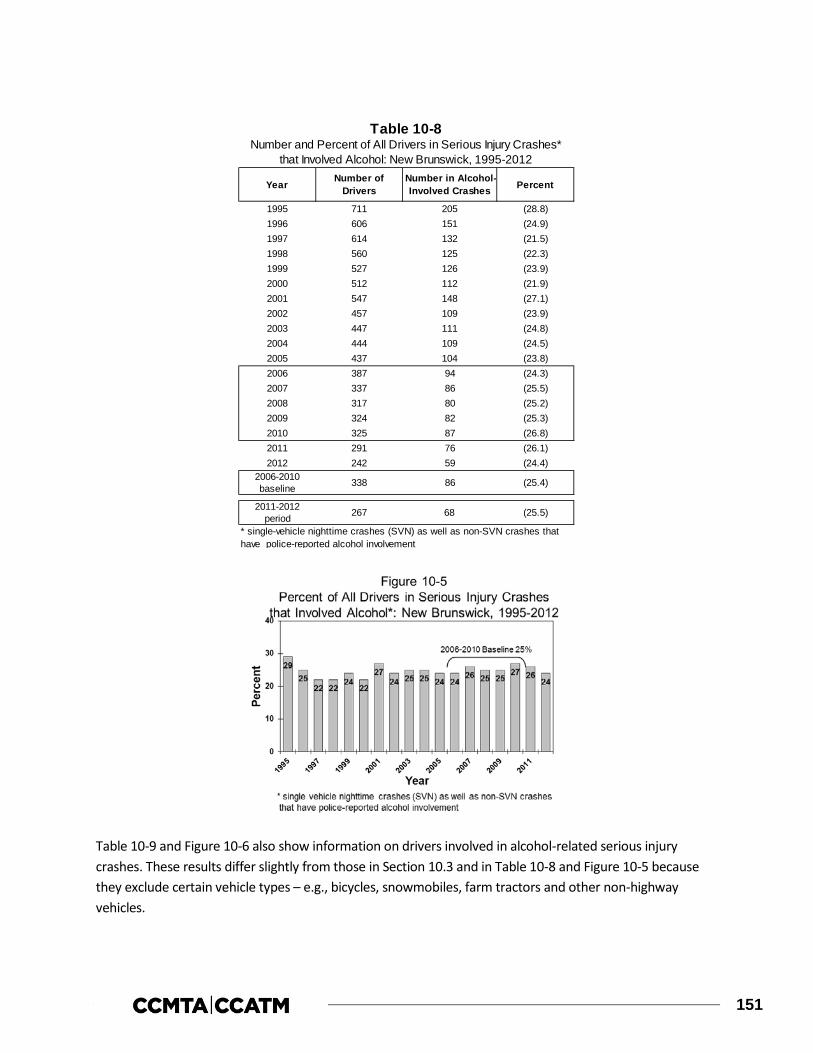
151
Table 10-9 and Figure 10-6 also show information on drivers involved in alcohol-related serious injury crashes. These results differ slightly from those in Section 10.3 and in Table 10-8 and Figure 10-5 because they exclude certain vehicle types – e.g., bicycles, snowmobiles, farm tractors and other non-highway vehicles.
Year Number of Drivers
Number in Alcohol-Involved Crashes Percent
1995 711 205 (28.8)1996 606 151 (24.9)1997 614 132 (21.5)1998 560 125 (22.3)1999 527 126 (23.9)2000 512 112 (21.9)2001 547 148 (27.1)2002 457 109 (23.9)2003 447 111 (24.8)2004 444 109 (24.5)2005 437 104 (23.8)2006 387 94 (24.3)2007 337 86 (25.5)2008 317 80 (25.2)2009 324 82 (25.3)2010 325 87 (26.8)2011 291 76 (26.1)2012 242 59 (24.4)
2006-2010baseline
2011-2012period
* single-vehicle nighttime crashes (SVN) as well as non-SVN crashes that have police-reported alcohol involvement
Table 10-8Number and Percent of All Drivers in Serious Injury Crashes*
that Involved Alcohol: New Brunswick, 1995-2012
338 86 (25.4)
267 68 (25.5)

152
As can be seen, the incidence of alcohol-involvement in serious injury crashes has fluctuated over this 18-year period. Between 1995 and 1997 the percentage of all drivers in serious injury crashes that involved alcohol dropped from 29.2% to 21.0%. Since then, the incidence fluctuated until 2007 (26.0%), declined slightly to 25.6% in 2009, rose in 2010 (27.5%), and decreased until 2012 (24.8%).
In the baseline period (2006-2010), an average of 25.6% of drivers in serious injury crashes were in an alcohol-involved crash. In the 2011-2012 period, the percentage of drivers in serious injury crashes involving alcohol was 26.4%, resulting in a 3.1% increase.
Number ofDrivers
1995 681 199 (29.2)1996 597 146 (24.5)1997 561 118 (21.0)1998 542 121 (22.3)1999 512 124 (24.2)2000 493 112 (22.7)2001 511 142 (27.8)2002 439 105 (23.9)2003 426 110 (25.8)2004 425 108 (25.4)2005 429 102 (23.8)2006 369 89 (24.1)2007 327 85 (26.0)2008 302 78 (25.8)2009 313 80 (25.6)2010 309 85 (27.5)2011 277 76 (27.4)2012 230 57 (24.8)
2006-2010baseline
2011-2012period
Table 10-9Number and Percent of Drivers* of Highway Vehicles in Serious
Injury Crashes** that Involved Alcohol: New Brunswick, 1995-2012
Year PercentNumber in Alcohol-Involved Crashes
** single-vehicle nighttime crashes (SVN) as well as non-SVN crashes that have police-reported alcohol involvement
* excludes operators of bicycles, snowmobiles, farm tractors, and other non-highway vehicles.
324 83 (25.6)
254 67 (26.4)
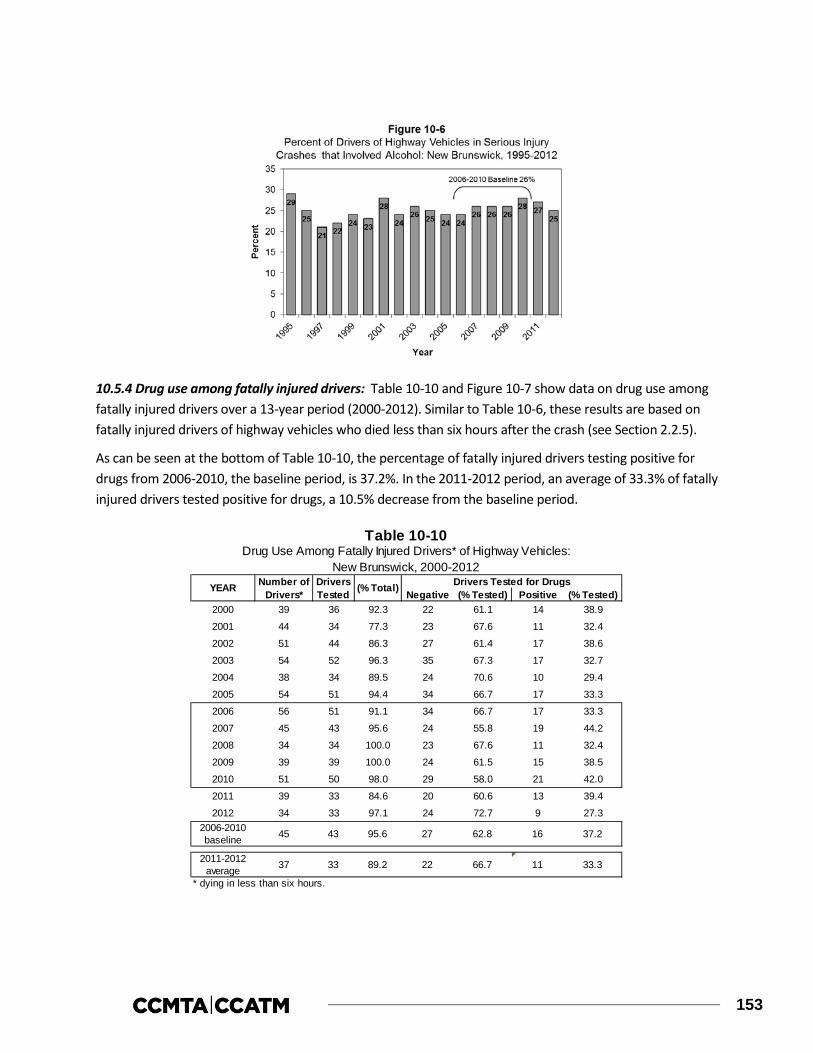
153
10.5.4 Drug use among fatally injured drivers: Table 10-10 and Figure 10-7 show data on drug use among fatally injured drivers over a 13-year period (2000-2012). Similar to Table 10-6, these results are based on fatally injured drivers of highway vehicles who died less than six hours after the crash (see Section 2.2.5).
As can be seen at the bottom of Table 10-10, the percentage of fatally injured drivers testing positive for drugs from 2006-2010, the baseline period, is 37.2%. In the 2011-2012 period, an average of 33.3% of fatally injured drivers tested positive for drugs, a 10.5% decrease from the baseline period.
Negative (% Tested) Positive (% Tested)2000 39 36 92.3 22 61.1 14 38.9
2001 44 34 77.3 23 67.6 11 32.4
2002 51 44 86.3 27 61.4 17 38.6
2003 54 52 96.3 35 67.3 17 32.7
2004 38 34 89.5 24 70.6 10 29.4
2005 54 51 94.4 34 66.7 17 33.3
2006 56 51 91.1 34 66.7 17 33.3
2007 45 43 95.6 24 55.8 19 44.2
2008 34 34 100.0 23 67.6 11 32.4
2009 39 39 100.0 24 61.5 15 38.5
2010 51 50 98.0 29 58.0 21 42.0
2011 39 33 84.6 20 60.6 13 39.4
2012 34 33 97.1 24 72.7 9 27.32006-2010baseline
2011-2012average
* dying in less than six hours.
16 37.2
Drug Use Among Fatally Injured Drivers* of Highway Vehicles: New Brunswick, 2000-2012
45 43 95.6 27 62.8
Table 10-10
YEAR Number of Drivers*
Drivers Tested (% Total) Drivers Tested for Drugs
11 33.337 33 89.2 22 66.7
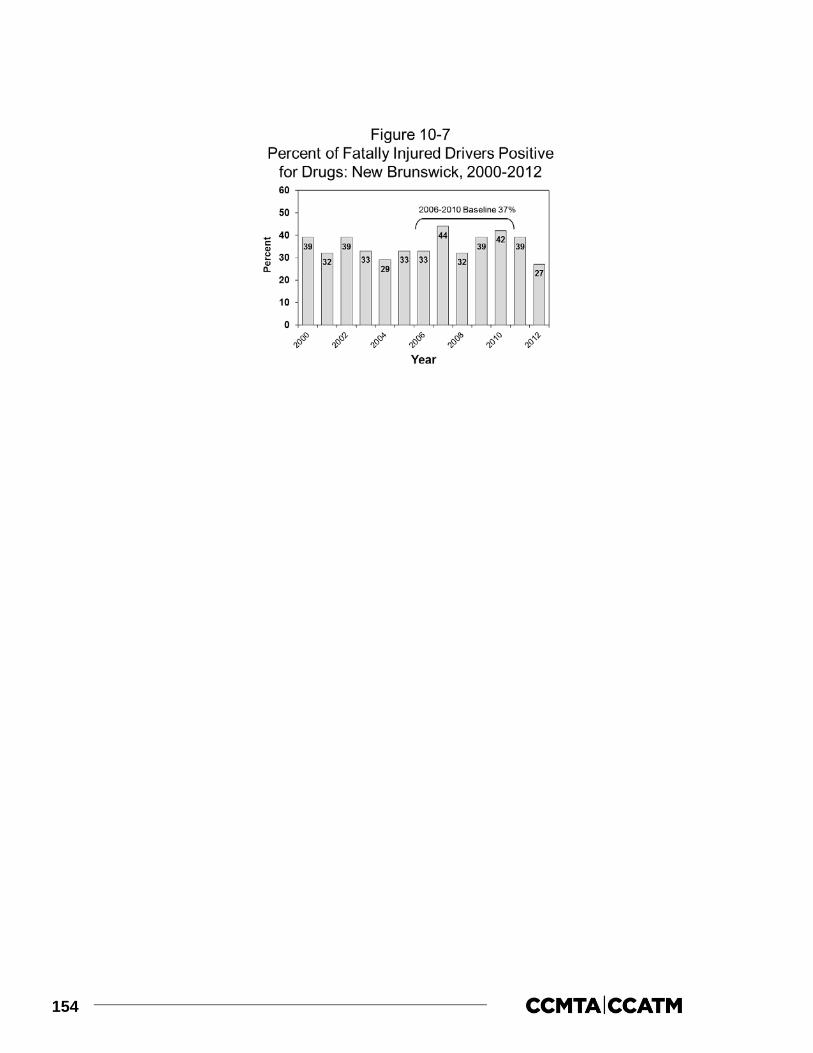
154

155
11.0 NOVA SCOTIA
This section of the report reviews the major findings on alcohol involvement in fatal and serious injury motor vehicle collisions as well as drug involvement in fatal motor vehicle collisions in Nova Scotia during 2012. It describes data on:
> people who were killed in alcohol-related crashes (Section 11.1);
> alcohol use among fatally injured drivers (Section 11.2);
> drivers involved in alcohol-related serious injury crashes (Section 11.3);
> drug use among fatally injured drivers (Section 11.4); and,
> trends in the alcohol-crash and drug-crash problems (Section 11.5).
11.1 Deaths in alcohol-related crashes
Table 11-1 presents information on people who died in alcohol-related crashes in Nova Scotia during 2012 for persons dying within 12 months of the collision (one calendar year) and for persons dying within 30 days of the collision. Motor vehicle deaths are categorized in terms of the victim’s age, gender, type (i.e., driver, passenger, pedestrian) and the type of vehicle they occupied. In each section, the first column in the table presents the number of deaths. The next two columns show the number and percent of these fatalities in which sufficient information was available to determine if alcohol was involved. A motor vehicle fatality was considered to be alcohol involved if there was at least one drinking driver or drinking pedestrian in the fatal crash.
For example, within the first section, it can be seen that among persons dying within 12 months of the collision, 18 people aged 46-55 were killed in motor vehicle crashes in Nova Scotia during 2012. And, in 17 cases (94.4%) it was possible to determine if alcohol was a factor in the crash. The next column shows the number of people killed in crashes that were known to be alcohol-involved. There were eight people aged 46-55 who died in alcohol-related crashes in Nova Scotia during 2012. The next column expresses this as a percentage – i.e., 47.1% of the 46-55 year olds who were killed died in an alcohol-related crash.
The final column (percent of all alcohol-related deaths) expresses the number of deaths in alcohol-related crashes as a percent of all the deaths in such crashes. For example, the alcohol-related deaths among 46-55 year olds represent 27.6% of all the people killed in alcohol-related crashes in Nova Scotia during 2012.
An examination of the section for persons dying within 30 days of the collision shows that 18 persons aged 46-55 died in motor vehicle crashes. In 17 of these cases (94.4%), it was possible to determine if alcohol was a factor in the crash. Among these persons, eight (47.1%) were alcohol-related deaths. And 46-55 year olds accounted for 27.6% of people dying in alcohol-related crashes.
The totals at the bottom of the table provide a summary. As can be seen, 92 persons died within 12 months of a motor vehicle crash in Nova Scotia during 2012. In 88 (95.7%) of these cases, it was possible to
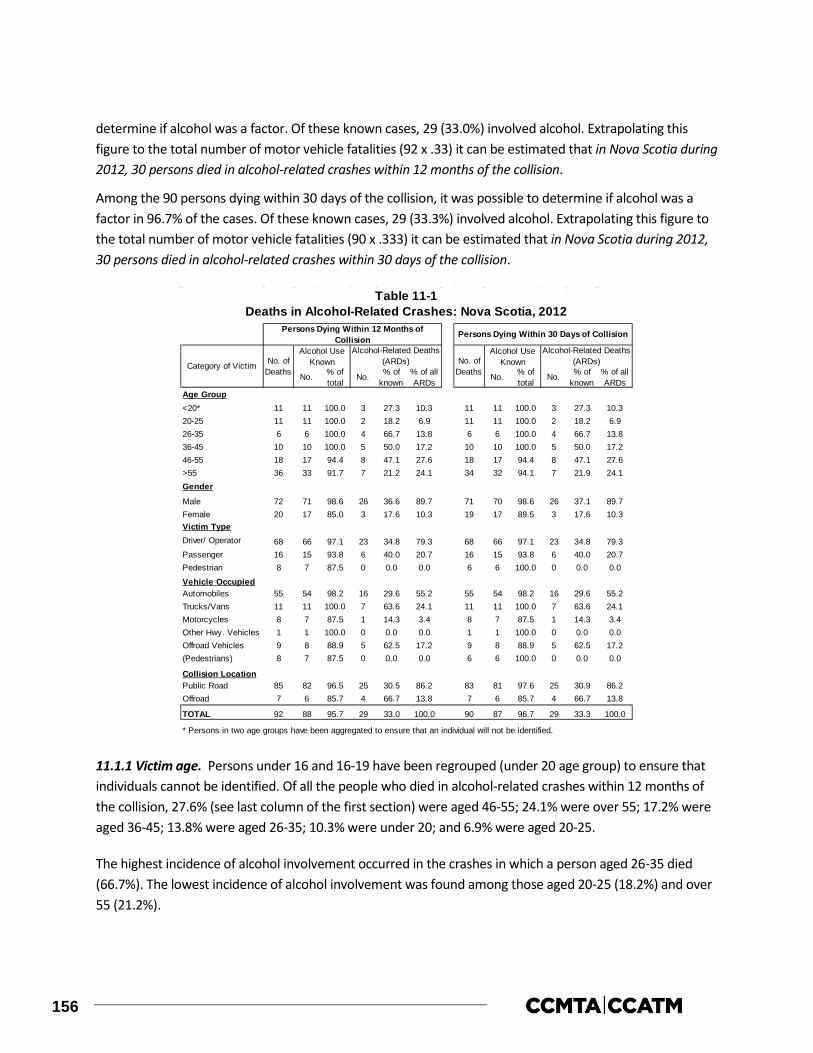
156
determine if alcohol was a factor. Of these known cases, 29 (33.0%) involved alcohol. Extrapolating this figure to the total number of motor vehicle fatalities (92 x .33) it can be estimated that in Nova Scotia during 2012, 30 persons died in alcohol-related crashes within 12 months of the collision.
Among the 90 persons dying within 30 days of the collision, it was possible to determine if alcohol was a factor in 96.7% of the cases. Of these known cases, 29 (33.3%) involved alcohol. Extrapolating this figure to the total number of motor vehicle fatalities (90 x .333) it can be estimated that in Nova Scotia during 2012, 30 persons died in alcohol-related crashes within 30 days of the collision.
11.1.1 Victim age. Persons under 16 and 16-19 have been regrouped (under 20 age group) to ensure that individuals cannot be identified. Of all the people who died in alcohol-related crashes within 12 months of the collision, 27.6% (see last column of the first section) were aged 46-55; 24.1% were over 55; 17.2% were aged 36-45; 13.8% were aged 26-35; 10.3% were under 20; and 6.9% were aged 20-25.
The highest incidence of alcohol involvement occurred in the crashes in which a person aged 26-35 died (66.7%). The lowest incidence of alcohol involvement was found among those aged 20-25 (18.2%) and over 55 (21.2%).
Age Group<20* 11 11 100.0 3 27.3 10.3 11 11 100.0 3 27.3 10.320-25 11 11 100.0 2 18.2 6.9 11 11 100.0 2 18.2 6.926-35 6 6 100.0 4 66.7 13.8 6 6 100.0 4 66.7 13.836-45 10 10 100.0 5 50.0 17.2 10 10 100.0 5 50.0 17.246-55 18 17 94.4 8 47.1 27.6 18 17 94.4 8 47.1 27.6>55 36 33 91.7 7 21.2 24.1 34 32 94.1 7 21.9 24.1Gender
Male 72 71 98.6 26 36.6 89.7 71 70 98.6 26 37.1 89.7Female 20 17 85.0 3 17.6 10.3 19 17 89.5 3 17.6 10.3Victim TypeDriver/ Operator 68 66 97.1 23 34.8 79.3 68 66 97.1 23 34.8 79.3Passenger 16 15 93.8 6 40.0 20.7 16 15 93.8 6 40.0 20.7Pedestrian 8 7 87.5 0 0.0 0.0 6 6 100.0 0 0.0 0.0
Vehicle OccupiedAutomobiles 55 54 98.2 16 29.6 55.2 55 54 98.2 16 29.6 55.2Trucks/Vans 11 11 100.0 7 63.6 24.1 11 11 100.0 7 63.6 24.1Motorcycles 8 7 87.5 1 14.3 3.4 8 7 87.5 1 14.3 3.4Other Hwy. Vehicles 1 1 100.0 0 0.0 0.0 1 1 100.0 0 0.0 0.0Offroad Vehicles 9 8 88.9 5 62.5 17.2 9 8 88.9 5 62.5 17.2(Pedestrians) 8 7 87.5 0 0.0 0.0 6 6 100.0 0 0.0 0.0
Collision LocationPublic Road 85 82 96.5 25 30.5 86.2 83 81 97.6 25 30.9 86.2Offroad 7 6 85.7 4 66.7 13.8 7 6 85.7 4 66.7 13.8
TOTAL 92 88 95.7 29 33.0 100.0 90 87 96.7 29 33.3 100.0
* Persons in two age groups have been aggregated to ensure that an individual will not be identified.
No. of Deaths No.
Alcohol Use Known
% of total
No.
Persons Dying Within 30 Days of Collision
% of known
Table 11-1Deaths in Alcohol-Related Crashes: Nova Scotia, 2012
Alcohol-Related Deaths (ARDs)
Alcohol-Related Deaths (ARDs)
% of all ARDs
% of all ARDs
Persons Dying Within 12 Months of Collision
% of known
No. of Deaths
Alcohol Use Known
No. % of total
No.Category of Victim

157
11.1.2 Gender. Of all the people who died in alcohol-related crashes within 12 months of the collision, 89.7% were males. The incidence of alcohol in crashes in which a male died (36.6%) was greater than the incidence of alcohol in crashes in which a female died (17.6%).
11.1.3 Victim type. Of all the people who died in alcohol-related crashes within 12 months of the collision, 79.3% were drivers/operators of a vehicle; 20.7% were passengers; and 0.0% were pedestrians.
Within each of the victim types, the highest incidence of alcohol involvement (40.0%) occurred in the crashes in which a passenger died. Alcohol was involved in 34.8% of the crashes in which a driver/operator died and 0.0% of those in which a pedestrian died.
11.1.4 Type of vehicle occupied. Of all the people who died in alcohol-related crashes within 12 months of the collision, 55.2% were in an automobile; 24.1% were truck/van occupants; 17.2% were off-road vehicle occupants; and 3.4% were motorcyclists.
Within each of these vehicle types, the incidence of alcohol involvement in which a truck/van occupant died was greater than the incidence of alcohol in crashes in which an automobile occupant died (63.6% versus 29.6%).
The number of fatalities in each of the other types of vehicles is too small to produce reliable estimates of alcohol-involvement.
11.1.5 Collision location. Of all the people who died in alcohol-related crashes within 12 months of the collision, 86.2% died in a collision which occurred on a public road and 13.8% died in an off-road collision. However, the incidence of alcohol involvement in which a victim died in an alcohol-related crash was greater for those dying in off-road collisions (66.7%) than it was for persons dying in a collision which on a public road (30.5%).
11.2 Alcohol in fatally injured drivers
This section presents information on the presence of alcohol, exclusively among drivers fatally injured within 12 months of the collision in Nova Scotia during 2012. Table 11-2 shows the information by age group, gender, vehicle type, collision type (single vs. multiple), and duration between crash time (within 12 months of the collision vs. within 30 days of the collision).
The first column in the table shows the number of drivers killed. The next columns show the number and percent of these victims who were tested for alcohol. The remaining columns provide information on the results of the alcohol tests – the first three of these present results for drivers who showed any evidence of alcohol; the last three columns present information on drivers who had BACs over the statutory limit of 80 mg%.
To illustrate, among 20-25 year olds there were nine drivers killed during 2012; eight of these fatally injured drivers (88.9%) were tested for alcohol. Of those who were tested, one (12.5%) was positive for alcohol. This means that 20-25 year old fatally injured drinking drivers accounted for 6.7% of all drinking drivers who were killed.

158
Then, in the final three columns, it can be seen that one of the eight (12.5%) fatally injured 20-25 year olds who were tested for alcohol had BACs in excess of 80 mg%. The final column expresses the number of drivers with illegal BACs as a percent of all drivers with BACs over the limit. Thus, 20-25 year old drivers accounted for 7.7% of all the drivers with BACs over the legal limit.
The main findings are shown by the totals at the bottom of the table. Nova Scotia had a very high testing rate in 2012, with 91.7% of fatally injured drivers being tested for alcohol use.
In Nova Scotia, 27.3% had been drinking and 13 of 15 (86.7%) fatally injured drinking drivers had BACs over 80 mg%. Although not shown in the table, more refined analyses by different BAC categories show that among tested drivers:
> 72.7% had BACs of zero mg%
> 3.6% had BACs from 1-49 mg%;
> 0.0% had BACs from 50-80 mg%
> 9.1% had BACs from 81 to 160 mg%; and,
> 14.5% had BACs over 160 mg%.
Age Group<20* 5 5 100.0 2 40.0 13.3 1 20.0 7.720-25 9 8 88.9 1 12.5 6.7 1 12.5 7.726-35 2 2 100.0 1 50.0 6.7 1 50.0 7.736-45 8 8 100.0 5 62.5 33.3 5 62.5 38.546-55 13 12 92.3 3 25.0 20.0 3 25.0 23.1>55 23 20 87.0 3 15.0 20.0 2 10.0 15.4Gender
Male 48 45 93.8 14 31.1 93.3 12 26.7 92.3Female 12 10 83.3 1 10.0 6.7 1 10.0 7.7
Vehicle TypeAutomobiles 43 41 95.3 11 26.8 73.3 10 24.4 76.9Truck/Van 8 6 75.0 3 50.0 20.0 2 33.3 15.4Motorcycles 8 7 87.5 1 14.3 6.7 1 14.3 7.7Tractor Trailer 1 1 100.0 0 0.0 0.0 0 0.0 0.0
Collision TypeSingle vehicle 33 30 90.9 11 36.7 73.3 9 30.0 69.2Multiple vehicle 27 25 92.6 4 16.0 26.7 4 16.0 30.8Duration Between Crash and Death TimeWithin 30 Days 60 55 91.7 15 27.3 100.0 13 23.6 100.0> 30 Days 0 0 0.0 0 0.0 0.0 0 0.0 0.0
TOTAL 60 55 91.7 15 27.3 100.0 13 23.6 100.0
* Drivers in two age groups have been aggregated to ensure that an individual will not be identified.
% of tested
Table 11-2Alcohol Use Among Fatally Injured Drivers of Highway Vehicles:
Nova Scotia, 2012Positive BAC BAC >80 mg%
% of all drivers with
+BAC
% of all drivers with BAC >80
mg%
% of tested No.
Category of Driver
No. of Drivers No.
Drivers Tested
% of total No.

159
The BAC distribution for fatally injured drivers is shown in Figure 11-1. In this figure 16 of 60 (26.7%) fatally injured drivers have a positive BAC. And among fatally injured drinking drivers, 14 (87.5%) have BACs over 80 mg%.
11.2.1 Age differences. Drivers under 16 and 16-19 have been regrouped (under 20 age group) to ensure that individuals cannot be identified. Of all the fatally injured drinking drivers (i.e., those with a positive BAC), 33.3% were aged 36-45; 20.0% were aged 46-55 and over 55; 13.3% were under 20 years of age; and 6.7% were aged 20-25 and 26-35.
Of all the fatally injured legally impaired drivers (i.e., those with BACs over 80 mg%), 38.5% were aged 36-45; 23.1% were aged 46-55; 15.4% were over 55; and 7.7% were aged under 20, 20-25 and 26-35.
When comparing the incidence of drinking and driving among fatally injured drivers by age group, fatally injured drivers aged 36-45 were the most likely to have been drinking (62.5%). By contrast, 12.5% of the tested drivers aged 20-25 had been drinking.
11.2.2 Gender differences. Males dominate the picture – they account for 93.3% of all of the fatally injured drivers who had been drinking and 92.3% of those who were legally impaired.
Males dominate the picture largely because they account for most of the drivers who are killed (48 of the 60 fatalities or 80.0% are males). Fatally injured male drivers were more likely to have been drinking than female drivers (31.1% and 10.0%, respectively). And 85.7% of the male drivers and 100.0% of the female drivers who were drinking had BACs over the legal limit.
11.2.3 Vehicle differences. Of all the fatally injured drinking drivers (i.e., those with a positive BAC), 73.3% were automobile drivers; 20.0% were truck/van drivers; and 6.7% were motorcyclists.
Of all the fatally injured legally impaired drivers (i.e., those with BACs over 80 mg%), 76.9% were automobile drivers; 15.4% were truck/van drivers; and 7.7% were motorcyclists.
Within each of the vehicle types, 50.0% of fatally injured truck/van drivers, 26.8% of automobile drivers; and 14.3% of motorcyclists were found to have been drinking.

160
11.2.4 Collision differences. Just over half of the drivers killed (33 of the 60) were involved in single-vehicle collisions but these crashes accounted for 73.3% of the drivers who had been drinking and 69.2% of the drivers who were legally impaired.
The reason for this apparent disparity is because alcohol is overrepresented in single-vehicle crashes. Over one-third of the drivers involved in single-vehicle crashes (36.7%) were positive for alcohol, compared to 16.0% of those involved in multiple-vehicle collisions.
11.2.5 Duration between crash and death time. Given that all of the fatally injured drivers died within 30 days of the collision, a comparison of alcohol use among drivers based on differences in the duration between crash time and death time is not applicable.
11.3 Drivers involved in alcohol-related serious injury crashes
This section presents information on drivers involved in alcohol-related crashes in which someone was seriously injured in 2012 in Nova Scotia. A “surrogate” or “indirect” measure is used to estimate alcohol involvement because drivers in serious injury crashes are seldom tested for alcohol. A driver is identified as having been involved in an alcohol-related serious injury crash if the crash in which someone was seriously injured involved a single vehicle at night (SVN), or if, in the case of a non-SVN serious injury crash, the police reported alcohol involvement – i.e., at least one drinking driver in the crash (see Section 2.2.4).
The results are shown in Table 11-3 for drivers grouped in terms of age, gender, type of vehicle driven, and type of collision. The first column shows the number of drivers involved in serious injury crashes. The number and percent of drivers in such crashes that involved alcohol is shown in the next two columns. The final column expresses the number of drivers involved in alcohol-related serious injury crashes in any row as a percent of all drivers involved in alcohol- related serious injury crashes.
As shown, by the totals at the bottom of the table, 368 drivers were involved in crashes in which someone was seriously injured, and among these 19.0% were alcohol-related crashes.
11.3.1 Driver age. Of all the drivers involved in alcohol-related serious injury crashes, 28.6% were aged 26-35; 22.9% were aged 20-25; 14.3% were aged 16-19 and 36-45; 8.6% were aged 46-55; and 7.1% were over 55.
Almost one-third of the drivers aged 26-35 and 20-25 were involved in alcohol-related serious injury crashes (30.3% and 30.2%, respectively). The lowest incidence of involvement in alcohol-related crashes was found for those under 16 and over 55 (0.0 and 7.0%, respectively).
11.3.2 Driver gender. Of all the drivers involved in alcohol-related serious injury crashes, 82.9% were males. The incidence of involvement in alcohol-related serious injury crashes was greater for males than for females (22.8% and 9.2%, respectively).
11.3.3 Type of vehicle driven. Of all the drivers involved in alcohol-related serious injury crashes, 57.1% were automobile drivers; 30.0% were truck/van drivers; and 8.6% were off-road vehicle drivers.
The highest incidence of involvement in alcohol-related serious injury crashes was found for drivers of off-road vehicles – 28.6% of these drivers were in crashes that involved alcohol, compared to 22.1% for

161
truck/van drivers; 20.6% for automobile drivers; and 9.1% for tractor-trailer drivers. Among motorcyclists, 4.7% were involved in alcohol-related crashes.
11.3.4 Type of collision. Of all the drivers involved in alcohol-related serious injury crashes, 80.0% of them were in single-vehicle crashes. The highest incidence of involvement in alcohol-related serious injury crashes was also found among drivers in single-vehicle crashes – 33.5% of these drivers, compared to only 7.0% for drivers involved in multiple-vehicle crashes.
11.4 Drug use among fatally injured drivers
This section presents information on the presence of drugs, exclusively among drivers fatally injured in Nova Scotia during 2012. Table 11-4 shows the prevalence of drug use among fatally injured drivers of highway vehicles as well as the number of drivers who tested positive for various categories of drugs.
As can be seen, Nova Scotia had a very high testing rate in 2012, with 90.0% of fatally injured drivers being tested for drug use.
Among fatally injured tested drivers, 20 out of 54 (37.0%) were positive for drugs. The most common category of drugs found within drivers testing positive for drug use was cannabis (55.0%). Other categories
% of % of all drivers inNumber total alcohol-related crashes
Age<16 4 0 0.0 0.016-19 41 10 24.4 14.320-25 53 16 30.2 22.926-35 66 20 30.3 28.636-45 53 10 18.9 14.346-55 64 6 9.4 8.6>55 71 5 7.0 7.1unknown 16 3 18.8 4.3
GenderMale 254 58 22.8 82.9Female 98 9 9.2 12.9unknown 16 3 18.8 4.3
Vehicle TypeAuto 194 40 20.6 57.1Truck/Van 95 21 22.1 30.0Motorcycle 43 2 4.7 2.9Tractor Trailer 11 1 9.1 1.4Other Hwy. Vehicle 2 0 0.0 0.0Off-Road 21 6 28.6 8.6Unknown 2 0 0.0 0.0
Collision TypeSingle-Vehicle 167 56 33.5 80.0Multiple-Vehicle 201 14 7.0 20.0
TOTAL 368 70 19.0 100.0
Table 11-3Drivers in Alcohol-Related Serious Injury Crashes:
Nova Scotia, 2012Category of Drivers Number of
Drivers
Alcohol-Related
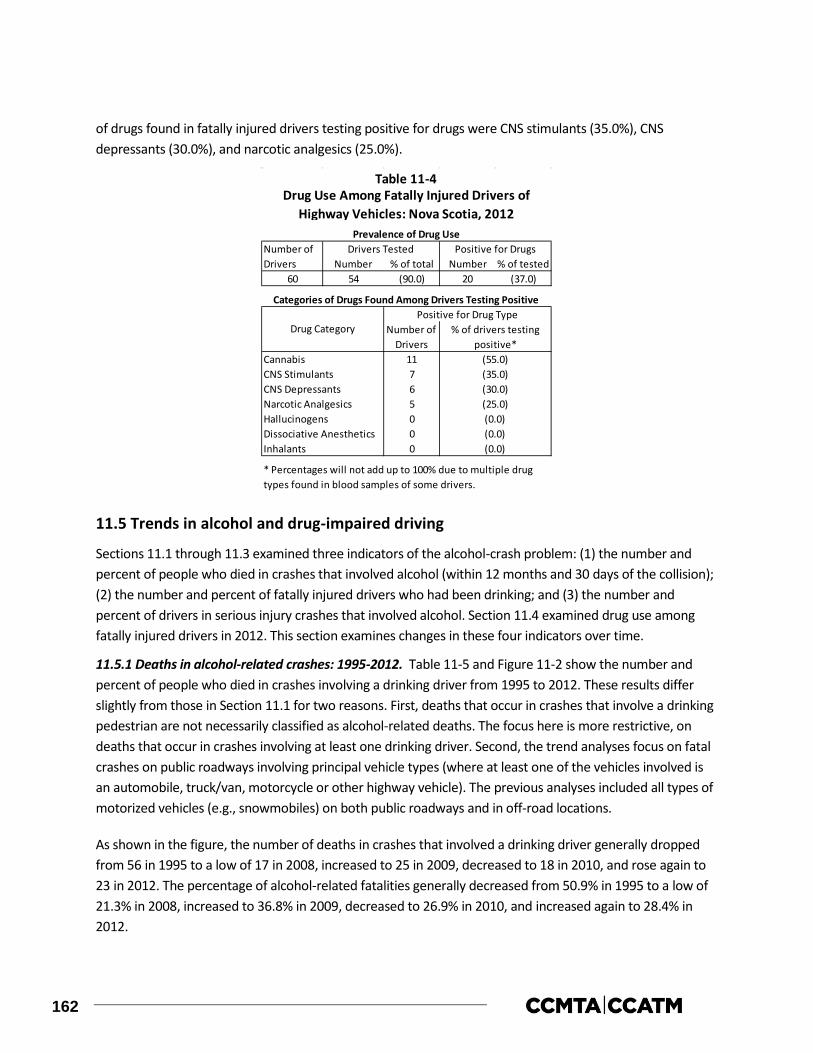
162
of drugs found in fatally injured drivers testing positive for drugs were CNS stimulants (35.0%), CNS depressants (30.0%), and narcotic analgesics (25.0%).
11.5 Trends in alcohol and drug-impaired driving
Sections 11.1 through 11.3 examined three indicators of the alcohol-crash problem: (1) the number and percent of people who died in crashes that involved alcohol (within 12 months and 30 days of the collision); (2) the number and percent of fatally injured drivers who had been drinking; and (3) the number and percent of drivers in serious injury crashes that involved alcohol. Section 11.4 examined drug use among fatally injured drivers in 2012. This section examines changes in these four indicators over time.
11.5.1 Deaths in alcohol-related crashes: 1995-2012. Table 11-5 and Figure 11-2 show the number and percent of people who died in crashes involving a drinking driver from 1995 to 2012. These results differ slightly from those in Section 11.1 for two reasons. First, deaths that occur in crashes that involve a drinking pedestrian are not necessarily classified as alcohol-related deaths. The focus here is more restrictive, on deaths that occur in crashes involving at least one drinking driver. Second, the trend analyses focus on fatal crashes on public roadways involving principal vehicle types (where at least one of the vehicles involved is an automobile, truck/van, motorcycle or other highway vehicle). The previous analyses included all types of motorized vehicles (e.g., snowmobiles) on both public roadways and in off-road locations.
As shown in the figure, the number of deaths in crashes that involved a drinking driver generally dropped from 56 in 1995 to a low of 17 in 2008, increased to 25 in 2009, decreased to 18 in 2010, and rose again to 23 in 2012. The percentage of alcohol-related fatalities generally decreased from 50.9% in 1995 to a low of 21.3% in 2008, increased to 36.8% in 2009, decreased to 26.9% in 2010, and increased again to 28.4% in 2012.
Number % of total Number % of tested60 54 (90.0) 20 (37.0)
11765000
* Percentages will not add up to 100% due to multiple drug types found in blood samples of some drivers.
Positive for Drug TypeNumber of
Drivers(55.0)(35.0)
HallucinogensDissociative AnestheticsInhalants
(0.0)(0.0)(0.0)
Drug Use Among Fatally Injured Drivers of Highway Vehicles: Nova Scotia, 2012
Table 11-4
CannabisCNS Stimulants
Drivers TestedNumber of Drivers
Positive for DrugsPrevalence of Drug Use
Narcotic Analgesics (25.0)CNS Depressants (30.0)
Categories of Drugs Found Among Drivers Testing Positive
Drug Category % of drivers testing positive*

163
As shown at the bottom of the table, during the 2006-2010 baseline period there was an average of 25 fatalities involving a drinking driver and they accounted for 31.3% of all fatalities. This means that the percent of fatalities involving a drinking driver decreased by 10.5% from 31.3% in the baseline period (2006-2010) to 28.0% in the 2011-2012 period. In terms of the number of persons killed in crashes involving a drinking driver, there has been a 16.0% decrease from an average of 25 in the baseline period (2006-2010) to 21 in the 2011-2012 period.
Number % of total Number % of total1995 110 56 50.9 107 54 50.5
1996 112 39 34.8 112 39 34.8
1997 85 36 42.4 85 36 42.4
1998 83 36 43.4 83 36 43.4
1999 98 27 27.6 98 27 27.6
2000 86 30 34.9 86 30 34.9
2001 77 30 39.0 75 30 40.0
2002 83 34 41.0 82 33 40.2
2003 67 25 37.3 67 25 37.3
2004 90 22 24.4 89 22 24.7
2005 70 23 32.9 70 23 32.9
2006 84 30 35.7 83 30 36.1
2007 103 35 34.0 102 35 34.3
2008 80 17 21.3 79 17 21.5
2009 68 25 36.8 67 25 37.3
2010 67 18 26.9 67 18 26.9
2011 68 19 27.9 66 19 28.8
2012 81 23 28.4 79 23 29.12006-2010baseline
2011-2012period
** only on public roadways involving principal vehicle types.
28.875 21 28.0 73 21
* numbers are estimates based on the percent of deaths for which information was available to determine alcohol use.
Number of Deaths
Alcohol-Related Deaths
Persons Dying Within 30 Days of Collision
Table 11-5Number* and Percent of Motor Vehicle Deaths** Involving a
Drinking Driver: Nova Scotia, 1995-2012
Alcohol-Related Deaths
Persons Dying Within 12 Months of Collision
Year of Death
Number of Deaths
80 25 31.3 80 25 31.3
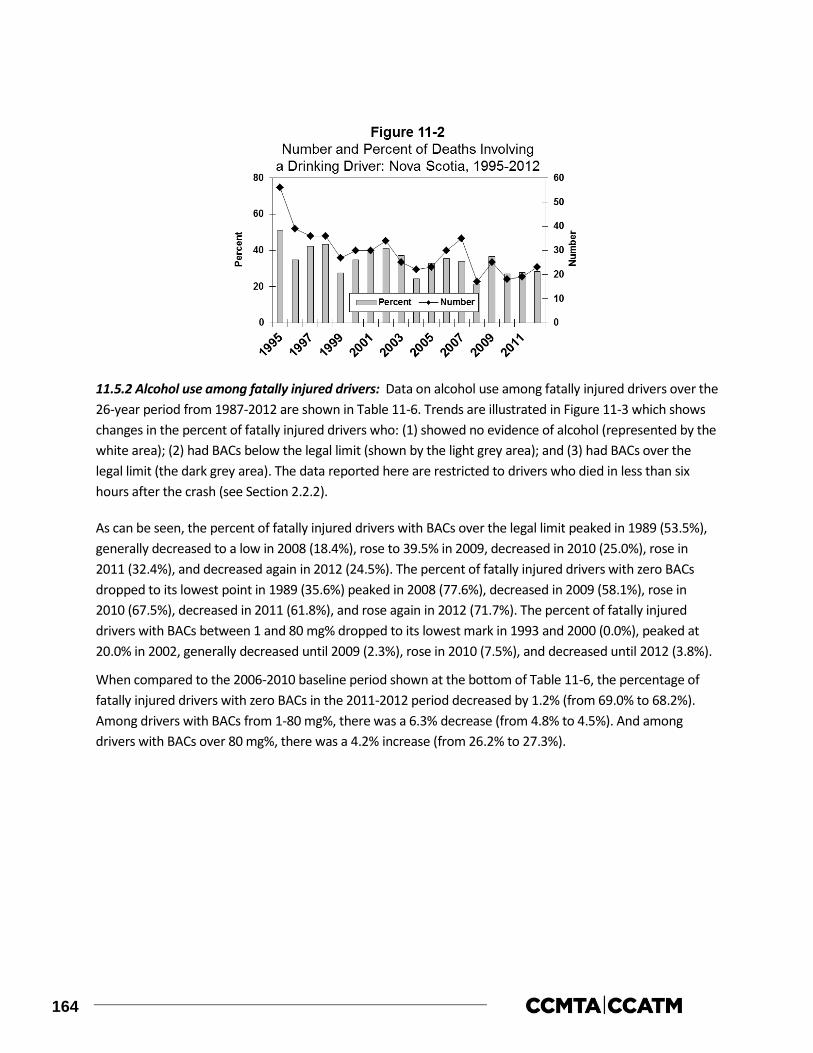
164
11.5.2 Alcohol use among fatally injured drivers: Data on alcohol use among fatally injured drivers over the 26-year period from 1987-2012 are shown in Table 11-6. Trends are illustrated in Figure 11-3 which shows changes in the percent of fatally injured drivers who: (1) showed no evidence of alcohol (represented by the white area); (2) had BACs below the legal limit (shown by the light grey area); and (3) had BACs over the legal limit (the dark grey area). The data reported here are restricted to drivers who died in less than six hours after the crash (see Section 2.2.2).
As can be seen, the percent of fatally injured drivers with BACs over the legal limit peaked in 1989 (53.5%), generally decreased to a low in 2008 (18.4%), rose to 39.5% in 2009, decreased in 2010 (25.0%), rose in 2011 (32.4%), and decreased again in 2012 (24.5%). The percent of fatally injured drivers with zero BACs dropped to its lowest point in 1989 (35.6%) peaked in 2008 (77.6%), decreased in 2009 (58.1%), rose in 2010 (67.5%), decreased in 2011 (61.8%), and rose again in 2012 (71.7%). The percent of fatally injured drivers with BACs between 1 and 80 mg% dropped to its lowest mark in 1993 and 2000 (0.0%), peaked at 20.0% in 2002, generally decreased until 2009 (2.3%), rose in 2010 (7.5%), and decreased until 2012 (3.8%).
When compared to the 2006-2010 baseline period shown at the bottom of Table 11-6, the percentage of fatally injured drivers with zero BACs in the 2011-2012 period decreased by 1.2% (from 69.0% to 68.2%). Among drivers with BACs from 1-80 mg%, there was a 6.3% decrease (from 4.8% to 4.5%). And among drivers with BACs over 80 mg%, there was a 4.2% increase (from 26.2% to 27.3%).
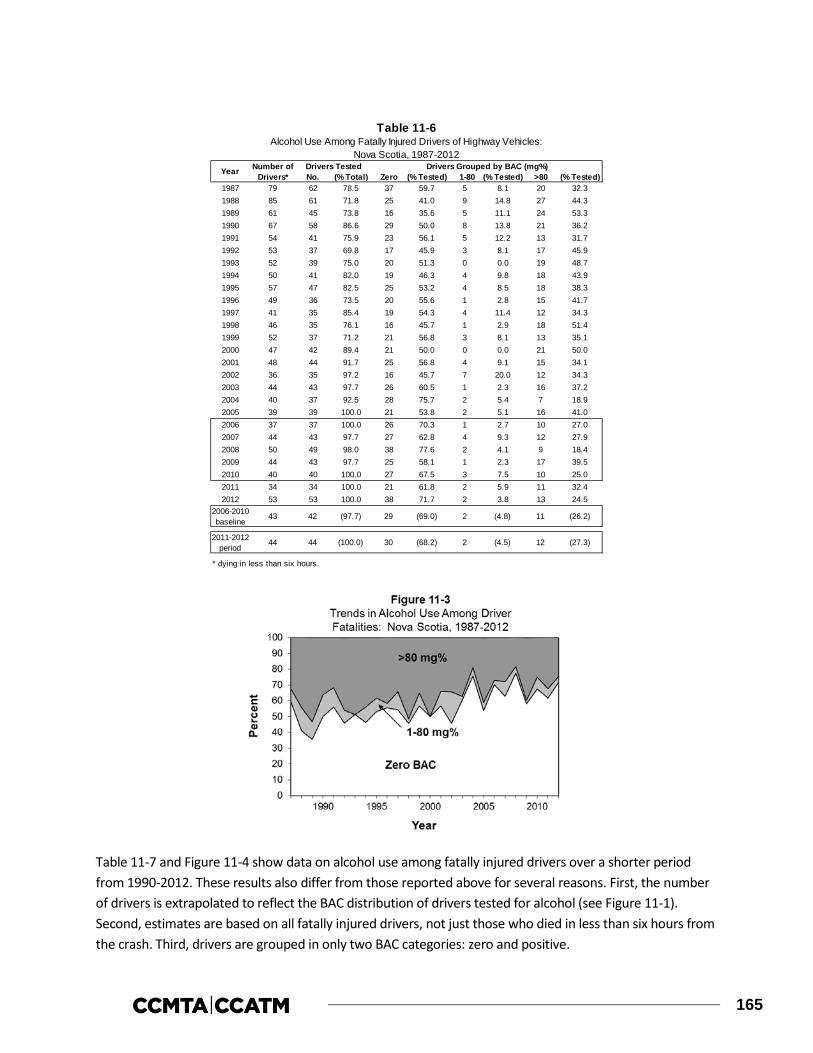
165
Table 11-7 and Figure 11-4 show data on alcohol use among fatally injured drivers over a shorter period from 1990-2012. These results also differ from those reported above for several reasons. First, the number of drivers is extrapolated to reflect the BAC distribution of drivers tested for alcohol (see Figure 11-1). Second, estimates are based on all fatally injured drivers, not just those who died in less than six hours from the crash. Third, drivers are grouped in only two BAC categories: zero and positive.
No. (% Total) Zero (% Tested) 1-80 (% Tested) >80 (% Tested)1987 79 62 78.5 37 59.7 5 8.1 20 32.31988 85 61 71.8 25 41.0 9 14.8 27 44.31989 61 45 73.8 16 35.6 5 11.1 24 53.31990 67 58 86.6 29 50.0 8 13.8 21 36.21991 54 41 75.9 23 56.1 5 12.2 13 31.71992 53 37 69.8 17 45.9 3 8.1 17 45.91993 52 39 75.0 20 51.3 0 0.0 19 48.71994 50 41 82.0 19 46.3 4 9.8 18 43.91995 57 47 82.5 25 53.2 4 8.5 18 38.31996 49 36 73.5 20 55.6 1 2.8 15 41.71997 41 35 85.4 19 54.3 4 11.4 12 34.31998 46 35 76.1 16 45.7 1 2.9 18 51.41999 52 37 71.2 21 56.8 3 8.1 13 35.12000 47 42 89.4 21 50.0 0 0.0 21 50.02001 48 44 91.7 25 56.8 4 9.1 15 34.12002 36 35 97.2 16 45.7 7 20.0 12 34.32003 44 43 97.7 26 60.5 1 2.3 16 37.22004 40 37 92.5 28 75.7 2 5.4 7 18.92005 39 39 100.0 21 53.8 2 5.1 16 41.02006 37 37 100.0 26 70.3 1 2.7 10 27.02007 44 43 97.7 27 62.8 4 9.3 12 27.92008 50 49 98.0 38 77.6 2 4.1 9 18.42009 44 43 97.7 25 58.1 1 2.3 17 39.52010 40 40 100.0 27 67.5 3 7.5 10 25.02011 34 34 100.0 21 61.8 2 5.9 11 32.42012 53 53 100.0 38 71.7 2 3.8 13 24.5
2006-2010baseline
2011-2012period
* dying in less than six hours.
2 (4.5) 12 (27.3)44 44 (100.0) 30 (68.2)
Table 11-6
Drivers Grouped by BAC (mg%)
Alcohol Use Among Fatally Injured Drivers of Highway Vehicles:Nova Scotia, 1987-2012
29 (69.0) 2 (4.8) 11 (26.2)
Year Number of Drivers*
Drivers Tested
43 42 (97.7)

166
As can be seen at the bottom of Table 11-7, the baseline percentage of fatally injured drivers testing positive for alcohol from 2006-2010 is 34.7%. In the 2011-2012 period, 31.4% of fatally injured drivers tested positive for alcohol, a 9.5% decrease from the baseline period.
Zero (% Tested) Positive (% Tested)1990 93 38 (40.9) 37 (39.8)1991 63 34 (54.0) 29 (46.0)1992 66 32 (48.5) 34 (51.5)1993 60 31 (51.7) 29 (48.3)1994 60 27 (45.0) 33 (55.0)1995 67 33 (49.3) 34 (50.7)1996 57 32 (56.1) 25 (43.9)1997 46 25 (54.3) 21 (45.7)1998 51 23 (45.1) 28 (54.9)1999 60 37 (61.7) 23 (38.3)2000 56 27 (48.2) 29 (51.8)2001 55 30 (54.5) 25 (45.5)2002 41 18 (43.9) 23 (56.1)2003 47 28 (59.6) 19 (40.4)2004 45 34 (75.6) 11 (24.4)2005 42 22 (52.4) 20 (47.6)2006 47 31 (66.0) 16 (34.0)2007 55 34 (61.8) 21 (38.2)2008 55 43 (78.2) 12 (21.8)2009 48 28 (58.3) 20 (41.7)2010 41 27 (65.9) 14 (34.1)2011 42 26 (61.9) 16 (38.1)2012 60 44 (73.3) 16 (26.7)
2006-2010baseline
2011-2012period
* numbers are estimates based on the BAC distribution of drivers tested for alcohol
51 35 (68.6) 16 (31.4)
49 32 (65.3) 17 (34.7)
Table 11-7Alcohol Use Among Fatally Injured Drivers of Highway Vehicles*:
Nova Scotia, 1990-2012
Year Number of Drivers
Drivers Grouped by BAC (mg%)

167
11.5.3 Drivers in serious injury crashes: Table 11-8 and Figure 11-5 show information on drivers involved in alcohol-related serious injury crashes. During the baseline period (2006-2010), an average of 24.1% of drivers in serious injury crashes were in an alcohol-involved crash. This percentage decreased to 18.1% in 2011, then rose to 19.0% in 2012. In the 2011-2012 period, an average of 18.5% of drivers in serious injury crashes were in an alcohol-involved crash. This represents a 23.2% decrease in the problem compared to the 2006-2010 baseline period.
Year Number of Drivers
Number in Alcohol-Involved Crashes Percent
1995 523 95 (18.2)1996 492 115 (23.4)1997 511 110 (21.5)1998 464 90 (19.4)1999 610 129 (21.1)2000 427 99 (23.2)2001 436 103 (23.6)2002 411 85 (20.7)2003 358 83 (23.2)2004 365 82 (22.5)2005 367 94 (25.6)2006 352 89 (25.3)2007 370 95 (25.7)2008 307 62 (20.2)2009 353 80 (22.7)2010 317 82 (25.9)2011 365 66 (18.1)2012 368 70 (19.0)
2006-2010baseline
2011-2012period
* single-vehicle nighttime crashes (SVN) as well as non-SVN crashes that have police-reported alcohol involvement
367 68 (18.5)
Table 11-8Number and Percent of All Drivers in Serious Injury Crashes*
that Involved Alcohol: Nova Scotia, 1995-2012
340 82 (24.1)

168
Table 11-9 and Figure 11-6 also show information on drivers involved in alcohol-related serious injury crashes. These results differ slightly from those in Section 11.3 and in Table 11-8 and Figure 11-5 because they exclude certain vehicle types – e.g., bicycles, snowmobiles, farm tractors and other non-highway vehicles.
As can be seen, the incidence of alcohol-involvement in serious injury crashes has fluctuated over this 18-year period. Between 1995 and 2005 the percentage of all drivers in serious injury crashes that involved alcohol rose from 18.5% to 26.1%. Since then, the incidence generally decreased until 2008 (20.0%), rose until 2010 (25.8%), decreased in 2011 (17.1%), and increased in 2012 (18.3%).
In the baseline period (2006-2010), an average of 23.9% of drivers in serious injury crashes were in an alcohol-involved crash. In the 2011-2012 period, the percentage of drivers in serious injury crashes involving alcohol was 17.7%, resulting in a 25.9% decrease.
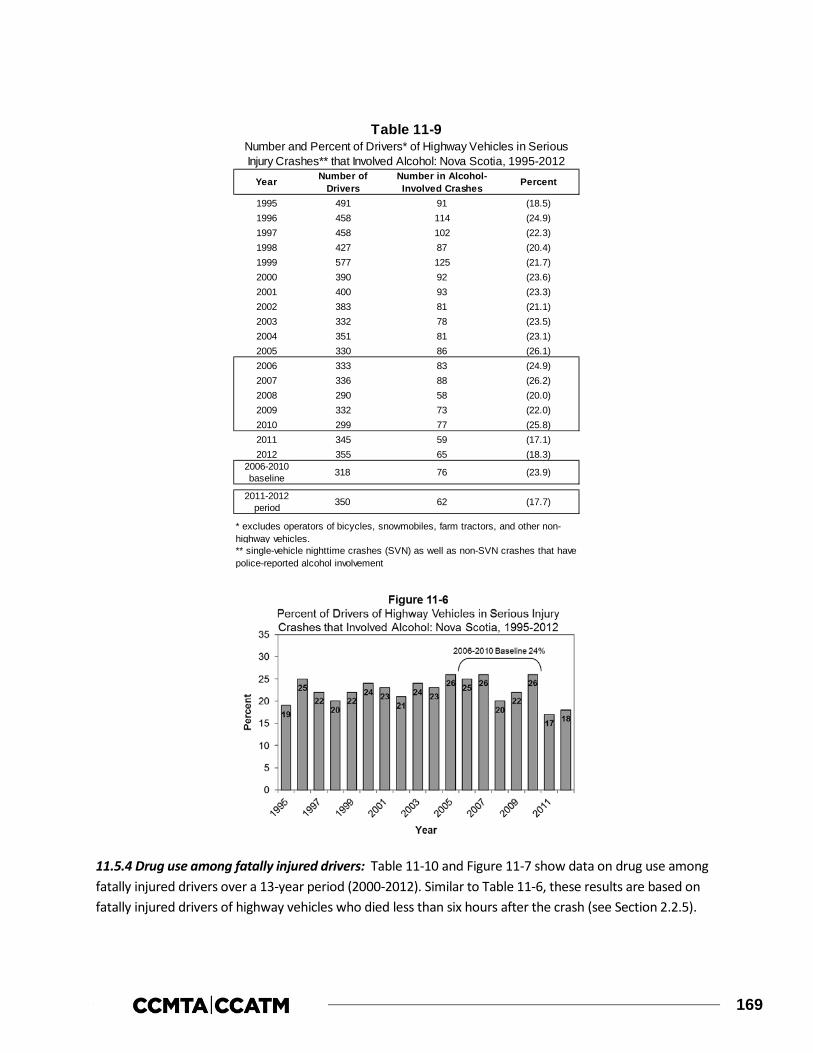
169
11.5.4 Drug use among fatally injured drivers: Table 11-10 and Figure 11-7 show data on drug use among fatally injured drivers over a 13-year period (2000-2012). Similar to Table 11-6, these results are based on fatally injured drivers of highway vehicles who died less than six hours after the crash (see Section 2.2.5).
Number ofDrivers
1995 491 91 (18.5)1996 458 114 (24.9)1997 458 102 (22.3)1998 427 87 (20.4)1999 577 125 (21.7)2000 390 92 (23.6)2001 400 93 (23.3)2002 383 81 (21.1)2003 332 78 (23.5)2004 351 81 (23.1)2005 330 86 (26.1)2006 333 83 (24.9)2007 336 88 (26.2)2008 290 58 (20.0)2009 332 73 (22.0)2010 299 77 (25.8)2011 345 59 (17.1)2012 355 65 (18.3)
2006-2010baseline
2011-2012period
Table 11-9Number and Percent of Drivers* of Highway Vehicles in Serious Injury Crashes** that Involved Alcohol: Nova Scotia, 1995-2012
Year PercentNumber in Alcohol-Involved Crashes
** single-vehicle nighttime crashes (SVN) as well as non-SVN crashes that have police-reported alcohol involvement
* excludes operators of bicycles, snowmobiles, farm tractors, and other non-highway vehicles.
318 76 (23.9)
350 62 (17.7)

170
As can be seen at the bottom of Table 11-10, the percentage of fatally injured drivers testing positive for drugs from 2006-2010, the baseline period, is 40.0%. In the 2011-2012 period, 41.9% of fatally injured drivers tested positive for drugs, a 4.8% increase from the baseline period.
Negative (% Tested) Positive (% Tested)2000 47 34 72.3 24 70.6 10 29.42001 48 40 83.3 31 77.5 9 22.52002 36 34 94.4 26 76.5 8 23.52003 44 39 88.6 29 74.4 10 25.62004 40 33 82.5 23 69.7 10 30.32005 39 35 89.7 19 54.3 16 45.72006 37 33 89.2 21 63.6 12 36.42007 44 42 95.5 30 71.4 12 28.62008 50 41 82.0 19 46.3 22 53.72009 44 43 97.7 25 58.1 18 41.92010 40 40 100.0 26 65.0 14 35.02011 34 33 97.1 18 54.5 15 45.52012 53 53 100.0 33 62.3 20 37.7
2006-2010baseline
2011-2012period
* dying in less than six hours.
18 41.944 43 97.7 25 58.1
16 40.0
Drug Use Among Fatally Injured Drivers* of Highway Vehicles: Nova Scotia, 2000-2012
43 40 93.0 24 60.0
Table 11-10
YEAR Number of Drivers*
Drivers Tested (% Total) Drivers Tested for Drugs

171
12.0 PRINCE EDWARD ISLAND
This section of the report reviews the major findings on alcohol involvement in fatal and serious injury motor vehicle collisions as well as drug involvement in fatal motor vehicle collisions in Prince Edward Island during 2012. It describes data on:
> people who were killed in alcohol-related crashes (Section 12.1);
> alcohol use among fatally injured drivers (Section 12.2);
> drivers involved in alcohol-related serious injury crashes (Section 12.3);
> drug use among fatally injured drivers (Section 12.4); and,
> trends in the alcohol-crash and drug-crash problems (Section 12.5).
12.1 Deaths in alcohol-related crashes
Table 12-1 presents information on people who died in alcohol-related crashes in Prince Edward Island during 2012 for persons dying within 12 months of the collision (one calendar year) and for persons dying within 30 days of the collision. Motor vehicle deaths are categorized in terms of the victim’s age, gender, type (i.e., driver, passenger, pedestrian) and the type of vehicle they occupied. In each section, the first column in the table presents the number of deaths. The next two columns show the number and percent of these fatalities in which sufficient information was available to determine if alcohol was involved. A motor vehicle fatality was considered to be alcohol involved if there was at least one drinking driver or drinking pedestrian in the fatal crash.
For example, within the first section, it can be seen that among persons dying within 12 months of the collision, four people aged 25 and under were killed in motor vehicle crashes in Prince Edward Island during 2012. And, in all four cases (100.0%) it was possible to determine if alcohol was a factor in the crash. The next column shows the number of people killed in crashes that were known to be alcohol-involved. There were two people aged 25 and under who died in alcohol-related crashes in Prince Edward Island during 2012. The next column expresses this as a percentage – i.e., 50.0% of those aged 25 and under who were killed died in an alcohol-related crash.
The final column (percent of all alcohol-related deaths) expresses the number of deaths in alcohol-related crashes as a percent of all the deaths in such crashes. For example, the alcohol-related deaths among those aged 25 and under represent 25.0% of all the people killed in alcohol-related crashes in Prince Edward Island during 2012.
An examination of the section for persons dying within 30 days of the collision shows that four persons aged 25 and under died in motor vehicle crashes. In all four of these cases (100.0%), it was possible to determine if alcohol was a factor in the crash. Among these persons, two (50.0%) were alcohol-related deaths. And those aged 25 and under accounted for 25.0% of people dying in alcohol-related crashes.
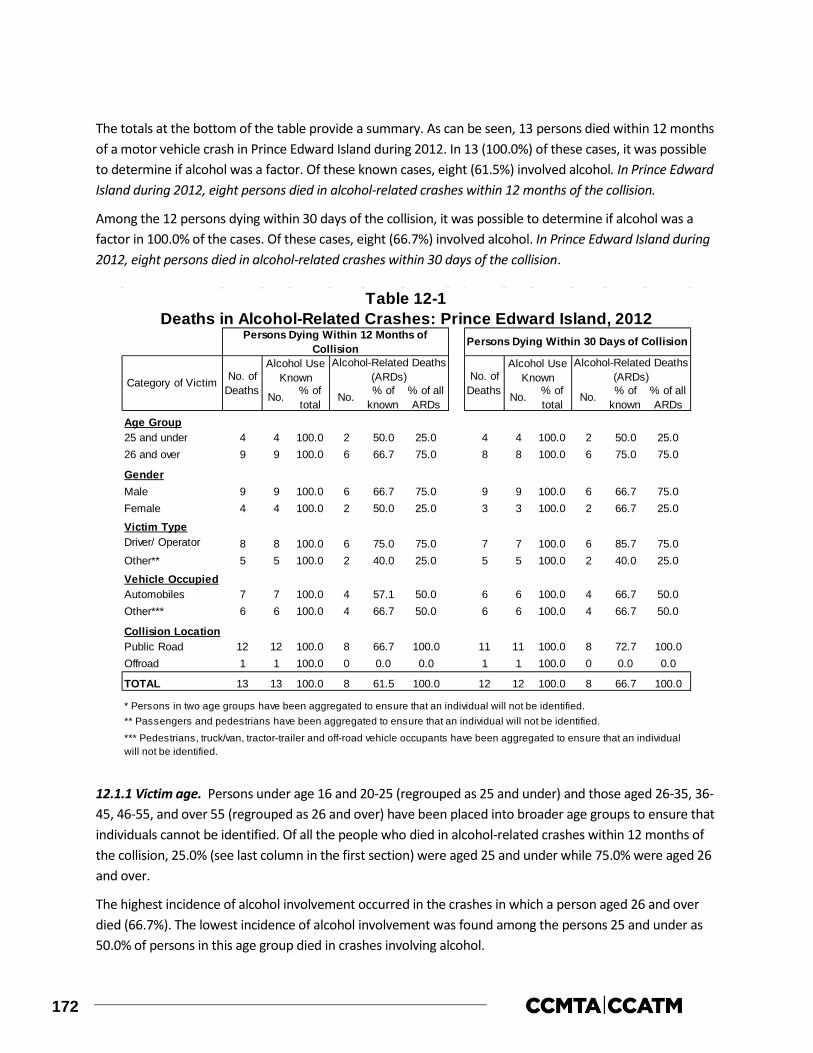
172
The totals at the bottom of the table provide a summary. As can be seen, 13 persons died within 12 months of a motor vehicle crash in Prince Edward Island during 2012. In 13 (100.0%) of these cases, it was possible to determine if alcohol was a factor. Of these known cases, eight (61.5%) involved alcohol. In Prince Edward Island during 2012, eight persons died in alcohol-related crashes within 12 months of the collision.
Among the 12 persons dying within 30 days of the collision, it was possible to determine if alcohol was a factor in 100.0% of the cases. Of these cases, eight (66.7%) involved alcohol. In Prince Edward Island during 2012, eight persons died in alcohol-related crashes within 30 days of the collision.
12.1.1 Victim age. Persons under age 16 and 20-25 (regrouped as 25 and under) and those aged 26-35, 36-45, 46-55, and over 55 (regrouped as 26 and over) have been placed into broader age groups to ensure that individuals cannot be identified. Of all the people who died in alcohol-related crashes within 12 months of the collision, 25.0% (see last column in the first section) were aged 25 and under while 75.0% were aged 26 and over.
The highest incidence of alcohol involvement occurred in the crashes in which a person aged 26 and over died (66.7%). The lowest incidence of alcohol involvement was found among the persons 25 and under as 50.0% of persons in this age group died in crashes involving alcohol.
Age Group25 and under 4 4 100.0 2 50.0 25.0 4 4 100.0 2 50.0 25.026 and over 9 9 100.0 6 66.7 75.0 8 8 100.0 6 75.0 75.0
GenderMale 9 9 100.0 6 66.7 75.0 9 9 100.0 6 66.7 75.0Female 4 4 100.0 2 50.0 25.0 3 3 100.0 2 66.7 25.0
Victim TypeDriver/ Operator 8 8 100.0 6 75.0 75.0 7 7 100.0 6 85.7 75.0Other** 5 5 100.0 2 40.0 25.0 5 5 100.0 2 40.0 25.0
Vehicle OccupiedAutomobiles 7 7 100.0 4 57.1 50.0 6 6 100.0 4 66.7 50.0Other*** 6 6 100.0 4 66.7 50.0 6 6 100.0 4 66.7 50.0
Collision LocationPublic Road 12 12 100.0 8 66.7 100.0 11 11 100.0 8 72.7 100.0Offroad 1 1 100.0 0 0.0 0.0 1 1 100.0 0 0.0 0.0
TOTAL 13 13 100.0 8 61.5 100.0 12 12 100.0 8 66.7 100.0
* Persons in two age groups have been aggregated to ensure that an individual will not be identified.** Passengers and pedestrians have been aggregated to ensure that an individual will not be identified.
*** Pedestrians, truck/van, tractor-trailer and off-road vehicle occupants have been aggregated to ensure that an individual will not be identified.
No. of Deaths No.
Alcohol Use Known
% of total
No.
Persons Dying Within 30 Days of Collision
% of known
Table 12-1Deaths in Alcohol-Related Crashes: Prince Edward Island, 2012
Alcohol-Related Deaths (ARDs)
Alcohol-Related Deaths (ARDs)
% of all ARDs
% of all ARDs
Persons Dying Within 12 Months of Collision
% of known
No. of Deaths
Alcohol Use Known
No. % of total
No.Category of Victim

173
12.1.2 Gender. Of all the people who died in alcohol-related crashes within 12 months of the collision, 75.0% were males. The incidence of alcohol in crashes in which a male died (66.7%) was greater than the incidence of alcohol in crashes in which a female died (50.0%).
12.1.3 Victim type. Passengers and pedestrians have been regrouped into ‘other’ victim types to ensure that individuals cannot be identified. Of all the people who died in alcohol-related crashes within 12 months of the collision, 75.0% were drivers/operators and 25.0% were other victim types.
Within each of the victim types, the highest incidence of alcohol involvement (75.0%) occurred in the crashes in which a driver/operator died. Alcohol was involved in 40.0% of the crashes in which other victim types died.
12.1.4 Type of vehicle occupied. Pedestrians, truck/van, tractor-trailer, and off-road vehicle occupants have been regrouped into ‘other’ vehicles occupied to ensure that individuals cannot be identified. Of all the people who died in alcohol-related crashes within 12 months of the collision, 50.0% were automobile occupants and 50.0% were other vehicle occupants.
Within each of these vehicle types, the incidence of alcohol involvement in which other vehicle occupants died (66.7%) was greater than the incidence of alcohol in crashes in which an automobile occupant died (57.1%).
12.2 Alcohol in fatally injured drivers
This section presents information on the presence of alcohol, exclusively among drivers fatally injured within 12 months of the collision in Prince Edward Island during 2012. Table 12-2 shows the information by age group, gender, vehicle type, collision type (single vs. multiple), and duration between crash time (within 12 months of the collision vs. within 30 days of the collision).
The first column in the table shows the number of drivers killed. The next columns show the number and percent of these victims who were tested for alcohol. The remaining columns provide information on the results of the alcohol tests – the first three of these present results for drivers who showed any evidence of alcohol; the last three columns present information on drivers who had BACs over the statutory limit of 80 mg%.
To illustrate, among 20-55 year olds there were four drivers killed during 2012; all of these fatally injured drivers (100.0%) were tested for alcohol. Of those who were tested, three (75.0%) were positive for alcohol. This means that fatally injured drinking drivers aged 20-55 accounted for 75.0% of all drinking drivers who were killed.
Then, in the final three columns, it can be seen that two (50.0%) of the fatally injured drivers aged 20-55 years of age who were tested for alcohol had BACs in excess of 80 mg%. This means that two of the three drivers who were positive for alcohol had a BAC in excess of the legal limit. The final column expresses the number of drivers with illegal BACs as a percent of all drivers with BACs over the limit. As can be seen, drivers aged 20-55 accounted for 100.0% of all the drivers with BACs over the legal limit.

174
The main findings are shown by the totals at the bottom of the table. Prince Edward Island had a high testing rate in 2012, with 83.3% of fatally injured drivers being tested for alcohol use.
In Prince Edward Island, 80.0% had been drinking and two out of four (50.0%) of the fatally injured drinking drivers had BACs over 80 mg%. Although not shown in the table, more refined analyses by different BAC categories show that among tested drivers:
> 20.0% had BACs of zero mg%;
> 40.0% had BACs from 1-49 mg%;
> 0.0% had BACs from 50-80 mg%;
> 0.0% had BACs from 81-160 mg%; and,
> 40.0% had BACs over 160 mg%.
The BAC distribution for fatally injured drivers is shown in Figure 12-1. As can be seen, five of six (83.3%) fatally injured drivers have positive BACs. And among fatally injured drinking drivers, three (60.0%) have BACs over 80 mg%.
Age Group20-55* 4 4 100.0 3 75.0 75.0 2 50.0 100.0>55 2 1 50.0 1 100.0 25.0 0 0.0 0.0Gender
Male 4 4 100.0 3 75.0 75.0 1 25.0 50.0Female 2 1 50.0 1 100.0 25.0 1 100.0 50.0
Collision TypeSingle vehicle 4 4 100.0 3 75.0 75.0 2 50.0 100.0Multiple vehicle 2 1 50.0 1 100.0 25.0 0 0.0 0.0Duration Between Crash and Death TimeWithin 30 Days 5 5 100.0 4 80.0 100.0 2 40.0 100.0> 30 Days 1 0 0.0 0 0.0 0.0 0 0.0 0.0
TOTAL 6 5 83.3 4 80.0 100.0 2 40.0 100.0
* Drivers in multiple age groups have been aggregated to ensure that an individual will not be identified.
% of tested
Table 12-2Alcohol Use Among Fatally Injured Drivers of Highway Vehicles:
Prince Edward Island, 2012Positive BAC BAC >80 mg%
% of all drivers with
+BAC
% of all drivers with BAC >80
mg%
% of tested No.
Category of Driver
No. of Drivers No.
Drivers Tested
% of total No.

175
12.2.1 Age differences. Drivers aged 20-25, 26-35, 36-45 and 46-55 have been regrouped (20-55 age group) to ensure that individuals cannot be identified. Of all the fatally injured drinking drivers (i.e., those with a positive BAC), 75.0% were aged 20-55 and 25.0% were over age 55.
Of all the fatally injured legally impaired drivers (i.e., those with BACs over 80 mg%), 100.0% were aged 20-55.
When comparing the incidence of drinking and driving among fatally injured drivers by age group, fatally injured tested drivers over 55 years of age were the most likely to have been drinking (100.0%). Three-quarters (75.0%) of the drivers aged 20-55 had been drinking.
12.2.2 Gender differences. Males dominate the picture as they account for 75.0% of all the fatally injured drivers who had been drinking and 50.0% of fatally injured drivers that were legally impaired.
Males dominate the picture largely because they account for most of the drivers who are killed (four of the six fatalities or 66.7% are males). However, fatally injured female drivers were more likely to have been drinking than male drivers (100.0% and 75.0%, respectively). And, 100.0% of the female drivers and 33.3% of the male drivers who were drinking had BACs over the legal limit.
12.2.3 Vehicle differences. In order to ensure that individual drivers cannot be identified, detailed analysis of alcohol use among fatally injured drivers based on vehicle type is not provided in this subsection.
12.2.4 Collision differences. Four of six drivers killed (66.7%) were involved in single-vehicle collisions and these crashes accounted for 75.0% of the drivers who had been drinking as well as 100.0% those who were legally impaired.
The reason for this apparent disparity is because alcohol is overrepresented in single-vehicle crashes. However, a smaller percentage of the drivers involved in single-vehicle crashes (75.0%) were positive for alcohol, compared to 100.0% of those involved in multiple-vehicle collisions.
12.2.5 Duration between crash and death time. Given only one fatally injured driver died more than 30 days after the collision, and this driver was not tested for alcohol, a comparison of alcohol use among drivers based on differences in the duration between crash time and death time is not applicable.
176
12.3 Drivers involved in alcohol-related serious injury crashes
This section presents information on drivers involved in alcohol-related crashes in which someone was seriously injured in 2012 in Prince Edward Island. A “surrogate” or “indirect” measure is used to estimate alcohol involvement because drivers in serious injury crashes are seldom tested for alcohol. A driver is identified as having been involved in an alcohol-related serious injury crash if the crash in which someone was seriously injured involved a single vehicle at night (SVN), or if, in the case of a non-SVN serious injury crash, the police reported alcohol involvement – i.e., at least one drinking driver in the crash (see Section 2.2.4).
The results are shown in Table 12-3 for drivers grouped in terms of age, gender, type of vehicle driven, and type of collision. The first column shows the number of drivers involved in serious injury crashes. The number and percent of drivers in such crashes that involved alcohol is shown in the next two columns. The final column expresses the number of drivers involved in alcohol-related serious injury crashes in any row as a percent of all drivers involved in alcohol-related serious injury crashes.
As shown, by the totals at the bottom of the table, 68 drivers were involved in crashes in which someone was seriously injured, and among these 27.9% were alcohol-related crashes.
12.3.1 Driver age. Of all the drivers involved in alcohol-related serious injury crashes, 42.1% were aged 20-25; 15.8% were aged 36-45, 46-55, and over 55; and 5.3% were aged 16-19 and 26-35.
Almost half of the drivers aged 20-25 were involved in alcohol-related serious injury crashes (47.1%). The lowest incidence of involvement in alcohol-related crashes was found for those under 16 (0.0%), 16-19 and 26-35 (12.5% each).
12.3.2 Driver gender. Of all the drivers involved in alcohol-related serious injury crashes, 73.7% were males. The incidence of involvement in alcohol-related serious injury crashes was also greater for males than for females (31.1% and 22.7%, respectively).
12.3.3 Type of vehicle driven. Of all the drivers involved in alcohol-related serious injury crashes, 73.7% were automobile drivers; 15.8% were off-road vehicle drivers; and 10.5% were motorcyclists.
The highest incidence of involvement in alcohol-related serious injury crashes was found for off-road vehicle drivers (60.0%) compared to 34.1% for automobile drivers. Among motorcyclists, 28.6% were involved in alcohol-related crashes.
12.3.4 Type of collision. Of all the drivers involved in alcohol-related serious injury crashes, 78.9% of them were in single-vehicle crashes. The highest incidence of involvement in alcohol-related serious injury crashes was also found among drivers in single-vehicle crashes – 42.9% of these drivers, compared to only 12.1% for drivers involved in multiple-vehicle crashes.

177
12.4 Drug use among fatally injured drivers
This section presents information on the presence of drugs, exclusively among drivers fatally injured in Prince Edward Island during 2012. Table 12-4 shows the prevalence of drug use among fatally injured drivers of highway vehicles as well as the number of drivers who tested positive for various categories of drugs.
As can be seen, Prince Edward Island had a high testing rate in 2012, with 83.3% of fatally injured drivers being tested for drug use.
Among fatally injured tested drivers, one out of five (20.0%) were positive for drugs. The most common categories of drugs found within drivers testing positive for drug use was CNS depressants (100.0%).
% of % of all drivers inNumber total alcohol-related crashes
Age<16 1 0 0.0 0.016-19 8 1 12.5 5.320-25 17 8 47.1 42.126-35 8 1 12.5 5.336-45 11 3 27.3 15.846-55 11 3 27.3 15.8>55 11 3 27.3 15.8unknown 1 0 0.0 0.0
GenderMale 45 14 31.1 73.7Female 22 5 22.7 26.3unknown 1 0 0.0 0.0
Vehicle TypeAuto 41 14 34.1 73.7Truck/Van 11 0 0.0 0.0Motorcycle 7 2 28.6 10.5Tractor Trailer 3 0 0.0 0.0Off-Road 5 3 60.0 15.8Unknown 1 0 0.0 0.0
Collision TypeSingle-Vehicle 35 15 42.9 78.9Multiple-Vehicle 33 4 12.1 21.1
TOTAL 68 19 27.9 100.0
Table 12-3Drivers in Alcohol-Related Serious Injury Crashes:
Prince Edward Island, 2012Category of Drivers Number of
Drivers
Alcohol-Related
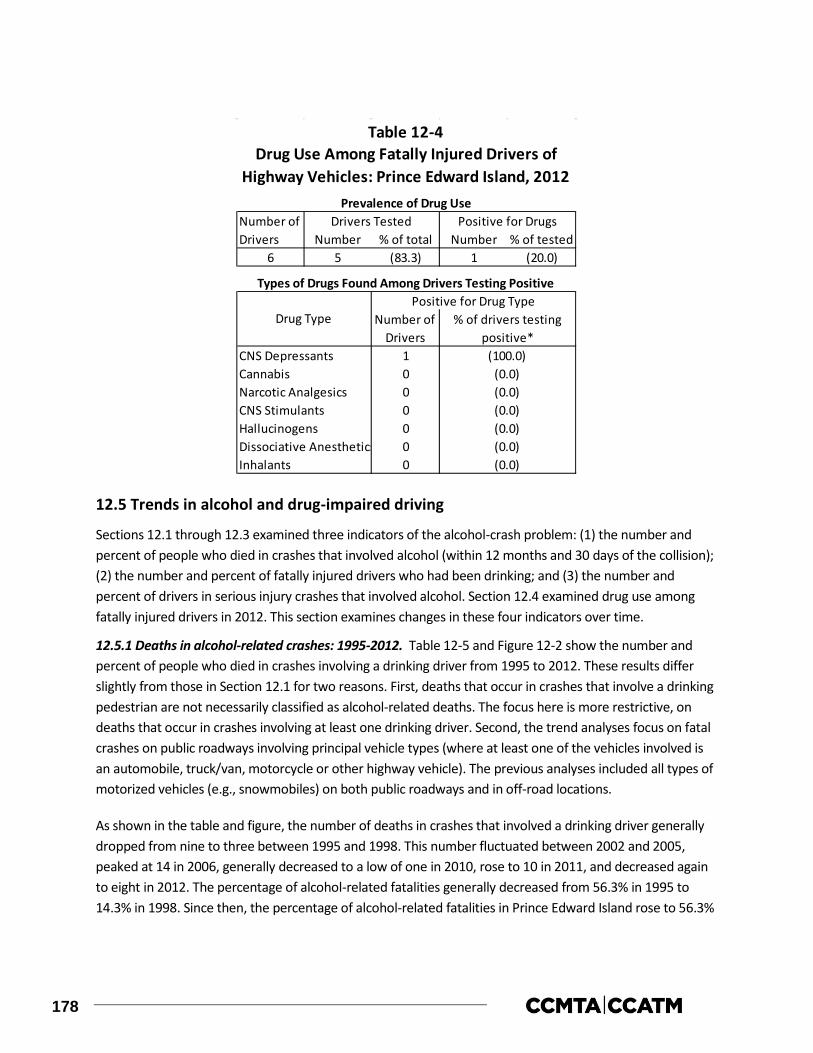
178
12.5 Trends in alcohol and drug-impaired driving
Sections 12.1 through 12.3 examined three indicators of the alcohol-crash problem: (1) the number and percent of people who died in crashes that involved alcohol (within 12 months and 30 days of the collision); (2) the number and percent of fatally injured drivers who had been drinking; and (3) the number and percent of drivers in serious injury crashes that involved alcohol. Section 12.4 examined drug use among fatally injured drivers in 2012. This section examines changes in these four indicators over time.
12.5.1 Deaths in alcohol-related crashes: 1995-2012. Table 12-5 and Figure 12-2 show the number and percent of people who died in crashes involving a drinking driver from 1995 to 2012. These results differ slightly from those in Section 12.1 for two reasons. First, deaths that occur in crashes that involve a drinking pedestrian are not necessarily classified as alcohol-related deaths. The focus here is more restrictive, on deaths that occur in crashes involving at least one drinking driver. Second, the trend analyses focus on fatal crashes on public roadways involving principal vehicle types (where at least one of the vehicles involved is an automobile, truck/van, motorcycle or other highway vehicle). The previous analyses included all types of motorized vehicles (e.g., snowmobiles) on both public roadways and in off-road locations.
As shown in the table and figure, the number of deaths in crashes that involved a drinking driver generally dropped from nine to three between 1995 and 1998. This number fluctuated between 2002 and 2005, peaked at 14 in 2006, generally decreased to a low of one in 2010, rose to 10 in 2011, and decreased again to eight in 2012. The percentage of alcohol-related fatalities generally decreased from 56.3% in 1995 to 14.3% in 1998. Since then, the percentage of alcohol-related fatalities in Prince Edward Island rose to 56.3%
Number % of total Number % of tested6 5 (83.3) 1 (20.0)
1000000
Drug Use Among Fatally Injured Drivers of Highway Vehicles: Prince Edward Island, 2012
Table 12-4
CNS Depressants
Drivers TestedNumber of Drivers
Positive for DrugsPrevalence of Drug Use
Types of Drugs Found Among Drivers Testing Positive
Drug Type % of drivers testing positive*
Positive for Drug TypeNumber of
Drivers(100.0)
(0.0)
(0.0)
(0.0)(0.0)(0.0)(0.0)
CannabisNarcotic AnalgesicsCNS StimulantsHallucinogensDissociative AnestheticsInhalants

179
in 2003, decreased to 20.0% in 2005, rose to 51.9% in 2006, fell to a low of 11.1% in 2010, and rose again to 66.7% in 2012.
As shown at the bottom of the table, during the 2006-2010 baseline period, there was an average of seven fatalities involving a drinking driver and they accounted for 46.7% of all fatalities. Thus, it can be seen that the percent of fatalities involving a drinking driver increased by 28.5% from 46.7% in the baseline period (2006-2010) to 60.0% in the 2011-2012 period. And, in terms of the number of persons killed in crashes involving a drinking driver, there has been a 28.6% increase from an average of seven in the baseline period (2006-2010) to nine in the 2011-2012 period.
Number % of total Number % of total1995 16 9 56.3 16 9 56.31996 18 4 22.2 15 4 26.71997 20 6 30.0 20 6 30.01998 21 3 14.3 20 2 10.01999 20 5 25.0 19 5 26.32000 19 5 26.3 19 5 26.32001 15 7 46.7 14 7 50.02002 18 10 55.6 17 9 52.92003 16 9 56.3 13 8 61.52004 28 10 35.7 28 10 35.72005 15 3 20.0 15 3 20.02006 27 14 51.9 26 14 53.82007 8 4 50.0 8 4 50.02008 19 9 47.4 17 9 52.92009 12 6 50.0 12 6 50.02010 9 1 11.1 9 1 11.12011 18 10 55.6 18 10 55.62012 12 8 66.7 11 8 72.7
2006-2010baseline
2011-2012period
** only on public roadways involving principal vehicle types.
60.015 9 60.0 15 9
* numbers are estimates based on the percent of deaths for which information was available to determine alcohol use.
Number of Deaths
Alcohol-Related Deaths
Persons Dying Within 30 Days of Collision
Table 12-5Number* and Percent of Motor Vehicle Deaths** Involving a
Drinking Driver: Prince Edward Island, 1995-2012
Alcohol-Related Deaths
Persons Dying Within 12 Months of Collision
Year of Death
Number of Deaths
15 7 46.7 14 7 50.0
180
12.5.2 Alcohol use among fatally injured drivers: Data on alcohol use among fatally injured drivers over the 26-year period from 1987-2012 are shown in Table 12-6. Trends are illustrated in Figure 12-3 which shows changes in the percent of fatally injured drivers who: (1) showed no evidence of alcohol (represented by the white area); (2) had BACs below the legal limit (shown by the light grey area); and (3) had BACs over the legal limit (the dark grey area). The data reported here are restricted to drivers who died in less than six hours after the crash (see Section 2.2.2).
As can be seen, the percent of fatally injured drivers with BACs over the legal limit generally declined from 1987 (60.0%) to 1997 (11.1%), generally increased until 2007 (66.7%), decreased in 2010 (0.0%), rose in 2011 (45.5%), and decreased again in 2012 (40.0%). The percent of fatally injured drivers with zero BACs generally increased from 1987 (40.0%) to its highest level in 1998 (87.5%), stabilized until 2006 (72.7%), dropped in 2007 and 2008 (33.3%), rose in 2010 (83.3%), and decreased to its lowest point in 2012 (20.0%). The percent of fatally injured drivers with BACs between 1 and 80 mg% reached 33.3% in 1990, fell to its lowest mark from 1998 to 2002 (0.0%), increased in 2003 (14.3%), returned to a low of 0.0% from 2005 to 2009, and rose to its highest level in 2012 (40.0%).
When compared to the 2006-2010 baseline period, the percentage of fatally injured drivers with zero BACs in the 2011-2012 period decreased by 60.0% (from 62.5% to 25.0%). Among drivers with BACs from 1-80 mg%, there was an increase from 0.0% to 25.0%. Among drivers with BACs over 80 mg%, there was a 33.3% increase 37.5% in the baseline period to 50.0% in the 2011-2012 period.

181
Table 12-7 and Figure 12-4 show data on alcohol use among fatally injured drivers over a shorter period from 1990-2012. These results also differ from those reported above for several reasons. First, the number of drivers is extrapolated to reflect the BAC distribution of drivers tested for alcohol (see Figure 12-1). Second, estimates are based on all fatally injured drivers, not just those who died in less than six hours from the crash. Third, drivers are grouped in only two BAC categories: zero and positive.
No. (% Total) Zero (% Tested) 1-80 (% Tested) >80 (% Tested)1987 6 5 83.3 2 40.0 0 0.0 3 60.01988 9 8 88.9 4 50.0 0 0.0 4 50.01989 8 5 62.5 2 40.0 0 0.0 3 60.01990 10 9 90.0 4 44.4 3 33.3 2 22.21991 16 16 100.0 11 68.8 1 6.3 4 25.01992 7 6 85.7 3 50.0 1 16.7 2 33.31993 9 8 88.9 3 37.5 0 0.0 5 62.51994 11 11 100.0 7 63.6 1 9.1 3 27.31995 9 8 88.9 3 37.5 0 0.0 5 62.51996 13 13 100.0 9 69.2 1 7.7 3 23.11997 9 9 100.0 6 66.7 2 22.2 1 11.11998 8 8 100.0 7 87.5 0 0.0 1 12.51999 7 7 100.0 5 71.4 0 0.0 2 28.62000 10 9 90.0 6 66.7 0 0.0 3 33.32001 5 5 100.0 3 60.0 0 0.0 2 40.02002 10 10 100.0 6 60.0 0 0.0 4 40.02003 7 7 100.0 4 57.1 1 14.3 2 28.62004 15 14 93.3 8 57.1 1 7.1 5 35.72005 8 7 87.5 4 57.1 0 0.0 3 42.92006 11 11 100.0 8 72.7 0 0.0 3 27.32007 3 3 100.0 1 33.3 0 0.0 2 66.72008 12 12 100.0 4 33.3 0 0.0 8 66.72009 10 10 100.0 5 50.0 0 0.0 5 50.02010 6 6 100.0 5 83.3 1 16.7 0 0.02011 11 11 100.0 4 36.4 2 18.2 5 45.52012 5 5 100.0 1 20.0 2 40.0 2 40.0
2006-2010baseline
2011-2012period
* dying in less than six hours.
8 8 (100.0)
Year Number of Drivers*
Drivers Tested
8 8 (100.0)
Table 12-6
Drivers Grouped by BAC (mg%)
Alcohol Use Among Fatally Injured Drivers of Highway Vehicles:Prince Edward Island, 1987-2012
5 (62.5) 0 (0.0) 3 (37.5)
(50.0)2 (25.0) 2 (25.0) 4

182
As can be seen in Table 12-7, the baseline percentage of fatally injured drivers testing positive for alcohol from 2006-2010 is 44.4%. In the 2011-2012 period, 66.7% of fatally injured drivers tested positive for alcohol, a 50.2% increase from the baseline period.
12.5.3 Drivers in serious injury crashes: Table 12-8 and Figure 12-5 show information on drivers involved in alcohol-related serious injury crashes. As shown in Table 12-8, during the baseline period (2006-2010), an
Zero (% Tested) Positive (% Tested)1990 16 9 (56.3) 7 (43.8)1991 16 11 (68.8) 5 (31.3)1992 8 4 (50.0) 4 (50.0)1993 11 4 (36.4) 7 (63.6)1994 11 7 (63.6) 4 (36.4)1995 12 5 (41.7) 7 (58.3)1996 15 11 (73.3) 4 (26.7)1997 11 7 (63.6) 4 (36.4)1998 11 10 (90.9) 1 (9.1)1999 10 7 (70.0) 3 (30.0)2000 12 8 (66.7) 4 (33.3)2001 6 4 (66.7) 2 (33.3)2002 10 6 (60.0) 4 (40.0)2003 9 5 (55.6) 4 (44.4)2004 16 9 (56.3) 7 (43.8)2005 13 8 (61.5) 5 (38.5)2006 13 10 (76.9) 3 (23.1)2007 4 1 (25.0) 3 (75.0)2008 12 4 (33.3) 8 (66.7)2009 10 5 (50.0) 5 (50.0)2010 6 5 (83.3) 1 (16.7)2011 11 4 (36.4) 7 (63.6)2012 6 1 (16.7) 5 (83.3)
2006-2010baseline
2011-2012period
* numbers are estimates based on the BAC distribution of drivers tested for alcohol
9 3 (33.3) 6 (66.7)
9 5 (55.6) 4 (44.4)
Table 12-7Alcohol Use Among Fatally Injured Drivers of Highway Vehicles*:
Prince Edward Island, 1990-2012
Year Number of Drivers
Drivers Grouped by BAC (mg%)

183
average of 23.4% of drivers in serious injury crashes were in an alcohol-involved crash. This compares to 26.5% in the 2011-2012 period, a 13.2% increase in the problem.
Table 12-9 and Figure 12-6 also show information on drivers involved in alcohol-related serious injury crashes. These results differ slightly from those in Section 12.3 and in Table 12-8 and Figure 12-5 above because they exclude certain vehicle types – e.g., bicycles, snowmobiles, farm tractors, and other non-highway vehicles.
Year Number of Drivers
Number in Alcohol-Involved Crashes Percent
1995 182 30 (16.5)1996 75 22 (29.3)1997 111 21 (18.9)1998 112 22 (19.6)1999 133 34 (25.6)2000 115 33 (28.7)2001 94 19 (20.2)2002 84 17 (20.2)2003 116 19 (16.4)2004 97 29 (29.9)2005 69 19 (27.5)2006 81 20 (24.7)2007 75 17 (22.7)2008 39 9 (23.1)2009 61 18 (29.5)2010 66 13 (19.7)2011 67 17 (25.4)2012 68 19 (27.9)
2006-2010baseline
2011-2012period
* single-vehicle nighttime crashes (SVN) as well as non-SVN crashes that have police-reported alcohol involvement
68 18 (26.5)
Table 12-8Number and Percent of All Drivers in Serious Injury Crashes*
that Involved Alcohol: Prince Edward Island, 1995-2012
64 15 (23.4)

184
As can be seen, the incidence of alcohol-involvement in serious injury crashes has fluctuated over this 18-year period. Between 1995 and 1996 the percentage of drivers in serious injury crashes that involved alcohol rose from 15.1% to 29.7%. Since then, the incidence fluctuated until 2003, rose to 29.3% in 2004, fluctuated until 2009 (31.0%), decreased to 19.7% in 2010, and rose again to 25.8% in 2012.
As shown Table 12-9, in the baseline period (2006-2010) an average of 23.0% of drivers in serious injury crashes were in an alcohol-involved crash. In the 2011-2012 period, the incidence of drivers in alcohol-involved crashes rose to 25.8%, a 12.2% increase.
Number ofDrivers
1995 172 26 (15.1)1996 74 22 (29.7)1997 102 21 (20.6)1998 108 22 (20.4)1999 130 33 (25.4)2000 110 32 (29.1)2001 83 16 (19.3)2002 80 17 (21.3)2003 111 18 (16.2)2004 92 27 (29.3)2005 66 19 (28.8)2006 77 18 (23.4)2007 68 15 (22.1)2008 35 8 (22.9)2009 58 18 (31.0)2010 66 13 (19.7)2011 62 15 (24.2)2012 62 16 (25.8)
2006-2010baseline
2011-2012period
* excludes operators of bicycles, snowmobiles, farm tractors, and other non-highway vehicles.
** single-vehicle nighttime crashes (SVN) as well as non-SVN crashes that have police-reported alcohol involvement
62 16 (25.8)
61 14 (23.0)
Table 12-9Number and Percent of Drivers* of Highway Vehicles in Serious Injury
Crashes** that Involved Alcohol: Prince Edward Island, 1995-2012
Year PercentNumber in Alcohol-Involved Crashes
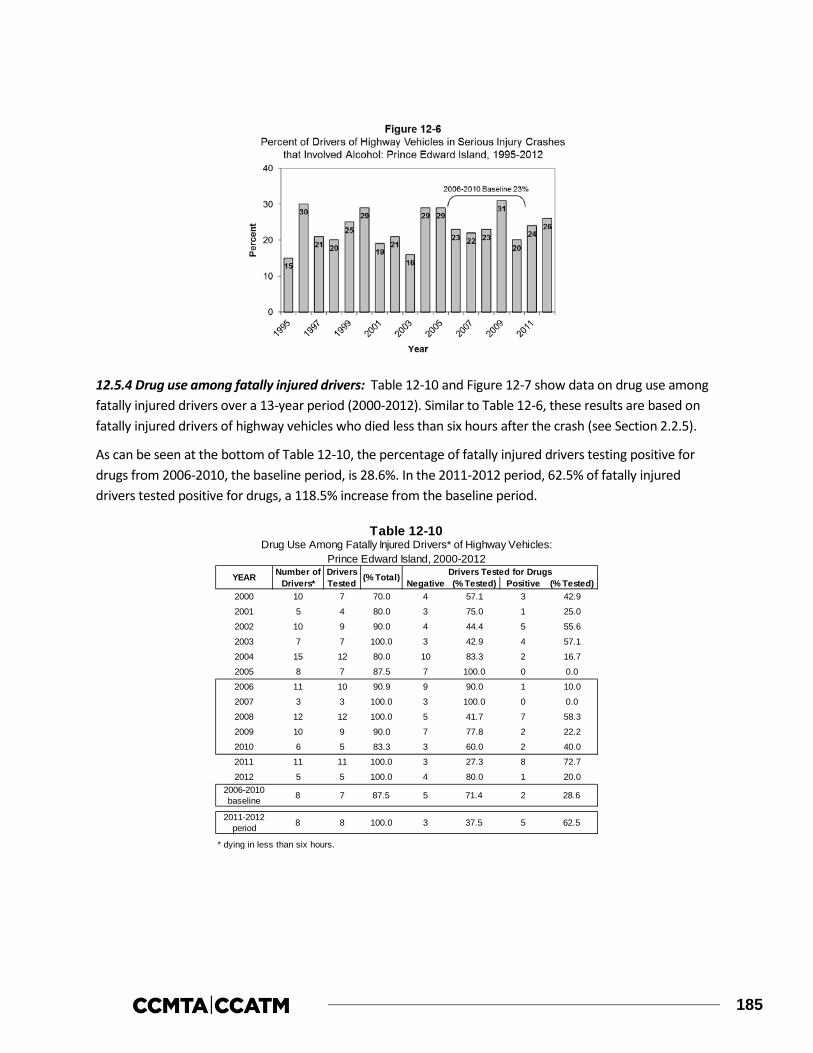
185
12.5.4 Drug use among fatally injured drivers: Table 12-10 and Figure 12-7 show data on drug use among fatally injured drivers over a 13-year period (2000-2012). Similar to Table 12-6, these results are based on fatally injured drivers of highway vehicles who died less than six hours after the crash (see Section 2.2.5).
As can be seen at the bottom of Table 12-10, the percentage of fatally injured drivers testing positive for drugs from 2006-2010, the baseline period, is 28.6%. In the 2011-2012 period, 62.5% of fatally injured drivers tested positive for drugs, a 118.5% increase from the baseline period.
Negative (% Tested) Positive (% Tested)2000 10 7 70.0 4 57.1 3 42.9
2001 5 4 80.0 3 75.0 1 25.0
2002 10 9 90.0 4 44.4 5 55.6
2003 7 7 100.0 3 42.9 4 57.1
2004 15 12 80.0 10 83.3 2 16.7
2005 8 7 87.5 7 100.0 0 0.0
2006 11 10 90.9 9 90.0 1 10.0
2007 3 3 100.0 3 100.0 0 0.0
2008 12 12 100.0 5 41.7 7 58.3
2009 10 9 90.0 7 77.8 2 22.2
2010 6 5 83.3 3 60.0 2 40.0
2011 11 11 100.0 3 27.3 8 72.7
2012 5 5 100.0 4 80.0 1 20.02006-2010baseline
2011-2012period
* dying in less than six hours.
5 62.58 8 100.0 3 37.5
Table 12-10
YEAR Number of Drivers*
Drivers Tested (% Total) Drivers Tested for Drugs
2 28.6
Drug Use Among Fatally Injured Drivers* of Highway Vehicles: Prince Edward Island, 2000-2012
8 7 87.5 5 71.4

186

187
13.0 NEWFOUNDLAND AND LABRADOR
This section of the report reviews the major findings on alcohol involvement in fatal and serious injury motor vehicle collisions as well as drug involvement in fatal motor vehicle collisions in Newfoundland and Labrador during 2012. It describes data on:
> people who were killed in alcohol-related crashes (Section 13.1);
> alcohol use among fatally injured drivers (Section 13.2);
> drivers involved in alcohol-related serious injury crashes (Section 13.3);
> drug use among fatally injured drivers (Section 13.4); and,
> trends in the alcohol-crash and drug-crash problems (Section 13.5).
13.1 Deaths in alcohol-related crashes
Table 13-1 presents information on people who died in alcohol-related crashes in Newfoundland and Labrador during 2012 for persons dying within 12 months of the collision (one calendar year) and for persons dying within 30 days of the collision. Motor vehicle deaths are categorized in terms of the victim’s age, gender, type (i.e., driver, passenger, pedestrian) and the type of vehicle they occupied. In each section, the first column in the table presents the number of deaths. The next two columns show the number and percent of these fatalities in which sufficient information was available to determine if alcohol was involved. A motor vehicle fatality was considered to be alcohol involved if there was at least one drinking driver or drinking pedestrian in the fatal crash.
For example, within the first section, it can be seen that among persons dying within 12 months of the collision, nine people aged 46-55 were killed in motor vehicle crashes in Newfoundland and Labrador during 2012. And, in eight cases (88.9%) it was possible to determine if alcohol was a factor in the crash. The next column shows the number of people killed in crashes that were known to be alcohol-involved. There were three people aged 46-55 who died in alcohol-related crashes in Newfoundland and Labrador during 2012. The next column expresses this as a percentage – i.e., 37.5% of the 46-55 year olds who were killed died in an alcohol-related crash.
The final column (percent of all alcohol-related deaths) expresses the number of deaths in alcohol-related crashes as a percent of all the deaths in such crashes. For example, the alcohol-related deaths among 46-55 year olds represent 23.1% of all the people killed in alcohol-related crashes in Newfoundland and Labrador during 2012.
An examination of the section for persons dying within 30 days of the collision shows that nine persons aged 46-55 died in motor vehicle crashes. In eight of these cases (88.9%), it was possible to determine if alcohol was a factor in the crash. Among these persons, three (37.5%) were alcohol-related deaths. And 46-55 year olds accounted for 23.1% of people dying in alcohol-related crashes.
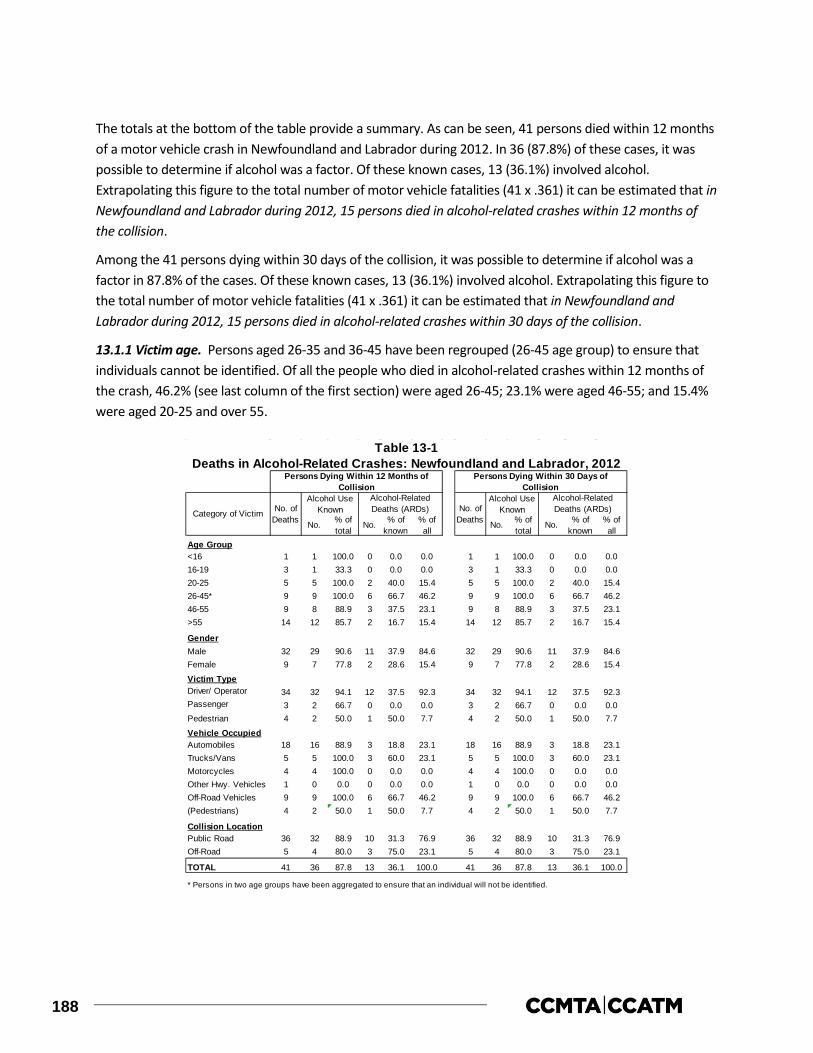
188
The totals at the bottom of the table provide a summary. As can be seen, 41 persons died within 12 months of a motor vehicle crash in Newfoundland and Labrador during 2012. In 36 (87.8%) of these cases, it was possible to determine if alcohol was a factor. Of these known cases, 13 (36.1%) involved alcohol. Extrapolating this figure to the total number of motor vehicle fatalities (41 x .361) it can be estimated that in Newfoundland and Labrador during 2012, 15 persons died in alcohol-related crashes within 12 months of the collision.
Among the 41 persons dying within 30 days of the collision, it was possible to determine if alcohol was a factor in 87.8% of the cases. Of these known cases, 13 (36.1%) involved alcohol. Extrapolating this figure to the total number of motor vehicle fatalities (41 x .361) it can be estimated that in Newfoundland and Labrador during 2012, 15 persons died in alcohol-related crashes within 30 days of the collision.
13.1.1 Victim age. Persons aged 26-35 and 36-45 have been regrouped (26-45 age group) to ensure that individuals cannot be identified. Of all the people who died in alcohol-related crashes within 12 months of the crash, 46.2% (see last column of the first section) were aged 26-45; 23.1% were aged 46-55; and 15.4% were aged 20-25 and over 55.
Age Group<16 1 1 100.0 0 0.0 0.0 1 1 100.0 0 0.0 0.016-19 3 1 33.3 0 0.0 0.0 3 1 33.3 0 0.0 0.020-25 5 5 100.0 2 40.0 15.4 5 5 100.0 2 40.0 15.426-45* 9 9 100.0 6 66.7 46.2 9 9 100.0 6 66.7 46.246-55 9 8 88.9 3 37.5 23.1 9 8 88.9 3 37.5 23.1>55 14 12 85.7 2 16.7 15.4 14 12 85.7 2 16.7 15.4
GenderMale 32 29 90.6 11 37.9 84.6 32 29 90.6 11 37.9 84.6Female 9 7 77.8 2 28.6 15.4 9 7 77.8 2 28.6 15.4
Victim TypeDriver/ Operator 34 32 94.1 12 37.5 92.3 34 32 94.1 12 37.5 92.3Passenger 3 2 66.7 0 0.0 0.0 3 2 66.7 0 0.0 0.0Pedestrian 4 2 50.0 1 50.0 7.7 4 2 50.0 1 50.0 7.7
Vehicle OccupiedAutomobiles 18 16 88.9 3 18.8 23.1 18 16 88.9 3 18.8 23.1Trucks/Vans 5 5 100.0 3 60.0 23.1 5 5 100.0 3 60.0 23.1Motorcycles 4 4 100.0 0 0.0 0.0 4 4 100.0 0 0.0 0.0Other Hwy. Vehicles 1 0 0.0 0 0.0 0.0 1 0 0.0 0 0.0 0.0Off-Road Vehicles 9 9 100.0 6 66.7 46.2 9 9 100.0 6 66.7 46.2(Pedestrians) 4 2 50.0 1 50.0 7.7 4 2 50.0 1 50.0 7.7
Collision LocationPublic Road 36 32 88.9 10 31.3 76.9 36 32 88.9 10 31.3 76.9Off-Road 5 4 80.0 3 75.0 23.1 5 4 80.0 3 75.0 23.1
TOTAL 41 36 87.8 13 36.1 100.0 41 36 87.8 13 36.1 100.0
* Persons in two age groups have been aggregated to ensure that an individual will not be identified.
Persons Dying Within 30 Days of Collision
% of known
Table 13-1Deaths in Alcohol-Related Crashes: Newfoundland and Labrador, 2012
Alcohol-Related Deaths (ARDs)
Alcohol-Related Deaths (ARDs)
% of all
% of all
Persons Dying Within 12 Months of Collision
% of known
No. of Deaths
Alcohol Use Known
No. % of total
No.Category of Victim No. of
Deaths No.
Alcohol Use Known
% of total
No.

189
The highest incidence of alcohol involvement occurred in the crashes in which a person aged 26-45 died (66.7%). The lowest incidence of alcohol involvement was found among the youngest fatalities – 0.0% of persons under age 16 and 16-19 died in crashes involving alcohol.
13.1.2 Gender. Of all the people who died in alcohol-related crashes within 12 months of the collision, 84.6% were males. The incidence of alcohol in crashes in which a male died (37.9%) was greater than the incidence of alcohol in crashes in which a female died (28.6%).
13.1.3 Victim type. Of all the people who died in alcohol-related crashes within 12 months of the collision, 92.3% were drivers/operators of a vehicle and 7.7% were pedestrians.
Within each of the victim types, the highest incidence of alcohol involvement (50.0%) occurred in the crashes in which a pedestrian died. Alcohol was involved in 37.5% of the crashes in which a driver/operator died. None of the fatally injured passengers died in an alcohol-related crash.
13.1.4 Type of vehicle occupied. Of all the people who died in alcohol-related crashes within 12 months of the collision, 46.2% were off-road vehicle occupants; and 23.1% were automobile occupants and truck/van occupants.
Within each of these vehicle types, the incidence of alcohol involvement in which an off-road vehicle occupant died (66.7%) was greater than the incidence of alcohol in crashes in which a truck/van occupant died (60.0%). Among automobile occupants, 18.8% died in an alcohol-related collision.
13.1.5 Collision location. Of all the people who died in alcohol-related crashes within 12 months of the collision, 76.9% died in a collision which occurred on a public road and 23.1% died in an off-road collision. However, the incidence of alcohol involvement in which a victim died in an alcohol-related crash was greater for those dying in off-road collisions (75.0%) than it was for persons dying in a collision which occurred on a public road (31.3%).
13.2 Alcohol in fatally injured drivers
This section presents information on the presence of alcohol, exclusively among drivers fatally injured within 12 months of the collision in Newfoundland and Labrador during 2012. Table 13-2 shows the information by age group, gender, vehicle type, collision type (single vs. multiple), and duration between crash time (within 12 months of the collision vs. within 30 days of the collision).
The first column in the table shows the number of drivers killed. The next columns show the number and percent of these victims who were tested for alcohol. The remaining columns provide information on the results of the alcohol tests – the first three of these present results for drivers who showed any evidence of alcohol; the last three columns present information on drivers who had BACs over the statutory limit of 80 mg%.
To illustrate, among drivers aged 46-55 there were six drivers killed during 2012; five of these fatally injured drivers (83.3%) were tested for alcohol. Of those who were tested, one (20.0%) was positive for alcohol. This means that fatally injured drinking drivers aged 46-55 accounted for 14.3% of all drinking drivers who were killed.
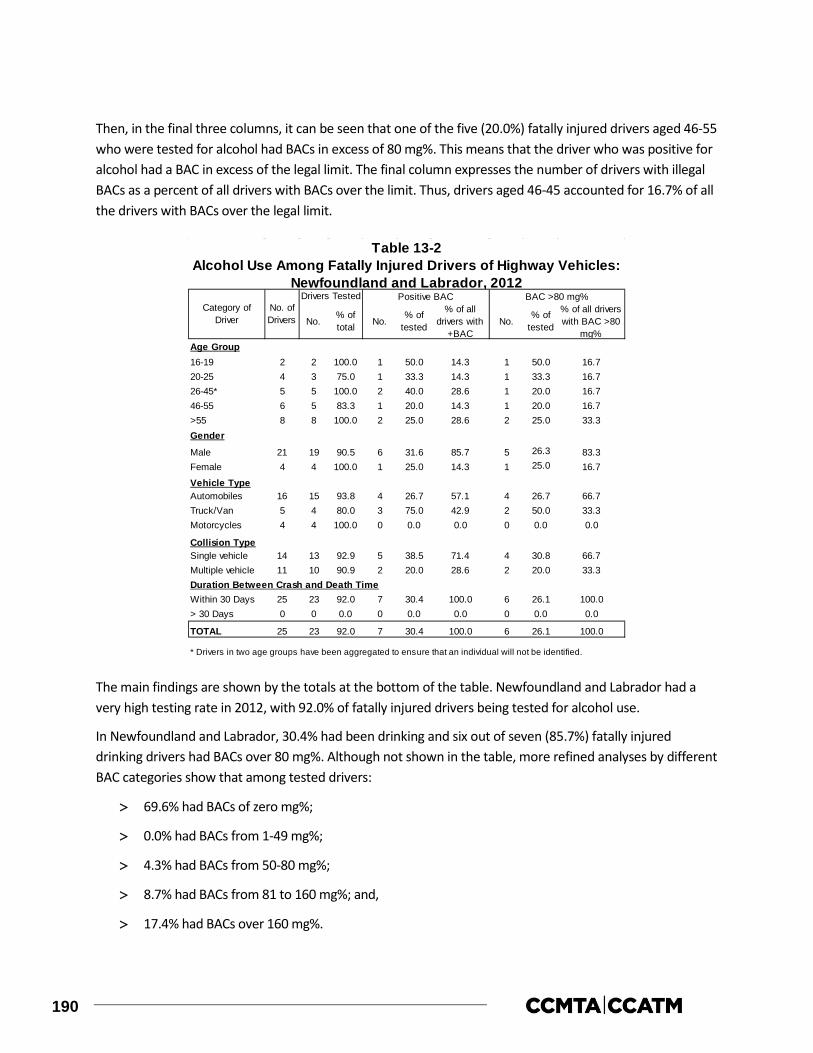
190
Then, in the final three columns, it can be seen that one of the five (20.0%) fatally injured drivers aged 46-55 who were tested for alcohol had BACs in excess of 80 mg%. This means that the driver who was positive for alcohol had a BAC in excess of the legal limit. The final column expresses the number of drivers with illegal BACs as a percent of all drivers with BACs over the limit. Thus, drivers aged 46-45 accounted for 16.7% of all the drivers with BACs over the legal limit.
The main findings are shown by the totals at the bottom of the table. Newfoundland and Labrador had a very high testing rate in 2012, with 92.0% of fatally injured drivers being tested for alcohol use.
In Newfoundland and Labrador, 30.4% had been drinking and six out of seven (85.7%) fatally injured drinking drivers had BACs over 80 mg%. Although not shown in the table, more refined analyses by different BAC categories show that among tested drivers:
> 69.6% had BACs of zero mg%;
> 0.0% had BACs from 1-49 mg%;
> 4.3% had BACs from 50-80 mg%;
> 8.7% had BACs from 81 to 160 mg%; and,
> 17.4% had BACs over 160 mg%.
Age Group16-19 2 2 100.0 1 50.0 14.3 1 50.0 16.720-25 4 3 75.0 1 33.3 14.3 1 33.3 16.726-45* 5 5 100.0 2 40.0 28.6 1 20.0 16.746-55 6 5 83.3 1 20.0 14.3 1 20.0 16.7>55 8 8 100.0 2 25.0 28.6 2 25.0 33.3Gender
Male 21 19 90.5 6 31.6 85.7 5 26.3 83.3Female 4 4 100.0 1 25.0 14.3 1 25.0 16.7
Vehicle TypeAutomobiles 16 15 93.8 4 26.7 57.1 4 26.7 66.7Truck/Van 5 4 80.0 3 75.0 42.9 2 50.0 33.3Motorcycles 4 4 100.0 0 0.0 0.0 0 0.0 0.0
Collision TypeSingle vehicle 14 13 92.9 5 38.5 71.4 4 30.8 66.7Multiple vehicle 11 10 90.9 2 20.0 28.6 2 20.0 33.3Duration Between Crash and Death TimeWithin 30 Days 25 23 92.0 7 30.4 100.0 6 26.1 100.0> 30 Days 0 0 0.0 0 0.0 0.0 0 0.0 0.0
TOTAL 25 23 92.0 7 30.4 100.0 6 26.1 100.0
* Drivers in two age groups have been aggregated to ensure that an individual will not be identified.
% of tested
Table 13-2Alcohol Use Among Fatally Injured Drivers of Highway Vehicles:
Newfoundland and Labrador, 2012Positive BAC BAC >80 mg%
% of all drivers with
+BAC
% of all drivers with BAC >80
mg%
% of tested No.
Category of Driver
No. of Drivers No.
Drivers Tested
% of total No.

191
The BAC distribution for fatally injured drivers is shown in Figure 13-1. In this figure seven of 25 (28.0%) fatally injured drivers have a positive BAC. And among fatally injured drinking drivers, six (85.7%) have BACs over 80 mg%.
13.2.1 Age differences. Drivers aged 26-35 and 36-45 have been regrouped (26-45 age group) to ensure that individuals cannot be identified. Of all the fatally injured drinking drivers (i.e., those with a positive BAC), 28.6% were aged 26-45 and over 55; and 16.7% were aged 16-19, 20-25 and 46-55. Of all the fatally injured legally impaired drivers (i.e., those with BACs over 80 mg%), 33.3% were over 55; and 16.7% were aged 16-19, 20-25, 26-45, and 46-55.
When comparing the incidence of drinking and driving among fatally injured drivers by age group, fatally injured drivers aged 16-19 were the most likely to have been drinking (50.0%). By contrast, 20.0% of fatally injured drivers aged 46-55 had been drinking.
13.2.2 Gender differences. Males dominate the picture – they account for 85.7% of the fatally injured drivers who had been drinking and 83.3% of those who were legally impaired.
Males dominate the picture largely because they account for most of the drivers who are killed (21 of the 25 fatalities or 84.0% are males). Fatally injured male drivers were more likely to have been drinking than female drivers (31.6% and 25.0%, respectively). And, 83.3% of male and 100.0% of female drivers who were drinking had BACs over the legal limit.
13.2.3 Vehicle differences. Of all the fatally injured drinking drivers (i.e., those with a positive BAC), 57.1% were automobile drivers and 42.9% were truck/van drivers. Among fatally injured legally impaired drivers (i.e., those with BACs over 80 mg%), 66.7% were automobile drivers and 33.3% were truck/van drivers.
Within each of the vehicle types, 75.0% of fatally injured truck/van drivers and 26.7% of automobile drivers were found to have been drinking. None of the fatally injured motorcyclists had been drinking.
13.2.4 Collision differences. Slightly more than half of the drivers killed (14 of the 25) were involved in single-vehicle collisions yet these crashes accounted for 71.4% of drivers who had been drinking and 66.7% of those who were legally impaired.

192
The reason for this apparent disparity is because alcohol is usually overrepresented in single-vehicle crashes. Two-fifths of the drivers involved in single-vehicle crashes (38.5%) were positive for alcohol, compared to 20.0% of those involved in multiple-vehicle collisions.
13.2.5 Duration between crash and death time. Given that all of the fatally injured drivers died within 30 days of the collision, a comparison of alcohol use among drivers based on differences in the duration between crash time and death time is not applicable.
13.3 Drivers involved in alcohol-related serious injury crashes
This section presents information on drivers involved in alcohol-related crashes in which someone was seriously injured in 2012 in Newfoundland and Labrador. A “surrogate” or “indirect” measure is used to estimate alcohol involvement because drivers in serious injury crashes are seldom tested for alcohol. A driver is identified as having been involved in an alcohol-related serious injury crash if the crash in which someone was seriously injured involved a single vehicle at night (SVN), or if, in the case of a non-SVN serious injury crash, the police reported alcohol involvement – i.e., at least one drinking driver in the crash (see Section 2.2.4).
The results are shown in Table 13-3 for drivers grouped in terms of age, gender, type of vehicle driven, and type of collision. The first column shows the number of drivers involved in serious injury crashes. The number and percent of drivers in such crashes that involved alcohol is shown in the next two columns. The final column expresses the number of drivers involved in alcohol-related serious injury crashes in any row as a percent of all drivers involved in alcohol- related serious injury crashes.
As shown, by the totals at the bottom of the table, 174 drivers were involved in crashes in which someone was seriously injured, and among these 18.4% were alcohol-related crashes.
13.3.1 Driver age. Of all the drivers involved in alcohol-related serious injury crashes, 25.0% were aged 36-45, and 21.9% were over 55. Drivers under 16 accounted for 0.0% of those involved in alcohol-related serious injury crashes.
Almost one-third of the drivers aged 36-45 were involved in alcohol-related serious injury crashes (29.6%). The lowest incidence of involvement in alcohol-related crashes was found for those aged under 16 and over 55 (0.0% and 15.6%, respectively).
13.3.2 Driver gender. Of all the drivers involved in alcohol-related serious injury crashes, 78.1% were males. The incidence of involvement in alcohol-related serious injury crashes was also greater for males than for females (20.7% and 13.2%, respectively).
13.3.3 Type of vehicle driven. Of all the drivers involved in alcohol-related serious injury crashes, 56.3% were automobile drivers; 18.8% were motorcyclists; 9.4% were truck/van drivers; and 6.3% were off-road vehicle drivers and drivers of other highway vehicles.
The highest incidence of involvement in alcohol-related serious injury crashes was found for drivers of off-road vehicles and other highway vehicles (20.0%), compared to 19.4% for motorcyclists, 18.9% for automobile drivers; and 16.7% for truck/van drivers.

193
13.3.4 Type of collision. Of all the drivers involved in alcohol-related serious injury crashes, 100.0% of them were in single-vehicle crashes. The highest incidence of involvement in alcohol-related serious injury crashes was also found among drivers in single-vehicle crashes (37.6%) compared to 0.0% for drivers involved in multiple-vehicle crashes.
13.4 Drug use among fatally injured drivers
This section presents information on the presence of drugs, exclusively among drivers fatally injured in Newfoundland and Labrador during 2012. Table 13-4 shows the prevalence of drug use among fatally injured drivers of highway vehicles as well as the number of drivers who tested positive for various categories of drugs.
As can be seen, Newfoundland and Labrador had a low testing rate in 2012, with 48.0% of fatally injured drivers being tested for drug use.
Among fatally injured tested drivers, six out of 12 (50.0%) were positive for drugs. The most common categories of drugs found within drivers testing positive for drug use were cannabis (50.0%), CNS depressants (33.3%), CNS stimulants and hallucinogens (16.7% each).
% of % of all drivers inNumber total alcohol-related crashes
Age<16 1 0 0.0 0.016-19 18 3 16.7 9.420-25 28 6 21.4 18.826-35 26 4 15.4 12.536-45 27 8 29.6 25.046-55 29 4 13.8 12.5>55 45 7 15.6 21.9
GenderMale 121 25 20.7 78.1Female 53 7 13.2 21.9
Vehicle TypeAuto 95 18 18.9 56.3Truck/Van 18 3 16.7 9.4Motorcycle 31 6 19.4 18.8Other Hwy. Vehicle 10 2 20.0 6.3Off-Road 10 2 20.0 6.3Unknown 10 1 10.0 3.1
Collision TypeSingle-Vehicle 85 32 37.6 100.0Multiple-Vehicle 89 0 0.0 0.0
TOTAL 174 32 18.4 100.0
Table 13-3Drivers in Alcohol-Related Serious Injury Crashes:
Newfoundland and Labrador, 2012Category of Drivers Number of
Drivers
Alcohol-Related
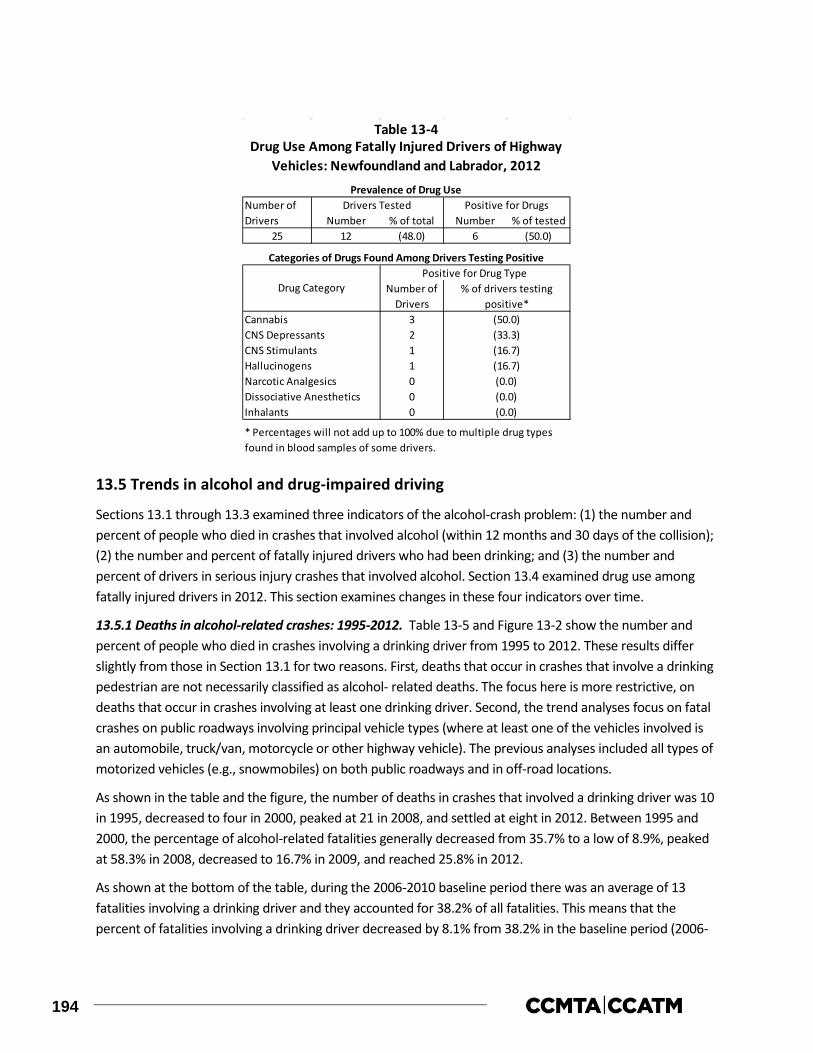
194
13.5 Trends in alcohol and drug-impaired driving
Sections 13.1 through 13.3 examined three indicators of the alcohol-crash problem: (1) the number and percent of people who died in crashes that involved alcohol (within 12 months and 30 days of the collision); (2) the number and percent of fatally injured drivers who had been drinking; and (3) the number and percent of drivers in serious injury crashes that involved alcohol. Section 13.4 examined drug use among fatally injured drivers in 2012. This section examines changes in these four indicators over time.
13.5.1 Deaths in alcohol-related crashes: 1995-2012. Table 13-5 and Figure 13-2 show the number and percent of people who died in crashes involving a drinking driver from 1995 to 2012. These results differ slightly from those in Section 13.1 for two reasons. First, deaths that occur in crashes that involve a drinking pedestrian are not necessarily classified as alcohol- related deaths. The focus here is more restrictive, on deaths that occur in crashes involving at least one drinking driver. Second, the trend analyses focus on fatal crashes on public roadways involving principal vehicle types (where at least one of the vehicles involved is an automobile, truck/van, motorcycle or other highway vehicle). The previous analyses included all types of motorized vehicles (e.g., snowmobiles) on both public roadways and in off-road locations.
As shown in the table and the figure, the number of deaths in crashes that involved a drinking driver was 10 in 1995, decreased to four in 2000, peaked at 21 in 2008, and settled at eight in 2012. Between 1995 and 2000, the percentage of alcohol-related fatalities generally decreased from 35.7% to a low of 8.9%, peaked at 58.3% in 2008, decreased to 16.7% in 2009, and reached 25.8% in 2012.
As shown at the bottom of the table, during the 2006-2010 baseline period there was an average of 13 fatalities involving a drinking driver and they accounted for 38.2% of all fatalities. This means that the percent of fatalities involving a drinking driver decreased by 8.1% from 38.2% in the baseline period (2006-
Number % of total Number % of tested25 12 (48.0) 6 (50.0)
3211000
Drug Use Among Fatally Injured Drivers of Highway Vehicles: Newfoundland and Labrador, 2012
Table 13-4
Cannabis
Narcotic Analgesics
Drivers TestedNumber of Drivers
Positive for DrugsPrevalence of Drug Use
CNS Depressants (33.3)CNS Stimulants (16.7)
Categories of Drugs Found Among Drivers Testing Positive
Drug Category % of drivers testing positive*
* Percentages will not add up to 100% due to multiple drug types found in blood samples of some drivers.
Positive for Drug TypeNumber of
Drivers(50.0)
(0.0)Hallucinogens
Dissociative AnestheticsInhalants
(16.7)
(0.0)(0.0)

195
2010) to 35.1% in the 2011-2012 period. And, in terms of the number of persons killed in crashes involving a drinking driver, there has been no change from an average of 13 in the baseline period (2006-2010) to 13 in the 2011-2012 period.
13.5.2 Alcohol use among fatally injured drivers: Data on alcohol use among fatally injured drivers over the 26-year period from 1987-2012 are shown in Table 13-6. Trends are illustrated in Figure 13-3 which shows

196
changes in the percent of fatally injured drivers who: (1) showed no evidence of alcohol (represented by the white area); (2) had BACs below the legal limit (shown by the light grey area); and (3) had BACs over the legal limit (the dark grey area). The data reported here are restricted to drivers who died in less than six hours after the crash (see Section 2.2.2).
As can be seen, the percentage of fatally injured drivers with BACs over the legal limit generally decreased from a peak in 1993 (56.3%), to a low in 2000 (10.5%), generally rose until 2008 (47.6%), and fluctuated until 2012 (27.3%). In 1995, 60.0% percent of fatally injured drivers had zero BACs. The percentage fell to a low of 13.3% in 2007, peaked in 2009 (85.7%), and fluctuated until 2012 (68.2%). The percentage of fatally injured drivers with BACs from 1-80 mg% was 0.0% in 1987, peaked in 2007 (40.0%), decreased to 0.0% from 2009 until 2011, and rose to 4.5% in 2012.
When compared to the 2006-2010 baseline period, the percentage of fatally injured drivers with zero BACs in the 2011-2012 period increased by 32.9% (from 55.6% to 73.9%). Among drivers with BACs from 1-80 mg%, there was a 61.3% decrease (from 11.1% to 4.3%). And among drivers with BACs over 80 mg%, there was a 34.8% decrease (from 33.3% to 21.7%).
No. (% Total) Zero (% Tested) 1-80 (% Tested) >80 (% Tested)1987 15 15 100.0 9 60.0 0 0.0 6 40.0
1988 20 17 85.0 7 41.2 3 17.6 7 41.2
1989 30 25 83.3 13 52.0 1 4.0 11 44.0
1990 24 20 83.3 9 45.0 5 25.0 6 30.0
1991 24 22 91.7 9 40.9 3 13.6 10 45.5
1992 18 13 72.2 5 38.5 2 15.4 6 46.2
1993 21 16 76.2 5 31.3 2 12.5 9 56.3
1994 12 10 83.3 5 50.0 0 0.0 5 50.0
1995 10 10 100.0 7 70.0 0 0.0 3 30.0
1996 18 13 72.2 6 46.2 1 7.7 6 46.2
1997 17 17 100.0 8 47.1 3 17.6 6 35.3
1998 19 17 89.5 10 58.8 2 11.8 5 29.4
1999 18 16 88.9 7 43.8 1 6.3 8 50.0
2000 21 19 90.5 16 84.2 1 5.3 2 10.5
2001 15 14 93.3 7 50.0 3 21.4 4 28.6
2002 18 18 100.0 12 66.7 2 11.1 4 22.2
2003 18 18 100.0 11 61.1 3 16.7 4 22.2
2004 16 14 87.5 8 57.1 1 7.1 5 35.7
2005 16 16 100.0 7 43.8 4 25.0 5 31.3
2006 21 19 90.5 13 68.4 0 0.0 6 31.6
2007 15 15 100.0 2 13.3 6 40.0 7 46.7
2008 21 21 100.0 5 23.8 6 28.6 10 47.6
2009 21 21 100.0 18 85.7 0 0.0 3 14.3
2010 18 18 100.0 12 66.7 0 0.0 6 33.3
2011 25 24 96.0 20 83.3 0 0.0 4 16.7
2012 23 22 95.7 15 68.2 1 4.5 6 27.32006-2010baseline
2011-2012period
* dying in less than six hours.
1 (4.3) 5 (21.7)24 23 (95.8) 17 (73.9)
Table 13-6
Drivers Grouped by BAC (mg%)
Alcohol Use Among Fatally Injured Drivers of Highway Vehicles:Newfoundland and Labrador, 1987-2012
10 (55.6) 2 (11.1) 6 (33.3)
Year Number of Drivers*
Drivers Tested
19 18 (94.7)
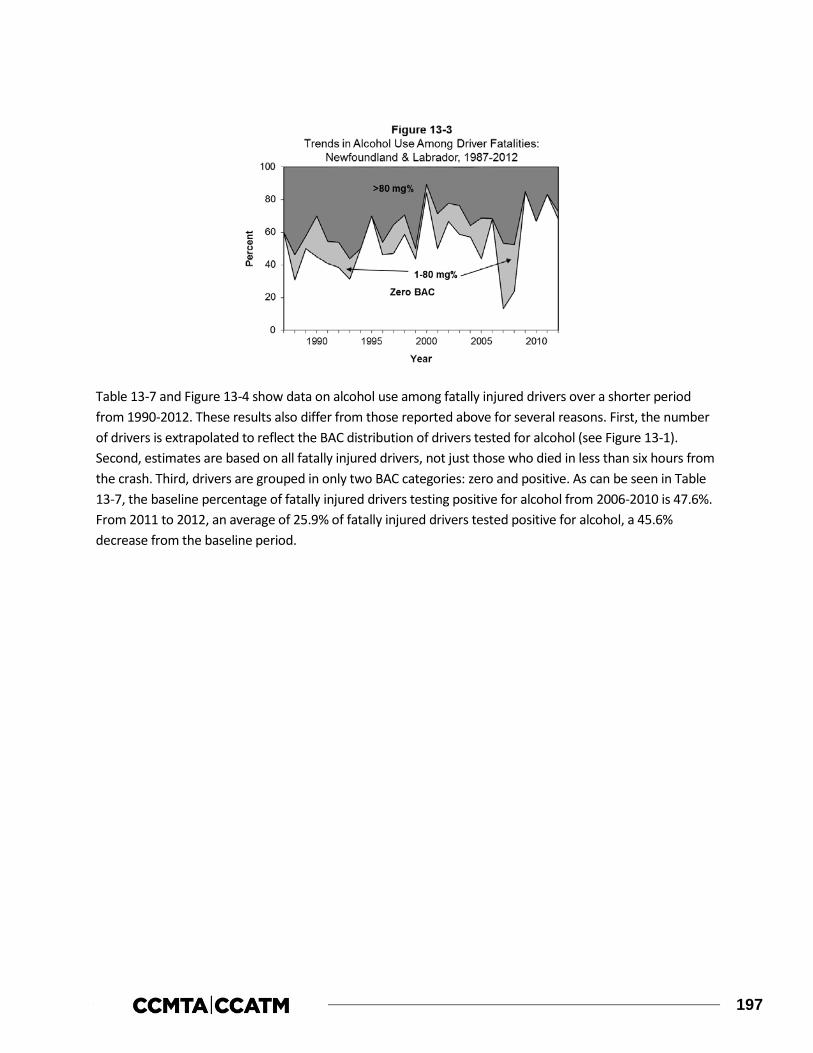
197
Table 13-7 and Figure 13-4 show data on alcohol use among fatally injured drivers over a shorter period from 1990-2012. These results also differ from those reported above for several reasons. First, the number of drivers is extrapolated to reflect the BAC distribution of drivers tested for alcohol (see Figure 13-1). Second, estimates are based on all fatally injured drivers, not just those who died in less than six hours from the crash. Third, drivers are grouped in only two BAC categories: zero and positive. As can be seen in Table 13-7, the baseline percentage of fatally injured drivers testing positive for alcohol from 2006-2010 is 47.6%. From 2011 to 2012, an average of 25.9% of fatally injured drivers tested positive for alcohol, a 45.6% decrease from the baseline period.
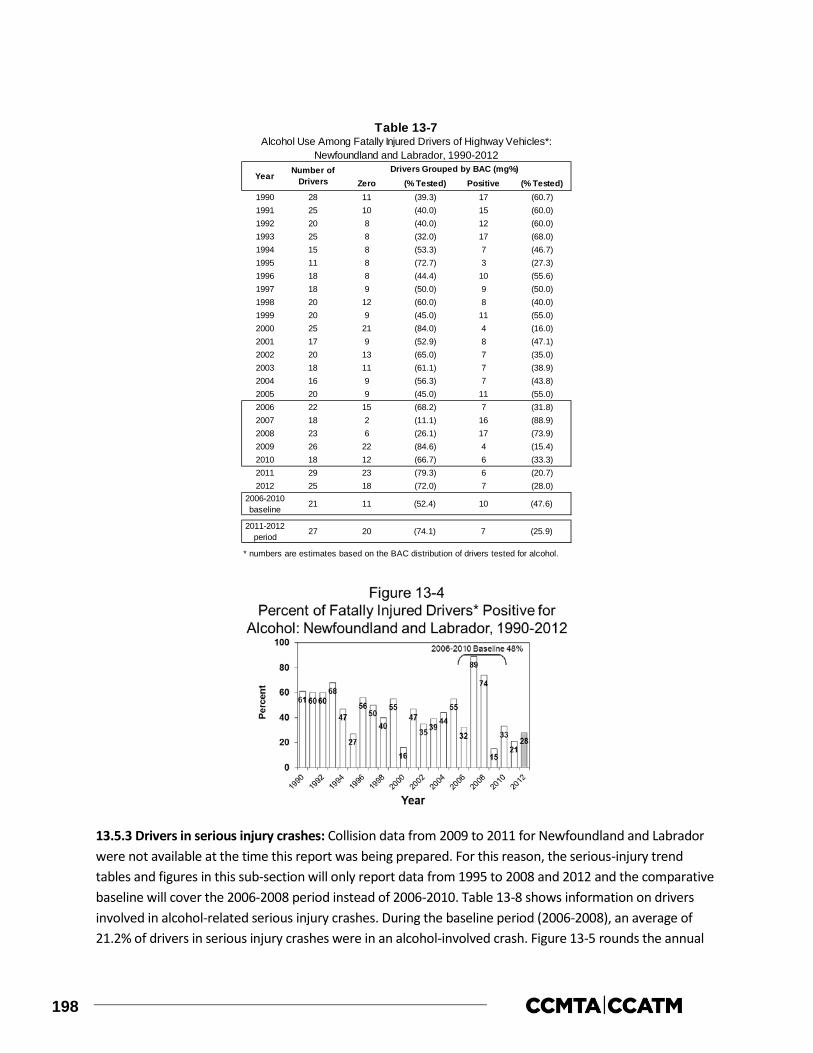
198
13.5.3 Drivers in serious injury crashes: Collision data from 2009 to 2011 for Newfoundland and Labrador were not available at the time this report was being prepared. For this reason, the serious-injury trend tables and figures in this sub-section will only report data from 1995 to 2008 and 2012 and the comparative baseline will cover the 2006-2008 period instead of 2006-2010. Table 13-8 shows information on drivers involved in alcohol-related serious injury crashes. During the baseline period (2006-2008), an average of 21.2% of drivers in serious injury crashes were in an alcohol-involved crash. Figure 13-5 rounds the annual
Zero (% Tested) Positive (% Tested)1990 28 11 (39.3) 17 (60.7)1991 25 10 (40.0) 15 (60.0)1992 20 8 (40.0) 12 (60.0)1993 25 8 (32.0) 17 (68.0)1994 15 8 (53.3) 7 (46.7)1995 11 8 (72.7) 3 (27.3)1996 18 8 (44.4) 10 (55.6)1997 18 9 (50.0) 9 (50.0)1998 20 12 (60.0) 8 (40.0)1999 20 9 (45.0) 11 (55.0)2000 25 21 (84.0) 4 (16.0)2001 17 9 (52.9) 8 (47.1)2002 20 13 (65.0) 7 (35.0)2003 18 11 (61.1) 7 (38.9)2004 16 9 (56.3) 7 (43.8)2005 20 9 (45.0) 11 (55.0)2006 22 15 (68.2) 7 (31.8)2007 18 2 (11.1) 16 (88.9)2008 23 6 (26.1) 17 (73.9)2009 26 22 (84.6) 4 (15.4)2010 18 12 (66.7) 6 (33.3)2011 29 23 (79.3) 6 (20.7)2012 25 18 (72.0) 7 (28.0)
2006-2010baseline
2011-2012period
* numbers are estimates based on the BAC distribution of drivers tested for alcohol.
Table 13-7Alcohol Use Among Fatally Injured Drivers of Highway Vehicles*:
Newfoundland and Labrador, 1990-2012
Year Number of Drivers
Drivers Grouped by BAC (mg%)
21 11 (52.4) 10 (47.6)
27 20 (74.1) 7 (25.9)

199
percentages into whole numbers. In 2012, the percentage of drivers involved in alcohol-involved serious-injury crashes was 18.4%. This represents a 13.2% decrease in the problem compared to the 2006-2008 baseline period.
Table 13-9 and Figure 13-6 also show information on drivers involved in alcohol-related serious injury crashes. These results differ slightly from those in Section 13.3 and in Table 13-8 and Figure 13-5 because they exclude certain vehicle types – e.g., bicycles, snowmobiles, farm tractors and other non-highway vehicles.
Table 13-8Number and Percent of All Drivers in Serious Injury Crashes* that
Involved Alcohol: Newfoundland and Labrador, 1995-2012Number of Alcohol Related
Drivers Number %1995 299 66 (22.1)1996 338 69 (20.4)1997 314 54 (17.2)1998 271 56 (20.7)1999 279 66 (23.7)2000 321 50 (15.6)2001 289 53 (18.3)2002 246 45 (18.3)2003 268 46 (17.2)2004 217 52 (24.0)2005 181 35 (19.3)2006 166 36 (21.7)2007 201 40 (19.9)2008 201 43 (21.4)2009201020112012 174 32 (18.4)
2006-2008baseline
* single-vehicle nighttime crashes (SVN) as well as non-SVN crashes that have police-reported alcohol involvement
Year
189 40 (21.2)
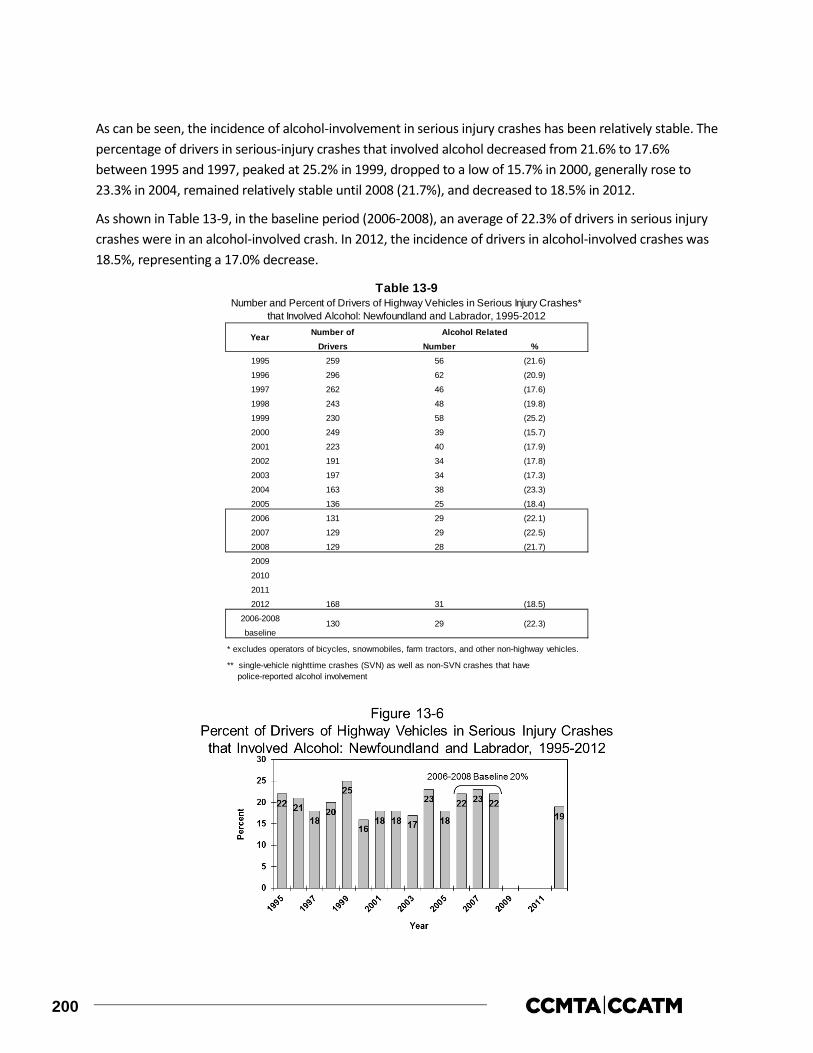
200
As can be seen, the incidence of alcohol-involvement in serious injury crashes has been relatively stable. The percentage of drivers in serious-injury crashes that involved alcohol decreased from 21.6% to 17.6% between 1995 and 1997, peaked at 25.2% in 1999, dropped to a low of 15.7% in 2000, generally rose to 23.3% in 2004, remained relatively stable until 2008 (21.7%), and decreased to 18.5% in 2012.
As shown in Table 13-9, in the baseline period (2006-2008), an average of 22.3% of drivers in serious injury crashes were in an alcohol-involved crash. In 2012, the incidence of drivers in alcohol-involved crashes was 18.5%, representing a 17.0% decrease.
Number of Alcohol RelatedDrivers Number %
1995 259 56 (21.6)
1996 296 62 (20.9)
1997 262 46 (17.6)
1998 243 48 (19.8)
1999 230 58 (25.2)
2000 249 39 (15.7)
2001 223 40 (17.9)
2002 191 34 (17.8)
2003 197 34 (17.3)
2004 163 38 (23.3)
2005 136 25 (18.4)
2006 131 29 (22.1)
2007 129 29 (22.5)
2008 129 28 (21.7)
2009
2010
2011
2012 168 31 (18.5)
2006-2008
baseline
* excludes operators of bicycles, snowmobiles, farm tractors, and other non-highway vehicles.
** single-vehicle nighttime crashes (SVN) as well as non-SVN crashes that have police-reported alcohol involvement
Year
130 29 (22.3)
Table 13-9Number and Percent of Drivers of Highway Vehicles in Serious Injury Crashes*
that Involved Alcohol: Newfoundland and Labrador, 1995-2012

201
13.5.4 Drug use among fatally injured drivers: Table 13-10 and Figure 13-7 show data on drug use among fatally injured drivers over a 13-year period (2000-2012). Similar to Table 13-6, these results are based on fatally injured drivers of highway vehicles who died less than six hours after the crash (see Section 2.2.5).
As can be seen at the bottom of Table 13-10, the percentage of fatally injured drivers testing positive for drugs from 2006-2010, the baseline period, is 28.6%. The percentage of fatally injured drivers testing positive for drugs was 28.6% in 2011 and 50.0% in 2012. From 2011 to 2012, the average percentage of fatally injured drivers testing positive for drugs was 44.4%, a 55.2% increase from the baseline period.
Negative (% Tested) Positive (% Tested)2000 21 6 28.6 4 66.7 2 33.32001 15 6 40.0 6 100.0 0 0.02002 18 9 50.0 4 44.4 5 55.62003 18 4 22.2 3 75.0 1 25.02004 16 6 37.5 2 33.3 4 66.72005 16 7 43.8 5 71.4 2 28.62006 21 9 42.9 6 66.7 3 33.32007 15 4 26.7 4 100.0 0 0.02008 21 7 33.3 5 71.4 2 28.62009 21 9 42.9 6 66.7 3 33.32010 18 8 44.4 5 62.5 3 37.52011 25 7 28.0 4 57.1 2 28.62012 23 12 52.2 6 50.0 6 50.0
2006-2010baseline
2011-2012period
* dying in less than six hours.
Table 13-10
YEAR Number of Drivers*
Drivers Tested (% Total) Drivers Tested for Drugs
2 28.6
Drug Use Among Fatally Injured Drivers* of Highway Vehicles: Newfoundland and Labrador, 2000-2012
19 7 36.8 5 71.4
4 44.424 9 37.5 5 55.6

203
14.0 YUKON
This section of the report reviews the major findings on alcohol involvement in fatal and serious injury motor vehicle collisions as well as drug involvement in fatal motor vehicle collisions in the Yukon during 2012. It describes data on:
> people who were killed in alcohol-related crashes (Section 14.1);
> alcohol use among fatally injured drivers (Section 14.2);
> drivers involved in alcohol-related serious injury crashes (Section 14.3);
> drug use among fatally injured drivers (Section 14.4); and,
> trends in the alcohol-crash and drug-crash problems (Section 14.5).
Detailed results are not provided in Sections 14.1, 14.2 and 14.4 because the small number of deaths in alcohol-related crashes – only one – and drivers fatally injured – only one – makes the results unreliable.
14.1 Deaths in alcohol-related crashes
A motor vehicle fatality was considered to be alcohol involved if there was at least one drinking driver or drinking pedestrian in the fatal crash.
During 2012, two persons died in motor vehicle crashes in the Yukon. And, in both of these cases (100.0%), it was possible to determine if alcohol was a factor in the crash. Of these cases, one (50.0%) involved alcohol.
14.2 Alcohol in fatally injured drivers
The Yukon had only one fatally injured driver in 2012. This driver was tested for alcohol and had a negative BAC.
14.3 Drivers involved in alcohol-related serious injury crashes
This section presents information on drivers involved in alcohol-related crashes in which someone was seriously injured in 2012 in the Yukon. A “surrogate” or “indirect” measure is used to estimate alcohol involvement because drivers in serious injury crashes are seldom tested for alcohol. A driver is identified as having been involved in an alcohol-related serious injury crash if the crash in which someone was seriously injured involved a single vehicle at night (SVN), or if, in the case of a non-SVN serious injury crash, the police reported alcohol involvement – i.e., at least one drinking driver in the crash (see Section 2.2.4).
The results are shown in Table 14-1 for drivers grouped in terms of age, gender, type of vehicle driven, and type of collision. The first column shows the number of drivers involved in serious injury crashes. The number and percent of drivers in such crashes that involved alcohol are shown in the next two columns.

204
The final column expresses the number of drivers involved in alcohol-related serious injury crashes in any row as a percent of all drivers involved in alcohol- related serious injury crashes.
As shown, by the totals at the bottom of the table, 20 drivers were involved in crashes in which someone was seriously injured, and among these 15.0% were alcohol-related crashes.
14.3.1 Driver age. Of all the drivers involved in alcohol-related serious injury crashes, 33.3% were aged 20-25, 26-35, and 36-45.
Within each of the age groups, 50.0% of the drivers aged 20-25, 26-35 and 36-45 were involved in alcohol-related serious injury crashes. The lowest incidence of involvement in alcohol-related crashes was found for those aged 16-19, 46-55 and over 55 (0.0%).
14.3.2 Driver gender. Of all the drivers involved in alcohol-related serious injury crashes, 66.7% were males. However, the incidence of involvement in alcohol-related serious injury crashes was greater for females than for males (25.0% and 13.3%, respectively).
14.3.3 Type of vehicle driven. Of all the drivers involved in alcohol-related serious injury crashes, 66.7% were truck/van drivers and 33.3% were automobile drivers.
The highest incidence of involvement in alcohol-related serious injury crashes was found for truck/van drivers – 22.2% of these drivers were in crashes that involved alcohol, compared to 16.7% for automobile drivers and 0.0% for motorcyclists and off-road vehicle operators.
% of % of all drivers inNumber total alcohol-related crashes
Age16-19 2 0 0.0 0.0
20-25 2 1 50.0 33.326-35 2 1 50.0 33.336-45 2 1 50.0 33.346-55 2 0 0.0 0.0>55 9 0 0.0 0.0unknown 1 0 0.0 0.0
GenderMale 15 2 13.3 66.7Female 4 1 25.0 33.3unknown 1 0 0.0 0.0
Vehicle TypeAuto 6 1 16.7 33.3Truck/Van 9 2 22.2 66.7Motorcycle 4 0 0.0 0.0Off-Road 1 0 0.0 0.0
Collision TypeSingle-Vehicle 13 3 23.1 100.0Multiple-Vehicle 7 0 0.0 0.0
TOTAL 20 3 15.0 100.0
Table 14-1Drivers in Alcohol-Related Serious Injury Crashes:
Yukon, 2012Category of Drivers Number of
Drivers
Alcohol-Related

205
14.3.4 Type of collision. Of all the drivers involved in alcohol-related serious injury crashes, 100.0% of them were in single-vehicle crashes. The highest incidence of involvement in alcohol-related serious injury crashes was also found among drivers in single-vehicle crashes – 23.1% of these drivers, compared to only 0.0% for drivers involved in multiple-vehicle crashes.
14.4 Drug use among fatally injured drivers
The Yukon had only one fatally injured driver in 2012. This driver was tested for drugs and had a negative result.
14.5 Trends in alcohol and drug-impaired driving
Sections 14.1 through 14.3 examined three indicators of the alcohol-crash problem: (1) the number and percent of people who died in crashes that involved alcohol (within 12 months and 30 days of the collision); (2) the number and percent of fatally injured drivers who had been drinking; and (3) the number and percent of drivers in serious injury crashes that involved alcohol. Section 14.4 examined drug use among fatally injured drivers in 2012. This section examines changes in these four indicators over time.
14.5.1 Deaths in alcohol-related crashes: 1995-2012. Table 14-2 and Figure 14-1 show the number and percent of people who died in crashes involving a drinking driver from 1995 to 2012. These results differ slightly from those in Section 14.1 for two reasons. First, deaths that occur in crashes that involve a drinking pedestrian are not necessarily classified as alcohol-related deaths. The focus here is more restrictive, on deaths that occur in crashes involving at least one drinking driver. Second, the trend analyses focus on fatal crashes on public roadways involving principal vehicle types (where at least one of the vehicles involved is an automobile, truck/van, motorcycle or other highway vehicle). The previous analyses included all types of motorized vehicles (e.g., snowmobiles) on both public roadways and in off-road locations.
As shown in the figure, the number of deaths in crashes that involved a drinking driver increased from one to seven between 1995 and 1998, fell to zero in 2001, rose to six in 2002, decreased to one in 2004, rose to five in 2006, fluctuated until 2010, and decreased to one in 2012. The percentage of alcohol-related fatalities rose from 7.7% in 1995 to 66.7% in 1996 and 1997. Since then, the percentage of alcohol-related fatalities in the Yukon fluctuated until 2000, dropped to 0.0% in 2001, generally rose until 2005 (66.7%), fluctuated until 2009 (28.6%), peaked in 2010 (75.0%), decreased in 2011 (33.3%), and rose again in 2012 (50.0%).
It can be seen that during the 2006-2010 baseline period that there was an average of three fatalities involving a drinking driver and they accounted for 42.9% of all fatalities. This means that the percent of fatalities involving a drinking driver increased by 16.6% from 42.9% in the baseline period (2006-2010) to 50.0% in the 2011-2012 period. In terms of the number of persons killed in crashes involving a drinking driver, there was a 33.3% decrease from an average of three in the baseline period (2006-2010) to two in the 2011-2012 period.

206
14.5.2 Alcohol use among fatally injured drivers: Due to the small number of cases – e.g., one fatally injured driver in 2012 – any trends would be unreliable, and therefore, are not presented in tables and figures.
14.5.3 Drivers in serious injury crashes: In the Yukon, data are only available since 1998 to indicate the degree of injury severity for collision victims. Thus trend tables in this section include data from 2005 to 2012, as opposed to the 1995-2012 period reported for serious injury collisions in most other jurisdictions. Table 14-3 and Figure 14-2 show information on drivers involved in alcohol-related serious injury crashes.
Number % of total Number % of total1995 13 1 7.7 12 1 8.3
1996 6 4 66.7 6 4 66.7
1997 3 2 66.7 3 2 66.7
1998 11 7 63.6 11 7 63.6
1999 17 7 41.2 17 7 41.2
2000 9 6 66.7 9 6 66.7
2001 4 0 0.0 4 0 0.0
2002 14 6 42.9 13 6 46.2
2003 8 4 50.0 8 4 50.0
2004 5 1 20.0 5 1 20.0
2005 6 4 66.7 6 4 66.7
2006 12 5 41.7 12 5 41.7
2007 5 2 40.0 5 2 40.0
2008 6 3 50.0 6 3 50.0
2009 7 2 28.6 7 2 28.6
2010 4 3 75.0 4 3 75.0
2011 6 2 33.3 6 2 33.3
2012 2 1 50.0 2 1 50.02006-2010baseline
2011-2012period
** only on public roadways involving principal vehicle types.
50.04 2 50.0 4 2
* numbers are estimates based on the percent of deaths for which information was available to determine alcohol use.
Number of Deaths
Alcohol-Related Deaths
Persons Dying Within 30 Days of Collision
Table 14-2Number* and Percent of Motor Vehicle Deaths** Involving a
Drinking Driver: Yukon, 1995-2012
Alcohol-Related Deaths
Persons Dying Within 12 Months of Collision
Year of Death
Number of Deaths
7 3 42.9 7 3 42.9

207
During the baseline period (2006-2010), an average of 32.1% of drivers in serious injury crashes were in an alcohol-involved crash. This compares to 26.1% in the 2011-2012 period, an 18.7% decrease in the problem.
Table 14-4 and Figure 14-3 also show information on drivers involved in alcohol-related injury crashes. These results differ slightly from those in Section 14.3 and in Table 14-3 and Figure 14-2 because they exclude certain vehicle types – e.g., bicycles, snowmobiles, farm tractors and other non-highway vehicles.
As can be seen the incidence of alcohol-involvement in injury crashes has fluctuated over this 15-year period. Between 1998 and 2003 the percentage of all drivers in injury crashes that involved alcohol
Year Number of Drivers
Number in Alcohol-Involved Crashes Percent
1998 35 14 (40.0)1999 57 10 (17.5)2000 34 17 (50.0)2001 36 8 (22.2)2002 43 17 (39.5)2003 29 7 (24.1)2004 21 9 (42.9)2005 41 21 (51.2)2006 29 6 (20.7)2007 28 10 (35.7)2008 27 5 (18.5)2009 27 11 (40.7)2010 29 13 (44.8)2011 26 9 (34.6)2012 20 3 (15.0)
2006-2010baseline
2011-2012period
* single-vehicle nighttime crashes (SVN) as well as non-SVN crashes that have police-reported alcohol involvement
Table 14-3Number and Percent of All Drivers in Serious Injury Crashes*
that Involved Alcohol: Yukon, 1998-2012
28 9 (32.1)
23 6 (26.1)
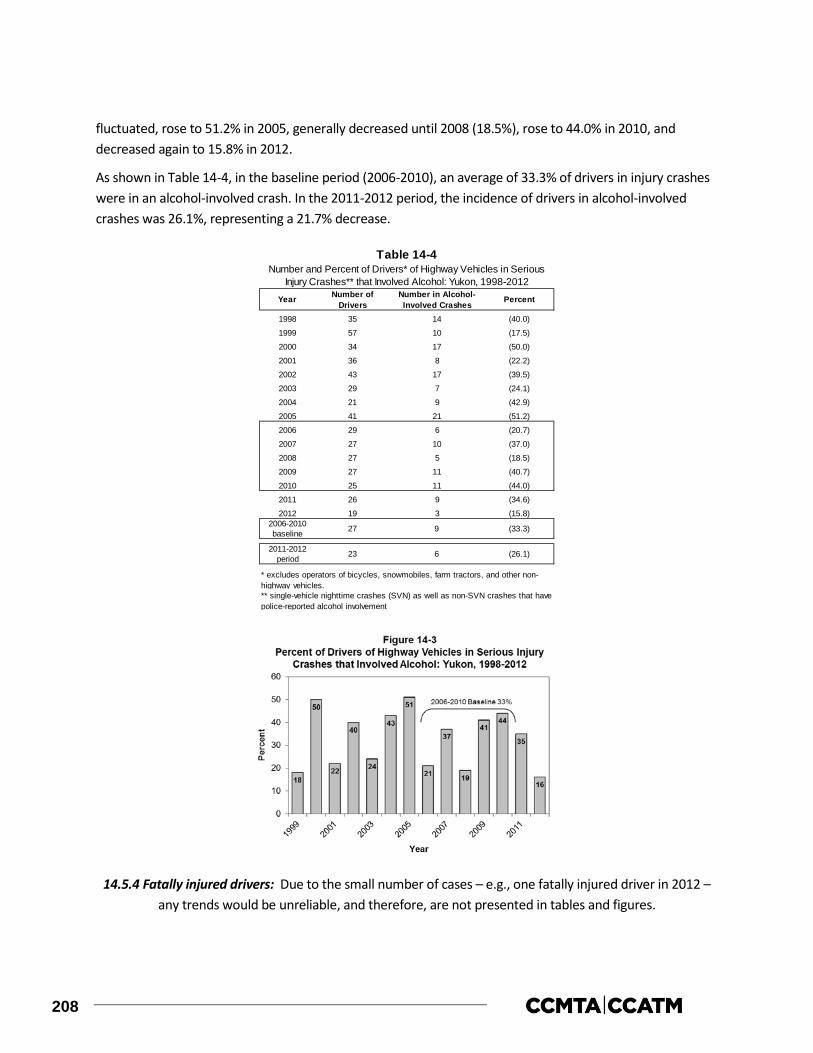
208
fluctuated, rose to 51.2% in 2005, generally decreased until 2008 (18.5%), rose to 44.0% in 2010, and decreased again to 15.8% in 2012.
As shown in Table 14-4, in the baseline period (2006-2010), an average of 33.3% of drivers in injury crashes were in an alcohol-involved crash. In the 2011-2012 period, the incidence of drivers in alcohol-involved crashes was 26.1%, representing a 21.7% decrease.
14.5.4 Fatally injured drivers: Due to the small number of cases – e.g., one fatally injured driver in 2012 – any trends would be unreliable, and therefore, are not presented in tables and figures.
Number ofDrivers
1998 35 14 (40.0)
1999 57 10 (17.5)
2000 34 17 (50.0)
2001 36 8 (22.2)
2002 43 17 (39.5)
2003 29 7 (24.1)
2004 21 9 (42.9)
2005 41 21 (51.2)
2006 29 6 (20.7)
2007 27 10 (37.0)
2008 27 5 (18.5)
2009 27 11 (40.7)
2010 25 11 (44.0)
2011 26 9 (34.6)
2012 19 3 (15.8)2006-2010baseline
2011-2012period
** single-vehicle nighttime crashes (SVN) as well as non-SVN crashes that have police-reported alcohol involvement
* excludes operators of bicycles, snowmobiles, farm tractors, and other non-highway vehicles.
27 9 (33.3)
23 6 (26.1)
Table 14-4Number and Percent of Drivers* of Highway Vehicles in Serious
Injury Crashes** that Involved Alcohol: Yukon, 1998-2012
Year PercentNumber in Alcohol-Involved Crashes

209
15.0 NORTHWEST TERRITORIES
This section of the report reviews the major findings on alcohol involvement in fatal and serious injury motor vehicle collisions as well as drug involvement in fatal motor vehicle collisions in the Northwest Territories during 2012. It describes data on:
> people who were killed in alcohol-related crashes (Section 15.1);
> alcohol use among fatally injured drivers (Section 15.2);
> drivers involved in alcohol-related serious injury crashes (Section 15.3);
> drug use among fatally injured drivers (Section 15.4); and,
> trends in the alcohol-crash and drug-crash problems (Section 15.5).
Detailed results are not provided in Sections 15.1, 15.2 and 15.4 because the small number of deaths – only two – and drivers fatally injured – none – makes the results unreliable.
15.1 Deaths in alcohol-related crashes
A motor vehicle fatality was considered to be alcohol involved if there was at least one drinking driver or drinking pedestrian in the fatal crash.
During 2012, two persons died in motor vehicle crashes in the Northwest Territories. And, in all (100.0%) of these cases, it was possible to determine if alcohol was a factor in the crash.
15.2 Alcohol use among fatally injured drivers
The Northwest Territories had no fatally injured drivers in 2012.
15.3 Drivers involved in alcohol-related serious injury crashes
This section presents information on drivers involved in alcohol-related crashes in which someone was seriously injured in 2012 in the Northwest Territories. A “surrogate” or “indirect” measure is used to estimate alcohol involvement because drivers in serious injury crashes are seldom tested for alcohol. A driver is identified as having been involved in an alcohol-related serious injury crash if the crash in which someone was seriously injured involved a single vehicle at night (SVN), or if, in the case of a non-SVN serious injury crash, the police reported alcohol involvement – i.e., at least one drinking driver in the crash (see Section 2.2.4).
The results are shown in Table 15-1 for drivers grouped in terms of age, gender, type of vehicle driven, and type of collision. The first column shows the number of drivers involved in serious injury crashes. The number and percent of drivers in such crashes that involved alcohol is shown in the next two columns. The final column expresses the number of drivers involved in alcohol-related serious injury crashes in any row as a percent of all drivers involved in alcohol-related serious injury crashes.
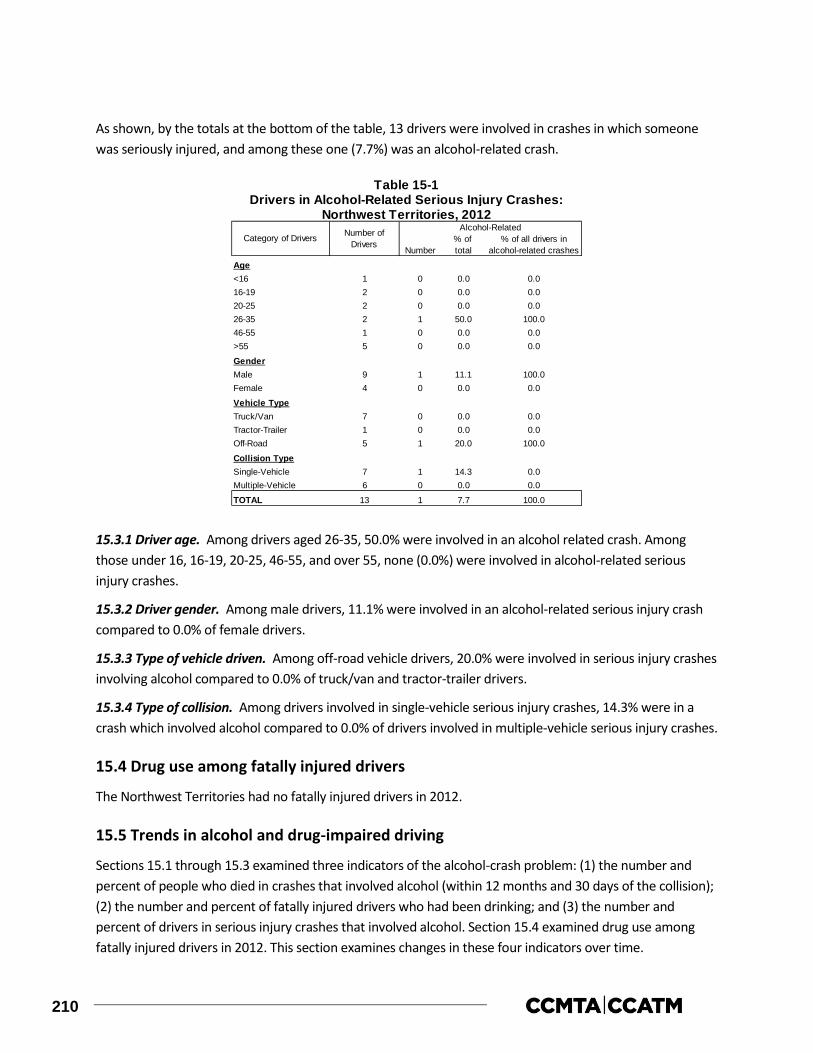
210
As shown, by the totals at the bottom of the table, 13 drivers were involved in crashes in which someone was seriously injured, and among these one (7.7%) was an alcohol-related crash.
15.3.1 Driver age. Among drivers aged 26-35, 50.0% were involved in an alcohol related crash. Among those under 16, 16-19, 20-25, 46-55, and over 55, none (0.0%) were involved in alcohol-related serious injury crashes.
15.3.2 Driver gender. Among male drivers, 11.1% were involved in an alcohol-related serious injury crash compared to 0.0% of female drivers.
15.3.3 Type of vehicle driven. Among off-road vehicle drivers, 20.0% were involved in serious injury crashes involving alcohol compared to 0.0% of truck/van and tractor-trailer drivers.
15.3.4 Type of collision. Among drivers involved in single-vehicle serious injury crashes, 14.3% were in a crash which involved alcohol compared to 0.0% of drivers involved in multiple-vehicle serious injury crashes.
15.4 Drug use among fatally injured drivers
The Northwest Territories had no fatally injured drivers in 2012.
15.5 Trends in alcohol and drug-impaired driving
Sections 15.1 through 15.3 examined three indicators of the alcohol-crash problem: (1) the number and percent of people who died in crashes that involved alcohol (within 12 months and 30 days of the collision); (2) the number and percent of fatally injured drivers who had been drinking; and (3) the number and percent of drivers in serious injury crashes that involved alcohol. Section 15.4 examined drug use among fatally injured drivers in 2012. This section examines changes in these four indicators over time.
% of % of all drivers inNumber total alcohol-related crashes
Age<16 1 0 0.0 0.016-19 2 0 0.0 0.020-25 2 0 0.0 0.026-35 2 1 50.0 100.046-55 1 0 0.0 0.0>55 5 0 0.0 0.0
GenderMale 9 1 11.1 100.0Female 4 0 0.0 0.0
Vehicle TypeTruck/Van 7 0 0.0 0.0Tractor-Trailer 1 0 0.0 0.0Off-Road 5 1 20.0 100.0
Collision TypeSingle-Vehicle 7 1 14.3 0.0Multiple-Vehicle 6 0 0.0 0.0
TOTAL 13 1 7.7 100.0
Table 15-1Drivers in Alcohol-Related Serious Injury Crashes:
Northwest Territories, 2012Category of Drivers Number of
Drivers
Alcohol-Related

211
15.5.1 Deaths in alcohol-related crashes: 1995-2012. Due to the small number of crashes on public roadways involving principal vehicle types (e.g., two in 2012) any trends would be unreliable, and therefore are not reported.
15.5.2 Alcohol use among fatally injured drivers: Due to the small number of cases – e.g., no fatally injured drivers in 2012 – any trends would be unreliable, and therefore are not reported.
15.5.3 Drivers in serious injury crashes: Table 15-2 and Figure 15-1 show information on drivers involved in alcohol-related serious injury crashes. During the baseline period (2006-2010), an average of 43.8% of drivers in serious injury crashes were in an alcohol-involved crash. This compares to 11.1% in the 2011-2012 period, representing a 74.7% decrease.
Year Number of Drivers
Number in Alcohol-Involved Crashes Percent
1995 24 16 (66.7)1996 21 8 (38.1)1997 15 4 (26.7)1998 22 11 (50.0)1999 24 7 (29.2)2000 11 6 (54.5)2001 25 8 (32.0)2002 22 6 (27.3)2003 17 6 (35.3)2004 16 5 (31.3)2005 31 10 (32.3)2006 21 9 (42.9)2007 17 9 (52.9)2008 15 7 (46.7)2009 12 3 (25.0)2010 16 6 (37.5)2011 5 0 (0.0)2012 13 1 (7.7)
2006-2010baseline
2011-2012period
* single-vehicle nighttime crashes (SVN) as well as non-SVN crashes that have police-reported alcohol involvement
9 1 (11.1)
Table 15-2Number and Percent of All Drivers in Serious Injury Crashes* that
Involved Alcohol: Northwest Territories, 1995-2012
16 7 (43.8)

212
Table 15-3 and Figure 15-2 also show information on drivers involved in alcohol-related serious injury crashes. These results differ slightly from those in Section 15.3 and in Table 15-2 and Figure 15-1 because they exclude certain vehicle types – e.g., bicycles, snowmobiles, farm tractors and other non-highway vehicles.
As can be seen, the incidence of alcohol-involvement in serious injury crashes has fluctuated over this 18-year period. Between 1995 and 1999 the percentage of all drivers in serious injury crashes that involved alcohol generally decreased. Since then, the incidence peaked at 66.7% in 2000, generally decreased to 21.4% in 2004, rose to 41.2% in 2006, remained stable until 2008 (41.7%), decreased to 20.0% in 2009, rose in 2010 (25.0%), and decreased to 0.0% in 2011 and 2012.
As shown in Table 15-3, in the baseline period (2006-2010), an average of 33.3% of drivers in serious injury crashes were in an alcohol-involved crash. In the 2011-2012 period, the incidence of drivers in alcohol-involved crashes declined to 0.0%.
Year Number of Drivers
Number in Alcohol-Involved Crashes Percent
1995 20 13 (65.0)1996 14 5 (35.7)1997 12 3 (25.0)1998 14 8 (57.1)1999 19 7 (36.8)2000 6 4 (66.7)2001 20 7 (35.0)2002 19 5 (26.3)2003 16 6 (37.5)2004 14 3 (21.4)2005 21 5 (23.8)2006 17 7 (41.2)2007 10 4 (40.0)2008 12 5 (41.7)2009 10 2 (20.0)2010 12 3 (25.0)2011 3 0 (0.0)2012 8 0 (0.0)
2006-2010baseline
2011-2012period
* single-vehicle nighttime crashes (SVN) as well as non-SVN crashes that have police-reported alcohol involvement
6 0 (0.0)
Table 15-3Number and Percent of Drivers of Highway Vehicles in Serious Injury
Crashes* that Involved Alcohol: Northwest Territories, 1995-2012
12 4 (33.3)
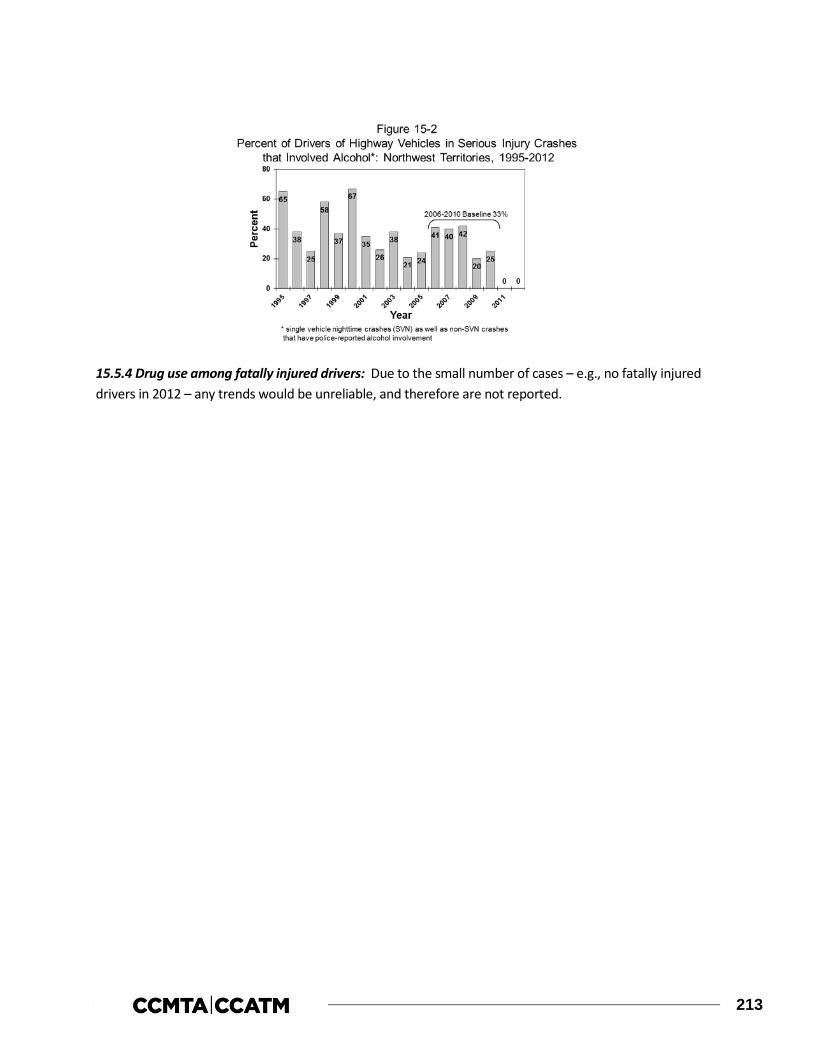
213
15.5.4 Drug use among fatally injured drivers: Due to the small number of cases – e.g., no fatally injured drivers in 2012 – any trends would be unreliable, and therefore are not reported.

215
16.0 NUNAVUT
This section of the report reviews the major findings on alcohol involvement in fatal and serious injury motor vehicle collisions as well as drug involvement in fatal motor vehicle collisions in Nunavut during 2012. It describes data on:
> people who were killed in alcohol-related crashes (Section 16.1);
> alcohol use among fatally injured drivers (Section 16.2);
> drivers involved in alcohol-related serious injury crashes (Section 16.3);
> drug use among fatally injured drivers (Section 16.4); and,
> trends in the alcohol-crash and drug-crash problems (Section 16.5).
Detailed results are not provided in Sections 16.1, 16.2 and 16.4 because the small number of deaths – only two – and drivers fatally injured – none – makes the results unreliable.
16.1 Deaths in alcohol-related crashes
A motor vehicle fatality was considered to be alcohol involved if there was at least one drinking driver or drinking pedestrian in the fatal crash.
During 2012, three persons died in motor vehicle crashes in Nunavut. And, in two of these cases (66.7%), it was possible to determine if alcohol was a factor in the crash.
16.2 Alcohol in fatally injured drivers
Nunavut had no fatally injured drivers of highway vehicles in 2012.
16.3 Drivers involved in alcohol-related serious injury crashes
This section presents information on drivers involved in alcohol-related crashes in which someone was seriously injured in 2010 in Nunavut. At the time this report was being prepared, 2011 and 2012 collision data from Nunavut were not available. For this reason, 2010 data will be reported in this section. A “surrogate” or “indirect” measure is used to estimate alcohol involvement because drivers in serious injury crashes are seldom tested for alcohol. A driver is identified as having been involved in an alcohol-related serious injury crash if the crash in which someone was seriously injured involved a single vehicle at night (SVN), or if, in the case of a non-SVN serious injury crash, the police reported alcohol involvement – i.e., at least one drinking driver in the crash (see Section 2.2.4).
The results are shown in Table 16-1 for drivers grouped in terms of age, gender, type of vehicle driven, and type of collision. The first column shows the number of drivers involved in serious injury crashes. The number and percent of drivers in such crashes that involved alcohol is shown in the next two columns. The

216
final column expresses the number of drivers involved in alcohol-related serious injury crashes in any row as a percent of all drivers involved in alcohol- related serious injury crashes.
As shown by the totals at the bottom of the table, five drivers were involved in crashes in which someone was seriously injured, and among these 40.0% were alcohol-related crashes. Due to the small number of cases, further analysis of drivers involved in serious injury crashes should be treated with caution.
16.3.1 Driver age. Of all the drivers involved in alcohol-related serious injury crashes, 100.0% were aged 20-25.
Two-thirds (66.7%) of the drivers aged 20-25 were involved in alcohol-related serious injury crashes. The lowest incidence of involvement in alcohol-related crashes was found for those aged 26-35 (0.0%).
16.3.2 Driver gender. Of all the drivers involved in alcohol-related serious injury crashes, 100.0% were males. And, the incidence of involvement in alcohol-related serious injury crashes was greater for males than for females (50.0% and 0.0%, respectively).
16.3.3 Type of vehicle driven. Of all the drivers involved in alcohol-related serious injury crashes, 100.0% were off-road vehicle drivers.
The highest incidence of involvement in alcohol-related serious injury crashes was found for off-road vehicle drivers – 50.0% of these drivers were in crashes that involved alcohol, compared to 0.0% for truck/van drivers.
16.3.4 Type of collision. Of all the drivers involved in alcohol-related serious injury crashes, 100.0% of them were in single-vehicle crashes. The highest incidence of involvement in alcohol-related serious injury crashes was also found among drivers in single-vehicle crashes – 66.7% of these drivers, compared to 0.0% for drivers involved in multiple-vehicle crashes.
% of % of all drivers inNumber total alcohol-related crashes
Age20-25 3 2 66.7 100.026-35 2 0 0.0 0.0
GenderMale 4 2 50.0 100.0Female 1 0 0.0 0.0
Vehicle TypeTruck/Van 1 0 0.0 0.0Off-Road 4 2 50.0 100.0
Collision TypeSingle-Vehicle 3 2 66.7 100.0Multiple-Vehicle 2 0 0.0 0.0
TOTAL 5 2 40.0 100.0
* These numbers are slightly underestimated since 24.4% of injuries are recorded as unspecified.
Table 16-1Drivers in Alcohol-Related Serious Injury Crashes:
Nunavut, 2010Category of Drivers Number of
Drivers
Alcohol-Related

217
16.4 Drug use among fatally injured drivers
Nunavut had no fatally injured drivers of highway vehicles in 2012.
16.5 Trends in alcohol and drug-impaired driving
Sections 16.1 through 16.3 examined three indicators of the alcohol-crash problem: (1) the number and percent of people who died in crashes that involved alcohol (within 12 months and 30 days of the collision); (2) the number and percent of fatally injured drivers who had been drinking; and (3) the number and percent of drivers in serious injury crashes that involved alcohol. Section 16.4 examined drug use among fatally injured drivers in 2012. This section examines changes in these four indicators over time.
16.5.1 Deaths in alcohol-related crashes: 1995-2011. Due to the small number of crashes on public roadways involving principal vehicle types (e.g., one death in 2012) any trends would be unreliable, and therefore are not reported.
16.5.2 Alcohol use among fatally injured drivers: Due to the small number of cases – e.g., no fatally injured drivers in 2012 – any trends would be unreliable, and therefore are not reported.
16.5.3 Drivers in serious injury crashes: Table 16-2 and Figure 16-1 show information on drivers involved in alcohol-related serious injury crashes. During the baseline period (2006-2010), an average of 30.0% of drivers in serious injury crashes were in an alcohol-involved crash. In 2010, 40.0% of drivers in serious injury collisions were in an alcohol-related crash.
Year Number of Drivers
Number in Alcohol-Involved Crashes Percent
1995 16 10 (62.5)1996 10 4 (40.0)1997 6 1 (16.7)1998 18 8 (44.4)1999 15 6 (40.0)2000 22 8 (36.4)2001 17 7 (41.2)2002 14 3 (21.4)2003 15 5 (33.3)2004 15 5 (33.3)2005 14 3 (21.4)2006 18 4 (22.2)2007 15 6 (40.0)2008 6 0 (0.0)2009 7 1 (14.3)2010 5 2 (40.0)
2006-2010baseline
* single-vehicle nighttime crashes (SVN) as well as non-SVN crashes that have police-reported alcohol involvement
Table 16-2Number and Percent of All Drivers in Serious Injury Crashes*
that Involved Alcohol: Nunavut, 1995-2010
10 3 (30.0)
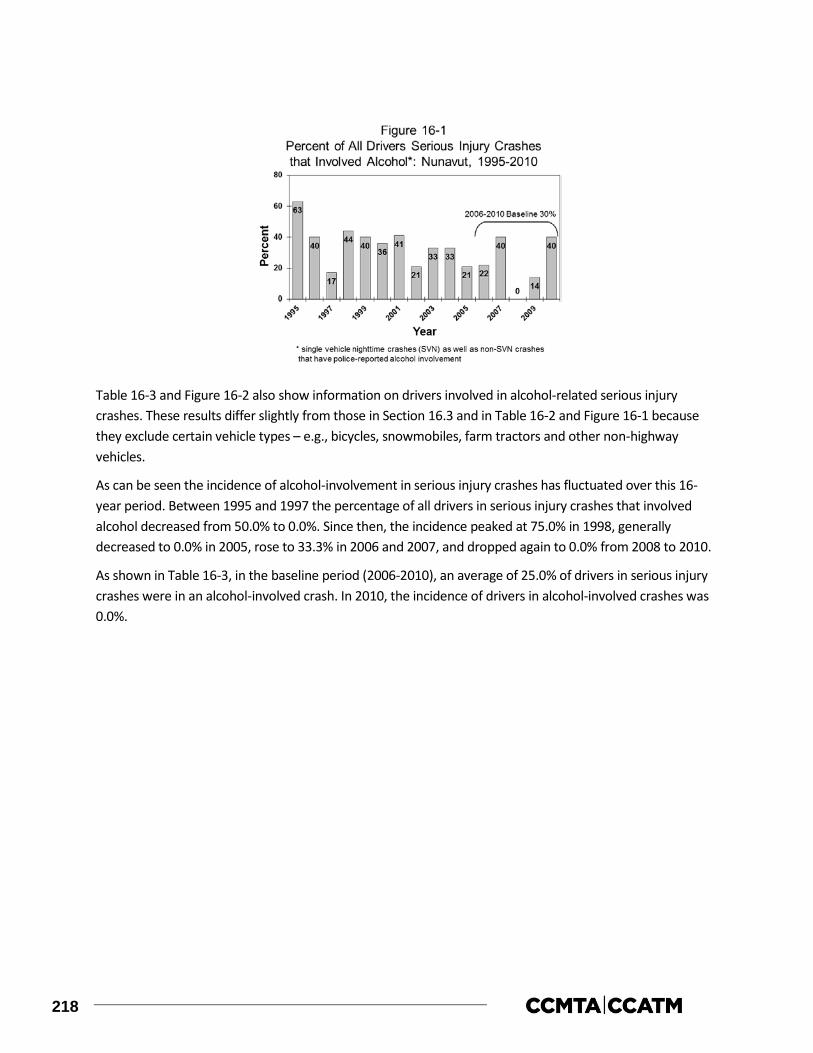
218
Table 16-3 and Figure 16-2 also show information on drivers involved in alcohol-related serious injury crashes. These results differ slightly from those in Section 16.3 and in Table 16-2 and Figure 16-1 because they exclude certain vehicle types – e.g., bicycles, snowmobiles, farm tractors and other non-highway vehicles.
As can be seen the incidence of alcohol-involvement in serious injury crashes has fluctuated over this 16-year period. Between 1995 and 1997 the percentage of all drivers in serious injury crashes that involved alcohol decreased from 50.0% to 0.0%. Since then, the incidence peaked at 75.0% in 1998, generally decreased to 0.0% in 2005, rose to 33.3% in 2006 and 2007, and dropped again to 0.0% from 2008 to 2010.
As shown in Table 16-3, in the baseline period (2006-2010), an average of 25.0% of drivers in serious injury crashes were in an alcohol-involved crash. In 2010, the incidence of drivers in alcohol-involved crashes was 0.0%.

219
16.5.4 Drug use among fatally injured drivers: Due to the small number of cases – e.g., no fatally injured drivers in 2012 – any trends would be unreliable, and therefore are not reported.
Number ofDrivers
1995 6 3 (50.0)
1996 2 1 (50.0)
1997 2 0 (0.0)
1998 4 3 (75.0)
1999 2 1 (50.0)
2000 5 2 (40.0)
2001 7 3 (42.9)
2002 5 1 (20.0)
2003 4 1 (25.0)
2004 4 1 (25.0)
2005 6 0 (0.0)
2006 9 3 (33.3)
2007 3 1 (33.3)
2008 2 0 (0.0)
2009 4 0 (0.0)
2010 1 0 (0.0)
2006-2010baseline
Table 16-3Number and Percent of Drivers* of Highway Vehicles in Serious
Injury Crashes** that Involved Alcohol: Nunavut, 1995-2010
Year PercentNumber in Alcohol-Involved Crashes
** single-vehicle nighttime crashes (SVN) as well as non-SVN crashes that have police-reported alcohol involvement
* excludes operators of bicycles, snowmobiles, farm tractors, and other non-highway vehicles.
4 1 (25.0)

221
17.0 REFERENCES
Blomberg, R.D.; Peck, R.C.; Moskowitz, H.; Burns, M; and Fiorentino, D. 2009. The Long Beach/Fort Lauderdale relative risk study, Journal of Safety Research 40(4): 285-292.
Brown, S.W.; Vanlaar, W.G.M.; and Mayhew, D.R. 2013. The Alcohol-Crash Problem in Canada: 2010. Ottawa, Ontario: Canadian Council of Motor Transport Administrators; and Transport Canada, Road Safety and Motor Vehicle Regulation. Brown, S.W.; Vanlaar, W.G.M.; and Robertson, R.D. 2014. The Alcohol and Drug-Crash Problems in Canada: 2011. Ottawa, Ontario: Canadian Council of Motor Transport Administrators. Jonah, B. 2012. Drugs and Driving Framework. Ottawa, Ontario: Canadian Council of Motor Transport Administrators. Mayhew, D.R.; Beirness, D.J.; and Simpson, H.M. 1997. Indicators of the Alcohol-Crash Problem. Ottawa, Ontario: Transport Canada, Road Safety and Motor Vehicle Regulation. Mayhew, D.R.; Brown, S.W.; and Simpson, H.M. 1999. Alcohol Use Among Drivers and Pedestrians Fatally Injured in Motor Vehicle Accidents. Ottawa, Ontario: Transport Canada, Road Safety and Motor Vehicle Regulation. Mayhew, D.R.; Brown, S.W.; and Simpson, H.M. 2000. The Alcohol-Crash Problem in Canada: 1998. Ottawa, Ontario: Transport Canada, Road Safety and Motor Vehicle Regulation. Mayhew, D.R.; Brown, S.W.; and Simpson, H.M. 2001. The Alcohol-Crash Problem in Canada: 1999. Ottawa, Ontario: Transport Canada, Road Safety and Motor Vehicle Regulation. Mayhew, D.R.; Brown, S.W.; and Simpson, H.M. 2002. The Alcohol-Crash Problem in Canada: 2000. Ottawa, Ontario: Transport Canada, Road Safety and Motor Vehicle Regulation. Mayhew, D.R.; Brown, S.W.; and Simpson, H.M. 2003. The Alcohol-Crash Problem in Canada: 2001. Ottawa, Ontario: Transport Canada, Road Safety and Motor Vehicle Regulation. Mayhew, D.R.; Brown, S.W.; and Simpson, H.M. 2004. The Alcohol-Crash Problem in Canada: 2002. Ottawa, Ontario: Transport Canada, Road Safety and Motor Vehicle Regulation. Mayhew, D.R.; Brown, S.W.; and Simpson, H.M. 2005. The Alcohol-Crash Problem in Canada: 2003. Ottawa, Ontario: Transport Canada, Road Safety and Motor Vehicle Regulation. Mayhew, D.R.; Brown, S.W.; and Simpson, H.M. 2006. The Alcohol-Crash Problem in Canada: 2004. Ottawa, Ontario: Transport Canada, Road Safety and Motor Vehicle Regulation. Mayhew, D.R.; Brown, S.W.; and Simpson, H.M. 2007. The Alcohol-Crash Problem in Canada: 2005. Ottawa, Ontario: Transport Canada, Road Safety and Motor Vehicle Regulation.

222
Mayhew, D.R.; Brown, S.W.; and Simpson, H.M. 2009. The Alcohol-Crash Problem in Canada: 2006. Ottawa, Ontario: Transport Canada, Road Safety and Motor Vehicle Regulation. Mayhew, D.R.; Brown, S.W.; and Simpson, H.M. 2010. The Alcohol-Crash Problem in Canada: 2007. Ottawa, Ontario: Transport Canada, Road Safety and Motor Vehicle Regulation. Mayhew, D.R.; Brown, S.W.; and Simpson, H.M. 2010. The Alcohol-Crash Problem in Canada: 2008. Ottawa, Ontario: Transport Canada, Road Safety and Motor Vehicle Regulation. Mayhew, D.R.; Brown, S.W.; and Simpson, H.M. 2011. The Alcohol-Crash Problem in Canada: 2009. Ottawa, Ontario: Transport Canada, Road Safety and Motor Vehicle Regulation. Moskowitz, H.; Burns, M.; Fiorentino, D.; Smiley, A.; and Zador, P. 2000. Driver characteristics and impairment at various BACs. Southern California Research Institute. 223. Available from the World Wide Web at: http://ntl.bts.gov/lib/9000/9500/9512/impairment.pdf
Traffic Injury Research Foundation of Canada. 1975. Analysis of Fatal Traffic Crashes in Canada, 1973. Focus: The Impaired Driver. Ottawa, Ontario: Traffic Injury Research Foundation. Zador, P.; Krawchuk, S.; and Voas, R. 2000. Alcohol-related relative risk of driver fatalities and driver involvement in fatal crashes in relation to driver age and gender: an update using 1996 data. Journal of Studies on Alcohol 61: 387-395.