alcohol and disorientation-related responses. ii ... · and ohga1a, ey11, and di guinta and rosa10...
TRANSCRIPT

I -TECHNICAL REPORT STANDARD TITLE PAGE
1. Report No. 2. Government Accession No. 3. Recipient's Catalog No.
FAA-AM-71-16 4. Title and Subtitle 5. Report Date
ALCOHOL AND DISORIENTATION-RELATED RESPONSES. II. April 1971 NYSTAGMUS AND "VERTIGO" DURING ANGULAR ACCELERATION 6. Performing Organi zotion Code
7. Authorl s) 8. Performing Orgoni zation Report No.
David J. Schroeder, Ph.D.
9. Performing Organization Nome and Address 10. Work Unit No.
FAA Civil Aeromedical Institute P. o. Box 25082 11. Contract or Grant No.
Oklahoma City, Oklahoma 73125 13. Type of Report and Period Covered
12. Sponsoring Agency Name and Address OAM Report Office of Aviation Medicine Federal Aviation Administration 800 Independence Ave., s. w. 14. Sponsoring Agency Code
Washine:ton D c 20590 15. Supplementary Notes
This study was conducted under tasks AM-B-69-PSY-10, AM-A-70-PSY-10, and AM-A-71-PSY-27.
16. Abstract
The integrity of the visual and vestibular systems is important in the mainte-nance of orientation during flight. Although alcohol is known to affect the vestibular system through the development of a positional alcohol nystagmus, information concerning the effects of alcohol on "vertigo" and eye-movement (nystagmus) responses to angular acceleration is contradictory. Several investigators have reported that alcohol enhances these responses, while others have reported suppressive effects. This study was designed to investigate the effect of alcohol ingestion on both "vertigo" and nystagmic responses to angular stimulation. Responses were obtained (a) with and without visual fixation, and (b) with the alertness of the subjects controlled.
When recorded in total darkness, the nystagmic response to rotatory stimulation was suppressed by the alcohol. When visual fixation was allowed, a high-frequency low-amplitude nystagmus to rotation was obtained following alcohol ingestion; there was little or no response prior to drinking. This apparent enhancement of the response was not due to an increase in vestibular sensitivity but, rather, to the suppressive effect of alcohol on the ability of the subject to maintain adequate visual fixation. "Vertigo" sensations resulting from the rotatory stimuli evidenced only slight declines following alcohol ingestion.
17. Key Words 18. Distribution Statement
Alcohol, Nystagmus, Vestibular, Visual Availability is unlimited. Document may Fixation be released to the National Technical
Information Service, Springfield, Virginia 22151~ for sale to the public.
19. Security Classif. (of this report) 20. Security Classil. (of this page) 21. N~. of Pages 22. Price
Unclassified Unclassified 27 $3.00
Form DOT F 1700.7 IB·69l
I
ALCOHOL AND DISORIENTATION-RELATED RESPONSES.
II. NYSTAGMUS AND ~~vERTIGO" DURING ANGULAR ACCELERATION
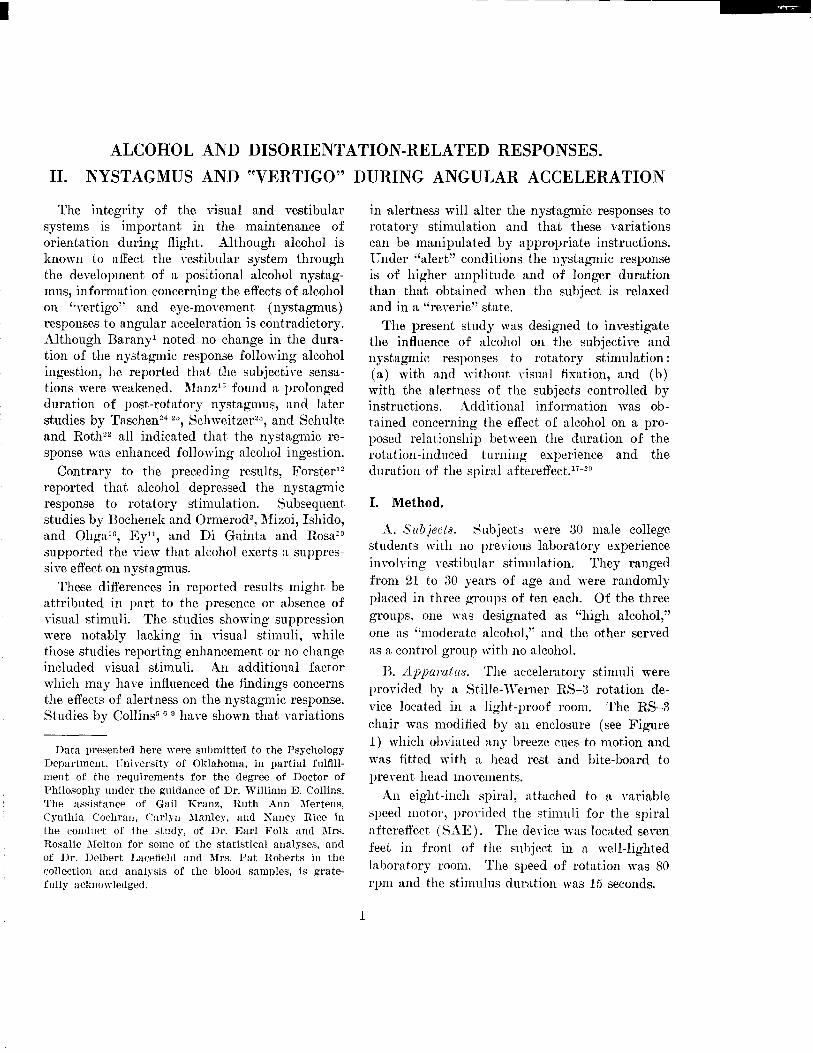
The integrity of the visual and vestibular systems is important in the maintenance of orientation during flight. Although alcohol is known to affect the vestibular system through the development of a positional alcohol nystagmus, information concerning the effects of alcohol on "vertigo" and eye-movement (nystagmus) responses to angular acceleration is contradictory. Although Barany1 noted no change in the duration of the nystagmic response following alcohol ingestion, he reported that the subjective sensations 'vere weakened. ~fanz15 found a prolonged duration of post-rotatory nystagmus, and later studies by Taschen24 25
, Schweitzer23, and Schulte
and Roth22 all indicated that the nystagmic response \Vas enhanced follmving alcohol ingestion.
Contrary to the preceding results, Forster12
reported that alcohol depressed the nystagmic response to rotatory stimulation. Subsequent studies by Bochenek and Ormerod\ 1\Iizoi, Ishido, and Ohga1a, Ey11 , and Di Guinta and Rosa10
supported the view that alcohol exerts a suppressive effect on nystagmus.
These differences in reported results might be attributed in part to the presence or absence of visual stimuli. The studies showing suppression were notably lacking in visual stimuli, while those studies reporting enhancement or no change included ,-isual stimuli. An additional factor which may have influenced the findings concerns the effects of alertness on the nystagmic response. Studies by Collins" 6 9 have shown that variations
Data presented here were submitted to the Psychology Department, L'niversity of Oklahoma, in partial fulfillment of the requirements for the degree of Doctor of Philosophy under the guidance of Dr. William E. Collins. The assistance of Gail Kranz, Ruth Ann l\fertens, Cynthia Coehrau, C'arlyu :Hanley, and Xancy Rice in the condnct of the stndy, of Dr. Earl Folk and :Mrs. Rosalie l\Ielton for some of the statistical analyses, and of Dr. Delbert Lacefield and l\Irs. Pat Roberts in the collection and analysis of the blood samples, is gratefully acknowledged.
1
in alertness will alter the nystagmic responses to rotatory stimulation and that these variations can be manipulated by appropriate instructions. Under "alert" conditions the nystagmic response is of higher amplitude and of longer duration than that obtained when the subject is relaxed and in a "reverie" state.
The present study was designed to investigate the influence of alcohol on the subjective and nystagmic responses to rotatory stimulation: (a) with and without. visual fixation, and (b) with the alertness of the subjects controlled by instructions. Additional information was obtained concerning the effect of alcohol on a proposed relationship between the duration of the rotation-induced turning experience and the duration of the spiral aftereffect .. 17
-20
I. Method.
A. Subjects. ~ubjects ''"ere 30 male college students with no previous laboratory experience involving vestibular stimulation. They ranged from 21 to 30 years of age and were randomly placed in three groups of ten each. Of the three groups, one was designated as "high alcohol," one as "moderate alcohol," and the other served as a control group with no alcohol.
B. Apparatu8. The acceleratory stimuli were provided by a Stille-'Verner RS-3 rotation device located in a light-proof room. The RS-3 chair 'vas modified by an enclosure (see Figure 1) which obviated any breeze cues to motion and was fitted with a head rest and bite-board to prevent head mm-ements.
An eight-inch spiral, attached to a variable speed motor, pro\-ided the stimuli for the spiral aftereffect ( SAE). The device 'vas located seven feet in front of the subject in a well-lighted laboratory room. The speed of rotation was 80 rpm and the stimulus duration was 15 seconds.
-

I
FIGURE 1. Modified Stille-Werner RS-3 chair used to administer the rotatory stimuli. The head rest and bite board were used to restrict the subjects' head movements and to keep the horizontal canals in the plane of rotation. The cross-shaped device at the front of the rotator contain" the calibration lights. With the doors closed and the canopy down, all breeze cues are eliminated. A hole in the canopy permits voice communication with the control room via the microphone suspended above the subject's head.
2

I -----------------------------------........ C. Recording. Silver disc electrodes were
taped by the outer canthi of the eyes to record horizontal components of eye movements. An electrode on the forehead served as a ground. Eye movements \vere amplified and recorded on an Offner Type T electroencephalograph using a 3-second time constant. The subjects' signals concerning their sensations of rotation were made by depression of a microswitch, and these signals were ·also recorded.
Eye movement calibrations 'vere obtained by asking each subject to sweep his eyes between two small, dim, flashing lights (subtending a visual angle of 15°) attached to the front of the rotatory device. A switch, located inside the cabin, allowed the subject to turn the lights off and on in an otherwise totally dark room, thereby permitting calibrations both prior to the accelerations and during constant velocity prior to the deceleration.
II. Procedure.
The 30 subjects received identical trials during what are here termed Pre, Post I, and Post II sessions. These respective sessions were held the day before drinking, and 45 minutes and four hours after drinking.
The subjects received three practice trials of counter-clockwise ( CC,V) rotations in total darkness. These practice trials 'vere used to train the subjects in the technique of estimating rotational velocity from turning sensations.2 9 13
A. Pre Trials. Following practice, the subjects received three experimental trials of clockwise (C,V) rotations separated by 5-minute rest periods. The accelerations on these three Pre trials were 5° /sec" for 12 seconds followed by rotation at constant velocity ( 60° /sec) for three minutes. Deceleration began after an eye-movement calibration was obtained. On trials 1 and 2, a brake deceleration of 120° I sec2 for 0.5 sec was used; on trial 3 continuous deceleration at the rate of 5° /sec2 lvas employed.
During the three Pre trials, the subjects performed different tasks. On one of the first two trials, the subject was instructed to work on a mental arithmetic (l\fA) task in the form of a continuous division problem." 9 Different proplems were given for the acceleration and deceleration periods and the subject's answers were recorded (approximately 1% minutes after the end
3
of the acceleration and the deceleration) to insure that the problems were viewed as an important part of the trial. Following his response, the subject was allowed to relax until alerted by the experimenter. On the other of the first two trials, the subject was instructed to signal his turning experiences as he had during the training period. Thus, the subject signaled with a key press (KP) the start, quarter turns, and end of his turning sensation for the acceleration stimulus, and the start and end of his turning sensation for the brake deceleration. After completion of his signals the subject was told to remain alert and attentive and to call out and signal any subsequent turning experience (secondary sensation). The order in which these tasks were presented was counterbalanced among subjects.
All subjects 'vere given an identical task for the acceleration of trial 3. They were instructed to assume a "Reverie" state, i.e., to relax, daydream, and not to pursue particular lines of thought. The subject was allowed to relax and daydream for 30 seconds prior to the acceleration, during the acceleration, and throughout the period of constant velocity until a few seconds before the eye-mo,·ement calibration was required; he was then told to make the calibration eye movements and to prepare himself for deceleration. The room lights \vere turned on during the first eight seconds of the deceleration for five subjects in each of the three groups, and for three seconds immediately after the chair was stopped for the remaining five subjects in each group. After the lights went out, the subject was asked to signal any further turning sensations and to call out the direction in which he experienced motion. For those trials during which the lights were briefly turned on after the end of the deceleration, the subject signaled his turning sensation during deceleration (before the lights were turned on) and again after the brief period of light. Subjects were instructed to watch the walls of the room when the lights were on during the deceleration, and to fixate on markers attached to the walls of the room while at a standstill in illumination. The use of the room lights was designed to provide data regarding the interaction of visual and vestibular stimulation.
B. Post Trials. Post I and Post II rotation trials were identical to the Pre trials but were

I conducted on the following day after consumption of ·alcohol (or of the non-alcoholic control beverage).
C. V i8ual Fixation Trials. Seven additional subjects received angular stimulation while attempting to fixate visually. The rotatory stimuli for these subjects was again a 5° /sec2 acceleration for 12 seconds, three minutes at constant velocity, and a brake deceleration. The only difference involved the use of visual fixation throughout the trials. During the acceleration with the room lights off, the subject fixated on a dimly illuminated target which rotated with him. The subject fixated on the same target following the brake deceleration; however, in this instance the room lights were turned on. These trials were administered a few minutes before and 45 minutes after drinking.
D. Alcohol Ingestion and Blood Tests. Subjects in the moderate and high alcohol groups drank a mixture of 100-proof Smirnoff vodka and orange juice. The mixture contained either 2.5 ml or 1.25 ml of vodka per kilogram of body weight for the high and moderate alcohol groups respectively. The control group drank orange juice with a few drops of rum extract added to alter the taste somewhat. Subjects who received rotatory stimulation while fixating on visual targets consumed a mixture which contained 2.00 ml of vodka per kilogram of body weight. All subjects consumed their drinks in a 15-minute period.
Venous blood samples of from three to five ml were drawn a few minutes prior to drinking, then one-hal£ hour, one hour, and four hours after consumption of the alcohol. The blood alcohol levels ·were determined by means of gas chromatography.
E. Scoring. The nystagmus was scored with respect to (a) duration or the time from the start of the stimulus to the last nystagmic beat, (b) frequency or the number of nystagmus beats, (c) slow phase displacement or the total number of degrees of eye movement in a three-second period, and (d) slow phase velocity (degrees/ sec) at peak slow phase displacement. Slow phase eye displacement was determined by measuring (in millimeters) the amplitude of each nystagmic beat from slow phase peak to baseline. These measures were summed for all the beats in each three-second interval and the sum
4
converted, using the calibrations, into degrees of slow phase eye movement.. From Bodin's4 formula, the velocity of the slow phase eye movement was calculated from the average angle of the slow phase of the nystagmus during the threesecond interval where the nystagmic output was maximum.
III. Results and Discussion.
A. Blood Alcohol Levels (BALs). Means and standard deviations for the blood alcohol levels are presented in Table 1. The mean level for the high alcohol group after one hour was 90 mg.%, nearly bvice the average value (52 mg.%) reached by the moderate alcohol group. Four hours after ingestion, the mean BAL for the moderate alcohol group 'vas reduced to 19 mg.%, while the average for the high alcohol group (65 mg.%) was above the values reached by the moderate alcohol group at either the 30-minute or the one-hour testing session.
TABLE 1.-Means and Standard Deviations for the Blood Alcohol Levels (in mg per 100 ml). Each Value is Based on a Mean for 10 Subjects.
Group
Moderate M Alcohol SD
High M Alcohol SD
Time Since the Ingestion of Alcohol
Thirty One Four Minutes Hour Hours
44.6 52. 1 18.6 14.1 10.9 3.8
64.2 90.0 64.7 19.7 18.0 10. 1
B. Alertness. The mean response levels under the alert conditions in the KP and MA trials were, for most trials, higher than those under the relaxed (Rev) condition (Tables 2 through 5). Analyses of variance for all measures of the nystagmic responses to the angular accelerations revealed significant effects for "instructions" (Table 6). While supporting the conclusions reached in earlier studies" 6 9 that alerting instructions produce a higher-amplitude, longer-duration response, the present data further indicate that alerting instructions result in an increase in the frequency and the slow phase velocity of vestibular eye movements. The nystagmic tracings presented in Figure 2 depict the effects of

I TABLE 2.-Means and Standard Deviations for the Slow Phase Nystagmus Displacement (in Degrees) Resulting from
the Rotatory Stimuli. Each Group Was Comprised of Ten Subjects.
Mental Arithmetic Key Press Reverie Group Stimulus
Pre Post I Post II Pre Post I Post II Pre Post I Post II
Ace
Control Dec
Ace
Moderate Alcohol Dec
Ace
High Alcohol Dec
M SD
M SD
M SD
M SD
M SD
M SD
567.7 183.7
668.5 354.2
467.1 127.3
443.8 157.6
582.7 313.6
601.3 343.1
495.2 194.5
759.8 442.1
421.2 95.6
380.8 141.3
307.9 133.7
332.4 156.0
474.9 204.3
597.0 231.1
538.6 156.8
475.5 195.9
431.7 207.9
402.1 131.5
514.1 205.4
523.2 285.8
411.6 143.8
359.2 146.2
493.4 211.9
414.9 189.8
466.2 288.2
492.3 347.5
396.3 93.0
347.5 157.6
315.1 178.2
283.6 159.1
448.4 165.4
475.3 192.9
505.3 184.0
421.9 169.6
412.9 173.4
369.6 145.4
339.6 83.3
298.0 108.7
321.9 83.6
Interrupted by visual stimulation
293.9 126.9
227.2 83.8
336.3 156.6
Interrupted by visual stimulation
377.9 168.6
184.1 119.2
256.7 110.7
Interrupted by visual stimulation
TABLE 3.-Means and Standard Deviations for the Number of Nystagmic Beats Resulting from the Rotatory Stimuli. Each Group Was Comprised of Ten Subjects.
Mental Arithmetic Key Press Reverie Group Stimulus
Pre Post I Post II Pre Post 1 Post II Pre Post 1 Post II
Ace
Control Dec
Ace
Moderate Alcohol Dec
Ace
High Alcohol Dec
M SD
M SD
M SD
M SD
M SD
M SD
76.6 19.7
79.6 21.5
92.4 105.3 37.1 49.8
76.9 30.6
68.3 25.9
77.9 33.4
80.8 31.9
56.4 15.6
48.4 14.2
43.2 17.5
48.8 18.0
two different alertness leYels (:\IA and Rev) on the nystag·mic response to angnlar accelerations. The effects of alertness are also evident in the response cnrves for the slow phase displacement and the freqnency of the nystagmic responses ( Fignres :3 through 8).
77.2 22.6
97.3 37.6
74.3 22.2
65.2 19.7
59.8 21.4
60.0 19.5
72. 1 21.1
77.0 31.7
71.4 27.9
60.4 23.2
75.9 25.9
68.7 23.7
78.1 21.3
80.7 36.7
55.2 15.5
48.8 14.5
40.4 17.5
42.8 18.3
75.7 16.8
81.4 32.9
72.3 20.5
63.5 14. 1
59.6 20.4
55.7 17.5
67.7 16.9
61.8 23.6
67.2 18.3
Interrupted by visual stimulation
64.3 28.6
46.3 12.8
61.0 20.3
Interrupted by visual stimulation
71.5 23.9
38.9 18.2
56.1 16.0
Interrupted by visual stimulation
C. Nystagmus Recorded in Darkness. Means and standard dm·iations for the slow phase displacement, frequency, peak Yelocity, and duration of the nystagmic eye movements resulting from rotatory stimnli administered in total darkness are presented in Tables 2 through 5. The
5
-

TABLE 4.-Means and Standard Deviations for the Peak Velocity (Deg/Sec) of the Slow Phase Nystagmus Resulting from the Rotatory Stimuli. Each Group Was Comprised of Ten Subjects.
Mental Arithmetic Key Press Reverie Group Stimulus
Pre Post I Post II Pre Post I Post II Pre Post I Post II
Control
Moderate Alcohol
High Alcohol
Ace
Dec
Ace
Dec
Ace
Dec
M SD
M SD
M SD
M SD
M SD
M SD
37.3 7.4
46.8 17.9
32.1 10.1
41.4 17.2
35.6 16.4
48.6 25.4
36.3 12.4
54.8 20.0
32.3 9.7
45.2 16.8
26.2 6.7
43.6 11.2
37.5 11.8
53.1 17.6
35.1 9.5
41.8 18.3
35.3 15.4
43.7 19.3
41.2 12. 1
61.4 19.3
29.4 11.8
39.1 16.8
35.8 16.4
46.0 14.5
35.0 11.6
59.2 15.3
32.4 8.0
46.1 14.6
24.1 10.7
39.0 21.4
40.6 8.6
56.6 11.3
36.8 13.7
48.5 16. 1
35.5 8.9
54.6 14.1
29.8 9.0
25.4 9.6
31.9 7.0
Interrupted by visual stimulation
25.3 8.4
26.0 12.4
31.7 14.4
Interrupted by visual stimulation
28.5 8.9
18.2 9.2
24.2 7.9
Interrupted by Yisual stimulation
TABLE 5.-Means and Standard Deviations for the Duration (in Seconds) of the Nystagmic Response Resulting from the Rotatory Stimuli. Each Group Was Comprised of Ten Subjects.
Mental Arithmetic Key Press Reverie Group Stimulus
Pre Post I Post II Pre Post I Post II Pre Post I Post II
Ace
Control Dec
Ace
Moderate Alcohol Dec
Ace
High Alcohol Dec
M SD
M SD
M SD
M SD
M SD
M SD
53.4 8.6
59.1 19.2
61. 1 13.6
54.5 13.0
58.4 10.7
53.1 13.2
52.8 8.4
62.2 27.6
49.1 7.6
40.2 7. 1
39.1 7.2
37.6 13.7
results of analyses of \"ariance for the acceleration data, are presented in Table 6. Since the "trial'~ factor was significant for all measures, t tests ·were conducted to determine where the significant changes occurred.
Although most of the measures evidenced some
51.0 11.4
57.6 21.9
56.4 11.0
46.8 7. 1
43.9 7.0
39.0 8.7
51.0 9.8
52.2 24.2
55.6 11.5
47.3 5.9
53.2 9.6
44.8 8.0
52.2 13.9
55.1 23.3
45.1 8.8
36.2 5.3
36.4 8.3
30.1 12.5
48.2 8.2
48.6 19.0
52.0 8.3
41.6 8.5
43.3 6.5
35.4 9.2
45.8 7.2
44.4 7.8
43.8 3.0
Interrupted by visual stimulation
45.4 9.8
35.0 8.4
42.6 8.1
Interrupted by visual stimulation
46.6 5.5
30.4 12.2
38.5 10.6
Interrupted by visual stimulation
degree of Pre-to-Post I decline for the control group, only the decline in slow phase displacement for the )IA acceleration ( .01 level) and the decline in velocity for the KP acceleration ( .05 level) were significant. Only one of the Preto-Post II differences was significant (Table 7).
6

I ------------------------~ ....... ALCOHOL ING~STION
STIMULI: 5'YSEC2 FOR 12 SEC
PRE
POST 1
SUBJECT OM
CONDITION
ALERT Jl.. ~~~"'N\N~'A"N~\tt-N\~ ~'',!'''~ I
REVERIE
+ SUBJECT BG
FIGURE 2. A portion of the nystagmic tracings, for two subjects, resulting from a 12-sec acceleration of 5° ;sec'. Calibrations ( 1 :-;o of eye movement) appear hpfore each trial. The vertical bars demarcate the stimulus period and the arrows indicate the end of the primary nystagmic response. The tracings for subject DM reveals the suppressive effect of the high alcohol dose on the nystagmic response (:\Iental Arithmetic condition). All aspects of the Post I nystagmic response are suppressed (slow phase displacement, frequency, peak velocity and duration of the nystagmus). The tracings for subject BG in the lower half of the figure (both taken from Pre trials) reflect the influence of alerting instructions (Key Press) on the nystagmic response. All measures of the nystagmie response during the Alert condition are enhanced in comparison with the Reverie condition.
TABLE 6.-Results of the Analyses of Variance for the Various Measures of the Nystagmic Responses Resulting from the Rotatory Stimuli.
Source
Groups (G) ______________ _ Instructions (I) ___________ _ I X G ___________________ _ Trials (Tr) _______________ _ Tr x G __________________ _
I x Tr I X Tr X a _______________ _
* p <. 05 ** p <.01
*** p <.001
Slow Phase Displacement
0.62 32.12*** 0.06
15.98*** 7.15** 0. 72 0.56
Frequency
1. 85 6.67** 0.46
28.14*** 10.21*** 0.35 0.58
7
F
Duration Peak Velocity
2.98 1.40 36.02*** 15.94*** 1. 48 0.56
33.30*** 8.44*** 9.97*** 2.61* 0.50 0.45 0.22 0.74

I 80 80
..J 70 70
~ 0::
"' 1-~ 60 60
u
"' "' ,;, 0:: 50 50
"' 11.
"' "' "' ~ 40 40
"' e "' :::> ~ 30 30
i! "' ,... z "' 20 20
"' .. J: 11.
3: g 10 10
"'
18 27 36 45 54 63 72 81
~ ... I
\ \
' I MODERATE
\ ALCOHOL
\ GROUP
'. I
18 27 36 4!5 54 63 72 81 90
TIME IN SECONDS
80
70
60
40
30
20
10
STIMULUS: 5•1 SEC 2 FOR 12 SEC
(MENTAL ARITHMETIC I PRE
POST I
POST D •-----.1.
FIGURE 3. Response data for the average number of degrees of slow phase eye movement resulting from the angular accelerations (fi 0 ;~ee' for 12 sec), under the :\Iental Arithmetic <·ondition. l're refers to the response recorded prior to the ingestion of alcohol, while the Post I aml Post II rlata were obtained 4fi min and four hours after ingestion. The arrow on the abscissa indicates the end of the stimulus. The value!> are plotted in 3-sec intervals; each point is a mean for 10 subjects.
....J <1: >
9
a: 8
"" ..... z
~ 7 Vl I
"' e; 6 n. Vl ..... z "" 5 ::!!
"" ~ ::!! 4
"" ,... "" u ::1: 3 Cl
~ Vl
f 2
~ a: ~I I
::!! ~ z
CONTROL GROUP
9 18 27 36 45 54 63 7'; 81
9
8
7
9 18 27 36 45 54 63 72 81 90
TIME IN SECONDS
STIMULUS: 5• I SEC2 FOR 12 SEC
MENTAL ARITHMETIC
PRE .__
POST I o--0 POST n .___.
9 18 27 36 45 54 63 72 81
Frm.'RE 4. Response data for the avErage number of nystagmi1· Pye movempnts resulting from the angular accelerations (5° ;sec' for 12 see), under the :\I ental Arithmetic I'OIHlition. Symbols and markings are identical to those used in Figure 3.
8

I 80 80
70 70 ...J
~ lr
"' ... ~ 60 60
u "' "' ,;, lr 50 50
"' IL
"' "' "' lr 40
" 40
"' 0
"' :> ::E 30 30
~ "' >-z
20 20
"' "' c( X IL
;!:: 0
10 10
...J
"'
9 18 27 36 45 54 63 72 81 90
• I(' I I I
'. \ I I I • \ \ \ \ \ • I \ I I I
MODERATE
ALCOHOL
GROUP
18 27 36 45 54 63 72 81
TIME IN SECONDS
70
60
50
40
30
20
10
STIMULUS: 5•JSEC2 FOR 12 SEC
(KEY PRESS) PRE ......__
POST I o------o POST n •---.
FIGURE 5. Response data for the average number of degrees of slow phase eye movement resulting from the angular accelerations (5°/sec' for 12 sec), under the Key Press condition. Symbols and markings are identical to those used in Figure 3.
9
8
(f)
1-z ~5 w > 0 :::;; w4 >-w u ~3 (!) <( 1-(f)
>-zz u.. 0 a: w CD :::;; ::J z
9 18 27 36 45 54 63 72 81 90
3
2
9 18 27 36 45 54 63 72 81
TIME IN SECONDS
STIMULUS: 5°/SEC2 FOR 12 SEC
KEY PRESS
PRE .,_.
POST I o--o POST n • _ _.
9 18 27 36 45 54 63 72 81
Frm:RE G. Hesponse clata for the average number of nystagmie eye movements resulting from the angular accelerations (5°/See' for 12 see), under the Key Press condition. Symi:Joh; and markings are identical to those used in Figure 3.
9
-

• :J 60
~ Q: LLI 1-
~50 1.) LLI en
I rtl
ffi 40 Q.
en LLI LLI Q: C> 30-LLI e en :::> ~ C> 20
~ en >z LLI en 10 <( J: Q.
3: 9 en 9 18
60
50
40
30
20
10
27 36 45 54 63
60
50
40
30
20
10
9 18 27 36 45 54 63
TIME IN SECONDS
9
STIMULUS: 5"/ SEC2 FOR 12 SEC
18
(REVERIE)
27
PRE -POST I o--o POST n •--•
HIGH
ALCOHOL
GROUP
36 45 54 63
FIGURE 7. Response data for the average number of degrees of slow phase eye movement resulting from the angu lar accelerations (5°/se<·' for 12 sec), under the Reverie (relaxed) condition. Symbols and markings are iden· tical to those used in Figure 3.
I
rtl
(J)
1-z ~ 5 w > 0 ::!: w4 >-w u ~ 3 l!l
~ (J)
>z2 lL. 0
ffi CONTROL Ill GROUP ::!: :::> z
9 18 27 36 45 54 63 9 18 27 36 45 54 63
TIME IN SECONDS
9 STIMULUS: 5"/ SEC 2 FOR 12 SEC
8
3
2
REVERIE
PRE .........
POST I o--o POST ll .6.---A
9 18 27 36 45 54 63 72 81
FIGL'RE 8. Response data for the average number of nystagmi<' t>ye movements resulting from the angular accelerations (5°/sec' for J2 sec), under the Reverie (relaxed) condition. Symbols and markings are identical to those used in Figure 3.
10


I
TABLE 9.-Results of the Paired t Tests for the Pre vs. Post I and Pre vs. Post II Comparisons of the Nystagmic Responses of the High Alcohol Group to the Rotatory Stimuli.
Measure
Displacement
Frequency
Duration
Comparison
Pre vs. Post I Pre vs. Post II
Pre vs. Post I Pre vs. Post II
Pre vs. Post I Pre vs. Post II
Velocity Pre vs. Post I Pre vs. Post II
* p <. 05 ** p <.01
*** p <.001
V> ::>
"
,00
90
~ 40
r z
~ :Jzo V>
'0
CONTROL GROUP
'00
90
eo
70
Condition
Mental Arithmetic Key Press Reverie
Ace Dec Ace
3.50** 2.96* 3.97** 2.04 2.43* 1. 74
5.48*** 4.91*** 7.45*** 3.46** 4.02** 3.09
6.60*** 2.53 5.18*** 4.37** 6.42*** 3.32**
2.37* 0.94 2.65* 0.09 0.77 0.07
,00
90
eo
18 27 36 45 !54 63 72 81 90
TIME IN SECONDS
Dec Ace
3.00* 4.97*** 1. 38 3.34**
4.99*** 5.08*** 2.89* 2.75*
3.17* 5.03*** 2.62* 3.31**
1. 08 3.39** 2.52* 1. 74
STIMULUS BRAKE DECELERATION
MENTAL ARITHM£ TIC
PRE
POST I o-------<J
POST D .a.--_..,
FIGURE 9. Response data for the average number of degrees of slow phase nystagmus resulting from the brake decelerations, under the l\lental Arithmetic condition. Since the deceleration (from 60° ;sec) was very rapid (approximately 0.5 sec), the values are plotted from the start of the deceleration. Symbols and markings are identical to those used in Figure 3.
sponse is recorded in total darkness. The extent of the suppression appears related to the amount of alcohol ingested; i.e., the high alcohol group
12
evidenced larger declines than the moderate alcohol group. These effects of alcohol are apparent in the nystagmus response curves for the

I ---------------------------------........ ;i 10 10
~ ILl
~9 9 STIMULUS: BRAKE DECELERATION
MENTAL ARITHMETIC u PRE ._ ILl en 8 8 POST I ()-Q I
POST D ·-I<)
Q:
~ 7 7
en 1--z 6 ILl ::::!: ILl > 5 0 5 ::::!:
ILl >- 4 ILl 4
u ~ (!) 3 3 <( 1--en >-z 2 2 lL 0 Q: ILl CD ::::!: ::> z
9 18 27 36 45 54 63 72 81 90 99 100 117 126 135 9 18 27 36 45 54 63 72 81 90 9 18 27 36 45 54 63 72 81
FIGURE 10. ResponRe data tions under tlle l\Iental
eo
...J 70
~ a: 1&1 1--!!: 60
l.il en ,;, a: ~ It' en 1&1 1&1 a: C) 1&1
40
9 en :::l :I 30 C)
~ en >-z 1&1
20
en c( :r Cl.
~ 10
en
TIME IN SECONDS
for the average number of nystagmic eye movements resulting from the brake deceleraArithmetic condition. Symbols and markings are identical to those used in Figure 3.
eo
70
60
CONTROL GROUP 50 MODERATE ALCOHOL GROUP
40
30
20
10
9 le 27 36 45 54 63
TIME IN SECONDS
eo
70 ·~~ I
40
30
20
10
STIMULUS: BRAKE DECELERATION
KEY PRESS PRE ...,.._____.
POST I o----o POST 0 •---6
HIGH ALCOHOL GROUP
9 le 2736455464
FIGURE 11. Response data for the average number of degrees of slow phase nystagmus resulting from the brake decelerations under the Key Press condition. Symbols and markings are identical to those used in Figure 3.
13

I
(f) 1-z ~5 w > 0 ::;: w4 >w u ~3 <!)
;: (f)
>Z2 lJ._ 0
a:: w ~ I GROUP
:::> z
9 18 27 36 45 54 63 72 81 90 99 108 117 9 18 27 36 45 54 63
9
8
7
STIMULUS: BRAKE DECELERATION
KEY PRESS
PRE ._.
POST I o-o
9 18 27 36 45 54 63 72 81
TIME IN SECONDS
FIGURE 12. Response data for the average number of nystagmic eye movements resulting from the brake decelerations under the Key Press condition. Symbols and markings are identical to those used in Figure 3.
various stimuli (Figures 3 through 8) and in the nystagmus tracings presented in Figure 2.
Changes in the nystagmic responses from the brake decelerations, folhwing alcohol ingestion, were similar to those noted for the accelerations (Tables 2 through 5 and Figures 9 through 12).
These data support the earlier studies3 10 11 12 16
which shov•;ed that alcohol ingestion suppressed the nystagmic response to rotatory stimuli. However, these results fail to support other investigations22 23 24 25 where alcohol enhanced vestibular nystagmus.
D. Resolution of ConfMcting Results from Preoious Studies. Data from seven additional subjects who receiYed rotatory stimulation while fixating on visual targets provide a basis for resolving conflicting reports in the literature. Tracings from a subject's nystagmic response to the acceleration while fixating on the target lights in an otherwise dark room, and from the brake decelerations while fixating on the target with the room lights on, are presented in Figures 13 and 14. It is apparent from both figures that the subject was able to suppress the recorded
14
nystagmic response by visual fixation when alcohol was not involved. However, following the ingestion of alcohol, a low-amplitude, high-frequency nystagmus was elicited by both stimulus rates.
\Vhat was reported in several previous studies as an enhanced vestibular response to acceleratory stimuli following the ingestion of alcohol can now be explained by the interference of alcohol ·with the subject's ability to maintain visual fixation. The inability to fixate permits a more vigorous nystagmic response to manifest itself. This interference by alcohol was also apparent in the subjects' reports concerning their attempts to fixate; greater effort and more time was required to bring the target into focus under the alcohol condition. (Similar effects have been obtained using caloric vestibular stimulation. )21
Data from a study by ,J atho14 offer additional support to this view that alcohol interferes with the visual fixation mechanism. .Tatho14 reported that recovery movements of the eyes following head shaking took a considerably longer time after the ingestion of alcohol.

I PRE ALCOHOL
POST ALCOHOL
CW STIMULUS: 5o I SEC2 ACCELERATION FOR 12 SEC SUBJECT IN DARKNESS FIXATED ON
TARGET LIGHT.
FIGURE 13. A portion of the tracings of the nystagmic response of a subject to a 12-sec acceleration of 5° /sec• during visual fixation of a dimly lit target-light. The vertical bars indicate the beginning and end of the stimulus. The calibration, representing 1;) 0 of eye movement, appears before each trial. 'fhe subject's response was recorded before and 45 min after the ingestion of 2 ml of 100-proof vodka per kg of body weight. The effect of alcohol on the visual fixation system is evidE'nt in the relatively strong nystagmic response for the Post condition. Visual fixation, while under alcohol intoxic-ation. is much less effective in suppressing the nystagmic response to vestibular stimulation.
PRE ALCOHOL
r-.... I
POST ALCOHOL
\_.
STIMULUS: BRAKE DECELERATION FROM CW ROTATION
SUBJECT FIXATED ON TARGET WITH ROOM LIGHTS ON. FIGLTRE 14. A portion of the tracings of the nystagmic response of a subject to a brake deceleration, following
two min of constant velocity at 60° /sec. The vertical bar indieates the start of the deceleration and the point where the room lights were turned on. The subject was instructt>d to fixate on the target-light as soon as the room lights came on. A calibration representing 15° of eye movement appears before each trial. Changes in the response under alcohol are similar to those noted in Figure 13.
15

I E. Subjective Data from the Accelerations and
Decelerations in Darkness. Means and standard deviations for the total displacement (in degrees) and duration of the rotatory sensations resulting from the accelerations, and for the duration of the rotatory sensations resulting from the decelerations are presented in Tables 10 and 11. Response curves for the subjects' estimations of turning velocity during the accelerations are presented in Figure 15. Analyses of variance (Table 12) were applied to these data.
TABLE 10.-Means and Standard Deviations for the Total Subjective Displacement (in Degrees) for the KP Acceleration (Total Darkness).
Trial Group
Pre Post I Post II
Control M 1368 1350 1269 SD 703.3 468.6 477.1
Moderate M 1323 1224 1287 Alcohol SD 511.0 728.9 578.7
High M 1107 945 918 Alcohol SD 395.8 360.6 257.4
1. Accelerations. Pre to Post I declines in mean experienced velocity and duration of the turning sensations for the moderate and the high alcohol groups were larger than those for the control group. Although the largest declines occurred for the high alcohol group, the F ratios for these data 'vere not significant (Table 12). Even though the Post II means for the velocity and duration measures of the rotatory sensations evidenced some recovery from the Post I level, they were still below Pre levels.
2. Decelerations. Results of the analysis of Yariance (Table 12) indicated that changes across trials in the duration of the turning sensations resulting from the decelerations were significant. The Pre to Post I declines in the durations, according to t tests, were significant for both alcohol groups but not for the control group (Table 13). None of the Pre-Post II differences were significant. That the declines in the duration measures were significant for the decelerations, but not for the accelerations, may be due to the fact that, during the acceleration, the subjects were required to make signals concerning the velocity of their sensations between the start and end of their turning sensations, whereas they needed only to signal the start and end of their turning experience during the deceleration. The additional signals may have maintained alertness and thereby prevented the response from decaying as rapidly as it did under the acceleration condition.
3. ()yerview. The data from the decelerations support the conclusion reached by Barany1 ;
alcohol ingestion tends to suppress the sensations resulting from rotatory stimulation. Moreover, some declines \Yere evident for the velocity and duration of the turning sensations from the accelerations, although they were not statistically significant. This difference in the magnitude of decline of the turning experience between the accelerations and decelerations may be due to differences in instructions concerning attention to (and signals of) rotatory sensations.
F. Spiral Aftereff'ect Data. Means and standard deviations for the spiral aftereffect ( SAE)
TABLE 11.-Means and Standard Deviations for the Duration (in Seconds) of the Subjective Turning Sensations Resulting from the KP Acceleration and Deceleration. Each Group Was Comprised of Ten Subjects.
Pre Post I Post II Group
Ace Dec Ace Dec Ace Dec
Control M 30.8 31.5 36.6 32.1 32.2 31.7 SD 9.5 11.5 16.3 11.9 13.0 19.6
Moderate M 26.6 28.5 25.6 23.3 25.4 25.1 Alcohol SD 10.2 9.4 8.2 9.7 7. 7 7.7
High M 28.0 31.1 27.7 23.0 26.2 24.6 Alcohol SD 10.3 8.8 8.4 9.4 10.8 14.6
16

I
TABLE 12.-Results of the Analyses of Variance for the Displacement (in Degrees) and Duration (in Seconds) of the Subjective Reactions During the KP Rotation Stimuli.
Subjective Displacement Duration Duration (Accelerations)
Source df Mean F
Squares
Groups (G)___________ 2 Subj./within Groups(S/G) 27
1002.33 1. 54 649.41
Trials (T) ____ _ _ _ _ _ _ _ _ _ 2 102.69 1. 33 Tx G________________ 4 27.36 0.35 T x S/ G _ _ _ _ _ _ _ _ _ _ _ _ _ _ 54 77.10
* p <.05
TABLE 13.-Results of the Paired t Tests for the Duration of the Rotatory Sensation Resulting from the KP Deceleration.
Group Pre vs. Post I Pre vs. Post II
ControL ___________ 0.21 0.04 Moderate AlcohoL __ High Alcohol ______ _
* p <.05 ** p <. 01
TABLE 14.-Means and
2.66* 4.11 **
Standard
1. 62 1. 97
Deviations for the Duration (in Seconds) of the Spiral Aftereffect (SAE). Each Group Was Comprised of Ten Subjects.
Trial Group
Pre Post I Post II
Control M 12.7 13.0 12.8 SD 6.4 6.3 7. 1
Moderate M 15.3 13.0 14. 1 Alcohol SD 7.2 5.4 6.1
High M 14.2 13.8 15. 1 Alcohol SD 10. 1 11.9 16. 1
are presented in Table 14. Comparisons of the Pre, Post I, and Post II ,·alues reveal little change as the result of the ingestion of alcohol.
The relationship between the duration of the SAE and the duration resulting from the accelerations and decelerations of the rotatory stimuli was investigated. Only the correlations for the high alcohol group \Vere significant (Table Hi). Thus, these data offer only partial support to the studies by Reason,'8 19 Reason and Benson,"0 and Nilsson and Henrikson.17 The
17
(Accelerations) (Decelerations)
Mean F Mean F Squares Squares
45.61 1. 54 33.99 1. 05 59.37 32.40 3.32 1. 15 14.69 3.88* 3.45 1. 20 5.33 1. 41 2.87 3.79
lack of significant correlations among the measures may be due to the lack of appreciable variability in the SAE duration values for the control and moderate alcohol groups; or to several differences in experimental technique between earlier studies and this one.
G. Subjecti?·e Data from the Deceleration 'which Involved BJ'ief Intervals of Light. The analysis of the data concerning the subjective sensations resulting from the decelerations using either a three-second or an eight-second period of room illumination was based on visual observation rather than on any statistical treatment of the data. There were no dramatic changes in the response which could be attributed to the ingestion of alcohol.
'Yhen compared to the experiences reported in total darkness (using a comparable angular stimulus) the primary sensations from the "light" decelerations were much shorter. The "light" intervals also tended to increase the occurrence and intensity of secondary sensations (i.e., a renewal of sensations which follows the end of the primary response and is in the opposite direction). These differences are evident \vhen you compare Figures 15 and 16.
Pnder dark conditions, the secondary sensation, in most cases, was either not present or was too weak to be signaled. Even \vith the small number (five) of subjects in each of the subgroups, the data appeared to agree with results obtained in studies by Collins. 7 8
H. Nystagmus Data from the Deceleration which hu·ol1·ed Brief Inter""•als of Light. Means and standard deviations for the slow phase displacement and frequency of the primary and
-

I
PRE -POST I o-----o ....1 210 POST n •---• ~ Q: 1&.1 .... ~ 180 0 1&.1 (/) 165 It)
Q: 150 1&.1
Q. I I
I (/) 135 I 1&.1 I I 1&.1 Q: I I C) 120 I • 1&.1 I 0 I I
105 I I .... I I z I I 1&.1 90 I ::f I I 1&.1 I 0 75 • < \ \ ....1 Q. I
' \
(/) 60 \ 0 I I
1&.1 45 I HIGH > ~ I ALCOHOL 0 30 I GROUP 1&.1 .., CD
15 ;:::) (/) I.
9 18 27 36 45 54 63 72 9 18 27 36 45 9 18 27 36 45 54
TIME IN SECONDS
I<'rm;m; 15. Hespon~e data for the average numher of degrees of suhjective displac-ement resulting from the accelerations ( G0 ;see' for 12 sec). Pre refers to the response reeorclef! prior to the ingestion of alcohol, while the Post I and Post II data were obtained, respectively, 4ii min and four hours after ingestion. The arrow on the abscissa indirates the end of the stimulus. The values are plotted in 3-see intervals: each point is a mean for 10 subjects.
TABLE 15.-Product Moment Correlations for the Duration of the ::lpiral Aftereffect and the Duration of the Rotatory Sensations for the 12-sec Accelerations and the Decelerations.
Acceleration Durations Group
Pre Post I
ControL ______________ • 26 .03 Moderate AlcohoL _____ .27 .25 High AlcohoL _________ . 81 ** . 89**
* p <.05 ** p <.01
secondary nystagmus resulting from the prolonged (light) decelerations are presented in Tables 1() and 17. Similar computations for the duration of the primary nystagmus are presented in Table 18; for comparative purposes, nystag-
Deceleration Durations
Post II Pre Post 1 Post II
18
. 25 • 10 -.13 -.15
.71* .04 .18 .45
.93* . 61 * . 81 ** . 72**
mus duration nllues for a comparable stimulus (an acceleration) in total darkness are also presented. Each value represents a mean for five subjects since each group was divided into a three-second and an eight-second light sub-group.

I
U)
w w 0::: 20 (.!) w 0
CONTROL GROUP
9 18 27 36 45 54 63 72 81
MODERATE ALCOHOL GROUP
9 18 27 36 45 54 63 72
TIME IN SECONDS
HIGH ALCOHOL GROUP
STIMULUS: 5•tSEC2 DECELERATION 8- SEC LIGHT GROUP
PRE _______..
POST I o--o POST n .A.--A
9 18 27 36 45 54 63 72 81
FIGcRE lG. Hespon~e rlata for the average nnmher of degTees of snbjertiYe displaeement resulting from the 12-sec deceleration of 5° ;see'. '!'he room lights were tnrnetl on at the start of the rleceleration and remained on for 8 see. Point,; plotterl above the zpro line represent the primlu~- re,;ponst>, whilt> those below represent the secondary re1'pon;;e. Symbol:-; aml marking~ are identical to those n><e<l in Figure 15.
19
-

I
_J
g 0:: w 1-z u w (/)
0
~
(/) w w 0:: (9 w 0
~ 20 ::::!: (9
~ (/)
>z w (/) <( I (}_
CONTROL GROUP
~ - I 0 ._,_.........,'-'-'~--'-'--'-'---'--'--'-'-.L.L'-'-'---'-''-' _J (/)
9 18 27 36 45 54 63
70 MODERATE ALCOHOL GROUP
9 18 27 36 45 54 63 72 81
TIME IN SECONDS
70
60
50
40
HIGH ALCOHOL GROUP
STIMULUS: 5"/ SEC2 DECELERATION
3- SEC LIGHT GROUP
PRE ..__..
POST I o--<)
POST n &-_.
9 18 27 36 45 54 63 72 81 90
FIGT'RE 17. Respom;e data for the average number of degrees of ~"<low phase eye movement resulting from the 12-sec rleceleration of ri 0 /sec'. Imnwrliately following tht> P!Hl of t!JP rleceleration, the room lights were turned on for :1 sec, <luring which time the subject fixated on a targPt. The short !Jar ahO\'P the zero line represents the period of room illumination while the arrow indicatPs tlw Pnrl of the stimulus. l'oints plotted ahove the zero line represent tlw primary respon~P, while those below reprPsPnt the seeondary rPsponse. Pre refers to the rPsponse oiJtainerl prior to the ingestion of alcohol, whil<' l'ost I aiH! l'ost II rt>ft>r, respectivt>ly, to data obtained 4ri min and four hours aftPr ingestion. The valm•s arP plotted in 3-see intervals; ear:h point represents the average response of five subjects.
20

I ~
TABLE 16.-Means and Standard Deviations for the Slow Phase Displacement of Primary and Secondary Nystagmus (in Degrees) Resulting from the 12-sec Deceleration of 5°/sec2 • The Room Lights Were on for Either 3 sec After the Decel or for 8 sec at the Start of the Deceleration.
Nystagmus
Group Light Primary Secondary Interval
Pre Post I Post II Pre Post I Post II
3 sec M 276.7 251.3 265.4 54.6 54.2 67.5 SD 46.2 57.1 42.2 39.1 41.9 65.5
Control 8 sec M 245.6 235.6 246.3 128.9 81. 5 79.8
SD 289.0 205.9 193.0 141.3 72.1 83.7
3 sec M 221.4 282.2 241.1 58.2 73.9 71.5 SD 34.6 97.7 69.8 55.8 36.0 46.9
Moderate Alcohol 8 sec M 156.7 138.3 156.7 48.4 60.1 46.2
SD 93.7 64.1 89.0 42.2 51.7 39.1
3 sec M 258.5 231.5 228.2 44.0 53.9 42.0 SD 162.9 130.2 120.4 40.3 28.3 28.5
High Alcohol 8 sec M 201.6 156.0 243.2 51.4 26.1 80.1
SD 119.4 76.3 88.6 33.0 32.6 23.8
TABLE 17.-Means and Standard Deviations for the Number of Primary and Secondary Nystagmic Eye Movements Resulting from the 12 sec Deceleration of 5° /sec2 • The Room Lights Were on for Either 3 sec After the Decel or for 8 sec at the Start of the Deceleration.
Nystagmus
Group Light Primary Secondary Interval
Pre Post I Post II Pre Post I Post II
3 sec M 46.6 50.0 52.6 14.6 15.4 15.4 SD 16. 1 23.2 24.2 8.8 9.1 9.4
Control 8 sec M 37.2 44.3 36.6 23.0 16.9 22.5
SD 29.1 21.9 19.0 15.1 10.2 14.8
3 sec M 46.4 55.5 47.0 14.8 18.0 19.1 SD 8.4 9.8 15.4 11. 1 7.6 10.8
Moderate Alcohol 8 sec M 32.4 24.1 30.0 15.2 17.2 12.3
SD 20.0 11.6 17.2 13.4 13.0 9.2
3 sec M 46.0 43.2 47.1 13.0 16.4 14.0 SD 17.7 15.1 18.5 10.9 5.8 8.4
High Alcohol 8 sec M 39. 1 27.7 41.4 16.8 11.4 22.2
SD 21.3 12.9 15.4 10.6 11.8 4.7
21

I TABLE 18.-Means and Standard Deviations for the Duration (in Seconds) of the Primary Nystagmus Resulting from
the Decelerations During Which (8 sec) or Following Which (3 sec) Room Lights Were on. For Purposes of Comparison, Similar Data Are Presented for the Acceleration in Total Darkness.
Deceleration Acceleration Group Interval
Pre Post I
3 sec M 39.0 39.6 SD 8.2 14.8
Control 8 sec M 38.4 42.0
SD 27.8 14.2
3 sec M 46.8 44.4 SD 8.6 6.2
Moderate Alcohol 8 sec M 40.8 33.0
SD 9.4 7.4
3 sec M 41.4 37.2 SD 6.5 8.9
High Alcohol 8 sec M 37.8 31.8
SD 13.2 4.6
Because of the small number of subjects in each of the sub-groups, the data should be interpreted with caution. Due to the nature of the data, a visual analysis rather than statistical treatment was used.
Changes in the nystagmic response, which occurred as a result of the brief intenals of light, are evident in comparison of the nystagmus response curves from the light decelerations and dark accelerations (compare Figures 3 through 8 with Figures 17 through 20). The primary nystagmic responses under both light conditions were weaker than those obtained under dark conditions. The suppressiye effect of the light was also e\·ident in the duration of the primary nystagmus; mean duration \'alues for the dark acceleration were much longer (Table 18). \Vhile the primary nystagmic response was weakened and shortened, the secondary nystagmic response (like the secondary sensation, the secondary nystagmic response follows the primary
22
Post II Pre Post I Post II
42.6 48.3 47.6 42.7 12.3 4.6 7.0 3.7
42.0 53.6 56.5 53.6 15.2 13.3 18.1 8.1
40.2 60.7 44.1 51.9 3.4 10.7 9. 1 4.4
30.0 53.8 46.0 52.0 9.5 7.9 9.4 11.7
38.4 53.6 41.8 45.0 10.3 4.1 3.1 6.4
40.2 52.8 30.9 41.6 5.8 13.9 8.3 6.8
nystagmic response and is in the opposite direction) began sooner and was of greater amplitude, see Figure 21. ruder dark conditions, the secondary nystagmic response was too weak and infrequent to score adequately in most cases. These suppressive effects of the brief intervals of light on the primary nystagmic response and their enhancing effects on secondary nystagmus support findings in earlier studies.7 8
The small number of subjects in each of the sub-groups made any analysis of the effects of alcohol difficult. Comparisons of the duration of the primary nystagmic response between the dark and light conditions indicate that the only trials where the ,·alues for the light condition were <lS long or longer than the dark condition occurred follmving a kohol ingestion (Table 18). These data provide some support for the idea that ,·isual fixation, following alcohol ingestion, was less effective in suppressing the primary nystagmic response.

I
_J
~ a:: w I~
u w (/)
I
r<l 5 a:: w a_
(/) 4 1-z w ~ 3 w > 0 ~
w >w u ~ ~
1:!
2
I I I
I
CONTROL GROUP
(/) 0~--~--------~----------->z lJ... 0 -I a:: w CD ~-2 :::> z
-3
9 18 27 3G 45 54 63 72
-----------------------------~~
MODERATE ALCOHOL GROUP
9 18 27 36 45 54 63 72 81
TIME IN SECONDS
HIGH ALCOHOL GROUP
STIMULUS: 5"1 SEC2 DECELERATION
3-SEC LIGHT GROUP
PRE ..__..
POST I o--o POST II .A--A
9 18 27 36 45 54 63 72 81 90
FmrRE 18. Hesponse <lata for thE> average number of nystagmk E>ye movt>nwnts resulting from the 12-sec deceleration of fi 0 ;see'. Following <leeeleration, room lights WE're tunwd on for ;~ sec, during which time the subject fixated on a target. Symbols and markings are identkal to tlw,;e u>'ed in Figure 17.
23

I
fd ~ 40 ,..., a:: w 0..3(.
3 10 ::if! (!)
~
CONTROL GROUP
~ 0~--------~~~~-------->z w ~-10 I a..
~-2o~~~~~ww~~~ww~~ _J ~
9 18 27 36 45 54 63 72
MODERATE ALCOHOL GROUP 60
50
HIGH ALCOHOL GROUP STIMULUS: 5"/ SEC 2 DECELERATION 8-SEC LIGHT GROUP
PRE _______.
POST I o---<l
POST II ·--·
~~~~~ww~~~~~~.~o~~~~~wwwu~~~~~
9 18 27 36 45 54 63 72 81 9 18 27 36 45 54 63 72 81
TIME IN SECONDS
FIGt.'RE 19. He~ponse data for the average number of degrees of :<low phase e~·e movement resulting- from the 12-sec deeeleration of 3° ;sec'. The room lights were turned on at the start of the deceleration and remained on for 8 se<:. Symbols and markings are identical to tho.-;e use<l in Fig-ure 17.
24

I
_j
g7 0:: w 1-~6 u w (f)
I
1">5
0:: w (l_
4 (f) 1-z w ~3 w e; ~
2 w >w
u ~
~
I I I I
CONTROL GROUP
~ o~---------4+-~---4~---->z LL o_, 0:: w CD ~-2 ::J z
9 18 27 36 45 54 63 72
8
7
6
5
4
3
2
MODERATE ALCOHOL GROUP
• \
9 18 27 36 45 54 63 72
TIME IN SECONDS
8 • I I I I I I
LIGHTS ON
HIGH ALCOHOL GROUP
STIMULUS:
5•; SEC 2 DECELERATION
8-SEC LIGHT GROUP
PRE ..._.....
POST I o---o POST n ·--·
9 18 27 36 45 54 63 72 81
Fra1_·RE 20. Hei"pon><e data for the averag-e number of nystag-mic- eye movements resulting from the 12-see deeeleration of iJ 0 /see'. Hoom light~ were turned on at the start of thP deceleration and remained on for 8 sec. Symbols and markings are identic·al to those used in Figure 17.
25

I
STIMUli: SEC2 FOR 12 SEC
ACCELERATION
DECELERATION
SUBJECT CT
FIGGRE 21. A portion of the nystagmic tracings for a subject's response to the dark acceleration and to the deceleration with the ih;ee period of illumination. The stinmli w0re C'omparahle: a 12-sec acceleration and a 12-sec deceleration eaeh at the rate of 5o ;sec'. Althongh the Il~·stagmie responses are in opposite directions the response ellaraeteristil's shonlll he similar. Differencp,.; in primary or secondary nystagmus may be attributed to the effedo; of visual fixation during the intPrval of light. The clark horizontal bar indicates the period of room illumination, while the vertical bar.,; demar<'ate t!JP stimulus interval. Calibrations (15° of Pye movement) appear before ea<'h of the trials. The arrow in!lieates tile point at which the primary nystagmus ends. 'l'he effects of visual fixation are evident in the shortened primary nystagmus and the enhanced secondary nystagmus depicted in the lower set of tracings.
26

REFERENCES
1. Barany, R. : Experimentelle Alkoholintoxication. 1\IONA'l'SCHHIFT FfiH OHHE='!KEILKlil'\D}J lTND LAHYl'IGO-HHL'\OLOGlE, 4ii :DG9-9li1, 1Dl1.
2. Bekes~-. G.: ~uhjeetiw <·upulometry. AHC'HIVES OF OTOLAR¥NGOLOGY, G1 :W-28, 1D5G.
3. Bochenek, Z. and F. C. Ormerod: The inhibiton· action of certain suhstan<·es on the response to vestibular stimulation. .JOuR='!AL OF LARYl'IGOLOGY AND OTOLOGY, 7G ::lD-44, 1962.
4. Bodin, :M. A. : Some pradical notes for the analysis of po~t-rotational nystag-ImJs by determination of time constants of <leeays. Unpublished manuscript, 196().
5. Collins, W. E.: Effe<-ts of mental set upon vestibular nystagmus. .TOl'R)IAL OF EXPEHII\IENTAL PSYCHOLOGY, 6:l :1D1-1D7. 1DU2.
6. Collins, ·w. E. : :uanipulation of arousal and its effects upon human vestilmlar nystagmus induce<! by calorie irrig-ation and angular accelerations. AEHOSPAC'E }lEDICIJ'\E, 114:124-129, 1963.
7. Collins, ,V. E.: }lo<lification of ve~tilmlar nystagmus and "vertigo" h~· means of visual stimulation. THAXSAC'TIOXS OF THE A}IEHICAX ACADE}IY OI'' OPHTIIAL}IOLOGY AND OTOLAHYNGOLOGY, 72 :!)62-DTD, 1!)68.
S. Collins, W. E.: Special effects of brief periods of visual fixation on n~·sta;:mus and sensations of turning. AEHOSPACE }lEDICINE, 3D :237-266, 1968.
9. Collins, '"· E.: Task-control of arousal and the pffeds of repeated unitlire<tional angular acceleration on human vestilmlar responses. ACTA OTOLAHYXGOLOGH'A SlTJ>LE}IEXTUI\1, 190, 1!)()4.
10. DiGiunta, E. ant! D. Hosa: Hilievi nistagmografici post-rotatorii in l'Or:;;o <li intossicazione alcoolica an1ta. CLIXH 'A OTO-HIXO-LAHIXGOIATHICA (HO}IAl, 20:1'\S-10:-i, 1D68.
11. Ey, '"· : Storun;:en ties m·ulo-vestilmlaren Systems bei alcoholisiertt•n l'ersonen. BE HIGHT: DEl!TSCH OI'HTHAL}IOLOGIS( 'liE GESSELSCHAFT, ()3: :HD-:li'i3, 1DG4.
12. Forster, B.: Elektron~·stag-mog-raphische l'ntersuchungen uhr>r <len Drehhe,;chleunigungs-ny:-;tagmus naeh Alkoholga!Jen. DEl_:TS< 'HE ZEITS< 'HHH'T FFTI DIE GESAl\I'l'B GEHICII'l'LH'IIE }lEDIZIJ'\, 47 ::!~2-2~1'1. ]!);)8.
1~. GnPtlry, F. E. and L. R. Lauver: Yestilmlar reactions <luring- prolonged constant angular acceleration . . Hll'HXAL OF APPLIED l'HYSIOLOGY, ]() :215-:!:!0, 19()].
14 .. Jatho, K.: DiP Wirkung der Alkoholintoxication auf den Yestilmlaravvarant unter lJesonderer Bernd:-
27
sit'htig-ung <lPr Storungen der vestibular-okulomotorisl'IIPll Heg-elfunktion. II. }Iitteilung Ergebnisse PXI>PriinPntellr>r l'IItennichungen. ZEITSCHHIFT I-TH LAHYXGOLOGIE, HHINOLOGIE, OTOLOGIE UXD IHHE GHEXZGEBLETE, 44:103-108, 1965.
1:-i. }fanz, Hudolf: Der Einfluss g-eringer Alkoholgaben auf Teilfunktionen von Aug-e and Ohr. DEL'TSCHE ZETTS< 'IIHIFT F'CH DIE GESAMTE GJ<jTIICHTLICHE }lEDIZIN, ;{2 :301-H12, 1940.
Hl. }Iizoi, Y .. T. Ishido, ami X Ohga: Studies on postrotatory ny><tag:mus in all-ohol intoxication. .J AP AXESE .JCH'HXAL ()]" LEGAL }fED I CINE, 16:247-2GO, 1!)62.
17. Xils~on, A. aml X. G. Henriksson: '.rhe Of'ulogyral illusion-a form of rotation after-effect-and its relation to the spiral after-effe<t in repeated trials. I'SYCHOLOGil'AL HESEAHCH DULLETIX, 7:1-17, 1DG7.
18. Heason, .J. T.: Inrlivi<lual differences in motion sicknes,.; ,.,u,.;ceptihility: A further test of the "receptivity" hypothesis. HTIITISH .JOUHNAL OF PSYC'lfOLOGY, (i0:3:!1-328, 1!)6!).
19. Heason, J. '1'.: Helations between motion sickness susceptibility, the spiral after-effect anti loudness estimation. HHI'l'ISH ;JOl:Hi\'AL OF PSYCHOLOGY, 39 ::{8:-i-38:3, 1D68.
~0. Heason, .T. T. and A . .J. Benson: Individual differem·es in the reported persistence of visual and labyrinthine after-sensations, and of exponentially decaying visual all(! auditory signals. BRITISH .JOL'HXAL 0}' l'SYCIIOLOGY, 59 :1()7-172, 19()8.
21. Sehroedcr, D . .J.: Alcohol all(! Disorientation-Helated Hesponse,.;. I. Nystagmus and Vertigo During < 'aloric and Optokinetic Stimulation. FAA OA;\f report 71-G, 1 !)71.
Schulte, K. and H. Hoth: Drehuystagmus un Blutalkohol-konzentration. ZENTHALBLATT I<'UER \'EHKEl!HS-JIEDIZI?\, \'EH'.rEHHS-PSYCHOLOGIE l'XD Al'GHEXZEXDE GEBIETE (Alfred/ LPino, Germany), 11:141-144, 1DG7.
:!:{. Schweitzr>r, H.: Graphologisehe, klinische und psychologisf'IIP l'ntPrsuchtmg-en 1111ter Alkoholwirkung. ()FFEXTLH 'liE GESC\DHEITSDIENS'l' ( Stuttg:m-t l, W ::{Ul-:{72, 1DG3.
24. 'l'a><dwn, H.: Xp;tagmusprufungen zur Yerstellung der Alkoholheeintlussung-. DEliTSCIIE ZEITSCI!HIFT I·TH DIE GESAJI'l'fj GEHIC'HTLICHE }!EDIZIN, 44 :4:JH-4H7, 1D:l:i-J!);)6.
~;). 'Tas<'hC>n. It: Eine einfache Xystagn1usprobe zur l•'pstsPllun.g r!Pr Alkoholbeeintlussung-. )lEDIZINIS( 'liE }IOXATSR('HHIFT (Stuttgart), !) :23-27, ]!),iii.
I -·~