albion wastewater treatment plant study of pcbs and ... · albion wastewater treatment plant . ......
TRANSCRIPT

Albion Wastewater Treatment Plant Study of PCBs and Dieldrin in Discharge to the South Fork Palouse River
May 2017
Publication No. 17-03-007

Publication information This report is available on the Department of Ecology’s website at https://fortress.wa.gov/ecy/publications/SummaryPages/1703007.html Data for this project are available at Ecology’s Environmental Information Management (EIM) website www.ecy.wa.gov/eim/index.htm. Search Study ID RCOO0015.
The Activity Tracker Code for this study is 16-034. Contact information For more information contact: Publications Coordinator Environmental Assessment Program P.O. Box 47600, Olympia, WA 98504-7600 Phone: (360) 407-6764 Washington State Department of Ecology - www.ecy.wa.gov o Headquarters, Olympia (360) 407-6000 o Northwest Regional Office, Bellevue (425) 649-7000 o Southwest Regional Office, Olympia (360) 407-6300 o Central Regional Office, Yakima (509) 575-2490 o Eastern Regional Office, Spokane (509) 329-3400 Cover photo: Treatment ponds at the Albion Wastewater Treatment Plant.
(photo by Randy Coots)
Any use of product or firm names in this publication is for descriptive purposes only and does not imply endorsement by the author or the Department of Ecology.
Accommodation Requests: To request ADA accommodation including materials in a format
for the visually impaired, call Ecology at 360-407-6764. Persons with impaired hearing may call Washington Relay Service at 711. Persons with speech disability may call TTY at 877-833-6341.

Page 1
Albion Wastewater Treatment Plant Study of PCBs and Dieldrin
In Discharge to the South Fork Palouse River
by
Randy Coots
Toxics Studies Unit Environmental Assessment Program
Washington State Department of Ecology Olympia, Washington 98504-7710
Water Resource Inventory Area (WRIA) and 8-digit Hydrologic Unit Code (HUC) numbers for the study area: WRIA • 34 HUC number • 17060108

Page 2
This page is purposely left blank

Page 3
Table of Contents
Page
List of Figures and Tables....................................................................................................4
Abstract ................................................................................................................................5
Acknowledgements ..............................................................................................................6
Introduction ..........................................................................................................................7 Compliance Criteria .......................................................................................................7
New Toxics Human Health Criteria (HHC) ............................................................8 Study Area .....................................................................................................................8
City of Albion ..........................................................................................................8 Surrounding Area .....................................................................................................8
Historical Data ...............................................................................................................9
Methods..............................................................................................................................10 Study Overview ...........................................................................................................10
Measurement Procedures .......................................................................................10 Goals and Objectives ...................................................................................................11 Quality Assessment Overview .....................................................................................11
Quality Assurance/Quality Control........................................................................12 Sample Holding .....................................................................................................12
Results ................................................................................................................................13 Influent, Effluent, and pH ............................................................................................13 PCB Congeners ............................................................................................................13 Dieldrin ........................................................................................................................14 TSS ...............................................................................................................................14
Discussion ..........................................................................................................................15 Influent and Effluent Volume and pH .........................................................................15
Influent and Effluent ..............................................................................................15 pH ...........................................................................................................................15
Interim WLAs and Removal Efficiency ......................................................................15 PCBs and Dieldrin Interim WLAs .........................................................................15 WWTP Removal Efficiency for PCBs, Dieldrin, and TSS ...................................18
Effluent PCBs and Dieldrin Results Compared to Criteria .........................................19 Facility Design Load for TSS ......................................................................................20
Conclusions ........................................................................................................................22
Recommendations ..............................................................................................................23
References ..........................................................................................................................24
Appendices .........................................................................................................................25 Appendix A. Quality Control Results for PCBs and Dieldrin ....................................26 Appendix B. Sample Logs for PCBs, Dieldrin, and TSS ...........................................47 Appendix C. Glossary, Acronyms, and Abbreviations ...............................................49

Page 4
List of Figures and Tables Page
Figures
Figure 1. Study Area for the Albion Wastewater Treatment Plant PCB and Dieldrin Study. ...................................................................................................................9
Figure 2. tPCB Loads in Albion WWTP Effluent (g/day)................................................16 Figure 3. Dieldrin Loads in Albion WWTP Effluent (g/day) ...........................................18
Tables
Table 1. Compliance Criteria for tPCBs and Dieldrin. .......................................................7 Table 2. Parameters, Number of Samples, Reporting Limits, and Analytical Methods. ..10 Table 3. Summary of the Albion WWTP Influent, Effluent, and pH. ..............................13 Table 4. Summary Results for PCB Congeners (pg/L). ....................................................13 Table 5. Summary Results for Dieldrin (pg/L). ................................................................14 Table 6. Summary Results for Total Suspended Solids (mg/L). ......................................14 Table 7. Summary of tPCB Loads and Removal Efficiency. ...........................................16 Table 8. Albion WWTP tPCB Effluent Study Load and Reduction Needed (g/day). ......17 Table 9. Summary of Dieldrin Loads and Removal Efficiency........................................17 Table 10. Summary of TSS Loads and Removal Efficiency. ...........................................19 Table 11. Effluent PCBs and Dieldrin Results Compared to Water Quality Criteria
(pg/L). ................................................................................................................20

Page 5
Abstract Albion is a small town in an area of eastern Washington State known as “The Palouse”. In 2007, the U.S. Environmental Protection Agency (EPA) approved a Total Maximum Daily Load (TMDL) analysis for toxics in the Palouse River. As an outcome, the Albion Wastewater Treatment Plant (WWTP) discharge received a wasteload allocation (WLA) for total PCBs (tPCBs) and dieldrin. The Albion WWTP discharges treated wastewater seasonally (February through May) from two facultative lagoons to the South Fork Palouse River. Currently tPCBs and dieldrin are not required monitoring parameters on discharge monitoring reports (DMRs) for the Albion WWTP. Sampling protocols and data analysis procedures for tPCBs and dieldrin were established to meet requirements of WLAs and future National Pollutant Discharge Elimination System (NPDES) permits. During the 2016 discharge season, composite influent and effluent samples were collected over a 24-hour period on three occasions. The effluent volumes discharged during the sample periods were totaled and combined with the laboratory results for tPCBs and dieldrin to calculate daily loads released to the South Fork Palouse River. The daily loads of tPCBs and dieldrin discharged from the Albion WWTP were compared to the Interim WLAs established in the Palouse River TMDL Implementation Plan at 0.0001 g/day each. The mean daily load of tPCBs in effluent for the three sample events was 0.000175 g/day, slightly exceeding the Interim WLA, while the mean daily load of dieldrin was 0.000033 g/day, well within the Interim WLA. A 43% load reduction is needed to bring tPCB loads within Interim WLAs of 0.0001 g/day. Recommendations include: • The need for a 43% reduction in current tPCB effluent loads to meet the Interim WLA of
0.0001 g/day. • Continued periodic monitoring for tPCBs and dieldrin until these parameters are included in
Albion’s NPDES permit reporting requirements.
• Albion develop a Pollutant Elimination Plan to limit inputs and educate the public about Albion’s sewage collection system, then reassess the outcome.

Page 6
Acknowledgements The author of this report thanks the following people for their contributions to this study:
• Kenneth Smith, City of Albion Director of Public Works
• Washington State Department of Ecology staff: o Ellie Key
o Casey Deligeannis
o Dave Serdar
o Debby Sargeant
o Will Hobbs
o Dale Norton
o Diana Washington

Page 7
Introduction Albion is a small town in an area of eastern Washington State known as The Palouse. In 2007, the U.S. Environmental Protection Agency (EPA) approved a Total Maximum Daily Load (TMDL) analysis for toxic chemicals in the Palouse River. One of the outcomes of the TMDL was to establish wasteload allocations (WLAs) for total polychlorinated biphenyls (tPCBs) and dieldrin in discharge from the Albion Wastewater Treatment Plant (WWTP). The WWTP discharges treated waste seasonally (February through May) from two facultative lagoons operated in series to the South Fork Palouse River. Small communities such as Albion have limited resources for the operation and maintenance of publicly owned infrastructure such as WWTPs, water treatment systems, and collection or distribution systems. Limited resources preclude many small towns from hiring personnel to specialize and dedicate to each municipal system. City managers or Public Works officials are often called upon to be lead WWTP operators. PCBs and dieldrin are not currently required reporting parameters on discharge monitoring reports (DMRs) but are expected to be in the future. This study establishes sampling protocols and data analysis procedures for tPCBs and dieldrin to meet WLAs requirements for the TMDL study and also future NPDES permits.
Compliance Criteria Interim WLAs for the Albion WWTP discharge effluent were established for tPCBs and dieldrin in the Palouse River TMDL Implementation Plan (Johnson et al., 2007). Compliance with the WLAs is determined by comparing measured daily loads (concentration multiplied by discharge) of tPCBs and dieldrin from the Albion WWTP effluent to the Interim WLAs. Interim WLAs for tPCBs and dieldrin were developed based on criteria limits from the National Toxics Rule (NTR) for human health and the Albion WWTP maximum design flow of 0.12 million gallons per day (mgd). For informational purposes, concentrations of tPCBs and dieldrin in effluent are also compared to the NTR, the new human health criteria (HHC, see below), and the Aquatic Life Standards for water. Table 1 lists the tPCBs and dieldrin Interim WLAs, along with the NTR for human health, the HHC, and the Aquatic Life Standards for water.
Table 1. Compliance Criteria for tPCBs and Dieldrin.
Analyte National Toxics Rule
NTR Interim Wasteload Allocations1
Revised HHC2
Revised Wasteload Allocations3
Aquatic Life
Standards
tPCBs 170 pg/L4 0.0001 g/day 7 pg/L 0.000003 g/day 14,000 pg/L Dieldrin 140 pg/L 0.0001 g/day 0.07 pg/L 0.00000003 g/day 56,000 pg/L
1 = Based on the NTR human health water quality criteria for tPCBs and dieldrin and the WWTP design flow of 0.12 mgd. 2 = Federally promulgated human health criteria (HHC) for Washington State. 3 = Based on the 2016 surface water quality HHC standards for tPCBs and dieldrin and the Albion WWTP design flow of 0.12 mgd. 4 = Picograms per liter, parts per quadrillion.

Page 8
New Toxics Human Health Criteria (HHC) The Washington State Department of Ecology (Ecology) recently completed the public process for revising the human health criteria (HHC) for toxics in the Water Quality Standards (WQS) for Surface Waters of the State (Chapter 173-201A WAC). These criteria underwent review by the EPA for consistency with the federal Clean Water Act. Under their authority for implementing the Clean Water Act, EPA partially approved and disapproved Ecology’s proposed HHC. For the proposed HHC that did not meet federal regulations, the EPA promulgated their own numeric criteria in State’s rule revision. A total of 192 new HHC for 97 priority pollutants were addressed in the recent WQS update including this study’s target parameters, tPCBs and dieldrin. Implementation of the new toxic criteria updates started in late December 2016. The Interim tPCBs and dieldrin WLAs established in the Palouse River TMDL Implementation Plan (Johnson et al., 2007) will be used as the TMDL loading criteria for the Albion WWTP discharge. Ecology will not be revisiting active TMDL projects where there were established WLAs in effect before updates of the toxics criteria. Table 1 presents the original Interim WLAs based on the NTR and, for informational purposes, the WLAs calculated from the recent HHC revision. The NTR criteria and the new Clean Water Act HHC for tPCBs and dieldrin are also shown. The WLAs based on the new HHC are lower (more restrictive) than those calculated for the NTR. The new HHC for tPCBs is about 24 times, and dieldrin about 2000 times, lower (more restrictive) than the NTR-based criteria.
Study Area City of Albion Albion is roughly 10 miles from the Idaho border and is situated along the South Fork of the Palouse River. Based on the 2010 census, Albion has a population of 579 within its 0.36 square mile of land. See Figure 1. Settled in the late 1800s Albion was incorporated in 1910. At an elevation of 2,398 feet, Albion has warm and dry summers, or what is referred to as a Mediterranean-like climate. The mean July high is 82°F, while the mean January low is 24°F. Albion receives about 21 inches of rainfall and 35 inches of snowfall per year (Intellicast, 2015). Surrounding Area The Palouse region is located in southeastern Washington and northern Idaho. The region is a major agricultural area primarily known for dry land farming of wheat and legumes. The Palouse is often characterized by its rolling hills and deep productive soils. The nearest cities to Albion are Pullman about three miles to the southeast, Colfax about seven miles to the northwest, and Palouse about ten miles to the northeast. Distances from Albion to major eastern Washington cities are Spokane at about 55 miles to the north and Walla Walla about 67 miles to the southwest.

Page 9
Figure 1. Study Area for the Albion Wastewater Treatment Plant PCB and Dieldrin Study.
Historical Data Only one set of PCB or dieldrin data exist for conducting a toxics loading assessment for the Albion WWTP. In 2007-2008 in support of the Palouse River TMDL Implementation Plan (Johnson et al., 2007), Ecology conducted a toxics study in the South Fork Palouse River sub-basin that included three WWTPs and two abandoned landfills (Lubliner, 2009). The study included PCB and dieldrin monitoring of influent and effluent at Albion’s WWTP. Based on one set of PCB and dieldrin samples collected in April 2008, Albion’s WWTP process reduced PCB-influent-to-effluent concentrations by an order of magnitude. Freezing spring temperatures delayed the onset of effluent discharge, reducing three planned sample events to one. While dieldrin concentrations met criteria at discharge measuring <30 pg/L (NTR= 140 pg/L), tPCBs exceeded the NTR. The tPCBs were measured at 1800 pg/L, roughly an order of magnitude greater than the NTR of 170 pg/L. An 85% reduction of tPCBs in the effluent discharge was recommended to meet Interim WLAs. The study also recommended additional effluent sampling for PCBs and dieldrin be conducted at the Albion WWTP to determine if the 2008 study’s single set of results is representative of current 24-hour composite conditions throughout the discharge season.

Page 10
Methods
Study Overview At the request of Ecology’s Water Quality Program, Eastern Regional Office, Ecology’s Environmental Assessment Program conducted a PCB and dieldrin influent/effluent study at the Albion WWTP during 2016. The South Fork Palouse River is the receiving water for the discharge. The Palouse River Toxics TMDL Implementation Plan (Johnson et al., 2007) established Interim WLAs for permitted discharges in the drainage. The Albion WWTP received Interim WLAs for tPCBs and dieldrin of 0.0001 g/day each. The follow-up survey to the TMDL Implementation Plan conducted in 2007-2008 (Lubliner, 2009) reported results for one set of samples analyzed for PCBs and dieldrin. The dieldrin levels were within both the Interim WLA and the NTR criterion, while tPCBs were an order of magnitude greater (exceeded). An 85% reduction of tPCBs was recommended to bring the daily loads within the Interim WLA. The WLAs were based on the NTR criteria for PCBs (170 pg/L) and dieldrin (140 pg/L) in water and the Albion WWTP design flow of 0.12 mgd. During the 2016 discharge season, tPCBs and dieldrin were sampled on three occasions. Daily loads of tPCBs and dieldrin were compared to the Interim WLA to determine compliance with the Palouse River TMDL. Sample concentrations were also compared to the NTR human health criteria and Aquatic Life Standards for informational purposes. Measurement Procedures The analytical parameters, sample numbers, reporting limits, and analytical methods used for the 2016 study are presented in Table 2. Method selection was based on study objectives and the analytical reporting limits possible.
Table 2. Parameters, Number of Samples, Reporting Limits, and Analytical Methods.
Parameter Sample Number
Reporting Limits
Sample Clean-up and Extraction Methods
Analytical Method
PCB Congeners 9 10 pg/L1,2 EPA 3535 EPA 1668C
Dieldrin 9 30 pg/L 13C labeled dieldrin EPA 1699
TSS 9 1 mg/L3 SM 2540D4
1 = PCBs reporting limits are congener specific. 2 = pg/L is parts per quadrillion. 3 = mg/L is parts per million. 4 = Standard Methods. TSS = total suspended solids.

Page 11
Field Measurement The pH was measured in the field using a hand-held HACH HQ40D pH meter. Calibration of the meter using standard pH buffers 4, 7, and 10 was conducted just prior to use. The pH measurements were only taken from effluent at the same discharge location as the toxic samples. The pH measurements were made during the first and last subsamples of the composite collection period for each of the three sample events.
Goals and Objectives The goal of the study was to determine whether Interim WLAs set forth in the Palouse River TMDL are being met for the Albion WWTP discharge. Study objectives are listed below:
• Collected 24-hour composite influent and effluent samples from the Albion WWTP on three occasions during the discharge season and analyze for PCB congeners and dieldrin.
• Determined total daily loads for PCBs and dieldrin discharged to the South Fork Palouse River from the Albion WWTP and compare to Interim WLAs established in the Palouse River TMDL Implementation Plan.
• Compared effluent results for tPCBs and dieldrin to human health and Aquatic Life Standards for informational purposes.
Quality Assessment Overview In addition to the quality assessment of study data, summary results are presented below in the Results Section. The studies laboratory data quality results are in Appendix A, Tables A-1 through A-12. Data sets like PCB congeners can have large numbers of non-detected or qualified results. PCB data sets require decisions about how sample totals are determined. For this study, tPCBs included all detected congeners per sample and any “J” (estimated concentration, positively identified) qualified results at full value. Results qualified as “NJ” (approximate concentration, tentatively identified) were not included in concentration totals or means. If no other detected results other than “NJ” are available for a sample or study mean then one-half the “NJ” result was used. “Non-detected” PCB values (“U” and “UJ”) were excluded. All detected and “J” qualified PCB congeners within each homolog group were totaled. The 10 possible homolog groups per sample with at least one detected congener are then summed for a tPCB sample concentration. All laboratory results for the study are included in Ecology’s Environmental Information Management (EIM) database. Public access to electronic data and the final report for the study is available through Ecology’s Internet homepage (www.ecy.wa.gov).

Page 12
Quality Assurance/Quality Control Results were reviewed for qualitative and quantitative accuracy following the National Functional Guidelines for Organic Data Review under the Contract Laboratory Program (CLP). Written case narratives assessing the quality of the data reports are provided by Ecology’s Manchester Environmental Laboratory (MEL). These narratives included descriptions of the analytical methods, a review of sample holding times, instrument calibration checks, blank results, surrogate recoveries, matrix spike recoveries, and laboratory control samples. The case narratives and complete data reports can be obtained by request from the report author. The quality assurance (QA) review verified laboratory performance met most quality control (QC) specifications outlined in the analytical methods. The quality of the data reported here is appropriate for the intended uses. To verify results generated for the study were of the quality needed, control sample results were compared to data quality objectives established in the QA Project Plan (Ecology, 2016). QC results are included in Appendix A. QC results for PCB analyses included labeled PCB spikes, laboratory blanks, labeled PCB spiked blanks, ongoing precision and recovery (OPR) spikes, and OPR labeled spikes. QC results for dieldrin analyses included laboratory blanks, spiked blanks, OPR blanks, and OPR labeled blanks. For the May sample event, one of the two tPCB duplicate samples (Effl-QA-03, 1605010-03) was rejected as an outlier. The outlier result (2962 pg/L) was over four times the duplicate sample value (698 pg/L) and over seven times the next highest effluent tPCB sample result. The May tPCB sample pair had a relative percent difference (RPD) of 124%. It was likely impacted by discharge of solids with higher PCB concentrations at the end of the discharge season. The February and March tPCB duplicate pairs had RPDs of 68% and 1.5%, respectively. Sample Holding PCBs and dieldrin samples were shipped by FedEx, directly to AXYS Analytical Services the contract laboratory in Sydney, British Columbia. The samples were collected in laboratory-provided sample bottles and coolers containing blue-ice. All study samples were maintained under chain-of-custody from the time of collection throughout the analytical process. Preparation and analysis of all samples was completed within method holding-time limits. TSS samples were maintained on wet ice throughout the sample period and driven to Ecology Headquarters in Lacey. The Ecology currier transported the cooler containing the TSS samples the following morning to MEL for analysis. Preparation and analysis of all samples was completed within method holding-time limits.

Page 13
Results On February 9, March 22, and May 3, during the 2016 discharge season, the influent and effluent were sampled at the Albion WWTP for PCBs, dieldrin, and TSS. The samples were 24-hour composites made-up of eight subsamples collected about every three hours over each of the three sample days. Sample logs with information on sample times, volumes, and collection locations for the composite samples are in Appendix B, Table B-1.
Influent, Effluent, and pH The Chief Operator of the Albion WWTP provided the 24-hour totals of influent and effluent volumes over the sample collection periods. The volume of influent to the plant was determined by totaling run times for the influent wet well pump over the composite sample periods. The influent pumps have a known pumping volume per unit of time. The effluent discharge in gallons per day was taken from the WWTP’s flow totalizer. The pH was measured at the effluent v-notched weir only. Table 3. Summary of the Albion WWTP Influent, Effluent, and pH.
Sample Source
Sample Dates
Influent (gal/day)
Effluent (gal/day)
pH Sample (Time)
pH (Units)
Influent Effluent 2/9/2016
65,938 -
- 120,000
0025 8.20 2125 9.02
Influent Effluent 3/22/2016
85,924 -
- 107,600
0011 9.09 2120 9.09
Influent Effluent 5/3/2016
74,182 -
- 78,723
0020 9.35 2115 9.41
Bold = Visual aid for effluent results.
PCB Congeners
PCBs were analyzed by the congener method EPA 1668C HRGC/HRMS. Table 4 shows summary results for influent and effluent tPCB samples analyzed for the Albion WWTP study. Table 4. Summary Results for PCB Congeners (pg/L).
Sample Source
Sample Number
Sample Date
Infl/Effl PCBs
Infl/Effl PCBs Study Mean
Influent 1602009-01
2/9/2016
4527
5021
454 J
Effluent 1602009-02
267 J 1602009-03
Influent 1603015-01 3/22/2016
1434
Effluent 1603015-02
396 J 1603015-03
Influent 1605010-01 5/3/2016
9102
Effluent 1605010-02 698 J

Page 14
Dieldrin Dieldrin samples were analyzed by EPA method 1699 HRGC/HRMS. Table 5 shows summary results for influent and effluent dieldrin samples analyzed for the Albion WWTP study. Table 5. Summary Results for Dieldrin (pg/L).
Sample Source
Sample Number
Sample Date
Infl/Effl Dieldrin
Infl/Effl Dieldrin Study Mean
Influent 1602009-01 2/9/2016
768 J
429 J
85.4 J
Effluent 1602009-02 82.1 J 1602009-03
Influent 1603015-01 3/22/2016
207 J
Effluent 1603015-02 116 NJ* 1603015-03
Influent 1605010-01 5/3/2016
311 J
Effluent 1605010-02 116 J 1605010-03
* One half the reported “NJ” value for the March Effluent was used.
TSS TSS samples were analyzed by Standards Methods 2540D. Table 6 shows summary results for influent and effluent TSS samples analyzed for the Albion WWTP study. Table 6. Summary Results for Total Suspended Solids (mg/L).
Sample Source
Sample Number
Sample Date
Infl/Effl TSS
Infl/Effl TSS Study Mean
Influent 1602009-01 2/9/2016
74
101
66
Effluent 1602009-02 46 1602009-03
Influent 1603015-01 3/22/2016
37
Effluent 1603015-02 74 1603015-03
Influent 1605010-01 5/3/2016
192
Effluent 1605010-02 78 1605010-03

Page 15
Discussion
Influent and Effluent Volume and pH Influent and Effluent During the three 24-hour sample events, the influent volume was determined by totaling the wet well pump run times over the composite sample periods. The influent pumps have a known pumping volume per unit of time. The effluent discharge volume over the 24-hour sample collection periods was determined by the WWTP flow totalizer measured at the effluent v-notched weir. Influent and effluent sample period volumes in gallons per day were provided by the Chief Operator of the Albion WWTP. The influent and effluent volumes are shown in Table 7. Discharge volumes for the study were within permitted design flows for the WWTP, ranging from 120,000 down to 78,723 gal/day. As a result of effluent flows and tPCB concentrations, the WWTP must reduce effluent tPCB concentrations to meet interim wasteload allocations (WLAs) of 0.0001 g/day. pH Over the study period, the pH slightly increased from the first sample event to the last (Table 3). During the first sample event, the pH was within NPDES discharge limits of equal to or greater than pH 6.0 and less than or equal to 9.0 pH standard units (Ecology, 2010). For the last two events, March was slightly greater than the NPDES discharge limits and May was up to 0.41 pH units over discharge limits. The first and last sample events were during bright sunny days, while the second event was overcast. The warmer sunny sample day in May likely increased algal use of carbon dioxide which can raise the pH (SRAC, 2008).
Interim WLAs and Removal Efficiency PCBs and Dieldrin Interim WLAs Interim WLAs were established in the Palouse River TMDL Implementation Plan (Johnson et al., 2007) at 0.0001 g/day for tPCBs. The WLAs were based on the WWTP’s design effluent maximum discharge (0.12 mgd) and the NTR human health tPCB criterion (170 pg/L). Table 7 shows the sample day tPCB concentrations and loads along with study means. PCB concentrations and loads showed an inverse relationship with discharge volume. Through the discharge season, PCB concentrations and loads increased from just above the interim WLA while effluent volume decreased. The tPCB Interim WLA target of 0.0001 g/day discharged was slightly exceeded through the study. The tPCB loads ranged from 0.000121 to 0.000208 g/day, with a study mean of 0.000175. The measured study loads ranged from about 20% greater to about two times the target Interim WLA. Figure 2 shows the effluent tPCB loads in g/day discharged for each of the three sample events and the Interim WLA.

Page 16
Table 7. Summary of tPCB Loads and Removal Efficiency.
Sample Source
Sample Date
Infl/Effl (gal/day)
tPCBs (pg/L)
tPCB Load (g/day)
tPCB % Removal
Influent 2/9/2016 65,938 4527 0.00113 Effluent 120,000 267 J 0.000121 89 Influent 3/22/2016 85,924 1434 0.000466 Effluent 107,600 396 J 0.000161 65 Influent 5/3/2016 74,182 9102 0.00256 Effluent 78,723 698 J 0.000208 92 Influent Study Mean 75,348 5021 0.00143 Effluent Study Mean 102,108 454 J 0.000175 88
Bold = Visual aid to effluent information.
Figure 2. tPCB Loads in Albion WWTP Effluent (g/day).
0.000121 0.000161
0.000208
0
0.00005
0.0001
0.00015
0.0002
0.00025
2/1/2016 3/1/2016 4/1/2016 5/1/2016
Efflu
ent t
PCB
Load
s, g
/day
0.0001 g/day tPCBs Interim WLA

Page 17
To compare the allowable loads to current loads, and quantify the percent reduction needed to meet the tPCB Interim WLA, current study loads were calculated as the mean study tPCB concentration combined with the mean effluent quantity discharged for the three sample events. Table 8 presents current tPCB loads, the allowable loads to meet the Interim WLA, the needed load reduction, and the percent of current load reduction needed to meet the Interim WLA.
Table 8. Albion WWTP tPCB Effluent Study Load and Reduction Needed (g/day).
Sample Source
Current tPCB Load
Interim tPCB WLA
Needed Load Reduction
Needed Percent
Reduction
Effluent 0.000175 0.0001 0.000075 43
Based on mean study flow for the 2016 discharge season sample events and the tPCBs Interim WLA at 0.0001 g/day, a 43% reduction is needed in tPCB loads through the discharge season to meet the Interim WLA. The percent reduction calculation is shown below:
tPCB Reduction = [(0.000175 g/day – 0.0001 g/day) / (0.000175 g/day)] x 100 = 43% The dieldrin Interim WLA target was established in the Palouse River TMDL Implementation Plan (Johnson et al., 2007) at 0.0001 g/day. The WLA was based on the WWTP’s design maximum discharge (0.12 mgd) and the dieldrin NTR human health criterion (140 pg/L). Table 9 shows the sample day dieldrin concentrations and loads, along with the study mean.
Table 9. Summary of Dieldrin Loads and Removal Efficiency.
Sample Source
Sample Date
Infl/Effl (gal/day)
Dieldrin (pg/L)
Dieldrin Load (g/day)
Dieldrin % Removal
Influent 2/9/2016 65,938 768 J 0.000192 Effluent 120,000 82.1 J 0.000037 81 Influent
3/22/2016 85,924 207 J 0.000067
Effluent 107,600 116 NJ1 0.000024 64 Influent 5/3/2016 74,182 311 J 0.000087 Effluent 78,723 116 J 0.000035 60 Influent Study Mean 75,348 429 J 0.000122 Effluent Study Mean 102,108 85.4 J 0.000033 73
1 = Used one-half the NJ value (58 NJ) in Loading and % Removal Dieldrin Calculations.

Page 18
Generally, dieldrin concentrations and loads were lower than those reported for tPCBs. Dieldrin did not show the same discharge-season increasing trend like the tPCB concentrations and loads did. With the effluent volume decreasing through the discharge season, dieldrin concentrations increased but loads did not. Figure 3 shows the effluent dieldrin loads in g/day discharged for each of the three sample events and the Interim WLA. Dieldrin results show Albion WWTP was consistently meeting the Interim WLA target of 0.0001 g/day through the 2016 discharge season. Based on the dieldrin Interim WLA target from the Palouse River TMDL Implementation Plan (Johnson et al., 2007), no load reductions are currently needed.
Figure 3. Dieldrin Loads in Albion WWTP Effluent (g/day)
WWTP Removal Efficiency for PCBs, Dieldrin, and TSS The Albion WWTP removal efficiencies were determined as the percentage of the influent’s contaminant load removed from the discharged effluent load. Based on measured tPCB loads, the data show generally good treatment efficiencies through the 2016 study. For tPCBs, only the March sample event was below an 80% removal threshold. Removal efficiencies ranged from 65% to 92%, with an 88% mean for the study. Table 7 shows the Albion WWTP loads and removal efficiency for tPCBs. Figure 2 graphically presents the tPCB load results along with the Interim WLA. Treatment removal efficiencies for dieldrin were generally good, decreasing through the study from 81% down to 60%. While the WWTP is meeting the dieldrin Interim WLA target of less than 0.0001 g/day discharged, the removal efficiency is slightly low with a study mean of 73%. Table 9 shows the WWTP percent removal efficiencies for dieldrin through the study. Figure 3 graphically presents the study load results and the dieldrin Interim WLA.
0.000037
0.000024
0.000035
0
0.00002
0.00004
0.00006
0.00008
0.0001
0.00012
2/1/2016 3/1/2016 4/1/2016 5/1/2016
Efflu
ent D
ield
rin Lo
ads,
g/d
ay
0.0001 g/day Dieldrin Interim WLA

Page 19
TSS is a required reporting parameter for the Albion NPDES permit. Currently the permit is under Interim Effluent Limitations with TSS limits based on a weekly mean not to exceed 65 mg/L and 63 lbs/day. The Albion WWTP Interim Effluent Limitations require TSS treatment efficiencies meet an 80% removal based on a monthly mean. The Albion WWTP treatment removal efficiency for TSS during the three sample events and the study mean are shown in Table 10, along with sample day influent and effluent TSS loads in lbs/day.
Table 10. Summary of TSS Loads and Removal Efficiency.
Sample Source
Sample Date
Infl/Effl (gal/day)
TSS (mg/L)
TSS Load (lbs/day)
TSS % Removal
Influent 2/9/2016 65,938 74 40.7 Effluent 120,000 46 46.0 0% Influent 3/22/2016 85,924 37 26.5 Effluent 107,600 74 66.4 0% Influent 5/3/2016 74,182 192 119 Effluent 78,723 78 51.2 57% Influent Study Mean 75,348 101 63.5 Effluent Study Mean 102,108 66 56.2 12%
TSS levels can be a problem in facultative lagoon systems. Algal concentrations and design of the discharge structure can impact levels of TSS discharged. The EPA reports commonly achieved effluent levels of TSS from facultative lagoons may range from 30 – 150 mg/L (EPA, 2011). The study data show TSS removal efficiency for the facultative system did not meet an 80% removal rate for any of the three 24-hour composite samples. Only the March TSS loading results (66.4 lbs/day) exceeded the 63 lbs/day weekly TSS Interim Effluent Limitation by about 5%, while the study mean was about 7 lbs/day under the TSS Interim Effluent Limitation.
Effluent PCBs and Dieldrin Results Compared to Criteria Effluent tPCBs and dieldrin results were compared to available ambient water quality criteria for informational purposes. While tPCBs and dieldrin are not currently required monitoring parameters for the Albion WWTP’s NPDES permit (No. WA-002260-8), they may be in the future. Influent flow to the WWTP has some design criteria based on flow, BOD, and TSS, but no toxic design criteria. The Albion WWTP effluent concentrations of tPCBs and dieldrin were determined by analysis of three 24-hour composite samples collected on February 9, March 22, and May 3 of 2016. The tPCBs and dieldrin discharged during the three sample periods are compared in Table 11 to the NTR criteria, the HHC, and the Aquatic Life Standard for each sample event and the study mean.

Page 20
Table 11. Effluent PCBs and Dieldrin Results Compared to Water Quality Criteria (pg/L).
Sample Source
Sample Date tPCBs
tPCBs Study Mean Dieldrin
Dieldrin Study Mean
Effluent 2/9/2016 267 J 454 J
82.1 J 85.4 J Effluent 3/22/2016 396 J 116 NJ1
Effluent 5/3/2016 698 J 116 J National Toxics Rule (NTR) 170 140
New PCBs Toxics Criterion (HHC) 7 0.07 Aquatic Life Standard 14,000 56,000
1 = Used one-half the NJ value (58 NJ) in the study mean calculation.
Over the discharge season, tPCB concentrations increased (Table 11) as the discharge decreased (Table 10). Compared to the NTR criterion for tPCBs, the effluent concentration increased from about 1.5 times the NTR to about 4 times over the study period, with a study mean effluent concentration of about 2.7 times the NTR criterion. The new HHC is much lower (more restrictive) than the NTR criteria. The effluent tPCBs never approached the Aquatic Life Standard. Dieldrin concentrations for the three individual sample events and the study mean were all below the NTR criterion of 140 pg/L. Dieldrin results for the study ranged from 82 to 116 pg/L and had a study mean of 85.4 pg/L. While dieldrin results were within the NTR criterion, they would exceed the new and lower HHC criterion. The effluent dieldrin concentrations never approached the Aquatic Life Standard.
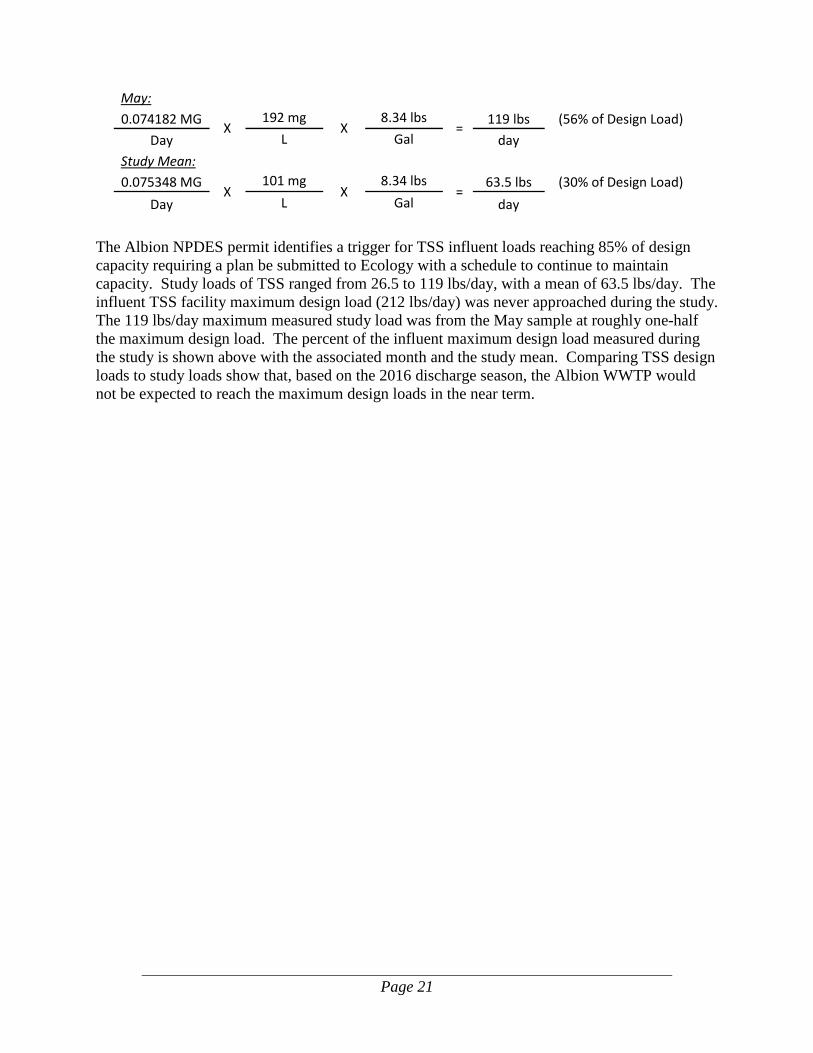
Facility Design Load for TSS Albion’s NPDES permit includes design criteria for influent TSS loads that should not be exceeded. These criteria ensure the WWTP is built to accommodate the wastewater treatment needs and expected future growth. The Albion WWTP’s maximum design quantity for influent TSS loads is 212 lbs/day. The formula below shows the most current loads of influent TSS measured through the 2016 discharge season at the Albion WWTP during the three 24-hour composite sample events for the study. The formula used for determining TSS loads in units of lbs/day is: (Flow in MGD) X (Concentration in mg/L) X (lbs/Gallon) = lbs/day
February:
0.065938 MG X 74 mg
X 8.34 lbs
= 40.7 lbs (19% of Design Load)
Day L Gal day
March: 0.085924 MG X
37 mg X
8.34 lbs =
26.5 lbs (13% of Design Load) Day L Gal day
Page 21
May: 0.074182 MG X
192 mg X
8.34 lbs = 119 lbs (56% of Design Load)
Day L Gal day Study Mean: 0.075348 MG
X 101 mg
X 8.34 lbs
= 63.5 lbs (30% of Design Load)
Day L Gal day The Albion NPDES permit identifies a trigger for TSS influent loads reaching 85% of design capacity requiring a plan be submitted to Ecology with a schedule to continue to maintain capacity. Study loads of TSS ranged from 26.5 to 119 lbs/day, with a mean of 63.5 lbs/day. The influent TSS facility maximum design load (212 lbs/day) was never approached during the study. The 119 lbs/day maximum measured study load was from the May sample at roughly one-half the maximum design load. The percent of the influent maximum design load measured during the study is shown above with the associated month and the study mean. Comparing TSS design loads to study loads show that, based on the 2016 discharge season, the Albion WWTP would not be expected to reach the maximum design loads in the near term.

Page 22
Conclusions Results of this 2016 study support the following conclusions:
• Effluent tPCB concentrations increased through the 2016 discharge season from 267 to 698 pg/L, with a study mean of 454 pg/L. The Interim tPCB wasteload allocation (WLA) target of 0.0001 g/day was slightly exceeded through the study. Study loads ranged from 0.000121 to 0.000208 g/day, with a mean of 0.000175 g/day. An effluent load reduction of 43% in current tPCB loads is needed to meet the Interim WLA of 0.0001 g/day.
• The tPCB trend over the discharge period showed concentrations and loads had an inverse relationship with effluent volume. While the effluent decreased through the discharge season, tPCBs increased in concentration and loads.
• tPCBs removal efficiency for the Albion WWTP was generally good at 88%. One of the three sample events showed removal efficiency below an 80% threshold.
• Effluent dieldrin concentrations increased from the first 2016 sample event to the last, ranging from 82.1 to 116 pg/L, with a mean of 85.4 pg/L. Dieldrin is consistently below the National Toxics Rule (NTR) human health criterion and considered to be meeting the Interim WLA target of 0.0001 g/day through the 2016 discharge season. Based on the Interim WLA target from the Palouse River TMDL Implementation Plan (Johnson et al., 2007), no dieldrin load reduction would currently be required.
• While dieldrin removal efficiencies at Albion’s WWTP were slightly low with a study mean of 73%, Interim WLAs of 0.0001 g/day were consistently met at discharge.
• Dieldrin did not show an increasing trend over the discharge period like the PCBs did. While the effluent decreased through the discharge season, dieldrin increased in concentration but not load.
• Total suspended solids (TSS) did not meet the 80% removal rate at discharge through the study. One of three study samples exceeded the weekly TSS Interim Effluent Limitations (63 lbs/day) by roughly 5%, while the study mean was about 7 lbs/day less than the TSS Average Weekly Interim Effluent Limitations.
• pH increased from within NPDES limits (>6.0 - <9.0) during the first sample event to greater than pH 9.0 during the last. Facultative ponds are known to have issues in warmer environments that can affect pH. Use of carbon dioxide by algal communities can raise the pH.
• The Albion WWTP design load maximums for TSS in influent were never approached. The May sample had the largest TSS load at roughly one-half the maximum design load, while the study mean was about 30% of maximum design load.

Page 23
Recommendations Results of this 2016 study support the following recommendations:
• The Albion WWTP will need a 43% reduction in tPCB effluent loads to meet the Interim WLA of 0.0001 g/day.
• tPCB and dieldrin influent and effluent loads from the Albion WWTP should be monitored periodically. Frequency of sampling should be at least every five years or following any WWTP upgrades or changes in the system, such as sludge removal, until these toxic chemicals are incorporated into the Albion NPDES permit. Samples to determine tPCBs and dieldrin effluent loads should be collected to represent the discharge period.
• Albion should develop a Pollutant Elimination Plan to limit inputs and educate the public about Albion’s sewage collection system, then reassess the outcome.
• Periodic cleaning of the sewage collection system should be considered. If the Albion WWTP has a sludge removal program for the treatment ponds, cleaning the sewage collection system should be timed for the best coordination between the two.

Page 24
References Ecology, 2016. Quality Assurance Project Plan: Albion Wastewater Treatment Plant Discharge of PCBs and Dieldrin to the South Fork Palouse River. Washington State Department of Ecology, Olympia, WA, Publication No. 16-03-102. 45 pages. https://fortress.wa.gov/ecy/publications/SummaryPages/1603102.html Ecology, 2010. National Pollutant Discharge Elimination System Waste Discharge Permit No. WA-002260-8 for Albion Washington. Washington State Department of Ecology, Spokane, WA. 23 pages. EPA, 2011. Principles of Design and Operations of Wastewater Treatment Pond Systems for Plant Operators, Engineers, and Managers. United States Environmental Protection Agency Office of Research and Development. EPA/600/R-11/088, August 2011. 457 pages. https://www.epa.gov/sites/production/files/2014-09/documents/lagoon-pond-treatment-2011.pdf Intellicast, 2015. Web access to Albion, Washington’s monthly averages for temperature and precipitation. Accessed the site on 9/3/2015. http://www.intellicast.com/Local/History.aspx?location=USWA0006 Johnson, A., E. Snouwaert, K. Kinney, and B. Era-Miller, 2007. Palouse River Chlorinated Pesticide and PCB Total Maximum Daily Load: Water Quality Improvement Report and Implementation Plan. Washington State Department of Ecology, Olympia, WA. Publication No. 07-03-018. https://fortress.wa.gov/ecy/publications/SummaryPages/0703018.html Lubliner, B., 2009. Palouse River Watershed PCB and Dieldrin Monitoring, 2007-2008, Wastewater Treatment Plants and Abandoned Landfills. Washington State Department of Ecology, Olympia, WA. Publication No. 09-03-004. https://fortress.wa.gov/ecy/publications/SummaryPages/0903004.html SRAC, 2008. Managing High pH in Freshwater Ponds. Southern Regional Aquaculture Center, SRAC Fact Sheet Publication No. 4604, USDA, Cooperative State Research, Education, and Extension Service. http://www2.ca.uky.edu/wkrec/high-ph-ponds.pdf

Page 25
Appendices

Page 26
Appendix A. Quality Control Results for PCBs and Dieldrin Table A-1. Labeled PCB Spike Samples Collected February 9, 2016 (% Recovery).
Sample Type Analyte Alb-Infl 01
1602009-01 Alb-Effl 02
1602009-02 Effl-QA 03
1602009-03 Labeled Spike PCB-001L 52.4 44.9 38.9 Labeled Spike PCB-003L 57.1 51.8 46.2 Labeled Spike PCB-004L 59 50.1 46 Labeled Spike PCB-015L 64.6 61.4 56.2 Labeled Spike PCB-019L 55.3 46.1 42.6 Labeled Spike PCB-028L 84.4 86.1 80.3 Labeled Spike PCB-037L 77.2 65.6 61.9 Labeled Spike PCB-054L 69 50.9 48.7 Labeled Spike PCB-077L 78.3 59.6 59.1 Labeled Spike PCB-081L 78.2 57.9 57.1 Labeled Spike PCB-104L 52.4 39.7 39.4 Labeled Spike PCB-105L 76.4 59.7 62.3 Labeled Spike PCB-111L 75.3 75.8 74.9 Labeled Spike PCB-114L 67.6 52 54.4 Labeled Spike PCB-118L 68.6 52.8 55.5 Labeled Spike PCB-123L 67.2 53.4 56.6 Labeled Spike PCB-126L 66.7 49.1 54.4 Labeled Spike PCB-155L 46.2 50 47.3 Labeled Spike PCB-156L/157L 49.6 47.5 47.9 Labeled Spike PCB-167L 45.8 46.3 45.9 Labeled Spike PCB-169L 48.9 43 44.6 Labeled Spike PCB-170L 54.9 50.3 55.3 Labeled Spike PCB-178L 55.2 68.8 57.7 Labeled Spike PCB-180L 53.2 48.1 53.2 Labeled Spike PCB-188L 50.6 44 54.9 Labeled Spike PCB-189L 63.8 50.1 63.5 Labeled Spike PCB-202L 32.9 36.9 47.9 Labeled Spike PCB-205L 59.3 54.2 58.2 Labeled Spike PCB-206L 48.4 43.7 47.2 Labeled Spike PCB-208L 47.3 43.1 50.8 Labeled Spike PCB-209L 39.8 41.5 44.6

Page 27
Table A-2. Labeled PCB Spike Samples Collected March 22, 2016 (% Recovery).
Sample Type Analyte Alb-Infl 01
1603015-01 Alb-Effl 02
1603015-02 Effl-QA 03
1603015-03 Labeled Spike PCB-001L 42.6 36.4 35.9 Labeled Spike PCB-003L 47.6 42.3 38.1 Labeled Spike PCB-004L 51.2 42.1 40.7 Labeled Spike PCB-015L 64.6 52.4 50.8 Labeled Spike PCB-019L 61.9 46.2 46.9 Labeled Spike PCB-028L 75.3 68.7 67.7 Labeled Spike PCB-037L 70.2 49.1 50 Labeled Spike PCB-054L 58.5 38.6 39.5 Labeled Spike PCB-077L 87.5 51.2 55.6 Labeled Spike PCB-081L 85.4 49.3 54.3 Labeled Spike PCB-104L 63.3 32 37 Labeled Spike PCB-105L 82.9 42.7 51.6 Labeled Spike PCB-111L 80.2 77.5 76.4 Labeled Spike PCB-114L 80.1 40.8 49.9 Labeled Spike PCB-118L 80.3 40.3 48.4 Labeled Spike PCB-123L 78.7 39.6 47.2 Labeled Spike PCB-126L 80.5 43.3 52.9 Labeled Spike PCB-155L 63 29.3 39.4 Labeled Spike PCB-156L/157L 71.4 34.1 45.5 Labeled Spike PCB-167L 72 34 45 Labeled Spike PCB-169L 72.8 36.4 49.7 Labeled Spike PCB-170L 68.6 33.5 46.5 Labeled Spike PCB-178L 84.1 81 82.7 Labeled Spike PCB-180L 71.9 33.7 47.2 Labeled Spike PCB-188L 52.8 24.8 35.3 Labeled Spike PCB-189L 67.4 31.8 44.3 Labeled Spike PCB-202L 52.6 24.4 35.6 Labeled Spike PCB-205L 65 29.9 43.2 Labeled Spike PCB-206L 60.1 27.1 41.2 Labeled Spike PCB-208L 56.3 26.7 39.3 Labeled Spike PCB-209L 60.2 27.8 43.3

Page 28
Table A-3. Labeled PCB Spike Samples Collected May 3, 2016 (% Recovery).
Sample Type Analyte Alb-Infl 01
1605010-01 Alb-Effl 02
1605010-02 Effl-QA 03
1605010-03 Labeled Spike PCB-001L 34.5 25.8 27 Labeled Spike PCB-003L 38.1 30.3 30.4 Labeled Spike PCB-004L 40.3 29.9 30.4 Labeled Spike PCB-015L 49.5 34.7 35.6 Labeled Spike PCB-019L 43.5 29.8 31 Labeled Spike PCB-028L 64.6 62 51.3 Labeled Spike PCB-037L 50.4 34.6 37.1 Labeled Spike PCB-054L 41.1 27.5 28.5 Labeled Spike PCB-077L 46.6 38 38.8 Labeled Spike PCB-081L 47.5 37 38.1 Labeled Spike PCB-104L 39.7 29.8 29.7 Labeled Spike PCB-105L 37.8 32.9 33.9 Labeled Spike PCB-111L 70.5 78.5 68.5 Labeled Spike PCB-114L 35.9 30.7 31.9 Labeled Spike PCB-118L 36.6 31 32.4 Labeled Spike PCB-123L 36.6 31.6 32.5 Labeled Spike PCB-126L 41.5 38.5 36.5 Labeled Spike PCB-155L 48.9 33.5 32.9 Labeled Spike PCB-156L/157L 39.6 32.2 32.5 Labeled Spike PCB-167L 37 30.6 30.4 Labeled Spike PCB-169L 45.3 38.8 35.7 Labeled Spike PCB-170L 39.2 32.8 33.1 Labeled Spike PCB-178L 82.7 84.9 77.2 Labeled Spike PCB-180L 41.8 33.1 33.3 Labeled Spike PCB-188L 44.4 33.6 34.3 Labeled Spike PCB-189L 39.7 31.1 31.4 Labeled Spike PCB-202L 42.4 33.9 33.2 Labeled Spike PCB-205L 37.6 29.7 28.4 Labeled Spike PCB-206L 37.7 29.8 28.8 Labeled Spike PCB-208L 37.3 29.3 29 Labeled Spike PCB-209L 36.7 32 32.6

Page 29
Table A-4. Laboratory PCB Blank Samples Analyzed February 2016 (pg/L). Bold = positive results.
Sample Type Analyte #1
WG54352-101 #2
WG54352-104 #3
WG54352-105 Lab Blank PCB-001 5.89 4.83 U 4.71 U Lab Blank PCB-002 2.83 J 4 U 4 U Lab Blank PCB-003 5.22 5.3 U 5.09 U Lab Blank PCB-004 5.8 4.69 U 4.11 U Lab Blank PCB-005 0.649 UJ 0.559 UJ 0.785 UJ Lab Blank PCB-006 3.41 J 4 U 4 U Lab Blank PCB-007 1.36 J 4 U 4 U Lab Blank PCB-008 16.8 13.8 U 12.7 U Lab Blank PCB-009 1.3 J 4 U 4 U Lab Blank PCB-010 0.583 UJ 0.502 UJ 0.705 UJ Lab Blank PCB-011 81.4 31.2 U 26.8 U Lab Blank PCB-012/013 1.87 J 4 U 4 U Lab Blank PCB-014 0.589 UJ 0.507 UJ 0.712 UJ Lab Blank PCB-015 8.4 6.93 U 6.5 U Lab Blank PCB-016 7.15 4.91 U 4.85 U Lab Blank PCB-017 7.46 5.38 U 5.09 U Lab Blank PCB-018/030 16.4 10.4 U 9.89 U Lab Blank PCB-019 2.1 J 4 U 4 U Lab Blank PCB-020/028 23.5 16.9 U 15.2 U Lab Blank PCB-021/033 13.9 9.91 U 9.18 U Lab Blank PCB-022 8.71 6.17 U 5.77 U Lab Blank PCB-023 0.511 UJ 0.5 UJ 0.555 UJ Lab Blank PCB-024 0.535 UJ 0.5 UJ 0.534 UJ Lab Blank PCB-025 1.57 J 4 U 4 U Lab Blank PCB-026/029 3.88 J 4 U 4 U Lab Blank PCB-027 0.975 J 4 U 4 U Lab Blank PCB-031 20 13.9 U 13 U Lab Blank PCB-032 5.03 4 U 4 U Lab Blank PCB-034 0.5 UJ 0.5 UJ 0.525 UJ Lab Blank PCB-035 0.548 J 4 U 0.504 UJ Lab Blank PCB-036 0.5 UJ 0.5 UJ 0.5 UJ Lab Blank PCB-037 2.83 J 4 U 4 U Lab Blank PCB-038 0.5 UJ 0.5 UJ 0.518 UJ Lab Blank PCB-039 0.5 UJ 0.5 UJ 0.517 UJ Lab Blank PCB-040/041/071 6.42 4.61 U 4.66 U Lab Blank PCB-042 2.81 J 4 U 4 U Lab Blank PCB-043 1.04 UJ 0.789 UJ 0.921 UJ Lab Blank PCB-044/047/065 22.4 11.4 U 9.9 U Lab Blank PCB-045/051 5.38 4 U 4 U

Page 30
Sample Type Analyte #1
WG54352-101 #2
WG54352-104 #3
WG54352-105 Lab Blank PCB-046 1.03 UJ 0.78 UJ 0.91 UJ Lab Blank PCB-048 2.96 J 4 U 4 U Lab Blank PCB-049/069 7.5 6.06 U 5.07 U Lab Blank PCB-050/053 1.97 J 4 U 4 U Lab Blank PCB-052 18.2 12.3 U 10.1 U Lab Blank PCB-054 0.612 UJ 0.5 UJ 0.558 UJ Lab Blank PCB-055 0.695 UJ 0.558 UJ 0.716 UJ Lab Blank PCB-056 2.05 NJ 1.38 J 1.21 NJ Lab Blank PCB-057 0.643 UJ 0.517 UJ 0.662 UJ Lab Blank PCB-058 0.656 UJ 0.527 UJ 0.675 UJ Lab Blank PCB-059/062/075 1.18 J 4 U 4 U Lab Blank PCB-060 1.69 J 4 U 4 U Lab Blank PCB-061/070/074/076 10.9 8.32 U 4 U Lab Blank PCB-063 0.633 UJ 0.508 UJ 0.652 UJ Lab Blank PCB-064 4.61 4.15 U 4 U Lab Blank PCB-066 5.93 4 U 4 U Lab Blank PCB-067 0.592 UJ 0.5 UJ 0.609 UJ Lab Blank PCB-068 1.78 J 0.504 UJ 0.646 UJ Lab Blank PCB-072 0.624 UJ 0.501 UJ 0.643 UJ Lab Blank PCB-073 0.664 UJ 0.504 UJ 0.588 UJ Lab Blank PCB-077 0.703 UJ 0.58 UJ 0.727 UJ Lab Blank PCB-078 0.658 UJ 0.528 UJ 0.677 UJ Lab Blank PCB-079 0.552 UJ 0.5 UJ 0.568 UJ Lab Blank PCB-080 0.619 UJ 0.5 UJ 0.637 UJ Lab Blank PCB-081 0.695 UJ 0.545 UJ 0.695 UJ Lab Blank PCB-082 1.43 UJ 0.973 UJ 1.39 UJ Lab Blank PCB-083/099 4.24 4 U 4 U Lab Blank PCB-084 1.38 NJ 1.95 J 1.29 UJ Lab Blank PCB-085/116/117 1.29 NJ 1.06 J 0.98 UJ Lab Blank PCB-086/087/097/109/119/125 4.89 4 U 4 U Lab Blank PCB-088/091 1.33 NJ 1.02 NJ 1.13 UJ Lab Blank PCB-089 1.24 UJ 0.845 UJ 1.21 UJ Lab Blank PCB-090/101/113 5.74 5.57 U 4.28 U Lab Blank PCB-092 1.18 UJ 0.996 NJ 1.15 UJ Lab Blank PCB-093/095/098/100/102 6.05 5.85 U 5.14 U Lab Blank PCB-094 1.26 UJ 0.859 UJ 1.23 UJ Lab Blank PCB-096 0.7 UJ 0.629 UJ 0.766 UJ Lab Blank PCB-103 1.02 UJ 0.693 UJ 0.99 UJ Lab Blank PCB-104 0.683 UJ 0.61 UJ 0.754 UJ Lab Blank PCB-105 1.89 J 4 U 4 U

Page 31
Sample Type Analyte #1
WG54352-101 #2
WG54352-104 #3
WG54352-105 Lab Blank PCB-106 0.902 UJ 0.778 UJ 0.894 UJ Lab Blank PCB-107 0.872 UJ 0.751 UJ 0.863 UJ Lab Blank PCB-108/124 0.949 UJ 0.818 UJ 0.94 UJ Lab Blank PCB-110/115 5.56 5.16 U 5.02 U Lab Blank PCB-111 0.925 UJ 0.629 UJ 0.899 UJ Lab Blank PCB-112 0.86 UJ 0.585 UJ 0.836 UJ Lab Blank PCB-114 1 UJ 0.847 UJ 0.986 UJ Lab Blank PCB-118 4.38 4.3 U 4 U Lab Blank PCB-120 1 UJ 0.683 UJ 0.976 UJ Lab Blank PCB-121 0.878 UJ 0.597 UJ 0.853 UJ Lab Blank PCB-122 1.04 UJ 0.894 UJ 1.03 UJ Lab Blank PCB-123 0.97 UJ 0.886 UJ 1.01 UJ Lab Blank PCB-126 1.18 UJ 1.01 UJ 1.38 UJ Lab Blank PCB-127 1.1 UJ 0.951 UJ 1.09 UJ Lab Blank PCB-128/166 1.52 UJ 0.983 J 1.27 UJ Lab Blank PCB-129/138/160/163 4.63 NJ 4.91 NJ 4.31 Lab Blank PCB-130 1.92 UJ 1.19 UJ 1.61 UJ Lab Blank PCB-131 1.68 UJ 1.03 UJ 1.41 UJ Lab Blank PCB-132 1.82 UJ 1.36 J 1.52 UJ Lab Blank PCB-133 1.71 UJ 1.05 UJ 1.43 UJ Lab Blank PCB-134/143 1.71 UJ 1.06 UJ 1.44 UJ Lab Blank PCB-135/151/154 1.88 J 4 U 0.906 UJ Lab Blank PCB-136 0.738 UJ 0.682 UJ 0.651 UJ Lab Blank PCB-137 1.82 UJ 1.12 UJ 1.53 UJ Lab Blank PCB-139/140 1.56 UJ 0.959 UJ 1.3 UJ Lab Blank PCB-141 1.65 UJ 1.02 UJ 1.38 UJ Lab Blank PCB-142 1.75 UJ 1.08 UJ 1.46 UJ Lab Blank PCB-144 1.05 UJ 0.974 UJ 0.929 UJ Lab Blank PCB-145 0.789 UJ 0.729 UJ 0.695 UJ Lab Blank PCB-146 1.52 UJ 1.01 J 1.28 UJ Lab Blank PCB-147/149 3.01 NJ 2.93 J 2.67 J Lab Blank PCB-148 1.04 UJ 0.964 UJ 0.92 UJ Lab Blank PCB-150 0.754 UJ 0.697 UJ 0.665 UJ Lab Blank PCB-152 0.674 UJ 0.623 UJ 0.594 UJ Lab Blank PCB-153/168 4.81 4.84 U 4 U Lab Blank PCB-155 0.609 UJ 0.534 UJ 0.508 UJ Lab Blank PCB-156/157 1.57 UJ 0.996 UJ 1.35 UJ Lab Blank PCB-158 1.17 UJ 0.719 UJ 0.978 UJ Lab Blank PCB-159 1.39 UJ 0.859 UJ 1.17 UJ Lab Blank PCB-161 1.19 UJ 0.734 UJ 0.998 UJ

Page 32
Sample Type Analyte #1
WG54352-101 #2
WG54352-104 #3
WG54352-105 Lab Blank PCB-162 1.4 UJ 0.862 UJ 1.17 UJ Lab Blank PCB-164 1.3 UJ 0.801 UJ 1.09 UJ Lab Blank PCB-165 1.39 UJ 0.854 UJ 1.16 UJ Lab Blank PCB-167 1.29 UJ 0.818 UJ 1.09 UJ Lab Blank PCB-169 1.53 UJ 0.935 UJ 1.32 UJ Lab Blank PCB-170 1.1 UJ 0.893 UJ 0.917 UJ Lab Blank PCB-171/173 1.23 UJ 0.898 UJ 1.07 UJ Lab Blank PCB-172 1.23 UJ 0.896 UJ 1.07 UJ Lab Blank PCB-174 1.14 UJ 0.832 UJ 0.995 UJ Lab Blank PCB-175 1.03 UJ 0.757 UJ 0.905 UJ Lab Blank PCB-176 0.727 UJ 0.532 UJ 0.637 UJ Lab Blank PCB-177 1.1 UJ 0.804 UJ 0.962 UJ Lab Blank PCB-178 1.04 UJ 0.759 UJ 0.908 UJ Lab Blank PCB-179 0.687 UJ 0.503 UJ 0.601 UJ Lab Blank PCB-180/193 0.872 NJ 1.54 NJ 1.45 NJ Lab Blank PCB-181 1.12 UJ 0.818 UJ 0.978 UJ Lab Blank PCB-182 1.02 UJ 0.745 UJ 0.891 UJ Lab Blank PCB-183/185 1.07 UJ 0.785 UJ 0.939 UJ Lab Blank PCB-184 0.703 UJ 0.514 UJ 0.615 UJ Lab Blank PCB-186 0.776 UJ 0.567 UJ 0.679 UJ Lab Blank PCB-187 1.66 NJ 1.7 NJ 1.74 NJ Lab Blank PCB-188 0.668 UJ 0.5 UJ 0.585 UJ Lab Blank PCB-189 0.897 UJ 0.948 UJ 1.22 UJ Lab Blank PCB-190 0.804 UJ 0.588 UJ 0.704 UJ Lab Blank PCB-191 0.871 UJ 0.637 UJ 0.762 UJ Lab Blank PCB-192 0.96 UJ 0.702 UJ 0.84 UJ Lab Blank PCB-194 0.928 UJ 0.708 UJ 0.816 UJ Lab Blank PCB-195 1.05 UJ 0.802 UJ 0.924 UJ Lab Blank PCB-196 0.887 UJ 0.869 UJ 0.804 UJ Lab Blank PCB-197/200 0.669 UJ 0.656 UJ 0.606 UJ Lab Blank PCB-198/199 0.91 UJ 0.892 UJ 0.825 UJ Lab Blank PCB-201 0.688 UJ 0.674 UJ 0.623 UJ Lab Blank PCB-202 0.798 UJ 0.756 UJ 0.684 UJ Lab Blank PCB-203 0.856 UJ 0.839 UJ 0.776 UJ Lab Blank PCB-204 0.684 UJ 0.67 UJ 0.62 UJ Lab Blank PCB-205 0.733 UJ 0.578 UJ 0.682 UJ Lab Blank PCB-206 0.96 UJ 0.986 UJ 0.989 UJ Lab Blank PCB-207 0.729 UJ 0.705 UJ 0.747 UJ Lab Blank PCB-208 0.78 UJ 0.72 UJ 0.799 UJ Lab Blank PCB-209 1.75 J 4 U 4 U
Total PCBs 383 J 10.7 J 6.98 J

Page 33
Table A-5. Laboratory PCB Blank Samples Analyzed March 2016 (pg/L).
Sample Type Analyte #1
WG54716-101 #2
WG54716-104 #3
WG54716-105 Lab Blank PCB-001 3.59 NJ 3.39 J 4.22 Lab Blank PCB-002 1.24 NJ 1.41 J 3.98 J Lab Blank PCB-003 3.26 NJ 3.36 NJ 15.4 NJ Lab Blank PCB-004 2.4 NJ 1.71 NJ 1.48 UJ Lab Blank PCB-005 1.69 UJ 1.1 UJ 1.15 UJ Lab Blank PCB-006 1.5 UJ 0.974 UJ 1.03 J Lab Blank PCB-007 1.94 NJ 0.997 UJ 2.04 J Lab Blank PCB-008 6.11 5.14 4 U Lab Blank PCB-009 1.48 UJ 0.959 UJ 1.01 UJ Lab Blank PCB-010 1.56 UJ 1.01 UJ 1.07 UJ Lab Blank PCB-011 19.3 15 4 U Lab Blank PCB-012/013 1.52 UJ 0.986 UJ 1.54 J Lab Blank PCB-014 1.48 UJ 0.958 UJ 1.01 UJ Lab Blank PCB-015 4.69 3.45 J 3.96 J Lab Blank PCB-016 2.86 J 4 U 4 U Lab Blank PCB-017 2.11 J 1.69 J 4 U Lab Blank PCB-018/030 4.37 4.28 U 4.07 U Lab Blank PCB-019 0.62 UJ 0.519 UJ 0.609 J Lab Blank PCB-020/028 8.21 5.97 U 6.44 U Lab Blank PCB-021/033 4.68 3.33 J 3.68 J Lab Blank PCB-022 3.07 J 4 U 4 U Lab Blank PCB-023 0.524 UJ 0.534 UJ 0.5 UJ Lab Blank PCB-024 0.5 UJ 0.5 UJ 0.5 UJ Lab Blank PCB-025 0.598 NJ 0.555 J 0.638 J Lab Blank PCB-026/029 1.24 NJ 0.934 J 0.993 J Lab Blank PCB-027 0.5 UJ 0.5 UJ 0.5 UJ Lab Blank PCB-031 5.73 NJ 4.79 4.74 Lab Blank PCB-032 1.49 J 1.07 J 1.19 J Lab Blank PCB-034 0.52 UJ 0.53 UJ 0.5 UJ Lab Blank PCB-035 0.5 UJ 0.5 UJ 0.5 UJ Lab Blank PCB-036 0.5 UJ 0.5 UJ 0.5 UJ Lab Blank PCB-037 1.05 NJ 0.878 J 1.23 J Lab Blank PCB-038 0.5 UJ 0.5 UJ 0.5 UJ Lab Blank PCB-039 0.5 UJ 0.5 UJ 0.5 UJ Lab Blank PCB-040/041/071 2.61 J 1.89 J 4 U Lab Blank PCB-042 0.731 NJ 0.991 J 0.875 J Lab Blank PCB-043 0.732 UJ 0.644 UJ 0.53 UJ Lab Blank PCB-044/047/065 6.38 4.56 U 5.54 U Lab Blank PCB-045/051 1.52 NJ 1.05 J 1.2 J

Page 34
Sample Type Analyte #1
WG54716-101 #2
WG54716-104 #3
WG54716-105 Lab Blank PCB-046 0.653 UJ 0.575 UJ 0.5 UJ Lab Blank PCB-048 0.951 J 4 U 4 U Lab Blank PCB-049/069 2.45 J 1.89 J 4 U Lab Blank PCB-050/053 0.549 UJ 0.588 J 0.687 J Lab Blank PCB-052 5.78 4.81 6.24 Lab Blank PCB-054 0.5 UJ 0.5 UJ 0.5 UJ Lab Blank PCB-055 0.646 UJ 0.633 UJ 0.692 UJ Lab Blank PCB-056 0.9 J 4 U 0.712 UJ Lab Blank PCB-057 0.602 UJ 0.591 UJ 0.645 UJ Lab Blank PCB-058 0.657 UJ 0.644 UJ 0.703 UJ Lab Blank PCB-059/062/075 0.5 UJ 0.5 UJ 0.5 UJ Lab Blank PCB-060 0.636 UJ 0.624 UJ 0.681 UJ Lab Blank PCB-061/070/074/076 4.06 4 U 3.52 J Lab Blank PCB-063 0.583 UJ 0.572 UJ 0.625 UJ Lab Blank PCB-064 1.85 NJ 1.2 J 1.65 J Lab Blank PCB-066 1.91 J 1.33 J 4 U Lab Blank PCB-067 0.527 UJ 0.517 UJ 0.564 UJ Lab Blank PCB-068 0.582 UJ 0.571 UJ 0.624 UJ Lab Blank PCB-072 0.594 UJ 0.583 UJ 0.637 UJ Lab Blank PCB-073 0.5 UJ 0.5 UJ 0.5 UJ Lab Blank PCB-077 0.666 UJ 0.678 UJ 0.704 UJ Lab Blank PCB-078 0.603 UJ 0.591 UJ 0.646 UJ Lab Blank PCB-079 0.505 UJ 0.5 UJ 0.541 UJ Lab Blank PCB-080 0.568 UJ 0.557 UJ 0.608 UJ Lab Blank PCB-081 0.673 UJ 0.671 UJ 0.721 UJ Lab Blank PCB-082 0.622 UJ 0.5 UJ 0.635 UJ Lab Blank PCB-083/099 1.69 NJ 1.03 J 1.56 J Lab Blank PCB-084 1.07 J 4 U 0.671 UJ Lab Blank PCB-085/116/117 0.652 NJ 0.5 UJ 0.5 UJ Lab Blank PCB-086/087/097/109/119/125 2.25 NJ 1.75 J 2.04 J Lab Blank PCB-088/091 0.82 NJ 0.5 UJ 0.604 UJ Lab Blank PCB-089 0.613 UJ 0.5 UJ 0.626 UJ Lab Blank PCB-090/101/113 3.28 NJ 2.44 J 3.08 J Lab Blank PCB-092 0.583 UJ 0.5 UJ 0.595 UJ Lab Blank PCB-093/095/098/100/102 3.82 J 3.01 J 2.71 J Lab Blank PCB-094 0.643 UJ 0.5 UJ 0.656 UJ Lab Blank PCB-096 0.5 UJ 0.5 UJ 0.5 UJ Lab Blank PCB-103 0.539 UJ 0.5 UJ 0.55 UJ Lab Blank PCB-104 0.5 UJ 0.5 UJ 0.5 UJ Lab Blank PCB-105 1.21 J 0.733 UJ 4 U Lab Blank PCB-106 0.701 UJ 0.596 UJ 0.577 UJ

Page 35
Sample Type Analyte #1
WG54716-101 #2
WG54716-104 #3
WG54716-105 Lab Blank PCB-107 0.792 UJ 0.673 UJ 0.652 UJ Lab Blank PCB-108/124 0.825 UJ 0.701 UJ 0.678 UJ Lab Blank PCB-110/115 3.13 NJ 2.37 J 2.83 J Lab Blank PCB-111 0.5 UJ 0.5 UJ 0.5 UJ Lab Blank PCB-112 0.5 UJ 0.5 UJ 0.5 UJ Lab Blank PCB-114 0.858 UJ 0.742 UJ 0.685 UJ Lab Blank PCB-118 2.45 J 4 U 2.02 J Lab Blank PCB-120 0.5 UJ 0.5 UJ 0.5 UJ Lab Blank PCB-121 0.5 UJ 0.5 UJ 0.5 UJ Lab Blank PCB-122 0.84 UJ 0.713 UJ 0.691 UJ Lab Blank PCB-123 0.906 UJ 0.759 UJ 0.759 UJ Lab Blank PCB-126 0.959 UJ 0.811 UJ 0.79 UJ Lab Blank PCB-127 0.77 UJ 0.654 UJ 0.633 UJ Lab Blank PCB-128/166 0.541 UJ 0.582 UJ 0.593 UJ Lab Blank PCB-129/138/160/163 2.02 J 4 U 1.94 J Lab Blank PCB-130 0.688 UJ 0.74 UJ 0.754 UJ Lab Blank PCB-131 0.679 UJ 0.73 UJ 0.744 UJ Lab Blank PCB-132 0.699 UJ 0.752 UJ 0.766 UJ Lab Blank PCB-133 0.66 UJ 0.71 UJ 0.723 UJ Lab Blank PCB-134/143 0.689 UJ 0.741 UJ 0.755 UJ Lab Blank PCB-135/151/154 1.65 J 4 U 1.15 J Lab Blank PCB-136 0.5 UJ 0.5 UJ 0.5 UJ Lab Blank PCB-137 0.695 UJ 0.748 UJ 0.762 UJ Lab Blank PCB-139/140 0.629 UJ 0.677 UJ 0.689 UJ Lab Blank PCB-141 0.588 UJ 0.633 UJ 0.645 UJ Lab Blank PCB-142 0.677 UJ 0.728 UJ 0.742 UJ Lab Blank PCB-144 0.5 UJ 0.5 UJ 0.5 UJ Lab Blank PCB-145 0.5 UJ 0.5 UJ 0.5 UJ Lab Blank PCB-146 0.581 UJ 0.625 UJ 0.636 UJ Lab Blank PCB-147/149 1.57 NJ 1.54 J 1.35 J Lab Blank PCB-148 0.5 UJ 0.5 UJ 0.5 UJ Lab Blank PCB-150 0.5 UJ 0.5 UJ 0.5 UJ Lab Blank PCB-152 0.5 UJ 0.5 UJ 0.5 UJ Lab Blank PCB-153/168 1.61 NJ 0.802 J 1.47 J Lab Blank PCB-155 0.5 UJ 0.5 UJ 0.5 UJ Lab Blank PCB-156/157 0.526 UJ 0.574 UJ 0.556 UJ Lab Blank PCB-158 0.5 UJ 0.5 UJ 0.5 UJ Lab Blank PCB-159 0.5 UJ 0.5 UJ 0.509 UJ Lab Blank PCB-161 0.5 UJ 0.5 UJ 0.503 UJ Lab Blank PCB-162 0.5 UJ 0.508 UJ 0.518 UJ

Page 36
Sample Type Analyte #1
WG54716-101 #2
WG54716-104 #3
WG54716-105 Lab Blank PCB-164 0.5 UJ 0.5 UJ 0.5 UJ Lab Blank PCB-165 0.527 UJ 0.567 UJ 0.578 UJ Lab Blank PCB-167 0.5 UJ 0.5 UJ 0.5 UJ Lab Blank PCB-169 0.5 UJ 0.529 UJ 0.536 UJ Lab Blank PCB-170 0.58 UJ 0.517 UJ 0.5 UJ Lab Blank PCB-171/173 0.602 UJ 0.535 UJ 0.526 UJ Lab Blank PCB-172 0.595 UJ 0.529 UJ 0.519 UJ Lab Blank PCB-174 0.539 UJ 0.5 UJ 0.5 UJ Lab Blank PCB-175 0.548 UJ 0.5 UJ 0.5 UJ Lab Blank PCB-176 0.5 UJ 0.5 UJ 0.5 UJ Lab Blank PCB-177 0.605 UJ 0.538 UJ 0.528 UJ Lab Blank PCB-178 0.578 UJ 0.514 UJ 0.505 UJ Lab Blank PCB-179 0.5 UJ 0.5 UJ 0.5 UJ Lab Blank PCB-180/193 0.5 UJ 0.647 J 0.657 J Lab Blank PCB-181 0.594 UJ 0.528 UJ 0.519 UJ Lab Blank PCB-182 0.538 UJ 0.5 UJ 0.5 UJ Lab Blank PCB-183/185 0.561 UJ 0.5 UJ 0.5 UJ Lab Blank PCB-184 0.5 UJ 0.5 UJ 0.5 UJ Lab Blank PCB-186 0.5 UJ 0.5 UJ 0.5 UJ Lab Blank PCB-187 0.632 NJ 0.5 UJ 0.5 UJ Lab Blank PCB-188 0.5 UJ 0.5 UJ 0.5 UJ Lab Blank PCB-189 0.915 UJ 0.806 UJ 0.797 UJ Lab Blank PCB-190 0.5 UJ 0.5 UJ 0.5 UJ Lab Blank PCB-191 0.5 UJ 0.5 UJ 0.5 UJ Lab Blank PCB-192 0.5 UJ 0.5 UJ 0.5 UJ Lab Blank PCB-194 0.504 UJ 0.5 UJ 0.505 UJ Lab Blank PCB-195 0.531 UJ 0.5 UJ 0.532 UJ Lab Blank PCB-196 0.5 UJ 0.5 UJ 0.5 UJ Lab Blank PCB-197/200 0.5 UJ 0.5 UJ 0.5 UJ Lab Blank PCB-198/199 0.5 UJ 0.5 UJ 0.517 J Lab Blank PCB-201 0.5 UJ 0.5 UJ 0.5 UJ Lab Blank PCB-202 0.5 UJ 0.5 UJ 0.5 UJ Lab Blank PCB-203 0.5 UJ 0.5 UJ 0.544 J Lab Blank PCB-204 0.5 UJ 0.5 UJ 0.5 UJ Lab Blank PCB-205 0.5 UJ 0.5 UJ 0.5 UJ Lab Blank PCB-206 1.3 UJ 1.16 UJ 1.05 UJ Lab Blank PCB-207 0.965 UJ 0.869 UJ 0.795 UJ Lab Blank PCB-208 1.04 UJ 0.941 UJ 0.867 UJ Lab Blank PCB-209 1.17 NJ 0.877 J 0.797 J
Total PCBs 94.2 J 69.9 J 66.7 J

Page 37
Table A-6. Laboratory PCB Blank Samples Analyzed May 2016 (pg/L).
Sample Type Analyte #1
WG54716-101 #2
WG54716-104 #3
WG54716-105 Lab Blank PCB-001 2.84 J 2.63 J 2.66 J Lab Blank PCB-002 1.91 J 1.34 J 1.58 J Lab Blank PCB-003 3.54 J 5.15 3.51 J Lab Blank PCB-004 2.27 UJ 1.58 UJ 1.77 UJ Lab Blank PCB-005 1.59 UJ 1.19 UJ 1.31 UJ Lab Blank PCB-006 1.47 J 1.09 UJ 1.48 J Lab Blank PCB-007 2.16 J 24.1 3.32 J Lab Blank PCB-008 5.96 5.53 5.6 Lab Blank PCB-009 1.41 UJ 1.06 UJ 1.17 UJ Lab Blank PCB-010 1.38 UJ 1.04 UJ 1.14 UJ Lab Blank PCB-011 16 13.6 14.4 Lab Blank PCB-012/013 1.63 UJ 1.22 UJ 1.35 UJ Lab Blank PCB-014 1.52 UJ 1.14 UJ 1.26 UJ Lab Blank PCB-015 2.65 J 2.64 J 3.01 J Lab Blank PCB-016 1.92 J 1.67 J 1.78 J Lab Blank PCB-017 1.72 J 2.09 J 2.03 J Lab Blank PCB-018/030 3.47 J 4.19 4.04 Lab Blank PCB-019 0.608 J 0.716 J 0.574 J Lab Blank PCB-020/028 0.5 UJ 5.56 6.13 Lab Blank PCB-021/033 3.15 J 3.29 J 3.37 J Lab Blank PCB-022 2.03 J 2.03 J 2.13 J Lab Blank PCB-023 0.5 UJ 0.5 UJ 0.5 UJ Lab Blank PCB-024 0.5 UJ 0.5 UJ 0.5 UJ Lab Blank PCB-025 0.5 UJ 0.5 UJ 0.5 UJ Lab Blank PCB-026/029 1.03 J 1.56 J 1.02 J Lab Blank PCB-027 0.5 UJ 0.5 UJ 0.5 UJ Lab Blank PCB-031 4.44 4.48 4.73 Lab Blank PCB-032 1.08 J 1.26 J 1.08 J Lab Blank PCB-034 0.5 UJ 0.5 UJ 0.5 UJ Lab Blank PCB-035 1.58 J 0.779 J 0.821 J Lab Blank PCB-036 0.5 UJ 0.5 UJ 0.5 UJ Lab Blank PCB-037 0.808 J 0.801 J 0.962 J Lab Blank PCB-038 0.5 UJ 0.5 UJ 0.5 UJ Lab Blank PCB-039 0.5 UJ 0.5 UJ 0.675 J Lab Blank PCB-040/041/071 1.55 J 1.58 J 1.8 J Lab Blank PCB-042 0.83 J 0.594 J 0.744 J Lab Blank PCB-043 0.5 UJ 0.5 UJ 0.5 UJ Lab Blank PCB-044/047/065 4.22 UJ 17.1 3.6 J Lab Blank PCB-045/051 1.01 J 2.59 J 0.916 J

Page 38
Sample Type Analyte #1
WG54716-101 #2
WG54716-104 #3
WG54716-105 Lab Blank PCB-046 0.5 UJ 0.5 UJ 0.5 UJ Lab Blank PCB-048 0.961 J 0.792 J 0.737 J Lab Blank PCB-049/069 1.5 J 1.88 J 1.59 J Lab Blank PCB-050/053 0.653 J 0.568 J 0.619 J Lab Blank PCB-052 3.44 J 4.13 NJ 3.84 J Lab Blank PCB-054 0.5 UJ 0.5 UJ 0.5 UJ Lab Blank PCB-055 0.5 UJ 0.5 UJ 0.5 UJ Lab Blank PCB-056 0.579 J 0.5 UJ 0.5 UJ Lab Blank PCB-057 0.5 UJ 0.5 UJ 0.5 UJ Lab Blank PCB-058 0.5 UJ 0.5 UJ 0.5 UJ Lab Blank PCB-059/062/075 0.5 UJ 0.512 J 0.5 UJ Lab Blank PCB-060 0.5 UJ 0.5 UJ 0.5 UJ Lab Blank PCB-061/070/074/076 2.41 J 2.52 J 3.18 J Lab Blank PCB-063 0.5 UJ 0.5 UJ 0.5 UJ Lab Blank PCB-064 1.08 J 1.04 J 1.05 J Lab Blank PCB-066 0.5 UJ 1.14 J 1.5 J Lab Blank PCB-067 0.5 UJ 0.5 UJ 0.5 UJ Lab Blank PCB-068 0.5 UJ 4.18 NJ 0.633 J Lab Blank PCB-072 0.5 UJ 0.5 UJ 0.5 UJ Lab Blank PCB-073 0.5 UJ 0.5 UJ 0.5 UJ Lab Blank PCB-077 0.5 UJ 0.5 UJ 0.607 J Lab Blank PCB-078 0.5 UJ 0.5 UJ 0.5 UJ Lab Blank PCB-079 0.5 UJ 0.5 UJ 0.5 UJ Lab Blank PCB-080 0.5 UJ 0.5 UJ 0.5 UJ Lab Blank PCB-081 0.5 UJ 0.5 UJ 0.5 UJ Lab Blank PCB-082 0.5 UJ 0.5 UJ 0.5 UJ Lab Blank PCB-083/099 1.07 J 1.59 J 1.36 J Lab Blank PCB-084 0.742 J 0.501 J 0.797 J Lab Blank PCB-085/116/117 0.5 UJ 0.52 J 0.568 J Lab Blank PCB-086/087/097/109/119/125 1.83 J 1.82 J 2.02 J Lab Blank PCB-088/091 0.5 UJ 0.5 UJ 0.5 UJ Lab Blank PCB-089 0.5 UJ 0.5 UJ 0.5 UJ Lab Blank PCB-090/101/113 2.3 J 2.03 J 2.47 J Lab Blank PCB-092 0.5 UJ 0.5 UJ 0.5 UJ Lab Blank PCB-093/095/098/100/102 1.97 J 2.45 J 2.13 J Lab Blank PCB-094 0.5 UJ 0.5 UJ 0.5 UJ Lab Blank PCB-096 0.5 UJ 0.5 UJ 0.5 UJ Lab Blank PCB-103 0.5 UJ 0.5 UJ 0.5 UJ Lab Blank PCB-104 0.5 UJ 0.5 UJ 0.5 UJ Lab Blank PCB-105 0.756 J 0.572 J 0.87 J

Page 39
Sample Type Analyte #1
WG54716-101 #2
WG54716-104 #3
WG54716-105 Lab Blank PCB-106 0.5 UJ 0.5 UJ 0.5 UJ Lab Blank PCB-107 0.5 UJ 0.5 UJ 0.5 UJ Lab Blank PCB-108/124 0.5 UJ 0.5 UJ 0.5 UJ Lab Blank PCB-110/115 1.96 J 1.86 J 2.19 J Lab Blank PCB-111 0.5 UJ 0.5 UJ 0.5 UJ Lab Blank PCB-112 0.5 UJ 0.5 UJ 0.5 UJ Lab Blank PCB-114 0.5 UJ 0.5 UJ 0.5 UJ Lab Blank PCB-118 1.41 J 1.83 J 2.14 J Lab Blank PCB-120 0.5 UJ 0.5 UJ 0.5 UJ Lab Blank PCB-121 0.5 UJ 0.5 UJ 0.5 UJ Lab Blank PCB-122 0.5 UJ 0.5 UJ 0.5 UJ Lab Blank PCB-123 0.5 UJ 0.5 UJ 0.5 UJ Lab Blank PCB-126 0.5 UJ 0.5 UJ 0.5 UJ Lab Blank PCB-127 0.5 UJ 0.5 UJ 0.5 UJ Lab Blank PCB-128/166 0.5 UJ 0.5 UJ 0.526 J Lab Blank PCB-129/138/160/163 1.63 J 1.93 J 2.4 J Lab Blank PCB-130 0.5 UJ 0.5 UJ 0.5 UJ Lab Blank PCB-131 0.5 UJ 0.5 UJ 0.5 UJ Lab Blank PCB-132 0.906 J 0.687 J 0.5 UJ Lab Blank PCB-133 0.5 UJ 0.5 UJ 0.5 UJ Lab Blank PCB-134/143 0.5 UJ 0.5 UJ 0.5 UJ Lab Blank PCB-135/151/154 0.731 J 0.71 J 0.643 J Lab Blank PCB-136 0.5 UJ 0.5 UJ 0.5 UJ Lab Blank PCB-137 0.5 UJ 0.5 UJ 0.5 UJ Lab Blank PCB-139/140 0.5 UJ 0.5 UJ 0.5 UJ Lab Blank PCB-141 0.5 UJ 0.572 J 0.636 J Lab Blank PCB-142 0.5 UJ 0.5 UJ 0.5 UJ Lab Blank PCB-144 0.5 UJ 0.5 UJ 0.5 UJ Lab Blank PCB-145 0.5 UJ 0.5 UJ 0.5 UJ Lab Blank PCB-146 0.5 UJ 0.5 UJ 0.5 UJ Lab Blank PCB-147/149 1.32 J 1.67 J 1.95 J Lab Blank PCB-148 0.5 UJ 0.5 UJ 0.5 UJ Lab Blank PCB-150 0.5 UJ 0.5 UJ 0.5 UJ Lab Blank PCB-152 0.5 UJ 0.5 UJ 0.5 UJ Lab Blank PCB-153/168 1.68 J 1.94 J 2.13 J Lab Blank PCB-155 0.5 UJ 0.5 UJ 0.5 UJ Lab Blank PCB-156/157 0.5 UJ 0.5 UJ 0.5 UJ Lab Blank PCB-158 0.5 UJ 0.5 UJ 0.5 UJ Lab Blank PCB-159 0.5 UJ 0.5 UJ 0.5 UJ Lab Blank PCB-161 0.5 UJ 0.5 UJ 0.5 UJ

Page 40
Sample Type Analyte #1
WG54716-101 #2
WG54716-104 #3
WG54716-105 Lab Blank PCB-162 0.5 UJ 0.5 UJ 0.5 UJ Lab Blank PCB-164 0.5 UJ 0.5 UJ 0.5 UJ Lab Blank PCB-165 0.5 UJ 0.5 UJ 0.5 UJ Lab Blank PCB-167 0.5 UJ 0.5 UJ 0.5 UJ Lab Blank PCB-169 0.5 UJ 0.5 UJ 0.5 UJ Lab Blank PCB-170 0.5 UJ 0.5UJ 0.803 J Lab Blank PCB-171/173 0.5 UJ 0.5 UJ 0.5 UJ Lab Blank PCB-172 0.5 UJ 0.5 UJ 0.5 UJ Lab Blank PCB-174 0.5 UJ 0.5 UJ 0.589 J Lab Blank PCB-175 0.5 UJ 0.5 UJ 0.5 UJ Lab Blank PCB-176 0.5 UJ 0.5 UJ 0.5 UJ Lab Blank PCB-177 0.5 UJ 0.5 UJ 0.5 UJ Lab Blank PCB-178 0.5 UJ 0.5 UJ 0.5 UJ Lab Blank PCB-179 0.5 UJ 0.5 UJ 0.5 UJ Lab Blank PCB-180/193 1.24 J 1.05 J 2.64 J Lab Blank PCB-181 0.5 UJ 0.5 UJ 0.5 UJ Lab Blank PCB-182 0.5 UJ 0.5 UJ 0.5 UJ Lab Blank PCB-183/185 0.5 UJ 0.5 UJ 0.5 UJ Lab Blank PCB-184 0.5 UJ 0.5 UJ 0.5 UJ Lab Blank PCB-186 0.5 UJ 0.5 UJ 0.5 UJ Lab Blank PCB-187 0.5 UJ 0.547 J 1.1 J Lab Blank PCB-188 0.5 UJ 0.5 UJ 0.5 UJ Lab Blank PCB-189 0.5 UJ 0.5 UJ 0.5 UJ Lab Blank PCB-190 0.5 UJ 0.5 UJ 0.5 UJ Lab Blank PCB-191 0.5 UJ 0.5 UJ 0.5 UJ Lab Blank PCB-192 0.5 UJ 0.5 UJ 0.5 UJ Lab Blank PCB-194 0.5 UJ 0.5 UJ 0.736 J Lab Blank PCB-195 0.5 UJ 0.5 UJ 0.522 J Lab Blank PCB-196 0.5 UJ 0.5 UJ 0.562 J Lab Blank PCB-197/200 0.5 UJ 0.5 UJ 0.5 UJ Lab Blank PCB-198/199 0.646 J 0.5 UJ 1.84 J Lab Blank PCB-201 0.5 UJ 0.5 UJ 0.5 UJ Lab Blank PCB-202 0.5 UJ 0.5 UJ 0.5 UJ Lab Blank PCB-203 0.5 UJ 0.5 UJ 1.41 J Lab Blank PCB-204 0.5 UJ 0.5 UJ 0.5 UJ Lab Blank PCB-205 0.5 UJ 0.5 UJ 0.5 UJ Lab Blank PCB-206 0.58 J 0.5 UJ 1.27 J Lab Blank PCB-207 0.5 UJ 0.5 UJ 0.5 UJ Lab Blank PCB-208 0.5 UJ 2.07 J 0.586 J Lab Blank PCB-209 0.966 J 1.07 J 1.12 J
Total PCBs 94.1 J 139 J 122 J

Page 41
Table A-7. Laboratory PCB Spiked Blank Samples Analyzed February 2016 (% Recovery).
Sample Type QC Type Analyte #1
WG54352-101 #2
WG54352-104 #3
WG54352-105 Lab Blank Labeled Spike PCB-001L 44.4 40.3 40 Lab Blank Labeled Spike PCB-003L 49.6 48.9 46.1 Lab Blank Labeled Spike PCB-004L 51.2 48.8 47.2 Lab Blank Labeled Spike PCB-015L 60.3 64.3 60.4 Lab Blank Labeled Spike PCB-019L 49.5 49.8 47.8 Lab Blank Labeled Spike PCB-028L 80.5 89.8 84.4 Lab Blank Labeled Spike PCB-037L 75.3 82.2 78 Lab Blank Labeled Spike PCB-054L 62.3 65.6 61.7 Lab Blank Labeled Spike PCB-077L 78.2 82.2 80.6 Lab Blank Labeled Spike PCB-081L 76.7 81.3 78.3 Lab Blank Labeled Spike PCB-104L 57.9 60.2 56.7 Lab Blank Labeled Spike PCB-105L 80 85.9 83.7 Lab Blank Labeled Spike PCB-111L 74.2 79.3 75.3 Lab Blank Labeled Spike PCB-114L 73.9 77.3 72.5 Lab Blank Labeled Spike PCB-118L 76.3 78.1 74 Lab Blank Labeled Spike PCB-123L 76.8 77.8 72.6 Lab Blank Labeled Spike PCB-126L 71.3 75.4 58.8 Lab Blank Labeled Spike PCB-155L 58.9 63.7 76.9 Lab Blank Labeled Spike PCB-156L/157L 58.7 59.2 70.3 Lab Blank Labeled Spike PCB-167L 57.9 57.6 70.7 Lab Blank Labeled Spike PCB-169L 52.8 54.6 62.9 Lab Blank Labeled Spike PCB-170L 74.8 79.8 71.4 Lab Blank Labeled Spike PCB-178L 57.7 60.9 73 Lab Blank Labeled Spike PCB-180L 79.2 79.1 71.5 Lab Blank Labeled Spike PCB-188L 68.8 82.2 62 Lab Blank Labeled Spike PCB-189L 77 84.6 68.9 Lab Blank Labeled Spike PCB-202L 57 58.7 60.7 Lab Blank Labeled Spike PCB-205L 78.9 80.1 76.6 Lab Blank Labeled Spike PCB-206L 63.5 62.8 61.7 Lab Blank Labeled Spike PCB-208L 64 69.4 64.8 Lab Blank Labeled Spike PCB-209L 55.6 61.4 59.4

Page 42
Table A-8. Laboratory PCB Spiked Blank Samples Analyzed March 2016 (% Recovery).
Sample Type QC Type Analyte #1
WG54716-101 #2
WG54716-104 #3
WG54716-105 Lab Blank Labeled Spike PCB-001L 31.5 48.2 50 Lab Blank Labeled Spike PCB-003L 37.6 52.5 51.8 Lab Blank Labeled Spike PCB-004L 44.1 58.1 55.4 Lab Blank Labeled Spike PCB-015L 59.1 71.1 66.7 Lab Blank Labeled Spike PCB-019L 59 70 63.2 Lab Blank Labeled Spike PCB-028L 67.9 77.8 75.4 Lab Blank Labeled Spike PCB-037L 72.6 77.8 75.7 Lab Blank Labeled Spike PCB-054L 61.2 69.6 61.6 Lab Blank Labeled Spike PCB-077L 91.3 92.4 93.5 Lab Blank Labeled Spike PCB-081L 89.5 92.1 90.7 Lab Blank Labeled Spike PCB-104L 65.5 70.7 61.8 Lab Blank Labeled Spike PCB-105L 86.3 87.3 89.9 Lab Blank Labeled Spike PCB-111L 78 81.3 81.8 Lab Blank Labeled Spike PCB-114L 82 83.5 84.9 Lab Blank Labeled Spike PCB-118L 83.1 85.4 84.1 Lab Blank Labeled Spike PCB-123L 83.7 85 82.3 Lab Blank Labeled Spike PCB-126L 86.8 88.6 86.1 Lab Blank Labeled Spike PCB-155L 68.4 71.3 62.3 Lab Blank Labeled Spike PCB-156L/157L 80.2 81 80.6 Lab Blank Labeled Spike PCB-167L 80 82 80.4 Lab Blank Labeled Spike PCB-169L 80.4 82.9 81.5 Lab Blank Labeled Spike PCB-170L 81.8 82.5 83.9 Lab Blank Labeled Spike PCB-178L 83.3 85.3 87 Lab Blank Labeled Spike PCB-180L 82.3 83.2 85 Lab Blank Labeled Spike PCB-188L 59.8 61.5 58.5 Lab Blank Labeled Spike PCB-189L 80.5 81.8 81.9 Lab Blank Labeled Spike PCB-202L 62.7 64.3 64 Lab Blank Labeled Spike PCB-205L 77.7 78.4 79.2 Lab Blank Labeled Spike PCB-206L 71 72.2 74.2 Lab Blank Labeled Spike PCB-208L 68.6 68.4 70.3 Lab Blank Labeled Spike PCB-209L 68.2 69.6 73

Page 43
Table A-9. Laboratory PCB Spiked Blank Samples Analyzed May 2016 (% Recovery).
Sample Type QC Type Analyte #1
WG54716-101 #2
WG54716-104 #3
WG54716-105 Lab Blank Labeled Spike PCB-001L 27.2 44.9 35.3 Lab Blank Labeled Spike PCB-003L 31.6 45.9 37.2 Lab Blank Labeled Spike PCB-004L 36.2 50 41 Lab Blank Labeled Spike PCB-015L 46.7 55 47 Lab Blank Labeled Spike PCB-019L 44.9 53.9 44.6 Lab Blank Labeled Spike PCB-028L 56.5 63 56.5 Lab Blank Labeled Spike PCB-037L 60.2 62 56.7 Lab Blank Labeled Spike PCB-054L 52.7 57.8 49.7 Lab Blank Labeled Spike PCB-077L 68.5 69.6 63.1 Lab Blank Labeled Spike PCB-081L 66.7 68.5 62.2 Lab Blank Labeled Spike PCB-104L 67 67.2 58.9 Lab Blank Labeled Spike PCB-105L 65.5 65.1 60.9 Lab Blank Labeled Spike PCB-111L 74.5 74.1 74.1 Lab Blank Labeled Spike PCB-114L 61.1 63 56.5 Lab Blank Labeled Spike PCB-118L 62.2 63.3 58 Lab Blank Labeled Spike PCB-123L 63.1 63.2 59.2 Lab Blank Labeled Spike PCB-126L 75.8 73.7 71.8 Lab Blank Labeled Spike PCB-155L 71.8 69.7 62.6 Lab Blank Labeled Spike PCB-156L/157L 71.5 65.8 65.1 Lab Blank Labeled Spike PCB-167L 66.5 64.1 61.5 Lab Blank Labeled Spike PCB-169L 86.9 80 82.7 Lab Blank Labeled Spike PCB-170L 74.2 70.4 68.7 Lab Blank Labeled Spike PCB-178L 77.7 77.5 75.5 Lab Blank Labeled Spike PCB-180L 73.7 68.1 67.5 Lab Blank Labeled Spike PCB-188L 73 68.8 63.9 Lab Blank Labeled Spike PCB-189L 69.6 70.7 62.8 Lab Blank Labeled Spike PCB-202L 73.9 71.4 69.3 Lab Blank Labeled Spike PCB-205L 71.5 70.9 64.8 Lab Blank Labeled Spike PCB-206L 63.4 65.2 60.3 Lab Blank Labeled Spike PCB-208L 68.7 66 61.4 Lab Blank Labeled Spike PCB-209L 63.4 63 59.8

Page 44
Table A-10. Ongoing Precision and Recovery Results for February, March, and May 2016 (% Recovery).
Sample Type QC Type Analyte February
WG54352-102 March
WG54716-102 May
WG54716-102
OPR Spike PCB-001 102 93.9 110 OPR Spike PCB-003 102 96.3 106 OPR Spike PCB-004 106 93.8 108 OPR Spike PCB-015 99.9 101 106 OPR Spike PCB-019 101 97.1 100 OPR Spike PCB-037 95.7 103 105 OPR Spike PCB-054 107 97.7 96.7 OPR Spike PCB-077 102 104 103 OPR Spike PCB-081 96.5 105 101 OPR Spike PCB-104 103 95.2 95.7 OPR Spike PCB-105 98.8 103 103 OPR Spike PCB-114 96.9 102 106 OPR Spike PCB-118 97.7 103 101 OPR Spike PCB-123 96.2 103 103 OPR Spike PCB-126 106 105 103 OPR Spike PCB-155 106 97.5 95.7 OPR Spike PCB-156/157 102 99.2 105 OPR Spike PCB-167 102 98.7 102 OPR Spike PCB-169 102 98.6 97.5 OPR Spike PCB-188 109 98.3 98.8 OPR Spike PCB-189 92.5 109 109 OPR Spike PCB-202 102 97.5 102 OPR Spike PCB-205 99.1 99.1 100 OPR Spike PCB-206 99.6 101 102 OPR Spike PCB-208 103 99.7 98.1 OPR Spike PCB-209 97.6 95.3 97.8

Page 45
Table A-11. Ongoing Precision and Recovery Results for February, March, and May 2016 (% Recovery).
Sample Type QC Type Analyte February
WG54352-102 March
WG54716-102 May
WG54716-102 OPR Labeled Spike PCB-001L 49.7 41 36.6 OPR Labeled Spike PCB-003L 51.3 46.9 40.7 OPR Labeled Spike PCB-004L 54.3 50.9 44.6 OPR Labeled Spike PCB-015L 62.1 65.5 53.9 OPR Labeled Spike PCB-019L 53.7 61.3 51.1 OPR Labeled Spike PCB-028L 82.3 78.3 62.3 OPR Labeled Spike PCB-037L 75.7 80.1 64.8 OPR Labeled Spike PCB-054L 65.1 68.1 57.7 OPR Labeled Spike PCB-077L 76.5 94.6 77.4 OPR Labeled Spike PCB-081L 77.2 92.4 75.7 OPR Labeled Spike PCB-104L 59.4 69.1 68 OPR Labeled Spike PCB-105L 82.5 92.5 73.1 OPR Labeled Spike PCB-111L 71.1 79.9 81 OPR Labeled Spike PCB-114L 72.7 88.3 69.5 OPR Labeled Spike PCB-118L 72.5 89.9 70.1 OPR Labeled Spike PCB-123L 73 89.1 71.8 OPR Labeled Spike PCB-126L 57.1 90.7 84.3 OPR Labeled Spike PCB-155L 80.7 70.7 69.8 OPR Labeled Spike PCB-156L/157L 71 80.5 74.3 OPR Labeled Spike PCB-167L 68.2 82.1 73.1 OPR Labeled Spike PCB-169L 64.3 78.6 87.2 OPR Labeled Spike PCB-178L 67.4 82.6 81 OPR Labeled Spike PCB-188L 68.2 66.2 69.7 OPR Labeled Spike PCB-189L 74.1 88.6 78.9 OPR Labeled Spike PCB-202L 57.9 66.6 75 OPR Labeled Spike PCB-205L 78.4 82.1 76.1 OPR Labeled Spike PCB-206L 64.1 71.8 72 OPR Labeled Spike PCB-208L 66.8 73.4 73.7 OPR Labeled Spike PCB-209L 62.7 66.3 73.3

Page 46
Table A-12. Dieldrin QC Results for Laboratory Blanks and On-going Precision and Recovery Samples.
Laboratory Sample ID
Sample Type
QC Type Sample Date Analyte
Result
(pg/L) 1 Percent
Recovery WG54245-101i Blank Lab Blank 2/9/2016 Dieldrin 22.7 NJ - WG54245-101i Blank Spiked Blank 2/9/2016 13C-Dieldrin - 86.2 WG54245-102i Blank OPR2 2/9/2016 Dieldrin - 97 WG54245-102i Blank OPR 2/9/2016 13C-Dieldrin - 83.3 WG54733-101 Blank Lab Blank 3/22/2016 Dieldrin 21.4 NJ - WG54733-101 Blank Spiked Blank 3/22/2016 13C-Dieldrin - 91.2 WG54733-102 Blank OPR 3/22/2016 Dieldrin - 95.8 WG54733-102 Blank OPR 3/22/2016 13C-Dieldrin - 90 WG55181-101 Blank Lab Blank 5/3/2016 Dieldrin 5.37 UJ - WG55181-101 Blank Spiked Blank 5/3/2016 13C-Dieldrin - 80.9 WG55181-102 Blank OPR 5/3/2016 Dieldrin - 99.7 WG55181-102 Blank OPR 5/3/2016 13C-Dieldrin - 80.4 1 = Picograms per liter, parts per quadrillion.

Page 47
Appendix B. Sample Logs for PCBs, Dieldrin, and TSS Table B-1. Composite Sample Logs for PCBs, Dieldrin, and TSS.
Sample Location
Subsample Number
Sample Date
Sample Time
Subsample1 Volume (mLs)
Influent
1
2/9/2016
0014
125
2 0315 3 0610 4 0910 5 1210 6 1510 7 1800 8 2110
Effluent
1
2/9/2016
0025
125
2 0325 3 0620 4 0940 5 1220 6 1525 7 1810 8 2125
Influent
1
3/22/2016
0011
125
2 0305 3 0616 4 0907 5 1156 6 1507 7 1751 8 2109
Effluent
1
3/22/2016
0030
125
2 0315 3 0631 4 0915 5 1207 6 1520 7 1805 8 2120
Influent
1
5/3/2016
0005
125 2 0309 3 0602 4 0900

Page 48
Sample Location
Subsample Number
Sample Date
Sample Time
Subsample1 Volume (mLs)
5 1201 6 1503 7 1805 8 2100
Effluent
1
5/3/2016
0015
125
2 0319 3 0612 4 0912 5 1212 6 1515 7 1816 8 2110
1 = PCB, dieldrin, and TSS samples were a composite of eight 125 mL subsamples collected over 24 hours.

Page 49
Appendix C. Glossary, Acronyms, and Abbreviations
Glossary Clean Water Act: A federal act passed in 1972 that contains provisions to restore and maintain the quality of the nation’s waters. Section 303(d) of the Clean Water Act establishes the TMDL program.
Effluent: An outflowing of water from a natural body of water or from a man-made structure. For example, the treated outflow from a wastewater treatment plant.
National Pollutant Discharge Elimination System (NPDES): National program for issuing, modifying, revoking and reissuing, terminating, monitoring, and enforcing permits, and imposing and enforcing pretreatment requirements under the Clean Water Act. The NPDES program regulates discharges from wastewater treatment plants, large factories, and other facilities that use, process, and discharge water back into lakes, streams, rivers, bays, and oceans.
Nonpoint source: Pollution that enters any waters of the state from any dispersed land-based or water-based activities, including but not limited to atmospheric deposition, surface-water runoff from agricultural lands, urban areas, or forest lands, subsurface or underground sources, or discharges from boats or marine vessels not otherwise regulated under the NPDES program. Generally, any unconfined and diffuse source of contamination. Legally, any source of water pollution that does not meet the legal definition of “point source” in section 502(14) of the Clean Water Act.
Parameter: Water quality constituent being measured (analyte). A physical, chemical, or biological property whose values determine environmental characteristics or behavior.
pH: A measure of the acidity or alkalinity of water. A low pH value (0 to 7) indicates that an acidic condition is present, while a high pH (7 to 14) indicates a basic or alkaline condition. A pH of 7 is considered to be neutral. Since the pH scale is logarithmic, a water sample with a pH of 8 is ten times more basic than one with a pH of 7.
Point source: Sources of pollution that discharge at a specific location from pipes, outfalls, and conveyance channels to a surface water. Examples of point source discharges include municipal wastewater treatment plants, municipal stormwater systems, industrial waste treatment facilities, and construction sites where more than 5 acres of land have been cleared.
Pollution: Contamination or other alteration of the physical, chemical, or biological properties of any waters of the state. This includes change in temperature, taste, color, turbidity, or odor of the waters. It also includes discharge of any liquid, gaseous, solid, radioactive, or other substance into any waters of the state. This definition assumes that these changes will, or are likely to, create a nuisance or render such waters harmful, detrimental, or injurious to (1) public health, safety, or welfare, or (2) domestic, commercial, industrial, agricultural, recreational, or other legitimate beneficial uses, or (3) livestock, wild animals, birds, fish, or other aquatic life.
Page 50
Stormwater: The portion of precipitation that does not naturally percolate into the ground or evaporate but instead runs off roads, pavement, and roofs during rainfall or snow melt. Stormwater can also come from hard or saturated grass surfaces such as lawns, pastures, playfields, and from gravel roads and parking lots.
Surface waters of the state: Lakes, rivers, ponds, streams, inland waters, salt waters, wetlands and all other surface waters and water courses within the jurisdiction of Washington State.
Total Maximum Daily Load (TMDL): Water cleanup plan. A distribution of a substance in a waterbody designed to protect it from not meeting (exceeding) water quality standards. A TMDL is equal to the sum of all of the following: (1) individual wasteload allocations for point sources, (2) the load allocations for nonpoint sources, (3) the contribution of natural sources, and (4) a Margin of Safety to allow for uncertainty in the wasteload determination. A reserve for future growth is also generally provided.
Watershed: A drainage area or basin in which all land and water areas drain or flow toward a central collector such as a stream, river, or lake at a lower elevation.
303(d) list: Section 303(d) of the federal Clean Water Act requires Washington State to periodically prepare a list of all surface waters in the state for which beneficial uses of the water – such as for drinking, recreation, aquatic habitat, and industrial use – are impaired by pollutants. These are water quality-limited estuaries, lakes, and streams that fall short of state surface water quality standards and are not expected to improve within the next two years.
Acronyms and Abbreviations BMP Best management practice BOD Biochemical oxygen demand Ecology Washington State Department of Ecology EIM Environmental Information Management database EPA U.S. Environmental Protection Agency HHC Human health criteria MEL Manchester Environmental Laboratory NPDES (See Glossary above) NTR National Toxics Rule (human health criteria) OPR Ongoing precision and recovery PBT Persistent, bioaccumulative, and toxic substance QA Quality Assurance QC Quality Control RPD Relative percent difference SOP Standard operating procedure TMDL (See Glossary above) TSS Total suspended solids USGS U.S. Geological Survey WAC Washington Administrative Code WLA Wasteload allocation

Page 51
WRIA Water Resource Inventory Area WWTP Wastewater treatment plant Units of Measurement °C degrees centigrade dw dry weight ft feet g gram, a unit of mass g/day grams per day kg kilograms, a unit of mass equal to 1,000 grams km kilometer, a unit of length equal to 1,000 meters m meter mg milligram mgd million gallons per day mg/L milligrams per liter (parts per million) mL milliliters mm millimeters ng/Kg nanograms per kilogram (parts per trillion) ng/L nanograms per liter (parts per trillion) pg/L picograms per liter (parts per quadrillion) s.u. standard units ug/Kg micrograms per kilogram (parts per billion) ug/L micrograms per liter (parts per billion)