alaska educator evaluation system teacher …akrti2015.pbworks.com/f/sunday-topic 8 - slos...
TRANSCRIPT
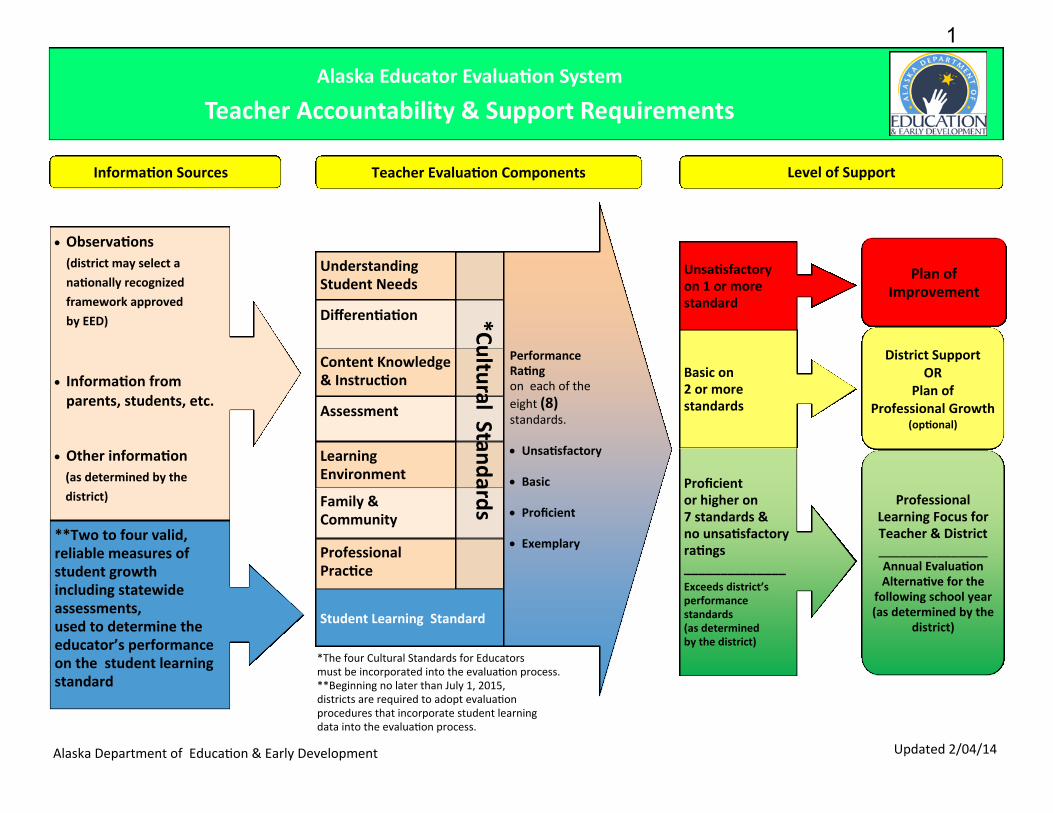
Information Sources Teacher Evaluation Components Level of Support
Alaska Educator Evaluation System
Teacher Accountability & Support Requirements
**Two to four valid, reliable measures of student growth including statewide assessments, used to determine the educator’s performance on the student learning standard
Observations
(district may select a
nationally recognized
framework approved
by EED)
Information from parents, students, etc.
Other information
(as determined by the
district) Professional Learning Focus for Teacher & District _______________ Annual Evaluation Alternative for the
following school year (as determined by the
district)
District Support OR
Plan of Professional Growth
(optional)
Plan of Improvement
Proficient or higher on 7 standards & no unsatisfactory ratings ______________ Exceeds district’s performance standards (as determined by the district)
Basic on 2 or more standards
Unsatisfactory on 1 or more standard
Student Learning Standard
Professional Practice
Family & Community
Learning Environment
Assessment
Content Knowledge & Instruction
Understanding Student Needs
Differentiation *Cu
ltural Stan
dard
s
Performance Rating on each of the
eight (8) standards. Unsatisfactory Basic Proficient Exemplary
Updated 2/04/14
*The four Cultural Standards for Educators must be incorporated into the evaluation process. **Beginning no later than July 1, 2015, districts are required to adopt evaluation procedures that incorporate student learning data into the evaluation process.
Alaska Department of Education & Early Development
1
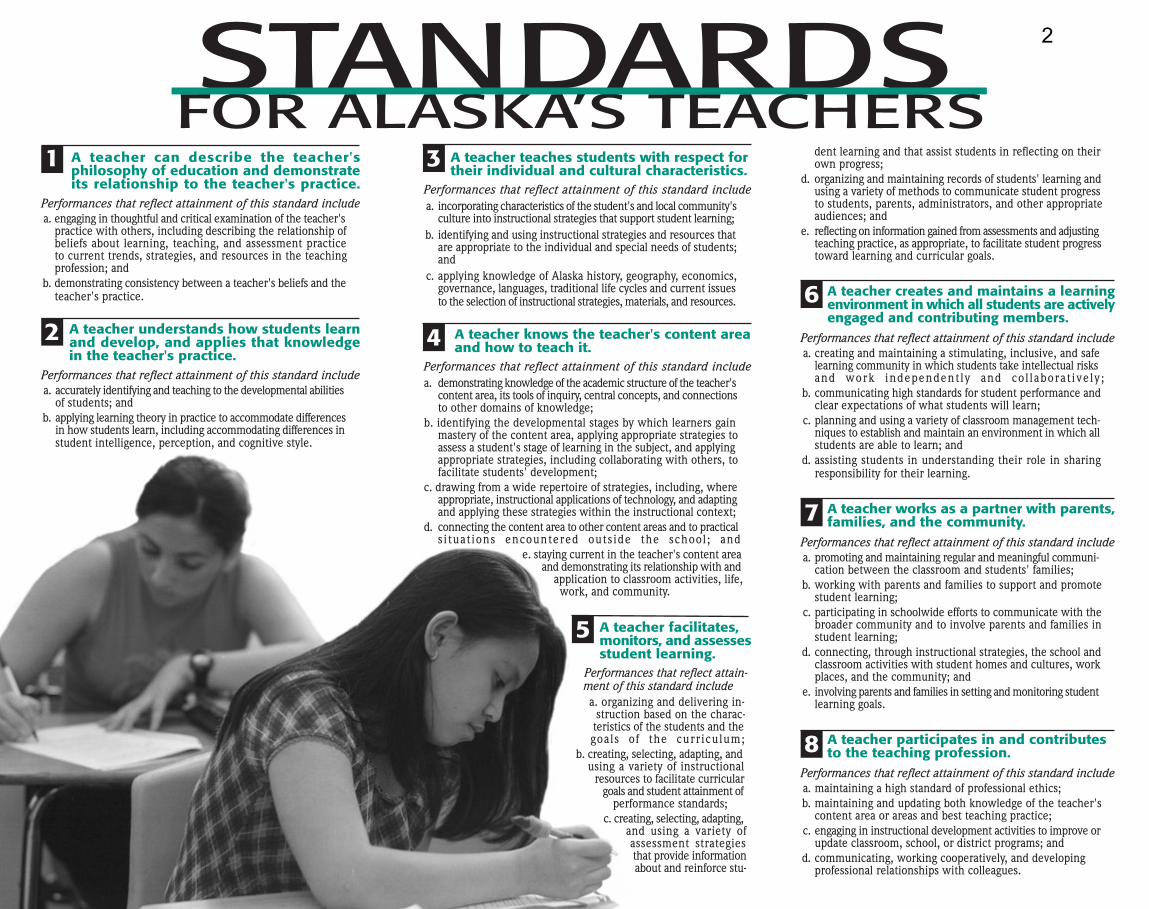
STANDARDSFOR ALASKA’S TEACHERS
2
A teacher teaches students with respect fortheir individual and cultural characteristics.
Performances that reflect attainment of this standard includea. incorporating characteristics of the student's and local community's
culture into instructional strategies that support student learning;b. identifying and using instructional strategies and resources that
are appropriate to the individual and special needs of students;and
c. applying knowledge of Alaska history, geography, economics,governance, languages, traditional life cycles and current issuesto the selection of instructional strategies, materials, and resources.
A teacher knows the teacher's content areaand how to teach it.
Performances that reflect attainment of this standard includea. demonstrating knowledge of the academic structure of the teacher's
content area, its tools of inquiry, central concepts, and connectionsto other domains of knowledge;
b. identifying the developmental stages by which learners gainmastery of the content area, applying appropriate strategies toassess a student's stage of learning in the subject, and applyingappropriate strategies, including collaborating with others, tofacilitate students' development;
c. drawing from a wide repertoire of strategies, including, whereappropriate, instructional applications of technology, and adaptingand applying these strategies within the instructional context;
d. connecting the content area to other content areas and to practicals i tuations encountered outside the school; and
e. staying current in the teacher's content areaand demonstrating its relationship with and
application to classroom activities, life,work, and community.
A teacher facilitates,monitors, and assessesstudent learning.
Performances that reflect attain-ment of this standard include a. organizing and delivering in-
struction based on the charac-teristics of the students and thegoals of the curriculum;
b. creating, selecting, adapting, andusing a variety of instructional
resources to facilitate curriculargoals and student attainment of
performance standards;c. creating, selecting, adapting,
and using a variety ofassessment strategiesthat provide informationabout and reinforce stu-
3
4
A teacher can describe the teacher'sphilosophy of education and demonstrateits relationship to the teacher's practice.
Performances that reflect attainment of this standard includea. engaging in thoughtful and critical examination of the teacher's
practice with others, including describing the relationship ofbeliefs about learning, teaching, and assessment practiceto current trends, strategies, and resources in the teachingprofession; and
b. demonstrating consistency between a teacher's beliefs and theteacher's practice.
A teacher understands how students learnand develop, and applies that knowledgein the teacher's practice.
Performances that reflect attainment of this standard includea. accurately identifying and teaching to the developmental abilities
of students; andb. applying learning theory in practice to accommodate differences
in how students learn, including accommodating differences instudent intelligence, perception, and cognitive style.
dent learning and that assist students in reflecting on theirown progress;
d. organizing and maintaining records of students' learning andusing a variety of methods to communicate student progressto students, parents, administrators, and other appropriateaudiences; and
e. reflecting on information gained from assessments and adjustingteaching practice, as appropriate, to facilitate student progresstoward learning and curricular goals.
A teacher creates and maintains a learningenvironment in which all students are activelyengaged and contributing members.
Performances that reflect attainment of this standard includea. creating and maintaining a stimulating, inclusive, and safe
learning community in which students take intellectual risksand work independent ly and col laborat ively ;
b. communicating high standards for student performance andclear expectations of what students will learn;
c. planning and using a variety of classroom management tech-niques to establish and maintain an environment in which allstudents are able to learn; and
d. assisting students in understanding their role in sharingresponsibility for their learning.
A teacher works as a partner with parents,families, and the community.
Performances that reflect attainment of this standard includea. promoting and maintaining regular and meaningful communi-
cation between the classroom and students' families;b. working with parents and families to support and promote
student learning;c. participating in schoolwide efforts to communicate with the
broader community and to involve parents and families instudent learning;
d. connecting, through instructional strategies, the school andclassroom activities with student homes and cultures, workplaces, and the community; and
e. involving parents and families in setting and monitoring studentlearning goals.
A teacher participates in and contributesto the teaching profession.
Performances that reflect attainment of this standard includea. maintaining a high standard of professional ethics;b. maintaining and updating both knowledge of the teacher's
content area or areas and best teaching practice;c. engaging in instructional development activities to improve or
update classroom, school, or district programs; andd. communicating, working cooperatively, and developing
professional relationships with colleagues.
5
6
7
8
1
2
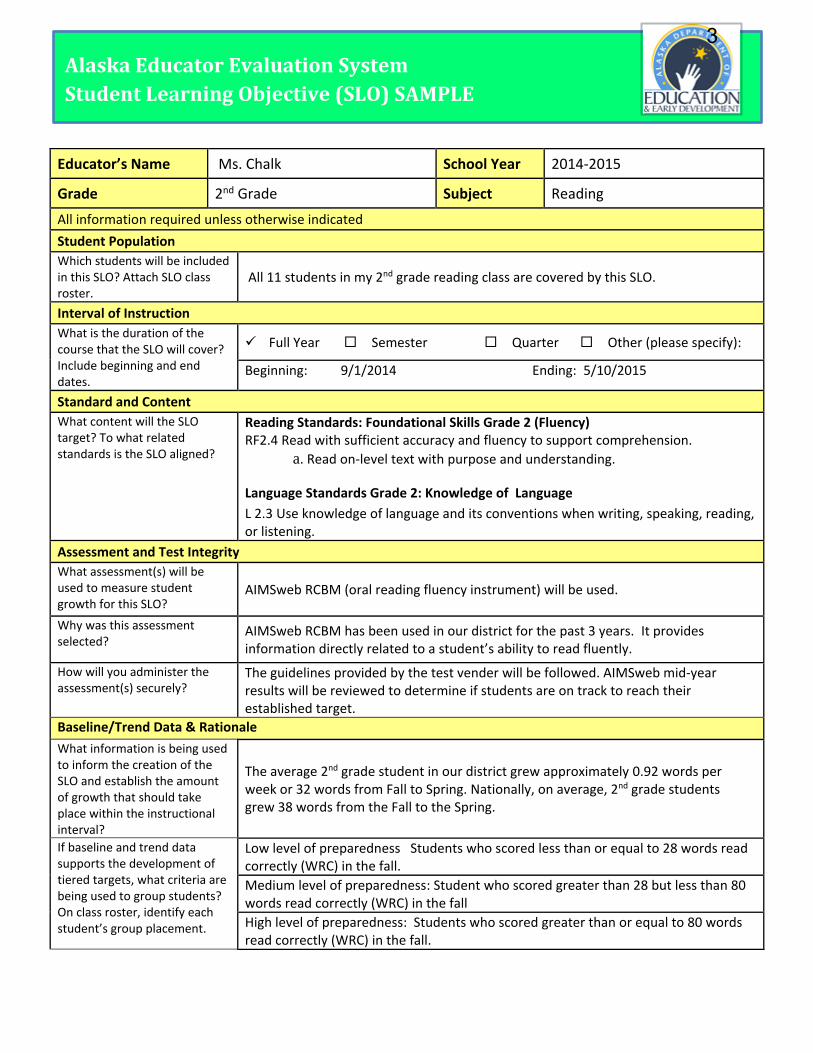
Alaska Educator Evaluation System
Student Learning Objective (SLO) SAMPLE
Educator’s Name Ms. Chalk School Year 2014-2015
Grade 2nd Grade Subject Reading
All information required unless otherwise indicated
Student Population
Which students will be included in this SLO? Attach SLO class roster.
All 11 students in my 2nd grade reading class are covered by this SLO.
Interval of Instruction
What is the duration of the course that the SLO will cover? Include beginning and end dates.
Full Year Semester Quarter Other (please specify):
Beginning: 9/1/2014 Ending: 5/10/2015
Standard and Content
What content will the SLO target? To what related standards is the SLO aligned?
Reading Standards: Foundational Skills Grade 2 (Fluency) RF2.4 Read with sufficient accuracy and fluency to support comprehension.
a. Read on-level text with purpose and understanding.
Language Standards Grade 2: Knowledge of Language
L 2.3 Use knowledge of language and its conventions when writing, speaking, reading, or listening.
Assessment and Test Integrity
What assessment(s) will be used to measure student growth for this SLO?
AIMSweb RCBM (oral reading fluency instrument) will be used.
Why was this assessment selected?
AIMSweb RCBM has been used in our district for the past 3 years. It provides information directly related to a student’s ability to read fluently.
How will you administer the assessment(s) securely?
The guidelines provided by the test vender will be followed. AIMSweb mid-year results will be reviewed to determine if students are on track to reach their established target.
Baseline/Trend Data & Rationale
What information is being used to inform the creation of the SLO and establish the amount of growth that should take place within the instructional interval?
The average 2nd grade student in our district grew approximately 0.92 words per week or 32 words from Fall to Spring. Nationally, on average, 2nd grade students grew 38 words from the Fall to the Spring.
If baseline and trend data supports the development of tiered targets, what criteria are being used to group students? On class roster, identify each student’s group placement.
Low level of preparedness Students who scored less than or equal to 28 words read correctly (WRC) in the fall.
Medium level of preparedness: Student who scored greater than 28 but less than 80 words read correctly (WRC) in the fall
High level of preparedness: Students who scored greater than or equal to 80 words read correctly (WRC) in the fall.
3
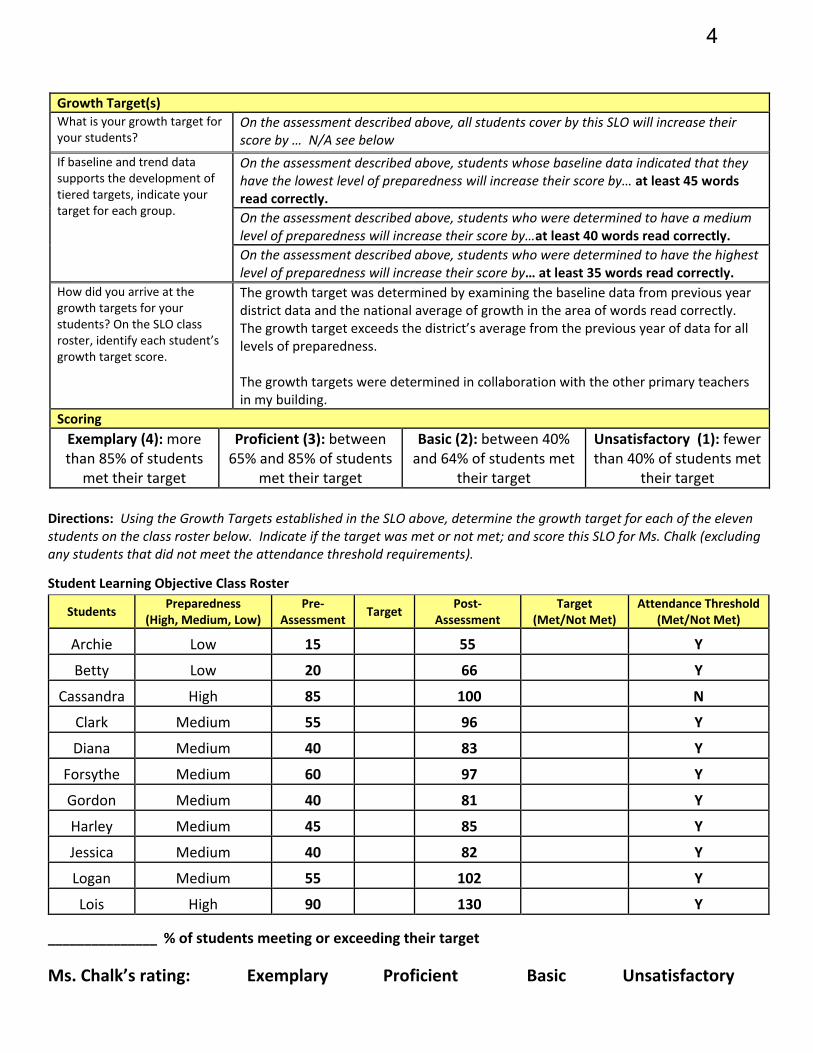
Directions: Using the Growth Targets established in the SLO above, determine the growth target for each of the eleven students on the class roster below. Indicate if the target was met or not met; and score this SLO for Ms. Chalk (excluding any students that did not meet the attendance threshold requirements).
Student Learning Objective Class Roster
Students Preparedness
(High, Medium, Low) Pre-
Assessment Target
Post-Assessment
Target (Met/Not Met)
Attendance Threshold (Met/Not Met)
Archie Low 15 55 Y
Betty Low 20 66 Y
Cassandra High 85 100 N
Clark Medium 55 96 Y
Diana Medium 40 83 Y
Forsythe Medium 60 97 Y
Gordon Medium 40 81 Y
Harley Medium 45 85 Y
Jessica Medium 40 82 Y
Logan Medium 55 102 Y
Lois High 90 130 Y
_______________ % of students meeting or exceeding their target
Ms. Chalk’s rating: Exemplary Proficient Basic Unsatisfactory
Growth Target(s) What is your growth target for your students?
On the assessment described above, all students cover by this SLO will increase their score by … N/A see below
If baseline and trend data supports the development of tiered targets, indicate your target for each group.
On the assessment described above, students whose baseline data indicated that they have the lowest level of preparedness will increase their score by… at least 45 words read correctly.
On the assessment described above, students who were determined to have a medium level of preparedness will increase their score by…at least 40 words read correctly.
On the assessment described above, students who were determined to have the highest level of preparedness will increase their score by… at least 35 words read correctly.
How did you arrive at the growth targets for your students? On the SLO class roster, identify each student’s growth target score.
The growth target was determined by examining the baseline data from previous year district data and the national average of growth in the area of words read correctly. The growth target exceeds the district’s average from the previous year of data for all levels of preparedness. The growth targets were determined in collaboration with the other primary teachers in my building.
Scoring
Exemplary (4): more than 85% of students
met their target
Proficient (3): between 65% and 85% of students
met their target
Basic (2): between 40% and 64% of students met
their target
Unsatisfactory (1): fewer than 40% of students met
their target
4
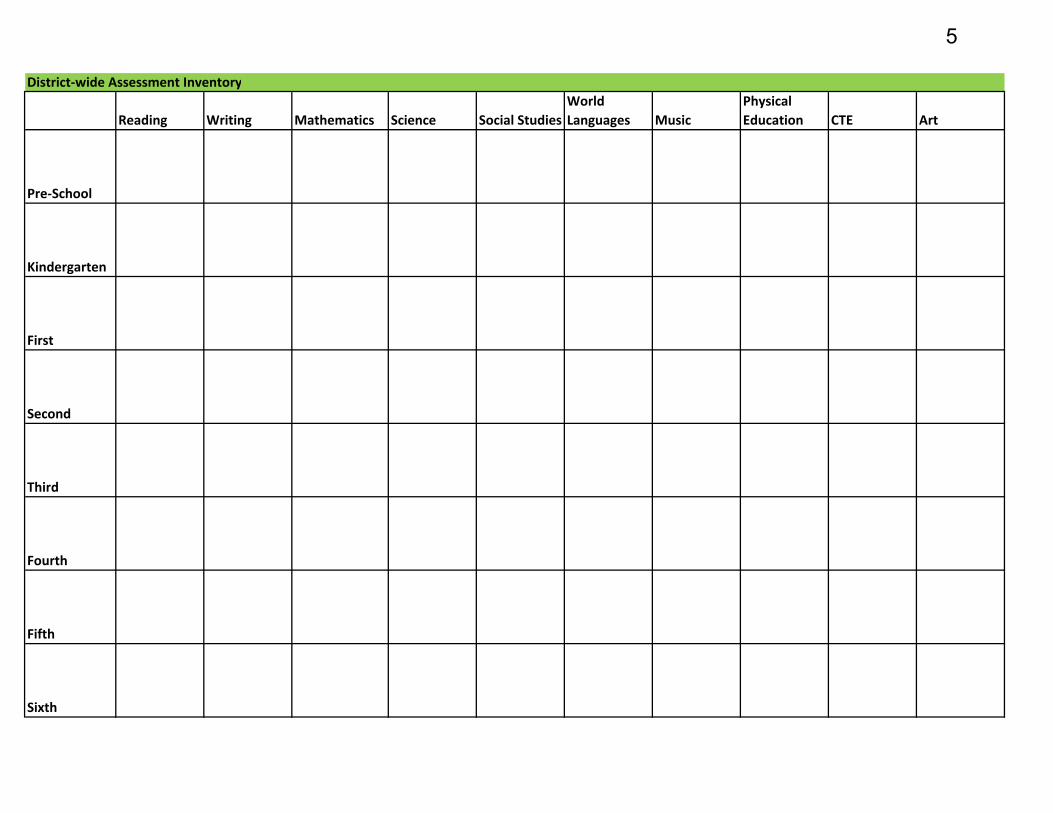
District‐wide Assessment Inventory
Reading Writing Mathematics Science Social StudiesWorld Languages Music
Physical Education CTE Art
Pre‐School
Kindergarten
First
Second
Third
Fourth
Fifth
Sixth
5
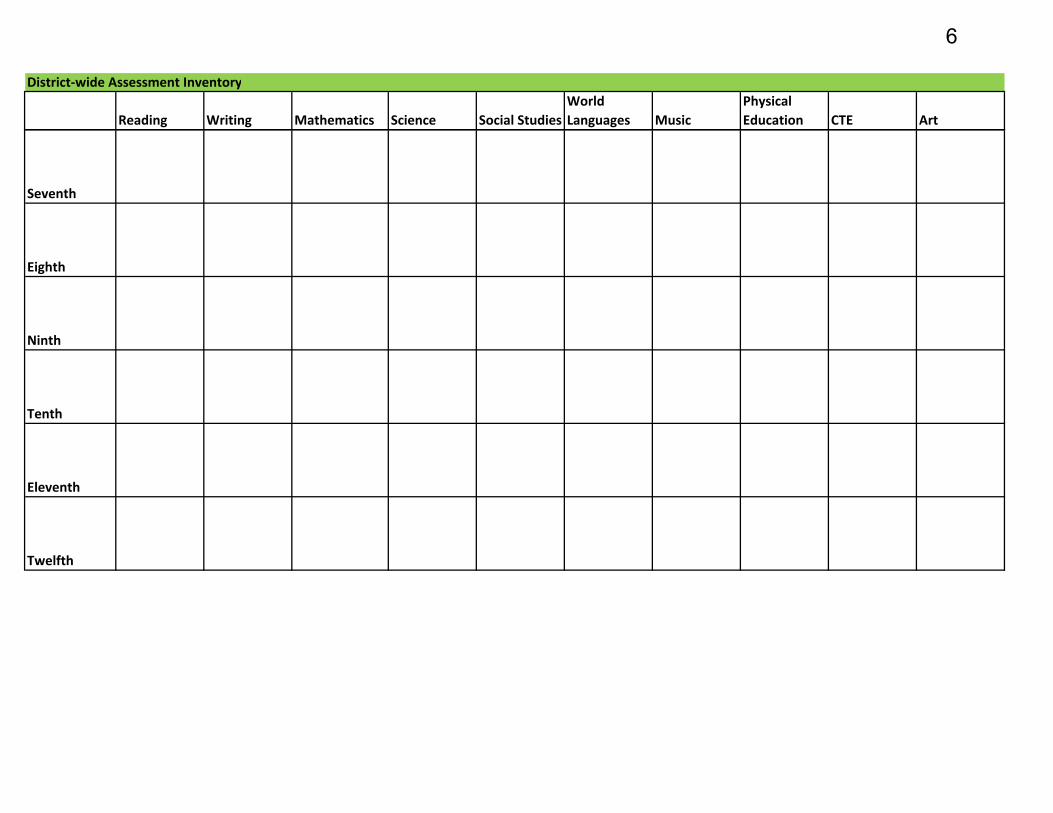
District‐wide Assessment Inventory
Reading Writing Mathematics Science Social StudiesWorld Languages Music
Physical Education CTE Art
Seventh
Eighth
Ninth
Tenth
Eleventh
Twelfth
6
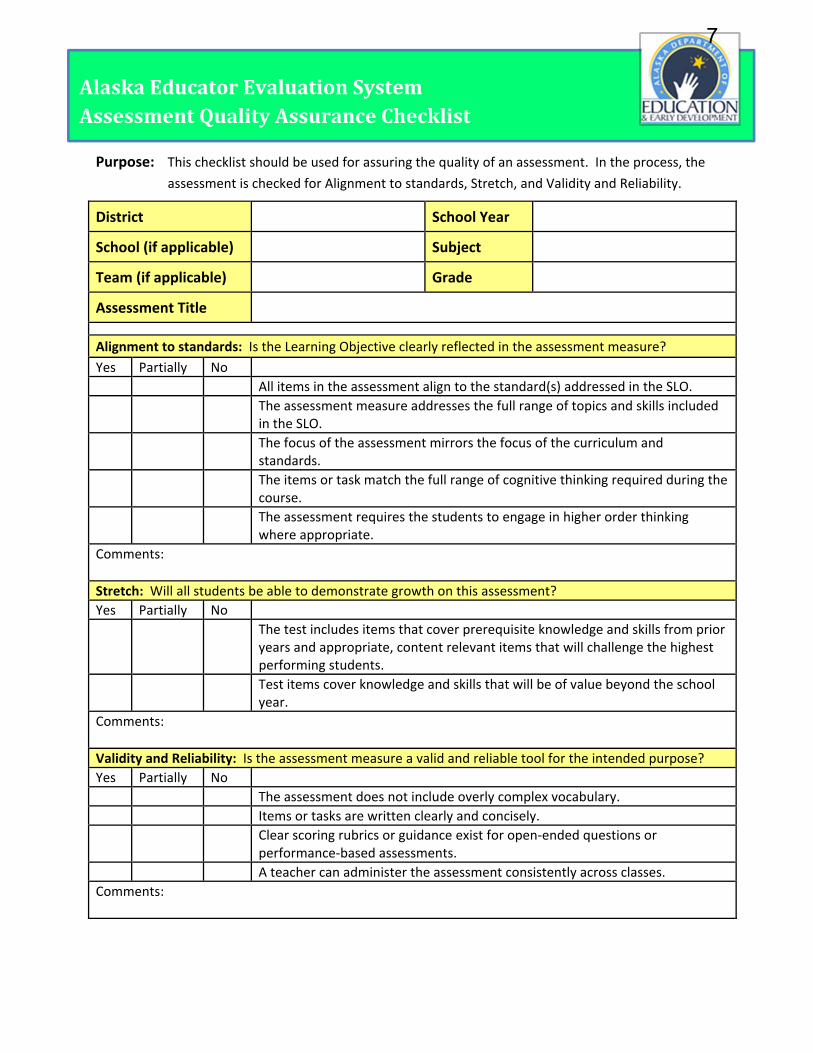
Purpose: This checklist should be used for assuring the quality of an assessment. In the process, the
assessment is checked for Alignment to standards, Stretch, and Validity and Reliability.
District School Year
School (if applicable) Subject
Team (if applicable) Grade
Assessment Title
Alignment to standards: Is the Learning Objective clearly reflected in the assessment measure? Yes Partially No All items in the assessment align to the standard(s) addressed in the SLO. The assessment measure addresses the full range of topics and skills included
in the SLO. The focus of the assessment mirrors the focus of the curriculum and
standards. The items or task match the full range of cognitive thinking required during the
course. The assessment requires the students to engage in higher order thinking
where appropriate. Comments: Stretch: Will all students be able to demonstrate growth on this assessment? Yes Partially No The test includes items that cover prerequisite knowledge and skills from prior
years and appropriate, content relevant items that will challenge the highest performing students.
Test items cover knowledge and skills that will be of value beyond the school year.
Comments: Validity and Reliability: Is the assessment measure a valid and reliable tool for the intended purpose? Yes Partially No The assessment does not include overly complex vocabulary. Items or tasks are written clearly and concisely. Clear scoring rubrics or guidance exist for open‐ended questions or
performance‐based assessments. A teacher can administer the assessment consistently across classes. Comments:
AlaskaEducatorEvaluationSystemAssessmentQualityAssuranceChecklist
7
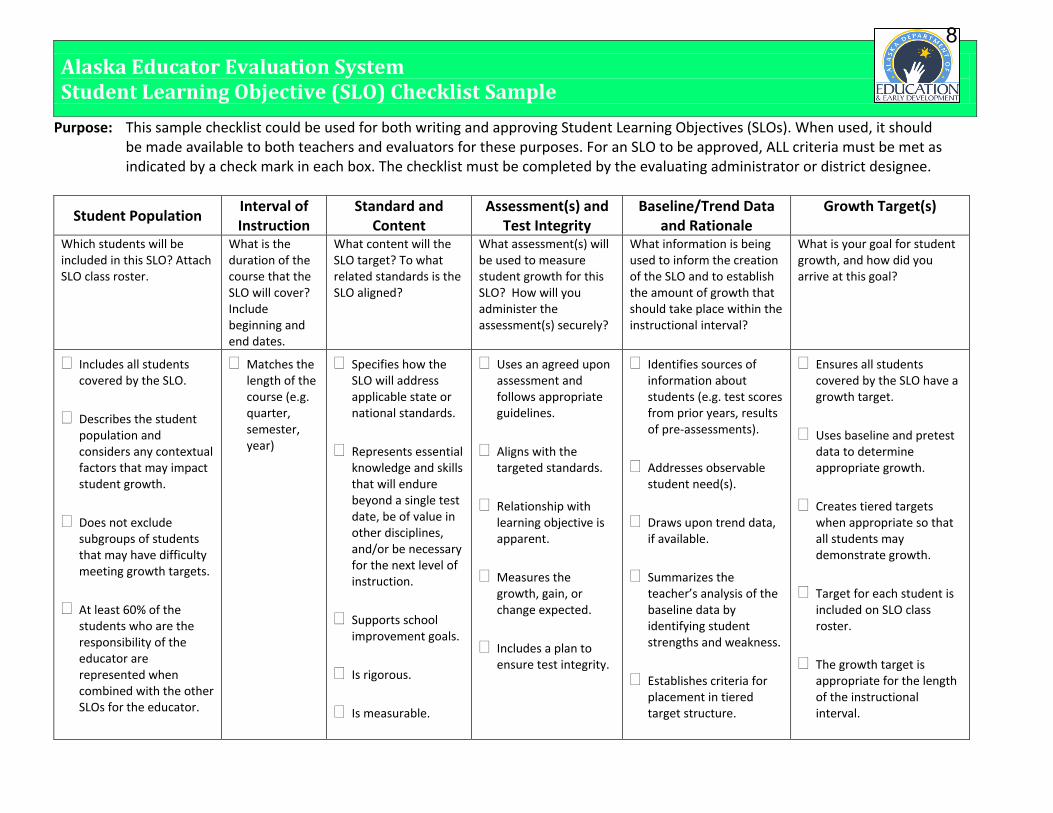
Purpose: This sample checklist could be used for both writing and approving Student Learning Objectives (SLOs). When used, it should be made available to both teachers and evaluators for these purposes. For an SLO to be approved, ALL criteria must be met as indicated by a check mark in each box. The checklist must be completed by the evaluating administrator or district designee.
Student Population Interval of Instruction
Standard and Content
Assessment(s) and Test Integrity
Baseline/Trend Data and Rationale
Growth Target(s)
Which students will be included in this SLO? Attach SLO class roster.
What is the duration of the course that the SLO will cover? Include beginning and end dates.
What content will the SLO target? To what related standards is the SLO aligned?
What assessment(s) will be used to measure student growth for this SLO? How will you administer the assessment(s) securely?
What information is being used to inform the creation of the SLO and to establish the amount of growth that should take place within the instructional interval?
What is your goal for student growth, and how did you arrive at this goal?
Includes all students covered by the SLO.
Describes the student population and considers any contextual factors that may impact student growth.
Does not exclude subgroups of students that may have difficulty meeting growth targets.
At least 60% of the students who are the responsibility of the educator are represented when combined with the other SLOs for the educator.
Matches the length of the course (e.g. quarter, semester, year)
Specifies how the SLO will address applicable state or national standards.
Represents essential knowledge and skills that will endure beyond a single test date, be of value in other disciplines, and/or be necessary for the next level of instruction.
Supports school improvement goals.
Is rigorous.
Is measurable.
Uses an agreed upon assessment and follows appropriate guidelines.
Aligns with the targeted standards.
Relationship with learning objective is apparent.
Measures the growth, gain, or change expected.
Includes a plan to ensure test integrity.
Identifies sources of information about students (e.g. test scores from prior years, results of pre-assessments).
Addresses observable student need(s).
Draws upon trend data, if available.
Summarizes the teacher’s analysis of the baseline data by identifying student strengths and weakness.
Establishes criteria for placement in tiered target structure.
Ensures all students covered by the SLO have a growth target.
Uses baseline and pretest data to determine appropriate growth.
Creates tiered targets when appropriate so that all students may demonstrate growth.
Target for each student is included on SLO class roster.
The growth target is appropriate for the length of the instructional interval.
Alaska Educator Evaluation System Student Learning Objective (SLO) Checklist Sample
8
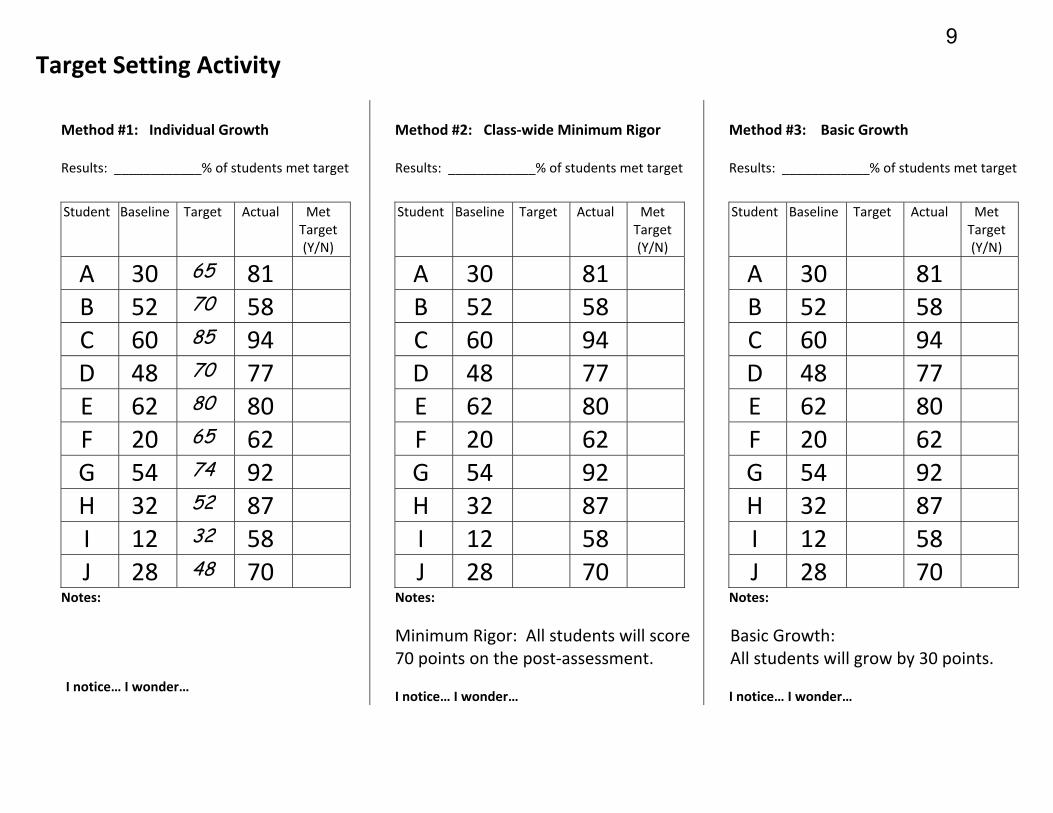
Target Setting Activity
Method #1: Individual Growth
Method #2: Class‐wide Minimum Rigor
Method #3: Basic Growth
Results: ____________% of students met target
Results: ____________% of students met target
Results: ____________% of students met target
Student Baseline Target Actual Met Target (Y/N)
A 30 65 81 B 52 70 58 C 60 85 94 D 48 70 77 E 62 80 80 F 20 65 62 G 54 74 92 H 32 52 87 I 12 32 58 J 28 48 70
Student Baseline Target Actual Met Target (Y/N)
A 30 81 B 52 58 C 60 94 D 48 77 E 62 80 F 20 62 G 54 92 H 32 87 I 12 58 J 28 70
Student Baseline Target Actual Met Target (Y/N)
A 30 81 B 52 58 C 60 94 D 48 77 E 62 80 F 20 62 G 54 92 H 32 87 I 12 58 J 28 70
Notes:
I notice… I wonder…
Notes: Minimum Rigor: All students will score 70 points on the post‐assessment.
I notice… I wonder…
Notes:
Basic Growth: All students will grow by 30 points.
I notice… I wonder…
9
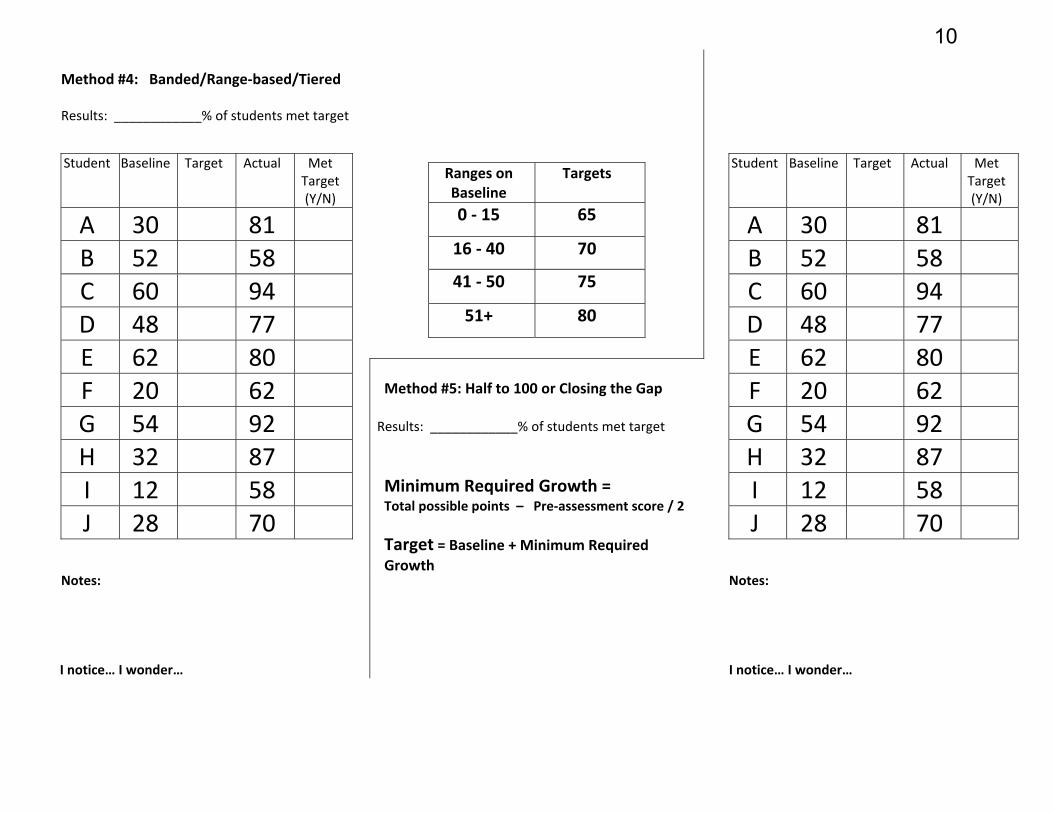
Method #4: Banded/Range‐based/Tiered
Results: ____________% of students met target
Student Baseline Target Actual Met Target (Y/N)
A 30 81 B 52 58 C 60 94 D 48 77 E 62 80 F 20 62 G 54 92 H 32 87 I 12 58 J 28 70
Ranges on Baseline
Targets
0 ‐ 15 65
16 ‐ 40 70
41 ‐ 50 75
51+ 80
Student Baseline Target Actual Met Target (Y/N)
A 30 81 B 52 58 C 60 94 D 48 77 E 62 80 F 20 62 G 54 92 H 32 87 I 12 58 J 28 70
Method #5: Half to 100 or Closing the Gap Results: ____________% of students met target Minimum Required Growth = Total possible points – Pre‐assessment score / 2 Target = Baseline + Minimum Required Growth Notes:
I notice… I wonder…
Notes:
I notice… I wonder…
10
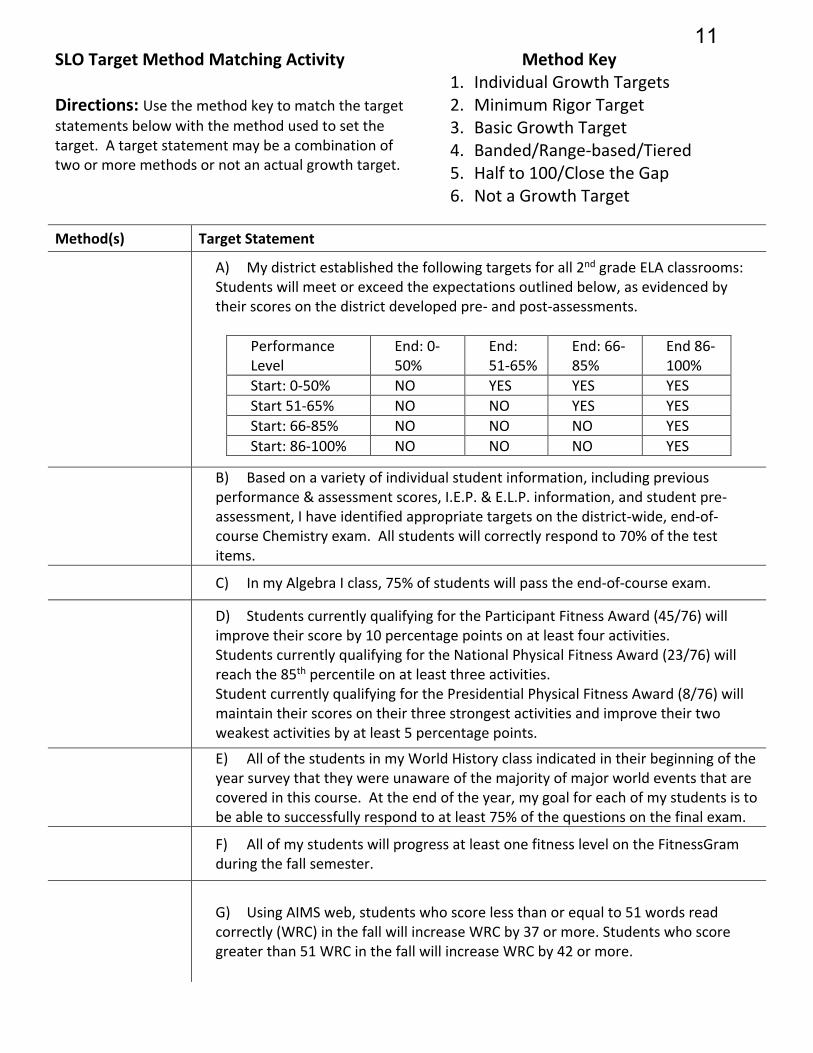
SLO Target Method Matching Activity Directions: Use the method key to match the target
statements below with the method used to set the target. A target statement may be a combination of two or more methods or not an actual growth target.
Method Key 1. Individual Growth Targets 2. Minimum Rigor Target 3. Basic Growth Target 4. Banded/Range-based/Tiered 5. Half to 100/Close the Gap 6. Not a Growth Target
Method(s) Target Statement
A) My district established the following targets for all 2nd grade ELA classrooms: Students will meet or exceed the expectations outlined below, as evidenced by their scores on the district developed pre- and post-assessments.
Performance Level
End: 0-50%
End: 51-65%
End: 66-85%
End 86-100%
Start: 0-50% NO YES YES YES
Start 51-65% NO NO YES YES
Start: 66-85% NO NO NO YES
Start: 86-100% NO NO NO YES
B) Based on a variety of individual student information, including previous performance & assessment scores, I.E.P. & E.L.P. information, and student pre-assessment, I have identified appropriate targets on the district-wide, end-of-course Chemistry exam. All students will correctly respond to 70% of the test items.
C) In my Algebra I class, 75% of students will pass the end-of-course exam.
D) Students currently qualifying for the Participant Fitness Award (45/76) will improve their score by 10 percentage points on at least four activities. Students currently qualifying for the National Physical Fitness Award (23/76) will reach the 85th percentile on at least three activities. Student currently qualifying for the Presidential Physical Fitness Award (8/76) will maintain their scores on their three strongest activities and improve their two weakest activities by at least 5 percentage points.
E) All of the students in my World History class indicated in their beginning of the year survey that they were unaware of the majority of major world events that are covered in this course. At the end of the year, my goal for each of my students is to be able to successfully respond to at least 75% of the questions on the final exam.
F) All of my students will progress at least one fitness level on the FitnessGram during the fall semester.
G) Using AIMS web, students who score less than or equal to 51 words read correctly (WRC) in the fall will increase WRC by 37 or more. Students who score greater than 51 WRC in the fall will increase WRC by 42 or more.
11
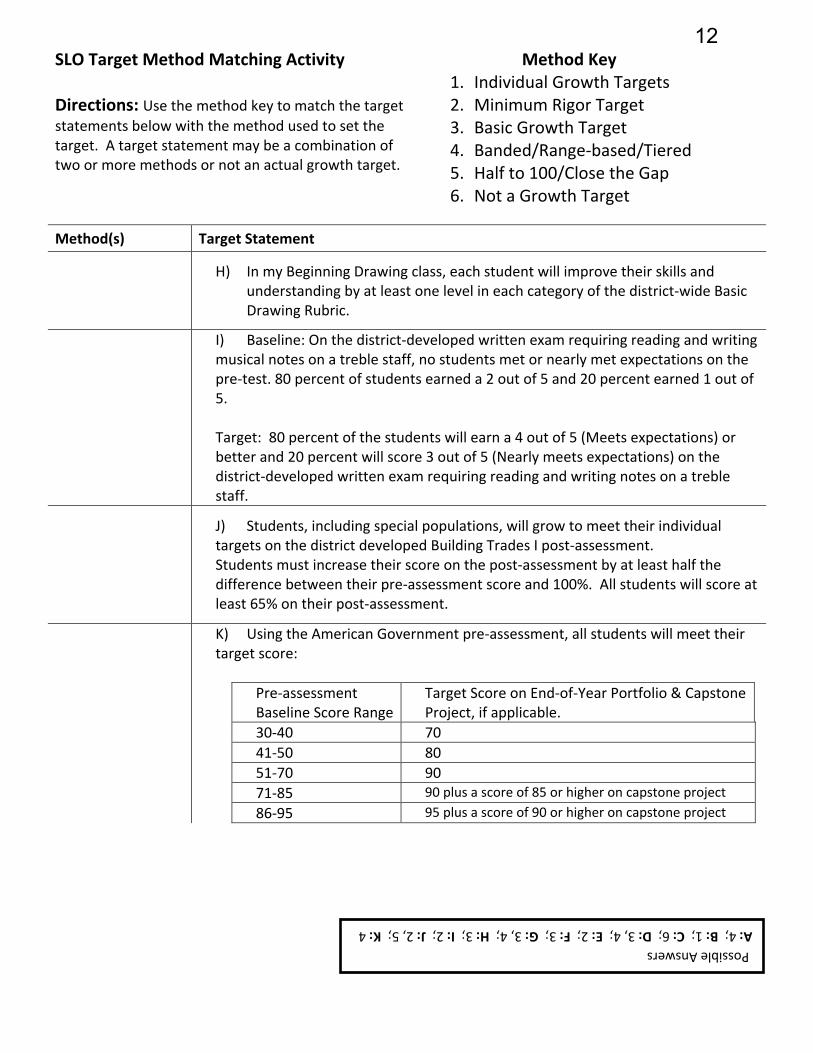
SLO Target Method Matching Activity Directions: Use the method key to match the target
statements below with the method used to set the target. A target statement may be a combination of two or more methods or not an actual growth target.
Method Key 1. Individual Growth Targets 2. Minimum Rigor Target 3. Basic Growth Target 4. Banded/Range-based/Tiered 5. Half to 100/Close the Gap 6. Not a Growth Target
Method(s) Target Statement
H) In my Beginning Drawing class, each student will improve their skills and
understanding by at least one level in each category of the district-wide Basic Drawing Rubric.
I) Baseline: On the district-developed written exam requiring reading and writing musical notes on a treble staff, no students met or nearly met expectations on the pre-test. 80 percent of students earned a 2 out of 5 and 20 percent earned 1 out of 5. Target: 80 percent of the students will earn a 4 out of 5 (Meets expectations) or better and 20 percent will score 3 out of 5 (Nearly meets expectations) on the district-developed written exam requiring reading and writing notes on a treble staff.
J) Students, including special populations, will grow to meet their individual targets on the district developed Building Trades I post-assessment. Students must increase their score on the post-assessment by at least half the difference between their pre-assessment score and 100%. All students will score at least 65% on their post-assessment.
K) Using the American Government pre-assessment, all students will meet their target score:
Pre-assessment Baseline Score Range
Target Score on End-of-Year Portfolio & Capstone Project, if applicable.
30-40 70
41-50 80
51-70 90
71-85 90 plus a score of 85 or higher on capstone project
86-95 95 plus a score of 90 or higher on capstone project
Possible Answers
A: 4; B: 1; C: 6; D: 3, 4; E: 2; F: 3; G: 3, 4; H: 3; I: 2; J: 2, 5; K: 4
12
Page 1
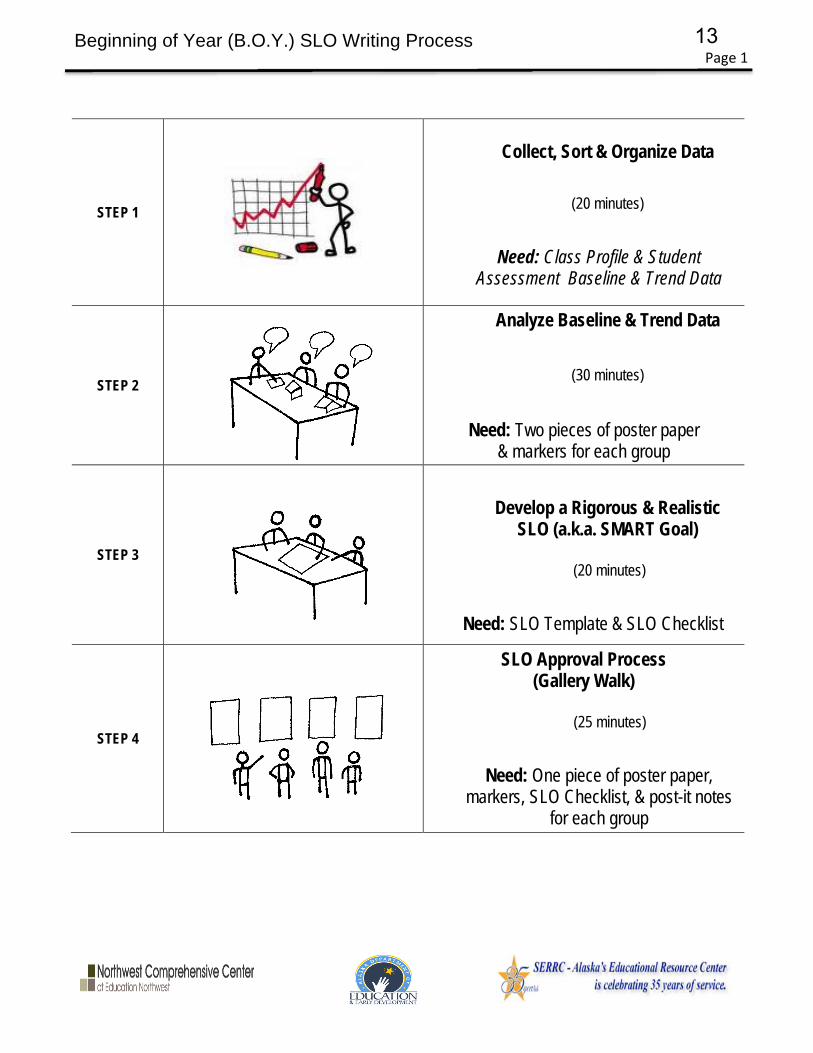
Beginning of Year (B.O.Y.) SLO Writing Process
STEP 1
Collect, Sort & Organize Data
(20 minutes)
Need: Class Profile & Student Assessment Baseline & Trend Data
STEP 2
Analyze Baseline & Trend Data
(30 minutes)
Need: Two pieces of poster paper
& markers for each group
STEP 3
Develop a Rigorous & Realistic
SLO (a.k.a. SMART Goal)
(20 minutes)
Need: SLO Template & SLO Checklist
STEP 4
SLO Approval Process (Gallery Walk)
(25 minutes)
Need: One piece of poster paper, markers, SLO Checklist, & post-it notes
for each group
13
Page 2
Beginning of Year (B.O.Y.) SLO Writing Process
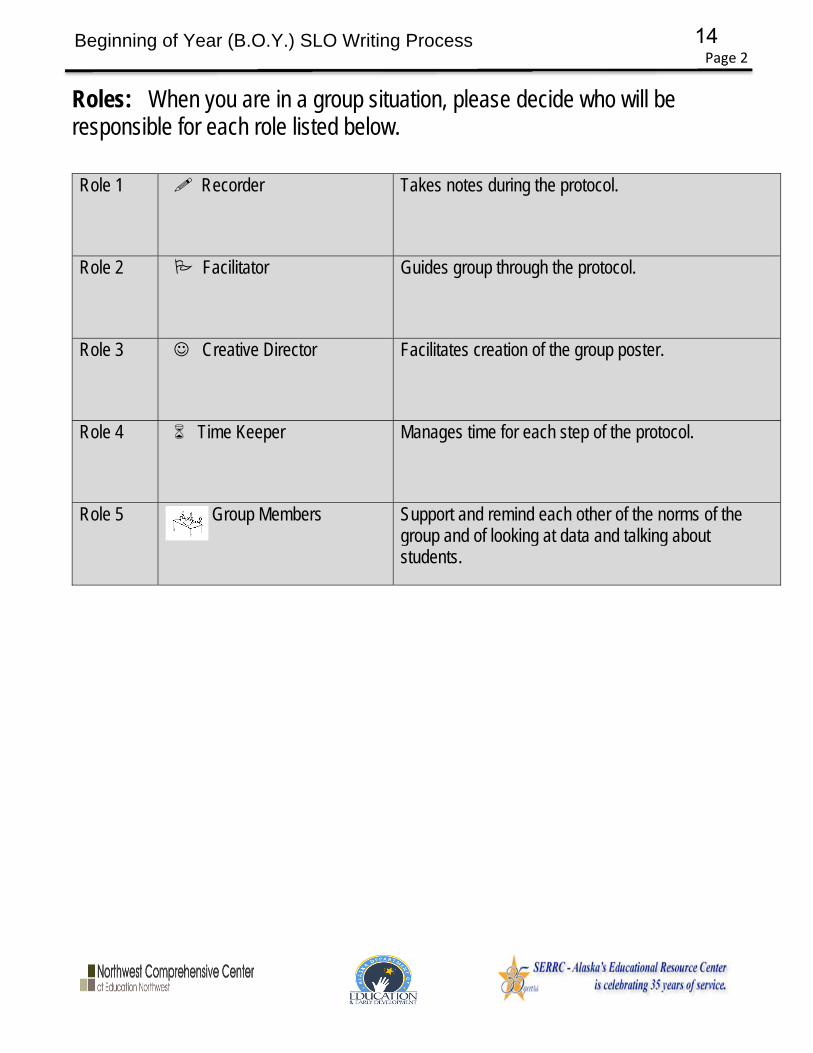
Roles: When you are in a group situation, please decide who will be responsible for each role listed below.
Role 1 Recorder Takes notes during the protocol.
Role 2 Facilitator Guides group through the protocol.
Role 3 Creative Director Facilitates creation of the group poster.
Role 4 Time Keeper Manages time for each step of the protocol.
Role 5 Group Members Support and remind each other of the norms of the group and of looking at data and talking about students.
14
Page 3
Beginning of Year (B.O.Y.) SLO Writing Process
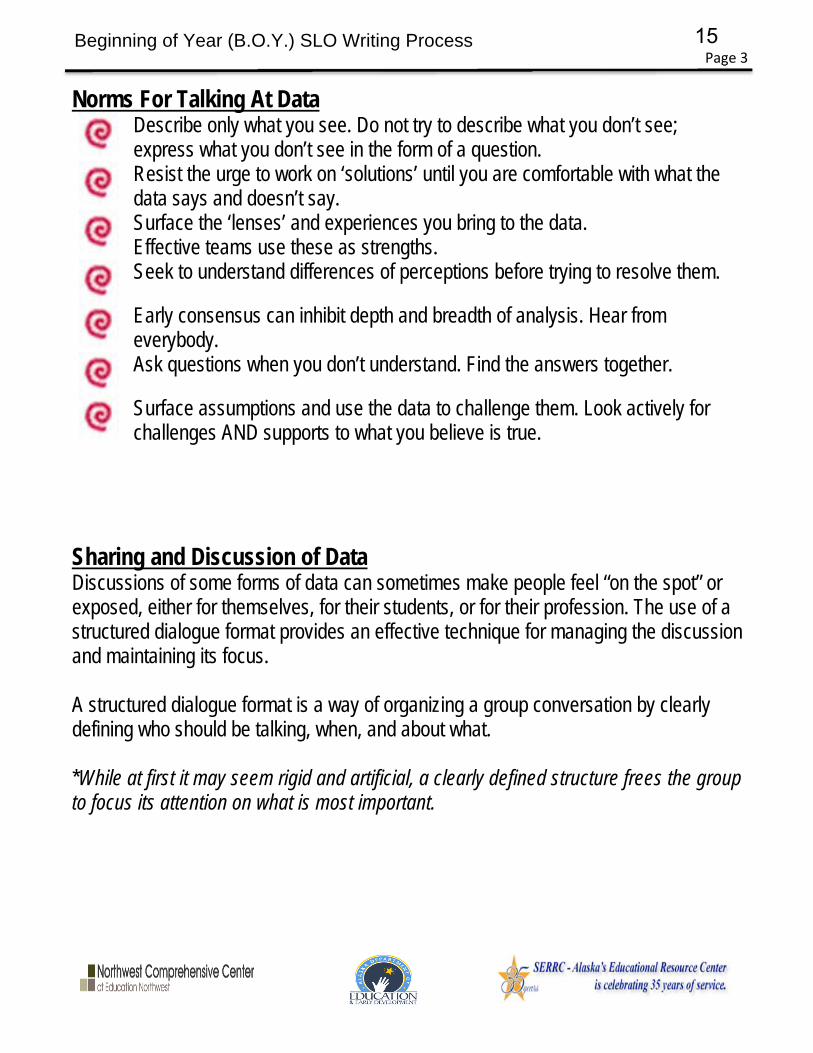
Norms For Talking At Data
Describe only what you see. Do not try to describe what you don’t see; express what you don’t see in the form of a question.
Resist the urge to work on ‘solutions’ until you are comfortable with what the data says and doesn’t say.
Surface the ‘lenses’ and experiences you bring to the data. Effective teams use these as strengths.
Seek to understand differences of perceptions before trying to resolve them.
Early consensus can inhibit depth and breadth of analysis. Hear from everybody.
Ask questions when you don’t understand. Find the answers together.
Surface assumptions and use the data to challenge them. Look actively for challenges AND supports to what you believe is true.
Sharing and Discussion of Data Discussions of some forms of data can sometimes make people feel “on the spot” or exposed, either for themselves, for their students, or for their profession. The use of a structured dialogue format provides an effective technique for managing the discussion and maintaining its focus. A structured dialogue format is a way of organizing a group conversation by clearly defining who should be talking, when, and about what. *While at first it may seem rigid and artificial, a clearly defined structure frees the group to focus its attention on what is most important.
15
Page 4
Beginning of Year (B.O.Y.) SLO Writing Process
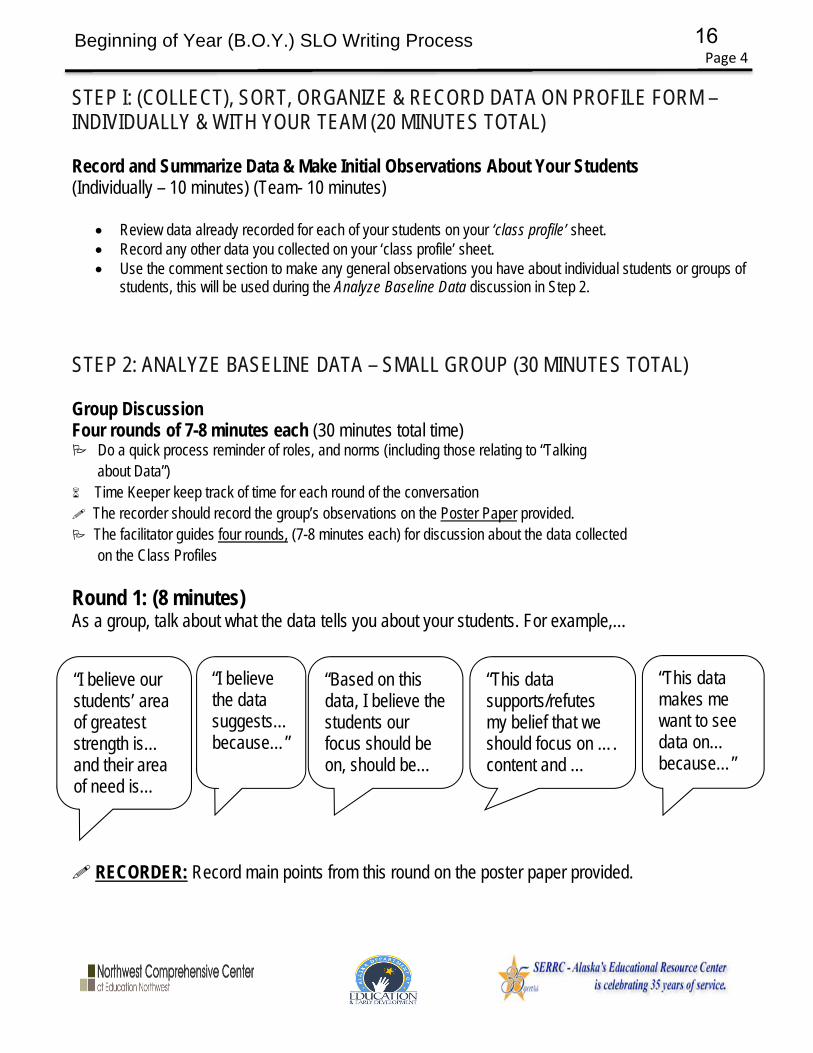
STEP I: (COLLECT), SORT, ORGANIZE & RECORD DATA ON PROFILE FORM – INDIVIDUALLY & WITH YOUR TEAM (20 MINUTES TOTAL) Record and Summarize Data & Make Initial Observations About Your Students (Individually – 10 minutes) (Team- 10 minutes)
Review data already recorded for each of your students on your ‘class profile’ sheet. Record any other data you collected on your ‘class profile’ sheet. Use the comment section to make any general observations you have about individual students or groups of
students, this will be used during the Analyze Baseline Data discussion in Step 2.
STEP 2: ANALYZE BASELINE DATA – SMALL GROUP (30 MINUTES TOTAL) Group Discussion Four rounds of 7-8 minutes each (30 minutes total time) Do a quick process reminder of roles, and norms (including those relating to “Talking about Data”) Time Keeper keep track of time for each round of the conversation The recorder should record the group’s observations on the Poster Paper provided. The facilitator guides four rounds, (7-8 minutes each) for discussion about the data collected on the Class Profiles
Round 1: (8 minutes) As a group, talk about what the data tells you about your students. For example,…
RECORDER: Record main points from this round on the poster paper provided.
“I believe our students’ area of greatest strength is… and their area of need is…
“This data supports/refutes my belief that we should focus on …. content and …
“Based on this data, I believe the students our focus should be on, should be…
“This data makes me want to see data on… because…”
“I believe the data suggests… because…”
16
Page 5
Beginning of Year (B.O.Y.) SLO Writing Process
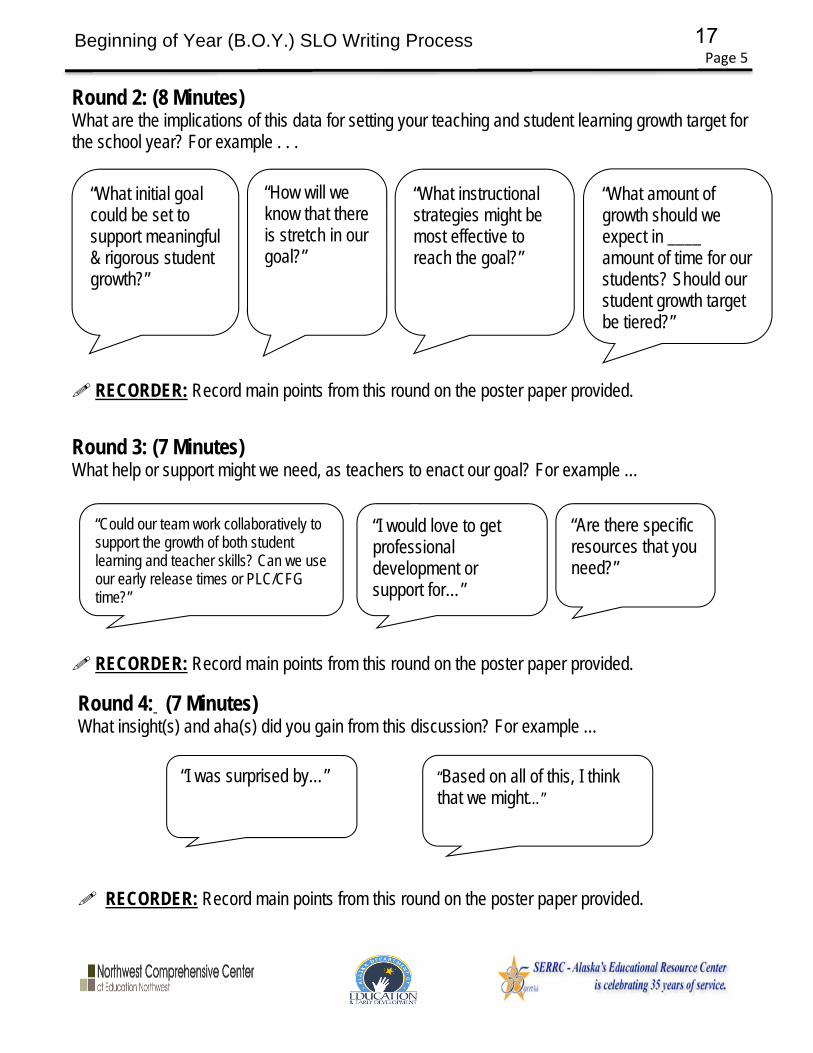
Round 2: (8 Minutes) What are the implications of this data for setting your teaching and student learning growth target for the school year? For example . . .
RECORDER: Record main points from this round on the poster paper provided.
Round 3: (7 Minutes) What help or support might we need, as teachers to enact our goal? For example …
RECORDER: Record main points from this round on the poster paper provided.
Round 4: (7 Minutes) What insight(s) and aha(s) did you gain from this discussion? For example …
RECORDER: Record main points from this round on the poster paper provided.
“What initial goal could be set to support meaningful & rigorous student growth?”
“What instructional strategies might be most effective to reach the goal?”
“What amount of growth should we expect in ____ amount of time for our students? Should our student growth target be tiered?”
“Could our team work collaboratively to support the growth of both student learning and teacher skills? Can we use our early release times or PLC/CFG time?”
“I would love to get professional development or support for…”
“Are there specific resources that you need?”
“I was surprised by…”
“Based on all of this, I think that we might…”
“How will we know that there is stretch in our goal?”
17
Page 6
Beginning of Year (B.O.Y.) SLO Writing Process
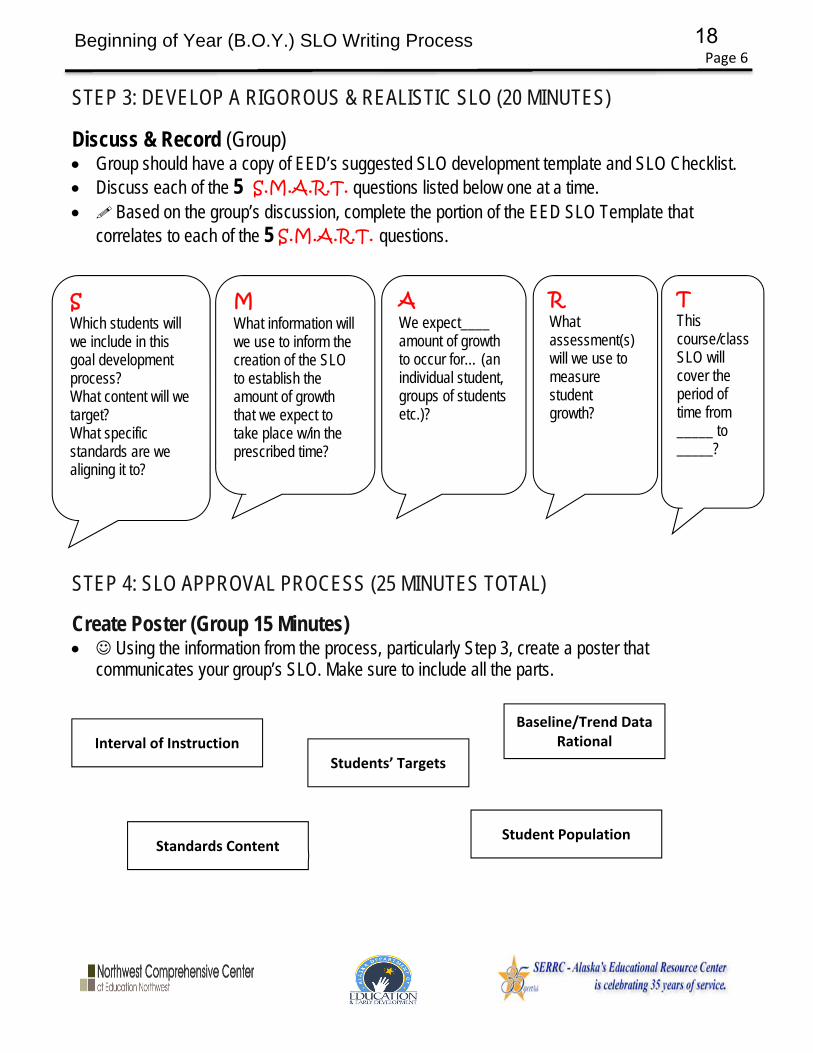
Baseline/Trend Data Rational Interval of Instruction
Standards Content
Students’ Targets
Student Population
STEP 3: DEVELOP A RIGOROUS & REALISTIC SLO (20 MINUTES)
Discuss & Record (Group) Group should have a copy of EED’s suggested SLO development template and SLO Checklist. Discuss each of the 5 S.M.A.R.T. questions listed below one at a time. Based on the group’s discussion, complete the portion of the EED SLO Template that
correlates to each of the 5 S.M.A.R.T. questions.
STEP 4: SLO APPROVAL PROCESS (25 MINUTES TOTAL)
Create Poster (Group 15 Minutes) Using the information from the process, particularly Step 3, create a poster that
communicates your group’s SLO. Make sure to include all the parts.
S Which students will we include in this goal development process? What content will we target? What specific standards are we aligning it to?
M What information will we use to inform the creation of the SLO to establish the amount of growth that we expect to take place w/in the prescribed time?
R What assessment(s) will we use to measure student growth?
A We expect____ amount of growth to occur for… (an individual student, groups of students etc.)?
T This course/class SLO will cover the period of time from _____ to _____?
18
Page 7
Beginning of Year (B.O.Y.) SLO Writing Process
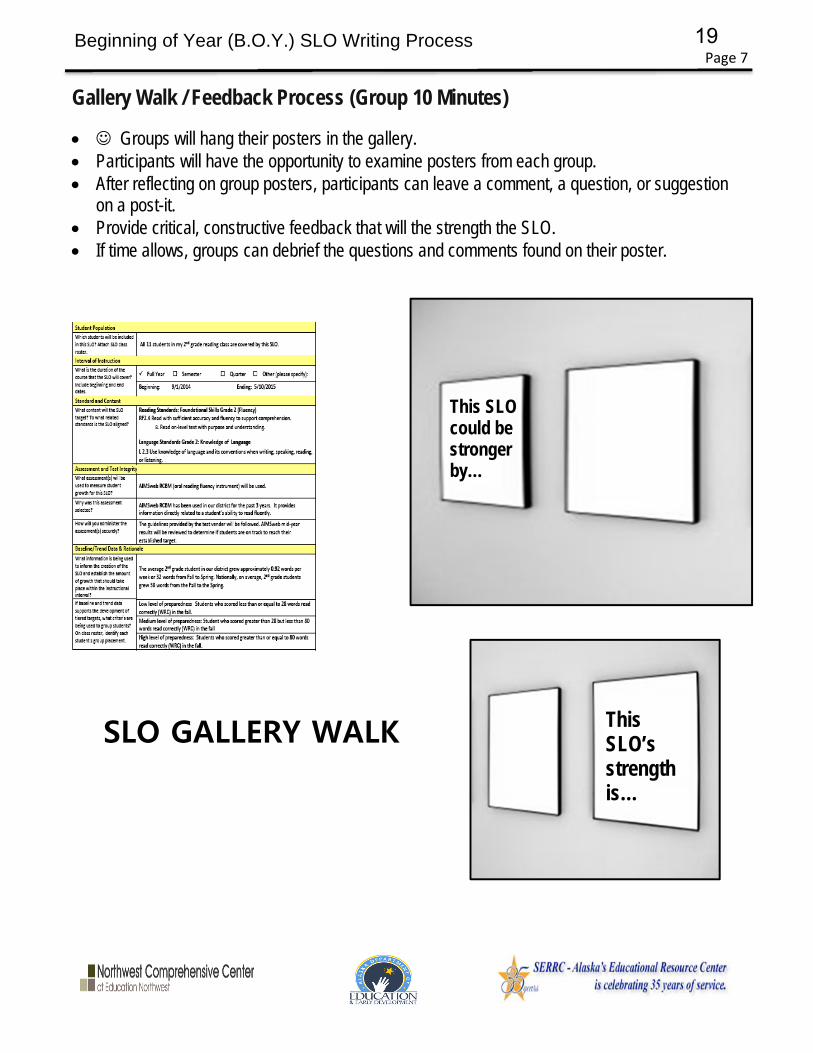
Gallery Walk / Feedback Process (Group 10 Minutes)
Groups will hang their posters in the gallery. Participants will have the opportunity to examine posters from each group. After reflecting on group posters, participants can leave a comment, a question, or suggestion
on a post-it. Provide critical, constructive feedback that will the strength the SLO. If time allows, groups can debrief the questions and comments found on their poster.
This SLO could be stronger by…
This SLO’s strength is…
SLO GALLERY WALK
19
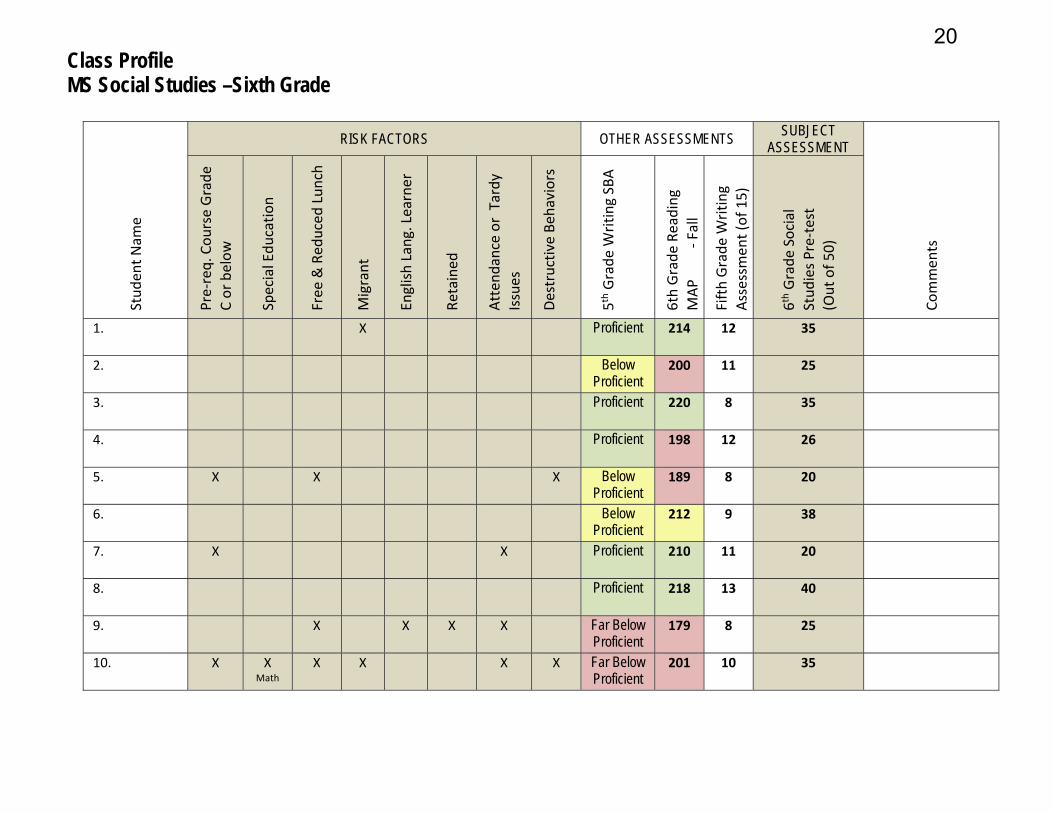
Class Profile MS Social Studies –Sixth Grade
Stud
ent N
ame
RISK FACTORS OTHER ASSESSMENTS SUBJECT ASSESSMENT
Commen
ts
Pre‐req. Cou
rse Grade
C or below
Special Edu
catio
n
Free
& Red
uced
Lun
ch
Migrant
English
Lang. Learner
Retained
Attend
ance or Tardy
Issues
Destructive Be
haviors
5th G
rade
Writing SBA
6th Grade
Reading
MAP
‐ Fall
Fifth Grade
Writing
Assessmen
t (of 15)
6th G
rade
Social
Stud
ies P
re‐test
(Out of 5
0)
1. X Proficient 214 12 35
2. Below Proficient
200 11 25
3. Proficient 220 8 35
4. Proficient 198 12 26
5. X X X Below Proficient
189 8 20
6. Below Proficient
212 9 38
7. X X Proficient 210 11 20
8. Proficient 218 13 40
9. X X X X Far Below Proficient
179 8 25
10. X X Math
X X X X Far Below Proficient
201 10 35
20

21
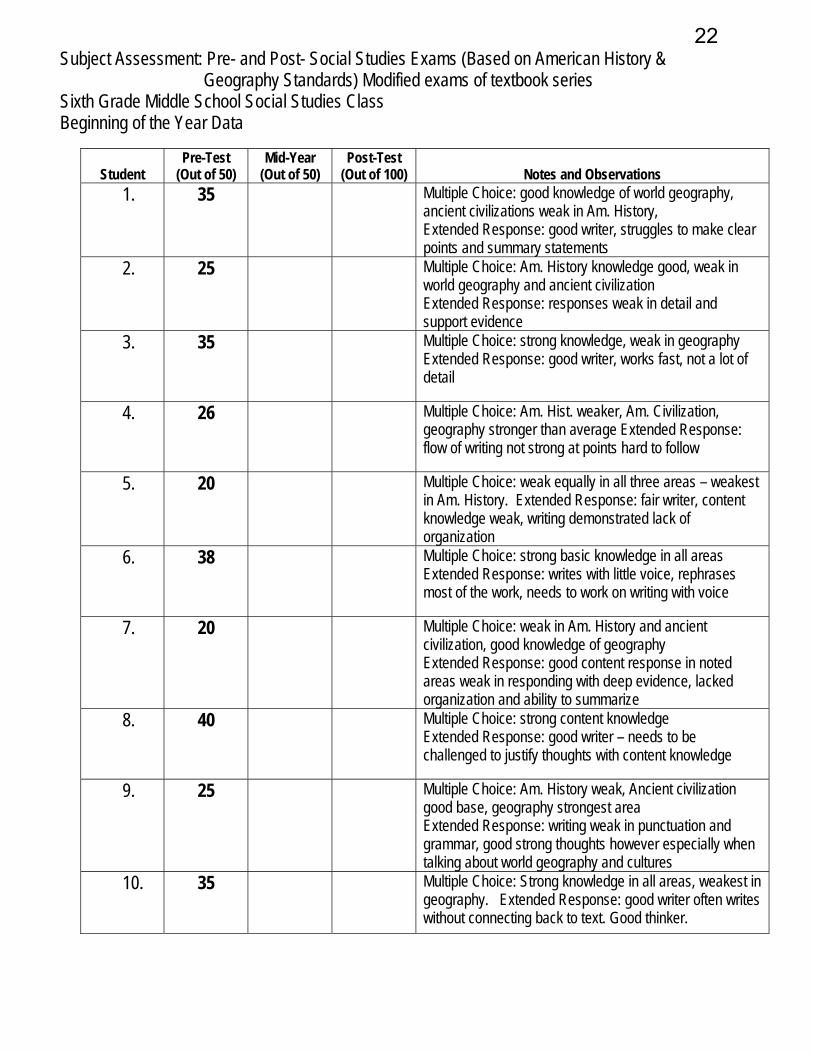
Subject Assessment: Pre- and Post- Social Studies Exams (Based on American History & Geography Standards) Modified exams of textbook series
Sixth Grade Middle School Social Studies Class Beginning of the Year Data
Student
Pre-Test (Out of 50)
Mid-Year (Out of 50)
Post-Test (Out of 100)
Notes and Observations
1. 35 Multiple Choice: good knowledge of world geography, ancient civilizations weak in Am. History, Extended Response: good writer, struggles to make clear points and summary statements
2. 25 Multiple Choice: Am. History knowledge good, weak in world geography and ancient civilization Extended Response: responses weak in detail and support evidence
3. 35 Multiple Choice: strong knowledge, weak in geography Extended Response: good writer, works fast, not a lot of detail
4. 26 Multiple Choice: Am. Hist. weaker, Am. Civilization, geography stronger than average Extended Response: flow of writing not strong at points hard to follow
5. 20 Multiple Choice: weak equally in all three areas – weakest in Am. History. Extended Response: fair writer, content knowledge weak, writing demonstrated lack of organization
6. 38 Multiple Choice: strong basic knowledge in all areas Extended Response: writes with little voice, rephrases most of the work, needs to work on writing with voice
7. 20 Multiple Choice: weak in Am. History and ancient civilization, good knowledge of geography Extended Response: good content response in noted areas weak in responding with deep evidence, lacked organization and ability to summarize
8. 40 Multiple Choice: strong content knowledge Extended Response: good writer – needs to be challenged to justify thoughts with content knowledge
9. 25 Multiple Choice: Am. History weak, Ancient civilization good base, geography strongest area Extended Response: writing weak in punctuation and grammar, good strong thoughts however especially when talking about world geography and cultures
10. 35 Multiple Choice: Strong knowledge in all areas, weakest in geography. Extended Response: good writer often writes without connecting back to text. Good thinker.
22
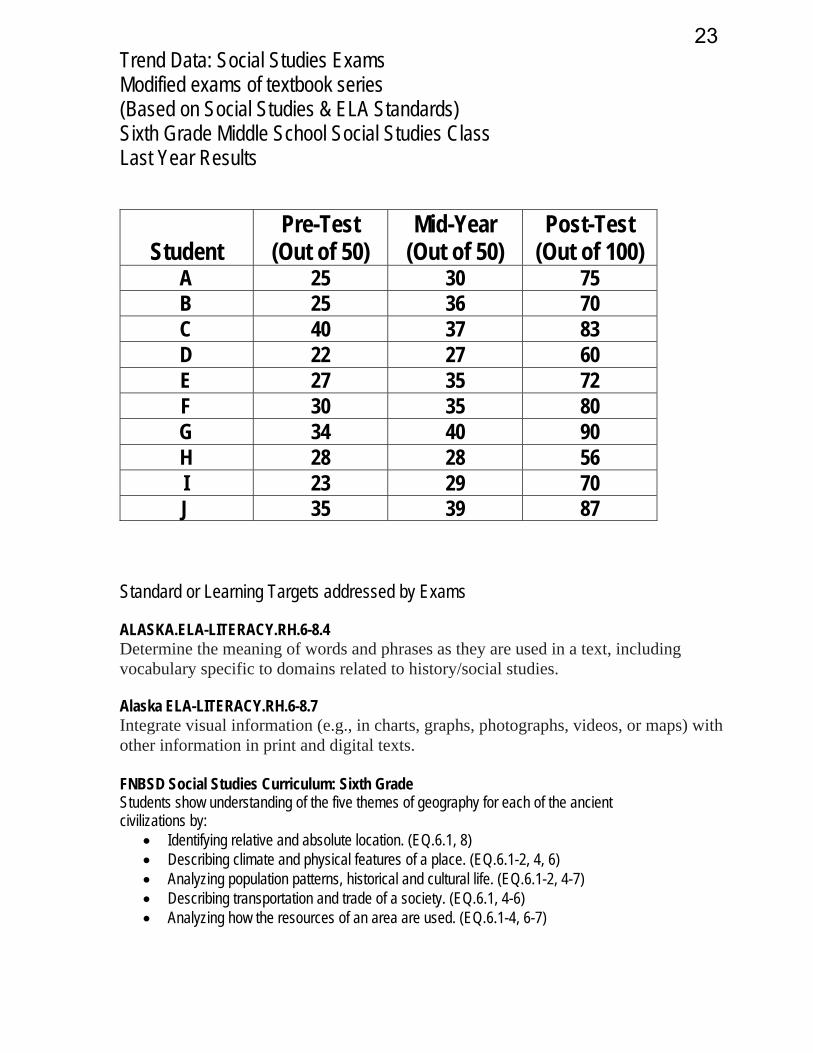
Trend Data: Social Studies Exams Modified exams of textbook series (Based on Social Studies & ELA Standards) Sixth Grade Middle School Social Studies Class Last Year Results
Standard or Learning Targets addressed by Exams ALASKA.ELA-LITERACY.RH.6-8.4 Determine the meaning of words and phrases as they are used in a text, including vocabulary specific to domains related to history/social studies. Alaska ELA-LITERACY.RH.6-8.7 Integrate visual information (e.g., in charts, graphs, photographs, videos, or maps) with other information in print and digital texts. FNBSD Social Studies Curriculum: Sixth Grade Students show understanding of the five themes of geography for each of the ancient civilizations by:
Identifying relative and absolute location. (EQ.6.1, 8) Describing climate and physical features of a place. (EQ.6.1-2, 4, 6) Analyzing population patterns, historical and cultural life. (EQ.6.1-2, 4-7) Describing transportation and trade of a society. (EQ.6.1, 4-6) Analyzing how the resources of an area are used. (EQ.6.1-4, 6-7)
Student
Pre-Test (Out of 50)
Mid-Year (Out of 50)
Post-Test (Out of 100)
A 25 30 75 B 25 36 70 C 40 37 83 D 22 27 60 E 27 35 72 F 30 35 80 G 34 40 90 H 28 28 56 I 23 29 70 J 35 39 87
23
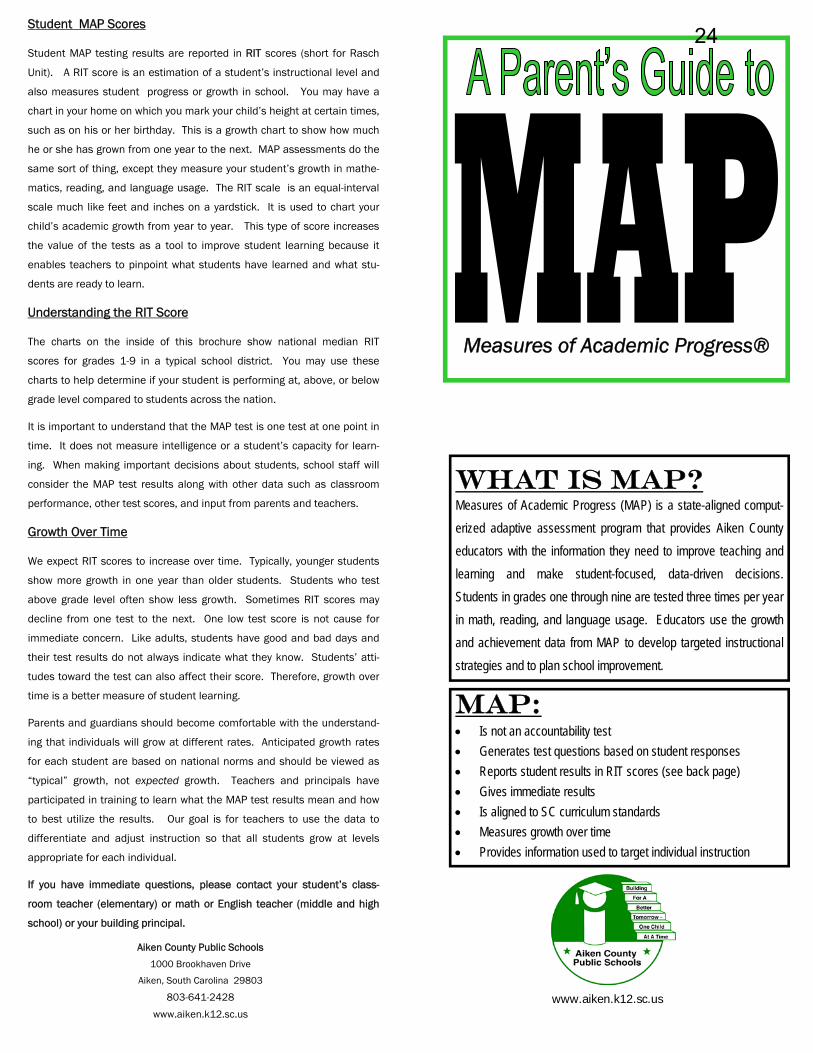
Measures of Academic Progress®
What is MAP? Measures of Academic Progress (MAP) is a state-aligned comput-
erized adaptive assessment program that provides Aiken County
educators with the information they need to improve teaching and
learning and make student-focused, data-driven decisions.
Students in grades one through nine are tested three times per year
in math, reading, and language usage. Educators use the growth
and achievement data from MAP to develop targeted instructional
strategies and to plan school improvement.
www.aiken.k12.sc.us
MAP: Is not an accountability test
Generates test questions based on student responses
Reports student results in RIT scores (see back page)
Gives immediate results
Is aligned to SC curriculum standards
Measures growth over time
Provides information used to target individual instruction
Aiken County Public Schools
1000 Brookhaven Drive
Aiken, South Carolina 29803
803-641-2428
www.aiken.k12.sc.us
Student MAP Scores
Student MAP testing results are reported in RIT scores (short for Rasch
Unit). A RIT score is an estimation of a student’s instructional level and
also measures student progress or growth in school. You may have a
chart in your home on which you mark your child’s height at certain times,
such as on his or her birthday. This is a growth chart to show how much
he or she has grown from one year to the next. MAP assessments do the
same sort of thing, except they measure your student’s growth in mathe-
matics, reading, and language usage. The RIT scale is an equal-interval
scale much like feet and inches on a yardstick. It is used to chart your
child’s academic growth from year to year. This type of score increases
the value of the tests as a tool to improve student learning because it
enables teachers to pinpoint what students have learned and what stu-
dents are ready to learn.
Understanding the RIT Score
The charts on the inside of this brochure show national median RIT
scores for grades 1-9 in a typical school district. You may use these
charts to help determine if your student is performing at, above, or below
grade level compared to students across the nation.
It is important to understand that the MAP test is one test at one point in
time. It does not measure intelligence or a student’s capacity for learn-
ing. When making important decisions about students, school staff will
consider the MAP test results along with other data such as classroom
performance, other test scores, and input from parents and teachers.
Growth Over Time
We expect RIT scores to increase over time. Typically, younger students
show more growth in one year than older students. Students who test
above grade level often show less growth. Sometimes RIT scores may
decline from one test to the next. One low test score is not cause for
immediate concern. Like adults, students have good and bad days and
their test results do not always indicate what they know. Students’ atti-
tudes toward the test can also affect their score. Therefore, growth over
time is a better measure of student learning.
Parents and guardians should become comfortable with the understand-
ing that individuals will grow at different rates. Anticipated growth rates
for each student are based on national norms and should be viewed as
“typical” growth, not expected growth. Teachers and principals have
participated in training to learn what the MAP test results mean and how
to best utilize the results. Our goal is for teachers to use the data to
differentiate and adjust instruction so that all students grow at levels
appropriate for each individual.
If you have immediate questions, please contact your student’s class-
room teacher (elementary) or math or English teacher (middle and high
school) or your building principal.
24
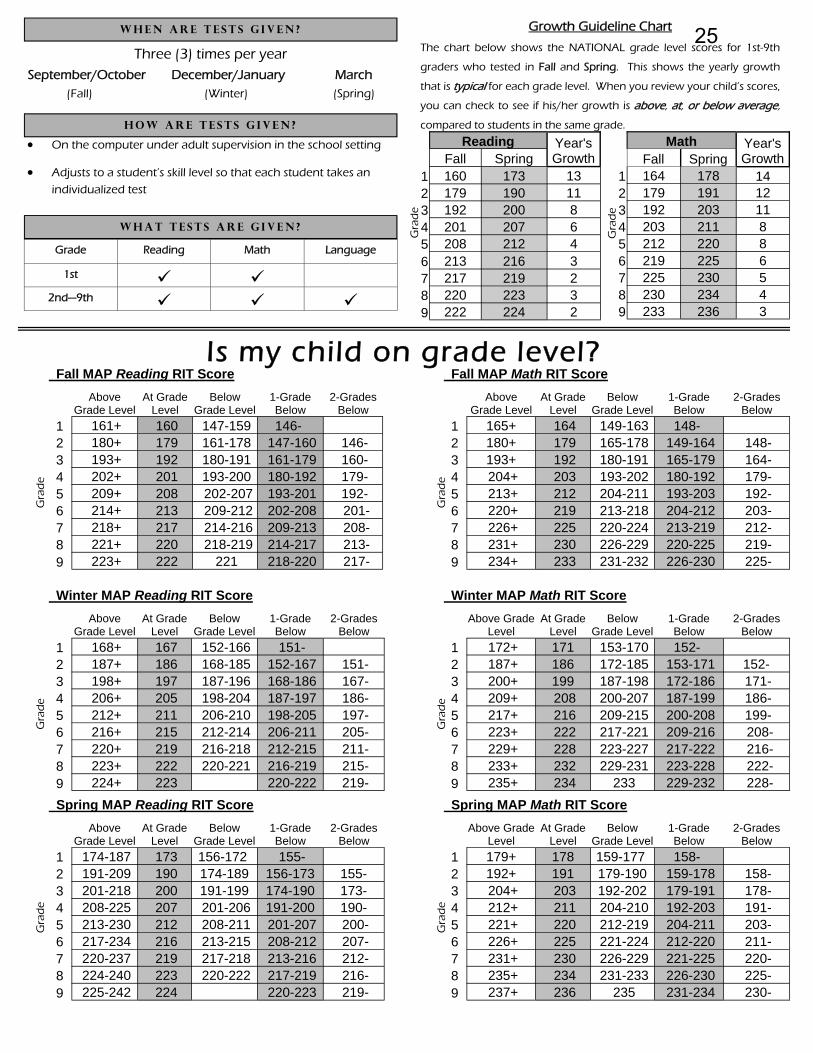
Is my child on grade level?
When are tests g iven?
Three (3) times per year September/October December/January March (Fall) (Winter) (Spring)
How are tests g iven ?
On the computer under adult supervision in the school setting
Adjusts to a student’s skill level so that each student takes an individualized test
What tests are g iven ?
Grade Reading Math Language
1st 2nd—9th
Growth Guideline Chart
The chart below shows the NATIONAL grade level scores for 1st-9th
graders who tested in Fall and Spring. This shows the yearly growth
that is typical for each grade level. When you review your child’s scores,
you can check to see if his/her growth is above, at, or below average,
compared to students in the same grade.
Reading Year's Growth Fall Spring
1 160 173 13 2 179 190 11 3 192 200 8 4 201 207 6 5 208 212 4 6 213 216 3 7 217 219 2 8 220 223 3 9 222 224 2
Math Year's Growth Fall Spring
1 164 178 14 2 179 191 12 3 192 203 11 4 203 211 8 5 212 220 8 6 219 225 6 7 225 230 5 8 230 234 4 9 233 236 3
Fall MAP Reading RIT Score
Above
Grade Level At Grade
Level Below
Grade Level 1-Grade Below
2-Grades Below
1 161+ 160 147-159 146- 2 180+ 179 161-178 147-160 146- 3 193+ 192 180-191 161-179 160- 4 202+ 201 193-200 180-192 179- 5 209+ 208 202-207 193-201 192- 6 214+ 213 209-212 202-208 201- 7 218+ 217 214-216 209-213 208- 8 221+ 220 218-219 214-217 213- 9 223+ 222 221 218-220 217-
Winter MAP Reading RIT Score
Above
Grade Level At Grade
Level Below
Grade Level 1-Grade Below
2-Grades Below
1 168+ 167 152-166 151- 2 187+ 186 168-185 152-167 151- 3 198+ 197 187-196 168-186 167- 4 206+ 205 198-204 187-197 186- 5 212+ 211 206-210 198-205 197- 6 216+ 215 212-214 206-211 205- 7 220+ 219 216-218 212-215 211- 8 223+ 222 220-221 216-219 215- 9 224+ 223 220-222 219-
Spring MAP Reading RIT Score
Above
Grade Level At Grade
Level Below
Grade Level 1-Grade Below
2-Grades Below
1 174-187 173 156-172 155- 2 191-209 190 174-189 156-173 155- 3 201-218 200 191-199 174-190 173- 4 208-225 207 201-206 191-200 190- 5 213-230 212 208-211 201-207 200- 6 217-234 216 213-215 208-212 207- 7 220-237 219 217-218 213-216 212- 8 224-240 223 220-222 217-219 216- 9 225-242 224 220-223 219-
Fall MAP Math RIT Score
Above
Grade Level At Grade
Level Below
Grade Level 1-Grade Below
2-Grades Below
1 165+ 164 149-163 148- 2 180+ 179 165-178 149-164 148- 3 193+ 192 180-191 165-179 164- 4 204+ 203 193-202 180-192 179- 5 213+ 212 204-211 193-203 192- 6 220+ 219 213-218 204-212 203- 7 226+ 225 220-224 213-219 212- 8 231+ 230 226-229 220-225 219- 9 234+ 233 231-232 226-230 225-
Winter MAP Math RIT Score
Above Grade
Level At Grade
Level Below
Grade Level 1-Grade Below
2-Grades Below
1 172+ 171 153-170 152- 2 187+ 186 172-185 153-171 152- 3 200+ 199 187-198 172-186 171- 4 209+ 208 200-207 187-199 186- 5 217+ 216 209-215 200-208 199- 6 223+ 222 217-221 209-216 208- 7 229+ 228 223-227 217-222 216- 8 233+ 232 229-231 223-228 222- 9 235+ 234 233 229-232 228-
Spring MAP Math RIT Score
Above Grade
Level At Grade
Level Below
Grade Level 1-Grade Below
2-Grades Below
1 179+ 178 159-177 158- 2 192+ 191 179-190 159-178 158- 3 204+ 203 192-202 179-191 178- 4 212+ 211 204-210 192-203 191- 5 221+ 220 212-219 204-211 203- 6 226+ 225 221-224 212-220 211- 7 231+ 230 226-229 221-225 220- 8 235+ 234 231-233 226-230 225- 9 237+ 236 235 231-234 230-
Gra
de
Gra
de
Gra
de
Gra
de
Gra
de
Gra
de
Gra
de
Gra
de
25