al security ricing in north dperica
TRANSCRIPT

al Security ricing in North
dperica f# Hwy C. Ballantyne*
This article is adapted from a paper presented at the Fourth American Regional Conference of the International Social Security Association, which was held in Buenos Aires in November 1988. The conference focused on several topics relating to social security financing in North America and Latin America, the role of social partners in social security administration, social protection for marginal urban workers, and staff training in social security organizations.
The article presents an overview of social security financing in the United States and Canada. The systems of financing social security, recent financial operations and trends, and the current financing issues are described for both countries. Due largely to past and projected birth rates and mortality rates, which show similar trends in each country, the cost of social security in North America will rise significantly after the next 20-30 years. Although the programs in both countries are estimated to be adequately financed, the projected contribution rates and the estimated future paths of fund balances are quite different in each country. The estimates shown in the article for the Old-Age, Survivors, and Disability insurance (OASDI) program in the United States are generally based on the 1988 Annual Report of the Board of Trustees of the OASI and DI Trust Funds. In Canada, the estimates shown are based on the Canada Pension Plan Statutory Actuarial Report No. 10.
* Chief Actuary, Social Security Administration.
2 Social Security Bulletin, April 1989/Vol. 52, No. 4
As in other industrialized areas of the world, social security in North America provides a significant source of income for those workers who are retired or disabled, for their qualified family members, and for the qualified survivors of deceased workers. In the future, as the aged population increases in both the United States and Canada, the role played by social security will become even more important. In the United States, for example, it is estimated that the total number of persons receiving monthly cash benefits under the Old-Age, Survivors, and Disability Insurance (OASDI) program will increase from 38.5 million in 1988 to 81 million by 2050, based on intermediate economic and demographic assumptions. As a percentage of gross national product (GNP), total OASDI expenditures for benefits and administration are estimated to increase from 4.7 percent in 1988 to 6.5 percent in 2050.
Although the number of aged persons in North America is expected to increase dramatically in the future, the number of persons of working ages is expected to increase much more slowly. In Canada, for example, the population aged 65 or older is estimated to increase by 155 percent-from 3.0 million in 1990 to 7.7 million in 2050-while the population aged 20-64 is expected to increase by only 28 percent- from 16.6 million in 1990 to 21.2
-
million in 2050. The corresponding increases in the United States show a similar relationship, with estimated increases of 121 percent-from 32.0 million to 70.7 million-for the
Because the number of
population aged 65 or older and
beneficiaries will rise much more rapidly than the number of workers
only 17 percent-from 152.6 million
in both the United States and Canada, the social security program
to 177.9 million-for the population
in each country will experience substantial future increases in
aged 20-64.
costs, relative to taxable payroll. This article describes the current financial status and future estimated costs of the social security programs in the United States and Canada.
Description of Programs
United States
In broad terms, social security in the United States consists primarily of two Federal programs-Old-Age, Survivors, and Disability Insurance (OASDI) and Health Insurance for the Aged (Medicare).
About 95 percent of all gainfully employed workers, including the self-employed, are covered, or eligible for coverage, under the OASDI program. Monthly cash benefits are provided for retired and disabled insured workers, for their qualified family members, and for
the qualified survivors of deceased insured workers. All benefit amounts are related to the amount of the worker’s prior earnings. However, the benefit formula is
The Medicare program consists of two separate but coordinated parts that pay a large portion of the costs
“weighted” so that workers with low
of health services for almost all
earnings receive higher benefits,
persons aged 65 or older and for disabled persons under age 65 who
relative to their earnings, than do
have been entitled to disability benefits for at least 2 years. Part A
workers with high earnings.
of the Medicare program is Hospital Insurance (HI), which pays for part of the costs of inpatient hospital care and related health care. Part B is Supplementary Medical Insurance (SMI), which pays for part of the costs of care provided by physicians and for other related health services. Legislation enacted into law on July 1, 1988, added catastrophic health insurance benefits under Medicare.
Canada
Social security in Canada includes two programs: pensions under the Old-Age Security (OAS) system and the Canada Pension Plan (CPP). The province of Quebec has a separate plan-the Quebec Pension Plan (QPP), which is generally similar to the CPP. Beneficiaries with limited income may also qualify for the Guaranteed
Social Security Bulletin, April 1989/Vol. 52, No. 4 3
Income Supplement (GIS). Other programs in Canada include universal hospital and physicians’ services insurance, provincial work injury programs, and unemployment insurance.
As in the case of the OASDI program in the United States, the Canadian system of old-age benefits is weighted to provide higher benefits, relative to earnings, for workers with low earnings. However, this weighting is achieved in a quite different way in the Canadian system. It is accomplished by the combination of two programs, or tiers. The first tier is a universal pension provided under the OAS program to all persons aged 65 or older who meet certain residency requirements. The size of the pension is not related to earnings, but does depend on the length of residence in Canada, with full pensions payable to those who have resided in Canada for at least 40 years after age 18. The second tier, applicable to nearly all employed or self-employed workers, consists of earnings-related benefits payable under the CPP (or QPP in Quebec) to insured workers aged 65 or older (or at reduced or increased rates beginning as early as age 60 or as late as age 70, respectively). The CPP (and QPP) also provide flat-rate and earnings- related pensions for disabled insured workers and for survivors of deceased insured workers. Both universal pensions and earnings- related pensions are administered by the Federal Department of National Health and Welfare. The Federal Department of National Revenue is responsible for the collection of contributions for earnings-related pensions. (In Quebec, the earnings-related pension program is administered by both the Quebec Pension Board and the Quebec Department of Revenue.)
Virtually the entire population is eligible for hospital and medical insurance, under which providers are paid for almost all costs of medically required hospital and physicians’ services. The provinces administer the hospital and medical insurance programs.
Sources of Social Security Financing
The sources of social security financing in the United States and in Canada, although similar in some respects, are quite different in other important respects. Financing for the earnings-related benefits in both countries is provided by a payroll tax on the earnings of workers in employment covered by the programs. However, as noted later in this article, Canada’s flat-rate OAS pension is financed from general revenues.
United States
In the United States, the OASDI program and the HI portion of the Medicare program are financed primarily by a tax on earnings paid by workers and their employers, and by individuals with self- employment income, in work covered by the program. Almost all workers are covered under the program or could be covered by voluntary election. The major groups that are not covered are police officers covered by their own retirement systems in most States, most full-time civilian Federal Government employees hired before 1984 (although covered under the HI program since 1983, they are generally not covered under the OASDI program), low-income self- employed persons, and farm and domestic workers with irregular employment.
Beginning January 1, 1983, all civilian Federal Government
employees have been covered under the HI program as a result of legislation enacted in 1982. The Social Security Amendments of 1983 provide that all civilian Federal Government employees hired after 1983 are covered under the OASDI program, as well. Legislation establishing a new Federal Employee Retirement System permitted full-time Federal employees hired before 1984 to voluntarily transfer from the old Civil Service Retirement System to the new system. All employees in the newly established Federal Employee Retirement System are covered under the OASDI program.
State and local governments may generally have their employees covered on a voluntary basis; however, as a result of the 1983 amendments, State and local government employees who had opted into the Social Security program and had not withdrawn by April 20, 1983, are no longer permitted to withdraw. (Police officers covered under an existing retirement system cannot be covered under any circumstances, except in specified States.)
All employees, and their employers, in employment covered by the program, are required to pay contributions based on their wages. Employees, and their employers, are also required to pay contributions based on their cash tips if their monthly cash tips amount to at least $20. All covered self-employed persons are required to pay contributions on their earnings from covered self- employment.
In general, an individual’s tax contributions are computed on annual earnings up to a specified maximum annual amount. The maximum amount taxable in a year is also the maximum amount of
4 Social Security Bulletin, April 1989/Vol. 52, No. 4
earnings creditable (for that year) for the computation of OASDI benefits. Thus, this maximum amount is often referred to as the contribution and benefit base. The contribution and benefit base rises each year in accordance with increases in national average wage levels. In 1989, the base is $48,000, representing an increase of $3,000 over the 1988 base of $45,000.
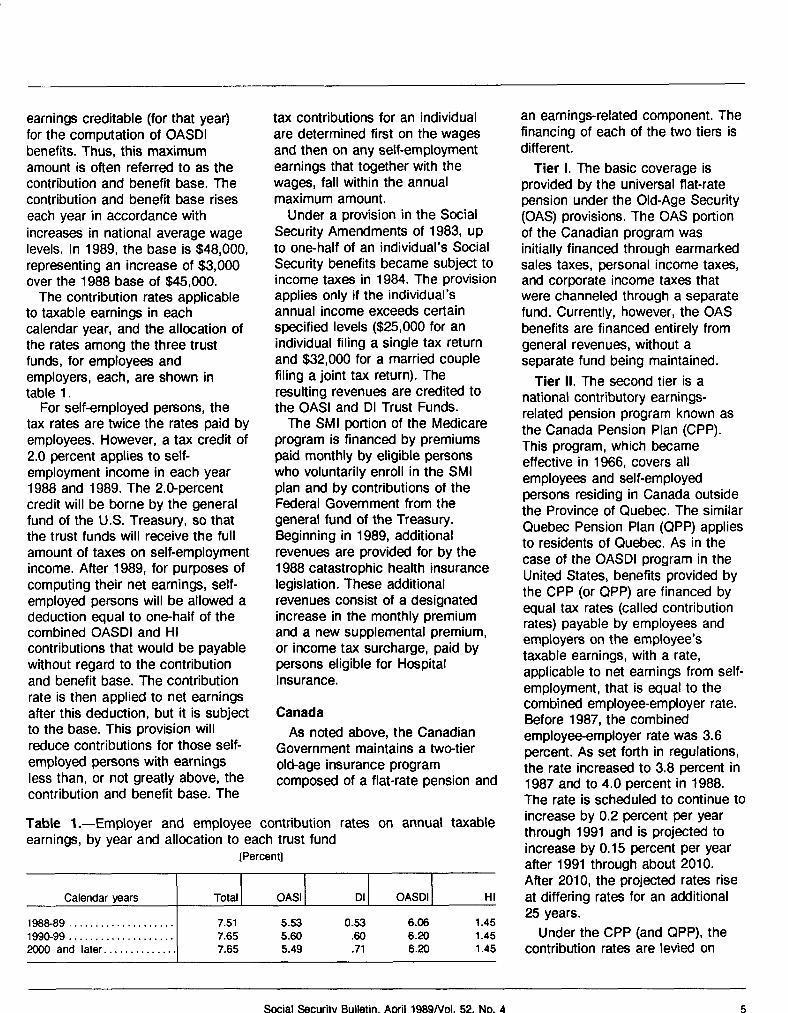
The contribution rates applicable to taxable earnings in each calendar year, and the allocation of the rates among the three trust funds, for employees and employers, each, are shown in table 1.
For self-employed persons, the tax rates are twice the rates paid by employees. However, a tax credit of 2.0 percent applies to self- employment income in each year 1988 and 1989. The 2.0-percent credit will be borne by the general fund of the U.S. Treasury, so that the trust funds will receive the full amount of taxes on self-employment income. After 1989, for purposes of computing their net earnings, self- employed persons will be allowed a deduction equal to one-half of the combined OASDI and HI contributions that would be payable without regard to the contribution and benefit base. The contribution rate is then applied to net earnings after this deduction, but it is subject to the base. This provision will reduce contributions for those self- employed persons with earnings less than, or not greatly above, the contribution and benefit base. The
tax contributions for an individual are determined first on the wages and then on any self-employment earnings that together with the wages, fall within the annual maximum amount.
Under a provision in the Social Security Amendments of 1983, up to one-half of an individual’s Social Security benefits became subject to income taxes in 1984. The provision applies only if the individual’s annual income exceeds certain specified levels ($25,000 for an individual filing a single tax return and $32,000 for a married couple filing a joint tax return). The resulting revenues are credited to the OASI and DI Trust Funds.
The SMI portion of the Medicare program is financed by premiums paid monthly by eligible persons who voluntarily enroll in the SMI plan and by contributions of the Federal Government from the general fund of the Treasury. Beginning in 1989, additional revenues are provided for by the 1988 catastrophic health insurance legislation. These additional revenues consist of a designated increase in the monthly premium and a new supplemental premium, or income tax surcharge, paid by persons eligible for Hospital Insurance.
Canada
As noted above, the Canadian Government maintains a two-tier old-age insurance program composed of a flat-rate pension and
Table l.-Employer and employee contribution rates on annual taxable earnings, by year and allocation to each trust fund
[Percent]
Calendar years Total OASI DI OASDI HI
1988-89 .................... 7.51 5.53 0.53 6.06 1.45 1990-99 .................... 7.65 5.60 60 6.20 1.45 2000 and later .............. 7.65 5.49 .71 6.20 1.45
an earnings-related component. The financing of each of the two tiers is different.
Tier I. The basic coverage is provided by the universal flat-rate pension under the Old-Age Security (OAS) provisions. The OAS portion of the Canadian program was initially financed through earmarked sales taxes, personal income taxes, and corporate income taxes that were channeled through a separate fund. Currently, however, the OAS benefits are financed entirely from general revenues, without a separate fund being maintained.
Tier II. The second tier is a national contributory earnings- related pension program known as the Canada Pension Plan (CPP). This program, which became effective in 1966, covers all employees and self-employed persons residing in Canada outside the Province of Quebec. The similar Quebec Pension Plan (QPP) applies to residents of Quebec. As in the case of the OASDI program in the United States, benefits provided by the CPP (or QPP) are financed by equal tax rates (called contribution rates) payable by employees and employers on the employee’s taxable earnings, with a rate, applicable to net earnings from self- employment, that is equal to the combined employee-employer rate. Before 1987, the combined employee-employer rate was 3.6 percent. As set forth in regulations, the rate increased to 3.8 percent in 1987 and to 4.0 percent in 1988. The rate is scheduled to continue to increase by 0.2 percent per year through 1991 and is projected to increase by 0.15 percent per year after 1991 through about 2010. After 2010, the projected rates rise at differing rates for an additional 25 years.
Under the CPP (and QPP), the contribution rates are levied on
Social Security Bull&n, April 1989Nol. 52, No. 4 5

annual earnings in excess of a basic exempt amount and up to a specified maximum amount of earnings. Benefit credit, however, is given for all earnings up to the specified maximum amount. The exempt amount and the maximum amount in 1988 are Can$2,600 and Can!§26,500, respectively. The maximum amount is subject to increase in the future, in accordance with increases in national average wages. The exempt amount for each year is calculated as 10 percent of the maximum amount (rounded down, if necessary, to the next lower multiple of Car@1 OO).’
Thus, the sources of financing the Canadian social security system differ in two important respects from that of the OASDI program in the United States. First, a large proportion of the old-age benefit- the OAS pension-is financed from general revenues. Second, the contribution rate for the earnings- related CPP (or QPP in Quebec) applies to a more limited portion of a worker’s earnings-the earnings from Can$2,600 to Can$26,500 in 1988, compared with all earnings up to $45,000 under the U.S. OASDI and HI programs.
Systems of Social Security Financing
Social security financing plans in the United States and Canada are developed through legislative processes. Both the benefits that are provided under each country’s programs and the contributions or revenues required to finance the benefits are set forth in the laws and/or regulations governing their social security programs. In both
‘As of December 31, 1988, US$l equaled 1.1752 Canadian dollars.
countries, when the laws (or regulations) are enacted or amended, the estimated future costs of the programs are taken into account in an effort to ensure the continued financial soundness of the programs. The system for maintaining adequate social security financing differs for each country.
United States
From the beginning of the Social Security program in 1937, the system has generally been financed on a fully self-supporting basis, with no government contributions or subsidies from the general fund of the U.S. Treasury. (However, the crediting to the trust funds of income from the taxation of benefits is viewed by some as general- revenue financing, the first added to the program on a continuing basis.) In keeping with this principle, two separate trust funds were established in the Treasury-one for Old-Age and Survivors Insurance (OASI) and one for Disability Insurance (DI). All of the financial operations of these programs are handled through these trust funds.
The Medicare program also has two separate trust funds-one for Hospital Insurance (HI) and one for Supplementary Medical Insurance (SMI), both established in 1966. Because the HI program is financed from the same source as the OASDI program, the system for financing HI is similar to that for financing OASDI.
In the early years of the Social Security program, it was intended that a rather sizable fund would accumulate, with the interest on the fund paying for a substantial proportion of the ultimate benefit outgo. It was not intended, however, to develop a fully funded actuarial reserve system. This partial funding basis was to be accomplished by a graded schedule
of tax contribution rates, rising over future years to an ultimate rate.
Over the years, some of the increases in contribution rates were deferred and benefits were increased, so that the extent of funding was intentionally reduced. As a result, the financing basis shifted from a partial funding basis to a current-cost or pay-as-you-go approach. Under the current-cost basis, total income in a year is intended to be approximately equal to total outgo in the year, plus an additional amount. The additional amount is needed to maintain the trust funds at an appropriate contingency-reserve level, relative to outgo. (Because outgo increases over time, the absolute fund level must also increase each year-that is, annual income must exceed annual outgo, so a constant fund level relative to outgo can be maintained.)
Under current-cost financing, the assets of the trust funds should not become too large, through continued annual surpluses, nor too small, through continued annual deficits. Although no general agreement exists regarding the appropriate size of the trust funds, the trust fund level should be large enough to allow time for legislative action to prevent fund exhaustion during periods of continued annual deficits. When a fund is not large enough for this purpose, the immediate future financing of the fund-to be considered adequate- must provide for rebuilding the fund to such a level within a reasonable period of time without significant further decline in the interim.
As a result of the Social Security Amendments of 1977, the financing of the OASDI program shifted from a currentcost basis to one with some advance funding; however, because of high costs and annual deficits in the later years of the long-range 75year projection
c .Sncial Securitv Bulletin. Aoril 1989/Vol. 52, No. 4

period, the program was not in close actuarial balance. Following enactment of the Social Security Amendments of 1983, the program has been in close actuarial balance and the OASI and DI Trust Funds are expected to accumulate rapidly during the next 20-30 years, with the combined funds reaching a maximum of more than 5 times annual expenditures by 2015.
The law requires that annual reports be made to Congress showing the actuarial status of both the OASDI and HI programs. Estimates of trust fund operations over the next 5 years are made to measure the adequacy of projected trust fund levels relative to annual outgo. To measure the adequacy of scheduled tax rates, long-range cost estimates are also made for each of the next 75 years. For direct comparison with estimated income rates, these estimates are expressed as “cost rates,” representing the cost of the program as a percentage of future taxable payroll. The estimated income rate for a year is the sum of (1) the scheduled tax rate for the year and (2) the estimated income from the taxation of Social Security benefits, expressed as a percentage of taxable earnings, in the year.
The difference between the income rate and the cost rate, for a year, is the annual balance. The long-range financial status of the trust funds is summarized by the calculation of the actuarial balance over the 75year projection period. In connection with the actuarial balance, a summarized income rate and a summarized cost rate are also calculated.
The actuarial balance of the OASDI program is the difference between the estimated summarized income rate and the estimated summarized cost rate over the 75-year projection period. If the actuarial balance is positive, the
program is said to have an actuarial surplus; if it is negative, an actuarial deficit occurs. The existence of a deficit indicates that, unless the projected trends turn out to be too pessimistic, changes in the system will be needed to make it viable in the future.
During the period 1972-87, the summarized income and cost rates were simply the averages of the estimated annual rates over the 75-year projection periods. (Before 1984, the annual income rates were the same as the annual tax rates because benefits were not yet taxable.) Until 1972, the summarized rates were based- on present-value calculations. (The “present value” of a future sum of money is the amount that, if it were invested on the date for which the present-value calculation is made, would accumulate with interest to equal the future sum of money.) Calculations were made of the present value of future tax income, future expenditures, and future taxable payrolls. For example, the summarized cost rate over the 75-year projection period was the present value, at the beginning of the period, of estimated expenditures during the period, expressed as a percentage of the present value of estimated taxable earnings during the projection period. In calculating the actuarial balance based on the present-value calculations, the fund balance at the beginning of the projection period was also taken into account. This accounting involved adding the beginning fund balance, as a percentage of the present value of the taxable payroll, to the summarized income rate, before subtracting the summarized cost rate.
Beginning in 1972, the summarized rates were changed to averages, rather than present
values, because both methods produced similar results, and the averaging method is simpler. The results were similar for two reasons. First, under the current-cost financing basis then in effect, the incidence of the estimated tax income and the incidence of the estimated expenditures were about the same over the projection period (that is, they were about equal in each year over the 75-year projection period), so that their present values were about the same. Second, the estimated annual rate of increase in taxable payroll over the projection period was about equal to the assumed rate of interest earned by the trust funds during the projection period. (It can be shown, mathematically, that the averaging calculation produces the same result as the present-value calculation, regardless of the relative incidences of tax income and expenditures, if the interest rate used in the present- value calculation is equal to the estimated rate of increase in taxable payroll.) In calculating the actuarial balance from the average rates, the beginning fund balance was not taken into account.
Since 1973, several occurrences have gradually caused the average rates and the present value rates to diverge. First, changes in the long range assumptions, such as reductions in assumed ultimate fertility rates and real wage gains, have resulted in lower estimated rates of increase in taxable payroll. As a result, the assumed lqngrange interest rate, which has not been reduced, is now higher than the estimated rate of increase in taxable payroll. Second, as previously indicated, the 1977 and 1983 amendments changed the annual incidence of income and outgo from “pay-as-you-go” to partial advance funding, with higher income, relative to outgo, in the
Social Security Bulletin, April 1989/Vol. 52, No. 4 7

earlier years of the projection period, and lower income, relative to outgo, in the later years. Both of these phenomena cause the average actuarial balance to be lower, over the next 75 years, than the actuarial balance based on present values. In recognition of this situation, the latest actuarial estimates are based on the present- value calculations. These estimates are shown in the 1988 Annual Report of the Board of Trustees of the Federal Old-Age and Survivors Insurance and Disability Insurance Trust Funds.
For comparison with the present- value calculations, the report also shows the average income and cost rates, and the average actuarial balance. In the report, the term “level-financing basis” refers to the present-value calculations. The report defines the level-financing calculations as rates based on the present values of the future tax income, outgo, and taxable payroll. The level-financing income rate is shown with the inclusion of the fund balance, at the beginning of the projection period, as a percentage of the present value of the taxable payroll. The average income rate and the average actuarial balance do not include the effect of the beginning fund balance. Thus, as the trust funds accumulate, the level-financing actuarial balance will, in the future, change less rapidly than the average balance.
The standard for determining “close actuarial balance” has remained unchanged since 1972. Based on this standard, the OASDI program is said to be in close actuarial balance if the summarized income rate, over the 75-year projection period is between 95 percent and 105 percent of the summarized cost rate, based on intermediate economic and demographic assumptions.
Canada
When the Old-Age Security portion of the Canadian program began in 1951, it was financed by earmarked taxes that were channeled through a separate fund. Today, however, OAS benefits are financed directly from general revenues and a separate fund is no longer maintained. Essentially, the OAS program is financed on a current-cost basis, with no advance funding.
The financing of CPP (and QPP) benefits is similar to the financing of OASDI benefits in the United States. As indicated above, these largely earnings-related benefits are financed by employee and employer payroll tax rates that are equal-2.0 percent each in 1988. As in the case of the OASDI program, the intent is to finance the CPP over all time by payroll taxes, without subsidies from general revenues. A separate fund-the Canada Pension Plan Account-is designated for the receipt of contributions and the payment of benefits and administrative expenses. The reserves of the fund are available for loans to the provinces in the form of 20-year bonds. (Up to 30 percent of the QPP fund can be invested in Canadian stocks or even in foreign stocks, which have a greater return than the provincial bonds.)
The CPP legislation requires that an actuarial report be made on the operation and status of the Canada Pension Plan Account at least once every 3 years. An actuarial report must also be prepared whenever legislative changes are made. The latest actuarial report (Statutory Actuarial Report No. 10)’ was
2Canada Pension Plan Statutory Actuarial Report No. 10 as at December 31, 1985.
prepared in connection with a bill amending the CPP; the bill was given its first reading in the House of Commons on June 11, 1986, and received royal assent on June 27, 1986. The bill’s provisions are now in effect.
The major financing difference between the OASDI and the CPPQPP programs has historically been in the level of funding of the two systems. The U.S. OASDI program was for many years financed on a current-cost basis; however, the CPP and QPP have always been partially advance funded. Income has substantially exceeded outgo in every year, so that a large fund, relative to outgo, now exists. A level contribution rate of 1.8 percent each for employees and employers was prescribed from the start. However, as noted previously, the CPP (and QPP) rate for employees and employers is scheduled to increase annually by 0.1 percent for each through 1991. After 1991, the rate for the CPP (but not the QPP) is projected to increase by 0.075 percent per year through 2011. However, the rates for years after 1991 are subject to quinquennial Federal-provincial reviews. At the conclusion of each quinquennial review, the rates for the last 20 years in the projected schedule are to be confirmed or revised, and the schedule is to be extended by 5 years. In addition to the schedule, the Federal-provincial agreement announced in December 1985 included a formula to be prescribed by regulation, that would become operational in the absence of an agreement or recommendation at subsequent quinquennial Federal-provincial reviews. The formula is designed to extend the schedule for 5 years by means of such equal annual increases (expressed as percentages of taxable~ earnings rounded to two decimal places)
8 Social Security Bulletin, April 1989/Vol. 52, No. 4
that, if increases of that size were in effect for a total of 15 years from the beginning of the 5-year period, the fund at the end of the 15 years would be equal to twice the expenditure in the following year.
Under the QPP, no further increases in the tax rate are projected after 1991. However, an actuarial report due in 1989 will present a variety of financing scenarios that could be applied to the QPP starting in 1992.
Recent Financial Operations and Trends
United States
During the 1970’s, adverse economic conditions caused the short-range financial status of the OASDI program to deteriorate rapidly. Large deficits in the long range also appeared. The Social Security Amendments of 1977 strengthened the financing of the program in both the long range and the short range. However, continued unfavorable economic conditions after 1977 caused the OASI and DI Trust Funds to decline further. Legislation enacted in late 1981 permitted interfund borrowing so that loans could be made to the OASI Trust Fund from the DI and HI Trust Funds. Late in 1982, $17,519 million was lent to the OASI Trust Fund under these provisions-$1 2,437 million from the HI Trust Fund and $5,081 million from the DI Trust Fund. The loans were necessary to allow the continued timely payment of benefits from the OASI Trust Fund, which otherwise would have been exhausted in November 1982.
The interfund borrowing provisions permitted loans only through December 31, 1982, and limited the loans to the amount necessary to ensure the timely payment of OASI benefits through
June 1983. The Social Security Amendments of 1983, enacted in April 1983, provided for OASDI program changes that resulted In substantial trust fund growth in the short range and brought the program into actuarial balance in the long range. In each year after 1982, the combined OASI and DI Trust Funds have increased. The loans to the OASI Trust Fund were fully repaid by April 19, 1986. The trust funds have increased more rapidly than was estimated at the time the 1983 amendments were enacted, due, in part, to a long period of sustained economic growth since 1982.
Canada
The partial-funding basis of the CPP and QPP is reflected in a high fund relative to annual expenditures. In 1981, the assets of the CPP fund were about 7% times as large as annual expenditures. However, the ratio of assets to expenditures has been declining. By 1986, the ratio was about 5 to 1.
Since the beginning of the CPP in 1966, it has been recognized that the 1.8-percent contribution rate for employees and employers, each, that was in effect before December 1985, would become inadequate at some future date. Estimates made in 1978 indicated that total outgo would begin to exceed total income in 1993, and that the fund would be exhausted in 2003, if the contribution rates were held level at 1.8 percent for employees and employers, each. Estimates prepared 5 years later confirmed those dates and eventually led to the adoption of the new schedule of contribution rates described earlier.
The recent financial operations and trends of the QPP have been similar to the CPP. However, the future financing requirements of the
QPP may be somewhat different from those of the CPP, because of differences in demographic conditions, assumptions, and benefits.
Current Financing Issues
Significant increases in benefit costs lie ahead for the social security programs in both the United States and Canada. Most of the estimated increases in costs, relative to taxable earnings, will occur in the long term, over a 2Gyear period beginning about 20 years from now.
In the short term, the programs in both countries have more than adequate financing for the payment of benefits. Although both programs are similar in this regard, the ratio of OASDI assets to expenditures is projected to rapidly increase in the near term, while the corresponding ratios for the CPP and QPP are projected to decline because, as noted previously, the relative levels of funding for OASDI in the United States and the CPP (and QPP) in Canada have been quite different. Also, the age and maturity of the two programs differ significantly- OASDI having begun in 1937 and the CPP in 1966.
United States
The long-range estimates for the combined OASI and DI Trust Funds over the next 75 years are shown in table 2. The estimates are shown on a level-financing basis-that is, present-value calculations-for each of the four alternative sets of assumptions described in the 1988 Trustees Report.
As indicated by the data in table 2, the alternative sets of assumptions range from optimistic (alternative I) to pessimistic (alternative Ill). Alternative II-B is considered to be the most likely scenario of the four sets. Based on
Social Security Bulletin, April 1989/Vol. 52, No. 4 9

alternative II-B, the estimated summarized income rate is 95.7 percent of the estimated summarized cost rate. The criterion for “close actuarial balance” is that the summarized income rate should be between 95 percent and 105 percent of the summarized cost rate, based on alternative II-B. Since the estimated rates meet this criterion, the OASDI program is said to be in close actuarial balance. If, however, the previously used averaging calculations were used, the rates would not meet the criterion, and the program would not be in close actuarial balance. On the old basis, the estimated average income rate, based on alternative II-B, is 12.95 percent (the beginning fund balance is not included) and is only 93.7 percent of the estimated average cost rate of 13.82 percent. The level- financing cost rate is smaller than the average cost rate because expenditures rise more rapidly than taxable payroll from about 2015 through about 2035, and, as noted above, the assumed interest rate is higher than the rate of growth in taxable payroll. Tax income also increases somewhat more rapidly than taxable payroll (though not as rapidly as expenditures), over the same period. Thus, even with the inclusion of the beginning fund balance, which is 0.06 percent of the present value of the taxable payroll, the level-financing income rate is smaller than the average income rate.
The summarized figures shown above do not reveal the pattern of OASDI financing within the next 75-year period. Table 3 shows the pattern of financing as depicted by the annual rates for every fifth year, based on the intermediate alternative, II-B assumptions.
The pattern of income rates and cost rates shown in table 3 reflects the partial advance funding now present in the OASDI program. The estimated positive annual balances over the next 30 years imply a substantial accumulation of trust fund reserves. However, because of rapidly rising costs beginning in the first decade of the next century, the
estimated annual balances become negative after the first 30 years of the projection period. Thereafter, the annual deficits become generally larger throughout the remaining 45 years of the projection period.
The combined OASI and DI Trust Funds are projected to increase
Table P.-Level-financing income rates, cost rates, and actuarial balance for the combined OASI and DI Trust Funds, 1988-2062 ’
[As percentage of taxable payroll]
Alternative
Rate
Income cost Actuarial balance
Alternative I....................... 12.83 10.97 1.86 Alternative II...................... 12.91 12.83 .08 Alternative II-B.................... 12.94 13.52 -58 Alternative Ill...................... 13.07 16.49 -3.42
‘See 1988 Annual Report of the Board of Trustess of the Federal Old-Age and Survivor Insurance and Dlsablllty Insurance Trust Funds, May 5, 1988.
Table 3.-Estimated income rates, cost rates, and actuarial balance for the combined OASI and DI Trust Funds, based on alternative II-B assumptions, calendar years 1988-2065 ’
[As percentage of taxable payroll]
Calendar year
Rate
Income cost Actuarial balance
1988 ............................. 12.29 10.73 1.56 1990 ............................. 12.60 10.81 1.79 1995 ............................. 12.62 10.55 2.07 2000.. ........................... 12.67 10.30 2.37 2005.. ........................... 12.75 10.22 2.53 2015.. ........................... 12.88 11.86 1.02 2020.. ........................... 12.97 13.47 -.51 2025 ............................. 13.04 14.93 -1.89 2030 ............................. 13.10 15.88 -2.78 2035 ............................. 13.13 16.25 -3.12 2040 ............................. 13.13 16.23 -3.10 2045.. ........................... 13.14 16.25 -3.11 2050.. ........................... 13.15 16.43 -3.28 2055 ............................. 13.16 16.66 -3.50 2060 ............................. 13.17 16.80 -3.62 2065 ............................. 13.18 16.85 -3.68
‘See 1988 Annual Report of the Board of Trustess of the Federal Old-Age and Survivors Insurance and Dlsblllty Insurance Trust Funds, May 5, 1988.
10 Social Security Bulletin, April 1989IVol. 52, No. 4

rapidly over the next three decades, with the assets, as a percentage of annual outgo, reaching a maximum of 531 percent in 2015, based on alternative II-B. Although total outgo begins to exceed tax income in 2019, the estimated assets, in nominal dollar amounts, continue increasing, to a peak of $11.8 trillion in 2031, because the interest earnings of the trust funds are larger than the excess of outgo over other income through this period. After 2031, the estimated assets, in nominal dollars, begin to decline, and the combined funds are estimated to be exhausted in 2048.
As a result of the projected accumulation of the trust funds, a great deal of publicity has been given to the Social Security program in the United States. Many articles in newspapers and magazines quote the $11.8 trillion maximum nominal dollar amount that the trust funds’ reserves are estimated to reach by the year 2031. Because the investments of the trust funds are limited, by law, to publicdebt obligations of the United States Government, some writers and politicians predict that the trust funds will own the entire public debt of the United States. However, the use of nominal dollar amounts, which is represented by the $11.8 trillion estimate, can be misleading when it applies to a period 43 years from now. If, for example, the reserves in 2031 were adjusted for the increase in the Consumer Price Index from 1988 and expressed in 1988 dollars, the amount would be only $2.2 trillion. (However, the maximum amount of $2.6 trillion, in 1988 dollars, would be reached earlier, in 2022.) If the reserves were expressed as a percentage of the projected gross national product, the maximum percentage would be 29.1 percent, reached in 2018. As a point of interest, the gross Federal debt of
the United States has been at least 33 percent of the GNP in every year since 1940. In 1988, the gross Federal debt was more than 55 percent of the GNP and was expected to be more than 56 percent of the GNP during the next 5 years.
The rising cost of the OASDI program, as a percentage of taxable earnings, after the next 30 years is largely due to the demographic situation in the United States. The large number of persons born during the “baby- boom” years from the mid-1940’s to the mid-1960’s are now in the work force and will not begin to reach retirement age until about 20 years from now. As the baby-boom generation retires, the estimated number of workers will become about level, due to the low birth rates since the mid-1960’s.
Today, there are 3.4 workers in covered employment for every OASDI beneficiary. But, largely because of the past and projected birth rates and mortality rates, the ratio of workers to beneficiaries is projected to drop rapidly after the
next 30 years, reaching 1.9 by 2035, and gradually dropping to 1.8 by the end of the 75-year projection period.
The long-term drop in the number of workers per beneficiary, and the resulting increase in the cost rate of the program, may strain the financial resources of the system in the long range. However, the OASDI program will continue to be monitored closely over the next 20-30 years, and ample time is available to prepare for any necessary modifications of the program in the long range.
Canada
The Canada Pension Plan is now adequately financed because of the rising schedule of contribution rates and the quinquennial review procedure that has been established. However, as a result of the long-term trend in rising costs, the projected contribution rates will rise steadily for about 50 years. Thus, the quinquennial review procedure must deal with continually increasing contribution rates. Table 4 shows the estimated
Table 4.-Financing schedule for the Canada Pension Plan
[Percentage of contributory earnings]
Rate
Calendar war cost Projected contribution
1988 ......................... 1990. ........................ 1995 ......................... 2000 ......................... 2005 ......................... 2010 ......................... 2015 ......................... 2020 ......................... 2025 ......................... 2030 ......................... 2050 ......................... 2075 ......................... 2100 .........................
5.19 4.00 5.63 4.40 6.18 5.20 6.75 5.95 7.18 6.70 7.88 7.45 8.95 8.80
10.09 10.10 11.27 11.07 12.03 11.65 11.49 11.68 11.42 11.34 11.50 11.40
Social Security Bulletin, April 1989/Vol. 52, No. 4 11

cost of the CPP, as a percentage of contributory earnings, and the scheduled contribution rates for employees and employers, combined, for selected years in the future. The estimates are based on the new assumptions in the actuarial report prepared in 1986.”
As explained above, increases in the contribution rates are scheduled through 1991. The rates projected for 1992-2011 are, however, subject to future review. Contribution rates after 2011 were calculated by the previously described formula that would be used to determine rates in the absence of an agreement or recommendation at subsequent quinquennial reviews.
As a result of the scheduled and projected increases in contribution rates, the CPP fund continues to rise, in nominal dollar amounts, throughout the long-range projection period. Although the cost rate exceeds the contribution rate through 2015, as shown in table 4, the fund grows because of interest earnings on its relatively large assets. However, through 2035, the ratio of the fund to annual expenditures is projected to decline steadily from its current level of about four times annual expenditures. By the end of the long-range projection period, however, the assets will still be relatively large, at about twice the level of annual expenditures.
3lbid.
In table 5, the projected fund assets are shown in nominal dollars and as a ratio to annual expenditures. Based on the estimates in this table, the CPP is adequately financed in both the short range and the long range. However, as noted above, the estimates are based on the projected contribution rates, which after 1991 are subject to quinquennial Federal-provincial review.
The financial status of the QPP is similar to that of the CPP only through 1991. After 1991, there are as yet no projected increases in contribution rates, in the abience of which the QPP fund is projected to be exhausted in 2002. An actuarial report to be released in 1989 will present a variety of financing scenarios that could be applied to the QPP starting in 1992.
Conclusion
The costs of the social security programs in the United States and Canada, including the province of Quebec, will rise dramatically in the future. The programs in both countries are estimated to be adequately financed in the short range and for many years in the long range. However, the contribution rate schedules are quite different in each country, and the projected fund balances follow different paths.
The U.S. Old-Age, Survivors, and Disability Insurance (OASDI) program is financed by a flat tax rate beginning in 1990, and the combined OASI and DI funds accumulate rapidly during the first half of the long-range projection
Table L-Canada Pension Plan fund projection, selected years 1988-2100
[Amounts in billions]
Fund at Calendar year end of year
1968....................... Can938 1990....................... 42 1995....................... 57 2000 . . . . . . . . . . . . . . . . . . 74 2005 . . . . . . . . . . . . . . . . . . 94 2010 . . . . . . . . . . . . . . . . . 118 2020 . . . . . . . . . . . . . . . . . . . 196 2030 . . . . . . . . . . . . . . . . . . . . 317 2050 . . . . . . . . . . . . . . . . . . . . . 1,066 2075 . . . . . . . . . . _ . . . . . . . . . . 4,355 2100 . . . . . . . . . . . . . . . . . . . . . 16,145
’ Ratio of fund at end of year to expenditures in following year.
Ratio of fund to expenditures ’
4.3 4.0 3.6 3.3 2.9 2.5 1.9 1.6 1.9 2.1 2.0
12 Social Security Bulletin, April 1989Nol. 52, NO. 4

period. The partial advance funding provides additional interest income that helps to pay benefits later, when outgo exceeds tax income. However, the combined funds are estimated to become exhausted in 2048, portending financial strains in the latter half of the long-range period.
The Canada Pension Plan (CPP) is to be financed by contribution rates that will likely continue to increase for at least 50 years. However, the extent of partial advance funding is estimated to decline in the future, because of the levels by which future annual cost rates generally exceed the corresponding contribution rates.
Social security will continue to be a subject for public debate in the United States because of the projected buildup of the trust funds and their expected subsequent decline and exhaustion. In Canada, the scheduled increases in contribution rates and the quinquennial reviews will undoubtedly ensure future debate on social security.
Social Security Bulletin, April 1989/Vol. 52, No. 4 13