al-othaim company - mecmec.biz/term/uploads/alothaim_09112009.pdf · al-othaim’s aggressive...
TRANSCRIPT

RETAIL | 09 November 2009 INITIATION OF COVERAGE
Al-Othaim Company Overweight Aggressive growth through high volumes
Price (SR) 51.5
12-month Tp (SR) 63.10
Potential upside (%) ↑ 23
Stock details
52-week range H/L (SR) 65/28
Market cap ($mn) 309
Shares outstanding (mn) 22.5
Listed on exchanges TADAWUL
Price perf (%) 1M 3M 12M
Absolute (7.6) 10.0 68.9
Rel. to market (5.8) 1.7 61.7
Avg daily T/o (mn) SR US$
3M 17.4 4.6
12M 22.8 6.1
Reuters code 4001.SE
Bloomberg code AOTHAIM AB
Website www.othaimmarkets.com
Valuation multiples
08 09E 10E P/E (x) 18.6 15.2 14.2
P/B (x) 3.9 3.4 3.0
EV/EBITDA (x) 11.9 13.3 10.8
Div yield (%) 3.8 2.9 2.9
Source: NCBC Research estimates
Share price performance
0
14
28
42
56
70
Aug-08 Mar-09 Oct-09
0
2,000
4,000
6,000
8,000
10,000
Al-Othaim Tadawul
Al-Othaim’s aggressive store expansion, multi-format operations and
attractive pricing policy position it strongly in Saudi Arabian food retailing.
With top and bottom line set to grow at double-digit CAGR during 2008-
13e, we initiate on Al-Othaim with an Overweight rating and PT of SR63.1
Ambitious expansion plans to push growth: Store expansions and a focus
on underpenetrated rural markets have helped Al-Othaim to grow into the
KSA’s second-largest food retailer. According to Business Monitor International,
food consumption in KSA is expected to increase by 33% during 2008-13, with
the hypermarket and supermarket formats taking an increasing % of sales. We
expect Al-Othaim to capitalize on this growth by opening 42 new stores in the
coming five years, leading to 12.4% revenue CAGR during 2008-13e.
A resilient product mix and favorable demographics: Al-Othaim has a
resilient product portfolio that focuses on the low and mid-income consumer
group. Relatively demand inelastic staples constitute 85% of its turnover. With
nearly 250,000 new family units formed in Saudi Arabia every year, as the
number two grocery retailer in KSA, Al-Othaim is positioned strongly to benefit
from the increased demand, aided by favorable demographics.
• Declining cost per unit to narrow margin contraction: EBIT margins
contracted to 2.1% in 2008 from 3.4% in 2004, impacted by growing
competition and higher operating costs. Going forward, we expect pricing
pressure to remain high as competition intensifies. However, increased sales of
private label goods, vertical expansion into food production and lower costs per
unit through higher volumes should support margins.
• Valuation: Al-Othaim currently trades on a 2010e P/E of 14.2x vs. a global
peer average of 16.8x. Given the potential of the Saudi market, we expect Al-
Othaim to trade close to the industry average. As the only listed pure-play food
retailer in the region, the stock is an ideal way to gain exposure to this sector.
We initiate coverage on Al-Othaim with an Overweight rating and target share
price of SR63.1, indicating a 23% upside to the current market price.
Source: Reuters Financials
2008 2009E 2010E 2011E CAGR %
Revenue SR mn 2,915 3,212 3,591 4,038 11.5
EBITDA SR mn 97 109 122 132 10.8
EBITDA margin % 3.3 3.4 3.4 3.3 Farouk Miah [email protected] Tel. +966 2690 7717 Net income SR mn 62 76 82 92 14.0
Net margin % 2.1 2.4 2.3 2.3
EPS SR 2.77 3.39 3.63 4.10 14.0
Total assets SR mn 1,081 1,329 1,453 1,588 13.7
Total selling space Sq mtr 119,500 135,500 150,400 165,300 11.4
Supermarket-to-total sales % 55.0 59.3 59.6 60.2 Please refer to the last page for important disclaimer
Source: Company, NCBC Research estimates

9 November 2009 ABDULLAH AL-OTHAIM MARKETS COMPANY - INITIATING COVERAGE 2
Contents INVESTMENT SCENARIOS...................................................................................3
INVESTMENT VIEW ............................................................................................4 Investment risks .....................................................................................................6
VALUATION........................................................................................................7 Valuation methodology ............................................................................................7
BUSINESS BACKGROUND .................................................................................11 Company overview................................................................................................ 11 Corporate history and structure .............................................................................. 11
SIX KEY THEMES ..............................................................................................13 1) Variability of new store openings......................................................................... 13 2) The threat of Agflation ....................................................................................... 14 3) Expanding Private Labels.................................................................................... 16 4) Staying with food, for now.................................................................................. 18 5) Ramadan moving into the summer ...................................................................... 19 6) Vertical expansion a possibility ........................................................................... 19
BUSINESS FOCUS .............................................................................................21 Business evolution................................................................................................. 21 Segmental analysis ............................................................................................... 21
INDUSTRY AND BUSINESS ...............................................................................26 Macro-drivers impacting Al-Othaim.......................................................................... 26 Retailing in Saudi Arabia: A snapshot....................................................................... 27 Competitive landscape - Al Othaim vs. the Rest ........................................................ 29
FINANCIAL ANALYSIS ......................................................................................31 Revenues ............................................................................................................. 31 Cost breakdown .................................................................................................... 32 Margins................................................................................................................ 33 Taxation............................................................................................................... 33 Per share data ...................................................................................................... 33 Fixed asset investment .......................................................................................... 34 Working capital management.................................................................................. 35 Cash flow ............................................................................................................. 36 Leverage.............................................................................................................. 37 Return ratios ........................................................................................................ 38
FINANCIALS.....................................................................................................39

9 November 2009 ABDULLAH AL-OTHAIM MARKETS COMPANY - INITIATING COVERAGE 3
Investment scenarios
Expansion in store count and productivity key growth
drivers
Historical and expected price performance (three
scenarios)
4.710.9
12.13.5 1.8 6.4 3.5
34.0
65.176.8
0
20
40
60
80 (SR)
DC
F Bear
Case
WAC
C m
ore
by
0.5
%
Rev
per
stor
e d
ec
by
2%
Cost
s in
crease
by
10 b
ps
(as
%of sa
les)
10 less
superm
arke
ts o
pened
DC
F Base
Case
5 m
ore
super-
mar
kets
open
ed
Cost
s decr
ease
by
5 b
ps
(as
%
of sa
les)
Rev
per
stor
e inc
by
0.5
%
DC
F Bull
Case
77
34
65
0
20
40
60
80
100
Aug-08 Feb-09 Sep-09 Mar-10 Oct-10
Historical Price Performance Price Target
Source: NCBC Research Source: NCBC Research
Investment view Investment scenarios
Price target:
SR 63.1
• Weighting of DCF base case and P/E
multiple at 50% each. P/E is calculated
using 2010e EPS of 3.63
DCF bull case:
SR 76.84
• Strong domestic market and increasing
store count. We assume expansion of
outlets on the back of higher Saudi
spending power to translate into increased
revenue per sq meter. This will likely result
in revenue CAGR of 13.3% between 2008-
13e and restrict margin contraction, leading
to EBIT margins of around 2.5% in 2013e
DCF base
case:
SR 65.15
• Per capita retail spending remains favorable
over the medium term, expansion
continues. We assume 2008-13e revenue
CAGR of 12.4%
• Leading player: Al-Othaim is currently the second largest
food retailer in Saudi Arabia, positioning it well to take
advantage of the growing market in the coming years.
• Pure play retailer: As the only listed pure play food
retailer in the region, the stock represents an excellent way
to gain exposure to this sector
• Risk-reward weighted to the upside. The stock suggests
49% upside in our bull case and 34% downside in our bear
case
• Valuation is reasonable: The stock trades at a 2010e P/E
of 14.2x vs. 16.8x of global peers and 16x of the TASI retail
sector.
• Defensive product portfolio: A grocery retailer with
staples constituting 85% of turnover provides portfolio
resilience, and should help the company outperform even
during economic downturns.
• Store expansion key driver to growth: Increasing store
count is expected to drive revenue growth at 12% CAGR
during 2008-13e.
• Measures to limit margin contraction: Increased
emphasis on private label goods, vertical expansion and
focus on improving operational efficiency and increasing
turnover is expected to help Al-Othaim maintain EBIT
margins of around 2.1-2.3% in 2008-13e.
DCF bear
case:
SR 34.00
• Lower per capita income in KSA will lead to
subdued spending power along with lower
store count for the company. We assume
2008-13e revenue CAGR of 9.9% and
2013e EBIT margin under 1.4%, reflecting
lower revenue per sq m. Assumes higher
WACC of 11.0%
Potential catalysts Investment risks
• Higher pace of store expansion: Higher than targeted
retail store openings will boost turnover and profit
• Lower commodity prices: Decline in global commodity
prices will lower COGS for food trading companies, leading
to higher margins
• Geographic expansion: Expansion into potentially
lucrative Egyptian market would spur growth
• Higher commodity prices: High global commodity prices
will put pressure on margins
• Increased competition: Increasing competition,
particularly through a new global entrant, would increase
pricing pressure at Al Othaim, leading to top and bottom
line slowdown
• Lower than expected store openings: We estimate 42
new stores to come by 2013e. If the actual number is below
our estimates, it would result in a decline in our PT

9 November 2009 ABDULLAH AL-OTHAIM MARKETS COMPANY - INITIATING COVERAGE 4
Investment view Store expansion is the key growth driver, with the Supermarket format leading the way Given increased pricing pressure and competition, we believe store expansions will
be the key growth driver for Al-Othaim, going forward. Management has announced
plans for ten new stores per year over the coming years. We believe this is
ambitious and have factored in our models around eight new stores per year
through 2013e. Al-Othaim’s aggressive expansion is supported by trends in the
food retail sector – food consumption in Saudi Arabia s set to increase by 33% in
the coming five years with the Super/Hypermarket share of this increasing to 57%
from 50%. Of the 42 total new stores expected during 2009-13e, we believe 34 will
be in the Supermarket format. This expansion is expected to result in 2009e sales
of SR3.2bn and would lead to revenue CAGR of 12.4% over 2008-13e.
Higher volumes and private label products to support margins Al-Othaim’s declining gross margin is a key concern with the company’s gross
margins falling from 8.6% in 2004 to 6.3% in 2008. This is as a result of
maintaining an aggressive pricing stance even as commodity prices increased in
order to ward off competition and increase market share. Although the recent fall in
global commodity markets provides a breather, intensified competition in the retail
space continues to exert pressure on selling prices. However, Al-Othaim has
strategies in place to limit the margin decline. The company is moving up the value
chain and increasing the share of higher margin private label products, intending to
increase its share of private label products to 15% in five years from 5% currently.
The company intends to develop several manufacturing facilities that will produce
bakery, meat, dairy, etc and supply fresh products to its stores.
Defensive portfolio to help ride out any stagnation in the economy Al Othaim largely sells basic/staple products, the demand for which is relatively
inelastic, making its impact from the current economic decline limited. Furthermore,
Al-Othaim has a strong market position as the second-largest retailer in the
country. This, supported by a solid balance sheet and lower raw material prices,
should help the company weather any stagnation in the economy, we believe.
Well positioned for industry consolidation We believe around 50% of the Saudi grocery sector consists of unorganized non-
chain stores, with the remainder consisting of more than a dozen companies
competing in the organized segment of the market. We believe the coming years
will see an increasing move from unorganized stores to organized chains, with the
benefits of economies of scale driving further consolidation in the market. With Al
Othaim the second largest organized grocery retailer in the country coupled with its
strong balance sheet, we believe it is well positioned to use consolidation as a mode
of strengthening its position in the market.

9 November 2009 ABDULLAH AL-OTHAIM MARKETS COMPANY - INITIATING COVERAGE 5
INVESTMENT VIEW
Strong infrastructure support to enable expansion Al-Othaim has one large warehouse in Riyadh with four further warehouses serving
the more remote areas. In addition, it has a transport fleet that includes trailers,
trucks and containers with cold-storage facilities and buses. The company has
numerous smaller depots around the central region that provide quick reach to
remote untapped areas where competition is lower. The company has implemented
modern Management Information Systems (MIS) across its network by contracting
Wipro Retail, a leading international IT and business service company to implement
Oracle Retail and E-Business Suite, linking its facilities, stores, warehouses and
depots. We believe this will boost supply chain efficiency and help achieve business
efficiency targets, cut operational costs and accommodate its ambitious growth and
expansion plans.
Strong working capital management Al-Othaim has been reporting a negative cash conversion cycle for the past several
years (i.e. the company’s cash collection has always remained ahead of cash
outlay) with the cycle improving over the past few years as reflected in its cash
cycle period: this increased to 15 days in 2008 from just 6 days in 2003. Breaking
this down further, we find that the company’s receivable outstanding decreased to
10 days in 2008 from 12 days in 2003 while its payable outstanding increased
significantly to 53 days in 2008 from 43 days in 2003. This implies that the
company has been able to negotiate strongly and maintain healthy relationship with
suppliers. Moreover, we believe higher turnover would provide Al-Othaim the clout
to negotiate stronger deals with suppliers. These factors should result in improved
cash cycles and consequently, better liquidity.
Investment in real estate is complementary Al-Othaim owns a 13.7% stake in its associate company ‘Abdullah Al-Othaim Real
Estate Investment and Development Company’ that mainly deals in the
development of malls in the Kingdom. This provides Al-Othaim dual benefits: first,
the company can open new stores in better locations. Second, it can pay lower
rental vis-à-vis contracting with a third party. Al-Othaim is also entitled to a 13.7%
share of profits in the real estate arm. As of now, the real estate arm has five
malls, in which Al-Othaim has three hypermarkets and a supermarket.
Defensive stock with growth potential plus a value play We believe Al-Othaim offers a unique combination of non-cyclical exposure to the
Saudi market with a strong revenue growth potential. This, combined with its status
as the only pure-play exposure to the retail/grocery segment in the region, makes
the company an even more attractive holding for institutional shareholders. The
company has strong positioning in a rapidly growing market and a strategy that
targets a largely untapped consumer base. The company is capitalizing on the
opportunities engendered by favorable demographics by increasing its store
network and operational infrastructure. Factoring in these strengths and the
expansion initiatives taken by the company, we arrive at our PT of SR63.1,
equivalent to a 23% upside, and assign an Overweight rating on the stock.

9 November 2009 ABDULLAH AL-OTHAIM MARKETS COMPANY - INITIATING COVERAGE 6
INVESTMENT VIEW
Investment risks
SLOWER-THAN-EXPECTED EXPANSION MAY RESULT IN DEVIATION IN OUR ESTIMATES
Several retail players in KSA have recently curtailed their expansion plans amid the
global economic downturn. However, Al-Othaim recently unveiled plans to open ten
new stores on average every year, mainly in the supermarket format. We have
incorporated this expansion into our valuation model, but have been relatively
cautious by assuming around eight new stores per year. Any scale-back from this
number could result in a deviation in our estimates and lead to a reduced valuation.
HIGH LEVELS OF COMPETITION COULD DEPRESS TOP/BOTTOM LINE GROWTH
One of Al-Othaim’s key strategies has been to increase market share through
aggressive pricing. However, with a highly fragmented sector (the top five players
account for less than 15% of the grocery market), competition is high with existing
retailers jostling for extra market share. To compound matters, following Saudi
Arabia’s accession to the WTO, the government has begun to liberalize the
economy. As a part of this, it opened up the retail sector to foreign participation
through a local partner, leading to international competitors such as Carrefour
entering the market. This highly competitive marketplace will likely dampen both
top and bottom line growth for all companies in the sector.
HIGHER INFLATION REMAINS A MAJOR THREAT
Inflation in KSA moved up rapidly from 0.3% in 2004 to 9.9% in 2008 (recording a
high of 11.1% in July 2008) driven mainly by higher food and rental prices.
”Agflation” – a rise in the price of global food items was one of the key reasons
behind Al-Othaim’s gross margins declining to 6.3% in 2008 from 8.6% in 2004.
Recently, inflation numbers have retreated to 4.4% in September 2009, benefitting
from the global economic slowdown and falling oil prices. We expect this to result in
lower COGS and a lessening in the rate of margin contraction. Any return to
accelerating inflation however is likely lead to additional margin pressures for Al-
Othaim.
INTRODUCTION OF VAT MAY CHALLENGE RETAIL SALES GROWTH
In 2008, Dubai announced plans to introduce Value Added Tax (VAT) of 3-5% in
2009. This was temporarily put on hold due to the global financial crisis and is likely
to be introduced after 2010. We expect food and retail companies to pass the VAT
cost to end-users, possibly triggering adverse consumer reactions. If such a law
were to be introduced in KSA, we believe it would have a negative bearing on retail
companies such as Al-Othaim. With inflation now at a reasonable level, we believe
it is easier for regional governments to implement VAT.
HIGHER RENTAL COSTS
Al-Othaim operates its stores mostly under lease agreements. Inflation is easing;
nevertheless, rentals continue to grow, albeit slowly. Owing to a demand-supply
mismatch and several other factors, we expect rentals in KSA to remain high. Any
acceleration in rental increases would have negative implications for Al-Othaim’s
margins, which are already under pressure.

9 November 2009 ABDULLAH AL-OTHAIM MARKETS COMPANY - INITIATING COVERAGE 7
Valuation
Valuation methodology We used the following methodologies to arrive at a fair price for Al-
Othaim:
• Discounted cash flow model (DCF)
• Peer group valuation (P/E)
Weighted average cost of capital (WACC) Our valuation is based on the following assumptions:
Cost of Equity (CoE) of 11.8%: We have taken the US 10-year Treasury yield of
3.54% (as of October 2009) as the risk-free rate, as the Saudi Riyal is pegged to
the US dollar. The company’s adjusted beta (weekly returns since 1 January 2007
compared with Saudi’s TASI) is 0.957. We assume an equity risk premium of 8.6%
for Saudi Arabia which includes a 2.1% premium for the country risk associated
with Saudi Arabia.
Tax-adjusted cost of debt of 5.1%: The cost of debt for Al-Othaim is based on
the assumption that the long-term and short-term loans are charged at an average
rate of 5.3%. We then adjust this for Zakat. Over the past three years, Al-Othaim
has provided for Zakat of 2.3-3.3%.
Using the above assumptions, we arrive at WACC of 10.5% in 2009.
Discounted cash flow model We first prepare a five-year Free Cash Flow (FCF) estimate for 2009 to 2013e for
evaluating Al-Othaim’s business.
We estimate the likely cash flows for the period beyond our forecast horizon using
the continuing (or terminal) value principle assumed at 2.5%, slightly lower than
our long-term GDP growth forecast. We then discount these cash flows using
WACC.
Based on these assumptions, we arrive at an estimated enterprise value of the
company and adjust it further for debt and cash (including investments), to arrive
at Al-Othaim’s estimated market capitalization.
Exhibit 1: Al-Othaim - Details of valuation
(SR' 000, unless specified) Value % of total equity value
Sum of PV of FCFF - 2009-2013e 440,971 30
PV of Terminal value 1,193,384 81
Enterprise Value 1,634,355 111
Add: Cash Available 26,694 2
Less: Total Debt 284,865 -19
Add: Financial Investments 89,609 6
Equity Value 1,465,793
No. of Shares Outstanding (‘000) 22,500
Value per Share (SR) 65.1
Source: Company, NCBC Research

9 November 2009 ABDULLAH AL-OTHAIM MARKETS COMPANY - INITIATING COVERAGE 8
VALUATION
Using the DCF model, we arrive at a target value of SR65.1 per share, implying a
potential upside of 27% from the current level. The table below indicates the
impact of changes in WACC as well as terminal growth rate on the target value.
Exhibit 2: Sensitivity of valuation to WACC and terminal growth
WACC (%)
8.5 9.5 10.5 11.5 12.5
1.5 77.1 66.8 58.8 52.4 47.1
2.0 82.4 70.7 61.8 54.7 49.0
2.5 88.6 75.2 65.1 57.3 51.1
3.0 96.0 80.4 69.0 60.3 53.4 Term
inal
gro
wth
ra
te (
%)
3.5 104.8 86.4 73.4 63.6 56.0
Source: NCBC Research estimates
Peer group valuation We have compared Al-Othaim’s P/E multiple with that of related global stocks. We
have opted for a mix of supermarkets from developed regions as well as developing
countries in order to better reflect the Al Othaim business. Historically, Al-Othaim
has traded at a discount to its peers. For instance, Al-Othaim traded at a 25.3%
and 26.4% discount to the industry average of 26.0x and 25.3x for 2007 and 2008
respectively. We believe the discount is compelling, given Al-Othaim’s healthy
fundamentals and the solid growth prospects of the Saudi market, especially when
compared to the more mature markets in which the global peers operate. However,
we conservatively assume that Al Othaim should trade in line with its peer group
which equates to a target P/E multiple of 16.8x for estimated 2010e EPS. Based on
this multiple, we value Al-Othaim at SR61.0 per share, which translates into a 19%
premium to the current share price of SR51.5.
Exhibit 3: Valuation metrics vs. Peers
P/E(x) RoE (%)
Company – Country Mkt cap
(USD mn) 09E 10E 09E 10E
Tesco Plc – UK 53,250 13.4 12.1 17.4 17.5
Companhia Brasileira De Dist. – Brazil 6,449 30.1 20.5 7.3 9.7
Cencosud – Chile 6.681 27.6 18.5 5.9 7.9
Shopr1ite Holdings – RSA 4,069 14.0 12.2 35.9 34.3
Costco Wholesale Corporation – USA 24,675 19.8 17.5 11.8 12.2
Times Ltd – HK 604 20.6 16.8 10.4 11.4
Target Corp – USA 36,452 15.8 14.0 15.4 14.6
Carrefour SA – France 28,015 19.5 13.8 13.9 15.6
Metro AG – Germany 17,227 17.9 14.6 13.3 14.8
Wumart Stores – HK 1,879 34.1 27.7 16.8 17.1
Lianhua Supermarket Holdings – HK 1,158 20.3 17.0 16.6 18.0
Al-Othaim Markets Company - KSA 309 15.2 14.2 23.8 22.4
Weighted Overall Average 20.7 16.6 15.7 16.3
Average (excluding Al-Othaim) 21.2 16.8 15.0 15.7
Premium / (discount) (%) (28.4) (15.6) 59.1 42.2
Source: Company, Reuters, NCBC Research estimates

9 November 2009 ABDULLAH AL-OTHAIM MARKETS COMPANY - INITIATING COVERAGE 9
VALUATION
Al-Othaim’s valuation, based on peer multiple, is displayed in the exhibit below.
Exhibit 4: Al-Othaim — valuation based on multiples
2010E
Earnings Per Share (SR) 3.63
Peer group average P/E 16.8
Premium/discount (%) 0
Al-Othaim P/E (x) 16.8
Price based on P/E (SR) 61.0
Source: NCBC Research estimates
Blended valuation Assigning a 50% weight each to DCF and P/E, we arrive at a target price of SR63.1
per share for Al-Othaim. This represents an upside of 23% from the current market
price of SR51.5.
Exhibit 5: Al-Othaim – Blended valuation
Valuation approach Price Potential upside/ (downside) (%) Weight (%)
DCF 65.1 26.5 50
Price-to-Earnings 61.0 18.5 50
Al-Othaim target price (SR) 63.1 22.5
Source: NCBC Research
Valuation evolution We have traced the historical movement of Al-Othaim’s P/E multiple and we find
that since its listing, the company has traded in a P/E band of 8.9–22.2x. This
sharp variance has been due to the volatility in the Saudi markets during 2008. The
stock’s P/E tumbled to single digit in October 2008 even as the Saudi markets
corrected sharply in the wake of the global financial crisis and its fallout in the
crude oil market. Al-Othaim currently trades at 15.2x 2009e EPS, toward the
middle of its recent P/E band.
Exhibit 6: Al-Othaim - P/E bands
-
16
32
48
64
80
Aug-08 Oct-08 Dec-08 Feb-09 Apr-09 Jun-09 Aug-09 Oct-09
Source: NCBC Research
21x
16x
10x

9 November 2009 ABDULLAH AL-OTHAIM MARKETS COMPANY - INITIATING COVERAGE 10
VALUATION
Liquidity Al Othaim has had varied liquidity over the last ten months with volumes above 1m
per day not uncommon, as well as days with less than 100k traded. The company’s
average daily turnover was SR25.3 mn (USD6.8 mn) in the first ten months of
2009 with this equating to 4.6% of free float.
Exhibit 7: Al-Othaim — liquidity on Tadawul
3 months
Jan09 - Mar09YTD 2009
Jan09 - Oct09 Since listing
Avg daily turnover (SR mn) 52.6 25.3 24.9
Avg daily turnover ($ mn) 14.0 6.8 6.7
Volumes (‘000) 1,035.9 523.8 515.4
As % of free-float 4.4 4.6 4.5
Source: Tadawul, Bloomberg, NCBC Research

9 November 2009 ABDULLAH AL-OTHAIM MARKETS COMPANY - INITIATING COVERAGE 11
Business background
Company overview Abdullah Al-Othaim Markets Company (Al-Othaim) is the second-largest food
retailer in Saudi Arabia with around 4% market share as of end 2008. The company
runs a chain of supermarkets and convenience stores throughout the Kingdom. In
2008, Al-Othaim earned net income of SR62.3mn on turnover of SR2,915mn,
implying a 2.1% net margin.
Al-Othaim operates in four market segments, Supermarkets, Hypermarkets,
Wholesale Stores and Convenience (or Corner) Stores:
• Supermarket is the largest segment, with 52 stores generating 55% of total
revenue in 2008
• Wholesales Stores accounted for 23% of total revenue through its seven units
• Hypermarkets accounted for 13% of revenue in 2008
• Convenience stores made up 9% of revenue in 2008
Geographically, Saudi Arabia accounts for the entire revenue of the company.
Al-Othaim also has a 13% stake in Abdullah Al-Othaim Investment and Real-estate
Development Company, a firm which specializes in constructing and managing
shopping complexes.
Exhibit 9: 2008 revenues by retail format and product type %
Supermarket58%
Hypermarket14%
Wholesale24%
Corner4%
Source: Company, Reuters, NCBC Research
Corporate history and structure Al-Othaim is an extension of Saleh Al-Othaim Trading Enterprises established in the
year 1956 by the late Saleh Ali Al-Othaim. The business started with just one store
in the Batha region, in the heart of Riyadh, engaged mostly in food retail. Mr. Al-
Othaim’s son eventually took over the business and he gradually opened a number
of stores in different retail formats to cater to the burgeoning urban needs of KSA
and a wider segment of customers. As of today, nearly two-thirds of the company
outlets are in the Riyadh area. Al-Othaim completed its initial public offering in
August 2008.
Exhibit 8: 2 key figures
(SR ‘000)
2008A
Revenues 2,914,948
Gross profit 183,466
Gross margin(%) 6.3
Net profit 62,267
Net margin (%) 2.1
Source: Company

9 November 2009 ABDULLAH AL-OTHAIM MARKETS COMPANY - INITIATING COVERAGE 12
BUSINESS BACKGROUND
In 1992, Al-Othaim established large warehouses and created other supply
infrastructure such as distribution vans, to keep pace with the expansion in retail
stores. Currently, the company has one large warehouse in Riyadh and four other
smaller warehouses used to serve remote areas.
Al-Othaim’s financial performance has been strong as the company benefited from
the growing retail market in the Kingdom. Over the past five years, Al-Othaim’s
revenue and net income CAGR have been 21.2% and 21.6% respectively. This
growth has come on the back of store expansions in densely populated urban
centers, supported by the rising popularity of ‘Mass Grocery Retail’ (MGR).
Management On 1 November 2009, Al-Othaim announced it had appointed Mohammad Abdul
Khalil as its new CEO after the resignation of Yousef Mohammad Al Qafari in
August. Although this change may cause some short term delays, we do not believe
it materially impacts the long term prospects for the company. Other key
management personnel all have relevant experience with a combination of those
who have been with Al-Othaim for over 15 years, as well those who joined
relatively recently.
Exhibit 10: Key management personnel
Name Post Nationality Age Since
Mohammad Abdul Kahlil CEO Canadian 43 2009
Marwan Ibrahim Al-Qasim CFO Jordanian 41 2005
Bahauddin Sharbani CFO and Head of Sales Egyptian 55 1993
Nasruddin Farah Siddique Head of Purchase Sudanese 48 1993
Mohammad Abdulla Saloom Head of HR Saudi 43 2007
Source: Company, NCBC Research
Shareholding structure Al-Othaim Holding Company and Abdullah Saleh Al-Othaim were the only two
holders to have their stakes diluted in the IPO – 70% to 49% and 15% to 6%
respectively. Currently Al-Othaim Holding Company is the largest shareholder in Al-
Othaim with a 31% stake, followed by Abdul Aziz Saleh Al-Othaim with a 17.7%
stake and Abdullah Saleh Al-Othaim with a 6% stake.
Exhibit 11: Shareholding structure
(%)
Shareholders Pre-IPO Post-IPO Currently*
Al-Othaim Holding Company 70.0 49.0 31.2
Abdullah Saleh Al-Othaim 15.0 6.0 6.0
Fahad Abdullah Saleh Al-Othaim 5.0 5.0 N/A
Huda Abdullah Saleh Al-Othaim 5.0 5.0 N/A
Abeer Abdullah Saleh Al-Othaim 5.0 5.0 N/A
Abdul Aziz Saleh Al-Othaim - 17.7
Others - 30 45.1
Total 100.0 100.0 100.0
Source: Company, Reuters, NCBC Research, * As of 1/11/09 from Tadawul website where only holdings above 5% are shown

9 November 2009 ABDULLAH AL-OTHAIM MARKETS COMPANY - INITIATING COVERAGE 13
Six key themes
1) Variability of new store openings The opening of new stores, we believe will be Al-Othaim’s key growth driver, going
forward. Although management has stated its intention of opening ten new stores
per year in the coming five years, we have taken a more cautious stance in our
modeling, assuming eight store openings per year given the weak economic
climate, difficulty in finding suitable locations and other logistical issues which may
slow the rate of expansion. We believe the deviation in the number of stores Al
Othaim is actually able to open will play a large part in the value attributed to the
company.
If Al Othaim’s management is able to open one more store per year than we
currently forecast, leading to a total of 127 by 2013, this will lead to a DCF
valuation of SR66.9. Conversely, if Al Othaim does not meet even our conservative
store expansion numbers and opens one less store per year than our current
estimates leading to 117 stores by 2013, this would result in a DCF valuation of
SR63.4. Various other possibilities and their corresponding valuations are
highlighted in the exhibit below.
Exhibit 12: Store opening variance analysis SR
58.1 59.8 61.6 63.4 66.9 68.7 70.458.1
65.1 70.4
0
12
24
36
48
60
72
DC
F Bea
rca
se
Four
less
superm
ark
ets
open
ed p
er
yr
Thre
e less
superm
ark
ets
open
ed p
er
yr
Tw
o le
sssu
perm
ark
ets
open
ed p
er
yr
One less
superm
ark
et
open
ed p
er
yr
DC
F Base
Case
One m
ore
superm
ark
et
open
ed p
er
yr
Tw
o m
ore
superm
ark
ets
open
ed p
er
yr
Thre
e m
ore
superm
ark
ets
open
ed p
er
yr
DCF
Bull
case
Source: NCBC Research
Although this scenario analysis is theoretical and is dependant on many factors, we
believe it illustrates well the impact of the number of store openings to the
valuation. However, we highlight the importance of time value of money on our
scenario analysis; that is to say that if in 2009, Al Othaim opened one less store
than we expect, this would impact our PT by a higher degree than if it opened one
less store than we expect in 2013.
Despite conservative numbers, 27% upside We believe we have been relatively conservative in assuming that Al-Othaim will
open 42 stores by 2013e vs. the 50 it is targeting. Despite our conservative stance,
our DCF-based fair price target is SR65.1, a 27% upside to the current share price.

9 November 2009 ABDULLAH AL-OTHAIM MARKETS COMPANY - INITIATING COVERAGE 14
KEY THEMES
2) The threat of Agflation The sharp rise in global food prices in 2007 and 2008, where the average price of
soft commodities increased by 75%, has led to an increased focus on the future
price of these commodities and their social, economic and political impact. The
trend of increasing prices of agricultural food products (now popularly termed as
“Agflation”), is a key concern for food retailers due to the potential negative impact
on margins.
Exhibit 13: Price index for key food items 2006-2009
Index
50
75
100
125
150
175
200
225
250
275
Jan-06 Jul-06 Jan-07 Jul-07 Jan-08 Jul-08 Jan-09 Jul-09
Food Price Index Dairy Price Index Cereals Price Index
Source: FAO, NCBC Research NB: Food Price Index includes prices for 55 separate food related commodities; Dairy Price Index includes prices for Cheese, Butter, Skimmed Milk Powder, Whole Milk Powder and Casein; Cereals Price Index includes prices for 9 types of Wheat, 16 types of Rice and 1 type of Maize.
Average food prices set to remain high For many, the food “crisis” of 2007-2008 is not an isolated incident but an indicator
of things to come. According to the United Nations, the global population level is set
to increase by 50% to 9bn by 2050. Given this, we believe the current agricultural
system will not be able to sustain the average historical levels of crop prices. Some
of the reasons for price increases in 2007-08 may be transitory; nonetheless, we
believe long-term trends suggest that demand will overtake supply, leading to
prices remaining higher than in previous years.
Exhibit 14: Explanations behind the food price spike in 2007-08
Transitory Long term
Demand drivers Population growth X
Increasing middle-income families X
Changing diets X
Continued economic growth X
Supply constraints Poor weather X
Increased usage in bio-fuels X
Urbanization X
Source: NCBC Research

9 November 2009 ABDULLAH AL-OTHAIM MARKETS COMPANY - INITIATING COVERAGE 15
KEY THEMES
Exhibit 15: Price forecasts for key soft commodities
Index
80
100
120
140
160
180
200
2002-07
2008 2009E 2010E 2011E 2012E 2013E 2014E 2015E 2016E 2017E 2018E
Wheat Coarse Grains Butter Cheese
Source: FAO, NCBC Research estimates
The outlook report of the United Nation’s Food and Agriculture Organization (FAO)
expects nominal prices of global commodities to be significantly higher in the
coming years; for example it expects prices of butter to be 68% higher by 2017-18,
compared with the 2002-07 average and that of cheese, skimmed milk and wheat
to be 52%, 60% and 38% higher respectively.
Exhibit 16: Difference in average prices during 2008-2017 vs. 1998-2007
%
0
10
20
30
40
50
60
70
80
90
Wheat Rice Butter Cheese Oilseeds Vegetableoils
Raw Sugar
Nominal Real
Source: FAO, NCBC Research
Al-Othaim’s business is sensitive to commodity prices Food purchases form a major percentage of Al Othaim’s total operating costs. For
example, in 2008, COGS as percentage of sales was 93.7%. Of this, purchase costs
constituted 92%, indicating that purchase costs accounted for nearly 86.2% of total
sales.
Although retail is not a regulated sector, the government maintains a close eye on
retail prices in KSA and the GCC in general, to ensure that consumers do not suffer
due to higher food prices. Thus, companies are not in a position to pass on the
entire burden of increasing costs to the consumers. Therefore, food processing

9 November 2009 ABDULLAH AL-OTHAIM MARKETS COMPANY - INITIATING COVERAGE 16
KEY THEMES
firms as well as retailers share the pain resulting from higher commodity costs. This
is partly reflected in the drop in Al-Othaim’s gross margins during 2004–2008.
Thus, we believe Agflation, remains a key risk for Al-Othaim over the coming years,
which could lead to further margin pressure.
Pressure on margins to continue Although global food prices have fallen over the past 12 months, we concur with
the FAO that average prices in the coming years will be higher than the average in
the recent past due to the supply-demand divergence. We expect Al-Othaim’s cost
of sales to grow faster than its top line, leading to gross margins declining to 5.2%
in 2013e. However, we have estimated a lower rate of fall in net margin, compared
with historical numbers because we expect strategies from Al-Othaim, such as
increasing the number of private label goods, to partially offset margin pressure
arising from higher purchase price and competition.
3) Expanding Private Labels
Private label goods generate higher margins Private labels refer to items sold under a brand created by the supermarket itself.
The key advantage of private labels is that, with the intermediary company
eliminated, the retailer is able to generate a higher margin. The manufacture of the
item is often outsourced and the item is sold directly by the retailer. For example,
Al-Othaim sells Fairy washing liquid, which it purchases from either Proctor &
Gamble, the manufacturer of this product, or a wholesaler, with the profit made on
this product minimal. However, it could decide to have its own brand “Al-Othaim
Washing up Liquid” for which it will outsource the production. It is then able to
make the profit it would have made on the Fairy item plus some of the profit, which
the wholesaler/Proctor & Gamble would have made themselves.
Al Othaim targets private label expansion From our discussions with the management, we understand that currently around
5% of goods sold by Al-Othaim are private label. Management aims to increase this
to 15% by 2013. In comparison, up to 40% of goods sold in supermarkets in
Europe and 25% in the US are private label brands. We believe that if Al-Othaim is
able to create private label brands that are genuine replacements of famous
brands, it would enhance margins and support margin growth amid increasing
competition.

9 November 2009 ABDULLAH AL-OTHAIM MARKETS COMPANY - INITIATING COVERAGE 17
KEY THEMES
Exhibit 17: % of private label goods in supermarkets %
0%
5%
10%
15%
20%
25%
30%
35%
40%
45%
Al Othaim Europe US
2008 2013
Source: Retailweek, NCBC Research
Famous trademarks contributing significantly to sales Al-Othaim uses several registered trademarks across the food and non-food product
categories. These include HALEY (food products), REX (non-food) and SAFFORI
(kids products and sweets) covering some 248 products and forming 3% of Al-
Othaim’s total SKU’s. In 2006, Al-Othaim introduced more trademarks including
PROOF (clothes, whiteners, healthy and beauty products), VICTO and SHEAR (food
products). It is worth noting that HALEY, its most important trademark, generated
approx SR100mn in turnover in 2007, constituting 4.4% of total sales.
Exhibit 18: Al Othaim private labels
Trademark Year of registration
Category Country of registration LOGO
HALEY (formed 4.4% of sales in 2007)
2005 Food Saudi Arabia, Bahrain, Syria and Jordan
SAFFORI 2005 Kids & sweet Saudi Arabia, Bahrain, Syria,
Jordan and UAE
REX 2005 Non-food Saudi Arabia
PROOF 2006 Clothes, whitener,
health & beauty Saudi Arabia
VICTO 2006 Food Saudi Arabia
SHEAR 2006 Food Saudi Arabia
AL-OTHAIM
Source: Company prospectus

9 November 2009 ABDULLAH AL-OTHAIM MARKETS COMPANY - INITIATING COVERAGE 18
KEY THEMES
Private label goods are here to stay According to a recent poll of 800 shoppers by GfK Custom Research North America,
consumers are becoming increasingly open to purchasing private label goods and
may well stick to these post recession. Some of the surveys key findings include:
• 35 percent of shoppers are trying store brand products for the first time in
categories where they had previously only purchased national-brand items.
Among this group, 94 percent say these store-brand products compare
“favorably” to their previous choice
• 91 percent of shoppers in the survey say they believe they are going to
continue buying store-brand products even after the recession ends. Only 8
percent of the consumers polled said they intend to stop buying private label
• Nearly half of all consumers polled say they believe the supermarket where
they normally shop should carry more store brands.
• 57 percent say they buy private label “frequently”; earlier this year, the figure
was 55 percent. The 2009 results are up substantially from the 41 percent who
said they bought private label frequently in a survey conducted just three years
ago
Although the above findings relate to US consumers, we believe many of these
trends will be true for Saudi too with this supported by comments from Al Othaim
management. Thus, Al Othaim’s target to give private label goods a more
prominent role in its stores will help enable it to meet consumer needs and increase
market share in the process.
4) Staying with food, for now Although traditionally supermarkets have mostly sold food items, they have
gradually converted to “one-stop-shops” which offer customers the convenience of
obtaining all their daily needs in one stop. Large supermarket chains have
expanded from selling food to everything customers might want —electronic goods,
consumer durables, clothes, pharmaceuticals, music etc. This trend has benefited
retailers since electronics and clothing gain higher margins (11-13% and 8-10%
respectively) vs. food items (2-4%).
Discretionary non-food items are more risky The trend nevertheless is not without risks. Moving away from foods, for instance,
increases reliance on discretionary items such as electronics and household goods,
the demand for which is more elastic. During an economic downturn, sales of such
items often suffer compared with defensive staple goods.
Al-Othaim keen on maintaining focus on food for now From our discussions with the Al-Othaim management, we understand that food-
based items constitute 85% of the company’s hypermarket merchandise, with
electronics and household comprising the rest. In the case of key competition, the
ratio of food-based items to non-food items is 60:40. Thus, we believe that Al-
Othaim’s sales are less sensitive to economic cycles vis-à-vis peers although a
lower percentage of sales coming from non-food entail lower margins versus peers.

9 November 2009 ABDULLAH AL-OTHAIM MARKETS COMPANY - INITIATING COVERAGE 19
KEY THEMES
The Al-Othaim management has indicated that it does not intend to move away
from this policy. This is because the ratio of food to non-food is more relevant to
the company’s target consumers who are typically in the low-mid income segment.
Thus, Al-Othaim’s customer base spends a higher proportion of income on food
than consumers who visit other retailers.
5) Ramadan moving into the summer Sales of certain food items double during Ramadan when special dishes are
prepared. In 2009, Ramadan commenced on 22 August and ended on 22
September. The start of Ramadan moves ahead in the Gregorian calendar every
year by around 10-12 days as the Islamic calendar is lunar based (i.e. in 2010,
Ramadan will commence on around 10-12 August). Thus for the last few years,
Ramadan has fallen in 3Q and this has reflected in higher sales in this quarter. A
concern is that over the next few years, Ramadan will fall in the summer months,
coinciding with Saudi school holidays when many families choose to go abroad on
vacation to beat the summer heat. This has the potential of softening Ramadan
sales. We have attempted to factor this into our model by shaving a few basis
points of growth off the number we would be normally expecting in coming years
for this quarter.
Exhibit 19: Seasonality of revenue and income by quarter
In SAR million, unless otherwise stated
684737 732 750 797
702
24 13 14 20 14 100
160
320
480
640
800
Q1 08 Q1 09 Q2 08 Q2 09 Q3 08 Q3 09 Q4 08 Q4 09
Sales Net income
Source: FAO, NCBC Research
6) Vertical expansion a possibility We believe Al-Othaim management is interested in vertical expansion through
development of a manufacturing facility. This would enable it to package its own
goods and move up the value chain in the production and processing of meat
products, fruit and vegetables, dairy and bakery. Currently, Al Othaim has its own
in-house bakery in many of its stores that produces bread and baked items. We
believe margins in the bread business are significantly higher (e.g. 23% with
Almarai’s Western Bakery vs. 18% margin in other foods), highlighting the financial
benefit of having in-house bakeries. Al-Othaim management has indicated that

9 November 2009 ABDULLAH AL-OTHAIM MARKETS COMPANY - INITIATING COVERAGE 20
KEY THEMES
increasing demand from its consumers for fresh items was also a major reason for
such in-house bakeries.
We have limited information on the company’s vertical expansion strategy and
hence we have not included this into our existing model. However, we believe that
if the strategy is executed correctly, it would help the company shore up margins.

9 November 2009 ABDULLAH AL-OTHAIM MARKETS COMPANY - INITIATING COVERAGE 21
Business focus
Business evolution Starting from a modest store in Riyadh, Al-Othaim has grown into a major retailer
that caters to local needs through a variety of store formats —convenience stores
to giant hypermarkets. Over the years, Al-Othaim has kept pace with the rapid
donning of the western lifestyle by the local population. For instance, in the past
few years, Al-Othaim has opened more supermarkets and hypermarkets than any
other store format. This has led to robust 21% revenue CAGR during 2003-2008 as
the company progressed on to emerge as the second-largest player in the highly
fragmented Saudi retail landscape.
Supermarkets and Hypermarkets — the future growth engine Going forward, we believe that supermarkets and hypermarkets will be Al-Othaim’s
focus. Based on our discussions with the management, we believe that most new
stores will be supermarkets. Consequently, we expect revenue from supermarkets
as a percentage of total sales to increase in the coming years. Hypermarkets will
likely follow a similar pattern, with Corner and Wholesale stores declining as a
proportion of the business as a result. By 2013e, we expect supermarkets to
constitute 59% of sales vs. 55% in 2008. The share of Hypermarkets will likely
jump to 17% by 2013e compared with 13% in 2008. We expect Wholesale and
Corner Stores to constitute 18% and 3% of sales respectively in 2013e vs. 23%
and 4% in 2008.
Segmental analysis Al-Othaim operates in one segment: grocery retail. Through this segment, the
company primarily sells food products and, in part, non-food items in KSA. Al-
Othaim’s presence across all retail formats enables it to cater to the needs of
different classes of people. The following is a format-wise breakout of Al-Othaim’s
Exhibit 20: Business Evolution - Sales by retail formats In SAR million, unless otherwise stated
-
500
1,000
1,500
2,000
2,500
3,000
3,500
2007 2008 2009E 2010E 2011E 2012E 2013E
Supermarket Hypermarket Wholesale Corner
Source: Company, NCBC Research estimates

9 November 2009 ABDULLAH AL-OTHAIM MARKETS COMPANY - INITIATING COVERAGE 22
BUSINESS FOCUS
businesses and our forecasts up to 2013e followed by a discussion of each
category.
Exhibit 21: Al-Othaim - Segmental summary
Revenues (SR mn)
% of total revenue No of stores
Selling space (Sq. Mtr)
Avg rev per Sq. Mtr (SR ’000)
Segments 2008 2013E 2008 2013E
Rev (CAGR) (%)
2008-13E 2008 2013E 2008 2013E 2008 2013E
Supermarket 1,571 3,052 55.0 59.0 14.0 52 86 83,200 137,600 18.88 22.18
Hypermarket 371 852 13.0 17.0 18.0 4 8 20,000 40,000 18.56 21.29
Wholesale 657 917 23.0 18.0 7.0 7 9 11,200 14,400 58.64 63.70
Corner 114 136 4.0 3.0 4.0 17 19 5,100 5,700 22.40 23.87
Source: Company, NCBC Research estimates
Supermarket (55% of 2008 revenues)
SUPERMARKET IS THE DOMINANT FORMAT
The Supermarket is the most pronounced food retail format globally and is now
beginning to gain traction in Saudi Arabia. According to Business Monitor
International (BMI), sales from the supermarket category are expected to grow
27.3% in the next five years. Al-Othaim’s growth story coincides with these
developments, with supermarkets contributing a significant portion of the
company’s turnover (55% in 2008).
RANKS SECOND IN MARKET SHARE IN THE SUPERMARKET CATEGORY
At the end of 2008, there were 535 supermarkets in the KSA, up from 358 in 2002.
Al-Othaim’s portfolio consisted of 52 supermarkets (or 65% of total store units) and
contributed 55% to Al-Othaim’s top line in 2008. Al-Othaim is the second-largest
player in this category with 60 supermarket stores in 3Q09, behind Panda
(including Giant and Geant store acquired in 2008/3Q09) with around 80. The key
to growth has been new store openings and robust infrastructure support to enable
timely sales.
With roughly 1,600 square meters per store of selling space, Al-Othaim’s total
selling space in this category stands at 83,200 sq mtr in 2008. We expect this
number to increase to 137,600 square meters by 2013e, driven by 34 new store
openings.
SUPERMARKET EXPANSION THE KEY TO GROWTH
Based on our discussions with the management and our analysis, we believe that of
the 42 new stores planned in the next few years, supermarkets will account for 34.
We expect sales from supermarket to grow at 14% CAGR over the next five years,
contributing 59% of total turnover by 2013e.

9 November 2009 ABDULLAH AL-OTHAIM MARKETS COMPANY - INITIATING COVERAGE 23
BUSINESS FOCUS
Exhibit 22: Supermarket store count/sales from 2003A-2013E
New stores units, unless otherwise stated
0
18
36
54
72
90
2003A 2004A 2005A 2006A 2007A 2008A 2009E 2010E 2011E 2012E 2013E
0
28,000
56,000
84,000
112,000
140,000
Store count Selling space (Sq mt - RHS)
Source: Company, NCBC Research estimates
Hypermarkets (13% of 2008 revenues)
A RELATIVELY NEW FORMAT IN SAUDI ARABIA …
Hypermarkets are a combination of a supermarket and a department store, with
very high SKUs consisting of both groceries and general merchandise. Due to this,
the format tends to have higher average revenue per square meter, a parameter
that measures the efficiency of a store. This concept is relatively new in Saudi
Arabia with just 45 such stores at end of 2008. Of this, HyperPanda (owned by Al-
Aziza Panda – part of Savola Group) owns 15 stores. Giant (acquired by Savola) is
estimated to own seven such stores, while Al-Othaim has four stores in this
category.
… BUT A POPULAR DESTINATION FOR CONSUMERS
The hypermarket is becoming an increasingly popular destination for consumers.
Due to the limited availability of social activities, shopping has become a source of
leisure activity as well as a necessity in the Kingdom. Due to their sheer size and
array of products on offer, hypermarkets are an ideal venue for residents to spend
leisure time. With 250k new families forming every year in Saudi Arabia and given
the general population dynamics (around 50% under the age of 30), the supply of
new consumers will remain high.
GROWTH PROSPECTS HIGHER THAN OTHER FORMATS
According to BMI, the hypermarket format is expected to grow at the fastest rate in
the coming years with a 44.2% rise from 2009-2013 and will contribute
approximately 60% of total modern retail sales. Spotting the opportunity, Al-
Othaim quickly moved on to establish hypermarkets and today has four stores
contributing 13% of 2008 total sales, up from 7.8% in 2007 after the addition of
two stores in 2007.
Going forward, we expect the company to slowly expand this category and open
only four more stores by 2013e. This is because Al-Othaim’s product portfolio
(mainly staples) and target consumer (low-mid income) are not ideally suited to the
hypermarket format given they traditionally hold up to 40% non-food items.

9 November 2009 ABDULLAH AL-OTHAIM MARKETS COMPANY - INITIATING COVERAGE 24
BUSINESS FOCUS
Nevertheless, as selling space in this format is higher, we expect sales from this
category to increase at an 18% CAGR by 2013e and contribute 17% of total top line
by this time.
Exhibit 23: Hypermarket store count/sales from 2003A-2013E
New store units, unless otherwise stated
0
2
4
6
8
10
2003A 2004A 2005A 2006A 2007A 2008A 2009E 2010E 2011E 2012E 2013E
0
10,000
20,000
30,000
40,000
50,000
Store count Selling space (Sq mt - RHS)
Source: Company, NCBC Research estimates
Wholesale (23% of 2008 revenue)
LIMITED FURTHER EXPANSION
Through wholesale stores, Al-Othaim targets other retailers, wholesalers, industries
and commercial institutions that purchase items on a large scale. This leads to
SKU’s of these wholesale stores being typically low and usually these stores stock
fast moving consumer goods. Al-Othaim had seven such stores at the end of 2008,
which contributed 23% to the top line during 2008. Going forward, we expect Al-
Othaim to open only 2 new wholesale stores in the outer years of our forecast
period. Sales in this category are expected to grow at a 7% CAGR between 2008-
2013e and constitute 17.7% of the top line in 2013e.
Exhibit 24: Wholesale store count/sales from 2003A-2013E New stores units, unless otherwise stated
0
2
4
6
8
10
2003A 2004A 2005A 2006A 2007A 2008A 2009E 2010E 2011E 2012E 2013E
0
3,000
6,000
9,000
12,000
15,000
Store count Selling space (Sq mt - RHS)
Source: Company, NCBC Research estimates

9 November 2009 ABDULLAH AL-OTHAIM MARKETS COMPANY - INITIATING COVERAGE 25
BUSINESS FOCUS
Corner (9% of 2008 revenues)
ENTICING CONCEPT, BUT LONG-TERM PROSPECTS POOR
As the name suggests, Corner stores are located at the corner of a building or a
neighborhood with convenience being their key attraction. The concept has become
popular in Saudi Arabia given that women are not allowed to drive or move outside
the home unaccompanied. Non-western expats also often purchase groceries from
corner shops due to limited transport facilities and low quantity of purchases.
Although Corner stores will retain their key attraction of convenience, we believe
that as a format, they will struggle in the coming years. This is because consumers
will increasingly want to compare a wide variety of items in one trip while shopping,
an experience that supermarkets and hypermarkets provide.
Corner stores contributed 4% of sales in 2008 and we expect this number to
decline to 3% in 2013e. Going forward, we anticipate just two new stores over our
forecast period and hence expect a subdued 4% CAGR top line growth during 2008-
2013e.
Exhibit 25: Convenience store count/sales from 2003A-2013E
New store units, unless otherwise stated
0
5
10
15
20
25
2003A 2004A 2005A 2006A 2007A 2008A 2009E 2010E 2011E 2012E 2013E
0
1,600
3,200
4,800
6,400
8,000
Store count Selling space (Sq mt - RHS)
Source: Company, NCBC Research estimates

9 November 2009 ABDULLAH AL-OTHAIM MARKETS COMPANY - INITIATING COVERAGE 26
Industry and business
Macro-drivers impacting Al-Othaim
Reliance of the Saudi economy to oil price Despite government attempts to diversify the economy away from oil, the economy
remains largely based on the petrochemicals sector. With prices peaking at $147
per barrel in 2008, the inflow of money helped per capita income of Saudis to
increase to SR79,570, from SR39,750 in 2002. However the sharp decline to US$30
in Dec 08, and recent moves to around $70 highlight the volatility of oil prices.
This, coupled with the over-reliance on oil, could lead to depressed consumer
sentiment if the oil price was to suffer another setback in price.
Fundamentals of the Saudi economy remain relatively stronger than most global economies The Kingdom has low debt levels (13.5% of GDP in 2008 vs. more than 100% in
1999) and ample reserves, which added to the fiscal surplus over the past few
years (estimated at SR1,665bn in 2008). This leads us to believe that KSA will fare
relatively better than most countries in weathering the global economic slowdown.
NCB Capital’s growth forecast for Saudi Arabia calls for a 0.8% decline in 2009e
followed by 3.8% growth in 2010e, outperforming world GDP growth estimates of -
1.1% and 3.1% for those years.
Favorable demographics to spur demand More than half of the population in the Middle Eastern countries is below 25 years.
The median age in Western Europe is 40.5 years, whereas that in North America is
36.3 years.
Exhibit 26: GCC population dynamics - median age in years Age, unless otherwise stated
10
15
20
25
30
35
40
45
1975 2000 2025 2050
Saudi Arabia Qatar Bahrain UAE Oman Kuwait
Source: Company, NCBC Research estimates
The population across the GCC countries is expected to grow at 2–3% CAGR in the
next 30 years, according to estimates by the United Nations Population Division. A
significant section of the Saudi population is young, which augurs well for the retail
industry as the young generation is more likely to espouse shopping directly at
Mass Grocery Retail outlets. Relative to the rest of the world, per-capita

9 November 2009 ABDULLAH AL-OTHAIM MARKETS COMPANY - INITIATING COVERAGE 27
INDUSTRY AND BUSINESS DYNAMICS
consumption of food products across GCC countries is low, indicating the high
market potential for this sector.
Decline in inflation gives a sign of relief, yet long-term COGS set to be higher Inflation in Saudi Arabia has fallen significantly from the peak of 11.1% in July 2008
to 4.4% in September 2009. Although the benefits of this have started coming
through (as seen by the 100bps YoY increase in net margins in 3Q09), long term, we
believe global food prices will remain higher than the average over the past decade
(this is discussed in detail under the heading “Agflation” on page 14). This has the
potential to lead to margin pressure for food retailers such as Al-Othaim.
Retailing in Saudi Arabia: A snapshot
Growing popularity of Western style shopping to accelerate growth Western-style mass grocery retail (MGR) was first introduced in 1970 in Saudi
Arabia. Rising income levels in Saudi Arabia and in the region due to soaring oil
prices has changed consumption patterns over the years, with people increasingly
preferring international brands. This trend has led to the growing acceptance of
shopping at modern retail formats, especially hypermarkets and supermarkets. For
instance, the Dubai Mall in the UAE, the largest in the world, is a case in point.
Other examples include Saudi Arabia’s USD266mn Al Shobily Grand Mall, Bahrain’s
USD663mn City Centre and Kuwait’s USD52mn Dar Al Awadi Centre.
According to RetailME magazine, in 2009, retail spending in shopping malls alone is
estimated to cross USD7.6bn in Dubai, USD1.9bn in Abu Dhabi and USD6bn in
Saudi Arabia. According to BMI, hypermarket sales in Saudi Arabia are expected to
grow by 44.2% to reach USD2.93bn in 2013. In addition, supermarket sales are
expected to reach USD1.71bn during the same period, up by about 27.3%.
Exhibit 27: MGR sales by format – Saudi Arabia In USD billions, unless otherwise stated
0
0.7
1.4
2.1
2.8
3.5
2005 2006 2007 2008 2009E 2010E 2011E 2012E 2013E
Supermarkets Hypermarkets
Source: BMI, NCBC Research estimates

9 November 2009 ABDULLAH AL-OTHAIM MARKETS COMPANY - INITIATING COVERAGE 28
INDUSTRY AND BUSINESS DYNAMICS
Pace of retail reforms to set tone for the future: The retail landscape in the Kingdom has changed dramatically over the past decade
with the entry of large players after the Saudi Government opened up the region’s
burgeoning sector to foreigners in May 2007. The move attracted investments from
international players such as Carrefour, Geant Casino, etc. to increase their presence in
the region. Although several multinational firms operate in the country through local
franchises, further liberalization of retail trade could provide them with the opportunity
to establish an independent presence in this large market. This may result in greater
participation of many international retail firms in the Saudi retail market.
Two sub-markets present in food retail – organized and independent corner stores We roughly divide the grocery retail sector into two sub-markets; organized, where
there are around a dozen players and unorganized, where there are hundreds of
independent retailers combining to form the majority of the overall market. From the
organized players, the top five retailers (Panda, Al Othaim, Giant Stores, Bin Dawood
and Tamimi) in the domestic grocery retail market accounted for only 13.9% of the
total market in 2007, up from 12% in 2006. Around 40% of the food retail market is
estimated to be taken by independent corner stores (known locally as Bagalas).
Exhibit 28: Saudi Arabia grocery sales % by value
Retail format 2007A 2008E 2009E 2010E 2011E 2012E 2013E
Supermarkets 19 20 20 20 20 21 21
Hypermarkets 28 30 31 32 33 35 36
Co-ops 1 1 1 1 1 1 1
Discount stores 2 2 2 2 2 2 2
Convenience stores 5 5 5 5 5 5 5
Bagalas (Independent/non-organized) 45 43 42 40 39 37 35
Total 100 100 100 100 100 100 100
Source: BMI, NCBC Research estimates
Giving rise to consolidation-first from unorganized to organized… We believe the coming years will see consolidation in the food retail sector. The first
form will be of the organized sub-market taking market share away from the
independent corner stores. This is primarily based on the increased choice and price
advantages of the larger formats.
…then amongst the organized retailers The second round of consolidation will be amongst the organized retailers
themselves, in our opinion. In Saudi Arabia there are around a dozen food retail
chains with more than ten stores. We believe there will be increased consolidation
amongst these retailers as they look to take advantage of economies of scale – this
may be in the form of the smaller retailers merging to make a credible threat to the
leading retailers, or one of the leading retailers acquiring a smaller company to
increase its market share. We have seen this implemented recently by Savola and
its Panda line of supermarkets in its acquisition of the Giant chain in October 2008
(20 supermarkets for SR185mn) and Geant chain in 2009 (11 supermarkets for
SR440mn).

9 November 2009 ABDULLAH AL-OTHAIM MARKETS COMPANY - INITIATING COVERAGE 29
INDUSTRY AND BUSINESS DYNAMICS
Competitive landscape - Al Othaim vs. the Rest We believe Al Othaim is significantly different from its key rivals in a number of key
areas:
• Low-middle income families the target: Al Othaim’s target market is the
low-middle income families that have lower than median salaries and thus have
been largely ignored by other organized food retailing companies. Although
average GDP per capita may have doubled to around SR80k since 2002, we
believe the median income is around 25% lower. With distribution of national
wealth relatively low, this has resulted in many not seeing their incomes rise
significantly over the past decade and for whom the pricing of goods is far
more important than other considerations. Our discussions with management
lead us to believe that the company’s strategy will be to focus on aggressive
pricing to attract and retain this target consumer.
• Rural areas a focus: Unlike some of its rivals, Al Othaim has opened stores in
rural areas of Saudi Arabia. Based on our discussions with the management, we
believe this trend will continue. This is because competition here is lower than
in mature urban markets and consumers here fit into Al Othaim’s target
segment. Al Othaim has been strategically targeting this niche market while its
larger rivals have concentrated on the urban cities. Currently, Al-Othaim has no
stores in the western region of Saudi Arabia and management has indicated
that it has no plans to expand in this region overcrowded with existing players.
• Food items remain a priority: From our analysis, Al Othaim has a higher
percentage of items in the food category than some of its rivals and private
labels are set to play a larger role. We have already discussed these trends on
page 18.
• Complementary formats present: Al-Othaim is present in all the four retail
formats: convenience stores, supermarkets, hypermarkets and wholesale, a
feature absent in competitors. The risk with such a strategy is that management
may be overstretching itself given the diverse business drivers and competitive
dynamics of each segment. However, we argue that certain aspects of the Saudi
market mean a strategy with a range of formats could be advantageous. For
example, the diverse nature of the Saudi consumer mean a presence in all retail
formats is necessary in order to capture the largest revenue flows.
The current fragmented organized food retail market As we have stated previously, the organized food retail market is very fragmented
in the KSA with the top five players having less than 15% market share. Below we
highlight the key retailers in Saudi Arabia and the number of Super/Hypermarkets
as published in a report by the Global Agriculture Information Network in October
2008. Although the data below is slightly out of date and Panda and Othaim have
opened several new stores at the end of 2008 and YTD, we believe the relative
rankings are the same.

9 November 2009 ABDULLAH AL-OTHAIM MARKETS COMPANY - INITIATING COVERAGE 30
INDUSTRY AND BUSINESS DYNAMICS
Exhibit 29: Super/Hypermarket retailers in Saudi Arabia – As of 2008
Retailer Outlets Location Purchasing Type
Panda 76 National Local buyer/Importer
Al-Othaim 64 Mainly central region Local buyer/Importer
Farm Supermarkets 26 Dammam, Jeddah, Al-Khobar, Dharan, Qatif, Jubail, Rastanura
Local buyer/Importer
Al Raya 15 Jeddah, Mecca, Medina, Taif Local buyer
Bin Dawoud 14 Jeddah, Mecca, Medina Local buyer
Giant* 12 Riyadh, Dammam, Jeddah, Khamis, Jubail
Local buyer/Importer
Tamimi Markets 11 Riyadh, Dammam, Al-Khobar Local buyer/Importer
Carrefour 9 Roiyadh, Jeddah, Al Khobar, Madinah Local buyer/Importer
Geant* 9 Riyadh, Jeddah, Dhahran, Kharj, Madinah and Qassim
Local buyer/Importer
Al Sadhan 8 Riyadh Local buyer
Omar Ali BalSharaf 7 Riyadh Local buyer
Danube 7 Jeddah, Riyadh Local buyer/Importer
Source: Global Agricultural Information Network, * Acquired by Panda NB: Above data is only for Supermarkets and Hypermarkets i.e. excludes other retail formats
Strong infrastructure and distribution network Al-Othaim is the second largest food retailer in Saudi Arabia with a total number of
stores currently standing at around 80. It has a solid infrastructure which supports
its day to day logistics and which will help it in running its business efficiently in the
long-term. We believe such a strong logistical base will be a strategic advantage for
the company in the future as it targets new ventures and new markets. Al-Othaim
owns five main warehouses and a large number of transport and related assets that
aid it in transacting business across its various branches on a daily basis.
Exhibit 30: Infrastructure
Warehouse Space (Sqm2) Location
Central warehouse 19,000 Riyadh
Hail warehouse 8,180 Riyadh
Tabuk warehouse 2,277 Tabuk
Buraida warehouse 3,405 Buraida
Hafr Al-batin warehouses 934 Hafr Al-batin
Khamees Mushait warehouse 4,000 Khamees Mushait
Old vegetable warehouse 2,915 Riyadh
New vegetable& meats warehouse 12,795 Riyadh
Source: NCBC Research, Company
Exhibit 31: Transport assets
Transport & distribution fleet Number
Transport containers 8
Trailer head 34
Cold containers 56
Transport trucks 21
Cold transport trucks 36
Light transport trucks 16
Buses 24
Private cars 75
Source: NCBC Research, Company

9 November 2009 ABDULLAH AL-OTHAIM MARKETS COMPANY - INITIATING COVERAGE 31
Financial analysis
Revenues
Expansion of supermarket to lead revenue growth Al-Othaim’s top line grew at a 21.2% CAGR during 2003-2008, driven by new store
openings, primarily supermarkets and hypermarkets. Al-Othaim opened 29 new
supermarkets with an average selling space of 1,600 square meters during the
period. The company also expanded its hypermarket count to 4 by end of 2008
from two in 2003, with an average 5,000 square meters of selling space per store.
Exhibit 32: Al-Othaim—sales 2003A-2013E
In SAR millions, unless otherwise stated
0
1,000
2,000
3,000
4,000
5,000
6,000
2003A 2004A 2005A 2006A 2007A 2008A 2009E 2010E 2011E 2012E 2013E
Source: Company, NCBC Research estimates
Going forward, we expect the top line to grow at a 12.4% CAGR during 2008-
2013e. The bulk of the growth is expected to come from Supermarkets and
Hypermarkets with the opening of 34 and 4 new stores, respectively by 2013e. We
expect the Wholesale category will continue to post modest growth, while Corner
Stores is expected to remain relatively stable.
Growth largely from store expansions vs. increased sales per square meter Based on our analysis of Al Othaim, we believe the bulk of the growth for the
company will come from the increase in number of stores vs. the growth in sales
per square meter. As stated previously, we expect the number of total stores to
increase from 80 in 2008, to 122 by 2013e – an increase of 53%. The actual
amount of selling space will increase by 65% to 197,700 square meters in 2013e
from 119,500 square meters in 2008 due to the impact of the larger wholesale and
hypermarket formats. In the same time period we expect average sales per square
meter to increase by 9% from SR23,400 to SR26,000 by 2013e.

9 November 2009 ABDULLAH AL-OTHAIM MARKETS COMPANY - INITIATING COVERAGE 32
F INANCIAL ANALYSIS AND FORECASTS
Exhibit 33: Al-Othaim—sales 2008A-2013E
In SAR millions, unless otherwise stated
2008A 2009E 2010E 2011E 2012E 2013E
Total number of outlets 80 90 98 106 114 122
Total selling space (Sq. Mt.) 119,500 135,500 150,400 165,300 181,500 197,700
Total sales (SRmn) 2,915 3,212 3,591 4,038 4,628 5,230
Avg rev per sq. mt. (SR 000) 23.90 23.20 23.38 23.93 25.02 25.99
Source: Company, NCBC Research estimates
Cost breakdown Al-Othaim generates a low single-digit operating margin, broadly in line with local
as well as global peers. Approximately 92% of Al-Othaim’s COGS comprises
purchase cost of goods sold. Nevertheless, the company has been successful in
controlling its Selling and Distribution (S&D) and General & Administrative (G&A)
expenses, keeping its total operating costs at 96.8-98.1% since 2004. We expect
this trend to continue through 2013e.
Purchase cost of goods COGS are the largest overall cost for the firm, accounting for 93.7% of sales in
2008. Of this, approximately 92% constitutes purchase cost of goods with the
remaining comprising employee costs (4%) and other overheads (4%). Despite
higher global commodity prices, Al-Othaim’s purchase costs as a percentage of
sales have risen by just 0.5% during 2003-2008. On absolute terms, it has grown
at 20.9% CAGR during the same period, broadly in line with top line growth (CAGR
of 21.2%). We believe this success at controlling costs is due in large part to Al-
Othaim’s strong negotiating position over its suppliers. Bulk purchases of all types
provide an edge over smaller competitors and help the company in securing special
discounts from suppliers. Management highlighted increased purchasing power as
one of the key reasons for the 100bps YoY increase in net margins in its 3Q09
earnings release.
Global commodity prices do not have a direct bearing on Al-Othaim, however
changes in prices have a strong secondary impact on the company given that food
processing firms often quickly pass on any changes (especially increases) to
purchasing companies through higher selling prices. Key commodities that impact
Al-Othaim include edible oil, sugar, wheat, rice, cheese and butter, as well as
packaging costs.
Although commodity prices have eased from their 2008 peaks, we concur with FAO
forecasts of higher prices in the coming years than the average prices seen in the
last decade. This represents a risk for companies such as Al-Othaim. However, in
the medium term, we expect COGS to move in line with top line growth, given
some stabilization in food prices and Al-Othaim’s ability to negotiate better terms
with suppliers.
Employee and other overhead costs Employee costs form a major portion of S&D and G&A expenses at approximately
50% of the total in 2008. Such expenses, as a percentage of sales, stood at 2.1%

9 November 2009 ABDULLAH AL-OTHAIM MARKETS COMPANY - INITIATING COVERAGE 33
F INANCIAL ANALYSIS AND FORECASTS
in 2008, down 40 bps from 2.5% in 2004. This reflects increased labor efficiencies.
We expect this number to decline even further to 1.5% by 2013e.
Al-Othaim’s other overheads include basic marketing and sales expenses, which as
a percentage of sales, have also fallen to 2.2% from 2.7% in 2004 and are
expected to decline to 1.6% by 2013e.
Margins Al-Othaim’s higher COGS in the past few years have been more than offset by
lower S&D and G&A expenses, resulting in EBIT expansion to 2.1% in 2008, up
20bps from 1.9% in 2003. Additionally, Al-Othaim’s net margin has remained at
2.1-3.5% over the past few years.
The higher than average food prices that we expect over the coming decade will put
pressure on Al-Othaim’s margins. However, this is likely to be partially offset by the
company’s ability to retain better deals on bulk purchases. As such, we expect
higher COGS to nearly outpace the reduction in other operating expenses (selling
and general); as a result, we expect net margins to remain flattish at 2.1% in
2013e versus 2.1% in 2008 and an expected 2.4% in 2009e.
Exhibit 34: EBITDA and net margins
In %, unless otherwise stated
0%
1%
2%
3%
4%
5%
2003A 2004A 2005A 2006A 2007A 2008A 2009E 2010E 2011E 2012E 2013E
EBITDA margin Net margin
Source: Company, NCBC Research estimates
Taxation Companies in the KSA are subject to the payment of Zakat, a type of wealth tax
levied on Saudi and GCC nationals, wholly Saudi or GCC-owner entities and Saudi
and GCC shareholders in limited liability companies. Al-Othaim has provided for
Zakat of 2.7-3.2% over the last five years. We assume a marginal rate of 2.7%
over the forecast period.
Per share data EPS policy: Al-Othaim’s earnings per share have grown at 17.8% over the past
five years (2003-2008). In line with our expectation of net income growth, we

9 November 2009 ABDULLAH AL-OTHAIM MARKETS COMPANY - INITIATING COVERAGE 34
F INANCIAL ANALYSIS AND FORECASTS
estimate EPS to grow at 12.6% CAGR during 2008-2013e, with an expected EPS of
SR5.00 in 2013e.
Dividend Policy: Our discussions with management lead us to believe that Al-
Othaim will be paying a dividend equal to 15% of its capital over the longer term.
This effectively translates to SR1.5 per share dividend (as paid in 2008), which we
have assumed throughout our forecasted period. On average, this is equivalent to
around a 36.3% payout ratio.
Fixed asset investment Of Al-Othaim’s overall stores, the company owns just two, the remaining being on a
lease basis. In general, for a new store startup, it costs around SR3-4mn to start a
new store (assuming it is leased). Furthermore, it costs around SR200k to refit an
existing store, which is done once every eight years. Other capital expenses are
spent on supporting infrastructure to carry out day to day activities.
As a percentage of total assets, Al-Othaim’s fixed asset rose to 42% in 2006 from
34% in 2003. However, it fell back to 34% in 2008 as the company opened less
stores in 2007 and 2008. However, projects under construction valued at SR246mn
were recorded on the company’s balance sheet in 2008 (SR54.6mn in 2007). This
mainly included book value of a mall under construction, contractor’s payment
applications, a packaging factory and new branches. Including these, fixed asset
grew to 57% in 2008 from 39% in 2003 and is expected to fall to 43% by 2013e.
We expect Capex as a % of sales to be around 1.5% in the coming years, based on
expenditure largely for its new stores. This is down from 10% in 2008 due to the
one off expenditure on its mall in Dammam.
Exhibit 35: Dividend per share and payout ratio
In SAR, unless otherwise stated
0.00
0.32
0.64
0.96
1.28
1.60
2003A 2005A 2007A 2009E 2011E 2013E
0%
10%
20%
30%
40%
50%
60%
Dividend per share Pay-out ratio (RHS)
Source: Company, Reuters, NCBC Research estimates

9 November 2009 ABDULLAH AL-OTHAIM MARKETS COMPANY - INITIATING COVERAGE 35
F INANCIAL ANALYSIS AND FORECASTS
Exhibit 36: Capex as % of sales
In SAR millions, unless otherwise stated
0
60
120
180
240
300
2003A 2004A 2005A 2006A 2007A 2008A 2009E 2010E 2011E 2012E 2013E0%
2%
5%
7%
10%
12%
Capex As % of sales
Source: Company, Reuters, NCBC Research estimates
Working capital management Al-Othaim’s position as the second largest food retailer in Saudi Arabia allows it to
negotiate with its suppliers, enabling it to manage its working capital requirements
effectively and generate robust operating cash flows. For instance, the company’s
average payables outstanding rose to 53 days in 2008 from 43 days in 2003. Its
receivable outstanding, on the other hand, remained largely flat at 10 days.
However, the company’s inventory days ticked up marginally to 29 days in 2008
from 25 days in 2003.
The perishable nature of most Al-Othaim’s products may lead to wastages.
However, the company’s policies reflect that perishable commodities such as
vegetable, milk, juices, etc. are refurbished on a daily basis or minimum thrice a
week. Additionally, we believe Al-Othaim’s large distribution network, opening of
more outlets, increasing concentration on fast moving goods and rising direct
supply to outlets will aid in a lower storage ratio in future. However, we have not
incorporated these benefits into our model given the limited information available
and have chosen instead to remain conservative on this front.
Going forward, we expect see the change in working capital increase from SR16mn
to SR49mn in 2013e. We forecast payables to increase from the 53 days seen in
2008 to around 60 by 2013e. For receivables, we see this decreasing marginally
from the 10 days recorded in 2008 to nine in 2013e. Inventory days are expected
to remain broadly flat at 29 days.

9 November 2009 ABDULLAH AL-OTHAIM MARKETS COMPANY - INITIATING COVERAGE 36
F INANCIAL ANALYSIS AND FORECASTS
Exhibit 37: Inventory turnover ratio, 2002A – 2013E
Days
0
2
4
6
8
10
12
14
16
2003A 2004A 2005A 2006A 2007A 2008A 2009E 2010E 2011E 2012E 2013E
Source: Company, NCBC Research estimates
Cash flow Historically, Al-Othaim has kept very little cash on its balance sheet – cash and
cash equivalent stood at SR26.9mn as of 31 December 2008 from SR7.2mn as on
31 December 2003. This was mainly characterized by lower profits (in absolute
terms) and higher investments during the period. Going forward, we expect the
company’s cash position to improve as investments start bearing fruits in the form
of profits with no major investments expected in the coming years. According to
management, the company intends to pay 15% of capital in the form of dividends
from 2008 which can easily be funded by operational cash flows. We expect cash
and cash equivalent to increase to SR344.5mn in 2013e.
Free Cash Flow (FCF) was negative in 2006–2008, mainly due to the large capex
needs and lower profits. The company spent SR115.5mn, SR96.5mn and
SR282.9mn in 2006, 2007 and 2008, respectively, on expansion initiatives, with the
2008 figure largely for the mall in Dammam it is building. Given this mall
development is a one off (inherited from its holding company from before its IPO),
we expect much lower capex in the coming years vs. the past three years. The vast
majority of forthcoming expenditure will be on opening of new stores. Hence, we
expect positive but subdued FCF numbers in 2009. Thereafter, as investments in
these years start bearing fruit, we anticipate returns to increase. We expect FCF to
grow at a double-digit rate from 2010e onwards to reach SR129.8mn by 2013e.

9 November 2009 ABDULLAH AL-OTHAIM MARKETS COMPANY - INITIATING COVERAGE 37
F INANCIAL ANALYSIS AND FORECASTS
Exhibit 38: FCF Forecasts
In SAR millions, unless otherwise stated
(200)
(150)
(100)
(50)
0
50
100
150
200
2007A 2008A 2009E 2010E 2011E 2012E 2013E
Source: Company, NCBC Research estimates
Leverage Until 2004, Al-Othaim was debt-free. For the first time in 2005, the company
borrowed SR2.8mn in a long-term loan. In the last few years as Al Othaim started
to expand at a faster pace, the company resorted to external borrowing and debt
rose to SR109.8mn in 2007. A year later, the number nearly trebled to SR284.9mn
as the company funded the construction of its mall in Dammam. Consequently, the
company’s debt to equity ratio increased to 95.3% in 2008 from just 1.4% in 2005.
With positive cash flows expected in the coming years and a reduction in large
project capex needs, we expect this number to decline to 31.2% by 2013e.
Al-Othaim’s short-term loans consist of bank facilities used largely to finance
working capital needs. As of 2008, SR97mn of such facilities were unused. Going
forward, we expect the company to continue using the revolving facility to meet its
short-term funding needs. The company’s long-term obligations are taken from
local bank (Arab National Bank) and a small portion from SIDF.
Exhibit 39: Leverage indicators In SAR millions, unless otherwise stated
2007A 2008A 2009E 2010E 2011E 2012E 2013E
Gross debt 110 285 337 337 324 278 238
Net debt 92 258 293 159 79 (19) (121)
Capex (97) (283) (148) (63) (66) (69) (73)
Debt/Equity (%) 46.0 95.0 99.0 86.0 72.0 54.0 40.0
Net debt/Ebitda (x) 1.0 2.7 2.7 1.3 0.6 (0.1) (0.8)
Interest/Ebitda (%) 3.0 3.0 0.0 3.0 2.0 2.0 1.0
Source: NCBC Research estimates
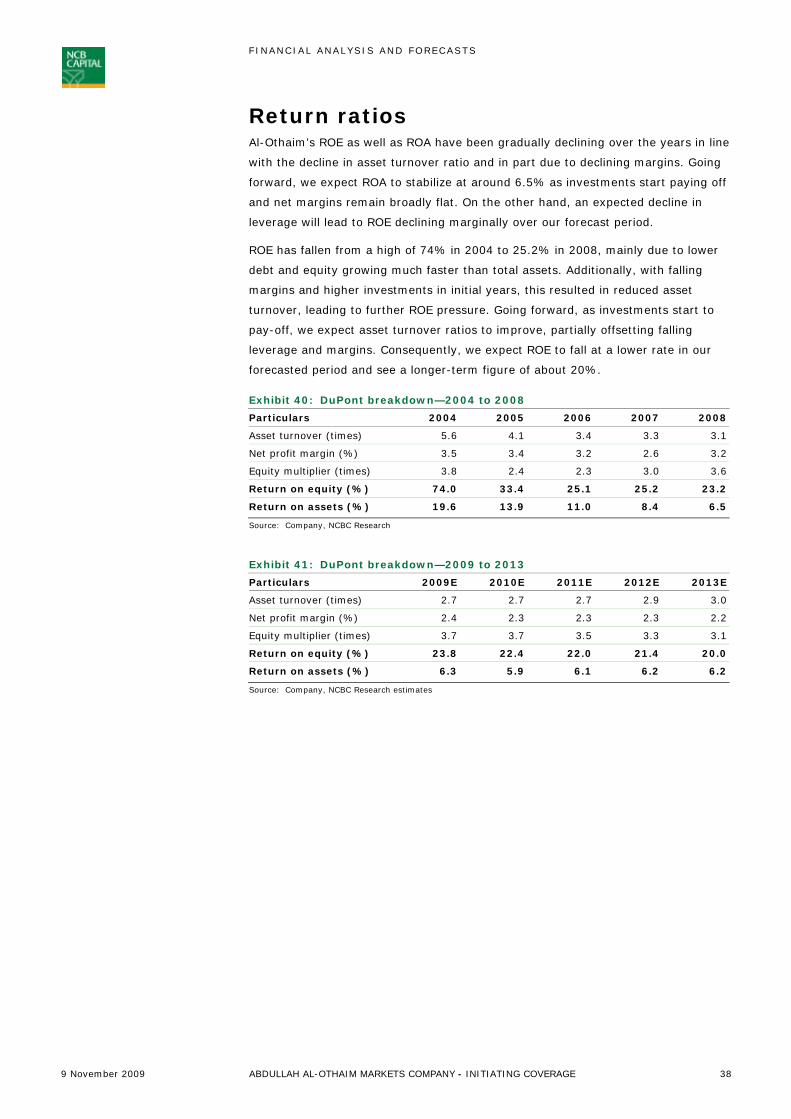
9 November 2009 ABDULLAH AL-OTHAIM MARKETS COMPANY - INITIATING COVERAGE 38
F INANCIAL ANALYSIS AND FORECASTS
Return ratios Al-Othaim’s ROE as well as ROA have been gradually declining over the years in line
with the decline in asset turnover ratio and in part due to declining margins. Going
forward, we expect ROA to stabilize at around 6.5% as investments start paying off
and net margins remain broadly flat. On the other hand, an expected decline in
leverage will lead to ROE declining marginally over our forecast period.
ROE has fallen from a high of 74% in 2004 to 25.2% in 2008, mainly due to lower
debt and equity growing much faster than total assets. Additionally, with falling
margins and higher investments in initial years, this resulted in reduced asset
turnover, leading to further ROE pressure. Going forward, as investments start to
pay-off, we expect asset turnover ratios to improve, partially offsetting falling
leverage and margins. Consequently, we expect ROE to fall at a lower rate in our
forecasted period and see a longer-term figure of about 20%.
Exhibit 40: DuPont breakdown—2004 to 2008
Particulars 2004 2005 2006 2007 2008
Asset turnover (times) 5.6 4.1 3.4 3.3 3.1
Net profit margin (%) 3.5 3.4 3.2 2.6 3.2
Equity multiplier (times) 3.8 2.4 2.3 3.0 3.6
Return on equity (%) 74.0 33.4 25.1 25.2 23.2
Return on assets (%) 19.6 13.9 11.0 8.4 6.5
Source: Company, NCBC Research
Exhibit 41: DuPont breakdown—2009 to 2013
Particulars 2009E 2010E 2011E 2012E 2013E
Asset turnover (times) 2.7 2.7 2.7 2.9 3.0
Net profit margin (%) 2.4 2.3 2.3 2.3 2.2
Equity multiplier (times) 3.7 3.7 3.5 3.3 3.1
Return on equity (%) 23.8 22.4 22.0 21.4 20.0
Return on assets (%) 6.3 5.9 6.1 6.2 6.2
Source: Company, NCBC Research estimates

9 November 2009 ABDULLAH AL-OTHAIM MARKETS COMPANY - INITIATING COVERAGE 39
Financials
Exhibit 42: Income statement
In SAR millions, unless otherwise stated
2008 2009E 2010E 2011E 2012E 2013E
Net sales 2,915 3,212 3,591 4,038 4,628 5,230
% change 25.6 10.2 11.8 12.4 14.6 13.0
Operating expenses 2,855 3,144 3,512 3,947 4,526 5,120
Operating profit 60 69 80 91 102 111
EBITDA 97 109 122 132 143 152
% change 8.4 12.5 11.0 8.8 8.4 5.9
Dep. & Amortization 37 41 42 41 41 41
EBIT 60 69 80 91 102 111
Interest Income, net 3 0 3 3 3 2
Pre-tax profit 64 78 84 95 106 114
Tax (Zakat) 2 2 2 3 3 3
Net income 62 76 82 92 103 111
% change 4.2 22.6 7.2 12.9 11.8 7.9
Exhibit 43: Balance sheet In SAR millions, unless otherwise stated
2008 2009E 2010E 2011E 2012E 2013E
Current assets 379 514 617 727 839 963
Investments 90 96 96 96 96 96
Net fixed assets 366 370 367 366 366 367
Other assets 246 349 374 400 428 458
Total assets 1,081 1,329 1,453 1,588 1,728 1,884
Current liabilities 757 725 834 945 1,066 1,184
Total debt 285 337 337 324 278 238
Other liabilities 16 20 22 24 27 29
Total liabilities 782 988 1,063 1,139 1,210 1,289
Share capital 225 225 225 225 225 225
Reserves & surplus 18 26 34 43 53 65
Shareholders' equity 56 91 131 180 239 306
Total equity & liab 1,081 1,329 1,453 1,588 1,728 1,884
Exhibit 44: Cash flow statement In SAR millions, unless otherwise stated
2008 2009E 2010E 2011E 2012E 2013E
Cash flow from op. (a) 115 153 231 179 201 209
Cash flow from inv.(b) (281) (154) (63) (66) (69) (73)
NOPLAT 40 40 41 41 41 42
WC 16 32 105 43 54 54
Capex (283) (148) (63) (66) (69) (73)
Depreciation 37 41 42 41 41 41
Free cash flow (167) 1 166 111 130 134
Cash flow from fin.(c) 175 18 (33) (46) (80) (74)
Debt 175 52 0 (13) (46) (41)
Net chg. in cash (a+b+c) 9 17 134 67 52 62
Cash at start of the year 18 27 44 178 245 297
Cash at end of the year 27 44 178 245 297 359
Source: Company, NCBC Research estimates

9 November 2009 ABDULLAH AL-OTHAIM MARKETS COMPANY - INITIATING COVERAGE 40
F INANCIALS
Exhibit 45: Key ratios
In SAR millions, unless otherwise stated
(SR mn) 2008 2009E 2010E 2011E 2012E 2013E
Per share ratios (SR)
EPS 2.8 3.4 3.6 4.1 4.6 5.0
FCF per share (7.4) 4.6 8.5 6.1 7.0 7.3
Div per share 1.5 1.5 1.5 1.5 1.5 1.5
Book value per share 13.3 15.2 17.3 19.9 23.0 26.5
Valuation ratios (x)
P/E 18.6 15.2 14.2 12.6 11.2 10.4
P/FCF (6.9) 11.2 6.1 8.4 7.4 7.1
P/BV 3.9 3.4 3.0 2.6 2.2 1.9
EV/sales 0.4 0.5 0.4 0.3 0.2 0.2
EV/EBITDA 11.9 13.3 10.8 9.4 8.0 6.8
Div yield (%) 3.8 2.9 2.9 2.9 2.9 2.9
Profitability ratios (%)
Gross margins 6.3 5.8 5.7 5.6 5.4 5.2
Operating margin 2.1 2.1 2.2 2.3 2.2 2.1
EBITDA margins 3.3 3.4 3.4 3.3 3.1 2.9
Net profit margins 2.1 2.4 2.3 2.3 2.2 2.1
ROE 23.2 23.8 22.4 22.0 21.4 20.0
ROA 6.5 6.3 5.9 6.1 6.2 6.2
Liquidity ratios
Current ratio 0.5 0.7 0.7 0.8 0.8 0.8
Quick Ratio 0.2 0.3 0.4 0.4 0.4 0.5
Operating ratios (days)
Inventory (excl. spare parts) 29 32 32 31 31 30
Receivables outstanding 10 11 10 10 10 10
Payables outstanding 53 63 63 63 63 63
Operating cycle 39 43 42 41 40 40
Cash cycle (15) (20) (21) (22) (23) (23)
Source: Company, NCBC Research estimates

9 November 2009 ABDULLAH AL-OTHAIM MARKETS COMPANY - INITIATING COVERAGE
Kindly send all mailing list requests to [email protected]
Brokerage sales Roger Yeoman +966 2 690 7851 [email protected]
+966 565 076 302 (mobile)
Brokerage website www.alahlitadawul.com / www.alahlibrokerage.com
Corporate website www.ncbc.com
NCBC INVESTMENT RATINGS
Overweight: Target price represents expected returns in excess of 15% in the next 12 months Neutral: Target price represents expected returns between -10% and +15% in the next 12 months Underweight: Target price represents a fall in share price exceeding 10% in the next 12 months Price Target: Analysts set share price targets for individual companies based on a 12 month horizon. These share price targets are subject
to a range of company specific and market risks. Target prices are based on a methodology chosen by the analyst as the best predictor of the share price over the 12 month horizon
OTHER DEFINITIONS
NR: Not Rated. The investment rating has been suspended temporarily. Such suspension is in compliance with applicable regulations and/or in circumstances when NCB Capital is acting in an advisory capacity in a merger or strategic transaction involving the company and in certain other situations
CS: Coverage Suspended. NCBC has suspended coverage of this company NC: Not Covered. NCBC does not cover this company IMPORTANT INFORMATION
The authors of this document hereby certi20 that the views expressed in this document accurately reflect their personal views regarding the securities and companies that are the subject of this document. The authors also certify that neither they nor their respective spouses or dependants (if relevant) hold a beneficial interest in the securities that are the subject of this document. Funds managed by NCB Capital and its subsidiaries for third parties may own the securities that are the subject of this document. NCB Capital or its subsidiaries may own securities in one or more of the aforementioned companies, or funds or in funds managed by third parties The authors of this document may own securities in funds open to the public that invest in the securities mentioned in this document as part of a diversified portfolio over which they have no discretion. The Investment Banking division of NCB Capital may be in the process of soliciting or executing fee earning mandates for companies that are either the subject of this document or are mentioned in this document. This document is issued to the person to whom NCB Capital has issued it. This document is intended for general information purposes only and may not be reproduced or redistributed to any other person. This document is not intended as an offer or solicitation with respect to the purchase or sale of any security. This document is not intended to take into account any investment suitability needs of the recipient. In particular, this document is not customized to the specific investment objectives, financial situation, risk appetite or other needs of any person who may receive this document. NCB Capital strongly advises every potential investor to seek professional legal, accounting and financial guidance when determining whether an investment in a security is appropriate to his or her needs. Any investment recommendations contained in this document take into account both risk and expected return. Information and opinions contained in this document have been compiled or arrived at by NCB Capital from sources believed to be reliable, but NCB Capital has not independently verified the contents of this document and such information may be condensed or incomplete. Accordingly, no representation or warranty, express or implied, is made as to and no reliance should be placed on the fairness, accuracy, completeness or correctness of the information and opinions contained in this document. To the maximum extent permitted by applicable law and regulation, NCB Capital shall not be liable for any loss that may arise from the use of this document or its contents or otherwise arising in connection therewith. Any financial projections, fair value estimates and statements regarding future prospects contained in this document may not be realized. All opinions and estimates included in this document constitute NCB Capital’s judgment as of the date of production of this document and are subject to change without notice. Past performance of any investment is not indicative of future results. The value of securities, the income from them, the prices and currencies of securities, can go down as well as up. An investor may get back less than he or she originally invested. Additionally, fees may apply on investments in securities. Changes in currency rates may have an adverse effect on the value, price or income of a security. No part of this document may be reproduced without the written permission of NCB Capital. Neither this document nor any copy hereof may be distributed in any jurisdiction outside the Kingdom of Saudi Arabia where its distribution may be restricted by law. Persons who receive this document should make themselves aware, of and adhere to, any such restrictions. By accepting this document, the recipient agrees to be bound by the foregoing limitations. NCB Capital is authorised by the Capital Market Authority of the Kingdom of Saudi Arabia to carry out dealing, as principal and agent and underwriting, managing, arranging, advising and custody, with respect to securities under licence number 37-06046. NCB Capital’s registered office is at 25th Floor, Al-Faisaliyah Tower, King Fahad Road, P.O. Box 22216, Riyadh 11495, Kingdom of Saudi Arabia.