akzonobel ici ar 2009 final tcm102-33828
DESCRIPTION
annual reportTRANSCRIPT

ICI Pakistan Limited Annual Report 2009


We recognize that everything in this world is linked.We are all interdependent on each other and our environment, and for the circle of life to continue flowing smoothly, these interdependencies need to be nurtured and allowed to flourish.
At ICI Pakistan Limited, everything we do links to the oneness of life, to the world around us, and most importantly, to the lives of our consumers. Our products and services are all geared towards making an impact on your life.
You will feel our presence even when we are not visible, in the ambience of your homes, in the fabric of your clothing, in the many products you use to make life a little easier, a little better. And to us, this is our way of ensuring that we are at one with the continuity of life.


3
Annual Report 2009
Being manufacturers of Polyester Fiber weaves us tightly into the fabric of your life.
Our Polyester Staple Fiber (PSF) is spun into yarn, which is then woven or knitted into fabric used to make clothing, bed sheets and other textile products that each one of us uses. This man-made fiber is a key substitute and complement for cotton, making it a highly critical raw material in a textile-intensive country suchas Pakistan.
We introduced this wonderful product to this country over 20 years ago. As one of the pioneers of the PSF technology in Pakistan, we enabled the cotton-rich textile industry to diversify their products and be more competitive in the international arena where growth of man-made fibers has been phenomenal. Our high quality product has set the trend and the PSF industry in Pakistan now competes internationally with comparable output and production rates.


5
Annual Report 2009
Did you know that every time you pick up a glass, read a newspaper or do your laundry, you experience the use of soda ash?
Without soda ash, the manufacturing of necessary commodities such as glass, paper and detergents would not be possible. Most people are probably not even aware of the importance of this basic raw material, still, we as a company know that we touch practically every life in the country in some way through the use of these essential everyday products.
Our Soda Ash Plant in Khewra was established in the 1940s, even before the creation of Pakistan! We’re market leaders for this key ingredient and are proud to be the largest producers of it in the country. Our remarkable growth over the years has enabled development and enhancement of the industries we furnish thereby providing you with a wider array of quality products to enhance your lifestyle.


7
Annual Report 2009
Everywhere you go, you will find the colors of your life enhanced by our paint products.
We have been coloring Pakistan for 44 years, and through the decades we’ve worked hard to provide you the right backdrop for life by transforming your homes and your workplaces with our paint solutions. But it’s not just about adding colors through the assortment of our palette; our products touch your life in many different ways.
We offer industrial coatings that help protect everything from refrigerators and radios to boiler plants and manufacturing facilities while our refinish paint products maintain and extend the life of your vehicles. Being able to influence so much makes us a direct part of your lives, and this is a responsibility we take very seriously.
Being the largest provider of paint solutions in Pakistan, delivering results is a part of our DNA, and we strive to ensure that our customers have access to a broad range of high quality products. Of course, we now have the added advantage of being part of the largest global paints and coatings company. With AkzoNobel’s expertise, we have lots of exciting opportunities to grow and to enter new fields, enabling us to continue being the leading paints company in Pakistan.


9
Annual Report 2009
Our name says it all; ours is the science of life – your life.
Helping you maintain and improve the quality of life is a role we are proud of and take very seriously. Whether you need advanced pharmaceuticals for your healthcare needs, superior seeds to improve the quality of essential crops or solutions for livestock management, we work hard to ensure you get the best.
We market some of the leading drugs available today, geared to address life threatening ailments like cardiovascular disease and cancer as well as providing veterinary and agricultural brands, so that you have a range of options for improving the quality of your life.
Being entrusted with such a serious responsibility, we are even more committed to innovation and keeping ahead of the curve with products and services that draw on the newest research and latest advances. We want to make sure our customers trust in us remains solid and that our brands remain synonymous with quality and consumer confidence.


11
Annual Report 2009
Our chemical ingredients translate into hundreds of products that you use in daily life.
We’re not stretching the truth when we say we service practically every industry in the country! Our products are essential in all kinds of manufacturing processes and in products from adhesives to paint, and from insulation for housing and refrigeration to textile auxiliaries that determine the finish of fabrics we use.
Where chemicals are involved, we know we have to be extra careful about our impact on people and the world around us. Our strong emphasis on health, safety, and environment means we incorporate the best practices from around the world, providing full safety information to customers, a safe workplace for employees, and care for the environment through many of our projects focusing on sustainability.


Tomorrow's Answers Today
Often people achieve only incremental progress, because their view of tomorrow is determined by what they see today.
We believe the future belongs to those smart enough to challenge it. We believe that real progress belongs to those who not only think with courage, but also have the courage to deliver on the thought. Tomorrow’s answers, delivered today.
What drives us is knowing that what is good for our customers today is not necessarily good enough for them tomorrow. What excites us is asking the unasked question. What inspires us is seeing the opportunity others cannot. What unites us is the intelligence to deliver where others have not.
This benefits our customers because we sustain their future competitiveness and meet the consumers’ unspoken needs.
This ambition defines us. This is the way we work. This is why we come to work.
To be the partner of first choice for customers and suppliers, ensuring sustained leadership positions in the markets where we compete, delivering long-term business value through a high performance culture, innovation, ethics and responsible care.
To achieve our mission we will:
● Give highest priority to health, safety, environment and ethical matters
● Ensure our products deliver maximum value to customers by maintaining dependable supply, consistent quality, and reliability
● Uphold excellent service levels to foster long-term relationships with customers and suppliers
● Achieve the highest possible operating efficiencies and lowest costs, and expand the business through selective capacity increase and new product launches
● Develop and retain a team of highly capable people dedicated to delivering the mission

Year in review17 Highlights and value addition18 Awards & achievements19 HSE 20 HR highlights22 CSR highlights25 Delivering value to customers
Annual Report 2009
Directors’ Report37 Overview 2009 key highlights38 Financial performance Dividends Projects HSE39 Polyester 40 Soda Ash41 Paints42 Life Sciences43 Chemicals44 Taxation Finance Future outlook45 Acknowledgment Auditors Board changes46 Compliance with the code of corporate governance Investment in retirement benefits Directors’ attendance47 Pattern of shareholding Group financial statements48 Statement of Compliance with the Code of Corporate Governance for the year ended December 31, 200950 Review report to the members on statement of compliance with best practices of code of corporate governance
About ICI Pakistan27 Company information28 Board members’ profiles30 Board & management committees with brief terms of reference31 Our code of conduct33 About AkzoNobel34 Our values

ICI Pakistan FinancialStatements
55 Auditors’ report to the members56 Balance sheet58 Profit and loss account60 Cash flow statement62 Statement of changes in equity63 Notes to the financial statements96 Comparison of results for 10 years98 Vertical and horizontal analysis for six years99 Pattern of shareholding
ICI PakistanConsolidatedFinancial Statements
104 Report of the directors of ICI Pakistan Group105 Auditors’ report to the members106 Consolidated balance sheet108 Consolidated profit and loss account110 Consolidated cash flow statement112 Consolidated statement of changes in equity113 Consolidated notes to the financial statements
Notice of AGM
Admission slip
Form of proxy
Annual Report 2009
Business offices andwarehouses
Regional presence
Plants andmanufacturing sites
Faisalabad Lahore
Rawalpindi
Islamabad
Peshawar
Multan
Rahim Yar KhanQuetta
Sukkur
HEAD OFFICEKarachi Hyderabad
Polyester PlantShiekhupura
Paints PlantLahore
Soda Ash PlantKhewra
Chemicals PlantKarachi
ICI Pakistanlocations

17
Annual Report 2009
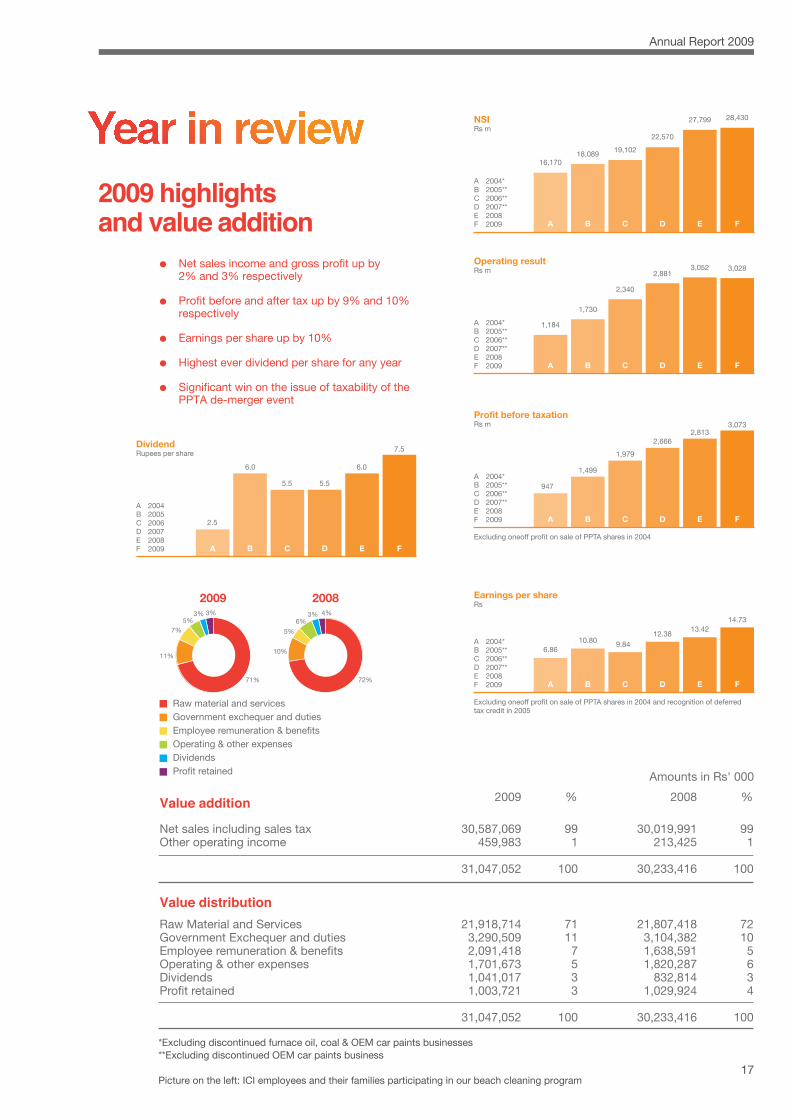
*Excluding discontinued furnace oil, coal & OEM car paints businesses**Excluding discontinued OEM car paints business
Picture on the left: ICI employees and their families participating in our beach cleaning program
Value addition
Net sales including sales taxOther operating income
Value distribution
Raw Material and ServicesGovernment Exchequer and dutiesEmployee remuneration & bene�tsOperating & other expensesDividendsPro�t retained
Amounts in Rs' 000
30,019,991213,425
30,233,416
991
100
2008 %
30,587,069459,983
31,047,052
991
100
2009 %
21,807,4183,104,3821,638,5911,820,287
832,8141,029,924
30,233,416
72105634
100
21,918,7143,290,5092,091,4181,701,6731,041,0171,003,721
31,047,052
71117533
100
● Net sales income and gross profit up by 2% and 3% respectively
● Profit before and after tax up by 9% and 10% respectively
● Earnings per share up by 10%
● Highest ever dividend per share for any year
● Significant win on the issue of taxability of the PPTA de-merger event
Raw material and servicesGovernment exchequer and dutiesEmployee remuneration & bene�tsOperating & other expensesDividendsPro�t retained
2009
71%
11%
7%5%
3% 3%
2008
72%
10%
5%
6%3% 4%
Excluding oneoff profit on sale of PPTA shares in 2004
Profit before taxationRs m
A 2004*B 2005**C 2006**D 2007**E 2008F 2009
947
1,499
1,979
2,6662,813
3,073
A B C D E F
DividendRupees per share
A 2004B 2005C 2006D 2007E 2008F 2009
2.5
6.0
5.5 5.5
6.0
7.5
A B C D E F
Operating resultRs m
A 2004*B 2005**C 2006**D 2007**E 2008F 2009
1,184
1,730
2,340
2,8813,052 3,028
*Includes Rs 1,154 m in respect of furnace oil & coal business
A B C D E F
Earnings per shareRs
A 2004*B 2005**C 2006**D 2007**E 2008F 2009
6.8610.80 9.84
12.3813.42
14.73
Excluding oneoff profit on sale of PPTA shares in 2004 and recognition of deferred tax credit in 2005
A B C D E F
NSIRs m
A 2004*B 2005**C 2006**D 2007**E 2008F 2009
16,17018,089 19,102
22,570
27,799 28,430
A B C D E F
18
Annual Report 2009
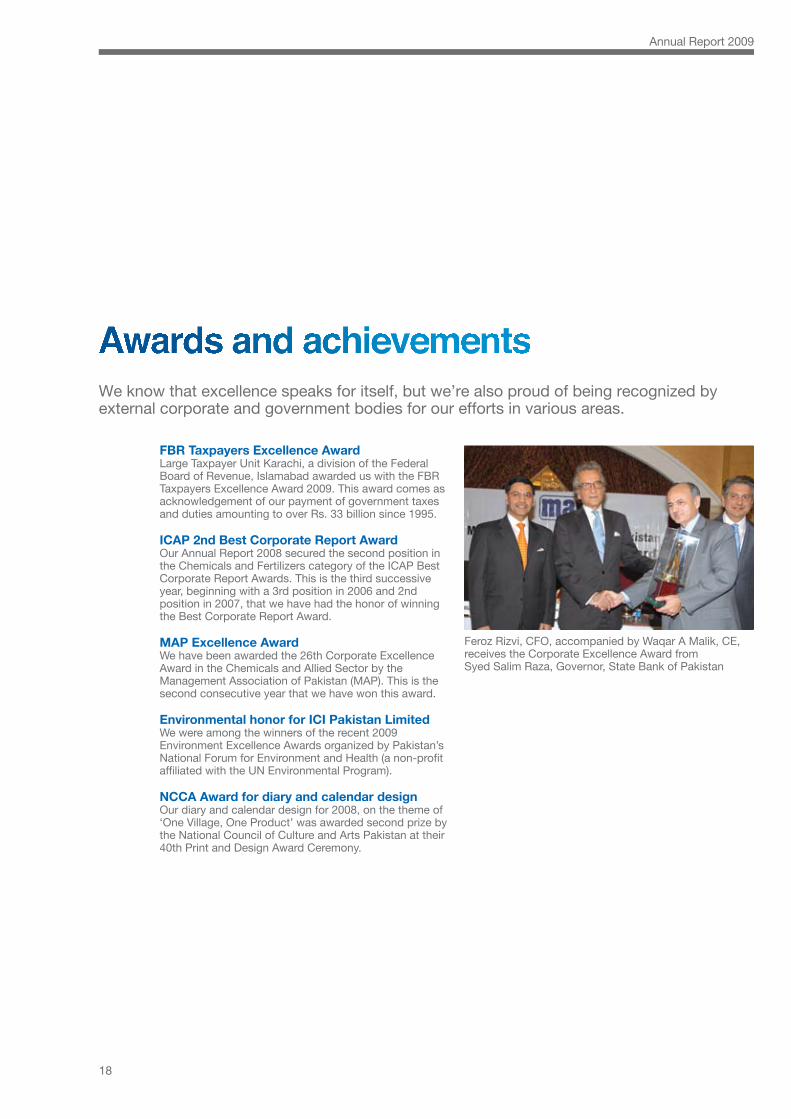
FBR Taxpayers Excellence AwardLarge Taxpayer Unit Karachi, a division of the Federal Board of Revenue, Islamabad awarded us with the FBR Taxpayers Excellence Award 2009. This award comes as acknowledgement of our payment of government taxes and duties amounting to over Rs. 33 billion since 1995.
ICAP 2nd Best Corporate Report AwardOur Annual Report 2008 secured the second position in the Chemicals and Fertilizers category of the ICAP Best Corporate Report Awards. This is the third successive year, beginning with a 3rd position in 2006 and 2nd position in 2007, that we have had the honor of winning the Best Corporate Report Award.
MAP Excellence AwardWe have been awarded the 26th Corporate Excellence Award in the Chemicals and Allied Sector by the Management Association of Pakistan (MAP). This is the second consecutive year that we have won this award.
Environmental honor for ICI Pakistan LimitedWe were among the winners of the recent 2009 Environment Excellence Awards organized by Pakistan’s National Forum for Environment and Health (a non-profit affiliated with the UN Environmental Program).
NCCA Award for diary and calendar designOur diary and calendar design for 2008, on the theme of ‘One Village, One Product’ was awarded second prize by the National Council of Culture and Arts Pakistan at their 40th Print and Design Award Ceremony.
We know that excellence speaks for itself, but we’re also proud of being recognized by external corporate and government bodies for our efforts in various areas.
Feroz Rizvi, CFO, accompanied by Waqar A Malik, CE,receives the Corporate Excellence Award fromSyed Salim Raza, Governor, State Bank of Pakistan

19
Our beliefOur goal is to increase stakeholder's value by delivering sustainable solutions to our customers as this is critical to the success of our company. To achieve this we work on sustainable business operation concept to meet our needs today while protecting resources and rights for future generations. We strive to continuously improve our HSE performance through leadership commitment, dedication of our staff and application of professional standards in our work.
Our principleThe implementation of our HSE&S policies across all operations, sites and businesses is through the AkzoNobel Health, Safety & Environment Management systems which are fully integrated with the company’s scheme of organization. Key elements are the policy, directives, standards, guidelines, local management systems and training, measurements, self assessment and audit, performance and policy review. This new system augments but does not replace HSE legislations already applicable to our activities.
Our performance Health• Completion of the whole year without a reportable Occupational Illness
SafetyOur Businesses achieved the following man-hours without LTI (Lost Time Injury) to employees and supervised contractors:
• Soda Ash 21.13 million man-hours
• Polyester 17.8 million man-hours
• Paints 9.9 million man-hours
• Specialty Chemicals 4.9 million man-hours
• Life Sciences 6.6 million man-hours
Environment• Reduction in CO2 emission by 2% in 2009
• Based on our HSE Performance, National Forum for Health and Safety declared ICI Pakistan the winner of the 2009 Environment Excellence Award
A strong culture of health and safety is essential for a company that wants to be successful, and we’re no different. We know that the health and safety of our people is of paramount importance, as is the safety of our processes and the sanctity of the environment. We’ve worked consistently over the years to put in place a strong, progressive HSE system which continues to evolve.

At ICI Pakistan, you will find a unique workplace with a diverse mix of personalities and expertise. Our people have talent, creative drive and enthusiasm. And that’s reflected in an atmosphere where they’re encouraged to achieve full potential in their area of business.
Our ambition, ‘Tomorrow’s Answers Today’ is reflected in our people. They’re entrepreneurial in their thinking and pragmatic in solving problems. Everything they do is done with integrity and responsibility. Most of all, they have the courage and curiosity to question accepted wisdom and provide answers others haven’t even thought of.
Our Talent FactoryOver 1,300 people are a part of our Talent Factory,and we’re proud that these employees are the ones who shape the future of our company.
We want our employees, and those thinking of joining us, to see us as a place where they can grow. Our Talent Factory aims to develop strong leaders, who can makea real impact on our performance and market value,and be noticed.
In line with our company value ‘Developing the talentsof our people’, we provide development opportunities through cross-functional exposure. Capability groups within the company have been formed to ascertain bench strength in each functional area and plan future career roadmaps for our key talent. This ensures a strong line of succession within the organization, in areasof commercial, technical, finance and HR.
For many years, the ICI Graduate Recruit Program has been our primary source of hiring and attracting new talent. In fact, several of our senior executives today joined ICI through this channel. In 2009, we added seven Graduate Recruits from different leading universities of Pakistan. While our talent pipeline is steadily augmented
by a stream of young recruits, we also have employees who have been part of our family for over twenty years.
For the Talent Factory to really take shape, we concentrate on these three building blocks:
Diversity & InclusionWe have a very strong commitment to diversity and inclusion. We are an equal opportunity employer and this is practiced in all aspects of our business activities, including recruitment and employment. Combined with state of the art technology and HR Information systems, the result is a high performance environment within which individuals can achieve their professional and personal aspirations. We take pride in our demographically diverse workforce that works togetherto create synergies and produce results.20
HighPerformance
Culture
TalentDevelopment Leadership
2009 Highlights
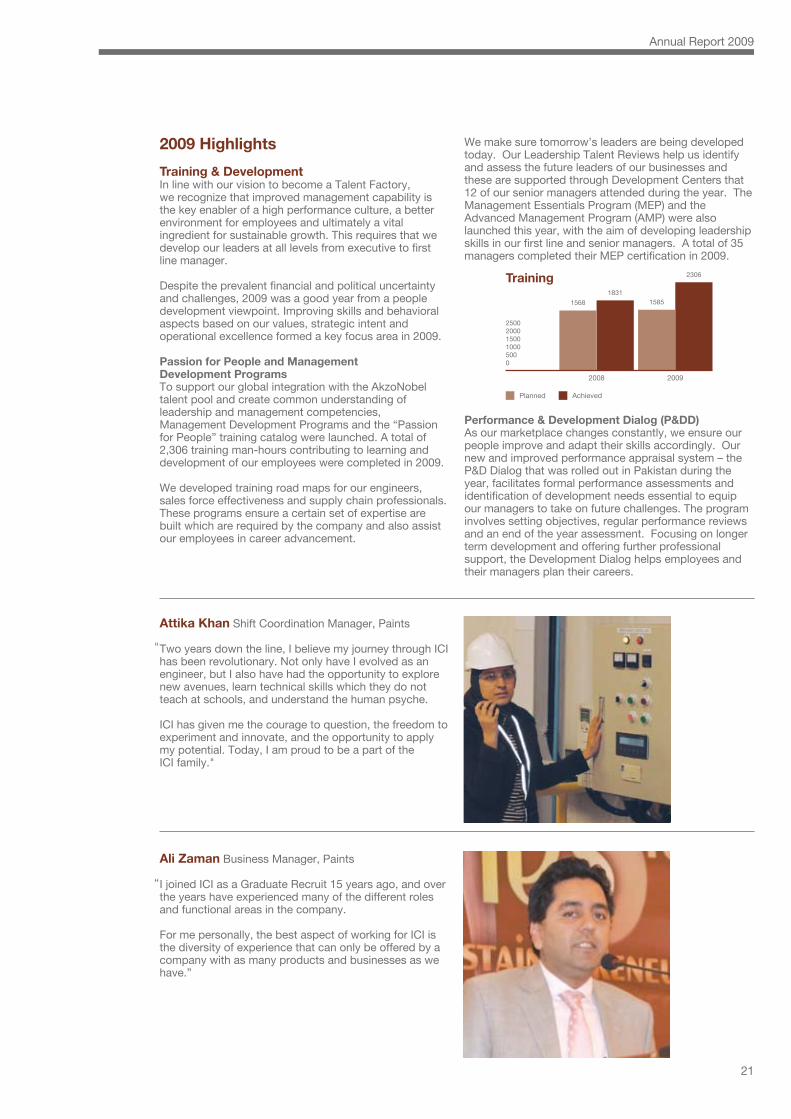
Training & DevelopmentIn line with our vision to become a Talent Factory,we recognize that improved management capability is the key enabler of a high performance culture, a better environment for employees and ultimately a vital ingredient for sustainable growth. This requires that we develop our leaders at all levels from executive to first line manager.
Despite the prevalent financial and political uncertainty and challenges, 2009 was a good year from a people development viewpoint. Improving skills and behavioral aspects based on our values, strategic intent and operational excellence formed a key focus area in 2009.
Passion for People and ManagementDevelopment ProgramsTo support our global integration with the AkzoNobel talent pool and create common understanding of leadership and management competencies, Management Development Programs and the “Passion for People” training catalog were launched. A total of 2,306 training man-hours contributing to learning and development of our employees were completed in 2009.
We developed training road maps for our engineers, sales force effectiveness and supply chain professionals. These programs ensure a certain set of expertise are built which are required by the company and also assist our employees in career advancement.
We make sure tomorrow’s leaders are being developed today. Our Leadership Talent Reviews help us identify and assess the future leaders of our businesses and these are supported through Development Centers that 12 of our senior managers attended during the year. The Management Essentials Program (MEP) and the Advanced Management Program (AMP) were also launched this year, with the aim of developing leadership skills in our first line and senior managers. A total of 35 managers completed their MEP certification in 2009.
Performance & Development Dialog (P&DD)As our marketplace changes constantly, we ensure our people improve and adapt their skills accordingly. Our new and improved performance appraisal system – the P&D Dialog that was rolled out in Pakistan during the year, facilitates formal performance assessments and identification of development needs essential to equip our managers to take on future challenges. The program involves setting objectives, regular performance reviews and an end of the year assessment. Focusing on longer term development and offering further professional support, the Development Dialog helps employees and their managers plan their careers.
21
Annual Report 2009
Attika Khan Shift Coordination Manager, Paints
Two years down the line, I believe my journey through ICI has been revolutionary. Not only have I evolved as an engineer, but I also have had the opportunity to explore new avenues, learn technical skills which they do not teach at schools, and understand the human psyche.
ICI has given me the courage to question, the freedom to experiment and innovate, and the opportunity to apply my potential. Today, I am proud to be a part of theICI family."
"
Ali Zaman Business Manager, Paints
I joined ICI as a Graduate Recruit 15 years ago, and over the years have experienced many of the different roles and functional areas in the company.
For me personally, the best aspect of working for ICI is the diversity of experience that can only be offered by a company with as many products and businesses as we have.”
“
25002000150010005000
2008 2009
1568
18311585
2306
Planned Achieved
Training

We’re as committed to our communities as we are to our customers, shareholders and employees. Social responsibility is a way of life at ICI Pakistan. We recognize that we cannot have a healthy and growing business unless the communities we serve are healthy and sustainable.
We have a rich history of community investment that’s evolved to meet the complexities and challenges of a developing society. We support a broad range of initiatives in the areas of heath, education and environment protection as we believe they provide the fundamental building blocks for the development of society.
CSR Highlights for 2009
Employee Volunteer Program launch Our approach to community investment is not limited to financial support, but is centered on the vital element of employee engagement. We believe that getting our own people deeply involved in helping communities is the best way to make a lasting and sustainable contribution.
To create a stable platform for employee engagement we launched the ICI Pakistan Volunteer Program in early 2009, and started off our volunteer activities immediately. Our employees enthusiastically contributed their time to a variety of community initiatives and so far 1816 volunteer hours have been clocked in by 86 employees.
Disaster ReliefWhen disasters strike, those affected require immediate assistance to meet basic needs such as shelter, healthcare, food, and clothing. We make it a point to offer immediate support for relief as well as assisting in long-term rehabilitation.
Relief effortsWhen insurgent action in the Northern areas of Pakistan, particularly Swat, resulted in a humanitarian crisis due to the displacement of millions of people, we immediately responded by providing financial support and relief goods. A sum of Rs. 3 million was pledged by the ICI Pakistan Foundation and our employees organized a collection drive, gathering staple food items, medicine and clothing. Our employees located in the Northern areas also actively volunteered at the IDP camps.
22

23
Annual Report 2009
RehabilitationThe 2005 earthquake was one of the worst ever natural disasters to hit Pakistan, causing massive loss of life and destroying entire communities. As part of the rehabilitation effort, we funded and built a primary and middle girls school in Bararkot. Our employees were actively engaged in the process, liaising with government authorities and ERRA, as well as offering technical support and supervision. The school is now run by government authorities with our active involvement; in 2009, we arranged for and funded the induction of several well-qualified teachers to improve quality of education available to local students.
Windmill project at local hospitalThe sole hospital facility in the underdeveloped area of Mauripur located near the ICI Head Office suffered from an electricity shortage due to frequent power outages. The hospital had obtained a windmill to generate its own back-up power, but needed to carry out repairs and installation. With our support, this windmill has been repaired and is now being installed.
Business Investment
Polyester Tibbi Harya Community Development Program In 2004, our Polyester Business adopted the local Government Primary School at Tibbi Harya next to our Polyester Plant. In 2009, we upgraded the school by providing additional teachers and investing in school infrastructure. Along with this, our Polyester team also initiated a project to help build roads and improve water and sanitation facilities for the community in Tibbi Harya.
Tree Plantation Drive In collaboration with Parks & Horticulture Authority (PHA) Lahore, we launched a tree plantation drive along the famous Canal Road in Lahore. 15,000 trees have been planted along the length of this famous landmark of Lahore. Our Polyester team worked along with PHA to make this initiative possible.
Soda AshJinnah ParkPind Dadan Khan is in the vicinity of our Soda Ash plant in Khewra. In 2009, we developed a recreational park for the community spanning over an area of 106,250 feet. This area was a deep sewage pond which has now been converted into a beautiful park.
200th Eye camp at KhewraFounded in 1943, our Winnington Hospital is located on-site at our Khewra plant. Besides serving staff, the hospital serves the community with free out-patient facilities, and has held Free Eye Camps in collaboration with LRBT since 1991. In 2009, our we celebrated a historic milestone by holding our 200th Free Eye Camp at the hospital. So far 11,281 major and minor surgeries have been conducted and 109,313 people from the community have been treated through this hugely successful initiative.
Doctors perform eye surgery using state-of-the-art medical equipment during our 200th Free Eye Campat Khewra
Children in IDP camp receiving school kits
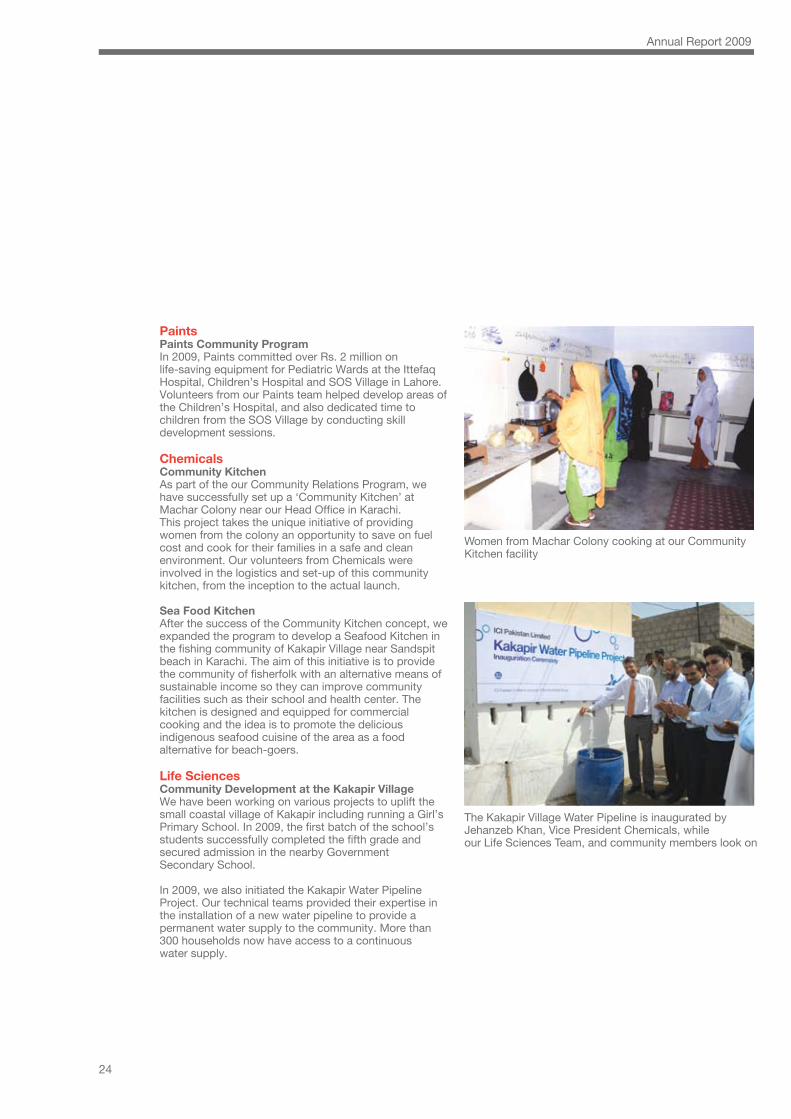
Paints Paints Community ProgramIn 2009, Paints committed over Rs. 2 million on life-saving equipment for Pediatric Wards at the Ittefaq Hospital, Children’s Hospital and SOS Village in Lahore. Volunteers from our Paints team helped develop areas of the Children’s Hospital, and also dedicated time to children from the SOS Village by conducting skill development sessions.
Chemicals Community Kitchen As part of the our Community Relations Program, we have successfully set up a ‘Community Kitchen’ at Machar Colony near our Head Office in Karachi.This project takes the unique initiative of providing women from the colony an opportunity to save on fuel cost and cook for their families in a safe and clean environment. Our volunteers from Chemicals were involved in the logistics and set-up of this community kitchen, from the inception to the actual launch.
Sea Food Kitchen After the success of the Community Kitchen concept, we expanded the program to develop a Seafood Kitchen in the fishing community of Kakapir Village near Sandspit beach in Karachi. The aim of this initiative is to provide the community of fisherfolk with an alternative means of sustainable income so they can improve community facilities such as their school and health center. The kitchen is designed and equipped for commercial cooking and the idea is to promote the delicious indigenous seafood cuisine of the area as a food alternative for beach-goers. Life SciencesCommunity Development at the Kakapir VillageWe have been working on various projects to uplift the small coastal village of Kakapir including running a Girl’s Primary School. In 2009, the first batch of the school’s students successfully completed the fifth grade and secured admission in the nearby GovernmentSecondary School.
In 2009, we also initiated the Kakapir Water Pipeline Project. Our technical teams provided their expertise in the installation of a new water pipeline to provide a permanent water supply to the community. More than 300 households now have access to a continuouswater supply.
24
Annual Report 2009
Women from Machar Colony cooking at our CommunityKitchen facility
The Kakapir Village Water Pipeline is inaugurated byJehanzeb Khan, Vice President Chemicals, whileour Life Sciences Team, and community members look on

Our customers’ needs are the driving force behind all that we do. Each of our businesses is unique in the scope of its operations and has its own practices, but what remains consistent is the drive to produce the greatest possible value. Like increasing production while reducing our CO2 emissions by 2 percent, and ensuring our customers have the benefit of a greener tomorrow.
PaintsAs market leaders in the category, we know that our customers expect nothing short of the best from us, so when recent research told us that our consumers were having trouble buying and selecting paint, we immediately addressed the problem. We developed modernized retail outlets and state-of-the-art color studios that meet international standards and provide a new tinting technology, advanced color selection tools and other services that ensure a better, more accurate paint-selection process for customers.
Comfort and convenience are also top priority, and we addressed this concern by developing our Mobile Color Solution Center. This state-of-the-art Dulux-branded mobile shop provides services similar to a premium retail outlet, and by visiting residential and commercial localities in Lahore, Karachi and Islamabad, is able to provide products and services to our consumers literally at their doorstep.
Dulux also raised the bar on service by introducing a dedicated customer services department to offer quick, easy access to a wide array of technical solutions and inspirational designs. We are the first in the industry to create such a service and with comprehensive feedback received at 0800-DULUX, we now know how to serve our customers better.
Polyester Our goal is to provide customized solutions to our customers to satisfy ever-changing market needs. In line with this goal, at Polyester we’ve developed a cost-effective recycled Polyester Fiber demanded by our customers to compete in a price sensitive segment of the market. This helped to reduce their input cost and saved them from the hassle and added costs of importing similar products from overseas. This initiative not only delighted our customer but was also valuable from the point of view of sustainability, with the recycling aspect making our new fiber cost-effective and reducing the burden on the scarce resources of our planet.
Life Sciences Sustaining global food supplies for a growing world population is an important question on the minds of leaders across the globe. In 2009, our Animal Health Division launched a product called Telilac, a calf milk replacer, (CMR). The use of CMRs is well established in developed countries, and the introduction of the product into Pakistan by us brings the latest technologies for maximizing returns from available natural resources to local livestock farmers. The value proposition for customers is two-fold; better health and growth of calves, and increase in income through sale of milk saved, which in turn also increases the availabilityof milk.
Chemicals Innovation is key to our success. We don’t just provide top quality products, we offer innovative solutions to facilitate our customers.
In 2009, one of our major customers ran into a difficulty when a particular titanium dioxide product they’d been using in their paint formulations became unavailable in Pakistan. When we realized they were unable to find alternate suppliers, we stepped in. Our team pooled its resources to source an alternate titanium product.We then helped our client reformulate their original paint recipe so that it was actually an improvement over the old one. Our customer not only found a solution to their original problem, but also enjoyed a 5% cost reduction and a subsequent increase in profitability.
Soda Ash At our Soda Ash business its not just about manufacturing and supplying our product; we take things a step further to make sure all our customers get the best value possible. An example of this is the initiative we launched last year to address the particular needs of our smaller customers.
Transport and logistics costs can be a burden, especially for smaller concerns. To remedy this, our commercial team went the extra mile by working with our customers’ transporters to group the requirements of small customers in the same geographic locations across the country, and dispatching product on trailers instead of small trucks, thereby reducing costs. At no extra cost, we ended up with happier customers and a more efficient, thought-out transport plan and of course contributing to reducing the carbon footprint!
25
Annual Report 2009
New Dulux colour studio


Board of directorsM J Jaffer Chairman (Non-Executive) Tariq Iqbal Khan Non-Executive Waqar A Malik Chief Executive James R Rees Non-ExecutiveMueen Afzal * Non-Executive Feroz Rizvi Executive Ali A Aga Executive M Nawaz Tiwana Non-ExecutiveBart Kaster Non-Executive Derek W Welch Non-Executive Audit sub committee Remuneration sub committeeM J Jaffer Chairman (Non-Executive) M Nawaz Tiwana Chairman (Non-Executive)Mueen Afzal Non-Executive James R Rees Non-Executive Bart Kaster Non-Executive Chief Financial Officer Company SecretaryFeroz Rizvi Saira Nishtar**
Executive management teamWaqar A Malik Chief Executive Suhail Aslam Khan Vice President, PolyesterAli A Aga * Vice President, Soda Ash M Asif Malik General Manager, TechnicalDr Amir Jafri Vice President, Paints Feroz Rizvi Chief Financial Officer Jehanzeb Khan Vice President, Chemicals
BankersAskari Bank Limited MCB Bank LimitedBank Al Habib Limited Meezan Bank LimitedBank Alfalah Limited National Bank of PakistanCitibank N.A. Oman International BankDeutsche Bank AG Samba Bank LimitedFaysal Bank Limited Standard Chartered Bank (Pakistan) LimitedHabib Bank Limited The Royal Bank of Scotland LimitedHSBC Bank Middle East Limited United Bank Limited
AuditorsInternal auditors External auditorsErnst & Young Ford Rhodes Sidat Hyder, KPMG Taseer Hadi & Co., Chartered Accountants Chartered Accountants
Registered office Shares registrarICI House, 5 West Wharf, Karachi-74000 FAMCO Associates (Pvt) Ltd.Tel # 111-100-200, (021) 32313717-22 1st Floor, State Life Building 1-A, Fax # 32311739 I.I Chundrigar Road, Karachi-74000Website: www.icipakistan.com Tel : (021) 32427012, 32426597, 32420755, Email: [email protected] : 32475606, 32425467 Fax : (021) 32426752
* names in alphabetical order** replaced Nasir Jamal as of February 1, 2010
27
Annual Report 2009

Feroz RizviDirector & CFO
Appointed to the Board of Directors of ICI Pakistan Limited in October 2006, Feroz is the Chief Financial Officer and has been with ICI Pakistan for over 26 years, during which he has held various senior positions. He is also a Director of ICI Pakistan PowerGen Limited and Faysal Asset Management Limited.
M Nawaz TiwanaDirector (Non-Executive)
Appointed to the Board of Directors of ICI Pakistan Limited in April 1997, Nawaz is also the Chairman of the Board’s Remuneration Committee. He has held various positions such as Managing Director, Pakistan International Airlines Corporation, Managing Director PSL and Chairman, Port Qasim Authority as well as Chairman, State Cement Corporation of Pakistan.
Waqar A MalikChief Executive
Appointed as the Chief Executive of ICI Pakistan Limited on October 1, 2005, Waqar has over 24 years of extensive experience with the Group, in senior commercial, finance and strategy roles including an overseas secondment at ICI Group Headquarters in London.
Waqar is on the Boards of Engro Polymer and Chemicals Limited, IGI Insurance Limited and Pakistan Business Council. He is a Director on the Central Board of Directors of State Bank of Pakistan and a trustee of the Duke of Edinburgh’s Award Foundation. He is also a member of the Board of Governors of National Management Foundation – LUMS and the Indus Valley School of Art and Architecture.
28
Annual Report 2009
M J JafferChairman (Non-Executive)
Appointed to the Board of Directors of ICI Pakistan Limited in October 1973, Mahomed Jaffer is the longest serving member of the Board and is also the Chairman of the Board’s Audit Committee. He retired as a senior partner of M/s Orr Dignam & Co., a leading corporate law firm of Pakistan. Specializing in arbitration law, Mahomed Jaffer has represented Pakistan as an alternate member in the International Court of Arbitration of the International Chamber of Commerce Paris since 1997. He is the President of the Governing Body of the Aga Khan Hospital and Medical College Foundation, and a Director of Pakistan Centre for Philanthropy, Tourism Promotion Services (Pakistan) Limited, and Lakson Investment Limited. He is visiting faculty for Pakistan Institute of Corporate Governance and lectures extensively on corporate governance, conciliation, arbitration and related subjects.

Ali A AgaDirector & Vice PresidentSoda Ash Business
Appointed to the Board of Directors of ICI Pakistan Limited in January 2009, Ali is Vice President Soda Ash Business and has been with ICI Pakistan for the last 21 years. He has diverse experience in commercial, human resources and general management roles. Ali is also a Director on the Board of ICI Pakistan PowerGen Limited.
Tariq Iqbal KhanDirector (Non-Executive)
Appointed to the Board of Directors of ICI Pakistan Limited in October 2001, Tariq is the Chairman and Managing Director of National Investment Trust Ltd. He has served as Chairman and MD of ICP and is a Founder Director of the Islamabad Stock Exchange. He has also served as a member, Tax Policy and Co-ordination in the Federal Board of Revenue, and was later appointed Commissioner with the Securities and Exchange Commission of Pakistan.
James R ReesDirector (Non-Executive)
Elected to the Board of Directors of ICI Pakistan Limited in April 2008, James is an experienced executive and is currently General Manager of AkzoNobel’s Car Refinishes Business Unit, a global business headquartered in the Netherlands. He joined AkzoNobel in 2003 and was previously General Manager of the Americas Sub Business Unit Car Refinishes at AkzoNobel.
James is also a Director of AkzoNobel Comex S.A. de C.V. and Anco Servicios Profesionales S. A. de C.V.
29
Annual Report 2009
Mueen AfzalDirector (Non-Executive)
Appointed to the Board of Directors in May 2003, he joined the Civil Service of Pakistan in 1964 and held important positions, including Finance Secretary for the Government of Pakistan, Health Secretary, and Secretary General, Finance and Economic Affairs from 1999 to 2002. He was awarded Hilal-e-Imitaz for distinguished public service in 2002.
Mueen is also the Chairman of Pakistan Tobacco Company Limited and Azgard Nine Limited. He is currently a Director of Murree Brewery Co. Limited and the Pakistan Poverty Alleviation Fund, and is on the Board of Governors of Aitchison College, Lahore.
Derek Walter WelchDirector (Non-Executive)
Elected to the Board of Directors of ICI Pakistan Limited in June 2009, Derek has been associated with the AkzoNobel Group since 1998 during which time he has held senior positions. He is currently Director Business Development at AkzoNobel NV and Vice President of AkzoNobel Chang Cheng Coatings (Guangdong) Co. Ltd. He also holds directorships in a number of companies of the AkzoNobel Group.
Bart Kaster Director (Non-Executive)
Elected to the Board of Directors of ICI Pakistan Limited in April 2008, Bart has been associated with the AkzoNobel Group since 1980, during which time he has held senior positions and various assignments in Europe and Asia.
Bart is also a Director of AkzoNobel UK Limited, AkzoNobel Decorative Coatings Limited and ICI Limited.

30
Annual Report 2009
Committees of the board
Audit committeeThe Audit Committee of the board reviews the system of internal controls, risk management and the audit process besides assisting the Board in reviewing financial statements and announcements to shareholders. The Committee comprises of Non-Executive Directors including the Chairman. The Audit Committee meets at least four times in a year besides privately meeting with external auditors and the head of internal audit.
Remuneration committeeThe Remuneration Committee of the Board is responsible for reviewing the remuneration and benefits of the Chief Executive, Executive Directors and other senior managers. The Committee consists of two Non-Executive Directors. The Committee meets at least once a year.
Banking committeeThe Banking Committee of the Board comprising of two Executive and one Non-Executive Director has been constituted to approve matters relating to opening, closing and day to day operations of bank accounts. The resolutions passed by the Banking Committee are subsequently ratified by the Board.
Share transfer committeeThe Share Transfer Committee of the Board comprises of two Executive and one Non-Executive Director. This Committee approves registrations, transfers and transmission of shares. Resolutions passed by the Shares Transfer Committee are subsequently placed at Board meetings for ratification.
Management committees
Executive management committeeThe CE is the Chairman of the Executive Management Committee. The Committee comprises of the Chief Financial Officer, all Vice Presidents, and one General Manager. This Committee meets once a month under the chairmanship of the Chief Executive and is responsible for strategic business planning, decision making and overall management of the Company.
HSE management committeeThe Health, Safety & Environment Committee, chaired by the CE, periodically reviews and monitors company wide practices. It oversees the health, safety & environment functions of our company and is also responsible for ensuring that all our operations are environment-friendly and compliant with regulatory and Group framework.
Succession planning forumThis forum is chaired by the CE and meets annually to review the company’s succession planning, talent development and talent pipeline at senior management level. This forum is supported by the following Capability Groups:
● Commercial Capability Group● Technical Capability Group● Finance and IT Capability Group● HR Capability Group
Supply chain networkChaired by the Vice President Chemicals Business, the Supply Chain Network comprises of Supply Chain Managers of each of the Company’s businesses. This Network aims to improve procurement and material handling effectiveness by seeking and capitalizing on synergistic opportunities and sharing of best practices.
Sustainability CouncilSustainability Council comprises of a multi-disciplined team representing each segment of ICI Pakistan Limited and is headed by General Manager, Technical. The objective of the Council is to implement a sustainable business strategy for the company and stakeholders.

31
Annual Report 2009
A brief overview of the code:
Business principles● Each employee should implement our core values, comply with and observe applicable laws, support fundamental human rights and give due regard to health, safety and environment Business integrity ● Bribery and any other form of unethical business practices are prohibited
● We promote free enterprise and require strict compliance with competition laws
● As responsible corporate citizens, we encourage participation in community activities and take all measures for the safety and health of our employees as well as for the protection of the environment
● Employees are expected to maintain confidentiality and to act in the Company’s interests at all times
Company responsibilitiesThe Code encourages us to:
● adopt the spirit of open communication
● provide equal opportunities and a healthy, safe and secure environment
● ensure the rights of employees to join unions/associations
● protect personal data of employees
● engage in an active performance and development dialog
Employee responsibilitiesThe Code provides employees guidance on their responsibilities vis a vis:
● Media relations and disclosures● Inside information● Corporate identity ● Protecting our intellectual property● Internet use● Business travel policy ● Prohibition on substance abuse
We have always had a strong sense of business principles and high ethical standards for the conduct of our business. Our business principles and ethical standards are enshrined in the ICI Pakistan Code of Conduct.


33
Annual Report 2009
AkzoNobel is:
● The largest paints and coatings company in the world
● A Fortune 500 company
● One of the Chemicals Industry leaders on the Dow Jones Sustainability Indexes
● A global presence with operations in more than 80 countries the world over, employing a workforce of 57,000 people
ICI Pakistan as part of AkzoNobel GroupICI Pakistan was acquired by AkzoNobel on January 2, 2008. We are proud to be part of a group that is committed to innovation, introducing new ideas and developing sustainable answers for our customers every day. We look forward to a bright and exciting future as one strong company with the drive to deliver Tomorrow’s Answers Today.
AkzoNobel is proud to be one of the world’s leading industrial companies. Based in Amsterdam, the Netherlands, AkzoNobel makes and supplies a wide range of paints, coatings and specialty chemicals

Our values are the beliefs that underpin our business.They define what we are and what we aim to be. They reflect the way we should operate both internally and externally. And they’re summed up in the line ‘Tomorrow’s Answers Today’.
These values give us standards to measure ourselves by, particularly in our dealings with customers, suppliers, our own people and the wider world. The values have real meaning for us and the way we behave.
Here’s what each of them means in practice:
Focusing on our customers’ future firstWe can guarantee our future only by giving our customers products and services that improve their future. So this value comes first. It’s our priority and the reason why we exist. We’ve always met the needs of our customers – that’s why we’ve grown. But now we make it very clear: it’s the basis of everything we do.
Embracing entrepreneurial thinkingNew thinking and new ideas are everything – if we’re to compete. So we need an environment and a mindset that encourages new ideas from individualsand teams.
“Yes”, not “Yes, but...” “Why not?” not “Why?”We might fail occasionally, but we’ll get great ideas to market more quickly as a result. And we’ll keep more people with truly original ideas within the company.
34
Annual Report 2009

Developing the talents ofour peopleOur business will grow if our people grow too. So we’re committed to professional and personal development. We’ll do all we can to develop existing talents, nurture new skills and progress within AkzoNobel. Through this commitment, we’ll attract and retain people of the highest quality to developthe business.
The courage and curiosityto questionAkzoNobel isn’t one of those companies with a set way of doing things. We dislike rigid hierarchies and we want our people to take a broad, interested view of the world. We like them to ask questions. “Is there a better way?” There generally is a better way, if we challenge ourselves and our customers to look at things differently. It’s the way we improve.
Integrity and responsibility in our actionsBusiness needs to work within a framework. Our employees have to be aware of rules and regulations that they must comply with, in whatever part of the world they work. But integrity and responsibility go deeper than that. They’re about doing things in the right way, as individuals and as a company.
Ethical and responsible behavior matters to our business. If we do the right things, people will know we’re a company that can be trusted. They’ll then be more likely to work with us and invest in us – which is good for our long-term growth.
35
Annual Report 2009


37
Annual Report 2009
The Board of Directors are pleased to present their report together with the audited financial statements of the Company for the year ended December 31, 2009.
OverviewDuring the year your Company faced concurrent headwinds notably, recession in the developed world, significant decline in large scale domestic manufacturing exacerbated by energy shortages as well as increase in electricity and gas tariffs.In addition, persistent inflation and high interest rates contracted the aggregate demand particularly in the construction and automobile sectors. Despite this, your Company demonstrated growth in earnings over 2008. Focus on our customers, cash, costs and strength of a diverse portfolio helped to protect our margins and limit the decline in volumes in a contracting economy.
Profit after tax of Rs 2.04 billion for the year was up by 10 percent compared with 2008 (restated). Earnings per share at Rs 14.73 was up by 10 percent over 2008 (restated).
On group basis (including the results of the wholly owned subsidiary ICI Pakistan PowerGen Limited) profit after tax for the year at Rs 2.05 billion was up by 21 percent compared with 2008 (restated). Earnings per share at Rs 14.80 was up by 21 percent over 2008 (restated).
2009 Key highlights ● PSF sales volume up by 10 percent despite domestic PSF market contraction by 3 percent
● Completion of the 65 ktpa Soda Ash plant expansion at a cost of Rs 1.9 billion. Domestic Soda Ash market contracted by 1 percent. Established new export markets for Soda Ash
● Continued investment in channel modernisation in the decorative segment. Double digit decline in domestic decorative coatings market
● Successful launch of AkzoNobel’s flagship vehicle refinish brand ‘Sikkens’, thereby establishing ICI as the clear market leader in this segment
● Double digit sales volume growth in industrial coatings for the motor cycle and the tractor segments
● Double digit volume growth both in our pharmaceutical and animal health segments. Sunflower seed sales affected by farm economics, tilting disproportionately in favour of wheat
● Reduction in carbon footprint by 2 percent
● Significant win on the issue of taxability of the PPTA de-merger event. The Supreme Court of Pakistan has held that section 122(5A) of the Income Tax Ordinance 2001 cannot be applied retrospectively

From left to right
Jehanzeb KhanVice President,Chemicals Business
Dr Amir JafriVice President,Paints Business
Feroz RizviChief Financial Officer
Ali A AgaVice President,Soda Ash Business
Waqar A MalikChief Executive
Suhail Aslam KhanVice President,Polyester Business
M Asif MalikGeneral Manager, Technical
38
Annual Report 2009
Financial performance Summary of financial results for ICI Pakistan Limited for the year ended December 31, 2009 isgiven below:
DividendsYour Directors are pleased to announce a final dividend of 45 percent i.e., Rs 4.50 per share of Rs. 10 each of the issued and paid up capital of Rs. 1,388,023,000. This, including the interim dividend of 35 percent, makes a total dividend of 80 percent for 2009.
ProjectsDuring the current year the 65 ktpa Soda Ash plant expansion project at a revised cost of Rs 1,850 million was successfully completed and commissioned as per plan, without a losttime incident.
Health, Safety and Environment (HSE)All our sites remained fully compliant with liquid and air emission standards. Despite higher production in 2009, our energy consumption and fresh water usage remained lower than 2008. This has resulted in a further reduction of CO2 emissions in 2009 by 2 percentover 2008.
There was no reportable occupational illness to our employees or supervised contractors in 2009. During the year, there was a safety incident resulting in a fatality and a medical treatment injury to contract employees arising out of the fallout from a bomb blast few hundred meters away from one of the Company’s office premises in Lahore, in May 2009. In addition, there was one case of medical treatment injury to an employee and one case of lost-time injury to an independent contractor.
ICI PAKISTAN LIMITED 2009 2008 Increase/ (Restated) (Decrease) Rs Million PercentageTurnover 32,399 31,922 1.5Net Sales Income 28,430 27,799 2.3Gross Profit 5,676 5,496 3.3Operating Result 3,028 3,052 (0.8)Profit Before Tax 3,073 2,813 9.2Profit After Tax 2,045 1,863 9.8Earning Per Share (Rs) 14.73 13.42 9.8

39
Annual Report 2009
Feedstock prices remained firm throughout the year on account of upturn in crude and naphtha values coupled with some tightness in PX and MEG availability. This rise in feedstock prices was also bolstered by relatively better demand in China due to the Chinese Government’s stimulus package. Consequently, polyester prices also gained strength in the regional market.
The Government announced the Textiles Policy for the period 2009 to 2014 which includes continuation of the monetisation of customs duty on PTA giving some relief to the highly capital intensive and margin squeezed PSF industry and the textile sector in general.
The domestic PSF market experienced a 3 percent contraction. The domestic PSF industry was affected by the dumping of product by regional suppliers at uneconomical prices as well as the duty free entry of man made fiber through the misuse of the existing
Afghan Transit Treaty. The business is actively pursuing the National Tariff Commission and various Government ministries for an enhancement of tariff on PSF. Earlier in 2008, PSF tariff was arbitrarily reduced to woefully inadequate level of 4.5 percent, badly shaking the investor’s confidence and it continues to remain an impediment for attracting fresh investment in this industry.
Blend economics favoured PSF and therefore the business managed to enhance its customer base on account of product quality and excellent technical service. Sales volume for the year was higher by 10 percent compared with last year. Higher sales volumes, improved unit margins along with higher raw material and energy efficiencies has resulted in 49 percent increase in the operating result compared with last year.
• Sales volume higher by 10%• Domestic Polyester Staple Fiber (PSF) market experienced 3% contraction• Improved margins and energy efficiency resulting in 49% increase in operating result
*Compared with the same period last year
Operating Result - Rs Million
Sales Volume - Tonnes
Production Volume - Tonnes
248
31,231
30,749
210%
40%
50%
49%
10%
10%
1,089
123,381
123,642
Increase/(Decrease*)
Increase/(Decrease*)
Year EndedDecember 31, 2009Q4 2009
Turnover - Rs Million
A 2004B 2005C 2006D 2007E 2008F 2009
10,2369,145
8,458
10,345
12,19213,242
A B C D E F
Operating Result - Rs Million
A 2004B 2005C 2006D 2007E 2008F 2009
157
329
466
654732
1,089
A B C D E F

40
Annual Report 2009
*Compared with the same period last year
Operating Result - Rs Million
Sales Volume - Tonnes Soda Ash & Sodium Bicarbonate
Production Volume - Tonnes Soda Ash & Sodium Bicarbonate
232
69,351
80,829
(24%)
2%
17%
(14%)
(3%)
1%
1,038
260,411
271,759
Increase/(Decrease*)
Increase/(Decrease*)
Year EndedDecember 31, 2009Q4 2009
With the global economic recession, the global demand for Soda Ash declined by 6 percent during the year as the downstream segments remained adversely affected. The glass segment, consuming nearly half of the global Soda Ash production, was the worst affected segment on account of slowdown in the construction and automobile industry. This situation forced the major players to reduce their operating rates and a tug of war persisted among major international manufacturers for capturing export opportunities even at very low prices and negligible margins.
During the year, the business successfully completed and commissioned the 65 ktpa plant expansion project without any lost time incident.
Poor law and order situation in the country coupled with the energy crisis adversely affected the downstream demand. In addition, demand from local glass industry, in particular, showed a significant decline due to sharp slowdown in the construction activities forcing a number
of manufacturing units to cease their operations. Overall, domestic Soda Ash market contracted by 1 percent compared to previous year. Due to weak demand, the occupacity of the expanded plant was 81 percent.
Focus on maintaining strong relationship with our customers ensured that our customer base remained intact. We also successfully managed to establish our product in the export markets and sold 12,993 tes. Unit gross margin was lower than last year primarily due to double digit increase in gas tariff and curtailment of gas supply resulting in the use of expensive alternate fuels.
Operating result for the year was lower by 14 percent compared with corresponding period last year, primarily due to increase in gas tariff, use of expensive alternate fuel during gas outages and higher depreciation charge resulting from the expanded plant.
• Domestic market contracted by 1%• Margin management marred by gas tariff increase and use of expensive alternate fuel during gas outages• Established our product in export market selling 12,993 tes
Turnover - Rs Million
A 2004B 2005C 2006D 2007E 2008F 2009
3,4474,073
4,3954,936
6,510 6,572
A B C D E F
410
590 635
863
1,213
1,038
Operating Result - Rs Million
A 2004B 2005C 2006D 2007E 2008F 2009 A B C D E F

41
Annual Report 2009
*Compared with the restated figures of same period last year
Operating Result - Rs Million
Sales Volume - Kilolitres
Production Volume - Kilolitres
(16)
7,583
7,387
27%
(17%)
(20%)
(21%)
(23%)
(22%)
263
33,223
33,741
Increase/(Decrease*)
Increase/(Decrease*)
Year EndedDecember 31, 2009Q4 2009
The economic slow down, high interest rates and the liquidity crunch adversely impacted business environment. There was a decline in construction activity resulting in a double digit contraction of the domestic decorative coatings market, in-addition customers down traded premium with non-premium products. Automobile production declined by 28 percent over 2008 and the vehicle refinish market also contracted. In the industrial segment, overall demand declined however this was partially compensated by double digit growth in volumes sold to the motorcycle and tractor industries.
Overall, volumes were lower by 23 percent over 2008 for reasons mentioned above. However margin management was better than last year, partially mitigating the impact of lower volumes.
Despite difficult market conditions, our focus on customer need and service remained a priority. In the decorative segment the company made an investment of Rs 39 million in order to modernize its key retail outlets and establish state of the art colour studios.
These outlets, at par with international standards are equipped with state of the art tinting technology and colour selection tools for enhanced customer experience and product offering.
Similarly, in the refinish segment, the company invested Rs 33 million on training and other associated cost related to the launch of AkzoNobel’s flagship Vehicle Refinish brand Sikkens. This product gained wide acceptance across the automotive after-sales network as well as market dealerships, establishing ICI as the clear market leader in the vehicle refinish market.
With lower volumes and one-off spend of Rs 33 million on the launch of Sikkens brand, the operating profit for the year was lower by 21 percent compared with last year. As reported earlier, the profit and loss account for the year 2008 has been restated to account for certain obligations and commitments in the decorative segment pertaining to that period not correctly reflected in the figures reported earlier.
• Contraction in automobile, refinish and decorative paints market• Sales volume down by 23%• Continued focus on customer needs with an investment of Rs 39 million for channel modernization
*Excluding discontinued OEM car paints business *Excluding discontinued OEM car paints business
Operating Result - Rs Million
A 2004*B 2005*C 2006*D 2007*E 2008F 2009
379
423
732 750
333263
A B C D E F
Turnover - Rs Million
A 2004*B 2005*C 2006*D 2007*E 2008F 2009
3,2453,705
4,5545,314
7,208
6,226
A B C D E F
*Compared with the same period last year
Operating Result - Rs Million
Turnover - Rs Million
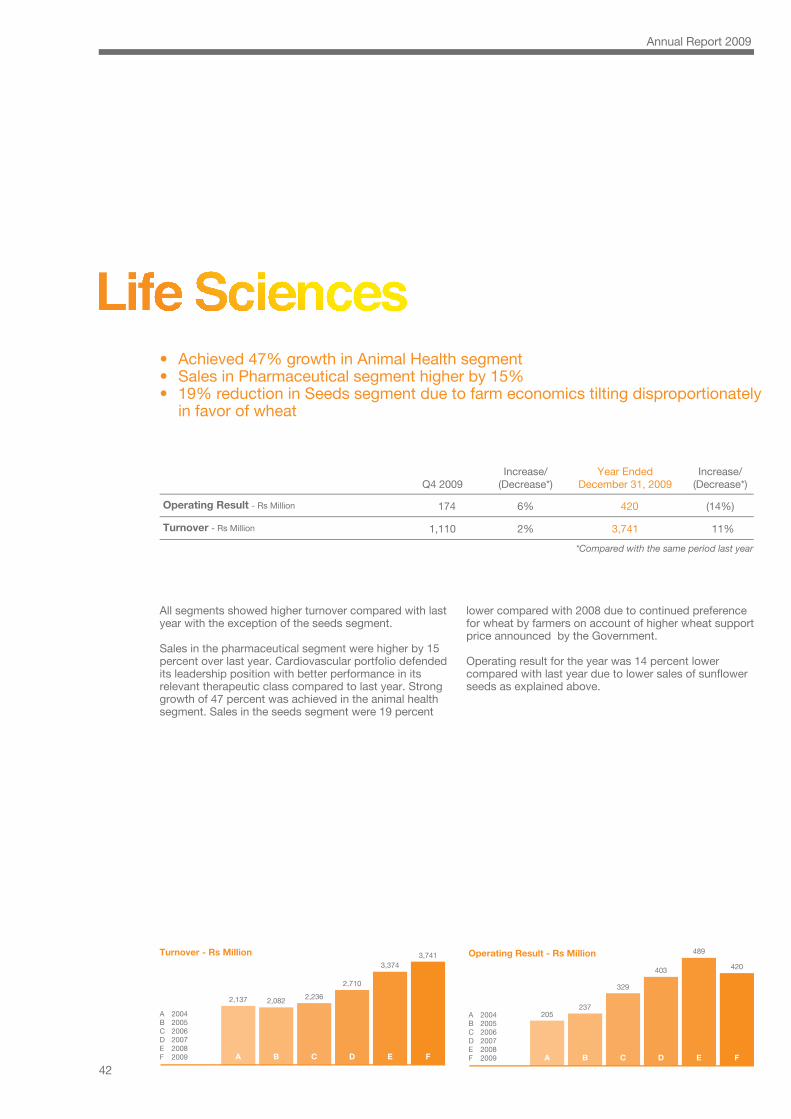
174
1,110
6%
2%
(14%)
11%
420
3,741
Increase/(Decrease*)
Increase/(Decrease*)
Year EndedDecember 31, 2009Q4 2009
42
Annual Report 2009
All segments showed higher turnover compared with last year with the exception of the seeds segment.
Sales in the pharmaceutical segment were higher by 15 percent over last year. Cardiovascular portfolio defended its leadership position with better performance in its relevant therapeutic class compared to last year. Strong growth of 47 percent was achieved in the animal health segment. Sales in the seeds segment were 19 percent
lower compared with 2008 due to continued preference for wheat by farmers on account of higher wheat support price announced by the Government.
Operating result for the year was 14 percent lower compared with last year due to lower sales of sunflower seeds as explained above.
• Achieved 47% growth in Animal Health segment• Sales in Pharmaceutical segment higher by 15%• 19% reduction in Seeds segment due to farm economics tilting disproportionately in favor of wheat
Turnover - Rs Million
A 2004B 2005C 2006D 2007E 2008F 2009
2,137 2,082 2,236
2,710
3,3743,741
A B C D E F
Operating Result - Rs Million
A 2004B 2005C 2006D 2007E 2008F 2009
205237
329
403
489
420
A B C D E F

*Compared with the same period last year**Relates to Polyurethanes and Specialty Chemicals
Operating Result - Rs Million
Sales Volume - Tonnes
Production Volume - Tonnes**
50
4,220
1,820
(24%)
14%
4%
(24%)
(22%)
(13%)
217
16,504
8,477
Increase/(Decrease*)
Increase/(Decrease*)
Year EndedDecember 31, 2009Q4 2009
43
Annual Report 2009
Business conditions remained difficult with the slow down of the value added textile, appliance sector and an overall industrial slowdown. Export opportunities also remained scarce due to general global economic slowdown.
Operating results for the year were lower by 24 percent compared with last year on account of lower sales volumes due to weak demand from the value added textile and the appliance sectors.
• Overall industrial slowdown• Limited export opportunities due to global recession
Turnover - Rs Million
A 2004*B 2005C 2006D 2007E 2008F 2009
2,3432,036
2,229
2,659
3,2072,895
*Includes Rs 1,154 m in respect of furnace oil & coal business
A B C D E F
Operating Result - Rs Million
A 2004*B 2005C 2006D 2007E 2008F 2009
79
150177
211
285
217
* Includes Rs 46.8 m in respect of furnace oil and coal business
A B C D E F

TaxationThe most significant development was the decision of the Honourable Supreme Court of Pakistan in which it was held that the Income Tax Department can not reopen assessments, finalised on or before June 2002, under section 122(5A) of the Income Tax Ordinance 2001 with retrospective effect.
Earlier, the Income Tax Department had reopened the settled issue of PTA de-merger under section 122(5A) of the Income Tax Ordinance 2001, with a view of applying tax on de-merged assets relating to PTA business through reopening of the assessment already finalised prior to June 2002. This matter was being contested at various levels including the Supreme Court of Pakistan. The decision from the Supreme Court, brought a favourable outcome to the considerable efforts put in by the Company over a number of years on the aforementioned issue.
FinanceCompany’s Balance Sheet management remained strong with current ratio improving to 1.9 (2008: 1.8).
Net sales income was up by 2 percent compared to last year. Gross profit was up by 3 percent on account of better volumes in polyester business and effective margin management. Financial charges for the year were lower by 24 percent as the liquidity position of the Company further improved and lower exchange losses due to relative stability in exchange rates. Other operating income of the Company showed significant improvement on account of higher income from deposits and other investments.
Despite tough business and economic conditions, your Company capitalised on the strength of its diverse portfolio, servicing a wide range of downstream industry and posted a 10 percent increase in profit after tax amounting of Rs. 2,045 million compared with Rs.1,863 million last year (restated). The consolidated profit after tax amounting to Rs. 2,054 million was also 21 percent higher compared with last year (restated).
Earnings per share for the year was higher by 10 percent compared to last year (restated).
Future outlookProspects of a global recovery in 2010 remain mixed. However, debate on an end to the monetary and fiscal stimuli and servicing the mounting public debts in the US and the Euro zone weigh heavily on the shape of this recovery and hence the uncertainty. On the domestic front, there are signs of macro economic stability, however this hard gained recovery is threatened by the pressures building up on fiscal account, further increase in energy shortages, persistent inflation and the unease on continued security incidents. Business environment is therefore expected to remain tough in 2010.
Under these very difficult challenges, your Company remains committed to business growth and opportunities for new investment. Meanwhile we draw the attention of the government on issues requiring policy interventions in order to safeguard the existing industrial base, revive economic growth and attract productive investment.
44
Annual Report 2009
DividendRupees per share
A 2004B 2005C 2006D 2007E 2008F 2009
2.5
6.05.5 5.5
6.0
7.5
A B C D E F
*Excluding purchase value of Fayzan ManufacturingModaraba Rs 1,295 million
Capital ExpenditureRs m
A 2004B 2005C 2006*D 2007E 2008F 2009
548
1,455
1,210
1,012
1,626
746
A B C D E F

• Renegotiate the Afghan transit treaty in order to curb duty free re-entry of goods in the domestic market. Increasing the tax base, domestic production and investments • Increase transparency on import data and make available the same to the stakeholders for effective policing on under invoicing. Increases tax collection and domestic production• Strengthen the National Tariff commission through capacity building and make it an independent body. Increases predictability / transparency on tariff structures to avoid any adhoc tariff adjustments as seen recently. Ensures effective investigation of anti dumping cases thereby genuinely providing level playing field to the domestic players and for encouraging new investment• Implement a long term energy policy and implement Cabinet’s short term energy management plan in letter and spirit
AcknowledgmentYour Company maintained its strong position, with a healthy balance sheet while meeting stakeholders’ expectations. The performance of the Company is a strong evidence of the contribution our employees make towards the success of the Company in difficult times. Your Company’s performance as reflected in the improved results for 2009 would not have been possible without the contribution of our committed employees, devoted customers and continued support received from suppliers and contractors. The Board would like to thank all stakeholders for their valuable support and untiring efforts, which enabled the Company to achieve this performance.
AuditorsThe present auditors KPMG Taseer Hadi & Co., Chartered Accountants retired and being eligible have offered themselves for reappointment with their new partner in charge of audit, Mr. Amir Jamil Abbasi.
Board changesOn January 23, 2009, Pervaiz A. Khan resigned from the Board consequent to his retirement from the service of ICI Pakistan Limited. To fill the vacancy, Ali A. Aga, Vice President of the Soda Ash business, was appointed on the Board with effect from January 27, 2009 for the remainder of the term to expire on April 28, 2011. Derek W. Welch was appointed as a Director of ICI Pakistan Limited in place of Muhammad Zahir who took an early retirement on medical grounds. Mr Welch's appointment was effective from June 3, 2009 for the remainder of the term to expire on April 28, 2011. The Board would like to thank the outgoing Directors Pervaiz A. Khan and Mohammad Zahir for their contribution to the Company and welcome the new Directors Ali A. Aga and Derek W. Welch on the Board of the Company.
45
Annual Report 2009

Compliance with the Code ofCorporate Governance As required under the code of corporate governance dated March 28, 2002, the Directors are pleased to state as follows:
● The financial statements prepared by the management of the Company present fairly its state of affairs, the results of its operations, cash flows and changes in equity
● Proper books of accounts of the Company have been maintained
● Accounting policies have been consistently applied in preparation of financial statements and accounting estimates are based on reasonable and prudent judgment
● International Accounting Standards, as applicable in Pakistan, have been followed in preparation of financial statements and any deviation from these has been adequately disclosed
● The system of internal control and other such procedures, which are in place, are being continuously reviewed by the Internal Audit Function. The process of review will continue and any weakness in controls will be removed
● There are no doubts upon the Company’s ability to continue as a going concern
● There has been no deviation from the best practices of corporate governance as detailed in the Listing Regulations
● Key operating and financial data for the last 10 years is summarized on pages 96-97
● Outstanding taxes and levies are given in the Notes to the Financial Statements
● The management of the Company is committed to good corporate governance, and appropriate steps are taken to comply with best practices
Investment in retirement benefits The value of investments, made by the staff retirement funds operated by the Company as per their respective audited financial statements for the year ended December 31, 2008 are as follows:
Value (Rs ‘000’s)1 ICI Pakistan Management Staff Provident Fund 543,1932 ICI Pakistan Management Staff Gratuity Fund 314,7123 ICI Pakistan Management Staff Pension Fund 812,0684 ICI Pakistan Management Staff Defined Contribution Superannuation Fund 177,7945 ICI Pakistan Non-Management Staff Provident Fund 350,930
Directors’ attendanceDuring the year, 4 (four) Board of Directors, 5 (five) Audit Committee and 1 (one) Remuneration Committee meetings were held. Attendance by each Director/CFO/Company Secretary was as follows.
(i) Resigned w.e.f. April 20, 2009
(ii) Appointed w.e.f. January 27, 2009
(iii) Appointed w.e.f. June 03, 2009
(iv) Resigned w.e.f. January 23, 2009
(v) Resigned w.e.f.. January 31, 2010
Leave of absence was granted to directors who
could not attend some of the Board meetings
46
Annual Report 2009
Name ofDirectors
Board ofDirectors
Attendance
AuditCommitteeAttendance
RemunerationCommitteeAttendance
1 Mr. M J Jaffer
2 Mr. Waqar A Malik
3 Mr. Mueen Afzal
4 Mr. M Nawaz Tiwana
5 Mr. Ali A Aga (ii)
6 Mr. Muhammad Zahir (i)
7 Mr. Derek W Welch (iii)
8 Mr. Tariq Iqbal Khan
9 Mr. Feroz Rizvi
10 Mr. Bart Kaster
11 Mr. James R Rees
12 Mr. Pervaiz A Khan (iv)
13 Mr. Nasir Jamal
Company Secretary (v)
4
4
4
4
4
1
1
3
4
2
3
0
4
-
-
-
1
-
-
-
-
-
-
1
-
-
5
-
5
-
-
-
-
-
-
4
-
-
4

Waqar A MalikChief Executive
Pattern of shareholdingA statement showing the pattern of shareholding in the Company along with additional information as at December 31, 2009 appears on pages 99-101
ICI Omicron B.V. (an AkzoNobel group company) continues to hold 75.81% shares, while Institutions held 12.39%, and individuals and others held the balance 11.79%.
The highest and lowest market prices during 2009 were Rs 50.00 and Rs 201.00 per share, respectively.
The Directors, CEO, CFO, Company Secretary and their spouses and minor children did not carry out any transaction in the shares of the Company duringthe year.
Group financial statementsThe audited financial statements of the ICI Group for the year ended December 31, 2009 are attached. The ICI Pakistan Group comprises of ICI Pakistan Limited and ICI Pakistan PowerGen Limited, a wholly owned subsidiary.
February 18, 2010Karachi
M J JafferChairman
47
Annual Report 2009

Statement of Compliance with the Code of Corporate Governance for the year ended December 31, 2009
This statement is being presented to comply with the Code of Corporate Governance contained in the listing regulations of the stock exchanges for the purpose of establishing a framework of good governance, whereby a listed company is managed in compliance with the best practices of corporate governance.
The Company has applied the principles contained in the Code in the following manner:
1. The Company encourages representation of independent, non-executive directors and directors representing minority interests on its Board of Directors. At present the Board includes seven non-executive directors and three executive directors
2. The directors voluntarily confirmed that none of them is serving as a director in more than ten listed companies, including ICI Pakistan Limited, except for Mr Tariq Iqbal Khan who has been granted a waiver from the application of the relevant clause of the Code by the Securities and Exchange Commission of Pakistan
3. The Directors have voluntarily declared that all the resident directors of the Company are registered taxpayers and none of them has defaulted in payment of any loan to a banking company, a DFI or NBFI. None of the directors is a member of stock exchange
4. Two casual vacancies occurred in the Board on January 23, 2009 and April 20, 2009 which were filled up on January 27, 2009 and June 3, 2009 respectively. SECP allowed the Company fifteen days’ extension for filling the second vacancy based on exceptional circumstances
5. The Board of Directors of the Company in its meeting held on February 23, 2001 adopted a Statement of Ethics and Business Practices. This statement under its title ‘The Way We Do Things Around Here’ and then ‘ICI Way’ had been regularly circulated within the Company since 2001. On October 23, 2008, the Directors adopted a new Code of Conduct which was circulated among all employees of the Company in 2008/2009. Training sessions were held at various locations in order to apprise all employees about the revised Code of Conduct
6. The Board of Directors at its meeting held on February 25, 2005 approved and adopted a mission statement which has been circulated to the employees of the Company. The Board of Directors has also approved and adopted a corporate strategy for the Company and significant policies. The corporate strategy is reviewed by the Board from time to time as appropriate
7. All the powers of the Board have been duly exercised and decisions on material transactions, including appointment and determination of remuneration and terms and conditions of employment of the CEO and other Executive Directors, have been taken by the Board
8. During the year four regular meetings of the Board were held which were all presided over by the Chairman. Written notices of the regular Board meetings, along with agenda and working papers, were circulated at least seven days before the meetings. The minutes of all four meetings were appropriately recorded and circulated in time
9. The Directors have been provided with copies of the Listing Regulations of the Stock Exchange, the Company’s Memorandum and Articles of Association and the Code of Corporate Governance. Orientation courses, both in-house and external, were also arranged for the Board in 2003 & 2006. Besides a comprehensive paper on ‘Roles and Responsibilities of Directors’ was also circulated to the directors for their perusal in November 2006. In April 2008, another booklet titled, “A Handbook of Directors” was circulated amongst the Directors. The directors are, therefore, well conversant with their duties and responsibilities
10. No new appointment of CFO, Company Secretary or Head of Internal Audit has been made during the year
11. The Report of the Directors for the year ended December 31, 2009 has been prepared in compliance with the requirements of the Code and fully describes the salient matters required to be disclosed
12. The financial statements of the Company were duly endorsed by the CEO and CFO before approval of the Board. The 2nd quarterly and annual accounts were also initialed by the external auditors before presentation to the Board
13. The Company maintains a list of related parties which is updated on a regular basis. All transactions with related parties are placed before the Audit Committee on a quarterly basis and are approved by the Board along with the methods for pricing
14. The Directors, CEO and executives do not hold any interest in the shares of the Company other than that disclosed in the pattern of shareholding
15. The Company has complied with all the corporate and financial reporting requirements of the Code
16. The Audit Sub Committee of the Board has been in existence since 1992. It comprises three members, all of whom are non-executive directors including the chairman of the committee. ICI Pakistan also has a Remuneration Committee comprising two non-executive directors, which has also been in operation since 1997
17. There have been five Audit Committee meetings during the year under review. The Directors have approved the revised terms of reference of the Audit Committee in light of the Code of Corporate Governance
18. ICI Pakistan has an effective internal audit function in place. The Board has outsourced the internal audit function to Ernst & Young Ford Rhodes Sidat Hyder, Chartered Accountants, who are considered suitably qualified and experienced for the purpose and are conversant with the policies and procedures of the Company. They are involved in the internal audit function on a full time basis48
Annual Report 2009

Waqar A MalikChief Executive
19. The statutory auditors of the Company have confirmed that they have been given a satisfactory rating under the quality control review programme of the Institute of Chartered Accountants of Pakistan, that they or any of the partners of the firm, their spouses and minor children do not hold shares of the Company and that the firm and all its partners are in compliance with International Federation of Accountants (IFAC) guidelines on Code of Ethics as adopted by Institute of Chartered Accountants of Pakistan
20. The statutory auditors or the persons associated with them have not been appointed to provide other services except in accordance with the listing regulations and the auditors have confirmed that they have observed IFAC guidelines in this regard
21. We confirm that all other material principles contained in the Code have been complied with
February 18, 2010Karachi
M J JafferChairman
49
Annual Report 2009

Review report to the members on statement of compliance with best practices of code of corporategovernance
We have reviewed the Statement of Compliance with the best practices contained in the Code of Corporate Governance prepared by the Board of Directors of ICI Pakistan Limited to comply with the listing regulations of the respective Stock Exchanges, where the Companyis listed.
The responsibility for compliance with the Code of Corporate Governance is that of the Board of Directors of the Company. Our responsibility is to review, to the extent where such compliance can be objectively verified, whether the Statement of Compliance reflects the status of the Company’s compliance with the provisions of the Code of Corporate Governance and report if it does not. A review is limited primarily to inquiries of the Company personnel and review of various documents prepared by the Company to comply with the Code.
As part of our audit of financial statements we are required to obtain an understanding of the accounting and internal control systems sufficient to plan the audit and develop an effective audit approach. We have not carried out any special review of the internal control system to enable us to express an opinion as to whether the Board’s statement on internal control covers all controls and the effectiveness of such internal controls.
Further sub-regulation (xiii) of Listing Regulations 35 (previously Regulation No. 37) notified by the Karachi Stock Exchange (Guarantee) Limited vide circular no. KSE/N-269 dated January 19, 2009 requires the Company to place before the Board of Directors for their consideration and approval related party transactions distinguishing between transactions carried out on terms equivalent to those that prevail in arm’s length transactions and transactions which are not executed at arm’s length price recording proper justification for using such alternate pricing mechanism. Further, all such transactions are also required to be separately placed before the audit committee. We are only required and have ensured compliance of requirement to the extent of approval of related party transactions by the board of directors and placement of such transactions before the audit committee. We have not carried out any procedures to determine whether the related party transactions were undertaken at arm’s length priceor not.
Based on our review, nothing has come to our attention which causes us to believe that the Statement of Compliance does not appropriately reflect the Company’s compliance, in all material respects, with the best practices contained in the Code of Corporate Governance as applicable to the Company for the year ended 31 December 2009.
February 18, 2010Karachi
KPMG Taseer Hadi & Co.Chartered Accountants
Syed Iftikhar Anjum
50
Annual Report 2009

Annual Report 2009
We published our �rst-ever Sustainability Report as a part of our Annual Report 2008. It is now a separate publication, and provides in-depth information regarding sustainabilityinitiatives and developments at ICI Pakistan Limited.
Don’t miss our Sustainability Report 2009
Our goal is to deliver sustainable solutions to our customers; this is crucial to the success of our company, but we know we would never be able to achieve this success without sustainable business operations that meet the needs of today while protecting resources for, and the rights of, future generations.
Our Sustainability Report for 2009 is divided into segments according to the way we manage sustainability at ICI Pakistan, and the four main components are: People, Planet, Performance and Product.


Annual Report 2009
ICI Pakistan LimitedFinancial Statements


55
Auditors’ Report to the Members
Annual Report 2009
We have audited the annexed unconsolidated balance sheet of ICI Pakistan Limited (“the Company”) as at 31 December, 2009and the related unconsolidated profit and loss account, unconsolidated statement of comprehensive income, unconsolidated cashflow statement and unconsolidated statement of changes in equity together with the notes forming part thereof, for the year thenended and we state that we have obtained all the information and explanations which, to the best of our knowledge and belief,were necessary for the purposes of our audit.
It is the responsibility of the Company’s management to establish and maintain a system of internal control, and prepare andpresent the above said statements in conformity with the approved accounting standards and the requirements of the CompaniesOrdinance, 1984. Our responsibility is to express an opinion on these statements based on our audit.
We conducted our audit in accordance with the auditing standards as applicable in Pakistan. These standards require that weplan and perform the audit to obtain reasonable assurance about whether the above said statements are free of any materialmisstatement. An audit includes examining, on a test basis, evidence supporting the amounts and disclosures in the above saidstatements. An audit also includes assessing the accounting policies and significant estimates made by management, as well as,evaluating the overall presentation of the above said statements. We believe that our audit provides a reasonable basis for ouropinion and, after due verification, we report that:
a) in our opinion, proper books of account have been kept by the Company as required by the Companies Ordinance, 1984;
b) in our opinion:
i) the balance sheet and profit and loss account together with the notes thereon have been drawn up in conformitywith the Companies Ordinance, 1984, and are in agreement with the books of account and are further in accordancewith accounting policies consistently applied, except for the change as described in note 2.2 to the financial statementswith which we concur;
ii) the expenditure incurred during the year was for the purpose of the Company’s business; and
iii) the business conducted, investments made and the expenditure incurred during the year were in accordance withthe objects of the Company;
c) in our opinion and to the best of our information and according to the explanations given to us, the unconsolidated balancesheet, unconsolidated profit and loss account, unconsolidated statement of comprehensive income, unconsolidated cashflow statement and unconsolidated statement of changes in equity together with the notes forming part thereof conformwith approved accounting standards as applicable in Pakistan, and, give the information required by the CompaniesOrdinance, 1984, in the manner so required and respectively give a true and fair view of the state of the Company’s affairsas at 31 December 2009 and of the profit, its cash flows and changes in equity for the year then ended; and
d) in our opinion Zakat deductible at source under the Zakat and Ushr Ordinance, 1980 (XVIII of 1980), was deducted by theCompany and deposited in the Central Zakat Fund established under section 7 of that Ordinance.
Date: 18 February 201018 February 2009 KPMG Taseer Hadi & Co.Karachi Chartered Accountants
Syed Iftikhar Anjum
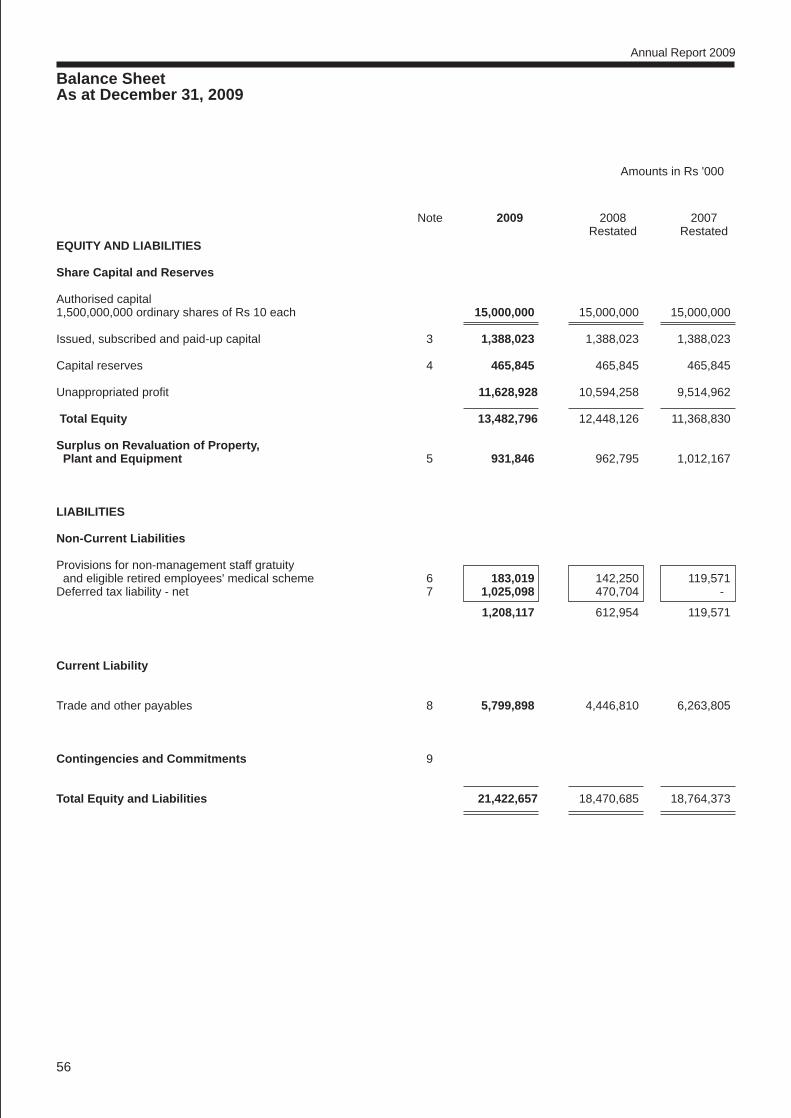
Balance SheetAs at December 31, 2009
Annual Report 2009
56
EQUITY AND LIABILITIES
Share Capital and Reserves
Authorised capital1,500,000,000 ordinary shares of Rs 10 each 15,000,000 15,000,000 15,000,000
Issued, subscribed and paid-up capital 3 1,388,023 1,388,023 1,388,023
Capital reserves 4 465,845 465,845 465,845
Unappropriated profit 11,628,928 10,594,258 9,514,962
Total Equity 13,482,796 12,448,126 11,368,830
Surplus on Revaluation of Property, Plant and Equipment 5 931,846 962,795 1,012,167
LIABILITIES
Non-Current Liabilities
Provisions for non-management staff gratuity and eligible retired employees' medical scheme 6 183,019 142,250 119,571Deferred tax liability - net 7 1,025,098 470,704 -
1,208,117 612,954 119,571
Current Liability
Trade and other payables 8 5,799,898 4,446,810 6,263,805
Contingencies and Commitments 9
Total Equity and Liabilities 21,422,657 18,470,685 18,764,373
Note 2009 2008 2007 Restated Restated
Amounts in Rs '000

Balance SheetAs at December 31, 2009
Annual Report 2009
57
Amounts in Rs '000
M J Jaffer Waqar A Malik Feroz RizviChairman / Director Chief Executive Chief Financial Officer
Note 2009 2008 2007 Restated Restated
ASSETS
Non-current Assets
Property, plant and equipment 10 9,225,110 9,353,769 8,506,736Intangible asset 11 - 7,700 39,737
9,225,110 9,361,469 8,546,473
Deferred tax asset - net 7 - - 370,406Long-term investments 12 712,500 712,500 582,500Long-term loans 13 330,801 330,605 204,867Long-term deposits and prepayments 14 29,078 30,684 37,357
1,072,379 1,073,789 1,195,130
10,297,489 10,435,258 9,741,603
Current Assets
Stores and spares 15 496,401 538,540 605,480
Stock-in-trade 16 3,244,525 2,951,956 2,311,336
Trade debts 17 919,463 806,612 991,596
Loans and advances 18 406,739 193,254 137,680
Trade deposits and short-term prepayments 19 452,438 404,662 341,129
Other receivables 20 677,111 749,388 683,461
Taxation recoverable 460,240 419,934 337,032
Cash and bank balances 21 4,468,251 1,971,081 3,615,056
11,125,168 8,035,427 9,022,770
Total Assets 21,422,657 18,470,685 18,764,373
The annexed notes 1 to 47 form an integral part of these financial statements.

Profit and Loss AccountFor the year ended December 31, 2009
Annual Report 2009
58
Turnover 24 32,399,181 31,921,873
Sales tax, excise duty, commission and discounts 23 (3,969,284) (4,122,958)
Net sales, commission & toll income 28,429,897 27,798,915
Cost of sales 24 (22,754,005) (22,303,138)
Gross profit 5,675,892 5,495,777
Selling and distribution expenses 26 (1,470,174) (1,317,258)
Administration and general expenses 27 (1,178,064) (1,126,159)
3,027,654 3,052,360
Financial charges 28 (167,541) (219,308)
Other operating charges 29 (247,590) (233,699)
(415,131) (453,007)
Other operating income 30 459,983 213,425
Profit before taxation 3,072,506 2,812,778
Taxation 31 (1,027,768) (950,040)
Profit after taxation 2,044,738 1,862,738
(Rupees) (Rupees)
Earnings per share - Basic and diluted 32 14.73 13.42
The annexed notes 1 to 47 form an integral part of these financial statements.
Note 2009 2008 Restated
Amounts in Rs '000
M J Jaffer Waqar A Malik Feroz RizviChairman / Director Chief Executive Chief Financial Officer

Statement of Comprehensive IncomeFor the year ended December 31, 2009
Annual Report 2009
59
Amounts in Rs '000
M J Jaffer Waqar A Malik Feroz RizviChairman / Director Chief Executive Chief Financial Officer
2009 2008 Restated
Profit for the year 2,044,738 1,862,738
Other comprehensive income - -
Total Comprehensive income for the year 2,044,738 1,862,738
The annexed notes 1 to 47 form an integral part of these financial statements.

Cash Flow StatementFor the year ended December 31, 2009
Annual Report 2009
60
Amounts in Rs '000
2009 2008 Restated
Cash Flows from Operating Activities
Profit before taxation 3,072,506 2,812,778
Adjustments for:
Depreciation and amortisation 870,688 806,044Gain on disposal of property, plant and equipment (5,293) (7,437)Provision for non-management staff gratuity and eligible retired employees' medical scheme 56,008 33,640Mark-up on bank deposits and loan to subsidiary (228,624) (129,412)Interest / mark-up expense 88,118 122,519
3,853,403 3,638,132Movement in:
Working capital 1,083,497 (2,434,675)Long-term loans (196) (21,738)Long-term deposits and prepayments 1,606 6,673
Cash generated from operations 4,938,310 1,188,392
Payments for :Non-management staff gratuity and eligible retired employees' medical scheme (15,239) (10,961)Taxation (513,680) (191,832)Interest / mark-up (97,097) (114,672)Profit / mark-up received on bank deposits 163,937 98,882
Net cash generated from operating activities 4,476,231 969,809
Cash Flows from Investing Activities
Payments for capital expenditure (826,402) (1,515,828)Proceeds from disposal of property, plant and equipment 17,148 12,130Profit / mark-up received on loan to subsidiary 58,211 28,729Long term investment - (130,000)Loan / standby finance facility to subsidiary company - net (187,000) (176,000)
Net cash used in investing activities (938,043) (1,780,969)

Cash Flows from Financing Activities
Dividend paid (1,041,018) (832,815)
Net cash used in financing activities (1,041,018) (832,815)
Net increase / (decrease) in cash and cash equivalents 2,497,170 (1,643,975)Cash and cash equivalents at January 1 1,971,081 3,615,056
Cash and cash equivalents at December 31 - note 21 4,468,251 1,971,081
Movement in Working Capital
(Increase) / decrease in current assets
Stores and spares 42,139 66,940Stock-in-trade (292,569) (640,620)Trade debts (112,851) 184,984Loans and advances (26,485) 16,426Trade deposits and short-term prepayments (47,776) (63,533)Other receivables 78,753 (64,126)
(358,789) (499,929)
Increase / (decrease) in current liability
Trade and other payables 1,442,286 (1,934,746)
1,083,497 (2,434,675)
The annexed notes 1 to 47 form an integral part of these financial statements.
Cash Flow StatementFor the year ended December 31, 2009
Annual Report 2009
61
Amounts in Rs '000
M J Jaffer Waqar A Malik Feroz RizviChairman / Director Chief Executive Chief Financial Officer
2009 2008 Restated

Annual Report 2009
62
M J Jaffer Waqar A Malik Feroz RizviChairman / Director Chief Executive Chief Financial Officer
Statement of Changes in EquityFor the year ended December 31, 2009
Balance as on January 1, 2008 1,388,023 465,845 9,544,582 11,398,450Effect of restatement as referred in note 41.3 - - (29,620) (29,620)
Balance as on January 1, 2008 - restated 1,388,023 465,845 9,514,962 11,368,830
Final dividend for the year ended December 31, 2007 @ Rs 3.50 per share - - (485,808) (485,808)Interim dividend for the year 2008 @ Rs 2.50 per share - - (347,006) (347,006)
Transactions with owners, recorded directly in equity - - (832,814) (832,814)
Total comprehensive income for the year ended December 31, 2008 - - 1,862,738 1,862,738
Transfer from surplus on revaluation of property, plant and equipment incremental depreciation for the period - net of deferred tax - note 5 - - 49,372 49,372
- - 1,912,110 1,912,110
Balance as on December 31, 2008 - restated 1,388,023 465,845 10,594,258 12,448,126
Final dividend for the year ended December 31, 2008 @ Rs 4.00 per share - - (555,209) (555,209)Interim dividend for the year 2009 @ Rs 3.50 per share - - (485,808) (485,808)
Transactions with owners, recorded directly in equity - - (1,041,017) (1,041,017)
Total comprehensive income for the year ended December 31, 2009 - - 2,044,738 2,044,738
Transfer from surplus on revaluation of property, plant and equipment incremental depreciation for the period - net of deferred tax - note 5 - - 30,949 30,949
- - 2,075,687 2,075,687
Balance as on December 31, 2009 1,388,023 465,845 11,628,928 13,482,796
The annexed notes 1 to 47 form an integral part of these financial statements.
Amounts in Rs '000
Issued, Capital Unappropriated Total subscribed reserves profitand paid-up
capital

Notes to the Financial StatementsFor the year ended December 31, 2009
1. Status and Nature of Business
ICI Pakistan Limited (“the Company”) is incorporated in Pakistan and is listed on Karachi, Lahore and Islamabad StockExchanges. The Company is engaged in the manufacture of polyester staple fibre, POY chips, soda ash, paints, specialtychemicals, sodium bicarbonate and polyurethanes; marketing of seeds, toll manufactured and imported pharmaceuticalsand animal health products; and merchanting of general chemicals. It also acts as an indenting agent and toll manufacturer.The Company’s registered office is situated at 5 West Wharf, Karachi.
2. Summary of Significant Accounting Policies
The accounting policies adopted are the same as those which were applied for the previous financial year except for thechanges described in note 2.2.
2.1 Statement of compliance
These financial statements have been prepared in accordance with approved accounting standards as applicable in Pakistan.Approved accounting standards comprise of such International Financial Reporting Standards (IFRS) issued by theInternational Accounting Standards Board as are notified under the Companies Ordinance, 1984, provisions of and directivesissued under the Companies Ordinance, 1984. In case requirements differ, the provisions of, or directives issued underthe Companies Ordinance, 1984 shall prevail.
2.2 Changes in accounting policies
Starting January 1, 2009, the Company has changed its accounting policies in the following areas:
The Company has applied "Revised IAS 1 Presentation of Financial Statements (2007)" which became effective fromJanuary 1, 2009. This standard required the Company to present in the statement of changes in equity all owner changesin equity, whereas all non-owner changes in equity are presented in statement of comprehensive income.
The Company has applied "IFRS 8 Operating Segments" from January 1, 2009. As a result, additional disclosures havebeen made relating to financial and descriptive information with respect to individual operating segments and on anenterprise-wide basis. The Company determines and presents operating segments based on the information that internallyis provided to the CEO, who is the Company’s chief operating decision maker. Previously operating segments weredetermined and presented in accordance with IAS 14 Segment Reporting. The new accounting policy in respect of operatingsegment disclosures is disclosed in note 2.20.
The Company has applied "Islamic Financial Accounting Standard 2 - Ijarah" from January 1, 2009. Ijarah contracts arealready treated as operating leases, resultantly there is no impact on the reported results.
Comparative information has been re-presented so that it is in conformity with the revised / new standards. Since thechanges in accounting policies only affect presentation of financial statements, there is no impact on earnings per share.
2.3 Basis of preparation
These financial statements have been prepared under the historical cost convention, except that certain property, plantand equipment have been included at revalued amounts and certain exchange elements referred to in note 2.9 have beenrecognised in the cost of the relevant property, plant & equipment.
The preparation of financial statements in conformity with approved accounting standards requires management to makeestimates, assumptions and use judgments that affect the application of policies and reported amounts of assets andliabilities and income and expenses. Estimates, assumptions and judgments are continually evaluated and are based on
Annual Report 2009
63

Annual Report 2009
64
Notes to the Financial StatementsFor the year ended December 31, 2009
historical experience and other factors, including reasonable expectations of future events. Revisions to accounting estimatesare recognised prospectively commencing from the period of revision.
Judgments and estimates made by the management that may have a significant risk of material adjustments to the financialstatements in subsequent years are discussed in note 43.
2.4 Staff retirement benefits
The Company’s retirement benefit plans comprise of provident funds, pensions, gratuity schemes and a medical schemefor eligible retired employees.
Defined benefit plans
The Company operates a funded pension scheme and a funded gratuity scheme for management staff. The pension andgratuity schemes are salary schemes providing pension and lump sums, respectively. Pension and gratuity schemes formanagement staff are invested through two approved trust funds. The Company also operates gratuity scheme for non-management staff and the pensioners’ medical scheme which are unfunded. The pension and gratuity plans are final salaryplans. The pensioner’s medical plan reimburses actual medical expenses to pensioners as per entitlement. The Companyrecognises expense in accordance with IAS 19 “Employee Benefits”.
An actuarial valuation of all defined benefit schemes is conducted every year. The valuation uses the Projected Unit Creditmethod. Actuarial gains and losses are amortised over the expected average remaining working lives of employees asallowed under the relevant provision of IAS 19 “Employee Benefits”.
Past-service costs are recognised immediately in profit and loss account, unless the changes to the plan are conditionalon the employees remaining in service for a specified period of time (the vesting period). In this case, the past-service costsare amortised on a straight-line basis over the vesting period.
Defined contribution plans
The Company operates two registered contributory provident funds for its entire staff and a registered defined contributionsuperannuation fund for its management staff, who have either opted for this fund by July 31, 2004 or have joined theCompany after April 30, 2004. In addition to this the Company also provides group insurance to all its employees.
2.5 Provisions
A provision is recognised in the balance sheet when the Company has a legal or constructive obligation as a result of apast event, and it is probable that an outflow of economic benefits will be required to settle the obligation and a reliableestimate can be made of the amount of obligation. The amount recognized as a provision shall be the best estimate of theexpenditure required to settle the present obligation at the end of the reporting period.
2.6 Trade and other payables
Trade and other payables are recognised initially at fair value plus directly attributable cost, if any.
2.7 Dividend
Dividend distribution to the Company’s shareholders is recognised as a liability in the period in which the dividends areapproved.

Annual Report 2009
65
Notes to the Financial StatementsFor the year ended December 31, 2009
2.8 Taxation
Income tax expense comprises current and deferred tax. Income tax expense is recognised in the profit and loss account,except to the extent that it relates to items recognised directly in other comprehensive income or below equity, in whichcase it is recognised in other comprehensive income or below equity respectively.
Current
Provision for current taxation is based on taxable income at the enacted or substantively enacted rates of taxation aftertaking into account available tax credits and rebates, if any. The charge for current tax includes adjustments to charge forprior years, if any.
Deferred
Deferred tax is recognised using balance sheet method, providing for temporary differences between the carrying amountsof assets and liabilities for financial reporting purposes and the amounts used for taxation purposes. The amount of deferredtax provided is based on the expected manner of realisation or settlement of the carrying amount of assets and liabilities,using the enacted or substantively enacted rates of taxation.
The Company recognises a deferred tax asset to the extent that it is probable that taxable profits for the foreseeable futurewill be available against which the asset can be utilised. Deferred tax assets are reduced to the extent that it is no longerprobable that the related tax benefit will be realised. Further, the Company recognises deferred tax asset / liability on deficit/ surplus on revaluation of property, plant and equipment which is adjusted against the related deficit / surplus.
2.9 Property, plant and equipment and depreciation
Property, plant and equipment (except freehold land, leasehold land and plant & machinery) are stated at cost lessaccumulated depreciation and impairment losses, if any. Freehold land, leasehold land and plant & machinery are statedat revalued amounts less accumulated depreciation. Capital work-in-progress is stated at cost. Cost of certain property,plant and equipment comprises historical cost, exchange differences recognised in accordance with the previous FourthSchedule to the Ordinance, cost of exchange risk cover in respect of foreign currency loans obtained for the acquisitionof property, plant and equipment upto the commencement of commercial production and the cost of borrowings duringconstruction period in respect of loans taken for specific projects.
Depreciation charge is based on the straight-line method whereby the cost or revalued amount of an asset is written offto profit and loss account over its estimated useful life after taking into account the residual value if material. The cost ofleasehold land is amortised in equal installments over the lease period. Depreciation on additions is charged from the monthin which the asset is available for use and on disposals up to the month of disposal.
The residual value, depreciation method and the useful lives of each part of property, plant and equipment that is significantin relation to the total cost of the asset are reviewed, and adjusted if appropriate, at each balance sheet date.
Surplus on revaluation of property, plant and equipment is credited to the surplus on revaluation account. To the extent ofthe incremental depreciation charged on the revalued assets the related surplus on revaluation of property, plant andequipment (net of deferred taxation) is transferred directly to unappropriated profit.
Maintenance and normal repairs are charged to income as and when incurred. Improvements are capitalised when it isprobable that respective future economic benefits will flow to the Company and the cost of the item can be measuredreliably. Assets replaced, if any, are derecognised.
Gains and losses on disposal of assets are taken to the profit and loss account, and the related surplus on revaluation ofproperty, plant and equipment is transferred directly to retained earnings (unappropriated profits).

Annual Report 2009
66
Notes to the Financial StatementsFor the year ended December 31, 2009
2.10 Intangible assets
Intangible assets are measured initially at cost and subsequently stated at cost less accumulated amortisation and impairmentlosses, if any.
Computer software
Acquired computer software licenses are capitalised on the basis of the costs incurred to acquire and bring to use thespecific software. Costs associated with developing or maintaining computer software programmes are recognised as anexpense as incurred. Costs that are directly associated with the production of identifiable and unique software productscontrolled by the Company, and that will probably generate economic benefits exceeding costs beyond one year, arerecognised as intangible assets. These costs are amortised over their estimated useful lives.
2.11 Impairment
Financial assets (including receivables)
Financial assets are assessed at each reporting date to determine whether there is objective evidence that they are impaired.A financial asset is impaired if objective evidence indicates that a loss event has occurred after the initial recognition ofthe asset, and that the loss event had a negative effect on the estimated future cash flows of that asset that can be estimatedreliably. Objective evidence that financial assets are impaired may include default or delinquency by a debtor, indicationsthat a debtor or issuer will enter bankruptcy.
All individually significant receivables are assessed for specific impairment. All individually significant receivables foundnot to be specifically impaired are then collectively assessed for any impairment that has been incurred but not yet identified.Receivables that are not individually significant are collectively assessed for impairment by grouping together receivablesand with similar risk characteristics.
An impairment loss in respect of a financial asset measured at amortised cost is calculated as the difference between itscarrying amount and the present value of the estimated future cash flows discounted at the asset’s original effective interestrate. Losses are recognised in profit or loss and reflected in an allowance account against receivables. Interest on theimpaired asset continues to be recognised through the unwinding of the discount. When a subsequent event causes theamount of impairment loss to decrease, the decrease in impairment loss is reversed through profit or loss.
Non-Financial assets
The carrying amounts of non-financial assets other than inventories and deferred tax asset, are reviewed at each reportingdate to determine whether there is any indication of impairment. If any such indication exists, then the asset’s recoverableamount is estimated. The recoverable amount of an asset or cash-generating unit is the greater of its value in use and itsfair value less costs to sell. In assessing value in use, the estimated future cash flows are discounted to their present valueusing a pre-tax discount rate that reflects current market assessment of the time value of money and the risks specific tothe asset. For the purpose of impairment testing, assets that cannot be tested individually are grouped together into thesmallest group of assets that generates cash inflows from continuing use that are largely independent of the cash inflowsof other assets or groups of assets (the “cash-generating unit, or CGU”).
The Company’s corporate assets do not generate separate cash inflows. If there is an indication that a corporate assetmay be impaired, then the recoverable amount is determined for the CGU to which the corporate asset belongs. Animpairment loss is recognised if the carrying amount of an asset or its CGU exceeds its estimated recoverable amount.Impairment losses are recognised in profit or loss.

Annual Report 2009
67
Notes to the Financial StatementsFor the year ended December 31, 2009
Impairment loss recognised in prior periods are assessed at each reporting date for any indications that the loss hasdecreased or no longer exists. An impairment loss is reversed if there has been a change in the estimates used todetermine the recoverable amount. An impairment loss is reversed only to the extent that the asset’s carrying amountdoes not exceed the carrying amount that would have been determined, net of depreciation or amortisation, if noimpairment loss had been recognised.
2.12 Investments
Investments in subsidiary (ICI Pakistan PowerGen Limited) and non listed equity securities classified as available forsale are stated at cost less provision for impairment, if any.
2.13 Stores and spares
Stores and spares are stated at lower of cost and net realizable value. Cost is determined using weighted averagemethod.
2.14 Stock-in-trade
Stock-in-trade is valued at lower of weighted average cost and estimated net realisable value.
Cost comprises all costs of purchase, costs of conversion and other costs incurred in bringing the inventories to theirpresent location and condition. Net realisable value signifies the estimated selling price in the ordinary course of businessless net estimated costs of completion and selling expenses.
2.15 Trade debts and other receivables
Trade debts and other receivables are recognised initially at fair value plus directly attributable cost, if any. A provisionfor impairment of trade and other receivables is established when there is objective evidence that the Company will notbe able to collect all amounts due according to the original terms of receivables (Refer note 39.6.1).
2.16 Foreign currency translation
Transactions denominated in foreign currencies are translated to Pak Rupees, at the foreign exchange rate prevailingat the date of transaction. Monetary assets and liabilities in foreign currencies are translated into Pak Rupees at theforeign exchange rates at the balance sheet date. Exchange differences are taken to the profit and loss account.
2.17 Functional and presentation currency
Items included in the financial statements are measured using the currency of the primary economic environment inwhich the Company operates. The financial statements are presented in Pakistani Rupees, which is the Company’sfunctional and presentation currency.
2.18 Revenue recognition
n Revenue from the sale of goods is recognised when the significant risks and rewards of ownership have beentransferred to the customer. For those products which are often sold with a right of return, accumulated experienceis used to estimate and provide for such returns at the time of sale.

Annual Report 2009
68
Notes to the Financial StatementsFor the year ended December 31, 2009
n Commission income is recognised on the date of shipment from suppliers.
n Profit on short-term deposits and mark-up on loan to subsidiary is accounted for on a time-apportioned basis using theeffective interest rate method.
n Dividend income is recognised when the right to receive dividend is established.
n Toll manufacturing income is recognised when services are rendered.
2.19 Financial expense and finance income
Financial expenses are recognised using the effective interest rate method and comprise foreign currency losses andmarkup/interest expense on borrowings.
Finance income comprises interest income on funds invested. Markup/Interest income is recognised as it accrues in profitor loss, using the effective interest rate method.
2.20 Segment reporting
Segment reporting is based on the operating (business) segments of the Company. An operating segment is a componentof the Company that engages in business activities from which it may earn revenues and incur expenses, including revenuesand expenses that relate to transactions with any of the Company’s other components. An operating segment’s operatingresults are reviewed regularly by the CEO to make decisions about resources to be allocated to the segment and assessits performance, and for which discrete financial information is available.
Segment results that are reported to the CEO include items directly attributable to a segment as well as those that can beallocated on a reasonable basis. Unallocated items comprise mainly corporate assets, income tax assets, liabilities andrelated income and expenditure. Segment capital expenditure is the total cost incurred during the period to acquire property,plant and equipment.
The business segments are engaged in providing products or services which are subject to risks and rewards which differfrom the risk and rewards of other segments. Segments reported are Polyester, Soda Ash, Paints, Life Sciences andChemicals, which also reflects the management structure of the Company.
2.21 Finance lease
Leases that transfer substantially all the risks and rewards incidental to ownership of an asset are classified as financelease. Assets subject to finance lease are stated at amounts equal to the fair value or, if lower, the present value of theminimum lease payments. The minimum lease payments are apportioned between the finance charge and the reductionof the outstanding liability. Assets acquired under finance leases are depreciated in accordance with the Company’sdepreciation policy on property, plant and equipment. The finance cost is charged to profit and loss account and is includedunder financial charges.
2.22 Operating lease / Ijarah contract
Leases in which a significant portion of the risks and rewards of ownership are retained by the lessor are classified asoperating leases. Payments made under operating leases (net of any incentives received from the lessor) are charged tothe profit and loss account on a straight-line basis over the period of the lease.

Annual Report 2009
69
Notes to the Financial StatementsFor the year ended December 31, 2009
Payments made under operating leases / Ijarah contracts are recognised in the profit and loss account on a straight-linebasis over the term of the lease.
2.23 Cash and cash equivalents
Cash and cash equivalents comprise of cash in hand and current or deposit accounts held with banks. Running financefacilities availed by the Company, which are payable on demand and form an integral part of the Company’s cash managementare included as part of cash and cash equivalents for the purpose of statement of cash flows.
2.24 Borrowings and their cost
Borrowings are recognised initially at fair value, net of transaction costs incurred. Borrowing costs are recognised as anexpense in the period in which these are incurred except to the extent of borrowing cost that are directly attributable tothe acquisition, construction or production of a qualifying asset. Such borrowing costs, if any, are capitalised as part of thecost of that asset.
2.25 Financial liabilities
All financial liabilities are initially recognised at fair value plus directly attributable cost, if any, and subsequently measuredat amortised cost.
2.26 Derivative financial instruments
The Company uses derivative financial instruments to hedge its exposure to foreign exchange and interest rate risks arisingfrom operational, financing and investment activities. In accordance with its treasury policy, the Company does not holdor issue derivative financial instruments for trading purposes. However, derivatives that do not qualify for hedge accountingare accounted for as trading instruments.
2.27 Off-setting
Financial assets and liabilities are offset and the net amount is reported in the financial statements only when there is legallyenforceable right to set-off the recognised amount and the Company intends either to settle on a net basis, or to realisethe assets and to settle the liabilities simultaneously.
2.28 Earnings per Share
The Company presents basic and diluted earnings per share (EPS) data for its ordinary shares. Basic EPS is calculatedby dividing the profit after tax attributable to ordinary shareholders of the Company by the weighted average number ofordinary shares outstanding during the period.

Annual Report 2009
70
Notes to the Financial StatementsFor the year ended December 31, 2009
3. Issued, Subscribed and Paid-up Capital
2009 2008 2009 2008(Numbers)
125,840,190 125,840,190 Ordinary shares of Rs 10 each fully paid in cash 1,258,402 1,258,402
318,492 318,492 Ordinary shares of Rs 10 each issued as fully paid for consideration other than cash under scheme of arrangement for amalgamation 3,185 3,185
25,227 25,227 Ordinary shares of Rs 10 each issued as fully paid bonus shares 252 252
12,618,391 12,618,391 Ordinary shares issued pursuant to the Scheme as fully paid for consideration of investment in associate (note 3.1) 126,184 126,184
138,802,300 138,802,300 1,388,023 1,388,023
3.1 With effect from October 1, 2000 the Pure Terephthalic Acid (PTA) Business of the Company was demerged under a Schemeof Arrangement (“the Scheme”) dated December 12, 2000 approved by the shareholders and sanctioned by the High Courtof Sindh.
3.2 ICI Omicron B.V., which is a wholly owned subsidiary of AkzoNobel N.V., held 105,229,125 (2008: 105,229,125) ordinaryshares of Rs 10 each at December 31, 2009. AkzoNobel N.V., acquired ICI PLC, UK, effective January 2, 2008, the parentcompany of ICI Omicron B.V., and became the ultimate holding company of ICI Pakistan Limited. ICI Pakistan Limitedcontinues to be the direct subsidiary of ICI Omicron B.V.
4. Capital Reserves
Share premium - note 4.1 465,259 465,259Capital receipts - note 4.2 586 586
465,845 465,845
4.1 Share premium includes the premium amounting to Rs 0.902 million received on shares issued for the Company's PolyesterPlant installation in 1980 and share premium of Rs 464.357 million representing the difference between nominal value of Rs 10per share of 12,618,391 ordinary shares issued by the Company and the market value of Rs 590.541 million of these sharescorresponding to 25% holding acquired in LOTTE Pakistan PTA Limited (formerly Pakistan PTA Limited), an ex-associate, atthe date of acquisition i.e. November 2, 2001 and the number of shares that have been issued were determined in accordancewith the Scheme in the ratio between market value of the shares of two companies based on the mean of the middle marketquotation of the Karachi Stock Exchange over the ten trading days between October 22, 2001 to November 2, 2001.
4.2 Capital receipts represent the amount received from various ICI PLC group companies overseas for the purchase of property,plant and equipment. The remitting companies have no claim to their repayments.
5. Surplus on Revaluation of Property, Plant and Equipment
Balance as on January 1 962,795 1,012,167
Less: Transfer to unappropriated profit in respect of incremental depreciation charged during the year net of deferred tax (30,949) (49,372)
Balance as on December 31 931,846 962,795
Amounts in Rs '000

Annual Report 2009
71
Notes to the Financial StatementsFor the year ended December 31, 2009
6. Provisions for non-management staff gratuity and eligible retired employees' medical scheme - note 6.1 183,019 142,250
6.1 Staff Retirement Benefits2009 2008
Funded Unfunded Funded UnfundedPension Gratuity Total Pension Gratuity Total
6.1.1 The amounts recognised in the profit and loss account against defined benefit schemes are as follows:
Current service cost 24,526 26,223 50,749 7,535 27,894 25,302 53,196 5,813Interest cost 153,634 62,926 216,560 41,173 102,880 39,967 142,847 22,172Expected return on plan assets (98,449) (31,903) (130,352) - (92,075) (30,167) (122,242) -Termination cost 13,043 - 13,043 - - - - -Past service cost - - - - (69,114) - (69,114) -Recognition of actuarial loss 101,997 13,582 115,579 7,300 18,053 8,414 26,467 5,742
Net Charge / (Surplus) for the year 194,751 70,828 265,579 56,008 (12,362) 43,516 31,154 33,727
6.1.2 Movements in the net asset / (liability) recognised in the balance sheet are as follows:
Opening balance 238,716 62,148 300,864 (142,489) 190,191 18,771 208,962 (119,809)Net (Charge) / Surplus for the year - note 6.1.1 (194,751) (70,828) (265,579) (56,008) 12,362 (43,516) (31,154) (33,727)Contributions / payments during the year 275,472 42,547 318,019 15,239 36,163 86,893 123,056 11,047
Closing balance 319,437 33,867 353,304 (183,258)* 238,716 62,148 300,864 (142,489)*
6.1.3 The amounts recognised in the balance sheet are as follows:
Fair value of plan assets - note 6.1.5 1,037,319 317,150 1,354,469 - 815,658 310,404 1,126,062 -Present value of defined benefit obligation - note 6.1.4 (1,285,827) (462,971) (1,748,798) (340,084) (1,117,525) (442,477) (1,560,002) (259,784)(Deficit) (248,508) (145,821) (394,329) (340,084) (301,867) (132,073) (433,940) (259,784)Unrecognised actuarial loss 567,945 179,688 747,633 156,826 540,583 194,221 734,804 117,295
Recognised asset / (liability) 319,437 33,867 353,304 (183,258) 238,716 62,148 300,864 (142,489)
6.1.4 Movement in the present value of defined benefit obligation:
Opening balance 1,117,525 442,477 1,560,002 259,784 977,855 373,060 1,350,915 204,472Current service cost 24,526 26,223 50,749 7,535 27,894 25,302 53,196 5,813Interest cost 153,634 62,926 216,560 41,173 102,880 39,967 142,847 22,172Benefits paid (286,286) (103,768) (390,054) (15,239) (92,439) (38,789) (131,228) (11,047)Termination cost 13,043 - 13,043 - - - - -Past service cost - note 6.1.8 - - - - (69,114) - (69,114) -Actuarial loss 263,385 35,113 298,498 46,831 170,449 42,937 213,386 38,374Present value of the defined benefit obligation at the end of the year 1,285,827 462,971 1,748,798 340,084 1,117,525 442,477 1,560,002 259,784
6.1.5 Movement in the fair value of plan assets:
Opening balance 815,658 310,404 1,126,062 - 1,038,068 274,870 1,312,938 -Expected return 98,449 31,903 130,352 - 92,075 30,167 122,242 -Contributions 275,472 42,547 318,019 - 36,163 86,893 123,056 -Benefits paid (286,286) (103,768) (390,054) - (92,439) (38,789) (131,228) -Actuarial gain / (loss) 134,026 36,064 170,090 - (258,209) (42,737) (300,946) -Fair value of plan assets at the end of the year 1,037,319 317,150 1,354,469 - 815,658 310,404 1,126,062 -
6.1.6 Historical information
As at December 31 2009 2008 2007 2006 2005Present Value of defined benefit obligation 2,088,882 1,819,786 1,555,387 1,236,483 1,199,351Fair value of plan assets 1,354,469 1,126,062 1,312,938 1,067,109 1,014,442Deficit 734,413 693,724 242,449 169,374 184,909
Experience adjustments on plan liabilities 3% 13% 16% 1% 8%Experience adjustments on plan assets 13% (27%) 7% (9%) 7%
6.1.7 Major categories / composition of plan assets are as follows: 2009 2008
Debt instruments 50% 20%Equity 32% 20%Cash 18% 60%
* The unfunded liability included in the above table includes Rs 0.239 million (2008: Rs 0.239 million) pertaining to ICI Pakistan PowerGen Limited.
These figures are based on the latest actuarial valuation, as at December 31, 2009. The valuation uses the Projected Unit Credit method. Actuarial gains andlosses are amortised over the expected future service life of current members.
Mortality of active employees and pensioners have been amended as 70 % of the EFU (61-66) Table (i.e.in 2008 valuation assumed mortality representedby EFU (61-66) Table).The table has been rated down three years for mortality of female pensioners and widows.
The return on plan assets was assumed to equal the discount rate. Actual (loss) / return on plan assets during 2009 was Rs 300.442 million (2008: Rs 178.704 million).
Amounts in Rs '000
2009 2008

Annual Report 2009
72
Notes to the Financial StatementsFor the year ended December 31, 2009
6.1.8 Past service cost reflects a revision in the conversion factor for commutation of pension to lump sums.
6.1.9 The principal actuarial assumptions at the reporting date were as follows:
2009 2008
Discount rate 12.75% 16.00%Expected return on plan assets 12.75% 16.00%Future salary increases 10.60% 13.79%Future pension increases 7.38% 10.48%
6.1.10 Medical cost trend is assumed to follow inflation. The sensitivity to reflect the effect of a 1% movement in the assumedmedical cost trend were as follows:
2009 Increase Decrease
Effect on the aggregate of the current service cost and interest cost 28,909 4,624 (3,385)Effect on the defined benefit obligation 257,794 40,233 (32,763)
6.1.11 The Company contributed Rs 55.553 million (2008: Rs 49.339 million) and Rs 29.321 million (2008: Rs 23.509 million) tothe provident fund and the defined contribution superannuation fund respectively during the year.
2009 2008 Restated
7. Deferred Tax (Liability) / Asset Opening (Charge) / Closing Opening (Charge) / Closingreversal reversal
Deductible temporary differencesTax losses carried forward 272,421 (272,421) - 1,293,899 (1,021,478) 272,421
Provisions for retirement benefits, doubtful debts and others 355,745 (19,424) 336,321 181,089 174,656 355,745
Taxable temporary differencesProperty, plant and equipment (1,098,870) (262,549) (1,361,419) (1,104,582) 5,712 (1,098,870)
(470,704) (554,394) (1,025,098) 370,406 (841,110) (470,704)
8. Trade and Other Payables 2009 2008 Restated
Trade creditors - note 8.1 963,992 1,189,743Bills payable 2,270,321 687,699Sales tax, excise and custom duties 177,618 118,476Mark-up accrued on short term financing - 8,979Accrued interest / return on unsecured loan - note 8.2 299,647 281,081Accrued expenses 1,150,995 959,057Technical service fee / Royalty 35,975 29,382Workers' profit participation fund - note 8.3 164,599 148,214Workers' welfare fund 119,760 155,998Distributors' security deposits - payable on termination of distributorship - note 8.4 71,993 55,222Contractors' earnest / retention money 10,103 9,680Advances from customers 248,727 362,902Unclaimed dividends 4,548 4,549Payable for capital expenditure 136,810 217,028Provision for compensated absences - note 8.5 20,000 20,000Others 124,810 198,800
5,799,898 4,446,810
Amounts in Rs '000

Annual Report 2009
73
Notes to the Financial StatementsFor the year ended December 31, 2009
Amounts in Rs '000
2009 2008 Restated
8.1 The above balances include amounts due to following associated undertakings:
LOTTE Pakistan PTA Limited (formerly Pakistan PTA Limited) - note 8.1.1 - 342,989ICI Paints UK (part of AkzoNobel group) 6,911 6,434ICI Paints (Asia Pacific) PTE Ltd (part of AkzoNobel group) 26,105 9,548AkzoNobel Paints Malaysia 3,392 1,882Marine Protective International Coating Malaysia 1,400 -ICI Paints Indonesia (part of AkzoNobel group) 101 95CR Netherlands 5,339 40,100
43,248 401,048
8.1.1 This Company was part of AkzoNobel group till September 17, 2009.
8.2 This represents amount payable to Mortar Investments International Limited.
8.3 Workers' profit participation fund
Balance as on January 1 148,214 147,360Allocation for the year - note 29 161,822 147,873
310,036 295,233Interest on funds utilised in the Company'sbusinesses at 41.25 percent (2008: 41.25 percent) per annum - note 28 2,105 3,637
312,141 298,870Less: - Amount paid on behalf of the Fund 72,260 53,927 - Deposited with the Government of Pakistan 75,282 96,729
147,542 150,656
Balance as on December 31 164,599 148,214
8.4 Interest on security deposits from certain distributors is payable at 7.5 percent (2008: 7.5 percent) per annum as specifiedin the respective agreements.
8.5 This figure is based on the latest actuarial valuation, as at December 31, 2009.

Notes to the Financial StatementsFor the year ended December 31, 2009
Annual Report 2009
74
9. Contingencies and Commitments
9.1 Claims against the Company not acknowledged as debts are as follows:
Local bodies 14,631 14,531Sales Tax authorities 93,323 92,844Others 53,396 87,844
161,350 195,219
9.2 A notice has been issued by the Environmental Protection Authority (EPA) against the Paints factory located at Ferozpurroad, Lahore. Pursuant to this an order has been passed by the EPA for asserted violation of certain provisions of the act.The Company has filed an appeal against the order in the Environmental Tribunal in Lahore and is of the opinion that theorder is not justified.
9.3 Guarantees issued by the Company in respect of financial and operational obligations of LOTTE Pakistan PTA Limited(formerly Pakistan PTA Limited) pursuant to the Scheme of arrangement, amounting to Rs 2,280 million (2008: Rs 2,370million) against which LOTTE Pakistan PTA Limited (formerly Pakistan PTA Limited) and KP Chemical Corporation Limitedhas issued counter guarantees to the Company.
9.4 Guarantee issued by the Company to a bank in respect of financing obtained by Senior Executives amounted to Rs 35million (2008: Rs 48 million), in accordance with the terms of employment.
9.5 Guarantee issued by the Company of Rs 133 million (2008: Rs 133 million) to a bank on behalf of its subsidiary ICI PakistanPowerGen Limited for availing funded facility.
9.6 Commitments in respect of capital expenditure amounted to Rs 23.875 million (2008: Rs 149.29 million).
9.7 Commitments for rentals under operating lease/Ijarah contracts in respect of vehicles amounting to Rs 195.166 million(2008: Rs 147.823 million) are as follows:
Year
2009 - 59,4802010 66,746 52,3832011 58,165 27,4182012 45,305 8,542 2013 23,680 -2014 1,270 -
195,166 147,823
Payable not later than one year 66,746 59,480Payable later than one year but not later than five years 128,420 88,343
195,166 147,823
9.8 Outstanding foreign exchange contracts as at December 31, 2009 entered into by the Company to hedge the anticipatedfuture transactions amounted to Rs Nil (2008: Rs 54.841 million).
2009 2008
Amounts in Rs '000
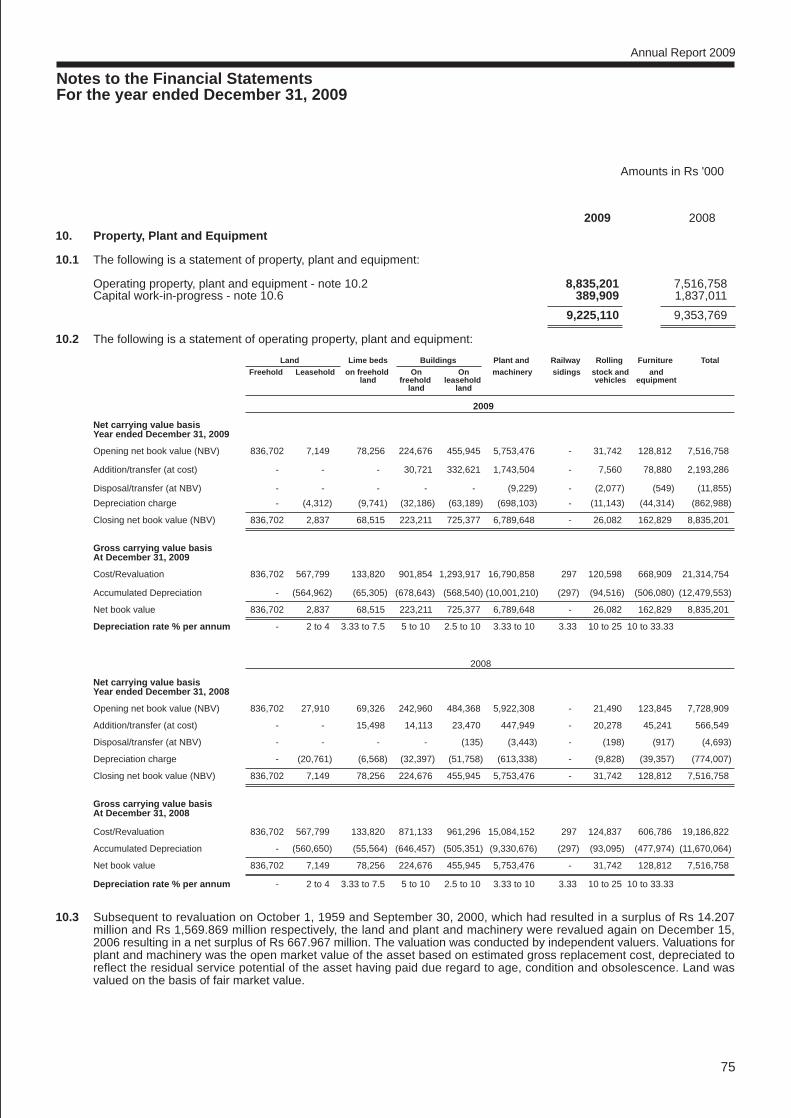
Notes to the Financial StatementsFor the year ended December 31, 2009
Annual Report 2009
75
10. Property, Plant and Equipment
10.1 The following is a statement of property, plant and equipment:
Operating property, plant and equipment - note 10.2 8,835,201 7,516,758Capital work-in-progress - note 10.6 389,909 1,837,011
9,225,110 9,353,769
10.2 The following is a statement of operating property, plant and equipment:
Land Lime beds Buildings Plant and Railway Rolling Furniture TotalFreehold Leasehold on freehold On On machinery sidings stock and and
land freehold leasehold vehicles equipmentland land
2009
Net carrying value basisYear ended December 31, 2009
Opening net book value (NBV) 836,702 7,149 78,256 224,676 455,945 5,753,476 - 31,742 128,812 7,516,758
Addition/transfer (at cost) - - - 30,721 332,621 1,743,504 - 7,560 78,880 2,193,286
Disposal/transfer (at NBV) - - - - - (9,229) - (2,077) (549) (11,855)
Depreciation charge - (4,312) (9,741) (32,186) (63,189) (698,103) - (11,143) (44,314) (862,988)
Closing net book value (NBV) 836,702 2,837 68,515 223,211 725,377 6,789,648 - 26,082 162,829 8,835,201
Gross carrying value basisAt December 31, 2009
Cost/Revaluation 836,702 567,799 133,820 901,854 1,293,917 16,790,858 297 120,598 668,909 21,314,754
Accumulated Depreciation - (564,962) (65,305) (678,643) (568,540) (10,001,210) (297) (94,516) (506,080) (12,479,553)
Net book value 836,702 2,837 68,515 223,211 725,377 6,789,648 - 26,082 162,829 8,835,201
Depreciation rate % per annum - 2 to 4 3.33 to 7.5 5 to 10 2.5 to 10 3.33 to 10 3.33 10 to 25 10 to 33.33
2008
Net carrying value basisYear ended December 31, 2008
Opening net book value (NBV) 836,702 27,910 69,326 242,960 484,368 5,922,308 - 21,490 123,845 7,728,909
Addition/transfer (at cost) - - 15,498 14,113 23,470 447,949 - 20,278 45,241 566,549
Disposal/transfer (at NBV) - - - - (135) (3,443) - (198) (917) (4,693)
Depreciation charge - (20,761) (6,568) (32,397) (51,758) (613,338) - (9,828) (39,357) (774,007)
Closing net book value (NBV) 836,702 7,149 78,256 224,676 455,945 5,753,476 - 31,742 128,812 7,516,758
Gross carrying value basisAt December 31, 2008
Cost/Revaluation 836,702 567,799 133,820 871,133 961,296 15,084,152 297 124,837 606,786 19,186,822
Accumulated Depreciation - (560,650) (55,564) (646,457) (505,351) (9,330,676) (297) (93,095) (477,974) (11,670,064)
Net book value 836,702 7,149 78,256 224,676 455,945 5,753,476 - 31,742 128,812 7,516,758
Depreciation rate % per annum - 2 to 4 3.33 to 7.5 5 to 10 2.5 to 10 3.33 to 10 3.33 10 to 25 10 to 33.33
10.3 Subsequent to revaluation on October 1, 1959 and September 30, 2000, which had resulted in a surplus of Rs 14.207million and Rs 1,569.869 million respectively, the land and plant and machinery were revalued again on December 15,2006 resulting in a net surplus of Rs 667.967 million. The valuation was conducted by independent valuers. Valuations forplant and machinery was the open market value of the asset based on estimated gross replacement cost, depreciated toreflect the residual service potential of the asset having paid due regard to age, condition and obsolescence. Land wasvalued on the basis of fair market value.
Amounts in Rs '000
2009 2008

10.4 Had there been no revaluation, the net book value of specific classes of operating property, plant and equipment wouldhave amounted to:
Net Book Value 2009 2008
Freehold land 20,929 20,929Leasehold land - 15Plant and machinery 6,575,035 5,538,264Rolling stock and vehicles 26,082 31,742Furniture and equipment 162,829 128,812
6,784,875 5,719,762
10.5 The depreciation charge for the year has been allocated as follows:
Cost of sales - note 25 815,543 733,896Selling and distribution expenses - note 26 12,726 11,744Administration and general expenses - note 27 34,719 28,367
862,988 774,007
10.6 The following is a statement of capital work-in-progress:
Designing, consultancy and engineering fee - 49,782Civil works and buildings 50,634 274,207Plant and machinery 183,965 1,300,228Miscellaneous equipment 33,664 125,227Advances to suppliers / contractors 121,646 87,567
389,909 1,837,011
10.7 Details of operating property, plant and equipment disposals having net book value in excess of Rs 50,000 are as follows:
2009 Mode of sale Cost Accumulated Net book Sale Particulars of buyers depreciation value proceedsPlant and machinery
Dust extraction unit and other items Auction 28,576 23,089 5,487 3,338 Hi-Tech Electronics & Machinery, Karachi
Tinting Machines Negotiation 4,429 710 3,719 3,719 Jaffer and Sons., Chaudhry Paint House, Color Bankand Awan Brothers, Lahore
Rolling stock and vehicles
Toyota Corolla - 2 nos Negotiation 1,481 734 747 2,088 Tufail Iqbal & M Inam, Lahore
Hino Dump Trucks Auction 8,808 7,519 1,289 1,902 Hi-Tech Electronics & Machinery, Karachi
2008
BuildingCorroded pipes in plant and steel Negotiation 336 201 135 130 Shahbaz & Company, Malakwal
Plant and machineryCables and switch Tender 912 508 404 866 Sheikh Khalil Ahmed, LahoreChain conveyer / Agitator tubes Negotiation 12,373 9,604 2,769 1,150 Shahbaz & Company, MalakwalVarious items Negotiation 405 210 195 961 ICI Pakistan PowerGen Limited
Rolling stock and vehiclesToyota Corolla Negotiation 59 - 59 785 Bilal Saeed, LahoreSuzuki Potohar Auction 221 156 65 307 Abdul Qadir, Lahore
Furniture and equipmentMultimedia Negotiation 213 90 123 20 KBS Enterprises, KarachiMultimedia Negotiation 109 31 78 20 General Traders, KarachiFurniture Auction 311 143 168 40 Irfan Traders, Lahore Air conditioners Negotiation 275 156 119 75 Shahbaz & Company, MalakwalComputers and servers Negotiation 172 108 64 50 Mega Computer, Lahore
Notes to the Financial StatementsFor the year ended December 31, 2009
Annual Report 2009
76
Amounts in Rs '000

11. Intangible Asset - SAP
Net carrying value basisYear ended December 31
Opening net book value (NBV) 7,700 39,737Amortisation charge (7,700) (32,037)
Closing net book value (NBV) - 7,700
Gross carrying amount At December 31Cost 168,781 168,781Accumulated amortisation (168,781) (161,081)
Net book value - 7,700
Rate of amortisation 20% 20%
11.1 The amortisation charge for the year has been allocated as follows:
Cost of sales - note 25 3,636 15,128Selling and distribution expenses - note 26 639 2,657Administration and general expenses - note 27 3,425 14,252
7,700 32,037
12. Long Term Investments - at cost
Unquoted Subsidiary- ICI Pakistan PowerGen Limited (wholly owned) - note 12.1 7,100,000 ordinary shares (2008: 7,100,000) of Rs 100 each 710,000 710,000
OthersEquity security available for sale
- Arabian Sea Country Club Limited 2,500 2,500
712,500 712,500
12.1 The value of the Company's investment on the basis of net assets of the Subsidiary as disclosed in the audited financialstatements for the year ended December 31, 2009 amounted to Rs. 258.426 million (2008: Rs 248.834 million).
13. Long-Term Loans - Considered good
Due from Subsidiary - Unsecured- Long term loan - note 13.1 200,000 200,000Due from Executives and Employees - note 13.2 130,801 130,605
330,801 330,605
13.1 This represents loan given to ICI Pakistan PowerGen Limited (wholly owned subsidiary) of Rs 200 million carrying mark-upat 3 months KIBOR + 2%. This loan is repayable in nine equal semi annual instalments commencing from October 1, 2011.
Notes to the Financial StatementsFor the year ended December 31, 2009
Annual Report 2009
77
Amounts in Rs '000
2009 2008

13.2 Due from Executives and EmployeesMotor car House Total Total
building
Due from Directors and Executives 74,647 47,109 121,756 102,117Less: Receivable within one year 9,965 15,154 25,119 22,630
64,682 31,955 96,637 79,487
Due from Employees 54,237 70,390Less: Receivable within one year 20,073 19,272
34,164 51,118
130,801 130,605
Outstanding for period:- less than three years but over one year 70,338 90,819- more than three years 60,463 39,786
130,801 130,605
13.3 Reconciliation of the carrying amount of loans to Directors and Executives:
Opening balance at beginning of the year 102,117 71,913Disbursements 79,293 84,345Repayments (59,654) (54,141)
Balance at end of the year 121,756 102,117
The loan to executive include an amount of Rs 1.595 million (2008: Rs 2.870 million) in respect of house building relatingto key management personnel. Loan outstanding during the year relates to Mr. Ali A. Aga (Director), who was providedthis loan as per his terms of employment.
13.4 Loans for purchase of motor cars and house building are repayable between two to ten years. These loans are interestfree and granted to the employees including executives of the Company in accordance with their terms of employment.
13.5 The maximum aggregate amount of long-term loans due from the Executives at the end of any month during the year wasRs 125.362 million (2008: Rs 102.117 million).
14. Long-Term Deposits and Prepayments
Deposits 21,211 22,291Prepayments 7,867 8,393
29,078 30,684
15. Stores and Spares
Stores (include in-transit Rs 11.688 million; 2008: Rs 13.271 million) 37,613 47,279Spares 493,799 519,154Consumables 76,660 76,768
608,072 643,201
Less: Provision for slow moving and obsolete items 111,671 104,661
496,401 538,540
15.1 Movement of provision in stores and spares
Provision as at January 1 104,661 55,661Charge for the year - note 27 40,000 49,000Write-off (32,990) -
Provision as at December 31 111,671 104,661
Notes to the Financial StatementsFor the year ended December 31, 2009
Annual Report 2009
78
Amounts in Rs '000
2009 2008

Notes to the Financial StatementsFor the year ended December 31, 2009
Annual Report 2009
79
16. Stock-in-Trade
Raw and packing material (include in-transit Rs 219.873 million; 1,282,701 1,489,937 2008: Rs 386.240 million)
Work-in-process 83,229 134,237
Finished goods (include in-transit Rs 9.23 million; 2008: nil) 1,997,408 1,441,647
3,363,338 3,065,821Less: Provision for slow moving and obsolete stock- Raw material 63,944 67,435- Finished goods 54,869 46,430
118,813 113,865
3,244,525 2,951,956
16.1 Movement of provision in stock-in-trade
Provision as at January 1 113,865 117,732Charge for the year - note 27 38,617 108,407Reversal (5,000) -Write-off (28,669) (112,274)
Provision as at December 31 118,813 113,865
Stock amounting to Rs 18.663 million (2008: Rs 392.2 million) are measured at net realisable value and has been writtendown by Rs 1.62 million (2008: Rs 61.6 million) to arrive at its net realiseable value.
17. Trade Debts
Considered good
- Secured 356,608 305,110- Unsecured 812,677 927,897
1,169,285 1,233,007Considered doubtful 277,631 193,363
1,446,916 1,426,370Less: Provision for:- Doubtful debts 277,631 193,363- Discounts 249,822 426,395
527,453 619,758
919,463 806,61218. Loans and Advances
Considered good
Loans due from:Directors and Executives - note 13.2 25,119 22,630Employees - note 13.2 20,073 19,272Subsidiary - unsecured - note 18.1 283,000 96,000
328,192 137,902Advances to:
Directors and Executives - note 18.2 6,012 5,530Employees 6,626 5,174Contractors and suppliers 60,355 41,561Others 5,554 3,087
78,547 55,352
406,739 193,254Considered doubtful 8,120 8,120
414,859 201,374Less: Provision for doubtful loans and advances 8,120 8,120
406,739 193,254
Amounts in Rs '000
2009 2008 Restated

18.1 A standby finance facility of Rs 300 million (2008: Rs 100 million short term loan) is provided to ICI Pakistan PowerGenLimited (wholly owned subsidiary) repayable on demand at a markup rate of 3 months Kibor + 1.65% (2008: Rs 6 monthsKibor + 3%). The amount utilized under this facility as at December 31, 2009 amounted to Rs. 283 million (2008: Rs. nil).
18.2 The maximum aggregate amount of advances due from the Directors and Executives at the end of any month during theyear was Rs 3.967 million and Rs 4.446 million (2008: Rs 2.620 million and Rs 15.056 million) respectively.
19. Trade Deposits and Short-Term Prepayments 2009 2008
Trade deposits 21,700 24,159Short-term prepayments 430,738 380,503
452,438 404,66220. Other Receivables
Considered good
Duties, sales tax and octroi refunds due 212,244 260,181Due from Associate - note 20.1 & 20.2 85,225 67,582Insurance claims 11,887 23,360Commission receivable 39,829 18,159Interest income receivable from subsidiary 16,233 13,815Interest income receivable 4,058 -Rebates receivable 123,427 194,522Others 184,208 171,769
677,111 749,388
Considered doubtful 17,383 17,533
694,494 766,921
Less: Provision for doubtful receivables - note 20.3 17,383 17,533
677,111 749,388
20.1 The maximum aggregate amount due from ICI Omicron B.V. at the end of any month during the year was Rs 81.978 million(2008: Rs 67.582 million).
20.2 The above balances include amounts due from following associated undertakings:
ICI Omicron B.V. wholly owned subsidiary of AkzoNobel N.V. 80,420 67,582ICI Paints Vietnam ( Part of AkzoNobel group ) 4,805 -
85,225 67,582
20.3 Movement of provision for doubtful receivables
Provision as at January 1 17,533 15,904Charge for the year - note 27 - 1,629Reversal (150) -
Provision as at December 31 17,383 17,533
21. Cash and Bank Balances
Short term deposits 3,350,000 120,000Current accounts 936,795 1,614,887In hand - Cheques 169,633 221,248 - Cash 11,823 14,946
4,468,251 1,971,08122. Short-Term Financing
22.1 Running financeThe facilities for running finance available from various banks amounted to Rs 2,691 million (2008: Rs 2,571 million) andcarried mark-up during the period ranging from 12.64 to 17.37 percent per annum (2008: 15.22 to 17.59 percent per annum).The facilities are secured by hypothecation charge over the present and future stock-in-trade and book debts of the Companyand first pari passu charge over plant and machinery of Polyester Business of the Company. No such facility was utilisedas at December 31, 2009.
22.2 Term financeThe facilities for term finance available from various banks amount to Rs nil (2008: Rs 550 million).
Notes to the Financial StatementsFor the year ended December 31, 2009
Annual Report 2009
80
Amounts in Rs '000

Notes to the Financial StatementsFor the year ended December 31, 2009
Annual Report 2009
81
23. Operating ResultsPolyester Soda Ash Paints Life Sciences Chemicals Company Company
Note 2009 2008 2009 2008 2009 2008 2009 2008 2009 2008 2009 2008 Restated Restated
SalesAfghanistan - - - - 88,800 82,000 - - - - 88,800 82,000Bangladesh - - 86,476 46,685 - - - - 6,888 13,313 93,364 59,998India - - 27,882 - - - - - - - 27,882 -South Africa - - 76,605 - - - - - - - 76,605 -United Arab
Emirates - - 16,556 35,354 - - - - 158 - 16,714 35,354Others - - 3,989 - - 11,900 810 691 18,055 6,910 22,854 19,501
- - 211,508 82,039 88,800 93,900 810 691 25,101 20,223 326,219 196,853Inter-segment - - - - - - - - 276,573 569,840 276,573 569,840
Local 13,242,345 12,187,914 6,360,285 6,428,445 6,136,722 7,114,309 3,740,030 3,373,373 2,508,705 2,530,635 31,988,087 31,634,676
13,242,345 12,187,914 6,571,793 6,510,484 6,225,522 7,208,209 3,740,840 3,374,064 2,810,379 3,120,698 32,590,879 32,401,369
Commission / Toll income - 4,490 - - - - - - 84,875 85,854 84,875 90,344
Turnover 13,242,345 12,192,404 6,571,793 6,510,484 6,225,522 7,208,209 3,740,840 3,374,064 2,895,254 3,206,552 32,675,754 32,491,713
Sales tax - - 1,073,105 1,064,410 811,979 905,199 - - 272,088 251,467 2,157,172 2,221,076Excise Duty - - 52,328 53,109 49,947 57,149 - - 7,010 6,080 109,285 116,338Commission and discounts to distributors and customers 44,517 54,254 107,539 126,512 1,006,822 1,121,653 374,927 360,139 169,022 122,986 1,702,827 1,785,544
44,517 54,254 1,232,972 1,244,031 1,868,748 2,084,001 374,927 360,139 448,120 380,533 3,969,284 4,122,958Net sales, commission & toll income 13,197,828 12,138,150 5,338,821 5,266,453 4,356,774 5,124,208 3,365,913 3,013,925 2,447,134 2,826,019 28,706,470 28,368,755
Cost of sales 25 11,794,598 11,155,231 3,896,339 3,716,355 2,986,743 3,695,790 2,383,614 1,983,934 1,969,284 2,321,668 23,030,578 22,872,978
Gross profit 1,403,230 982,919 1,442,482 1,550,098 1,370,031 1,428,418 982,299 1,029,991 477,850 504,351 5,675,892 5,495,777
Selling and distribution expenses 26 75,236 54,738 112,223 83,807 725,114 650,223 424,700 410,673 132,901 117,817 1,470,174 1,317,258
Administration and general expenses 27 239,111 196,463 291,821 253,314 381,949 444,863 137,107 130,420 128,076 101,099 1,178,064 1,126,159
Operating result 1,088,883 731,718 1,038,438 1,212,977 262,968 333,332 420,492 488,898 216,873 285,435 3,027,654 3,052,360
23.1 Segment assets 6,262,004 6,221,622 6,042,615 6,398,339 2,317,535 2,654,665 1,429,433 1,047,091 767,910 828,952 16,819,497 17,150,669
23.2 Unallocated assets 4,603,160 1,320,016
21,422,657 18,470,685
23.3 Segment liabilities 2,297,646 1,053,424 1,998,609 1,506,505 753,310 1,135,559 1,331,383 763,269 322,872 301,285 6,703,820 4,760,042
23.4 Unallocated liabilities 304,195 299,722
7,008,015 5,059,764 23.5 Non-cash items
(Provision for non-management staff gratuity and eligible retired employees' medical scheme) 10,249 5,718 27,052 17,493 8,121 4,710 5,041 2,691 5,545 3,028 56,008 33,640
23.6 Depreciation & amortisation 326,976 350,285 436,885 361,614 72,376 59,135 14,507 16,013 19,944 18,997 870,688 806,044
23.7 Capital expenditure 83,573 100,971 461,508 1,386,174 148,599 68,111 16,489 17,416 36,015 53,061 746,184 1,625,733
23.8 Inter-segment pricingTransactions among the business segments are recorded at arm's length prices using admissible valuation methods.
23.9 There were no major customer’s of the Company which formed 10 per cent or more of the Company's revenue.
Amounts in Rs '000

24. Reconciliations of reportable segment turnover, cost of sales, assets and liabilities
24.1 Turnover
Total turnover for reportable segments - note 23 32,675,754 32,491,713
Elimination of inter-segment turnover (276,573) (569,840)
Total turnover 32,399,181 31,921,873
24.2 Cost of sales
Total cost of sales for reportable segments - note 25 23,030,578 22,872,978
Elimination of inter-segment revenue (276,573) (569,840)
Total cost of sales 22,754,005 22,303,138
24.3 Assets
Total assets for reportable segments 16,819,497 17,150,669
Taxation recoverable 460,240 419,934
Bank deposits - note 21 3,350,000 120,000
Due from Associates - note 20.1 80,420 67,582
Long term Investments - note 12 712,500 712,500
Total assets 21,422,657 18,470,685
24.4 Liabilities
Total liabilities for reportable segments 6,703,820 4,760,042
Accrued interest / return on unsecured loan 299,647 295,173
Unclaimed dividends - note 8 4,548 4,549
Total liabilities 7,008,015 5,059,764
Notes to the Financial StatementsFor the year ended December 31, 2009
Annual Report 2009
82
Amounts in Rs '000
2009 2008
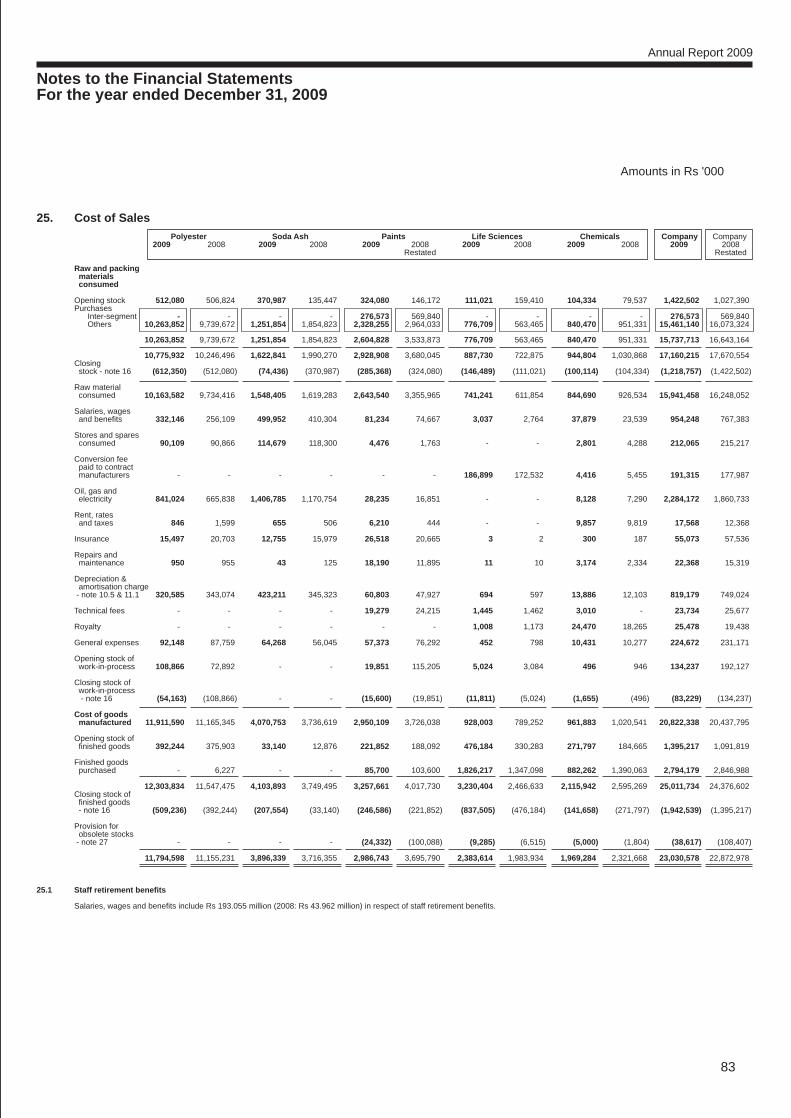
25. Cost of SalesPolyester Soda Ash Paints Life Sciences Chemicals Company Company
2009 2008 2009 2008 2009 2008 2009 2008 2009 2008 2009 2008 Restated Restated
Raw and packing materials consumed
Opening stock 512,080 506,824 370,987 135,447 324,080 146,172 111,021 159,410 104,334 79,537 1,422,502 1,027,390Purchases Inter-segment - - - - 276,573 569,840 - - - - 276,573 569,840 Others 10,263,852 9,739,672 1,251,854 1,854,823 2,328,255 2,964,033 776,709 563,465 840,470 951,331 15,461,140 16,073,324
10,263,852 9,739,672 1,251,854 1,854,823 2,604,828 3,533,873 776,709 563,465 840,470 951,331 15,737,713 16,643,164
10,775,932 10,246,496 1,622,841 1,990,270 2,928,908 3,680,045 887,730 722,875 944,804 1,030,868 17,160,215 17,670,554Closing stock - note 16 (612,350) (512,080) (74,436) (370,987) (285,368) (324,080) (146,489) (111,021) (100,114) (104,334) (1,218,757) (1,422,502)
Raw material consumed 10,163,582 9,734,416 1,548,405 1,619,283 2,643,540 3,355,965 741,241 611,854 844,690 926,534 15,941,458 16,248,052
Salaries, wages and benefits 332,146 256,109 499,952 410,304 81,234 74,667 3,037 2,764 37,879 23,539 954,248 767,383
Stores and spares consumed 90,109 90,866 114,679 118,300 4,476 1,763 - - 2,801 4,288 212,065 215,217
Conversion fee paid to contract manufacturers - - - - - - 186,899 172,532 4,416 5,455 191,315 177,987
Oil, gas and electricity 841,024 665,838 1,406,785 1,170,754 28,235 16,851 - - 8,128 7,290 2,284,172 1,860,733
Rent, rates and taxes 846 1,599 655 506 6,210 444 - - 9,857 9,819 17,568 12,368
Insurance 15,497 20,703 12,755 15,979 26,518 20,665 3 2 300 187 55,073 57,536
Repairs and maintenance 950 955 43 125 18,190 11,895 11 10 3,174 2,334 22,368 15,319
Depreciation & amortisation charge - note 10.5 & 11.1 320,585 343,074 423,211 345,323 60,803 47,927 694 597 13,886 12,103 819,179 749,024
Technical fees - - - - 19,279 24,215 1,445 1,462 3,010 - 23,734 25,677
Royalty - - - - - - 1,008 1,173 24,470 18,265 25,478 19,438
General expenses 92,148 87,759 64,268 56,045 57,373 76,292 452 798 10,431 10,277 224,672 231,171
Opening stock of work-in-process 108,866 72,892 - - 19,851 115,205 5,024 3,084 496 946 134,237 192,127
Closing stock of work-in-process - note 16 (54,163) (108,866) - - (15,600) (19,851) (11,811) (5,024) (1,655) (496) (83,229) (134,237)
Cost of goods manufactured 11,911,590 11,165,345 4,070,753 3,736,619 2,950,109 3,726,038 928,003 789,252 961,883 1,020,541 20,822,338 20,437,795
Opening stock of finished goods 392,244 375,903 33,140 12,876 221,852 188,092 476,184 330,283 271,797 184,665 1,395,217 1,091,819
Finished goods purchased - 6,227 - - 85,700 103,600 1,826,217 1,347,098 882,262 1,390,063 2,794,179 2,846,988
12,303,834 11,547,475 4,103,893 3,749,495 3,257,661 4,017,730 3,230,404 2,466,633 2,115,942 2,595,269 25,011,734 24,376,602Closing stock of finished goods - note 16 (509,236) (392,244) (207,554) (33,140) (246,586) (221,852) (837,505) (476,184) (141,658) (271,797) (1,942,539) (1,395,217)
Provision for obsolete stocks - note 27 - - - - (24,332) (100,088) (9,285) (6,515) (5,000) (1,804) (38,617) (108,407)
11,794,598 11,155,231 3,896,339 3,716,355 2,986,743 3,695,790 2,383,614 1,983,934 1,969,284 2,321,668 23,030,578 22,872,978
25.1 Staff retirement benefits
Salaries, wages and benefits include Rs 193.055 million (2008: Rs 43.962 million) in respect of staff retirement benefits.
Notes to the Financial StatementsFor the year ended December 31, 2009
Annual Report 2009
83
Amounts in Rs '000

26. Selling and Distribution ExpensesPolyester Soda Ash Paints Life Sciences Chemicals Company Company
2009 2008 2009 2008 2009 2008 2009 2008 2009 2008 2009 2008 Restated Restated
Salaries and benefits 40,591 32,209 24,581 18,389 195,676 152,402 184,344 147,224 63,531 51,355 508,723 401,579
Repairs and maintenance 122 69 1,063 863 3,537 2,687 1,862 1,531 1,033 623 7,617 5,773
Advertising and sales promotion 15,480 1,064 896 1,251 262,189 244,830 64,513 90,357 987 2,091 344,065 339,593
Rent, rates and taxes - - 922 921 23,491 25,254 4,404 4,666 1,182 1,482 29,999 32,323
Insurance - - 434 914 - - 3,866 5,128 3,340 4,091 7,640 10,133
Lighting, heating and cooling 17 15 873 885 4,807 3,721 1,969 1,684 206 258 7,872 6,563
Depreciation & amortisation charge - note 10.5 & 11.1 59 248 327 209 - - 11,195 12,467 1,784 1,477 13,365 14,401
Outward freight and handling 7,078 7,515 69,972 48,363 172,953 159,682 22,395 23,071 28,089 21,610 300,487 260,241
Travelling expenses 3,206 5,081 1,882 1,308 30,588 31,951 63,407 65,509 11,567 13,317 110,650 117,166
Postage, telegram, telephone and telex 423 808 774 688 5,801 5,558 9,759 7,712 3,447 3,665 20,204 18,431
General expenses 8,260 7,729 10,499 10,016 26,072 24,138 56,986 51,324 17,735 17,848 119,552 111,055
75,236 54,738 112,223 83,807 725,114 650,223 424,700 410,673 132,901 117,817 1,470,174 1,317,258
26.1 Staff retirement benefitsSalaries, wages and benefits include Rs 67.593 million (2008: Rs 40.995 million) in respect of staff retirement benefits.
26.2 Severance costSalaries and benefits include Rs 4.677 million (2008: Rs nil ) in respect of severance cost.
27. Administration and General Expenses
Salaries and benefits 134,531 92,194 193,284 146,769 134,481 94,962 93,672 75,817 72,479 59,887 628,447 469,629
Repairs and maintenance 2,715 3,739 3,478 7,657 8,828 7,982 1,352 2,268 780 1,638 17,153 23,284
Advertising and publicity expenses 2,855 2,870 6,013 7,424 - - 1,134 1,357 1,452 1,543 11,454 13,194
Rent, rates and taxes 2,551 2,341 2,877 2,527 6,302 5,963 543 459 587 520 12,860 11,810
Insurance 552 687 1,454 1,975 7,438 578 2,137 3,399 316 436 11,897 7,075
Lighting, heating and cooling 3,172 2,650 5,273 4,521 3,518 2,903 3,590 3,219 1,077 953 16,630 14,246
Depreciation & amortisation charge - note 10.5 & 11.1 6,332 6,963 13,347 16,082 11,573 11,208 2,618 2,949 4,274 5,417 38,144 42,619
Provision for doubtful debts - trade 5,610 4,130 - - 69,040 60,046 7 627 641 - 75,298 64,803 - others - - - - - - - 1,629 - - - 1,629
Provision for obsolete stocks-Note 16.1 - - - - 24,332 100,088 9,285 6,515 5,000 1,804 38,617 108,407
Provision for obsolete spares-Note 15.1 40,000 45,000 - 4,000 - - - - - - 40,000 49,000
Travelling expenses 6,491 7,404 8,142 11,548 14,626 12,787 5,631 7,773 5,349 4,060 40,239 43,572
Postage, telegram, telephone and telex 1,337 1,070 2,149 2,085 8,999 13,997 2,516 2,042 1,148 1,014 16,149 20,208
General expenses 32,965 27,415 55,804 48,726 92,812 134,349 14,622 22,366 34,973 23,827 231,176 256,683
239,111 196,463 291,821 253,314 381,949 444,863 137,107 130,420 128,076 101,099 1,178,064 1,126,159
27.1 Staff retirement benefitsSalaries, wages and benefits include Rs 132.772 million (2008: Rs 52.685 million) in respect of staff retirement benefits.
27.2 Severance costSalaries and benefits include Rs 42.903 million (2008: Rs 6.531 million) in respect of severance cost.
Notes to the Financial StatementsFor the year ended December 31, 2009
Annual Report 2009
84
Amounts in Rs '000

Notes to the Financial StatementsFor the year ended December 31, 2009
Annual Report 2009
85
Amounts in Rs '000
28. Financial Charges
Mark-up on short-term financing 1,587 10,773Interest on workers' profit participation fund - note 8.3 2,105 3,637Discounting charges on receivables 82,383 104,195Exchange loss 74,454 92,634Interest on security deposits 2,043 3,914Others 4,969 4,155
167,541 219,308
29. Other Operating Charges
Auditors' remuneration - note 29.1 6,600 7,120Donations - note 29.2 16,464 21,650Workers' profit participation fund - note 8.3 161,822 147,873Workers' welfare fund 62,704 57,056
247,590 233,699
29.1 Auditors' remuneration
Audit and Group reporting fee 4,950 5,500Half yearly review and other certifications 1,015 900Out-of-pocket expenses 635 720
6,600 7,120
29.2 Donations include Rs 13.97 million (2008: Rs 13.4 million) to ICI Pakistan Foundation (Head office, Karachi) Mr. WaqarA Malik, Chief Executive; Mr. Ali Asrar Aga and Mr. Feroz Rizvi, Directors of the Company and Mr. Suhail Aslam Khan andMr. Nasir Jamal, Executives of the Company are amongst the Trustees of the Foundation.
30. Other Operating Income
Income from related partiesReturn on loan due from Subsidiary 60,629 39,305Service fees from related parties - note 30.1 4,636 8,482
Return from other financial assetsProfit on short-term and call deposits 167,995 90,107
Income from non-financial assetsScrap sales 56,988 43,212Gain on disposal of property, plant and equipment 5,293 7,437
OthersProvisions and accruals no longer required written back 104,768 2,602Income on technical assistance 244 1,396Income on sale of Adhesive to Henkel 14,662 -Sundries 44,768 20,884
459,983 213,425
30.1 This represents amount charged by the Company for certain management and other services rendered to its related parties(Lotte Pakistan PTA Limited (formerly Pakistan PTA Limited) and ICI Pakistan PowerGen Limited), in accordance with theService Agreements based on commercial terms between the companies.
2009 2008 Restated

31. Taxation
Current 490,813 102,838Prior years (17,439) 6,092
Total current tax charge 473,374 108,930Deferred - note 7 554,394 841,110
Net tax charged - note 31.1 1,027,768 950,040
31.1 Tax reconciliation
Profit for the year 3,072,506 2,812,778
Tax @ 35% 1,075,377 984,472Prior years' tax charge (17,439) 6,092Tax impact on income under FTR of the current year (40,712) (47,241)Permanent difference - Donations 5,762 7,578Other 4,780 (861)
1,027,768 950,040
32. Earnings per share - Basic and diluted
Profit after taxation for the year 2,044,738 1,862,738
Number of shares Weighted average number of ordinary shares in issue during the year 138,802,300 138,802,300
Rupees
Earnings per share 14.73 13.42
2009 2008 Restated
Notes to the Financial StatementsFor the year ended December 31, 2009
Annual Report 2009
86
Amounts in Rs '000
33. Remuneration of Directors and Executives
The aggregate amounts charged in the financial statements for the remuneration, including all benefits, to the Chairman,Chief Executive, Directors and Executives of the Company were as follows:
Chairman Chief Executive Directors Executives Total
2009 2008 2009 2008 2009 2008 2009 2008 2009 2008
Managerial remuneration 1,162 995 21,135 17,299 33,863 34,870 418,814 366,543 474,974 419,707Retirement benefits - - 5,321 4,474 7,383 7,622 107,981 94,817 120,685 106,913Group insurance - - 42 42 126 126 4,512 4,515 4,680 4,683Rent and house maintenance - - 5,268 5,600 - - 122,368 106,950 127,636 112,550Utilities - - 647 554 - - 30,310 26,639 30,957 27,193Medical expenses - - 203 180 419 454 15,410 15,281 16,032 15,915
1,162 995 32,616 28,149 41,791 43,072 699,395 614,745 774,964 686,961
Number of persons 1 1 1 1 5 5 328 282 335 289

Notes to the Financial StatementsFor the year ended December 31, 2009
Annual Report 2009
87
Amounts in Rs '000
33.1 In addition to this, an amount of Rs 209.8 million (2008: Rs 179 million) on account of variable pay has been recognisedin the current year. This amount is payable in 2010 after verification of achievements against target. Further, a long termbonus of Rs 28.9 million (2008: Rs 21 million) payable to certain employees has been recognised in the financial statementswhich is payable in 2010.
Out of variable pay recognised for 2008 and 2007 following payments were made:
Paid in 2009 Paid in 2008relating to 2008 relating to 2007
Chief Executive - note 33.1.1 11,765 11,859Directors 11,400 9,976Executives 92,752 100,326Other employees 37,131 24,030
153,048 146,191
33.1.1 Included in this is a one-off Rs nil (2008: 4.1million) profit growth bonus.
33.2 The Directors and certain Executives are provided with free use of Company cars in accordance with their entitlement. TheChief Executive is provided with Company owned and maintained furnished accommodation and free use of Company car.
33.3 Aggregate amount charged in the financial statements for remuneration to three Non-executive Directors was Rs 3.228million (2008: Rs 2.482 million). This includes fees paid to directors amounting to Rs. 0.249 million (2008: Rs. 0.221 million)for attending for board and other meetings.
33.4 The above balances include an amount of Rs 141.359 million (2008: Rs 165.8 million) on account of remuneration of keymanagement personnel out of which Rs 24.356 million (2008: Rs 19.896 million) relates to post employment benefits.
34. Transactions with Related Parties
The related parties comprise parent company (ICI Omicron B.V.), ultimate parent company (AkzoNobel N.V.), related groupcompanies, local associated company, directors of the Company, companies where directors also hold directorship, keyemployees (note 33) and staff retirement funds (note 6). Details of transactions with related parties, other than those whichhave been specifically disclosed elsewhere in these financial statements are as follows:
2009 2008Subsidiary Company
Purchase of goods, materials and services 676,003 452,449Provision of services and other receipts 1,980 1,980Return on loan to Subsidiary 60,629 39,305Loan to subsidiary company - (net of repayment) 96,000 176,000Standby finance facility availed by Subsidiary 283,000 -Investment - 130,000Sale of operating asset - 961
Associated companies
Purchase of goods, materials and services 5,750,335 7,609,047Provision of services and other receipts 6,440 6,502Sale of goods and materials 126,429 142,591Dividends 789,218 631,975Donations 13,970 13,400

Notes to the Financial StatementsFor the year ended December 31, 2009
Annual Report 2009
88
Amounts in Rs '000
35. Plant Capacity and Annual Production
- in metric tonnes except Paints which is in thousands of litres:
2009 2008
Annual Production Annual ProductionName Plate Name Plate
Capacity Capacity
Polyester 122,000 123,642 122,000 112,011Soda Ash - note 35.1 350,000 269,500 285,000 266,060Paints - note 35.2 - 33,741 - 43,305Chemicals - note 35.2 - 8,477 - 9,669Sodium Bicarbonate 20,000 22,580 20,000 21,850
35.1 Production was below name plate capacity due to gas curtailment and also in line with market demand
35.2 The capacity of Paints and Chemicals is indeterminable because these are multi-product plants.
36. Fair Value of Financial Assets and Liabilities
The carrying amounts of the financial assets and financial liabilities approximate their fair values.
37. Financial Risk Management
The Company's activities expose it to a variety of financial risks: market risk (including currency risk, interest rate risk andprice risk), credit risk and liquidity risk. The Company's overall risk management policy focuses on the unpredictability offinancial markets and seeks to minimize potential adverse effects on the Company's financial performance.
37.1 Risk Management Framework
The Board of Directors has overall responsibility for establishment and over sight of the Company's risk managementframework. The executives management team is responsible for developing and monitoring the Company’s risk managementpolicies. The team regularly meets and any changes and compliance issues are reported to the Board of Directors throughthe audit committee.
Risk management systems are reviewed regularly by the executive management team to reflect changes in market conditionsand the Company’s activities. The Company, through its training and management standards and procedures, aims todevelop a disciplined and constructive control environment in which all employees understand their roles and obligations.
The audit committee oversees compliance by management with the Company’s risk management policies and procedures,and reviews the adequacy of the risk management framework in relation to the risks faced by the Company.
38. Market Risk
Market risk is the risk that the fair value or future cash flows of a financial instrument will fluctuate because of changes inmarket prices. Market risk comprises three types of risk interest rate risk, currency risk, and other price risk.
38.1 Interest Rate Risk
Interest rate risk is the risk that the fair values of future cash flows of a financial instrument will fluctuate because of changesin market interest rates. At the reporting date the interest rate profile of Company's interest-bearing financial instruments was:
Carrying Amount
2009 2008
Fixed rate instrumentsFinancial assets - Note 21 3,350,000 120,000Financial liabilities - Note 8 (71,993) (55,222)
3,278,007 64,778
Variable rate instrumentsFinancial assets - Note 13 & 18 483,000 296,000

Notes to the Financial StatementsFor the year ended December 31, 2009
Annual Report 2009
89
Amounts in Rs '000
Sensitivity analysis for fixed rate instrumentsThe Company does not account for any fixed rate financial assets and liabilities at fair value through profit or loss, thereforea change in interest rates at the reporting date would not affect profit or loss.
Sensitivity analysis for variable rate instrumentsIf KIBOR had been 1% higher / lower with all other variables held constant, the impact on the profit after tax for the yearwould have been Rs 4.83 million (2008: Rs 2.96 million).
38.2 Foreign currency risk
Foreign currency risk is the risk that the fair value or future cash flows of a financial instrument will fluctuate because ofchanges in foreign exchange rates. Foreign currency risk arises mainly where receivables and payables exist due totransactions entered into foreign currencies. The Company is exposed to foreign currency risk on sales, purchases andborrowings, which, are entered in a currency other than Pak Rupees. However the forward foreign exchange contractswere not available in 2009 in accordance with State Bank of Pakistan instructions.
SGD EURO USD GBP JPY
2009
Trade debts - 2,800 11,667 - -Other receivables - - 123,427 - -Due from Associate - note 20.1 - - - 80,420 -Cash and bank balances - - 62,287 - -
- 2,800 197,381 80,420 -
Trade and other payables 30,824 62,986 1,692,533 511,236 5,293Accrued interest / return on unsecured loan - note 8.2 - - 299,647 - -
30,824 62,986 1,992,180 511,236 5,293
Gross balance sheet exposure (30,824) (60,186) (1,794,799) (430,816) (5,293)
2008
Trade debts - - 14,381 - -Other receivables - - 142,096 - -Due from Associate - note 20.1 - - - 67,582 -Cash and bank balances - - 31,554 - -
- - 188,031 67,582 -
Trade and other payables 4,668 6,605 904,727 200,622 Accrued interest / return on unsecured loan - note 8.2 - - 281,081 - -
4,668 6,605 1,185,808 200,622 -
Gross balance sheet exposure (4,668) (6,605) (997,777) (133,040) -
Significant exchange rates applied during the year were as follows:
Average rate for the year Spot rate as at December 31
2009 2008 2009 2008 Rupees Rupees
EURO 113.84 104.37 121.37 111.47USD 81.69 70.93 84.24 79.10GBP 127.85 130.67 137.81 114.71JPY 0.87 0.69 0.91 0.88SGD 56.52 50.25 60.06 54.94
Sensitivity analysis Every 1% increase or decrease in exchange rate with all other variables held constant will increase or decrease profit aftertax for the year by Rs 23.2 million (2008: Rs 11.4 million).

Notes to the Financial StatementsFor the year ended December 31, 2009
Annual Report 2009
Amounts in Rs '000
39. Credit Risk
Credit risk represents the accounting loss that would be recognised at the reporting date if counter-parties failed completelyto perform as contracted. The Company does not have significant exposure to any individual counterparty. To reduce exposureto credit risk the Company has developed a formal approval process whereby credit limits are applied to its customers. However,in Paints business reviewing to assign credit limits is in process which will be completed in the first quarter of 2010.Themanagement also continuously monitors the credit exposure towards the customers and makes provision against thosebalances considered doubtful of recovery. To mitigate the risk, the Company has a system of assigning credit limits to itscustomers based on an extensive evaluation based on customer profile and payment history. Outstanding customer receivablesare regularly monitored. Business with customers is also secured, where possible, by way of inland letters of credit.
The Company's gross maximum exposure to credit risk at the reporting date is as follows:2009 2008
Restated39.1 Financial Assets
Long term loans - note 13 330,801 330,605Long term deposits and prepayments - note 14 29,078 30,684Trade debts (gross) net of discount - note 17 1,197,094 999,975Loans and advances (gross) - note 18 414,859 201,374Trade deposits - note 19 21,700 24,159Other receivables - note 20 464,867 489,207Bank balances - note 21 4,456,428 1,956,135
6,914,827 4,032,139
39.2 The Company has placed its funds with banks which are rated A-1+ or above by PACRA / JCRVIS.
39.3 Financial Assets - Secured 565,182 511,387 - Unsecured 6,361,468 3,535,698
6,926,650 4,047,085
39.4 The ageing of bank balances, trade receivables and loans and advances (on gross basis) at the reporting date is as follows:
Not past due 5,461,849 2,541,315Past due but not Impaired: Not more than three months 281,317 390,278Past due and Impaired: more than three months and not more than six months 63,002 61,176 more than six months and not more than nine months 25,352 8,870 more than nine months and not more than one year 43,378 53 More than one year 193,483 155,792
606,532 616,169
6,068,381 3,157,484
39.5 The maximum exposure to credit risk for past due and impaired at the reporting date by type of counterparty was:
Wholesale customers 138,510 58,522Retail customers 284,408 345,308End-user customers 183,614 212,339
606,532 616,169
39.6 Movement of provision for trade receivables and loans and advances
Opening 201,483 143,520Additional provision 75,298 64,803Provision utilised against write offs 9,646 (6,388)Provision no longer required (676) (452)
285,751 201,483
39.6.1 The recommended approach for provision is to assess the top layer (covering 50%) of trade receivables on an individualbasis and apply a dynamic approach to the remainder of receivables. The procedure introduces a company-standard fordynamic provisioning:
• Provide impairment loss for 50% of the outstanding receivable when overdue more than 90 days, and • Provide an impairment loss for 100% when overdue more than 120 days
90

Notes to the Financial StatementsFor the year ended December 31, 2009
Annual Report 2009
91
Amounts in Rs '000
39.7 Concentration RiskThe sector wise analysis of receivables, comprising trade debts, loans and advances and bank balances excluding cashin hand are given below:
2009 2008
Textile 217,085 235,577Glass 22,679 12,371Ceramics 2,985 -Paper and Board 18,137 -Chemicals 232,624 142,781Pharmaceuticals 18,799 62,845Construction 31,972 -Transport 60,264 -Paints 516,308 504,346Bank 4,456,428 1,956,135Subsidiary 283,000 96,000Others 208,100 147,429
6,068,381 3,157,484
40. Liquidity RiskLiquidity Risk is the risk that an entity will encounter difficulty in meeting obligations associated with financial liabilities.Prudent liquidity risk management implies maintaining sufficient cash and marketable securities and the availability offunding through an adequate amount of committed credit facilities. Company treasury aims at maintaining flexibility infunding by keeping committed credit lines available.
The table below analyse the Company's financial liabilities into relevant maturity groupings based on the remaining periodat the balance sheet to the maturity date.
Carrying Contractual Less thanamount cash flows one year
2009Financial liabilitiesTrade creditors - note 8 963,992 963,992 (963,992)Bills payable - note 8 2,270,321 2,270,321 (2,270,321)Accrued interest / return on unsecured loan - note 8.2 299,647 299,647 (299,647)Accrued expenses - note 8 1,150,995 1,150,995 (1,150,995)Technical service fee / Royalty - note 8 35,975 35,975 (35,975)Distributors' security deposits - payable on termination of distributorship - note 8 & 8.4 71,993 77,392 (77,392)Contractors' earnest / retention money - note 8 10,103 10,103 (10,103)Unclaimed dividends - note 8 4,548 4,548 (4,548)Payable for capital expenditure - note 8 136,810 136,810 (136,810)Others - note 8 124,810 124,810 (124,810)
5,069,194 5,074,593 (5,074,593)
It is not expected that the cash flows included in the maturity analysis could occur significantly earlier or at significantlydifferent amount.
2008Financial liabilitiesTrade creditors - note 8 1,189,743 1,189,743 (1,189,743)Bills payable - note 8 687,699 687,699 (687,699)Mark-up accrued on short term financing - note 8 8,979 8,979 (8,979)Accrued interest / return on unsecured loan - note 8.2 281,081 281,081 (281,081)Accrued expenses - note 8 959,057 959,057 (959,057)Technical service fee / Royalty - note 8 29,382 29,382 (29,382)Distributors' security deposits - payable on termination of distributorship - note 8 & 8.4 55,222 59,364 (59,364)Contractors' earnest / retention money - note 8 9,680 9,680 (9,680)Unclaimed dividends - note 8 4,549 4,549 (4,549)Payable for capital expenditure - note 8 217,028 217,028 (217,028)Others - note 8 198,800 198,800 (198,800)
3,641,220 3,645,362 (3,645,362)

Notes to the Financial StatementsFor the year ended December 31, 2009
Annual Report 2009
92
Amounts in Rs '000
41. In April 2009 it was observed that certain isolated management practices and dealings at Decorative segment of the Paintsbusiness seemed to be at variance with the Company’s approved policies and procedures. This information was communicatedto the Board who immediately initiated a detailed review by the Company’s Internal Auditors Ernst & Young Ford RhodesSidat Hyder, Chartered Accountants. These practices mainly related to obligations and commitments made in the marketwhich were not properly recorded.
The detailed review by Ernst & Young Ford Rhodes Sidat Hyder, Chartered Accountants has been completed, the Board ofDirectors have decided to make a full provision in respect of these identified obligations. The amount has been accountedfor as given below in accordance with the IAS 8 “Accounting Policies, Changes in Accounting Estimates and Errors”.
41.1 The effect of retrospective restatement on profit and loss account is tabulated below:
2008
Increase in commission and discounts (165,000)Increase in selling and distribution expenses (72,500)Increase in administration and general expenses (62,500)
Decrease in operating results (300,000)Decrease in other operating income (41,000)Decrease in WPPF charge 17,050Decrease in WWF charge 6,820
Decrease in profit before tax (317,130)Decrease in income tax expense 110,996
Decrease in profit after tax (206,134)
(Rupees)Decrease in basic and diluted earnings per share (1.49)
41.2 The effect of retrospective restatement on Balance sheet for 2008 and 2007 is tabulated below:
2008 2007
Decrease in trade debts 197,000 32,000
Increase in deferred tax asset 126,946 15,950
Increase in trade and other payables 165,700 13,570
Decrease in unappropriated profit 235,754 29,620
41.3 Effect on unappropriated profit as at December 31:
Increase in commission and discounts (197,000) (32,000)Increase in administration and general expenses (62,500) -Increase in selling and distribution expenses (89,500) (17,000)
Decrease in operating results (349,000) (49,000)Decrease in other operating income (41,000) -Decrease in WPPF and WWF charge 27,300 3,430Decrease in income tax expense 126,946 15,950
Decrease in unappropriated profit (235,754) (29,620)
42. Capital Risk Management
The Company's objective when managing capital is to safe guard the Company's ability to continue as a going concernso that it can continue to provide returns for shareholders and benefits for other stakeholders; and to maintain a strongcapital base to support the sustained development of its businesses.
The Company manages its capital structure by monitoring return on net assets and makes adjustments to it in the light ofchanges in economic conditions. In order to maintain or adjust the capital structure, the Company may adjust the amountof dividend paid to shareholders or issue new shares.

Notes to the Financial StatementsFor the year ended December 31, 2009
Annual Report 2009
93
43. Accounting Estimates and Judgements
Income Taxes
The Company takes into account the current income tax law and decisions taken by appellate authorities. Instances wherethe Company's view differs from the view taken by the income tax department at the assessment stage and where theCompany considers that its view on items of material nature is in accordance with law, the amounts are shown as contingentliabilities (unless there is remote possibility of transfer of benefits).
The tax department reopened the income tax assessment for the assessment year 2001-2002 on the ground that demergerof PTA business from ICI Pakistan Ltd. was effective from the completion date i.e. August 6, 2001. This was challengedby the Company in the High Court which upheld the Company’s contention that the department did not have the right toreopen this finalized assessment. The department had however filed an appeal in the Supreme Court against the HighCourt’s order. The appeal was dismissed by the Supreme Court.
For the assessment year 2002-2003 on receipt of notice under section 62 of the Income Tax Ordinance, 1979, the Companyhad filed a writ petition in the Supreme Court challenging the tax department’s notice that the effective date of PTA’sdemerger was August 6, 2001 rather than the effective date given in the Scheme of Arrangement as October 1, 2000. Thatnotice had raised certain issues relating to vesting of PTA assets by the company which has been settled in the assessmentyear 2001-2002. While this case is pending for adjudication, in view of the Supreme Court's decision relating to assessmentyear 2001-2002 it is unlikely that the department can take an adverse action.
Whilst amending the assessment for the Tax Year 2003, tax department has taken certain action in the order, considered bythe department as “ protective assessment” on the matter of unabsorbed depreciation carried forward. It is the Company’scontention that such an action is unwarranted. An appeal before the CIT (Appeals), on the matter has been filed which ispending. The very basis of such an action has also been challenged before the High Court of Sindh which is pending forhearing. While this case is pending for adjudication, in view of the Supreme Court's decision relating to assessment year 2001-2002 it is unlikely that the department can take an adverse action.
The Income Tax Appellate Tribunal earlier set aside the assessment for the assessment year 1998-99 on the issues of dateof commissioning of PTA plant & depreciation thereon, restriction of cost of capitalization of PTA plant and addition to incomein respect of trial production stocks. The re-assessment was finalized by the department during the year giving rise to anadditional tax demand.
In appeal against the said order, after the action being maintained by the Commissioner of Income Tax - Appeals, theIncome Tax Appellate Tribunal has set aside the assessment order passed by the tax department for fresh adjudication.
Pension and Gratuity
Certain actuarial assumptions have been adopted as disclosed in note 6 to the financial statements for valuation of presentvalue of defined benefit obligations and fair value of plan assets. Any changes in these assumptions in future years mightaffect unrecognized gains and losses in those years.
Property, plant and equipment
The estimates for revalued amounts, if any, of different classes of property, plant and equipment, are based on valuationperformed by external professional valuers and recommendation of technical teams of the Company. The said recommendationsalso include estimates with respect to residual values and depreciable lives. Further, the Company reviews the value ofthe assets for possible impairment on an annual basis. The future cash flows used in the impairment testing of assets isbased on management's best estimates which may change in future periods. Any change in the estimates in future yearsmight affect the carrying amounts of the respective items of property, plant and equipments with a corresponding affecton the depreciation charge and impairment.
44. Standards or Interpretations not yet effective
The following standards, interpretations and amendments of approved accounting standards are effective for accountingperiods beginning from the dates specified below. These standards are either not relevant to the Company's operationsor are not expected to have significant impact on the Company's financial statements other than increase in disclosuresin certain cases:
Revised IFRS 3 Business Combinations (applicable for annual periods beginning on or after July 1, 2009) broadens amongother things the definition of business resulting in more acquisitions being treated as business combinations, contingentconsideration to be measured at fair value, transaction costs other than share and debt issue costs to be expensed, anypre-existing interest in an acquiree to be measured at fair value, with the related gain or loss recognised in profit or lossand any non-controlling (minority) interest to be measured at either fair value, or at its proportionate interest in the identifiableassets and liabilities of an acquiree, on a transaction-by- transaction basis. The application of this standard is not likely tohave an effect on the Company’s financial statements.

Notes to the Financial StatementsFor the year ended December 31, 2009
Annual Report 2009
94
Amended IAS 27 Consolidated and Separate Financial Statements (effective for annual periods beginning on or after July1, 2009) requires accounting for changes in ownership interest by the group in a subsidiary, while maintaining control, tobe recognized as an equity transaction. When the group loses control of subsidiary, any interest retained in the formersubsidiary will be measured at fair value with the gain or loss recognized in the profit or loss. The application of the standardis not likely to have an effect on the Company’s financial statements.
IFRIC 15- Agreement for the Construction of Real Estate (effective for annual periods beginning on or after October 1,2009) clarifies the recognition of revenue by real estate developers for sale of units, such as apartments or houses, 'off-plan', that is, before construction is complete. The amendment is not relevant to the Company’s operations.
Amendments to IAS 39 Financial Instruments: Recognition and Measurement – Eligible Hedged Items (effective for annualperiods beginning on or after July 1, 2009) clarifies the application of existing principles that determine whether specificrisks or portions of cash flows are eligible for designation in a hedging relationship. The amendment is not likely to havean effect on the Company’s financial statements.
IFRIC – 17 Distributions of Non-cash Assets to Owners (effective for annual periods beginning on or after July 1, 2009)states that when a company distributes non cash assets to its shareholders as dividend, the liability for the dividend ismeasured at fair value. If there are subsequent changes in the fair value before the liability is discharged, this is recognisedin equity. When the non cash asset is distributed, the difference between the carrying amount and fair value is recognisedin the income statement. As the Company does not distribute non-cash assets to its shareholders, this interpretation hasno impact on the Company’s financial statements.
The International Accounting Standards Board made certain amendments to existing standards as part of its second annualimprovements project. The effective dates for these amendments vary by standard and most will be applicable to theCompany’s 2010 financial statements. These amendments are unlikely to have an impact on the Company’s financialstatements.
Amendment to IFRS 2 – Share-based Payment – Group Cash-settled Share-based Payment Transactions (effective forannual periods beginning on or after January 1, 2010). Currently effective IFRSs require attribution of group share-basedpayment transactions only if they are equity-settled. The amendments resolve diversity in practice regarding attribution ofcash-settled share-based payment transactions and require an entity receiving goods or services in either an equity-settledor a cash-settled payment transaction to account for the transaction in its separate or individual financial statements.
Amendment to IAS 32 Financial Instruments: Presentation – Classification of Rights Issues (effective for annual periodsbeginning on or after February 1, 2010). The IASB amended IAS 32 to allow rights, options or warrants to acquire a fixednumber of the entity’s own equity instruments for a fixed amount of any currency to be classified as equity instrumentsprovided the entity offers the rights, options or warrants pro rata to all of its existing owners of the same class of its ownnon-derivative equity instruments. This interpretation has no impact on the Company’s financial statements.
IFRIC 19 Extinguishing Financial Liabilities with Equity Instruments (effective for annual periods beginning on or after July1, 2010). This interpretation provides guidance on the accounting for debt for equity swaps. This interpretation has noimpact on the Company’s financial statements.
IAS 24 Related Party Disclosures (revised 2009) – effective for annual periods beginning on or after January 1, 2011. Therevision amends the definition of a related party and modifies certain related party disclosure requirements for government-related entities. The amendment would result in certain changes in disclosures.
Amendments to IFRIC 14 IAS 19 – The Limit on a Defined Benefit Assets, Minimum Funding Requirements and theirInteraction (effective for annual periods beginning on or after January 1, 2011). These amendments remove unintendedconsequences arising from the treatment of prepayments where there is a minimum funding requirement. These amendmentsresult in prepayments of contributions in certain circumstances being recognised as an asset rather than an expense. Thisamendment is not likely to have any impact on Company’s financial statements.
Improvements to IFRSs 2008 – Amendments to IFRS 5 Non-current Assets Held for Sale and Discontinued Operations –(effective for annual periods beginning on or after July 1, 2009). The amendments specify that if an entity is committed toa plan to sell a subsidiary, then it would classify all of that subsidiary’s assets and liabilities as held for sale if criteria inIFRS 5 are met. This applies regardless of the entity retaining an interest (other than control) in the subsidiary; and disclosuresfor discontinued operations are required by the parent when a subsidiary meets the definition of a discontinued operation.This amendment is not likely to have any impact on Company’s financial statements.

Notes to the Financial StatementsFor the year ended December 31, 2009
Annual Report 2009
95
45. Dividend
The directors in their meeting held on February 18, 2010 have declared a final dividend of Rs 4.5 per share (2008:Rs 4.00 per share) in respect of year ended December 31, 2009. The financial statements for the year ended December31, 2009 do not include the effect of the above dividend which will be accounted for in the period in which it is declared.
46. Date of Authorisation
These financial statements were authorised for issue in the Board of Directors meeting held on February 18, 2010.
47. General
47.1 Figures have been rounded off to the nearest thousand rupees.
47.2 Corresponding Figures
Corresponding figures have been rearranged and reclassified, wherever necessary, for better presentation and disclosure.
Reclassification from component Reclassification to component Amounts in Rs '000
Administration & general expenses Selling & distribution expenses 10,797 - Depreciation - Depreciation
Selling & distribution expenses Cost of sales 9,635 - General Expenses - Rent rates and taxes
Cost of sales Selling & distribution expenses 23,071 - Raw Material Purchases - Outward freight and handling charges
Cost of sales Cost of sales 1,173 - Finished Goods Purchases - Royalty
M J Jaffer Waqar A Malik Feroz RizviChairman / Director Chief Executive Chief Financial Officer

Comparison of Results for Ten YearsAs at December 31
Annual Report 2009
96
2000 2001 2002 2003 2004 * 2005 2006 2007 2008 2009Continued Discontinued Company Restated Restated Restated
Balance SheetTotal Equity and Revaluation Reserve 4,038,362 5,384,581 6,775,438 6,141,682 8,641,044 9,987,387 11,389,230 12,380,997 13,410,921 14,414,642Non Current Liability 189,552 66,173 78,895 74,568 82,601 90,604 104,079 119,571 612,954 1,208,117
Current Liability 6,910,283 7,945,475 6,932,541 7,915,577 5,205,018 5,891,930 5,436,275 6,263,805 4,446,810 5,799,898
Total Equity and Liabilities 11,138,197 13,396,229 13,786,874 14,131,827 13,928,663 15,969,921 16,929,584 18,764,373 18,470,685 21,422,657
Non Current Assets 7,792,121 8,685,242 9,168,174 8,825,935 6,738,979 9,469,783 9,905,729 9,741,603 10,435,258 10,297,489Current Assets 3,346,076 4,710,987 4,618,700 5,305,892 7,189,684 6,500,138 7,023,855 9,022,770 8,035,427 11,125,168
Total Assets 11,138,197 13,396,229 13,786,874 14,131,827 13,928,663 15,969,921 16,929,584 18,764,373 18,470,685 21,422,657
Profit and Loss AccountNet sales, commission & toll income 9,784,132 7,576,861 15,725,184 10,569,573 12,218,937 18,127,295 17,639,480 18,476,457 19,574,118 23,024,123 27,798,915 28,429,897Gross profit 2,613,951 (134,936) 2,479,015 2,465,404 2,327,095 2,664,367 2,755,709 3,351,698 4,081,470 4,818,754 5,495,777 5,675,892Operating Result 1,542,154 (368,602) 1,173,552 1,398,862 1,077,114 1,087,681 1,346,788 1,842,542 2,479,018 2,984,004 3,052,360 3,027,654Profit before taxation 1,251,588 (2,923,265) (1,671,677) 619,777 723,094 806,552 2,898,950 1,612,401 2,117,797 2,768,523 2,812,778 3,072,506Profit after taxation 1,202,446 (2,952,776) (1,750,330) 566,618 1,854,732 766,244 2,846,368 2,253,257 1,455,628 1,784,800 1,862,738 2,044,738
Summary of Cash FlowsNet cash generated from operating activities 461,917 980,784 1,026,536 1,933,065 1,823,927 2,521,959 3,477,093 4,093,537 969,809 4,476,231Net cash used in investing activities (1,631,630) (788,962) (32,549) (103,226) 3,379,171 (1,118,221) (1,040,183) (1,397,436) (1,780,969) (938,043)Net cash used in financing activities (3,066,247) 70,652 (965,730) (1,261,623) (4,542,451) (928,947) (2,337,028) (868,583) (832,815) (1,041,018)Cash and cash equivalents at December 31 185,081 447,555 475,812 1,044,028 1,704,675 2,179,466 2,279,348 4,106,866 2,462,891 4,960,061
Investors RatioGross profit to Sales 15.76 23.33 19.04 14.70 15.62 18.14 20.86 20.93 19.77 19.96Gross profit ratio ( turnover) 13.16 19.24 15.44 12.03 12.94 15.92 18.60 18.54 17.22 17.52EBITDA - 2,019,204 1,707,874 1,735,358 2,026,891 2,580,943 3,251,478 3,858,393 3,858,404 3,898,342EBITDA margin to sales (%) - 19 14 10 11 14 17 17 14 14Profit/(loss) after Taxation to sales (%) - 5 15 4 16 12 7 8 7 7Debtor turnover ratio ( in days ) - Sales 8 18 19 13 15 14 13 14 12 11Inventory turnover ratio ( in days ) - COGS 64 81 69 45 61 65 57 47 43 50Creditor turnover ratio ( in days ) - COGS - 62 48 32 42 42 47 42 19 15Operating Cycle - 37 40 26 34 38 23 19 35 46Fixed assets turnover to Sales (%) 277 177.77 212.77 327.94 327.51 252.49 232.61 269.4 296.95 308.18Market Value / share 10.85 35.30 53.95 85.00 89.65 140.50 115.50 196.65 68.71 168.49Break-up value per share with Surplus on Revaluation 26.72 32.09 38.73 44.25 62.25 71.95 82.05 89.20 96.62 103.85Break-up value per share excluding Surplus on Revaluation 11.70 17.78 33.08 39.35 58.02 68.39 73.95 81.91 89.68 97.14Price Earning ratio - 7.55 4.04 15.40 4.37 8.65 11.01 16.29 5.12 11.44Dividend (Declared for the year) Yield - (%) - 5.67 4.17 - 2.79 4.27 4.76 2.80 8.73 4.75Dividend (Declared for the year) Payout (%) - 48.99 16.84 - 12.19 36.96 52.45 42.77 44.71 54.31Return on Capital Employed (%) - 24.05 40.40 14.03 35.34 23.74 14.18 15.70 14.96 15.17Debt : Equity ratio 78:22 67:33 49:51 42:58 0:100 0:100 0:100 0:100 0:100 0:100Current ratio 1.43 1.11 1.17 1.36 1.41 1.10 1.29 1.44 1.81 1.92Acid Test 0.54 0.51 0.56 0.67 0.71 0.56 0.73 0.97 1.02 1.27Interest cover - times 0.42 1.80 2.72 3.11 12.38 6.72 8.32 25.74 22.77 24.78Earnings after tax per share - 4.68 13.36 5.52 20.51 16.23 10.49 12.86 13.42 14.73Dividends - Rupee per share - 2.00 2.25 - 2.50 6.00 5.50 5.50 6.00 7.50Dividend cover - times - 2.04 6.68 2.45 8.20 2.71 1.91 2.34 2.24 1.96
* The comparatives (2002 to 2004) have not been restated due to change in accounting policy on adoption of IFRIC 4.
Comparison of Results for Ten YearsAs at December 31
Annual Report 2009
97
Amounts in Rs '000
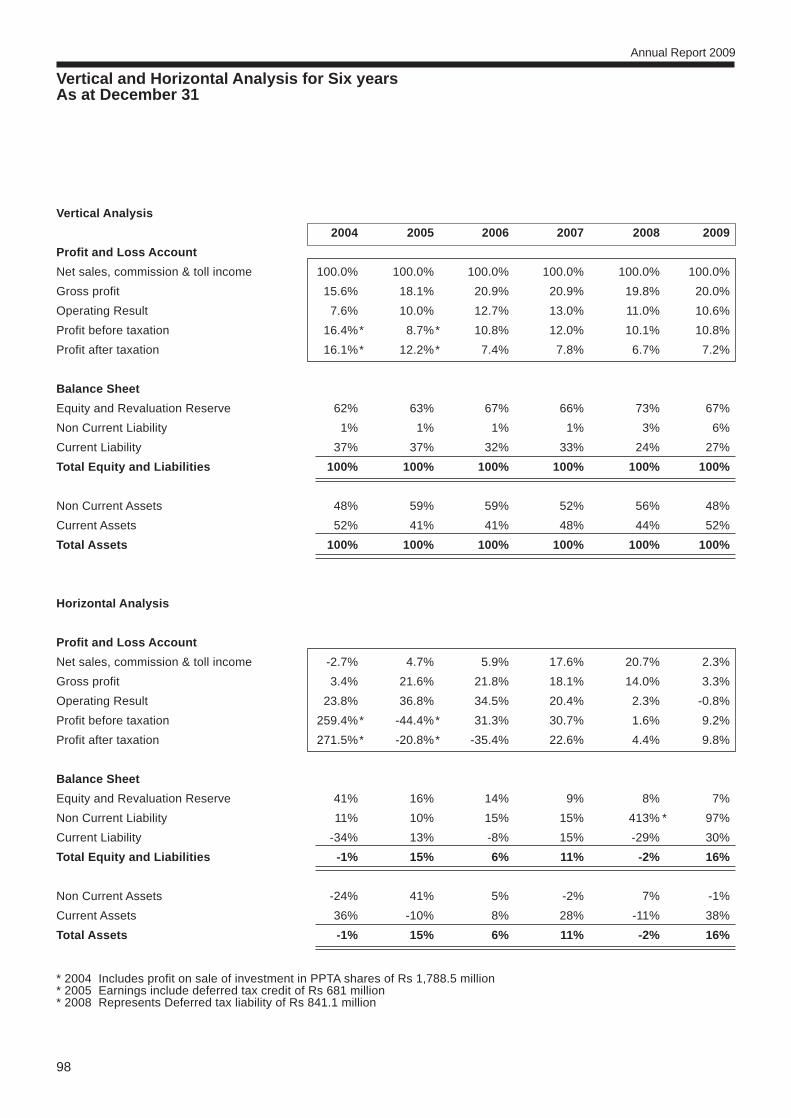
Vertical and Horizontal Analysis for Six yearsAs at December 31
Annual Report 2009
98
Vertical Analysis
2004 2005 2006 2007 2008 2009
Profit and Loss Account
Net sales, commission & toll income 100.0% 100.0% 100.0% 100.0% 100.0% 100.0%
Gross profit 15.6% 18.1% 20.9% 20.9% 19.8% 20.0%
Operating Result 7.6% 10.0% 12.7% 13.0% 11.0% 10.6%
Profit before taxation 16.4%* 8.7%* 10.8% 12.0% 10.1% 10.8%
Profit after taxation 16.1%* 12.2%* 7.4% 7.8% 6.7% 7.2%
Balance Sheet
Equity and Revaluation Reserve 62% 63% 67% 66% 73% 67%
Non Current Liability 1% 1% 1% 1% 3% 6%
Current Liability 37% 37% 32% 33% 24% 27%
Total Equity and Liabilities 100% 100% 100% 100% 100% 100%
Non Current Assets 48% 59% 59% 52% 56% 48%
Current Assets 52% 41% 41% 48% 44% 52%
Total Assets 100% 100% 100% 100% 100% 100%
Horizontal Analysis
Profit and Loss Account
Net sales, commission & toll income -2.7% 4.7% 5.9% 17.6% 20.7% 2.3%
Gross profit 3.4% 21.6% 21.8% 18.1% 14.0% 3.3%
Operating Result 23.8% 36.8% 34.5% 20.4% 2.3% -0.8%
Profit before taxation 259.4%* -44.4%* 31.3% 30.7% 1.6% 9.2%
Profit after taxation 271.5%* -20.8%* -35.4% 22.6% 4.4% 9.8%
Balance Sheet
Equity and Revaluation Reserve 41% 16% 14% 9% 8% 7%
Non Current Liability 11% 10% 15% 15% 413% * 97%
Current Liability -34% 13% -8% 15% -29% 30%
Total Equity and Liabilities -1% 15% 6% 11% -2% 16%
Non Current Assets -24% 41% 5% -2% 7% -1%
Current Assets 36% -10% 8% 28% -11% 38%
Total Assets -1% 15% 6% 11% -2% 16%
* 2004 Includes profit on sale of investment in PPTA shares of Rs 1,788.5 million* 2005 Earnings include deferred tax credit of Rs 681 million* 2008 Represents Deferred tax liability of Rs 841.1 million

Annual Report 2009
99
Pattern of Shareholdingas at December 31, 2009
No. of Shareholders Categories No. of SharesFrom To
6,174 1 100 218,9554,038 101 500 972,2491,072 501 1,000 798,2981,095 1,001 5,000 2,331,983
146 5,001 10,000 1,060,82746 10,001 15,000 573,88630 15,001 20,000 534,73917 20,001 25,000 393,875
7 25,001 30,000 195,7406 30,001 35,000 191,5134 35,001 40,000 149,2743 40,001 45,000 125,3391 45,001 50,000 50,0002 50,001 55,000 106,2301 60,001 65,000 65,0001 65,001 70,000 67,2737 70,001 75,000 511,2793 75,001 80,000 235,7001 80,001 85,000 80,0402 95,001 100,000 200,0001 100,001 105,000 104,8301 110,001 115,000 112,2003 120,001 125,000 365,9622 125,001 130,000 255,1001 130,001 135,000 134,8471 155,001 160,000 160,0001 160,001 165,000 164,9231 170,001 175,000 171,7002 175,001 180,000 358,8731 230,001 235,000 233,3001 245,001 250,000 250,0001 285,001 290,000 289,6101 320,001 325,000 321,2241 325,001 330,000 325,8141 370,001 375,000 373,6002 395,001 400,000 800,0001 410,001 415,000 411,8001 510,001 515,000 514,7041 545,001 550,000 547,8321 595,001 600,000 600,0001 605,001 610,000 610,0001 695,001 700,000 696,8001 855,001 860,000 860,0001 905,001 910,000 909,9001 935,001 940,000 938,3711 1,195,001 1,200,000 1,200,0001 1,240,001 1,245,000 1,241,0001 1,510,001 1,515,000 1,512,5991 3,045,001 3,050,000 3,045,9861 7,195,001 7,200,000 7,200,0001 105,225,001 105,230,000 105,229,125
12,692 138,802,300

Pattern of Shareholdingas at December 31, 2009
Annual Report 2009
100
S.No. Categories of Shareholders No. of Shares Held PercentageShareholders
1 Associated Companies (a) 1 105,229,125 75.81
2 Investment Companies 12 6,118 0.00
3 Insurance Companies 7 2,749 0.00
4 Joint Stock Companies 26 9,232 0.01
5 Others 25 314,262 0.23
6 Financial Institutions 12 19,058 0.01
7 Modaraba Companies 3 176 0.00
8 Mutual Funds 6 764 0.00
9 Individuals 8,480 2,610,569 1.89
10 Central Depository Company (b) 4,120 30,610,247 22.05
TOTALS 12,692 138,802,300 100.00
(a) Represents the 75.81% shareholding of ICI Omicron, B.V., a subsidiary of AkzoNobel N.V.
(b) Categories of Account Holders and Sub Account Holders as per Central Depository Register.
1 Insurance Companies 16 5,586,635 18.25
2 Investment Companies 4 55,288 0.18
3 Joint Stock Companies 120 7,825,110 25.56
4 Modaraba Management Companies 2 121 0.00
5 Modarabas 4 93,475 0.31
6 Mutual Fund 33 5,068,018 16.56
7 Others 18 263,141 0.86
8 Financial Institutions 18 3,826,736 12.50
9 Cooperative Societies 1 2,200 0.01
10 Charitable Trusts 7 160,731 0.53
11 Individuals 3,897 7,728,792 25.25
TOTALS 4,120 30,610,247 100.0

Pattern of Shareholdingas at December 31, 2009
Annual Report 2009
101
Shareholder’s Category Number of Number of Shareholders Shares Held
Associated Companies, Undertakings and Related PartiesICI OMICRON B.V. 1 105,229,125
NIT and ICP (name wise detail)National Bank of Pakistan, Trustee Department (NIT) 2 1,103,294Investment Corporation of Pakistan 2 1,810
Directors, CE and their spouse and minor children (name wise detail)Mahomed J. Jaffer 1 21,325Waqar A Malik 1 1Mueen Afzal 1 1Feroz Rizvi 1 1M Nawaz Tiwana 1 1Ali Asrar Aga 1 1Khatoon M. Jaffer w/o M J Jaffer 1 15,989Akbar Jaffer s/o M J Jaffer 1 15,081
Executives 53 17,696
Public Sector Companies and Corporations 4 3,048,048
Banks, Development Finance Institutions, 96 9,732,536Non-Banking Finance InstitutionsInsurance Companies, Modarabas and Mutual Funds
Shareholders holding 10% or more voting interestICI OMICRON B.V. 1 105,229,125
ADDITIONAL INFORMATION


Consolidated Financial Statements
Annual Report 2009
ICI Pakistan Limitedand its Subsidiary Company

Annual Report 2009
104
The Directors are pleased to present their report together withthe audited Group results of ICI Pakistan Limited for the yearended December 31, 2009. The ICI Pakistan Group comprisesof ICI Pakistan Limited and ICI Pakistan PowerGen Limited, awholly owned subsidiary.
The Directors Report, giving a commentary on the performanceof ICI Pakistan Limited for the year ended December 31, 2009has been presented separately.
During the year, furnace oil prices on an average at Rs31,453/tonne were 22 percent lower compared with averageprice at Rs 40,407 last year. However, gas tariff was increasedduring the year.
Electricity sales volume for the quarter and year ended was 39and 11 percent higher respectively compared with the samequarter and full year 2008. This was due to higher demand fromthe Polyester plant of ICI Pakistan Limited. This, along withrevision in electricity tariff enabled the Company in achievingoperating result of Rs 88.8 million compared with an operatingloss of Rs 114.4 million last year. Financial charges for the yearwere higher by 43 percent primarily on account of higher workingcapital requirements compared to last year .
Earnings per share at Rs 1.35 were significantly higher comparedwith a loss per share last year.
Future Outlook
Sale of surplus power to LESCO under the power sale agreementis expected to commence in Q1, 2010.
Report of the Directors for the yearended December 31, 2009
Dated: February 18, 2009Karachi
M J JafferChairman
Waqar A MalikChief Executive
Date: February 18, 2010
Karachi

105
Auditors’ Report to the Members
Annual Report 2009
We have audited the annexed consolidated financial statements of ICI Pakistan Limited and its subsidiary (the "Group") comprising
consolidated balance sheet as at 31 December 2009 and the related consolidated profit and loss account, consolidated statement
of comprehensive income, consolidated cash flow statement and consolidated statement of changes in equity together with the
notes forming part thereof, for the year then ended.
These financial statements are the responsibility of the Holding Company's management. Our responsibility is to express an opinion
on these financial statements based on our audit.
We conducted our audit in accordance with the auditing standards as applicable in Pakistan. These standards require that we
plan and perform the audit to obtain reasonable assurance about whether the above said statements are free of any material
misstatement. An audit includes examining, on a test basis, evidence supporting the amounts and disclosures in the above said
statements. An audit also includes assessing the accounting policies and significant estimates made by management, as well as,
evaluating the overall presentation of the above said statements. We believe that our audit provides a reasonable basis for our
opinion.
In our opinion, the consolidated financial statements present fairly the consolidated financial position of the Group as at 31 December
2009, and the consolidated results of its operations, consolidated cash flows and consolidated changes in equity for the year then
ended in accordance with approved accounting standards as applicable in Pakistan.
Date: 18 February 201018 February 2009 KPMG Taseer Hadi & Co.
Karachi Chartered Accountants
Syed Iftikhar Anjum
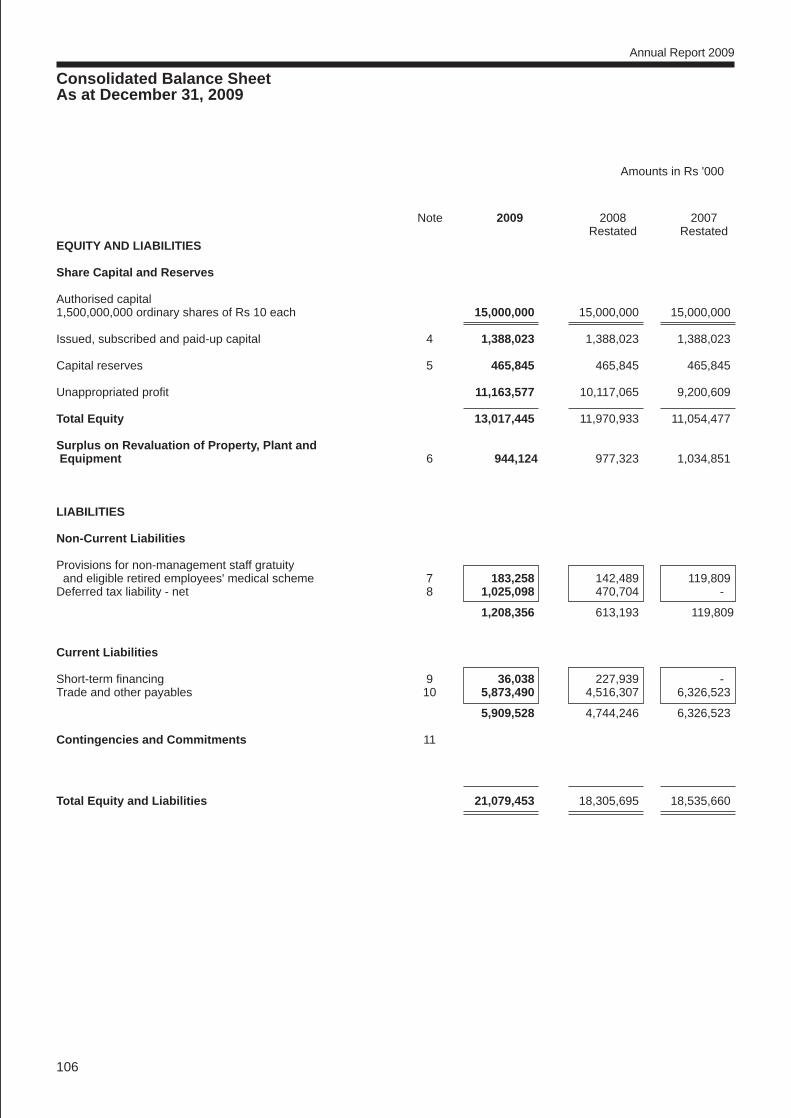
Consolidated Balance SheetAs at December 31, 2009
Annual Report 2009
106
Amounts in Rs '000
EQUITY AND LIABILITIES
Share Capital and Reserves
Authorised capital1,500,000,000 ordinary shares of Rs 10 each 15,000,000 15,000,000 15,000,000
Issued, subscribed and paid-up capital 4 1,388,023 1,388,023 1,388,023
Capital reserves 5 465,845 465,845 465,845
Unappropriated profit 11,163,577 10,117,065 9,200,609
Total Equity 13,017,445 11,970,933 11,054,477
Surplus on Revaluation of Property, Plant and Equipment 6 944,124 977,323 1,034,851
LIABILITIES
Non-Current Liabilities
Provisions for non-management staff gratuity and eligible retired employees' medical scheme 7 183,258 142,489 119,809Deferred tax liability - net 8 1,025,098 470,704 -
1,208,356 613,193 119,809
Current Liabilities
Short-term financing 9 36,038 227,939 -Trade and other payables 10 5,873,490 4,516,307 6,326,523
5,909,528 4,744,246 6,326,523
Contingencies and Commitments 11
Total Equity and Liabilities 21,079,453 18,305,695 18,535,660
Note 2009 2008 2007 Restated Restated

Consolidated Balance SheetAs at December 31, 2009
Annual Report 2009
107
Amounts in Rs '000
M J Jaffer Waqar A Malik Feroz RizviChairman / Director Chief Executive Chief Financial Officer
Note 2009 2008 2007 Restated Restated
ASSETS
Non-current Assets
Property, plant and equipment 12 9,862,870 10,069,384 8,775,214Intangible asset 13 - 7,700 39,737
9,862,870 10,077,084 8,814,951
Deferred tax asset - net 8 - - 370,406Long-term investments 14 2,500 2,500 2,500Long-term loans 15 131,430 131,314 109,768Long-term deposits and prepayments 16 29,078 30,684 37,357
163,008 164,498 520,031
10,025,878 10,241,582 9,334,982
Current Assets
Stores and spares 17 554,581 581,473 647,784
Stock-in-trade 18 3,253,345 2,965,699 2,328,375
Trade debts 19 944,879 832,062 1,017,082
Loans and advances 20 124,940 98,370 114,640
Trade deposits and short-term prepayments 21 454,433 406,019 342,559
Other receivables 22 713,444 789,959 712,263
Taxation recoverable 460,240 418,776 335,875
Cash and bank balances 23 4,547,713 1,971,755 3,702,100
11,053,575 8,064,113 9,200,678
Total Assets 21,079,453 18,305,695 18,535,660
The annexed notes 1 to 48 form an integral part of these consolidated financial statements.

Consolidated Profit and Loss AccountFor the year ended December 31, 2009
Annual Report 2009
108
Turnover 25 32,399,181 31,921,873
Sales tax, excise duty, commission and discounts 24 (4,062,526) (4,186,816)
Net sales, commission & toll income 28,336,655 27,735,057
Cost of sales 25 (22,569,672) (22,346,066)
Gross profit 5,766,983 5,388,991
Selling and distribution expenses 27 (1,470,174) (1,317,258)
Administration and general expenses 28 (1,178,370) (1,132,201)
Operating results 3,118,439 2,939,532
Financial charges 29 (185,742) (235,738)
Other operating charges 30 (248,436) (233,842)
(434,178) (469,580)
Other operating income 31 397,837 171,830
Profit before taxation 3,082,098 2,641,782
Taxation 32 (1,027,768) (950,040)
Profit after taxation 2,054,330 1,691,742
(Rupees) (Rupees)
Earnings per share - Basic and diluted 33 14.80 12.19
The annexed notes 1 to 48 form an integral part of these consolidated financial statements.
Note 2009 2008Restated
Amounts in Rs '000
M J Jaffer Waqar A Malik Feroz RizviChairman / Director Chief Executive Chief Financial Officer

Consolidated Statement of Comprehensive IncomeFor the year ended December 31, 2009
Annual Report 2009
109
Profit for the year 2,054,330 1,691,742
Other comprehensive income - -
Total Comprehensive income for the year 2,054,330 1,691,742
The annexed notes 1 to 48 form an integral part of these consolidated financial statements.
2009 2008 Restated
Amounts in Rs '000
M J Jaffer Waqar A Malik Feroz RizviChairman / Director Chief Executive Chief Financial Officer
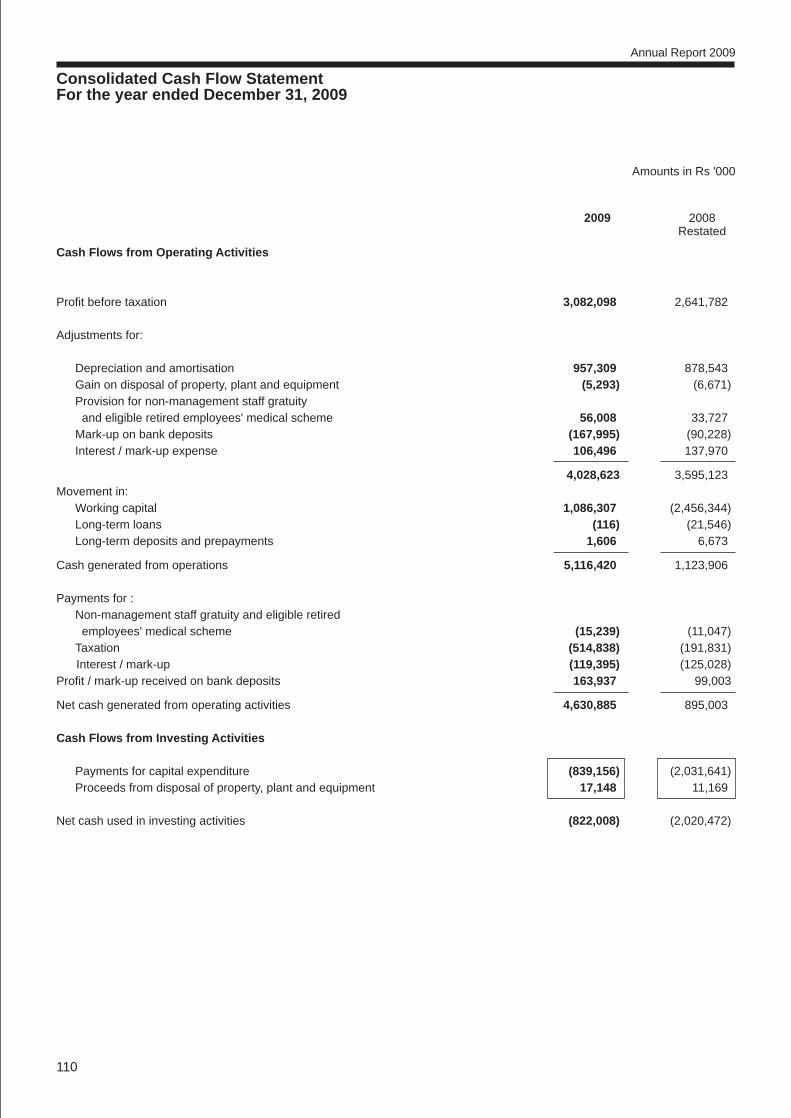
Consolidated Cash Flow StatementFor the year ended December 31, 2009
Cash Flows from Operating Activities
Profit before taxation 3,082,098 2,641,782
Adjustments for:
Depreciation and amortisation 957,309 878,543Gain on disposal of property, plant and equipment (5,293) (6,671)Provision for non-management staff gratuity and eligible retired employees' medical scheme 56,008 33,727Mark-up on bank deposits (167,995) (90,228)Interest / mark-up expense 106,496 137,970
4,028,623 3,595,123Movement in:
Working capital 1,086,307 (2,456,344)Long-term loans (116) (21,546)Long-term deposits and prepayments 1,606 6,673
Cash generated from operations 5,116,420 1,123,906
Payments for :Non-management staff gratuity and eligible retired employees' medical scheme (15,239) (11,047)Taxation (514,838) (191,831)
Interest / mark-up (119,395) (125,028)Profit / mark-up received on bank deposits 163,937 99,003
Net cash generated from operating activities 4,630,885 895,003
Cash Flows from Investing Activities
Payments for capital expenditure (839,156) (2,031,641)Proceeds from disposal of property, plant and equipment 17,148 11,169
Net cash used in investing activities (822,008) (2,020,472)
2009 2008Restated
Annual Report 2009
110
Amounts in Rs '000

Consolidated Cash Flow StatementFor the year ended December 31, 2009
M J Jaffer Waqar A Malik Feroz RizviChairman / Director Chief Executive Chief Financial Officer
Cash Flows from Financing Activities
Dividend paid (1,041,018) (832,815)
Net cash used in financing activities (1,041,018) (832,815)
Net increase / (decrease) in cash and cash equivalents 2,767,859 (1,958,284)Cash and cash equivalents at January 1 1,743,816 3,702,100
Cash and cash equivalents at December 31 4,511,675 1,743,816
Movement in Working Capital
(Increase) / decrease in current assets
Stores and spares 26,892 66,311Stock-in-trade (287,646) (637,324)Trade debts (112,817) 185,020Loans and advances (26,570) 16,270Trade deposits and short-term prepayments (48,414) (63,460)Other receivables 80,573 (86,471)
(367,982) (519,654)
Increase / (decrease) in current liability
Trade and other payables 1,454,289 (1,936,690)
1,086,307 (2,456,344)
Cash and cash equivalents at December 31 comprise of:
Cash and bank balances - note 23 4,547,713 1,971,755Running finances utilised under mark-up arrangements - note 9 (36,038) (227,939)
4,511,675 1,743,816
The annexed notes 1 to 48 form an integral part of these consolidated financial statements.
2009 2008Restated
Annual Report 2009
111
Amounts in Rs '000

Annual Report 2009
112
Consolidated Statement of Changes in EquityFor the year ended December 31, 2009
Balance as on January 1, 2008 1,388,023 465,845 9,230,229 11,084,097Effect of restatement as referred in note 42.3 - - (29,620) (29,620)
Balance as on January 1, 2008 - restated 1,388,023 465,845 9,200,609 11,054,477
Final dividend for the year ended December 31, 2007 @ Rs. 3.50 per share - - (485,808) (485,808)Interim dividend for the year 2008 @ Rs. 2.50 per share - - (347,006) (347,006)
Transactions with owners, recorded directly in equity - - (832,814) (832,814)
Total comprehensive income for the year ended December 31, 2008 - - 1,691,742 1,691,742
Transfer from surplus on revaluation of property, plant and equipment incremental depreciation net of deferred tax - note 6 - - 57,528 57,528
- - 1,749,270 1,749,270
Balance as on December 31, 2008 - restated 1,388,023 465,845 10,117,065 11,970,933
Final dividend for the year ended December 31, 2008 @ Rs. 4.00 per share - - (555,209) (555,209)Interim dividend for the year 2009 @ Rs. 3.50 per share - - (485,808) (485,808)
Transactions with owners, recorded directly in equity - - (1,041,017) (1,041,017)
Total comprehensive income for the year ended December 31, 2009 - - 2,054,330 2,054,330
Transfer from surplus on revaluation of property, plant and equipment incremental depreciation net of deferred tax - note 6 - - 33,199 33,199
- - 2,087,529 2,087,529
Balance as on December 31, 2009 1,388,023 465,845 11,163,577 13,017,445
The annexed notes 1 to 48 form an integral part of these consolidated financial statements.
M J Jaffer Waqar A Malik Feroz RizviChairman / Director Chief Executive Chief Financial Officer
Amounts in Rs '000
Issued, Capital Unappropriated Total subscribed reserves profitand paid-up
capital
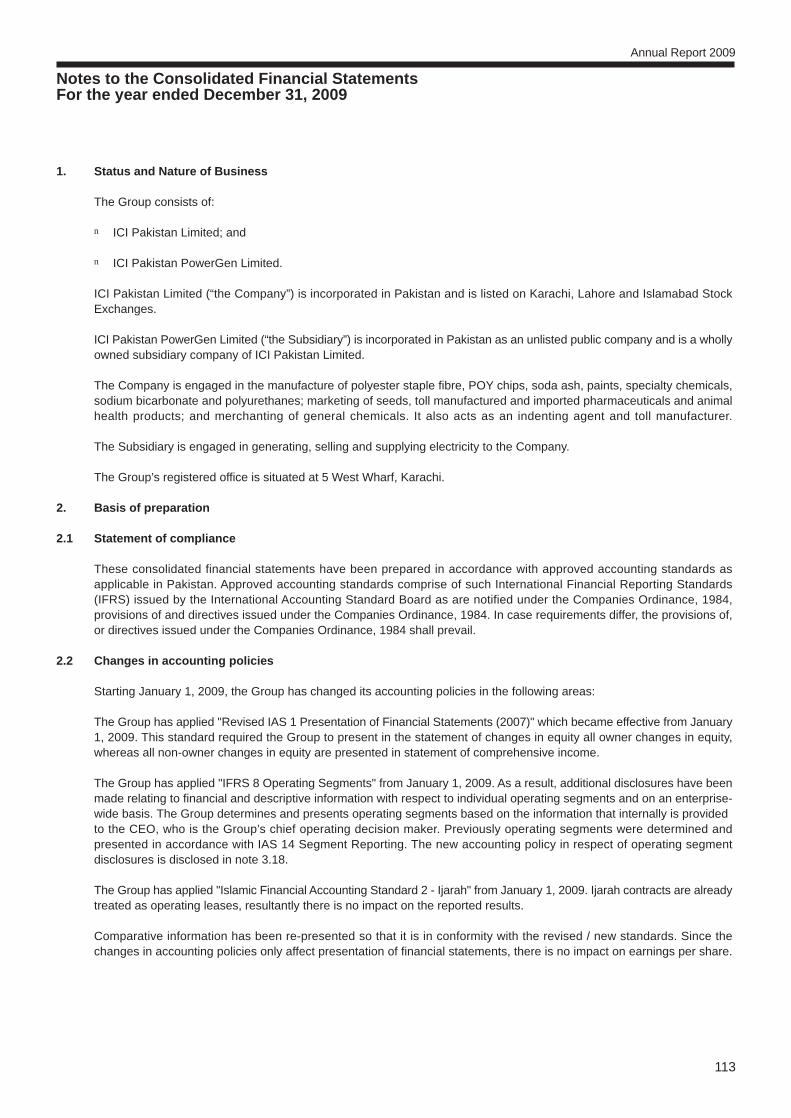
Annual Report 2009
113
Notes to the Consolidated Financial StatementsFor the year ended December 31, 2009
1. Status and Nature of Business
The Group consists of:
n ICI Pakistan Limited; and
n ICI Pakistan PowerGen Limited.
ICI Pakistan Limited (“the Company”) is incorporated in Pakistan and is listed on Karachi, Lahore and Islamabad StockExchanges.
ICI Pakistan PowerGen Limited (“the Subsidiary”) is incorporated in Pakistan as an unlisted public company and is a whollyowned subsidiary company of ICI Pakistan Limited.
The Company is engaged in the manufacture of polyester staple fibre, POY chips, soda ash, paints, specialty chemicals,sodium bicarbonate and polyurethanes; marketing of seeds, toll manufactured and imported pharmaceuticals and animalhealth products; and merchanting of general chemicals. It also acts as an indenting agent and toll manufacturer.
The Subsidiary is engaged in generating, selling and supplying electricity to the Company.
The Group’s registered office is situated at 5 West Wharf, Karachi.
2. Basis of preparation
2.1 Statement of compliance
These consolidated financial statements have been prepared in accordance with approved accounting standards asapplicable in Pakistan. Approved accounting standards comprise of such International Financial Reporting Standards(IFRS) issued by the International Accounting Standard Board as are notified under the Companies Ordinance, 1984,provisions of and directives issued under the Companies Ordinance, 1984. In case requirements differ, the provisions of,or directives issued under the Companies Ordinance, 1984 shall prevail.
2.2 Changes in accounting policies
Starting January 1, 2009, the Group has changed its accounting policies in the following areas:
The Group has applied "Revised IAS 1 Presentation of Financial Statements (2007)" which became effective from January1, 2009. This standard required the Group to present in the statement of changes in equity all owner changes in equity,whereas all non-owner changes in equity are presented in statement of comprehensive income.
The Group has applied "IFRS 8 Operating Segments" from January 1, 2009. As a result, additional disclosures have beenmade relating to financial and descriptive information with respect to individual operating segments and on an enterprise-wide basis. The Group determines and presents operating segments based on the information that internally is providedto the CEO, who is the Group’s chief operating decision maker. Previously operating segments were determined andpresented in accordance with IAS 14 Segment Reporting. The new accounting policy in respect of operating segmentdisclosures is disclosed in note 3.18.
The Group has applied "Islamic Financial Accounting Standard 2 - Ijarah" from January 1, 2009. Ijarah contracts are alreadytreated as operating leases, resultantly there is no impact on the reported results.
Comparative information has been re-presented so that it is in conformity with the revised / new standards. Since thechanges in accounting policies only affect presentation of financial statements, there is no impact on earnings per share.

Annual Report 2009
114
Notes to the Consolidated Financial StatementsFor the year ended December 31, 2009
2.3 Basis of measurement
These consolidated financial statements have been prepared under the historical cost convention, except that certainproperty, plant and equipment have been included at revalued amounts and certain exchange elements referred to in note3.7 have been recognised in the cost of the relevant property, plant & equipment.
The preparation of financial statements in conformity with approved accounting standards requires management to makeestimates, assumptions and use judgments that affect the application of policies and reported amounts of assets andliabilities and income and expenses. Estimates, assumptions and judgments are continually evaluated and are based onhistorical experience and other factors, including reasonable expectations of future events. Revisions to accounting estimatesare recognised prospectively commencing from the period of revision.
Judgments and estimates made by the management that may have a significant risk of material adjustments to the financialstatements in subsequent years are discussed in note 44.
3. Summary of Significant Accounting Policies
The accounting policies adopted are the same as those which were applied for the previous financial year.
3.1 Consolidation
The financial statements of the Subsidiary have been consolidated on a line-by-line basis and all intra-group balances andtransactions have been eliminated.
3.2 Staff retirement benefits
The Group’s retirement benefit plans comprise of provident funds, pensions, gratuity schemes and a medical scheme foreligible retired employees.
Defined benefit plans
The Group operates a funded pension scheme and a funded gratuity scheme for management staff. The pension andgratuity schemes are salary schemes providing pension and lump sums, respectively. Pension and gratuity schemes formanagement staff are invested through two approved trust funds. The Group also operates gratuity scheme for non-management staff and the pensioners’ medical scheme which are unfunded. The pension and gratuity plans are final salaryplans. The pensioner’s medical plan reimburses actual medical expenses to pensioners as per entitlement. The Grouprecognises expense in accordance with IAS 19 “Employee Benefits”.
An actuarial valuation of all defined benefit schemes is conducted every year. The valuation uses the Projected Unit Creditmethod. Actuarial gains and losses are amortised over the expected average remaining working lives of employees asallowed under the relevant provision of IAS 19 “Employee Benefits”.
Past-service costs are recognised immediately in profit and loss account, unless the changes to the plan are conditionalon the employees remaining in service for a specified period of time (the vesting period). In this case, the past-service costsare amortised on a straight-line basis over the vesting period.
Defined contribution plans
The Group operates two registered contributory provident funds for its entire staff and a registered defined contributionsuperannuation fund for its management staff, who has either opted for this fund by July 31, 2004 or have joined the Groupafter April 30, 2004. In addition to this the Group also provides group insurance to all its employees.

Annual Report 2009
115
Notes to the Consolidated Financial StatementsFor the year ended December 31, 2009
3.3 Provisions
A provision is recognised in the balance sheet when the Group has a legal or constructive obligation as a result of a pastevent, and it is probable that an outflow of economic benefits will be required to settle the obligation and a reliable estimatecan be made of the amount of obligation. The amount recognized as a provision shall be the best estimate of the expenditurerequired to settle the present obligation at the end of the reporting period.
3.4 Trade and other payables
Trade and other payables are recognised initially at fair value plus directly attributable cost, if any.
3.5 Dividend
Dividend distribution to the Group’s shareholders is recognised as a liability in the period in which the dividends are approved.
3.6 Taxation
Income tax expense comprises current and deferred tax. Income tax expense is recognised in the profit and loss account,except to the extent that it relates to items recognised directly in other comprehensive income or below equity, in whichcase it is recognised in other comprehensive income or below equity respectively.
Current
Provision for current taxation is based on taxable income at the enacted or substantively enacted rates of taxation aftertaking into account available tax credits and rebates, if any. The charge for current tax includes adjustments to charge forprior years, if any.
Deferred
Deferred tax is recognised using balance sheet method, providing for temporary differences between the carrying amountsof assets and liabilities for financial reporting purposes and the amounts used for taxation purposes. The amount of deferredtax provided is based on the expected manner of realisation or settlement of the carrying amount of assets and liabilities,using the enacted or substantively enacted rates of taxation.
The Group recognises a deferred tax asset to the extent that it is probable that taxable profits for the foreseeable futurewill be available against which the asset can be utilised. Deferred tax assets are reduced to the extent that it is no longerprobable that the related tax benefit will be realised. Further, the Group recognises deferred tax asset / liability on deficit /surplus on revaluation of property, plant and equipment which is adjusted against the related deficit / surplus.
3.7 Property, plant and equipment and depreciation
Property, plant and equipment (except freehold land, leasehold land and plant & machinery) are stated at cost lessaccumulated depreciation and impairment losses. Freehold land, leasehold land and plant & machinery are stated atrevalued amounts less accumulated depreciation. Capital work-in-progress is stated at cost. Cost of certain property, plantand equipment comprises historical cost, exchange differences recognised in accordance with the previous Fourth Scheduleto the Ordinance, cost of exchange risk cover in respect of foreign currency loans obtained for the acquisition of property,plant and equipment upto the commencement of commercial production and the cost of borrowings during constructionperiod in respect of loans taken for specific projects.
Depreciation charge is based on the straight-line method whereby the cost or revalued amount of an asset is written offto profit and loss account over its estimated useful life after taking into account residual value, if material. The cost ofleasehold land is amortised in equal installments over the lease period. Depreciation on additions is charged from the monthin which the asset is available for use and on disposals up to the month of disposal.

Annual Report 2009
116
Notes to the Consolidated Financial StatementsFor the year ended December 31, 2009
The residual value, depreciation method and the useful lives of each part of property, plant and equipment that is significantin relation to the total cost of the asset are reviewed, and adjusted if appropriate, at each balance sheet date.
Surplus on revaluation of property, plant and equipment is credited to the surplus on revaluation account. To the extent ofthe incremental depreciation charged on the revalued assets the related surplus on revaluation of property, plant andequipment (net of deferred taxation) is transferred directly to unappropriated profit.
Maintenance and normal repairs are charged to income as and when incurred. Improvements are capitalised when it isprobable that respective future economic benefits will flow to the Group and the cost of the item can be measured reliably.Assets replaced, if any, are derecognised.
Gains and losses on disposal of assets are taken to the profit and loss account, and the related surplus on revaluation ofproperty, plant and equipment is transferred directly to retained earnings (unappropriated profits).
3.8 Intangible assets
Intangible assets are measured initially at cost and subsequently stated at cost less accumulated amortisation and impairmentlosses, if any.
Computer software
Acquired computer software licenses are capitalised on the basis of the costs incurred to acquire and bring to use thespecific software. Costs associated with developing or maintaining computer software programmes are recognised as anexpense as incurred. Costs that are directly associated with the production of identifiable and unique software productscontrolled by the Group, and that will probably generate economic benefits exceeding costs beyond one year, are recognisedas intangible assets. These costs are amortised over their estimated useful lives.
3.9 Impairment
Financial assets (including receivables)
Financial asset are assessed at each reporting date to determine whether there is objective evidence that they are impaired.A financial asset is impaired if objective evidence indicates that a loss event has occurred after the initial recognition ofthe asset, and that the loss event had a negative effect on the estimated future cash flows of that asset that can be estimatedreliably. Objective evidence that financial assets are impaired may include default or delinquency by a debtor, indicationsthat a debtor or issuer will enter bankruptcy.
All individually significant receivables are assessed for specific impairment. All individually significant receivables foundnot to be specifically impaired are then collectively assessed for any impairment that has been incurred but not yet identified.Receivables that are not individually significant are collectively assessed for impairment by grouping together receivablesand with similar risk characteristics.
An impairment loss in respect of a financial asset measured at amortised cost is calculated as the difference between itscarrying amount and the present value of the estimated future cash flows discounted at the asset’s original effective interestrate. Losses are recognised in profit or loss and reflected in an allowance account against receivables. Interest on theimpaired asset continues to be recognised through the unwinding of the discount. When a subsequent event causes theamount of impairment loss to decrease, the decrease in impairment loss is reversed through profit or loss.
Non-Financial assets
The carrying amounts of non-financial assets other than inventories and deferred tax asset, are reviewed at each reportingdate to determine whether there is any indication of impairment. If any such indication exists, then the asset’s recoverableamount is estimated. The recoverable amount of an asset or cash-generating unit is the greater of its value in use and itsfair value less costs to sell. In assessing value in use, the estimated future cash flows are discounted to their present value

Annual Report 2009
117
Notes to the Consolidated Financial StatementsFor the year ended December 31, 2009
using a pre-tax discount rate that reflects current market assessment of the time value of money and the risks specific tothe asset. For the purpose of impairment testing, assets that cannot be tested individually are grouped together into thesmallest group of assets that generates cash inflows from continuing use that are largely independent of the cash inflowsof other assets or groups of assets (the “cash-generating unit, or CGU”).
The Group’s corporate assets do not generate separate cash inflows. If there is an indication that a corporate asset maybe impaired, then the recoverable amount is determined for the CGU to which the corporate asset belongs. An impairmentloss is recognised if the carrying amount of an asset or its CGU exceeds its estimated recoverable amount. Impairmentlosses are recognised in profit or loss.
Impairment loss recognised in prior periods are assessed at each reporting date for any indications that the loss hasdecreased or no longer exists. An impairment loss is reversed if there has been a change in the estimates used to determinethe recoverable amount. An impairment loss is reversed only to the extent that the asset’s carrying amount does not exceedthe carrying amount that would have been determined, net of depreciation or amortisation, if no impairment loss had beenrecognised.
3.10 Investment
Investment in non-listed equity security classified as available for sale is stated at cost less provision for impairment, if any.
3.11 Stores and spares
Stores and spares are stated at lower of cost and net realisable value. Cost is determined using weighted average method.
3.12 Stock-in-trade
Stock-in-trade is valued at lower of weighted average cost and estimated net realisable value.
Cost comprises all costs of purchase, costs of conversion and other costs incurred in bringing the inventories to their presentlocation and condition. Net realisable value signifies the estimated selling price in the ordinary course of business less netestimated costs of completion and selling expenses.
3.13 Trade debts and other receivables
Trade debts and other receivables are recognised initially at fair value plus directly attributable cost, if any, and subsequentlymeasured at amortised cost. A provision for impairment of trade and other receivables is established when there is objectiveevidence that the Group will not be able to collect all amounts due according to the original terms of receivables. (Refernote 40.5.1).
3.14 Foreign currency translation
Transactions denominated in foreign currencies are translated to Pak Rupees, which is the Group’s functional currency,at the foreign exchange rate prevailing at the date of transaction. Monetary assets and liabilities in foreign currencies aretranslated into Pak Rupees at the foreign exchange rates at the balance sheet date. All exchange differences are takento the profit and loss account.
3.15 Functional and presentation currency
Items included in the financial statements are measured using the currency of the primary economic environment in whichthe Group operates. The financial statements are presented in Pakistani Rupees, which is the Group’s functional andpresentation currency.
Annual Report 2009
118
Notes to the Consolidated Financial StatementsFor the year ended December 31, 2009
3.16 Revenue recognition
n Revenue from the sale of goods is recognised when the significant risks and rewards of ownership have been transferredto the customer. For those products which are often sold with a right of return, accumulated experience is used toestimate and provide for such returns at the time of sale.
n Commission income is recognised on date of shipment from suppliers.
n Profit on short-term deposits is accounted for on a time-apportioned basis using the effective interest rate method.
n Dividend income is recognised when the right to receive dividend is established.
n Toll manufacturing income is recognised when services are rendered.
3.17 Financial expense and finance income
Financial expenses are recognised using the effective interest method and comprise foreign currency losses and markup/ interest expense on borrowings.
Finance income comprises interest income on funds invested. Markup / Interest income is recognised as it accrues in profitor loss, using the effective interest method.
3.18 Segment reporting
Segment reporting is based on the operating (business) segments of the Group. An operating segment is a component ofthe Group that engages in business activities from which it may earn revenues and incur expenses, including revenuesand expenses that relate to transactions with any of the Group’s other components. An operating segment’s operatingresults are reviewed regularly by the CEO to make decisions about resources to be allocated to the segment and assessits performance, and for which discrete financial information is available.
Segment results that are reported to the CEO include items directly attributable to a segment as well as those that can beallocated on a reasonable basis. Unallocated items comprise mainly corporate assets, income tax assets, liabilities andrelated income and expenditure. Segment capital expenditure is the total cost incurred during the period to acquire property,plant and equipment.
The business segments are engaged in providing products or services which are subject to risks and rewards which differfrom the risk and rewards of other segments. Segments reported are Polyester, Soda Ash, Paints, Life Sciences, Chemicalsand others (PowerGen) which also reflects the management structure of the Group.
3.19 Finance lease
Leases that transfer substantially all the risks and rewards incidental to ownership of an asset are classified as financelease. Assets subject to finance lease are stated at amounts equal to the fair value or, if lower, the present value of theminimum lease payments. The minimum lease payments are apportioned between the finance charge and the reductionof the outstanding liability. Assets acquired under finance leases are depreciated in accordance with the Group’s depreciationpolicy on property, plant and equipment. The finance cost is charged to profit and loss account and is included underfinancial charges.
3.20 Operating lease / Ijarah contracts
Leases in which a significant portion of the risks and rewards of ownership are retained by the lessor are classified asoperating leases. Payments made under operating leases (net of any incentives received from the lessor) are charged tothe profit and loss account on a straight-line basis over the period of the lease.
Annual Report 2009
119
Notes to the Consolidated Financial StatementsFor the year ended December 31, 2009
Payments made under operating leases / Ijarah contracts are recognised in the profit and loss account on a straight-linebasis over the term of the lease.
3.21 Cash and cash equivalents
Cash and cash equivalents comprise of cash in hand and current or deposit accounts held with banks. Running financefacilities availed by the Group, which are payable on demand and form an integral part of the Group’s cash managementare included as part of cash and cash equivalents for the purpose of statement of cash flows.
3.22 Borrowings and their cost
Borrowings are recognised initially at fair value, net of transaction costs incurred. Borrowing costs are recognised as anexpense in the period in which these are incurred except to the extent of borrowing cost that are directly attributable tothe acquisition, construction or production of a qualifying asset. Such borrowing costs, if any, are capitalised as part of thecost of that asset.
3.23 Financial liabilities
All financial liabilities are initially recognised at fair value plus directly attributable cost, if any, and subsequently measuredat amortised cost.
3.24 Derivative financial instruments
The Group uses derivative financial instruments to hedge its exposure to foreign exchange and interest rate risks arisingfrom operational, financing and investment activities. In accordance with its treasury policy, the Group does not hold orissue derivative financial instruments for trading purposes. However, derivatives that do not qualify for hedge accountingare accounted for as trading instruments.
3.25 Off-setting
Financial assets and liabilities are offset and the net amount is reported in the financial statements only when there is legallyenforceable right to set-off the recognised amount and the Group intends either to settle on a net basis, or to realise theassets and to settle the liabilities simultaneously.
3.26 Earnings per Share
The Group presents basic and diluted earnings per share (EPS) data for its ordinary shares. Basic EPS is calculated bydividing the profit after tax attributable to ordinary shareholders of the Group by the weighted average number of ordinaryshares outstanding during the period.

Annual Report 2009
120
Notes to the Consolidated Financial StatementsFor the year ended December 31, 2009
4. Issued, Subscribed and Paid-up Capital
2009 2008 2009 2008(Numbers)
125,840,190 125,840,190 Ordinary shares of Rs 10 each fully paid in cash 1,258,402 1,258,402
318,492 318,492 Ordinary shares of Rs 10 each issued as fully paid for consideration other than cash under scheme of arrangement for amalgamation 3,185 3,185
25,227 25,227 Ordinary shares of Rs 10 each issued as fully paid bonus shares 252 252
12,618,391 12,618,391 Ordinary shares issued pursuant to the Scheme as fully paid for consideration of investment in associate (note 4.1) 126,184 126,184
138,802,300 138,802,300 1,388,023 1,388,023
4.1 With effect from October 1, 2000 the Pure Terephthalic Acid (PTA) Business of the Company was demerged under a Schemeof Arrangement (“the Scheme”) dated December 12, 2000 approved by the shareholders and sanctioned by the High Courtof Sindh.
4.2 ICI Omicron B.V., which is a wholly owned subsidiary of AkzoNobel N.V., held 105,229,125 (2008: 105,229,125) ordinaryshares of Rs 10 each at December 31, 2009. AkzoNobel N.V., acquired ICI PLC, UK, effective January 2, 2008, the parentcompany of ICI Omicron B.V., and became the ultimate holding company of ICI Pakistan Limited. ICI Pakistan Limitedcontinues to be the direct subsidiary of ICI Omicron B.V.
5. Capital Reserves
Share premium - note 5.1 465,259 465,259Capital receipts - note 5.2 586 586
465,845 465,845
5.1 Share premium includes the premium amounting to Rs 0.902 million received on shares issued for the Company's PolyesterPlant installation in 1980 and share premium of Rs 464.357 million representing the difference between nominal value of Rs 10per share of 12,618,391 ordinary shares issued by the Company and the market value of Rs 590.541 million of these sharescorresponding to 25% holding acquired in LOTTE Pakistan PTA Limited (formerly Pakistan PTA Limited), an ex-associate, atthe date of acquisition i.e. November 2, 2001 and the number of shares that have been issued were determined in accordancewith the Scheme in the ratio between market value of the shares of two companies based on the mean of the middle marketquotation of the Karachi Stock Exchange over the ten trading days between October 22, 2001 to November 2, 2001.
5.2 Capital receipts represent the amount received from various ICI PLC group companies overseas for the purchase of property,plant and equipment. The remitting companies have no claim to their repayments.
6. Surplus on Revaluation of Property, Plant and Equipment
Balance as on January 1 977,323 1,034,851
Less: Transfer to unappropriated profit in respect of incremental depreciation charged during the year net of deferred tax (33,199) (57,528)
Balance as on December 31 944,124 977,323
Amounts in Rs '000

Annual Report 2009
121
Notes to the Consolidated Financial StatementsFor the year ended December 31, 2009
Amounts in Rs '000
7. Provisions for non-management staff gratuity and eligible retired employees' medical scheme - note 7.1 183,258 142,489
7.1 Staff Retirement Benefits2009 2008
Funded Unfunded Funded UnfundedPension Gratuity Total Pension Gratuity Total
7.1.1 The amounts recognised in the profit and loss account against defined benefit schemes are as follows:
Current service cost 24,526 26,223 50,749 7,535 27,894 25,302 53,196 5,813Interest cost 153,634 62,926 216,560 41,173 102,880 39,967 142,847 22,172Expected return on plan assets (98,449) (31,903) (130,352) - (92,075) (30,167) (122,242) -Termination cost 13,043 - 13,043 - - - - -Past service cost - - - - (69,114) - (69,114) -Recognition of actuarial loss 101,997 13,582 115,579 7,300 18,053 8,414 26,467 5,742
Net (Surplus) / Charge for the year 194,751 70,828 265,579 56,008 (12,362) 43,516 31,154 33,727
7.1.2 Movements in the net asset / (liability) recognised in the balance sheet are as follows:
Opening balance 238,716 62,148 300,864 (142,489) 190,191 18,771 208,962 (119,809)Net (Charge) / Surplus for the year - note 7.1.1 (194,751) (70,828) (265,579) (56,008) 12,362 (43,516) (31,154) (33,727)Contributions / payments during the year 275,472 42,547 318,019 15,239 36,163 86,893 123,056 11,047
Closing balance 319,437 33,867 353,304 (183,258) 238,716 62,148 300,864 (142,489)
7.1.3 The amounts recognised in the balance sheet are as follows:
Fair value of plan assets - note 7.1.5 1,037,319 317,150 1,354,469 - 815,658 310,404 1,126,062 -Present value of defined benefit obligation - note 7.1.4 (1,285,827) (462,971) (1,748,798) (340,084) (1,117,525) (442,477) (1,560,002) (259,784)(Deficit) (248,508) (145,821) (394,329) (340,084) (301,867) (132,073) (433,940) (259,784)Unrecognised actuarial loss 567,945 179,688 747,633 156,826 540,583 194,221 734,804 117,295
Recognised asset / (liability) 319,437 33,867 353,304 (183,258) 238,716 62,148 300,864 (142,489)
7.1.4 Movement in the present value of defined benefit obligation:
Opening balance 1,117,525 442,477 1,560,002 259,784 977,855 373,060 1,350,915 204,472Current service cost 24,526 26,223 50,749 7,535 27,894 25,302 53,196 5,813Interest cost 153,634 62,926 216,560 41,173 102,880 39,967 142,847 22,172Benefits paid (286,286) (103,768) (390,054) (15,239) (92,439) (38,789) (131,228) (11,047)Termination cost 13,043 - 13,043 - - - - -Past service cost - note 7.1.8 - - - - (69,114) - (69,114) -Actuarial loss 263,385 35,113 298,498 46,831 170,449 42,937 213,386 38,374Present value of the defined benefit obligation at the end of the year 1,285,827 462,971 1,748,798 340,084 1,117,525 442,477 1,560,002 259,784
7.1.5 Movement in the fair value of plan assets:
Opening balance 815,658 310,404 1,126,062 - 1,038,068 274,870 1,312,938 -Expected return 98,449 31,903 130,352 - 92,075 30,167 122,242 -Contributions 275,472 42,547 318,019 - 36,163 86,893 123,056 -Benefits paid (286,286) (103,768) (390,054) - (92,439) (38,789) (131,228) -Actuarial gain / (loss) 134,026 36,064 170,090 - (258,209) (42,737) (300,946) -Fair value of plan assets at the end of the year 1,037,319 317,150 1,354,469 - 815,658 310,404 1,126,062 -
7.1.6 Historical information
As at December 31 2009 2008 2007 2006 2005Present Value of defined benefit obligation 2,088,882 1,819,786 1,555,387 1,236,483 1,199,351Fair value of plan assets 1,354,469 1,126,062 1,312,938 1,067,109 1,014,442Deficit 734,413 693,724 242,449 169,374 184,909
Experience adjustments on plan liabilities 3% 13% 16% 1% 8%Experience adjustments on plan assets 13% (27%) 7% (9%) 7%
7.1.7 Major categories / composition of plan assets are as follows: 2009 2008
Debt instruments 50% 20%Equity 32% 20%Cash 18% 60%
These figures are based on the latest actuarial valuation, as at December 31, 2009. The valuation uses the Projected Unit Credit method. Actuarial gainsand losses are amortised over the expected future service life of current members.
Mortality of active employees and pensioners have been amended as 70 % of the EFU (61-66) Table (i.e. in 2008 valuation assumed mortality representedby EFU (61-66) Table). The table has been rated down three years for mortality of female pensioners and widows.
The return on plan assets was assumed to equal the discount rate. Actual (loss) / return on plan assets during 2009 was Rs 300.442 million (2008: Rs 178.704 million).
2009 2008
Annual Report 2009
122
Notes to the Consolidated Financial StatementsFor the year ended December 31, 2009
7.1.8 Past service cost reflects a revision in the conversion factor for commutation of pension to lump sums.
7.1.9 The principal actuarial assumptions at the reporting date were as follows:2009 2008
Discount rate 12.75% 16.00%Expected return on plan assets 12.75% 16.00%Future salary increases 10.60% 13.79%Future pension increases 7.38% 10.48%
7.1.10 Medical cost trend is assumed to follow inflation. The sensitivity to reflect the effect of a 1% movement in the assumedmedical cost trend were as follows:
2009 Increase Decrease
Effect on the aggregate of the current service cost and interest cost 28,909 4,624 (3,385)Effect on the defined benefit obligation 257,794 40,233 (32,763)
7.1.11 The Group contributed Rs 55.553 million (2008: Rs 49.674 million) and Rs 29.321 million (2008: Rs 23.832 million) to theprovident fund and the defined contribution superannuation fund respectively during the year.
2009 2008Restated
8. Deferred Tax (Liability) / Asset Opening (Charge) / Closing Opening (Charge) / Closingreversal reversal
Deductible temporary differencesTax losses carried forward 214,425 (214,425) - 1,289,149 (1,074,724) 214,425
Provisions for retirement benefits, doubtful debts and others 413,741 (77,420) 336,321 185,839 227,902 413,741
Taxable temporary differencesProperty, plant and equipment (1,098,870) (262,549) (1,361,419) (1,104,582) 5,712 (1,098,870)
(470,704) (554,394) (1,025,098) 370,406 (841,110) (470,704)
2009 2008
9. Short-Term Financing
Running finances utilised under mark-up arrangements - note 9.1 36,038 227,939
36,038 227,939
9.1 Running finance
The facilities for running finance available from various banks amounted to Rs 2,991 million (2008: Rs 2,831 million) and carried mark-up during the period ranging from 12.64 to 17.37 percent per annum (2008: 15.22 to 17.59 percent perannum). The facilities are secured by hypothecation charge over the present and future stock-in-trade and book debts ofthe Group and first pari passu charge over plant and machinery of Polyester Business of the Group.
9.2 Term finance
The facilities for term finance available from various banks amount to Rs nil (2008: Rs 550 million).
Amounts in Rs '000

Annual Report 2009
123
Notes to the Consolidated Financial StatementsFor the year ended December 31, 2009
2009 2008Restated
Amounts in Rs '000
10. Trade and Other Payables
Trade creditors - note 10.1 977,600 1,203,954Bills payable 2,270,855 688,008Sales tax, excise and custom duties 177,618 118,476Mark-up accrued on short-term financing 2,712 15,611Accrued interest / return on unsecured loan - note 10.2 299,647 281,081Accrued expenses 1,177,342 974,332Technical service fee / royalty 35,975 29,382Workers' profit participation fund - note 10.3 165,103 148,214Workers' welfare fund 119,954 156,000Distributors' security deposits - payable on termination of distributorship - note 10.4 71,993 55,222Contractors' earnest / retention money 10,103 9,680Advances from customers 248,727 362,902Unclaimed dividends 4,548 4,549Payable for capital expenditure 139,532 223,738Provision for compensated absences - note 10.5 20,000 20,000Others 151,781 225,158
5,873,490 4,516,307
10.1 The above balances include amounts due to following associated undertakings:
LOTTE Pakistan PTA Limited formerly Pakistan PTA Limited - note 10.1.1 - 342,989ICI Paints UK (part of AkzoNobel group) 6,911 6,434ICI Paints (Asia Pacific) PTE Ltd (part of AkzoNobel group) 26,105 9,548AkzoNobel Paints Malaysia 3,392 1,882Marine Protective International Coating Malaysia 1,400 -ICI Paints Indonesia (part of AkzoNobel group) 101 95CR Netherlands 5,339 40,100
43,248 401,048
10.1.1 This Company was part of AkzoNobel till September 17, 2009.
10.2 This represents amount payable to Mortar Investments International Limited.
10.3 Workers' profit participation fund
Balance as on January 1 148,214 147,360Allocation for the year - note 30 162,326 147,873
310,540 295,233Interest on funds utilised in the Company's businesses at 41.25 percent (2008: 41.25 percent) per annum - note 29 2,105 3,637
312,645 298,870Less: - Amount paid on behalf of the fund 72,260 53,927 - Deposited with the Government of Pakistan 75,282 96,729
147,542 150,656
Balance as on December 31 165,103 148,214
10.4 Interest on security deposits from certain distributors is payable at 7.5 percent (2008: 7.5 percent) per annum as specifiedin the respective agreements.
10.5 This figure is based on the latest actuarial valuation, as at December 31, 2009.

11. Contingencies and Commitments
11.1 Claims against the Group not acknowledged as debts are as follows:
Local bodies 32,342 32,242Sales tax authorities 93,323 92,844Others 53,396 87,844
179,061 212,930
11.2 A notice has been issued by the Environmental Protection Authority (EPA) against the Paints factory located at Ferozpurroad, Lahore. Pursuant to this an order has been passed by the EPA for asserted violation of certain provisions of the act.The Company has filed an appeal against the order in the Environmental Tribunal in Lahore and is of the opinion that theorder is not justified.
11.3 Guarantees issued by the Company in respect of financial and operational obligations of LOTTE Pakistan PTA Limited(formerly Pakistan PTA Limited) pursuant to the Scheme of arrangement, amounting to Rs 2,280 million (2008: Rs 2,370million) against which LOTTE Pakistan PTA Limited (formerly Pakistan PTA Limited) and KP Chemicals Corporation hasissued counter guarantees to the Company.
11.4 Guarantee issued by the Company to a bank in respect of financing obtained by Senior Executives amounted to Rs 35million (2008: Rs 48 million), in accordance with the terms of employment.
11.5 Guarantee issued by the Company of Rs 133 million (2008: Rs 133 million) to a bank on behalf of its subsidiary ICI PakistanPowerGen Limited for availing funded facility.
11.6 Commitments in respect of capital expenditure amounted to Rs 33.875 million (2008: Rs 149.29 million).
11.7 Commitments for rentals under operating lease/Ijarah contracts in respect of vehicles amounting to Rs 196.685 million(2008: Rs 149.387 million) are as follows:
Year
2009 - 59,7732010 67,213 52,7742011 58,633 27,8092012 45,772 8,9332013 23,797 982014 1,270 -
196,685 149,387
Payable not later than one year 67,213 59,773Payable later than one year but not later than five years 129,472 89,614
196,685 149,387
11.8 Outstanding foreign exchange contracts as at December 31, 2009 entered into by the Group to hedge the anticipated futuretransactions amounted to Rs nil (2008: Rs 54.841 million).
Annual Report 2009
124
Notes to the Consolidated Financial StatementsFor the year ended December 31, 2009
Amounts in Rs '000
2009 2008

12. Property, Plant and Equipment
12.1 The following is a statement of property, plant and equipment:
Operating property, plant and equipment - note 12.2 9,445,987 8,214,163Capital work-in-progress - note 12.6 416,883 1,855,221
9,862,870 10,069,384
12.2 The following is a statement of operating property, plant and equipment:
Land Lime beds Buildings Plant and Railway Rolling Furniture TotalFreehold Leasehold on freehold On On machinery sidings stock and and
land freehold leasehold vehicles equipmentland land
2009
Net carrying value basisYear ended December 31, 2009
Opening net book value (NBV) 836,702 7,149 78,256 243,783 455,945 6,431,761 - 31,742 128,825 8,214,163
Addition/transfer (at cost) - - - 30,721 332,621 1,743,506 - 7,560 78,880 2,193,288
Disposal/transfer (at NBV) - - - - - (9,229) - (2,077) (549) (11,855)
Depreciation charge - (4,312) (9,741) (33,258) (63,189) (783,646) - (11,143) (44,320) (949,609)
Closing net book value (NBV) 836,702 2,837 68,515 241,246 725,377 7,382,392 - 26,082 162,836 9,445,987
Gross carrying value basisAt December 31, 2009
Cost/Revaluation 836,702 567,799 133,820 947,003 1,293,917 18,014,527 297 120,598 669,585 22,584,248
Accumulated Depreciation - (564,962) (65,305) (705,757) (568,540) (10,632,135) (297) (94,516) (506,749) (13,138,261)
Net book value 836,702 2,837 68,515 241,246 725,377 7,382,392 - 26,082 162,836 9,445,987
Depreciation rate % per annum - 2 to 4 3.33 to 7.5 5 to 10 2.5 to 10 3.33 to 10 3.33 10 to 25 10 to 33.33
2008
Net carrying value basisYear ended December 31, 2008
Opening net book value (NBV) 836,702 27,910 69,326 244,172 484,368 6,140,870 - 21,490 123,864 7,948,702
Addition/transfer (at cost) - - 15,498 32,601 23,470 979,377 - 20,278 45,241 1,116,465
Disposal/transfer (at NBV) - - - - (135) (3,248) - (198) (917) (4,498)
Depreciation charge - (20,761) (6,568) (32,990) (51,758) (685,238) - (9,828) (39,363) (846,506)
Closing net book value (NBV) 836,702 7,149 78,256 243,783 455,945 6,431,761 - 31,742 128,825 8,214,163
Gross carrying value basisAt December 31, 2008Cost/Revaluation 836,702 567,799 133,820 916,282 961,296 16,307,819 297 124,837 607,462 20,456,314
Accumulated Depreciation - (560,650) (55,564) (672,499) (505,351) (9,876,058) (297) (93,095) (478,637) (12,242,151)
Net book value 836,702 7,149 78,256 243,783 455,945 6,431,761 - 31,742 128,825 8,214,163
Depreciation rate % per annum - 2 to 4 3.33 to 7.5 5 to 10 2.5 to 10 3.33 to 10 3.33 10 to 25 10 to 33.33
12.3 Subsequent to revaluation on October 1, 1959 and September 30, 2000, which had resulted in a surplus of Rs 14.207million and Rs 1,569.869 million respectively, the land and plant and machinery were revalued again on December 15,2006 resulting in a net surplus of Rs 667.967 million. The valuation was conducted by independent valuers. Valuations forplant and machinery was the open market value of the asset based on estimated gross replacement cost, depreciated toreflect the residual service potential of the asset having paid due regard to age, condition and obsolescence. Land wasvalued on the basis of fair market value.
Annual Report 2009
125
Notes to the Consolidated Financial StatementsFor the year ended December 31, 2009
Amounts in Rs '000
2009 2008

Annual Report 2009
126
Notes to the Consolidated Financial StatementsFor the year ended December 31, 2009
Amounts in Rs '000
12.4 Had there been no revaluation, the net book value of specific classes of operating property, plant and equipment wouldhave amounted to:
2009 2008Net Book Value
Freehold land 20,929 20,929Leasehold land - 15Plant and machinery 7,155,501 6,202,020Rolling stock and vehicles 26,082 31,742Furniture and equipment 162,836 128,825
7,365,348 6,383,531
12.5 The depreciation charge for the year has been allocated as follows:
Cost of sales - note 26 902,164 806,395Selling and distribution expenses - note 27 12,726 11,744Administration and general expenses - note 28 34,719 28,367
949,609 846,506
12.6 The following is a statement of capital work-in-progress:
Designing, consultancy and engineering fee - 49,782Civil works and buildings 51,121 274,650Plant and machinery 209,638 1,317,181Miscellaneous equipment 33,664 125,227Advances to suppliers / contractors 122,460 88,381
416,883 1,855,221

Annual Report 2009
127
12.7 Details of operating property, plant and equipment disposals having net book value in excess of Rs 50,000 are as follows:
2009 Mode of sale Cost Accumulated Net book Sale Particulars of buyers depreciation value proceedsPlant and machinery
Dust extraction unit and other items Auction 28,576 23,089 5,487 3,338 Hi-Tech Electronics & Machinery, Karachi
Tinting Machines Negotiation 4,429 710 3,719 3,719 Jaffer and Sons, Chaudhry Paint House, Color Bankand Awan Brothers, Lahore
Rolling stock and vehicles
Toyota Corolla - 2 nos Negotiation 1,481 734 747 2,088 Tufail Iqbal & M Inam, Lahore
Hino Dump Trucks Auction 8,808 7,519 1,289 1,902 Hi-Tech Electronics & Machinery, Karachi
2008
Building
Corroded pipes in plant and steel Negotiation 336 201 135 130 Shahbaz & Company, Malakwal
Plant and machinery
Cables and switch Tender 912 508 404 866 Sheikh Khalil Ahmed, Lahore
Chain conveyer / Agitator tubes Negotiation 12,373 9,604 2,769 1,150 Shahbaz & Company, Malakwal
Rolling stock and vehicles
Toyota Corolla Negotiation 59 - 59 785 Bilal Saeed, Lahore
Suzuki Potohar Auction 221 156 65 307 Abdul Qadir, Lahore
Furniture and equipment
Multimedia Negotiation 213 90 123 20 KBS Enterprises, Karachi
Multimedia Negotiation 109 31 78 20 General Traders, Karachi
Furniture Auction 311 143 168 40 Irfan Traders, Lahore
Air conditioners Negotiation 275 156 119 75 Shahbaz & Company, Malakwal
Computers and servers Negotiation 172 108 64 50 Mega Computer, Lahore
Amounts in Rs '000
Notes to the Consolidated Financial StatementsFor the year ended December 31, 2009

Notes to the Consolidated Financial StatementsFor the year ended December 31, 2009
Annual Report 2009
128
Amounts in Rs '000
2009 2008
13. Intangible Asset - SAP
Net carrying value basisYear ended December 31
Opening net book value (NBV) 7,700 39,737Amortisation charge (7,700) (32,037)
Closing net book value (NBV) - 7,700
Gross carrying amount At December 31
Cost 168,781 168,781Accumulated amortisation (168,781) (161,081)
Net book value - 7,700
Rate of amortisation 20% 20%
13.1 The amortisation charge for the year has been allocated as follows:
Cost of sales - note 26 3,636 15,128Selling and distribution expenses - note 27 639 2,657Administration and general expenses - note 28 3,425 14,252
7,700 32,037
14. Long-Term Investment - At cost
Unquoted Equity security available for sale - Arabian Sea Country Club Limited 2,500 2,500
15. Long-Term Loans - Considered good
Due from Executives and Employees - note 15.1 131,430 131,314
15.1 Due from Executives and Employees
Motor car House Total Totalbuilding
Due from Directors and Executives 74,647 47,109 121,756 102,117
Less: Receivable within one year 9,965 15,154 25,119 22,630
64,682 31,955 96,637 79,487
Due from Employees 55,156 71,350Less: Receivable within one year 20,363 19,523
34,793 51,827
131,430 131,314
Outstanding for period: - less than three years but over one year 70,636 90,941 - more than three years 60,794 40,373
131,430 131,314

Notes to the Consolidated Financial StatementsFor the year ended December 31, 2009
Annual Report 2009
129
Amounts in Rs '000
2009 2008
15.2 Reconciliation of the carrying amount of loans to Directors / Executives:
Opening balance at beginning of the year 102,117 71,913Disbursements 79,293 84,345Repayments (59,654) (54,141)
Balance at end of the year 121,756 102,117
The loan to executive include an amount of Rs 1.595 million (2008: Rs 2.870 million) in respect of house building relatingto key management personnel. Loan outstanding during the year relates to Mr. Ali A. Aga (Director), who was provided thisloan as per his terms of employment.
15.3 Loans for purchase of motor cars and house building are repayable between two to ten years. These loans are interestfree and granted to the employees including executives of the Group in accordance with their terms of employment.
15.4 The maximum aggregate amount of long-term loans due from the Executives at the end of any month during the year wasRs 125.362 million (2008: Rs 102.117 million).
16. Long-Term Deposits and Prepayments
Deposits 21,211 22,291Prepayments 7,867 8,393
29,078 30,684
17. Stores and Spares
Stores (include in-transit Rs 11.628 million; 2008: Rs 13.311 million) 37,563 47,330Spares 562,708 574,113Consumables 86,681 85,391
686,952 706,834Less: Provision for slow moving and obsolete items 132,371 125,361
554,581 581,473
17.1 Movement of provision in stores and spares
Opening 125,361 73,361Charge - note 28 40,000 52,000Write-off (32,990) -
Closing 132,371 125,361
18. Stock-in-Trade
Raw and packing material (include in-transit Rs 219.830 million; 2008:Rs 386.242 million) 1,291,521 1,503,680Work-in-process 83,229 134,237Finished goods (include in-transit Rs 9.23 million; 2008: Nil) 1,997,408 1,441,647
3,372,158 3,079,564Less: Provision for slow moving and obsolete stock - Raw materials 63,944 67,435 - Finished goods 54,869 46,430
118,813 113,865
3,253,345 2,965,699

18.1 Movement of provision in stock-in-trade
Opening 113,865 117,732Charge - note 28 38,617 108,407Reversal (5,000) -Write-off (28,669) (112,274)
Closing 118,813 113,865
Stock amounting to Rs 18.663 million (2008: Rs 392.2 million) are measured at net realisable value and has been writtendown by Rs 1.62 million (2008: Rs 61.6 million) to arrive at its net realiseable value.
19. Trade Debts
Considered good
- Secured 382,380 305,110 - Unsecured 812,321 953,347
1,194,701 1,258,457Considered doubtful 277,631 193,363
1,472,332 1,451,820Less: Provision for: - Doubtful debts 277,631 193,363 - Discounts payable 249,822 426,395
527,453 619,758
944,879 832,062
20. Loans and Advances
Considered good
Loans due from: Executives - note 15.1 25,119 22,630 Employees - note 15.1 20,363 19,523
45,482 42,153Advances to: Directors and Executives - note 20.1 6,012 5,530 Employees 6,808 5,428 Contractors and suppliers 61,019 42,155 Others 5,619 3,104
79,458 56,217
124,940 98,370Considered doubtful 8,120 8,120
133,060 106,490Less: Provision for doubtful loans and advances 8,120 8,120
124,940 98,370
20.1 The maximum aggregate amount of advances due from the Directors and Executives at the end of any month during theyear was Rs 3.967 million and Rs 4.446 million (2008: Rs 2.620 million and Rs 15.056 million) respectively.
Notes to the Consolidated Financial StatementsFor the year ended December 31, 2009
Annual Report 2009
130
Amounts in Rs '000
2009 2008Restated

Notes to the Consolidated Financial StatementsFor the year ended December 31, 2009
Annual Report 2009
131
Amounts in Rs '000
21. Trade Deposits and Short-Term Prepayments
Trade deposits 9,768 24,159Short-term prepayments 444,665 381,860
454,433 406,019
22. Other Receivables
Considered good
Duties, sales tax and octroi refunds due 254,775 307,534Due from Associate - note 22.1 & 22.2 85,225 67,582Insurance claims 11,887 23,360Commission receivable 39,829 18,159Interest income receivable 4,058 -Rebates receivable 123,427 194,522Others 194,243 178,802
713,444 789,959Considered doubtful 17,383 17,533
730,827 807,492Less: Provision for doubtful receivables - note 22.3 17,383 17,533
713,444 789,959
22.1 The maximum aggregate amount due from ICI Omicron B.V. at the end of any month during the year was Rs 81.978 million(2008: Rs 67.582 million).
22.2 The above balances include amounts due from following associated undertakings:
ICI Omicron B.V. wholly owned subsidiary of AkzoNobel N.V. 80,420 67,582ICI Paints Vietnam ( Part of AkzoNobel group ) 4,805 -
85,225 67,582
22.3 Movement of provision for doubtful receivables
Opening 17,533 15,904Charge - note 28 - 1,629Reversal (150) -
Closing 17,383 17,533
23. Cash and Bank Balances
Short term deposits 3,350,000 120,000Current accounts 1,016,353 1,615,561In hand - Cheques 169,633 221,248 - Cash 11,727 14,946
4,547,713 1,971,755
2009 2008

Notes to the Consolidated Financial StatementsFor the year ended December 31, 2009
Annual Report 2009
132
Amounts in Rs '000
24. Operating ResultsPolyester Soda Ash Paints Life Sciences Chemicals Others-PowerGen Group Group
Note 2009 2008 2009 2008 2009 2008 2009 2008 2009 2008 2009 2008 2009 2008 Restated Restated
SalesAfghanistan - - - - 88,800 82,000 - - - - - - 88,800 82,000Bangladesh - - 86,476 46,685 - - - - 6,888 13,313 - - 93,364 59,998India - - 27,882 - - - - - - - - - 27,882 -South Africa - - 76,605 - - - - - - - - - 76,605 -United Arab
Emirates - - 16,556 35,354 - - - - 158 - - - 16,714 35,354Others - - 3,989 - - 11,900 810 691 18,055 6,910 - - 22,854 19,501
- - 211,508 82,039 88,800 93,900 810 691 25,101 20,223 - - 326,219 196,853
Inter-segment - - - - - - - - 276,573 569,840 676,003 452,449 952,576 1,022,289
Local 13,242,345 12,187,914 6,360,285 6,428,445 6,136,722 7,114,309 3,740,030 3,373,373 2,508,705 2,530,635 - - 31,988,087 31,634,676
13,242,345 12,187,914 6,571,793 6,510,484 6,225,522 7,208,209 3,740,840 3,374,064 2,810,379 3,120,698 676,003 452,449 33,266,882 32,853,818
Commission / Toll income - 4,490 - - - - - - 84,875 85,854 - - 84,875 90,344
Turnover 13,242,345 12,192,404 6,571,793 6,510,484 6,225,522 7,208,209 3,740,840 3,374,064 2,895,254 3,206,552 676,003 452,449 33,351,757 32,944,162
Sales tax - - 1,073,105 1,064,410 811,979 905,199 - - 272,088 251,467 93,242 63,858 2,250,414 2,284,934
Excise Duty - - 52,328 53,109 49,947 57,149 - - 7,010 6,080 - - 109,285 116,338
Commission and discounts to distributors and customers 44,517 54,254 107,539 126,512 1,006,822 1,121,653 374,927 360,139 169,022 122,986 - - 1,702,827 1,785,544
44,517 54,254 1,232,972 1,244,031 1,868,748 2,084,001 374,927 360,139 448,120 380,533 93,242 63,858 4,062,526 4,186,816Net sales,
commission & toll income 13,197,828 12,138,150 5,338,821 5,266,453 4,356,774 5,124,208 3,365,913 3,013,925 2,447,134 2,826,019 582,761 388,591 29,289,231 28,757,346
Cost of sales 26 11,794,598 11,155,231 3,896,339 3,716,355 2,986,743 3,695,790 2,383,614 1,983,934 1,969,284 2,321,668 493,410 497,117 23,522,248 23,368,355
Gross profit 1,403,230 982,919 1,442,482 1,550,098 1,370,031 1,428,418 982,299 1,029,991 477,850 504,351 89,351 (108,526) 5,766,983 5,388,991
Selling and distribution expenses 27 75,236 54,738 112,223 83,807 725,114 650,223 424,700 410,673 132,901 117,817 - - 1,470,174 1,317,258
Administration and general expenses 28 239,111 196,463 291,821 253,314 381,949 444,863 137,107 130,420 128,076 101,099 546 6,282 1,178,370 1,132,201
Operating result 1,088,883 731,718 1,038,438 1,212,977 262,968 333,332 420,492 488,898 216,873 285,435 88,805 (114,808) 3,118,439 2,939,532
24.1 Segment assets 6,262,004 6,221,622 6,042,615 6,398,339 2,317,535 2,654,665 1,429,433 1,047,091 767,910 828,952 366,796 545,010 17,186,293 17,695,679
24.2 Unallocated assets 3,893,160 610,016
21,079,453 18,305,695
24.3 Segment liabilities 2,297,646 1,053,424 1,998,609 1,506,505 753,310 1,135,559 1,331,383 763,269 322,872 301,285 109,869 297,675 6,813,689 5,057,717
24.4 Unallocated liabilities 304,195 299,722
7,117,884 5,357,439
24.5 Non-cash items (Provision for non-management staff gratuity 10,249 5,718 27,052 17,493 8,121 4,710 5,041 2,691 5,545 3,028 - 87 56,008 33,727 and eligible retired employees' medical scheme)
24.6 Depreciation & amortisation 326,976 350,285 436,885 361,614 72,376 59,135 14,507 16,013 19,944 18,997 86,621 72,499 957,309 878,543
24.7 Capital expenditure 83,573 100,971 461,508 1,386,174 148,599 68,111 16,489 17,416 36,015 53,061 8,766 519,441 754,950 2,145,174
24.8 Inter-segment pricing
Transactions among the business segments are recorded at arm's length prices using admissible valuation methods.
24.9 There were no major customer’s of the Group which formed 10 per cent or more of the Group's revenue.

Notes to the Consolidated Financial StatementsFor the year ended December 31, 2009
Annual Report 2009
133
Amounts in Rs '000
25. Reconciliations of reportable segment turnover, cost of sales, assets and liabilities
25.1 Turnover
Total turnover for reportable segments - note 24 33,351,757 32,944,162
Elimination of inter-segment turnover (276,573) (569,840)
Elimination of inter-segment turnover from subsidiary (676,003) (452,449)
Total turnover 32,399,181 31,921,873
25.2 Cost of sales
Total cost of sales for reportable segments - note 26 23,522,248 23,368,355
Elimination of inter-segment revenue (276,573) (569,840)
Elimination of inter-segment revenue from subsidiary (676,003) (452,449)
Total cost of sales 22,569,672 22,346,066
25.3 Assets
Total assets for reportable segments 17,186,293 17,695,679
Taxation recoverable 460,240 419,934
Bank deposits - note 23 3,350,000 120,000
Due from Associates - note 22.1 80,420 67,582
Long term Investments - note 14 2,500 2,500
Total assets 21,079,453 18,305,695
25.4 Liabilities
Total liabilities for reportable segments 6,813,689 5,057,717
Accrued interest / return on unsecured loan 299,647 295,173
Unclaimed dividends - note 10 4,548 4,549
Total liabilities 7,117,884 5,357,439
2009 2008

Notes to the Consolidated Financial StatementsFor the year ended December 31, 2009
Annual Report 2009
134
Amounts in Rs '000
26. Cost of SalesPolyester Soda Ash Paints Life Sciences Chemicals Others-PowerGen Group Group
2009 2008 2009 2008 2009 2008 2009 2008 2009 2008 2009 2008 2009 2008 Restated Restated
Raw and packing materials consumed
Opening stock 512,080 506,824 370,987 135,447 324,080 146,172 111,021 159,410 104,334 79,537 13,743 17,039 1,436,245 1,044,429
Purchases Inter-segment - - - - 276,573 569,840 - - - - - - 276,573 569,840
Others 10,263,852 9,739,672 1,251,854 1,854,823 2,328,255 2,964,033 776,709 563,465 840,470 951,331 86,268 232,873 15,547,408 16,306,197
10,263,852 9,739,672 1,251,854 1,854,823 2,604,828 3,533,873 776,709 563,465 840,470 951,331 86,268 232,873 15,823,981 16,876,037
10,775,932 10,246,496 1,622,841 1,990,270 2,928,908 3,680,045 887,730 722,875 944,804 1,030,868 100,011 249,912 17,260,226 17,920,466
Closing stock - note 18 (612,350) (512,080) (74,436) (370,987) (285,368) (324,080) (146,489) (111,021) (100,114) (104,334) (8,820) (13,743) (1,227,577) (1,436,245)
Raw material consumed 10,163,582 9,734,416 1,548,405 1,619,283 2,643,540 3,355,965 741,241 611,854 844,690 926,534 91,191 236,169 16,032,649 16,484,221
Salaries, wages and benefits 332,146 256,109 499,952 410,304 81,234 74,667 3,037 2,764 37,879 23,539 14,767 11,456 969,015 778,839
Stores and spares consumed 90,109 90,866 114,679 118,300 4,476 1,763 - - 2,801 4,288 15,293 19,852 227,358 235,069
Conversion fee paid to contract
manufacturers - - - - - - 186,899 172,532 4,416 5,455 - - 191,315 177,987
Oil, gas and electricity 841,024 665,838 1,406,785 1,170,754 28,235 16,851 - - 8,128 7,290 271,999 149,372 2,556,171 2,010,105
Rent, rates and taxes 846 1,599 655 506 6,210 444 - - 9,857 9,819 1,036 672 18,604 13,040
Insurance 15,497 20,703 12,755 15,979 26,518 20,665 3 2 300 187 1,518 2,002 56,591 59,538
Repairs and maintenance 950 955 43 125 18,190 11,895 11 10 3,174 2,334 151 121 22,519 15,440
Depreciation and amortisation - 320,585 343,074 423,211 345,323 60,803 47,927 694 597 13,886 12,103 86,621 72,499 905,800 821,523 note 12.5 & 13.1
Excise duty - - - - - - - - - - 5,854 3,951 5,854 3,951
Technical fees - - - - 19,279 24,215 1,445 1,462 3,010 - - - 23,734 25,677
Royalty - - - - - - 1,008 1,173 24,470 18,265 - - 25,478 19,438
General expenses - note 26.2 92,148 87,759 64,268 56,045 57,373 76,292 452 798 10,431 10,277 4,980 1,023 227,912 230,454
Opening stock of work-in-process 108,866 72,892 - - 19,851 115,205 5,024 3,084 496 946 - - 134,237 192,127
Closing stock of work-in-process - note 18 (54,163) (108,866) - - (15,600) (19,851) (11,811) (5,024) (1,655) (496) - - (83,229) (134,237)
Cost of goods manufactured 11,911,590 11,165,345 4,070,753 3,736,619 2,950,109 3,726,038 928,003 789,252 961,883 1,020,541 493,410 497,117 21,314,008 20,933,172
Opening stock of finished goods 392,244 375,903 33,140 12,876 221,852 188,092 476,184 330,283 271,797 184,665 - - 1,395,217 1,091,819
Finished goods purchased - 6,227 - - 85,700 103,600 1,826,217 1,347,098 882,262 1,390,063 - - 2,794,179 2,846,988
12,303,834 11,547,475 4,103,893 3,749,495 3,257,661 4,017,730 3,230,404 2,466,633 2,115,942 2,595,269 493,410 497,117 25,503,404 24,871,979Closing stock of finished goods - note 18 (509,236) (392,244) (207,554) (33,140) (246,586) (221,852) (837,505) (476,184) (141,658) (271,797) - - (1,942,539) (1,395,217)
Provision for obsolete stocks
- note 28 - - - - (24,332) (100,088) (9,285) (6,515) (5,000) (1,804) - - (38,617) (108,407)
11,794,598 11,155,231 3,896,339 3,716,355 2,986,743 3,695,790 2,383,614 1,983,934 1,969,284 2,321,668 493,410 497,117 23,522,248 23,368,355
26.1 Staff retirement benefits
Salaries, wages and benefits include Rs 193.055 million (2008: Rs 45.524 million) in respect of staff retirement benefits.
26.2 Service Charges from subsidiary
This includes amount Rs 1.740 million charged by the Company for certain administrative service charges in accordance with the service level agreement which have been eliminated from the total.

27. Selling and Distribution ExpensesPolyester Soda Ash Paints Life Sciences Chemicals Others-PowerGen Group Group
2009 2008 2009 2008 2009 2008 2009 2008 2009 2008 2009 2008 2009 2008 Restated Restated
Salaries and benefits 40,591 32,209 24,581 18,389 195,676 152,402 184,344 147,224 63,531 51,355 - - 508,723 401,579
Repairs and maintenance 122 69 1,063 863 3,537 2,687 1,862 1,531 1,033 623 - - 7,617 5,773
Advertising and sales promotion 15,480 1,064 896 1,251 262,189 244,830 64,513 90,357 987 2,091 - - 344,065 339,593
Rent, rates and taxes - - 922 921 23,491 25,254 4,404 4,666 1,182 1,482 - - 29,999 32,323
Insurance - - 434 914 - - 3,866 5,128 3,340 4,091 - - 7,640 10,133
Lighting, heating and cooling 17 15 873 885 4,807 3,721 1,969 1,684 206 258 - - 7,872 6,563
Depreciation and amortisation - note 12.5 & 13.1 59 248 327 209 - - 11,195 12,467 1,784 1,477 - - 13,365 14,401
Outward freight and handling 7,078 7,515 69,972 48,363 172,953 159,682 22,395 23,071 28,089 21,610 - - 300,487 260,241
Travelling expenses 3,206 5,081 1,882 1,308 30,588 31,951 63,407 65,509 11,567 13,317 - - 110,650 117,166
Postage, telegram, telephone and telex 423 808 774 688 5,801 5,558 9,759 7,712 3,447 3,665 - - 20,204 18,431
General expenses 8,260 7,729 10,499 10,016 26,072 24,138 56,986 51,324 17,735 17,848 - - 119,552 111,055
75,236 54,738 112,223 83,807 725,114 650,223 424,700 410,673 132,901 117,817 - - 1,470,174 1,317,258
27.1 Staff retirement benefitsSalaries, wages and benefits include Rs 67.593 million (2008: Rs 40.995 million) in respect of staff retirement benefits.
27.2 Severance costSalaries and benefits include Rs 4.677 million (2008: Rs nil ) in respect of severance cost.
28. Administration and General Expenses
Salaries and benefits 134,531 92,194 193,284 146,769 134,481 94,962 93,672 75,817 72,479 59,887 - - 628,447 469,629
Repairs and maintenance 2,715 3,739 3,478 7,657 8,828 7,982 1,352 2,268 780 1,638 - - 17,153 23,284
Advertising and publicity 2,855 2,870 6,013 7,424 - - 1,134 1,357 1,452 1,543 - - 11,454 13,194
Rent, rates and taxes 2,551 2,341 2,877 2,527 6,302 5,963 543 459 587 520 - 1 12,860 11,811
Insurance 552 687 1,454 1,975 7,438 578 2,137 3,399 316 436 - - 11,897 7,075
Lighting, heating and cooling 3,172 2,650 5,273 4,521 3,518 2,903 3,590 3,219 1,077 953 - - 16,630 14,246
Depreciation and amortisation -
note 12.5 & 13.1 6,332 6,963 13,347 16,082 11,573 11,208 2,618 2,949 4,274 5,417 - - 38,144 42,619
Provision for doubtful debts - trade 5,610 4,130 - - 69,040 60,046 7 627 641 - - - 75,298 64,803 - others - - - - - - - 1,629 - - - - - 1,629
Provision for obsolete stocks - Note 18.1 - - - - 24,332 100,088 9,285 6,515 5,000 1,804 - - 38,617 108,407
Provision for obsolete spares - Note 17.1 40,000 45,000 - 4,000 - - - - - - - 3,000 40,000 52,000
Travelling expenses 6,491 7,404 8,142 11,548 14,626 12,787 5,631 7,773 5,349 4,060 - - 40,239 43,572
Postage, telegram, telephone and telex 1,337 1,070 2,149 2,085 8,999 13,997 2,516 2,042 1,148 1,014 - 40 16,149 20,248
General expenses note 28.3 32,965 27,415 55,804 48,726 92,812 134,349 14,622 22,366 34,973 23,827 546 3,241 231,482 259,684
239,111 196,463 291,821 253,314 381,949 444,863 137,107 130,420 128,076 101,099 546 6,282 1,178,370 1,132,201
28.1 Staff retirement benefitsSalaries, wages and benefits include Rs 132.772 million (2008: Rs 52.685 million) in respect of staff retirement benefits.
28.2 Severance costSalaries and benefits include Rs 42.903 million (2008: Rs 6.531 million) in respect of severance cost.
28.3 Service Charges from subsidiaryThis includes Rs 0.240 million charged by the Company for certain administrative service charges in accordance with the service level agreement which have been eliminated from the total.
Notes to the Consolidated Financial StatementsFor the year ended December 31, 2009
Annual Report 2009
135
Amounts in Rs '000
29. Financial Charges
Mark-up on short-term financing 19,965 26,224Interest on: Workers' profit participation fund - note 10.3 2,105 3,637Discounting charges on receivables 82,383 104,195Exchange losses 74,454 93,613Interest on security deposits 2,043 3,914Others 4,792 4,155
185,742 235,738
30. Other operating charges
Auditors' remuneration - note 30.1 6,750 7,263Donations - note 30.2 16,464 21,650Workers' profit participation fund - note 10.3 162,326 147,873Workers' welfare fund 62,896 57,056
248,436 233,842
30.1 Auditors' remuneration
Audit and Group reporting fee 5,080 5,630Half yearly review and other certifications 1,015 900Out-of-pocket expenses 655 733
6,750 7,263
30.2 Donations include Rs 13.97 million (2008: Rs 13.4 million) to ICI Pakistan Foundation (Head office, Karachi) Mr. WaqarA Malik, Chief Executive; Mr. Ali Asrar Aga and Mr. Feroz Rizvi, Directors of the Company and Mr. Suhail Aslam Khan andMr. Nasir Jamal, Executives of the Company are amongst the Trustees of the Foundation.
31. Other Operating Income
Income from related partyService fees from related party - note 31.1 2,656 6,502
Return from financial assetsProfit on short-term and call deposits 167,995 90,228
Income from non-financial assetsScrap sales 57,259 43,547Gain on disposal of property, plant and equipment 5,293 6,671
OthersProvisions and accruals no longer required written back 104,960 2,602Income on technical assistance 244 1,396Income on sale of Adhesive to Henkel 14,662 -Sundries 44,768 20,884
397,837 171,830
31.1 This represents amount charged by the Group for certain management and other services rendered to its related party(Lotte Pakistan PTA Limited formerly Pakistan PTA Limited), in accordance with the Service Agreement based on commercialterms between the Companies.
Notes to the Consolidated Financial StatementsFor the year ended December 31, 2009
Annual Report 2009
136
Amounts in Rs '000
2009 2008Restated

Notes to the Consolidated Financial StatementsFor the year ended December 31, 2009
Annual Report 2009
137
32. Taxation
Current 490,813 102,838Prior years (17,439) 6,092
Total current tax charge 473,374 108,930Deferred - note 8 554,394 841,110
Net tax charged - note 32.1 1,027,768 950,040
32.1 Tax reconciliation
Profit for the year 3,082,098 2,641,782
Tax @ 35% 1,078,734 924,623Prior years' tax charge (17,439) 6,092Permanent difference - Donations 5,762 7,578Tax impact on losses / (profit) of subsidiary - note 32.2 (3,357) 59,581Tax impact on income under FTR of the current year (40,712) (47,241)Others 4,780 (593)
Net tax charged 1,027,768 950,040
32.2 The turnover tax at the rate of 0.5% of turnover has been waived under second schedule of the income tax law ordinance2001.
33. Earnings per share - Basic and diluted
Profit after taxation for the year 2,054,330 1,691,742
Number of shares Weighted average number of ordinary shares in issue during the year 138,802,300 138,802,300
Rupees
Earnings per share 14.80 12.19
Amounts in Rs '000
2009 2008Restated
34. Remuneration of Directors and Executives
The aggregate amounts charged in the financial statements for the remuneration, including all benefits, to the Chairman,Chief Executive, Directors and Executives of the Group were as follows:
Chairman Chief Executive Directors Executives Total
2009 2008 2009 2008 2009 2008 2009 2008 2009 2008
Managerial remuneration 1,162 995 21,135 17,299 33,863 34,870 418,814 366,543 474,974 419,707Retirement benefits - - 5,321 4,474 7,383 7,622 107,981 94,817 120,685 106,913Group insurance - - 42 42 126 126 4,512 4,515 4,680 4,683Rent and house maintenance - - 5,268 5,600 - - 122,368 106,950 127,636 112,550Utilities - - 647 554 - - 30,310 26,639 30,957 27,193Medical expenses - - 203 180 419 454 15,410 15,281 16,032 15,915
1,162 995 32,616 28,149 41,791 43,072 699,395 614,745 774,964 686,961
Number of persons 1 1 1 1 5 5 328 282 335 289

Notes to the Consolidated Financial StatementsFor the year ended December 31, 2009
Annual Report 2009
138
Amounts in Rs '000
34.1 In addition to this, an amount of Rs 209.8 million (2008: Rs 179 million) on account of variable pay has been recognisedin the current year. This amount is payable in 2010 after verification of achievements against target. Further, a long termbonus of Rs 28.9 million (2008: Rs 21 million) payable to certain employees has been recognised in the financial statementswhich is payable in 2010.
Out of variable pay recognised for 2008 and 2007 following payments were made:
Paid in 2009 Paid in 2008relating to 2008 relating to 2007
Chief Executive - note 34.1.1 11,765 11,859Directors 11,400 9,976Executives 92,752 100,326Other employees 37,131 24,030
153,048 146,191
34.1.1 Included in this is a one-off Rs nil (2008: Rs 4.1 million) profit growth bonus.
34.2 The Directors and certain Executives are provided with free use of Company cars in accordance with their entitlement. TheChief Executive is provided with Company owned and maintained furnished accommodation and free use of Company car.
34.3 Aggregate amount charged in the financial statements for remuneration to three Non-executive Directors was Rs 3.228million (2008: Rs 2.482 million). This includes fees paid to directors amounting to Rs 0.249 million (2008: Rs. 0.221 million)for attending for board and other meetings.
34.4 The above balances include an amount of Rs 141.359 million (2008: Rs 165.8 million) on account of remuneration of keymanagement personnel out of which Rs 24.356 million (2008: Rs 19.896 million) relates to post employment benefits.
35. Transactions with Related Parties
The related parties comprise parent company (ICI Omicron B.V.), ultimate parent company (AkzoNobel N.V.), related groupcompanies, local associated company, directors of the Company, companies where directors also hold directorship, keyemployees (note 34) and staff retirement funds (note 7). Details of transactions with related parties, other than those whichhave been specifically disclosed elsewhere in these financial statements are as follows:
2009 2008Associated companies
Purchase of goods, materials and services 5,750,335 7,609,047Provision of services and other receipts 6,440 6,502Sale of goods and materials 126,429 142,591Dividends 789,218 631,975Donations 13,970 13,400

Notes to the Consolidated Financial StatementsFor the year ended December 31, 2009
Annual Report 2009
139
Amounts in Rs '000
36. Plant Capacity and Annual Production
- in metric tonnes except Paints which is in thousands of litres and PowerGen which is in thousand of Kilowatts:
2009 2008
Annual Production Annual ProductionName Plate Name Plate
Capacity Capacity
Polyester 122,000 123,642 122,000 112,011Soda Ash - note 36.1 350,000 269,500 285,000 266,060Paints - note 36.2 - 33,741 - 43,305Chemicals - note 36.2 - 8,477 - 9,669Sodium Bicarbonate 20,000 22,580 20,000 21,850PowerGen - note 36.3 221,978 63,765 157,476 57,650
36.1 Production was below name plate capacity due to gas curtailment and also in line with market demand.
36.2 The capacity of Paints and Chemicals is indeterminable because these are multi-product plants.
36.3 Electricity by PowerGen is produced as per demand.
37. Fair Value of Financial Assets and Liabilities
The carrying amounts of the financial assets and financial liabilities approximate their fair values.
38. FINANCIAL RISK MANAGEMENT
The Group's activities expose it to a variety of financial risks: credit risk, liquidity risk and market risk (including currencyrisk, interest rate risk and price risk). The Group's overall risk management policy focuses on the unpredictability of financialmarkets and seeks to minimize potential adverse effects on the Group's financial performance.
38.1 Risk Management Framework
The Board of Directors has overall responsibility for establishment and over sight of the Group's risk management framework.The executive management team is responsible for developing and monitoring the Group’s risk management policies. Theteam regularly meets and any changes and compliance issues are reported to the Board of Directors through the auditcommittee.
Risk management systems are reviewed regularly by the executive management team to reflect changes in market conditionsand the Group’s activities. The Group, through its training and management standards and procedures, aims to developa disciplined and constructive control environment in which all employees understand their roles and obligations.
The audit committee oversees compliance by management with the Group’s risk management policies and procedures,and reviews the adequacy of the risk management framework in relation to the risks faced by the Group.
39. Market Risk
Market risk is the risk that the fair value or future cash flows of a financial instrument will fluctuate because of changes inmarket prices. Market risk comprises three types of risk currency risk, interest rate risk and other price risk.
39.1 Interest Rate Risk
Interest rate risk is the risk that the fair values of future cash flows of a financial instrument will fluctuate because of changesin market interest rates. At the reporting date the interest rate profile of Group's interest-bearing financial instruments was:
Carrying Amount
2009 2008
Fixed rate instrumentsFinancial assets - Note 23 3,350,000 120,000Financial liabilities - Note 10 (71,993) (55,222)
3,278,007 64,778

Notes to the Consolidated Financial StatementsFor the year ended December 31, 2009
Annual Report 2009
140
Amounts in Rs '000
Sensitivity analysis for fixed rate instruments
The Group does not account for any fixed rate financial assets and liabilities at fair value through profit or loss, thereforea change in interest rates at the reporting date would not affect profit or loss.
39.2 Foreign currency risk
Foreign currency risk is the risk that the fair value or future cash flows of a financial instrument will fluctuate because ofchanges in foreign exchange rates. Foreign currency risk arises mainly where receivables and payables exist due totransactions entered into foreign currencies. The Group is exposed to foreign currency risk on sales, purchases andborrowings, which, are entered in a currency other than Pak Rupees. However the forward foreign exchange contractswere not available in 2009 in accordance with State Bank of Pakistan instructions.
SGD EURO USD GBP JPY
2009
Trade debts - 2,800 11,667 - -Other receivables - - 123,427 - -Due from Associate - note 22.1 - - - 80,420 -Cash and bank balances - - 62,287 - -
- 2,800 197,381 80,420 -
Trade and other payables 30,824 62,986 1,692,533 511,236 5,293Accrued interest / return on unsecured loan - note 10.2 - - 299,647 - -
30,824 62,986 1,992,180 511,236 5,293
Gross balance sheet exposure (30,824) (60,186) (1,794,799) (430,816) (5,293)
2008
Trade debts - - 14,381 - -Other receivables - - 142,096 - -Due from Associate - note 22.1 - - - 67,582 -Cash and bank balances - - 31,554 - -
- - 188,031 67,582 -
Trade and other payables 4,668 6,605 904,727 200,622 -Accrued interest / return on unsecured loan - note 10.2 - - 281,081 - -
4,668 6,605 1,185,808 200,622 -
Gross balance sheet exposure (4,668) (6,605) (997,777) (133,040) -
Significant exchange rates applied during the year were as follows:
Average rate for the year Spot rate as at December 31
2009 2008 2009 2008 Rupees Rupees
EURO 113.84 104.37 121.37 111.47USD 81.69 70.93 84.24 79.10GBP 127.85 130.67 137.81 114.71JPY 0.87 0.69 0.91 0.88SGD 56.52 50.25 60.06 54.94
Sensitivity analysis
Every 1% increase or decrease in exchange rate with all other variables held constant will increase or decrease profit aftertax for the year by Rs 23.2 million (2008: Rs 11.4 million).

Notes to the Consolidated Financial StatementsFor the year ended December 31, 2009
Annual Report 2009
141
Amounts in Rs '000
40. Credit Risk
Credit risk represents the accounting loss that would be recognised at the reporting date if counter-parties failed completelyto perform as contracted. The Group does not have significant exposure to any individual counterparty. To reduce exposureto credit risk the Group has developed a formal approval process whereby credit limits are applied to its customers. However,in Paints business reviewing to assign credit limits is in process which will be completed in the first quarter of 2010. Themanagement also continuously monitors the credit exposure towards the customers and makes provision against thosebalances considered doubtful of recovery. To mitigate the risk, the Group has a system of assigning credit limits to its customersbased on an extensive evaluation based on customer profile and payment history. Outstanding customer receivables areregularly monitored. Business with customers is also secured, where possible, by way of inland letters of credit.
The Group gross maximum exposure to credit risk at the reporting date is as follows:2009 2008
Restated40.1 Financial Assets
Long term loans - note 15 131,430 131,314Long term deposits and prepayments - note 16 29,078 30,684Trade debts (gross) net of discount - note 19 1,222,510 1,025,425Loans and advances (gross) - note 20 133,060 106,490Trade deposits - note 21 9,768 24,159Other receivables - note 22 458,669 482,425Bank balances - note 23 4,535,986 1,956,809
6,520,501 3,757,306
The Group has placed its funds with banks which are rated A-1+ or above by PACRA / JCRVIS.
40.2 Financial Assets - Secured 566,187 512,601 - Unsecured 5,966,041 3,244,705
6,532,228 3,757,306
40.3 The ageing of cash and bank balances, trade receivables and loans and advances at the reporting date is as follows:
Not past due 5,259,252 2,472,555Past due but not impaired:
Not more than three months 281,317 390,278Past due and Impaired:
more than three months and not more than six months 63,002 61,176more than six months and not more than nine months 25,352 8,870more than nine months and not more than one year 43,378 53More than one year 219,255 155,792
632,304 616,169
5,891,556 3,088,724
40.4 Movement of provision for trade receivables and loans and advances
Opening 201,483 143,520Additional provision 75,298 64,803Provision utilised against write offs 9,646 (6,388)Provision no longer required (676) (452)
285,751 201,483
40.5 The maximum exposure to credit risk for past due and impaired at the reporting date by type of counterparty was:
Wholesale customers 164,282 58,522Retail customers 284,408 345,308End-user customers 183,614 212,339
632,304 616,169
40.5.1 The recommended approach for provision is to assess the top layer (covering 50%) of trade receivables on an individualbasis and apply a dynamic approach to the remainder of receivables. The procedure introduces a company-standard fordynamic provisioning:
• Provide impairment loss for 50% of the outstanding receivable when overdue more than 90 days, and• Provide impairment loss for 100% when overdue more than 120 days.

Notes to the Consolidated Financial StatementsFor the year ended December 31, 2009
Annual Report 2009
142
Amounts in Rs '000
40.6 Concentration Risk
The sector wise analysis of receivables, comprising trade debts, loans and advances and bank balances excluding cashin hand is given below:
Textile 217,085 261,027Glass 22,679 12,371Ceramics 2,985 -Paper and Board 18,137 -Chemicals 232,624 142,781Pharmaceuticals 18,799 62,845Construction 31,972 -Transport 60,264 -Paints 516,308 504,347Bank 4,535,986 1,956,809Others 234,717 148,544
5,891,556 3,088,724
41. Liquidity Risk
Liquidity Risk is the risk that an entity will encounter difficulty in meeting obligations associated with financial liabilities.Prudent liquidity risk management implies maintaining sufficient cash and marketable securities and the availability offunding through an adequate amount of committed credit facilities. Groups treasury aims at maintaining flexibility in fundingby keeping committed credit lines available.
The table below analyse the Group's financial liabilities into relevant maturity groupings based on the remaining period atthe balance sheet to the maturity date.
Carrying Contractual Less thanamount cash flows one year
2009Financial liabilitiesTrade creditors - note 10 977,600 977,600 (977,600)Bills payable 2,270,855 2,270,855 (2,270,855)Mark-up accrued on short term financing 2,712 2,712 (2,712)Accrued interest / return on unsecured loan - note 10.2 299,647 299,647 (299,647)Accrued expenses 1,177,342 1,177,342 (1,177,342)Technical service fee / Royalty 35,975 35,975 (35,975)Distributors' security deposits - payable on termination of distributorship - note 10.4 71,993 77,392 (77,392)Contractors' earnest / retention money 10,103 10,103 (10,103)Unclaimed dividends 4,548 4,548 (4,548)Payable for capital expenditure 139,532 139,532 (139,532)Others 151,781 151,781 (151,781)
5,142,088 5,147,487 (5,147,487)
It is not expected that the cash flows included in the maturity analysis could occur significantly earlier or at significantlydifferent amount.
2008Financial liabilities
Trade creditors - note 10 1,203,954 1,203,954 (1,203,954)Bills payable 688,008 688,008 (688,008)Mark-up accrued on short term financing 15,611 15,611 (15,611)Accrued interest / return on unsecured loan - note 10.2 281,081 281,081 (281,081)Accrued expenses 974,332 974,332 (974,332)Technical service fee / Royalty 29,382 29,382 (29,382)Distributors' security deposits - payable on termination of distributorship - note 10.4 55,222 59,364 (59,364)Contractors' earnest / retention money 9,680 9,680 (9,680)Unclaimed dividends 4,549 4,549 (4,549)Payable for capital expenditure 223,738 223,738 (223,738)Others 225,158 225,158 (225,158)
3,710,715 3,714,857 (3,714,857)

Notes to the Consolidated Financial StatementsFor the year ended December 31, 2009
Annual Report 2009
143
42. In April 2009 it was observed that certain isolated management practices and dealings at Decorative segment of the Paintsbusiness seemed to be at variance with the Group’s approved policies and procedures. This information was communicatedto the Board who immediately initiated a detailed review by the Group’s Internal Auditors Ernst & Young Ford Rhodes SidatHyder, Chartered Accountants. These practices mainly related to obligations and commitments made in the market whichwere not properly recorded.
The detailed review by Ernst & Young Ford Rhodes Sidat Hyder, Chartered Accountants has been completed, the Board ofDirectors have decided to make a full provision in respect of these identified obligations. The amount has been accountedfor as given below in accordance with the IAS 8 “Accounting Policies, Changes in Accounting Estimates and Errors”.
42.1 The effect of retrospective restatement on profit and loss account is tabulated below:
2008
Increase in commission and discounts (165,000)Increase in selling and distribution expenses (72,500)Increase in administration and general expenses (62,500)
Decrease in operating results (300,000)Decrease in other operating income (41,000)Decrease in WPPF charge 17,050Decrease in WWF charge 6,820
Decrease in profit before tax (317,130)Decrease in income tax expense 110,996
Decrease in profit after tax (206,134)
(Rupees)Decrease in basic and diluted earnings per share (1.49)
42.2 The effect of retrospective restatement on Balance sheet for 2008 and 2007 is tabulated below:
2008 2007
Decrease in trade debts 197,000 32,000
Increase in deferred tax asset 126,946 15,950
Increase in trade and other payables 165,700 13,570
Decrease in unappropriated profit 235,754 29,620
42.3 Effect on unappropriated profit as at December 31:
Increase in commission and discounts (197,000) (32,000)Increase in administration and general expenses (62,500) -Increase in selling and distribution expenses (89,500) (17,000)
Decrease in operating results (349,000) (49,000)Decrease in other operating income (41,000) -Decrease in WPPF and WWF charge 27,300 3,430Decrease in income tax expense 126,946 15,950
Decrease in unappropriated profit (235,754) (29,620)
43. Capital Risk Management
The Group's objective when managing capital is to safe guard the Group’s ability to continue as a going concern so that itcan continue to provide returns for shareholders and benefits for other stakeholders; and to maintain a strong capital baseto support the sustained development of its businesses.
The Group manages its capital structure by monitoring return on net assets and makes adjustments to it in the light ofchanges in economic conditions. In order to maintain or adjust the capital structure, the Group may adjust the amount ofdividend paid to shareholders or issue new shares.
Amounts in Rs '000

Notes to the Consolidated Financial StatementsFor the year ended December 31, 2009
Annual Report 2009
144
44. Accounting Estimates and Judgements
Income Taxes
The Group takes into account the current income tax law and decisions taken by appellate authorities. Instances wherethe Group's view differs from the view taken by the income tax department at the assessment stage and where the Groupconsiders that its view on items of material nature is in accordance with law, the amounts are shown as contingent liabilities(unless there is remote possibility of transfer of benefits).
The tax department reopened the income tax assessment for the assessment year 2001-2002 on the ground that demergerof PTA business from ICI Pakistan Ltd. was effective from the completion date i.e. August 6, 2001. This was challengedby the Group in the High Court which upheld the Group's contention that the department did not have the right to reopenthis finalized assessment. The department had however filed an appeal in the Supreme Court against the High Court’sorder. The appeal was dismissed by the Supreme Court.
For the assessment year 2002-2003 on receipt of notice under section 62 of the Income Tax Ordinance, 1979, the Companyhad filed a writ petition in the Supreme Court challenging the tax department’s notice that the effective date of PTA’sdemerger was August 6, 2001 rather than the effective date given in the Scheme of Arrangement as October 1, 2000. Thatnotice had raised certain issues relating to vesting of PTA assets by the Company which has been settled in the assessmentyear 2001-2002. While this case is pending for adjudication, review of the Supreme Court's decision relating to assessmentyear 2001-2002 it is unlikely that the department can take an adverse action.
Whilst amending the assessment for the Tax Year 2003, tax department has taken certain action in the order, consideredby the department as “protective assessment” on the matter of unabsorbed depreciation carried forward. It is the Group'scontention that such an action is unwarranted. An appeal before the CIT (Appeals), on the matter has been filed which ispending. The very basis of such an action has also been challenged before the High Court of Sindh which is pending forhearing. While this case is pending for adjudication, review of the Supreme Court's decision relating to assessment year2001-2002 it is unlikely that the department can take an adverse action.
The Income Tax Appellate Tribunal earlier set aside the assessment for the assessment year 1998-99 on the issues of dateof commissioning of PTA plant & depreciation thereon, restriction of cost of capitalization of PTA plant and addition to incomein respect of trial production stocks. The re-assessment was finalized by the department during the year giving rise to anadditional tax demand.
In appeal against the said order, after the action being maintained by the Commissioner of Income Tax - Appeals, theIncome Tax Appellate Tribunal has set aside the assessment order passed by the tax department for fresh adjudication.
Pension and Gratuity
Certain actuarial assumptions have been adopted as disclosed in note 7 to the financial statements for valuation of presentvalue of defined benefit obligations and fair value of plan assets. Any changes in these assumptions in future years mightaffect unrecognized gains and losses in those years.
Property, plant and equipment
The estimates for revalued amounts, if any, of different classes of property, plant and equipment, are based on valuationperformed by external professional valuers and recommendation of technical teams of the Group. The said recommendationsalso include estimates with respect to residual values and depreciable lives. Further, the Group reviews the value of theassets for possible impairment on an annual basis. The future cash flows used in the impairment testing of assets is basedon management's best estimates which may change in future periods. Any change in the estimates in future years mightaffect the carrying amounts of the respective items of property, plant and equipments with a corresponding affect on thedepreciation charge and impairment.
45. Standards or Interpretations not yet effective
The following standards, interpretations and amendments of approved accounting standards are effective for accountingperiods beginning from the dates specified below. These standards are either not relevant to the Group’s operations orare not expected to have significant impact on the Group's financial statements other than increase in disclosures in certaincases:
Revised IFRS 3 Business Combinations (applicable for annual periods beginning on or after July 1, 2009) broadens among

Notes to the Consolidated Financial StatementsFor the year ended December 31, 2009
Annual Report 2009
145
other things the definition of business resulting in more acquisitions being treated as business combinations, contingentconsideration to be measured at fair value, transaction costs other than share and debt issue costs to be expensed, anypre-existing interest in an acquiree to be measured at fair value, with the related gain or loss recognised in profit or lossand any non-controlling (minority) interest to be measured at either fair value, or at its proportionate interest in the identifiableassets and liabilities of an acquiree, on a transaction-by- transaction basis. The application of this standard is not likely tohave an effect on the Group’s financial statements.
Amended IAS 27 Consolidated and Separate Financial Statements (effective for annual periods beginning on or after July1, 2009) requires accounting for changes in ownership interest by the group in a subsidiary, while maintaining control, tobe recognized as an equity transaction. When the group loses control of subsidiary, any interest retained in the formersubsidiary will be measured at fair value with the gain or loss recognized in the profit or loss. The application of the standardis not likely to have an effect on the Group’s financial statements.
IFRIC 15- Agreement for the Construction of Real Estate (effective for annual periods beginning on or after October 1,2009) clarifies the recognition of revenue by real estate developers for sale of units, such as apartments or houses, 'off-plan', that is, before construction is complete. The amendment is not relevant to the Group’s operations.
Amendments to IAS 39 Financial Instruments: Recognition and Measurement – Eligible Hedged Items (effective for annualperiods beginning on or after July 1, 2009) clarifies the application of existing principles that determine whether specificrisks or portions of cash flows are eligible for designation in a hedging relationship. The amendment is not likely to havean effect on the Group’s financial statements.
IFRIC – 17 Distributions of Non-cash Assets to Owners (effective for annual periods beginning on or after July 1, 2009)states that when a Group distributes non cash assets to its shareholders as dividend, the liability for the dividend is measuredat fair value. If there are subsequent changes in the fair value before the liability is discharged, this is recognised in equity.When the non cash asset is distributed, the difference between the carrying amount and fair value is recognised in theincome statement. As the Group does not distribute non-cash assets to its shareholders, this interpretation has no impacton the Group’s financial statements.
The International Accounting Standards Board made certain amendments to existing standards as part of its second annualimprovements project. The effective dates for these amendments vary by standard and most will be applicable to the Group’s2010 financial statements. These amendments are unlikely to have an impact on the Group’s financial statements.
Amendment to IFRS 2 – Share-based Payment – Group Cash-settled Share-based Payment Transactions (effective forannual periods beginning on or after January 1, 2010). Currently effective IFRSs require attribution of group share-basedpayment transactions only if they are equity-settled. The amendments resolve diversity in practice regarding attribution ofcash-settled share-based payment transactions and require an entity receiving goods or services in either an equity-settledor a cash-settled payment transaction to account for the transaction in its separate or individual financial statements.
Amendment to IAS 32 Financial Instruments: Presentation – Classification of Rights Issues (effective for annual periodsbeginning on or after February 1, 2010). The IASB amended IAS 32 to allow rights, options or warrants to acquire a fixednumber of the entity’s own equity instruments for a fixed amount of any currency to be classified as equity instrumentsprovided the entity offers the rights, options or warrants pro rata to all of its existing owners of the same class of its ownnon-derivative equity instruments. This interpretation has no impact on the Group’s financial statements.
IFRIC 19 Extinguishing Financial Liabilities with Equity Instruments (effective for annual periods beginning on or after July1, 2010). This interpretation provides guidance on the accounting for debt for equity swaps. This interpretation has noimpact on the Group’s financial statements.
IAS 24 Related Party Disclosures (revised 2009) – (effective for annual periods beginning on or after January 1, 2011).The revision amends the definition of a related party and modifies certain related party disclosure requirements forgovernment-related entities. The amendment would result in certain changes in disclosures.
Amendments to IFRIC 14 IAS 19 – The Limit on a Defined Benefit Assets, Minimum Funding Requirements and theirInteraction (effective for annual periods beginning on or after January 1, 2011). These amendments remove unintendedconsequences arising from the treatment of prepayments where there is a minimum funding requirement. These amendmentsresult in prepayments of contributions in certain circumstances being recognised as an asset rather than an expense. Thisamendment is not likely to have any impact on Group’s financial statements.
Improvements to IFRSs 2008 – Amendments to IFRS 5 Non-current Assets Held for Sale and Discontinued Operations –

Notes to the Consolidated Financial StatementsFor the year ended December 31, 2009
Annual Report 2009
146
(effective for annual periods beginning on or after July 1, 2009). The amendments specify that if an entity is committed toa plan to sell a subsidiary, then it would classify all of that subsidiary’s assets and liabilities as held for sale if criteria inIFRS 5 are met. This applies regardless of the entity retaining an interest (other than control) in the subsidiary; and disclosuresfor discontinued operations are required by the parent when a subsidiary meets the definition of a discontinued operation.This amendment is not likely to have any impact on Group’s financial statements.
46. Dividend
The directors in their meeting held on February 18, 2010 have declared a final dividend of Rs 4.50 per share (2008:Rs 4.00 per share) in respect of year ended December 31, 2009. The financial statements for the year ended December31, 2009 do not include the effect of the above dividend which will be accounted for in the period in which it is declared.
47. Date of Authorisation
These consolidated statements were authorised for issue in the Board of Directors meeting held on February 18, 2010.
48. General
48.1 Figures have been rounded off to the nearest thousand rupees except stated otherwise.
48.2 Corresponding Figures
Corresponding figures have been rearranged and reclassified, wherever necessary, for better presentation and disclosure.
Reclassification from component Reclassification to component Amounts in Rs '000
Administration & general expenses Selling & distribution expenses 10,797 - Depreciation - Depreciation
Selling & distribution expenses Cost of sales 9,635 - General Expenses - Rent rates and taxes
Cost of sales Selling & distribution expenses 23,071 - Raw Material Purchases - Outward freight and handling charges
Cost of sales Cost of sales 1,173 - Finished Goods Purchases - Royalty
M J Jaffer Waqar A Malik Feroz RizviChairman / Director Chief Executive Chief Financial Officer

Annual Report 2009
147
Notice of Meeting
Notice is hereby given that the Fifty-eighth Annual General Meeting of ICI PAKISTAN LIMITED will be held on Tuesday,March 30, 2010 at 11:30 a.m. at the Registered Office of the Company, ICI House, 5 West Wharf, Karachi, to transactthe following business:
1. To receive, consider and adopt the accounts of the Company for the year ended December 31, 2009, the reportof the Auditors thereon and the report of the Directors.
2. To declare and approve Final cash dividend @ 45% i.e., Rs 4.50 per ordinary share of Rs 10/- each for the yearended December 31, 2009 as recommended by the Directors, payable to the Members whose names appear inthe Register of Members as at March 18, 2010.
3. To appoint the Auditors of the Company and to fix their remuneration.
By the Order of the Board
February 18, 2010 Saira NishtarKarachi Company Secretary
1. Share Transfer Books of the Company will remain closedfrom March 19, 2010 to March 30, 2010 (both daysinclusive). Transfers received in order at the office of ourShares Registrar, FAMCO Associates (Pvt) Ltd. State LifeBuilding No 1-A, 1st Floor, I.I Chundrigar Road Karachi-74000, by the close of business on March 18, 2010 will bein time to entitle the transferees to the final dividend andto attend the Meeting.
2. All Members are entitled to attend and vote at the meeting.
3. A Member entitled to attend and vote at the Meeting isentitled to appoint a proxy to attend, speak and vote forhim/her. A proxy must be a Member of the Company.
4. An instrument of proxy applicable for the Meeting is beingprovided with the notice sent to Members. Further copiesof the instrument of proxy may be obtained from theRegistered Office of the Company during normal officehours.
5. An instrument of proxy and the power of attorney or otherauthority (if any) under which it is signed, or a notariallycertified copy of such power or authority, must, to be valid,be deposited at the Registered Office of the Company notless than 48 hours before the time of the Meeting.
6. Members are requested to notify immediately changes, ifany, in their registered address to our Shares Registrar,FAMCO Associates (Pvt) Ltd.
7. CDC Account Holders will further have to follow the under-mentioned guidelines as laid down in circular 1 datedJanuary 26, 2000 issued by the Securities and ExchangeCommission of Pakistan.
A. For Attending the Meeting:
(i) In case of individuals, the account holder or sub-accountholder and/or the person whose securities are in groupaccount and their registration details are uploaded asper the Regulations, shall authenticate his/her identityby showing his/her original Computerized NationalIdentity Card (CNIC) or original passport at the time ofattending the meeting.
(ii) In case of corporate entity, the Board of Directors'resolution/power of the attorney with specimen signatureof the nominee shall be produced (unless it has beenprovided earlier) at the time of the meeting.
B. For Appointing Proxies:
(i) In case of individuals, the account holder or sub-accountholder and/or the person whose securities are in groupaccount and their registration details are uploaded asper the Regulations, shall submit the proxy form as perthe above requirement.
(ii) The proxy form shall be witnessed by two personswhose names, addresses and CNIC numbers shall bementioned on the form.
(iii) Attested copies of CNIC or the passport of the beneficialowners and the proxy shall be furnished with the proxyform.
(iv) The proxy shall produce his original CNIC or originalpassport at the time of the meeting.
(v) In case of corporate entity, the Board of Directors'resolution/power of attorney with specimen signatureshall be submitted (unless it has been provided earlier)along with proxy form to the Company.
Notes:


149
The Fifty-eighth Annual General Meeting of ICI Pakistan Limited will be held on March 30, 2010at 11:30 a.m. at the Registered Office of the Company at ICI House, 5 West Wharf, Karachi.
Company’s transport will wait at the corner of Karachi Stock Exchange Road, between 10:15 a.m.and 10:45 a.m. on the date of the Meeting. Shareholders desirous of attending the Meeting may availthis facility.
Kindly bring this slip duly signed by you for attending the Meeting.
Company Secretary
Name
Shareholder No. Signature
Note:
i) The signature of the shareholder must tally with the specimen signature on the Company's record.
ii) Shareholders are requested to hand over duly completed admission slips at the counter beforeentering the Meeting premises.
CDC Account Holders / Proxies / Corporate Entities:
a) The CDC Account Holder / Proxy shall authenticate his / her identity by showing his / heroriginal Computerised National Identity Card (CNIC) or original passport at the time of attendingthe Meeting.
b) In case of corporate entity, the Board of Directors' resolution / power of attorney with specimensignature of the nominee shall be produced at the time of the Meeting (unless it has beenprovided earlier).
This Admission Slip is Not Transferable
Admission Slip

Form of Proxy58th Annual General Meeting
I / We
of
being member(s) of ICI Pakistan Limited holding
ordinary shares hereby appoint
of or failing him / her
of who is / are also member(s) of ICI Pakistan Limited as my / ourproxy in my / our absence to attend and vote for me / us and on my / our behalf at the Fifty-eighth AnnualGeneral Meeting of the Company to be held on March 30, 2010 and at any adjournment thereof.
Important:
1. This Proxy Form, duly completed and signed, must be received at the Registered Office of the Company, ICI House, 5West Wharf, Karachi, not less than 48 hours before the time of holding the meeting.
2. No person shall act as proxy unless he / she himself / herself is a member of the Company, except that a corporationmay appoint a person who is not a member.
3. If a member appoints more than one proxy and more than one instruments of proxy are deposited by a member withthe Company, all such instruments of proxy shall be rendered invalid.
For CDC Account Holders / Corporate Entities:
In addition to the above, the following requirements have to be met:
i) The proxy form shall be witnessed by two persons whose names, addresses and CNIC numbers shall be mentionedon the form.
ii) Attested copies of CNIC or the passport of the beneficial owners and the proxy shall be furnished with the proxy form.
iii) The proxy shall produce his / her original CNIC or original passport at the time of the Meeting.
iv) In case of corporate entity, the Board of Directors resolution / power of attorney with specimen signature shall besubmitted (unless it has been provided earlier) along with proxy form to the Company.
Signature onRevenue Stampof Appropriate
Value
This signature shouldagree with thespecimen registeredwith the Company.
Folio / CDC Account No.
As witness my / our hand / seal this day of 2010
Signed by the said
in the presence of 1.
2.

AffixCorrectPostage
The Company SecretaryICI Pakistan LimitedICI House5 West WharfKarachi-74000

www.akzonobel.com
A publication of the Corporate Communicationsand Public Affairs Department ICI Pakistan Limited5 West WharfKarachi 74000
T +92 21 3231 3717 - 22F +92 21 3231 1739 - 92 21 3231 2500E [email protected]
Designed by Adétude Private Limited
Don't miss our Sustainability Report 2009, which is nowa separate publication
AkzoNobel is proud to be one of the world’s leading industrial companies. Based in Amsterdam, the Netherlands, we make and supply a wide range of paints, coatings and specialty chemicals - 2009 revenue totaled €13.9 billion. In fact, we are the largest global paints and coatings company. As a major producer of specialty chemicals we supply industries worldwide with quality ingredients for life’s essentials. We think about the future, but act in the present. We’re passionate about introducing new ideas and developing sustainable answers for our customers. That’s why our 57,000 employees - who are based in more than 80 countries - are committed to excellence and delivering Tomorrow’s Answers Today™.
© 2010 Akzo Nobel N.V. All rights reserved.“Tomorrow’s Answers Today” is a trademarkof Akzo Nobel N.V.