akzonobel ici annual report 2010 tcm102-58712
TRANSCRIPT


Contents
Mission / Vision 02
CE Statement 03
Code of Conduct & values 04
Company information 05
About AkzoNobel 06
Financial highlights 08
Our Directors 14
Report of the Directors 16
Statement of Compliance 24
Review report 25
Management committees 26
Corporate Governance & Compliance 28
Awards & achievements / Calendar of major events 34
Technology developments 35
Community investment 36
Health, Safety, Environment & Security (HSE&S) 40
Our Talent Factory 42
Overview of our Businesses
Paints 44
Polyester 56
Soda Ash 60
Chemicals 64
Life Sciences 68
ICI Pakistan Financial Statements 75
ICI Pakistan Consolidated Financial Statements 125
Notice of meeting 165
Admission slip
Form of proxy
Sustainability Report
Grounds for excitement What excites us is asking the unasked question. And what drives us is knowing that what is good for our customers today is not necessarily good enough for them tomorrow. Our focus is to become bigger and better than ever, and to continue to touch the lives of our customers as we have for the past sixty-seven years.
2010 has been an eventful year, a year of many firsts, and also of unexpected challenges. We thrive on tackling these challenges every day, and finding new answers to questions before they are even asked. These are the reasons we come to work every day. These are our 'Grounds for excitement'.
Adding color to people’s lives; Harnessing the powerof our palette
Going green; Achieving more by consuming less through innovative technology
Decades ofdevelopment; Bringing about change through sustainable involvement
A vital part of everyday life; Providing a spectrum of products that are trusted by customers
Putting down roots; Breaking new ground with local seed production technology
44 56 60 64 68

ICI Pakistan Limited Annual Report 2010 | Key Performance Indicators | 01
RatiosEquityin Rs. million2009 13,4832010 14,548
Operating working capital turnover
2009 1212010 35
Return on capital employedin % 2009 19.42010 22.4
Return on fixed assets% of revenue2009 32.82010 40.9
Dividend yield*in %2009 4.82010 12.1
Operating result per employeein Rs. million2009 2.32010 2.8
Cash flowsNet cash from operating activitiesin Rs. million2009 4,4762010 2,334
Capital expendituresin Rs. million2009 8262010 854 +3%
+22%
Statement of incomeNSIin Rs. million2009 28,4302010 35,130
Operating resultin Rs. million2009 3,0282010 3,713
Profit before taxin Rs. million2009 3,0732010 3,732
Profit after taxin Rs. million2009 2,0452010 2,429
EBITDAin Rs. million2009 3,8992010 4,657
EBITDA margin% of NSI2009 13.72010 13.3
Dividend and earnings per shareEarnings per sharein Rs. 2009 14.732010 17.50
Dividend per share (proposed)in Rs.2009 8.00 2010 17.50
* Based on year end market value
Key PerformanceIndicators
+24% +8%
+23% -71%
+21% +16%
+19% +25%
+19% +152%
-3%
+19% -48%
+119%

Tomorrow’s Answers TodayOften people achieve only incremental progress, because their view of tomorrow is determined by what theysee today.
We believe the future belongs to those smart enough to challenge it. We believe that real progress belongs to those who not only think with courage, but also have the courage to deliver on the thought.
Tomorrow’s answers, delivered today.
What drives us is knowing that what is good for our customers today is not necessarily good enough for them tomorrow. What excites us is asking the unasked question. What inspires us is seeing the opportunity others cannot. What unites us is the intelligence to deliver where others have not.
This benefits our customers because we sustain their future competitiveness and meet the consumers’ unspoken needs. This ambition defines us. This is the way we work. This is why we come to work.
Our Vision
To be the partner of first choice for customers and suppliers, ensuring sustained leadership positions in the markets where we compete, delivering long-term business value through a high performance culture, innovation, ethics and responsible care.
Strategic ThrustTo achieve our mission we will:• Give highest priority to health, safety, environment and
ethical matters• Ensure our products deliver maximum value to
customers by maintaining dependable supply, consistent quality, and reliability
• Uphold excellent service levels to foster long-term relationships with customers and suppliers
• Achieve the highest possible operating efficiencies and lowest costs, and expand the business through selective capacity increase and new product launches
• Develop and retain a team of highly capable people dedicated to delivering the mission
Our Mission

Dear Stakeholders,
With the close of 2010, we complete 67 years of existence as a company. Starting as a soda ash manufacturing concern tucked in the salt ranges of Punjab in 1944, ICI Pakistan is now a leading manufacturing company of Pakistan with a range of products that practically touch all lives in the country everyday. The journey has been long and the road tough but what has held us together is a consistent focus on delivering customer value and a solid commitment from our people in doing so. 2010 was a tough year with continuation of the energy crisis and a heightened security situation. However, the toughest challenge came in the form of floods that hit the country in the second half of the year turning into one of the worst national disasters in the history of our nation. Over 20 million people lost their homes and livelihoods, crops and cattle were destroyed while infrastructural damages were colossal.
The magnitude of the disaster demanded a swift and effective response. I am proud to say that the company and its employees took the task to heart and immediately responded to the challenge, organizing a countrywide flood relief program that provided over 1 million meals and urgent medical assistance to affectees across the country. Business conditions were difficult throughout the year particularly after the floods. However, our ability to quickly adapt to the changing circumstances was crucial and we carefully rebounded as the year came to an end. Our financial performance and top line growth is an evidence of the resilience of our footing and solidity of our portfolio.
This was a year of many firsts with our Polyester Business hitting new production records, Soda Ash exploring new export markets and establishing itself as a regional player, Paints securing the first top coat order, Chemicals introducing Dissolvine and Life Sciences launching its own products invarious segments.
We also realize that there are areas where we need to focus more. Creating an engaged workforce is a key focus area for us and we have stepped up our employee engagement programs to create a culture of cooperation and co-creation. Our safety records have been excellent over the years, and we shall continue to vigorously focus on behavior based safety programs.
In 2010, we progressed further on our journey of sustainability and established a sustainability integration paradigm for the company. We conducted a comprehensive stakeholder engagement program, feedback from which became the stepping stone for our way forward. We set Key Performance Indicators and have now aligned business and functional priorities accordingly. In 2011, we shall stride forward to further integrate sustainability within the organization. More details of our sustainability strategy and performance are given in the Sustainability section of this report.
At ICI Pakistan, we have a history of serving the nation's needs and I am proud to be leading this great company at such an exciting period where despite tremendous challenges we continue to grow and serve better. I would like to express gratitude to all stakeholders who have helped us, and continue to do so, on this wonderful journey. I would particularly like to thank all my colleagues who are helping lead us into a future of many possibilities.
I wish you the very best.
Warm regards,
Waqar A Malik
Statement from our Chief ExecutiveOur rigorous efforts to maintain our competitiveness were underpinned by a strict focus on operational effectiveness, specifically concentrated on “Customers, Costs and Cash”.We can look ahead to 2011 with confidence, hope and resilience. We know that there are challenges ahead, but we also know that we have the right resources to meetthose challenges.
ICI Pakistan Limited Annual Report 2010 | CE Statement | 03

We have always had a strong sense of business principles and high ethical standards for the conduct of our business. Our business principles and ethical standards are enshrined in theICI Pakistan Code of Conduct.
A brief overview of the code:
Business principles• Each employee should implement our core values,
comply with and observe applicable laws, support fundamental human rights and give due regard to health, safety and environment
Business integrity• Bribery and any other form of unethical business
practices are prohibited• We promote free enterprise and require strict
compliance with competition laws• As responsible corporate citizens, we encourage
participation in community activities and take all measures for the safety and health of our employees as well as for the protection of the environment
• Employees are expected to maintain confidentiality and to act in the Company’s interests at all times
Company responsibilitiesThe Code encourages us to:• adopt the spirit of open communication• provide equal opportunities and a healthy, safe and
secure environment• ensure the rights of employees to join unions/
associations• protect personal data of employees• engage in an active performance and development
dialog
Employee responsibilitiesThe Code provides employees guidance on their responsibilities vis a vis:• Media relations and disclosures• Inside information• Corporate identity• Protecting our intellectual property• Internet use• Business travel policy• Prohibition on substance abuse
Our values • Focusing on our customer’s future first • Embracing entrepreneurial thinking • Developing the talents of our people • The courage and curiosity to question • Integrity and responsibility in our actions
Code of Conduct & values
04 | Code of Conduct & values | ICI Pakistan Limited Annual Report 2010

Company information
Board of Directors M J Jaffer Chairman Non-Executive James R Rees Non-Executive Waqar A Malik Chief Executive Feroz Rizvi ExecutiveMueen Afzal * Non-Executive Rogier M G Roelen Non-ExecutiveAli A Aga Executive M Nawaz Tiwana Non-ExecutiveBart Kaster Non-Executive Derek W Welch Non-Executive Audit & Remuneration Sub Commitees of the Board
Audit sub committee Remuneration sub committeeM J Jaffer Chairman Non-Executive M Nawaz Tiwana Chairman Non-ExecutiveMueen Afzal Non-Executive James R Rees Non-Executive Bart Kaster Non-Executive Chief Financial Officer Feroz Rizvi
Company SecretarySaira Nishtar
Executive Management TeamWaqar A Malik Chief Executive Suhail Aslam Khan Vice President, Polyester BusinessAli A Aga * Vice President, Soda Ash Business M Asif Malik Vice President, Corporate HR & Life SciencesKhalid Alvi Vice President, Chemicals Business Feroz Rizvi Chief Financial Officer Jehanzeb Khan Vice President, Paints Business
BankersAskari Bank Limited MCB Bank LimitedBank Al Habib Limited Meezan Bank LimitedBank Alfalah Limited National Bank of PakistanCitibank N.A. Oman International BankDeutsche Bank AG Samba Bank LimitedFaysal Bank Limited Standard Chartered Bank (Pakistan) LimitedHabib Bank Limited United Bank LimitedHSBC Bank Middle East Limited Habib Metropolitan Bank Limited
AuditorsInternal auditors External auditorsErnst & Young Ford Rhodes Sidat Hyder, KPMG Taseer Hadi & Co., Chartered AccountantsChartered Accountants
Registered office Shares RegistrarICI House, 5 West Wharf, Karachi-74000 FAMCO Associates (Pvt) Ltd.Tel # 111-100-200, (021) 32313717-22 1st Floor, State Life Building 1-A, Fax # 32311739 I.I Chundrigar Road, Karachi-74000Website: www.akzonobel.com/pk Tel : (021) 32427012, 32426597, 32420755, Email: [email protected] : 32475606, 32425467 Fax : (021) 32426752
* names in alphabetical order
ICI Pakistan Limited Annual Report 2010 | Company information | 05

AkzoNobel is the largest global paints and coatings company and a major producer of specialty chemicals. Headquartered in Amsterdam, the Netherlands, AkzoNobel is a Global Fortune 500 company consistently ranked as one of the leaders on the Dow Jones Sustainability Index. With operations in
more than 80 countries, it has 55,000 people around the world committed to excellence and delivering ‘Tomorrow’s Answers Today™.
AkzoNobel supplies industries and consumers worldwide with innovative products, and is passionate about developing sustainable
answers for its customers. Its portfolio includes well known brands such as Dulux®, Sikkens®, International® and Eka®.
ICI Pakistan was acquired by AkzoNobel on January 2, 2008. We are proud to be part of a group that is committed to innovation,
About AkzoNobelLooking closer, seeing further Look around you and chances are you'll see AkzoNobel's influence. The company’s products can be found everywhere from the Beijing Olympic arenas and Sydney Harbor Bridge to, quite possibly, the house next door to you.
06 | About AkzoNobel | ICI Pakistan Limited Annual Report 2010

AkzoNobel, making the FIFA World Cup 2010 the most colorful world cup ever
Walmart selects AkzoNobel as primary paint supplier for US stores
AkzoNobel's Stickerfix now being offered by Toyota
introducing new ideas and developing sustainable answers for our customers every day. We look forward to a bright and exciting future as one strong company with the drive to deliver ‘Tomorrow’s Answers Today’™.
Specialty Chemicals Why do some of the world’s biggest manufacturers rely on us? As a major producer of specialty chemicals with leadership positions in many markets, we make sure that industries worldwide are supplied with quality ingredients for life’s essentials.
The operational performance of our Specialty Chemicals division is among the best in the industry. As a result, our products appear in a remarkable variety of items we all use every day. There are over 2,000 items in our specialty chemical portfolio.
Decorative PaintsFrom brilliant ideas to brilliant paints AkzoNobel is the world's leading decorative paint company, home to famous names like Sikkens, Dulux and Hammerite. Our Decorative Paints business has a huge range of quality products for every situation and surface. As well as paints, lacquers and varnishes, we make adhesives and floor leveling compounds. We also offer a range of mixing machines, color concepts and training courses for the building and renovation industry. And our specialty coatings for metal, concrete and other critical building materials lead the market.
Performance Coatings Coatings that help businesses do better We’re world leaders when it comes to performance coatings. Over the years we’ve earned a rock-solid reputation based on our innovative technologies, first-class service and flexible distribution. Our coating brands include famous names like International®, Sikkens® and Interpon®.
Performance coatings have hundreds of uses. We’ve divided them into five businesses; together they supply businesses ranging from construction to consumer electronics and shipping to sports equipment.
AkzoNobel becomes primary paint supplier to Walmart AkzoNobel has been selected by the worlds largest retailer Walmart to be the primary paint supplier for the retailer’s US stores. A portfolio of interior and exterior paints will be offered to more than 3,500 Walmart stores.
New MP4-26 Formula 1 carAkzoNobel has become a full technology partner to the McLaren Group after expanding and extending the current relationship with Vodafone McLaren Mercedes. The two companies have been working together since 2008, when AkzoNobel – through its Sikkens brand – became the official supplier of paint solutions to the Vodafone McLaren.
The striking new MP4-26, which features a sophisticated, high gloss Sikkens system, will be driven by former champions Jenson Button and Lewis Hamilton in the Grand Prix.
The most colorful World Cup ever AkzoNobel supplied paint for five of the main stadiums of the 2010 Football World Cup in South Africa.
The stadiums were coated with AkzoNobel International protective coatings, Interpon powder coatings and Dulux decorative paint.
Toyota Motor Europe becomes first global automotive manufacturer to offer Stickerfix™Stickerfix™ is an adhesive system which uses patented AkzoNobel paint technology in combination with a specially developed vinyl sticker. It has an ultra-thin high-tech adhesive film coated with a perfect match of the original vehicle color, using professional high-quality automotive refinish paint. Every color on offer is matched to Toyota’s master plates to ensure the best possible match, and covers the most common colors of Toyota vehicles in Europe.
A new Toyota Stickerfix™ solution will be available with every new color introduced to the range. Branded as Toyota Stickerfix™, the product will be available in Toyota showrooms as part of a protection pack for new and used Toyota vehicles, and also from Toyota After Sales facilities throughout the EMEA region.
ICI Pakistan Limited Annual Report 2010 | About AkzoNobel | 07

FinancialhighlightsOur results at a glance• 2010 turnover growth at 22 percent• 2010 gross profit growth at 18 percent• 2010 profit after tax growth at 19 percent• 2010 earnings per share: Rs 17.50 (2009: Rs 14.73)• Total dividend per share for 2010: Rs 17.50 (2009: Rs 8.00) proposed
54%
24%
4%
12%6%
Operating result by businessTotal operating result Rs. 3.7 Billion %Polyester 54Soda Ash 24Paints 4Life Sciences 12Chemicals 6
Turnover by businessTotal Turnover Rs. 39.9 Billion %Polyester 45 Soda Ash 20Paints 17Life Sciences 10Chemicals 8
* Excluding discontinued Kansai business** Excluding one-off recognition of deferred tax credit and discontinued Kansai business
In my two years with the company, both my routine tasks and exciting challenges have contributed towards enriching my experience.
Omar FarooqFinancial Analyst
08 | Financial highlights | ICI Pakistan Limited Annual Report 2010

We are a company with five business streams, each having its own dynamics and intricate financial structure. Merging the synergies and consolidating this diversity to a single corporate portfolio is what makes my work exciting!
Nasir JamalCorporate Finance Manager& Treasurer
I love how every day at work, I get to inter-act with different people, take up challeng-ing tasks, explore new areas of work and overall develop my individual as well as professional capabilities.
Asma Jamil SheikhFinancial Trainee Officer
ICI Pakistan Limited Annual Report 2010 | Financial highlights | 09

Profitability ratios
Excluding one-off recognition of deferred tax credit in 2005 and discontinued Kansai business from 2005 - 2007
10 | Financial highlights | ICI Pakistan Limited Annual Report 2010
Profit after margin

Cost ratios
Liquidity & other ratios Efficiency ratios
*Operating cost includes cost of sales, selling & distribution and administration & general expenses
ICI Pakistan Limited Annual Report 2010 | Financial highlights | 11
*

Ratios 2001 2002 2003 2004 2005 2006 2007 2008 2009 2010
Profitability Ratios Gross margin % 23.33 19.04 14.70 15.62 18.14 20.85 20.93 19.77 19.96 19.03Gross profit turnover % 19.24 15.44 15.16 13.21 15.92 18.60 18.54 17.22 17.52 16.91Operating margin % 13.23 8.82 6.00 7.64 9.97 12.66 12.96 10.98 10.65 10.57Net profit margin % 5.36 15.18 4.23 6.00 8.51 7.44 7.75 6.70 7.19 6.91Profit markup % 30.42 23.53 17.23 18.51 22.16 26.34 26.47 24.64 24.94 23.51Profit before tax margin % 5.86 5.92 4.45 6.30 8.73 10.82 12.02 10.12 10.81 10.62Return on equity % 24.05 40.40 14.03 13.13 16.56 14.18 15.70 14.96 15.17 16.70Return on capital employed % 25.66 15.71 17.50 15.44 18.28 21.57 23.87 21.77 19.38 22.43Return on assets % 4.23 13.45 5.42 7.59 9.85 8.60 9.51 10.08 9.54 11.02Return on fixed assets % 23.53 18.76 19.68 25.01 25.18 29.46 34.92 32.61 32.82 40.91
Growth Ratios Net sales % 8.03 15.60 48.35 (2.69) 4.74 5.94 17.63 20.74 2.27 23.57Operating results % (9.29) (23.00) 0.98 23.82 36.81 34.54 20.37 2.29 (0.81) 22.62EBITDA % (41.64) (15.42) 1.61 16.80 25.34 25.95 20.58 0.00 1.04 19.45Profit after tax % (52.88) 227.33 (58.69) 38.06 48.63 (7.42) 22.61 4.37 9.77 18.78Operating working capital % (31.08) (11.43) 53.16 (104.67) (324.95) (199.82) (118.86) 218.10 (82.19) 320.64
Efficiency Ratios Asset turnover Times 0.79 0.89 1.28 1.27 1.16 1.16 1.23 1.51 1.33 1.59Fixed asset turnover Times 1.78 2.13 3.28 3.28 2.52 2.33 2.69 2.97 3.08 3.87Inventory turnover Times 3.16 4.14 5.73 4.16 4.73 5.07 6.24 6.39 6.08 6.71Current asset turnover Times 2.24 2.65 3.42 2.45 2.84 2.79 2.55 3.46 2.56 2.96Capital employed turnover Times 2.35 2.20 2.83 2.39 2.09 1.91 2.08 2.28 2.07 2.39Operating working capital turnover Times 16.74 21.85 21.16 (440.62) (108.61) (38.38) (20.62) 21.09 121.06 35.56Inventory turnover ratio Days 104.41 91.37 60.06 76.94 81.77 73.67 59.85 52.43 58.00 51.19Debtor turnover ratio Days 17.66 19.07 13.25 15.09 14.44 12.84 13.65 11.81 11.08 8.90Creditor turnover ratio Days 58.03 79.58 56.35 75.62 78.70 75.90 78.24 50.52 41.00 40.06Operating cycle Days 64.03 30.86 16.96 16.41 17.52 10.62 (4.74) 13.72 28.08 20.03Revenue per employee Rs'000 7,438 9,264 13,568 13,434 14,137 15,304 17,946 21,044 21,852 26,878Net income per employee Rs'000 399 1,406 574 806 1,203 1,138 1,391 1,410 1,572 1,858Capex to sales % 8.01 4.09 2.53 3.12 7.77 5.53 4.65 5.45 2.91 2.43
Cost RatiosOperating costs (%of sales) % 86.77 91.18 94.00 92.36 90.03 87.34 87.04 89.02 89.35 89.43Administration costs (%of sales) % 4.14 4.20 3.26 3.77 3.75 3.71 3.30 4.05 4.14 3.70Selling costs (% of sales) % 5.95 6.03 5.43 4.22 4.41 4.48 4.67 4.74 5.17 4.77Interest cost (%of sales) % 5.99 3.44 2.11 1.44 1.50 1.45 0.44 0.32 – –
Equity RatiosPrice earnings ratio Rs 8.25 4.04 15.40 11.76 12.40 11.01 15.29 5.12 11.44 8.24Earnings per share Rs 4.28 13.36 5.52 7.62 11.33 10.49 12.86 13.42 14.73 17.50Dividend per share Rs 2.00 2.25 2.50 4.00 5.00 5.50 6.00 6.50 8.00 17.50Dividend cover Times 2.14 5.94 2.21 1.91 2.27 1.91 2.14 2.06 1.84 1.00Dividend (declared for the year) yield % 5.67 4.17 2.94 4.46 3.56 4.76 3.05 9.46 4.75 12.13Dividend (declared for the year) payout % 48.99 16.84 45.29 52.48 44.14 52.45 46.66 48.43 54.31 100.01Market value per share Rs 35.30 53.95 85.00 89.65 140.50 115.50 196.65 68.71 168.49 144.24Break-up value per share with surplus on revaluation Rs 40.64 48.81 44.25 62.25 71.95 82.05 89.20 96.62 103.85 111.35Break-up value per share excluding surplus on revaluation Rs 17.78 33.08 39.35 58.02 68.39 73.95 81.91 89.68 97.14 104.81
Liquidity RatiosCurrent ratio Ratio 0.59:1 0.67:1 0.67:1 1.38:1 1.10:1 1.29:1 1.44:1 1.81:1 1.92:1 2.17:1Quick/Acid test ratio Ratio 0.27:1 0.32:1 0.33:1 0.69:1 0.56:1 0.73:1 0.97:1 1.02:1 1.27:1 1.39:1Cash ratio Ratio 0.06:1 0.07:1 0.13:1 0.33:1 0.29:1 0.33:1 0.58:1 0.44:1 0.77:1 0.85:1
Leverage Ratios Debt to equity % 25.43 7.44 – 1.39 – 0.04 – – – –Total debt to capital ratio Ratio 44:56 33:67 40:60 1:99 0:100 0:100 0:100 0:100 0:100 0:100Interest cover Times 1.98 2.72 3.11 5.36 6.82 8.44 28.42 32.29 – –
Summary of Cash FlowsCash generated from operations Rs. million 2,142.4 1,819.2 2,139.6 1,916.5 2,666.9 3,554.0 4,312.4 1,188.4 4,938.3 3,716.2 Net cash generated from operating activities Rs. million 980.8 1,026.5 1,933.1 1,823.9 2,522.0 3,477.1 4,093.5 969.8 4,476.2 2,334.4 Net cash used in investing activities Rs. million (789.0) (32.5) (103.2) 3,379.2 (1,420.8) (1,040.2) (1,397.4) (1,781.0) (938.0) (752.9)Net cash used in financing activities Rs. million 70.7 (965.8) (1,261.7) (4,542.4) (1,118.2) (2,337.1) (868.5) (832.8) (1,041.0) (1,388.0)Cash and cash equivalents at December 31 Rs. million 447.5 475.8 1,044.0 1,704.7 1,687.7 1,787.5 3,615.1 1,971.1 4,468.3 4,661.8
Excluding turnover of discontinued furnace oil and coal businesses in 2003, one-off profit on sale of PPTA shares in 2004, recognition of deferred tax credit in 2005and discontinued Kansai business in 2005 - 2007. The comparatives (2002 to 2004) have not been restated due to change in accounting policy on adoption of IFRIC 4.
Operating & Financial Highlights
12 | Financial highlights | ICI Pakistan Limited Annual Report 2010

Vertical Analysis 2005 2005 2006 2006 2007 2007 2008 2008 2009 2009 2010 2010 Rs. m % Rs. m % Rs. m % Rs. m % Rs. m % Rs. m % Profit and Loss Account Net sales, commission & toll income 18,476.5 100.0 19,574.1 100.0 23,024.1 100.0 27,798.9 100.0 28,429.9 100.0 35,130.0 100.0Cost of Sales 15,124.8 81.9 15,492.6 79.1 18,205.4 79.1 22,303.1 80.2 22,754.0 80.0 28,443.7 81.0Gross profit 3,351.7 18.1 4,081.5 20.9 4,818.8 20.9 5,495.8 19.8 5,675.9 20.0 6,686.3 19.0Administration & General Expenses 693.6 3.8 726.4 3.7 760.2 3.3 1,126.2 4.1 1,178.1 4.1 1,299.0 3.7Selling & Distribution Expenses 815.6 4.4 876.1 4.5 1,074.5 4.7 1,317.3 4.7 1,470.2 5.2 1,674.7 4.8Operating Result 1,842.5 10.0 2,479.0 12.7 2,984.0 13.0 3,052.4 11.0 3,027.7 10.6 3,712.6 10.6Financial Charges 287.1 1.6 319.3 1.6 146.4 0.6 219.3 0.8 167.5 0.6 163.9 0.5Other Operating Charges 108.0 0.6 171.1 0.9 222.3 1.0 233.7 0.8 247.6 0.9 303.4 0.9Other Operating Income 165.0 0.9 129.2 0.7 153.3 0.7 213.4 0.8 460.0 1.6 486.3 1.4Profit before taxation 1,612.4 8.7 2,117.8 10.8 2,768.5 12.0 2,812.8 10.1 3,072.5 10.8 3,731.5 10.6Taxation 40.1 0.2 662.2 3.4 983.7 4.3 950.0 3.4 1,027.8 3.6 1,302.7 3.7Profit after taxation 1,572.3 8.5 1,455.6 7.4 1,784.8 7.8 1,862.7 6.7 2,044.7 7.2 2,428.8 6.9 Balance Sheet Total Equity and Revaluation Reserve 9,987.4 63 11,389.2 67 12,381.0 66 13,410.9 73 14,414.6 67 15,455.4 70Non Current Liabilities 90.6 1 104.1 1 119.6 1 613.0 3 1,208.1 6 1,093.2 5Current Liabilities 5,891.9 37 5,436.3 32 6,263.8 33 4,446.8 24 5,799.9 27 5,482.0 25Total Equity and Liabilities 15,969.9 100 16,929.6 100 18,764.4 100 18,470.7 100 21,422.7 100 22,030.7 100Non Current Assets 9,469.8 59 9,905.7 59 9,741.6 52 10,435.3 56 10,297.5 48 10,152.4 46Current Assets 6,500.1 41 7,023.9 41 9,022.8 48 8,035.4 44 11,125.2 52 11,878.3 54Total Assets 15,969.9 100 16,929.6 100 18,764.4 100 18,470.7 100 21,422.7 100 22,030.7 100 Horizontal Analysis 2005 2005 2006 2006 2007 2007 2008 2008 2009 2009 2010 2010 Rs. m % Rs. m % Rs. m % Rs. m % Rs. m % Rs. m %Profit and Loss Account Net sales, commission & toll income 18,476.5 4.7 19,574.1 5.9 23,024.1 17.6 27,798.9 20.7 28,429.9 2.3 35,130.0 23.6Cost of Sales 15,124.8 1.6 15,492.6 2.4 18,205.4 17.5 22,303.1 22.5 22,754.0 2.0 28,443.7 25.0Gross profit 3,351.7 21.6 4,081.5 21.8 4,818.8 18.1 5,495.8 14.0 5,675.9 3.3 6,686.3 17.8Administration & General Expenses 693.6 4.4 726.4 4.7 760.2 4.7 1,126.2 48.1 1,178.1 4.6 1,299.0 10.3Selling & Distribution Expenses 815.6 9.6 876.1 7.4 1,074.5 22.7 1,317.3 22.6 1,470.2 11.6 1,674.7 13.9Operating Result 1,842.5 36.8 2,479.0 34.5 2,984.0 20.4 3,052.4 2.3 3,027.7 -0.8 3,712.6 22.6Financial Charges 287.1 10.9 319.3 11.2 146.4 -54.1 219.3 49.8 167.5 -23.6 163.9 -2.2Other Operating Charges 108.0 59.9 171.1 58.5 222.3 29.9 233.7 5.1 247.6 5.9 303.4 22.6Other Operating Income 165.0 -91.2 129.2 -21.7 153.3 18.6 213.4 39.2 460.0 115.5 486.3 5.7Profit before taxation 1,612.4 45.2 2,117.8 31.3 2,768.5 30.7 2,812.8 1.6 3,072.5 9.2 3,731.5 21.4Taxation 40.1 23.7 662.2 1549.5 983.7 48.6 950.0 -3.4 1,027.8 8.2 1,302.7 26.7Profit after taxation 1,572.3 48.6 1,455.6 -7.4 1,784.8 22.6 1,862.7 4.4 2,044.7 9.8 2,428.8 18.8 Balance Sheet Total Equity and Revaluation Reserve 9,987.4 16 11,389.2 14 12,381.0 9 13,410.9 8 14,414.6 7 15,455.4 7Non Current Liabilities 90.6 10 104.1 15 119.6 15 613.0 413 1,208.1 97 1,093.2 -10Current Liabilities 5,891.9 13 5,436.3 -8 6,263.8 15 4,446.8 -29 5,799.9 30 5,482.0 -5Total Equity and Liabilities 15,969.9 15 16,929.6 6 18,764.4 11 18,470.7 -2 21,422.7 16 22,030.7 3Non Current Assets 9,469.8 41 9,905.7 5 9,741.6 -2 10,435.3 7 10,297.5 -1 10,152.4 -1Current Assets 6,500.1 -10 7,023.9 8 9,022.8 28 8,035.4 -11 11,125.2 38 11,878.3 7Total Assets 15,969.9 15 16,929.6 6 18,764.4 11 18,470.7 -2 21,422.7 16 22,030.7 3 For better presentation segment assets in note 23.1 for 2010 are shown with inter business current account. This presentation does not have any effect on balance sheet or profit and loss account
Vertical and Horizontal Analysis
Managing the Treasury function offers dynamic learning opportunities.In 2011 I'm looking
forward to leading new automation and process improvement projects. Shahzaib KhanTreasury Manager
ICI Pakistan Limited Annual Report 2010 | Financial highlights | 13

Waqar A MalikChief Executive
Appointed as the Chief Executive of ICI Pakistan Limited on October 1, 2005, Waqar Malik has over 25 years of extensive experience with the Group in senior management positions.
His other engagements outside ICI Pakistan Limited are; Director on the Central Board of the State Bank of Pakistan, Director Pakistan Business Council, non-executive Director on the Boards of Engro Polymer & Chemicals Limited and IGI Insurance Limited. A former President of Overseas Investors Chamber of Commerce & Industry (OICCI), Waqar is also a member of the Board of Governors of LUMS along with being a trustee of Duke of Edinburgh's Award Foundation.
An alumnus of Harvard Business School and INSEAD, Waqar is a Chartered Accountant by profession and a Fellow of the Institute of Chartered Accountants in England & Wales.
M Nawaz TiwanaDirector (Non-Executive)
Appointed to the Board of Directors of ICI Pakistan Limited in April 1997, Nawaz is also the Chairman of the Board’s Remuneration Committee. He has held various positions such as Managing Director, Pakistan International Airlines Corporation, Managing Director PSL and Chairman, Port Qasim Authority as well as Chairman, State Cement Corporation of Pakistan.
Ali A AgaDirector & Vice PresidentSoda Ash Business
Appointed to the Board of Directors of ICI Pakistan Limited in January 2009, Ali is Vice President Soda Ash Business and has been with ICI Pakistan for the last 22 years. He has diverse experience in commercial, human resources and general management roles. Ali is also a Non-Executive Director on the Board of ICI Pakistan PowerGen Limited.
Our Directors
M J Jaffer Chairman (Non-Executive)
Appointed to the Board of Directors of ICI Pakistan Limited in October 1973, Mahomed Jaffer is the longest serving member of the Board and is also the Chairman of the Board’s Audit Committee. He retired as a senior partner of M/s Orr Dignam & Co., a leading corporate law firm of Pakistan. Specializing in arbitration law, Mahomed Jaffer has represented Pakistan as an alternate member in the International Court of Arbitration of the International Chamber of Commerce Paris since 1997. He is the President of The Aga Khan Hospital and Medical College Foundation and a Director of Pakistan Centre for Philanthropy, Tourism Promotion Services (Pakistan) Limited and Lakson Investment Limited. He is also Chairman of the Advisory Committee of Pakistan of the Center for International Private Enterprise, an affiliate of the US Chamber of Commerce. He is also the member of Advisory Committee for Pakistan of HSBC. He is visiting faculty for Pakistan Institute of Corporate Governance and lectures extensively on Corporate Governance, Conciliation, Arbitration and related subjects.
14 | Our Directors | ICI Pakistan Limited Annual Report 2010

Bart KasterDirector (Non-Executive)
Elected to the Board of Directors of ICI Pakistan Limited in April 2008, Bart has been associated with the AkzoNobel Group since 1980, during which he has held senior positions and various assignments in Europe and Asia.
Bart is also a Director of AkzoNobel UK Limited, AkzoNobel Decorative Coatings Limited and ICI Limited.
Mueen AfzalDirector (Non-Executive)
Appointed to the Board of Directors of ICI Pakistan Limited in May 2003, he joined the Civil Service of Pakistan in 1964 and held important positions, including Finance Secretary for the Government of Pakistan, Health Secretary, and Secretary General, Finance and Economic Affairs from 1999 to 2002. He was awarded Hilal-e-Imitaz for distinguished public service in 2002.
Mueen is also the Chairman of Pakistan Tobacco Company Limited and Azgard Nine Limited. He is currently Director of Murree Brewery Co. Limited and the Pakistan Poverty Alleviation Fund, and is on the Board of Governors of Aitchison College, Lahore.
James R ReesDirector (Non-Executive)
Elected to the Board of Directors of ICI Pakistan Limited in April 2008, James is an experienced executive and is currently the General Manager of AkzoNobel’s Car Refinishes Business Unit, a global business headquartered in the Netherlands. He joined AkzoNobel in 2003 and was previously the General Manager of the Americas Sub Business Unit Car Refinishes at AkzoNobel.
James is also a Director of AkzoNobel Comex S.A. de C.V. and Anco Servicios Profesionales S. A. de C.V.
Feroz RizviDirector & CFO
Appointed to the Board of Directors of ICI Pakistan Limited in October 2006, Feroz is the Chief Financial Officer and has been with ICI Pakistan for over 27 years, during which he has held various senior positions. He is also a Non-Executive Director of ICI Pakistan PowerGen Limited and Faysal Asset Management Limited.
Derek Walter Welch Director (Non-Executive)
Elected to the Board of Directors of ICI Pakistan Limited in June 2009, Derek has been associated with the AkzoNobel Group since 1998 during which he has held senior positions. He is currently Director Business Development at AkzoNobel N.V. and Vice President of AkzoNobel Chang Cheng (Guangdong) Co., Ltd. He also holds directorships in a number of companies of the AkzoNobel Group.
Rogier M. G. RoelenDirector (Non-Executive)
Elected to the Board of Directors of ICI Pakistan Limited in August 2010, Rogier has been associated with the AkzoNobel Group since 2008 during which he has held senior positions. Before joining AkzoNobel Rogier had worked for various national and international clients.
ICI Pakistan Limited Annual Report 2010 | Our Directors | 15

Report of the Directorsfor the year ended December 31, 2010
Six years financial performance at a glanceNet sales, commission and toll income
Value of addition and its distribution
Raw material & services
Employee remuneration & benefits
Operating & other expenses Profit retained
Dividends
Government exchequer & duties
The Directors are pleased to present their report together with the audited financial statements of the Company for the year ended December 31, 2010.
OverviewNet Sales Income (NSI) of your Company increased by 24 percent over last year on the back of higher sale volumes as well as selling prices. This together with strong margin management and good cost control resulted in operating profit increasing by 23 percent over last year despite a very difficult operating environment. Profit after tax at Rs 2.43 billion was 19 percent higher compared with 2009. Earnings Per Share at Rs 17.50 was also higher by 19 percent. On group basis (including the result of wholly owned subsidiary ICI Pakistan PowerGen Limited) profit after tax for the year at Rs 2.48 billion was 21 percent higher compared with 2009.
Financial Performance 2010 2009 Increase PercentageRs Million Turnover 39,533 32,399 22Net Sales Income 35,130 28,430 24Gross Profit 6,686 5,676 18Operating Result 3,713 3,028 23Profit Before Tax 3,732 3,073 21Profit After Tax 2,429 2,045 19Earnings Per Share (Rs) 17.50 14.73 19
16 | Report of the Directors | ICI Pakistan Limited Annual Report 2010Excluding discontinued Kansai business from 2005 - 2007 and recognition of deferred tax credit in 2005

DividendsIn view of the Company’s healthy cash position, the Board has decided to pay out the Profit after Tax for the year 2010 as total dividend for the year 2010. Accordingly, your Directors are pleased to announce a final dividend of 120 percent i.e., Rs 12 per share of Rs. 10 each of the issued and paid up capital of Rs. 1,388,023,000/- subject to the approval of the shareholders at the forthcoming Annual General Meeting. This, including the already paid interim dividend of Rs. 5.50 per share makes a total dividend of Rs. 17.50 per share.
Board changesMr Tariq Iqbal Khan resigned from the Board with effect from July 19, 2010. To fill this casual vacancy, the Directors appointed Mr Rogier Roelen, with effect from August 13, 2010 for the remainder of the term to expire on April 28, 2011. The Board places on record its appreciation for the valuable contribution made by the outgoing Director, Mr Tariq Iqbal Khan and welcomes Mr Rogier Roelen as a new Director of the Company.
Health, Safety and Environment (HSE)There was no reportable occupational illness to our employees or supervised contractors in 2010. During the year, two minor injuries were reported by Paints site involving supervised contractors who resumed their jobs after treatment. The Safety performance at other sites remained well controlled. Soda Ash achieved 23.4 million man hours, Polyester achieved 19.9 million man hours, Specialty Chemicals achieved 5.4 millions man hours and Life Sciences achieved 7.3 million man hours without LTI (lost time injury) to Employees and Supervised Contractors. Implementation of Asset Integrity plans and launch of Behaviour Based Safety during the year further aim to improve our Health and Safety Performancemoving forward.
Energy consumption and CO2 emissions were lower by 5.3 percent and 3 percent respectively on like to like basis compared with 2009. Notable energy conservation initiatives included the Reverse Osmosis Water Plant at Soda Ash brought on line in Q4 2010.
A detailed report on HSE performance and development in 2010 is available on page 40 of the annual report.
Corporate social responsibility-CSR Your Company's community social and other charitable activities are managed through the ICI Pakistan Foundation which is operated by its own Board of Trustees. In addition certain other community activities are carried out directly by your Company. The foundation focuses on community development through investment in education, health, environment and infrastructural development along with
disaster relief. In 2010, a total of Rs 42.5 million was spent on community activities (inclusive of contribution by parent Company, staff and other related concerns for flood relief).
Education:In the sphere of education the foundation made significant infrastructural investments in the Government Girls School in Bararkot Kashmir, Government Primary School in Tibbi Haria Sheikhupura and the Kakapir Government Boys School in Karachi to improve and upgrade them. All these schools are supported by the foundation. We also completed twenty years of continued support to the Institute of Behavioral Psychology (IBP), an institute for children with special needs.
Health:Since 1991, your Company has conducted Surgical Eye Clinic programs at Khewra in collaboration with the Layton Rahmatulla Benevolent Trust (LRBT). Till end 2010, 116,988 outpatients have been treated and 11,992 major and minor surgeries conducted at the Winnington Hospital, run and managed by your Company.
A similar program was initiated near our Polyester plant in Sheikhupura with the first eye camp being held in November 2010 treating nearly 200 patients.
Environment:Support for 'Save the Turtle Project' in collaboration with WWF Pakistan continues. This is our sixth year supporting this project. After our engagement, there is a significant increase in hatchling release from 2,204 to over 35,000 every season. Beach cleaning activity is a part of the project and this year along with our volunteers we also involved students of the area.
Disaster relief: In 2010 the country faced its worst natural disaster which left over 20 million people robbed of their homes and livelihood. To assist the affectees, ICI Pakistan Foundation launched a pan-Pakistan Flood Relief Campaign 2010. One million meals in the form of essential rations along with 10,000 care packs containing immediate sustenance items and clean drinking water packed and prepared by the employees were also distributed in the flood affected areas. Other than this, free medical and veterinary camps were set up across the country by the Life Sciences business. The foundation is now actively involved in the rehabilitation efforts and is helping build homes for flood affectees.
The total contribution towards flood relief activities was over Rs 36 million (inclusive of funds contributed by parent Company directly to the ICI Pakistan Foundation, contributions by staff and other stakeholders).
Relief goods being delivered to the Pakistan Navy for dispatch to the flood victims
Life Sciences Medical Camp for flood victimsDirectors' visit to our Polyester plant
ICI Pakistan Limited Annual Report 2010 | Report of the Directors | 17

Volunteering:Your Company greatly encourages its employees to participate in community activities. In 2010 a total of nearly 4500 man hours were spent volunteering.
A detailed report on CSR performance in 2010 is available on page 36 of the annual report.
Human ResourceIn line with our ambition to be recognized as a Company which offers opportunity to its people for ongoing learning, development and growth, talent movement across businesses and functions remained a strategic priority for your Company. In addition, your Company imparted 27,982 man hours of training in 2010 compared to 20,980 hours in 2009, focusing on improving managerial, personal and functional effectiveness. Learning opportunities for managers was also provided through AkzoNobel’s global strategic assignments and leadership development programs. In 2010 your Company conducted the Gallup Viewpoint engagement survey with the aim of benchmarking and providing managers a high performance work environment fostering talent engagement and development.
The Performance and Development Dialog mid and year end assessment processes was concluded as per timeline and company guidelines ensuring the employees continue to benefit from clear and credible systems.
A detailed report on human resource performance and development in 2010 is available on page 42 of theannual report.
Risk Management FrameworkThe Board has an overall responsibility for ensuring that an effective risk management process is in place. This encompasses identification and prioritization of strategic, financial, operational, legal & external risks and ensuring appropriate controls to mitigate these risks.
A detailed report on risk management philosophy, key risks and tools used by the Company is available on page 31 of the annual report.
Polyester Staple Fiber (PSF)Prices for PTA and MEG continued to rise throughout the year due to higher crude oil prices, speculative trading and concerns over supplies in the regional market.
A significantly lower cotton crop in China, Pakistan and to some extent in the USA along with pick-up in global economic activity has substantially influenced the demand for polyester. Higher usage of polyester resulted in unprecedented increase in PSF demand and prices. The global cotton prices rose to an all time high of 159 cents/lb. The domestic cotton prices followed the international lead and rose to a record high of Rs 10,500 per maund. Earlier in the year, the decision of National Tariff Commission (NTC)
imposing anti-dumping duty on PSF from regional players had been set aside by the High Court on technical grounds. NTC has moved to remove these technical issues, however APTMA has challenged the methodology utilised by the NTC and secured a stay from the High Court which is being challenged by the NTC.
18 | Report of the Directors | ICI Pakistan Limited Annual Report 2010

Sales volume for the year was 5 percent higher compared to last year at a record 129,736 tonnes on the back of a buoyant market. To cater for the high demand the plant was run at full capacity throughout the year. Higher volumes and better gross profit margins resulted in the highest ever operating result of Rs 2,022.1 million, 86 percent higher compared to 2009.
Going forward, in the short term, regional feedstock prices are forecast to remain firm due to tightness in PTA and MEG supplies. Domestic fiber demand is expected to stay stable in the near term, though later in the year an expected good global cotton harvest will put pressure on PSF prices and margins.
Soda AshGlobal soda ash demand witnessed some recovery in 2010 based on higher consumption in the emerging markets of China, India and Brazil during the first three quarters of the year. Resultantly, the full year market growth remained at about 4-5 percent.
Domestic soda ash market remained subdued as downstream industrial activity was severely affected by the unprecedented gas curtailments in 2010 which persisted throughout the year, unlike previous years when curtailment was restricted to winter months only. The overall gas supply was at an average 25 percent lower than last year causing major disruptions across all industries. The domestic soda ash market thus continues to remain in an over supply situation due to lower off take by the downstream industry. This is further aggravated by dumping of soda ash into Pakistan, which is adversely affecting the domestic industry.
All major industrial consumers of soda ash, specially Glass, Silicate and Paper industries were affected, leading to a decline in their consumption of soda ash. However, the negative impact of lower consumption by industrial segment was somewhat mitigated by growth in the bazaar segment, which benefitted from growth in the unorganized detergent sector.
Overall, sales volume during the year was higher by 12 percent compared to 2009, primarily on the back of exports to various countries in the region as the business successfully established itself in the export market.Business operations remained severely affected as the full time equivalent gas outages increased from 60 days in 2009 to 143 days in 2010. Business had to incur an additional cost of over Rs 500 million on alternate fuels compared to 2009. The focus throughout the year was on optimizing operational efficiencies and strict cost control in all areas. Operating result at Rs 895.0 million was 14 percent lower than 2009 as the impact of higher revenue was dragged down by the higher usage of more expensive furnace oil during gas outages.
Ministry of Commerce and Industry, Government of India has initiated anti-dumping investigations against exporters of soda ash from USA, EU, China, Kenya, Ukraine, Iran and Pakistan. Your Company was also served a notice along with other exporters under investigation and has given a written response to the Indian authority.
Going forward, gas curtailments are expected to increase and will keep the industrial activity depressed, impacting soda ash demand in the country. Dumping of soda ash into Pakistan from certain countries also remains a key concern and your Company has filed an anti-dumping application with the National Tariff Commission, seeking an investigation into this practice and initiation of investigation is expected in the near future.
Advanced Management Program forsenior managers
Long Service Award ceremonies were celebrated across the company
An aerial view of our Polyester plant Our Soda Ash plant at night
ICI Pakistan Limited Annual Report 2010 | Report of the Directors | 19

PaintsSales volume was up by 4 percent over last year in the Decorative segment despite difficult market conditions due to the extended monsoon season and severe floods in Q3. The domestic construction sector which is the primary driver for growth, is yet to return to its high levels of 2006-2007. The burden of high inflation and lower disposable income has also adversely effected the painting maintenance cycle, extending it from a historical average of 3 years to 5 years. Some down-trading has also been observed, with consumers moving away from the premium paints segment and buying lower priced paints.
In the industrial segment, business successfully established itself in the OEM top coats segment with breakthroughs at major car manufacturers. Significant progress was made in establishing AkzoNobel's product portfolio in the Marine and Protective Coatings as well as Packaging Coatings businesses. However softening of the economy and resultant lower Foreign Direct Investment (FDI) has considerably contracted the projects business generally.
Refinish segment maintained its focus on establishing the Group products portfolio. Dynacoat, a new mid-tier product introduced into the market was well recieved and has demonstrated good potential for growth. However due to a sharp decline in market liquidity generally and also down-trading on account of high inflation, growth in the refinish segment remained generally low.
Despite all the negative indicators the business through effective margin management successfully kept the unit margins intact. However a conservative policy towards debtor’s provisioning was adopted and one off provision of Rs 108 million was taken in view of the worsening economic conditions particularly liquidity crunch and high interest rates. Consequently, the operating result at Rs 133.3m was 49 percent lower compared to 2009. Excluding the effect of the above one-off provision, operating result was lower by 8 percent only.
Performance of the business going forward would be highly dependent on external factors such as the economic conditions, revival of construction activities and the law & order situation in the country. Rapid increase in raw material prices internationally is also expected to put margins under pressure. Life sciences Pharmaceutical, Animal Health and Vegetable Seeds segments posted double digit growth in sales offsetting weak performance in the sunflower seeds segment. Post floods and rising cotton prices considerably tilted farmers preference in favour of cotton compared to sunflower.Sales in the Pharmaceutical segment grew by 11 percent over last year through volume growth. Animal Health and
Vegetable Seeds segment demonstrated strong double digit growth in sales compared to last year on the back of both price and volume in Animal Health segment, whereas, Vegetable Seeds segment growth was driven by product expansion and aggressive marketing. With highest ever NSI at Rs 3,761.5 million, operating result at Rs 438.8 million was 4 percent higher compared to last year.
20 | Report of the Directors | ICI Pakistan Limited Annual Report 2010

ChemicalsOperating result for the year at Rs 223.4 million was higher by 3 percent compared to last year on the back of better price management despite decrease in sales volume by 6 percent mainly due to lower demand on account of extensive gas load shedding and impact of floods in Q3 2010.
Going forward, gas availability is a major cause of concern with the outage going beyond the expected levels adversely affecting demand from downstream industries.
FinanceThe Company’s Balance Sheet management remained strong with current ratio improving to 2.2 (2009:1.9) and liquidity ratio to 1.4 (2009:1.3)
Net sales income was higher by 24 percent compared to last year. Gross profit was higher by 18 percent on account of better volumes across all businesses and effective margin management. Selling and distribution expenses for the year were 14 percent higher primarily on account of higher freight expenses relating to soda ash exports. Without additional freight expenses, selling and distribution expenses were higher by 7 percent. Administration and general expenses for the year were 10 percent higher than last year mainly due to one off provision of Rs 108 million in Paints business explained earlier. Excluding this administration and general expenses were higher by1 percent.
Financial charges for the year were lower by 2 percent. Other operating income was higher by 6 percent due to increase in interest income on bank deposits.
Consequently, profit after tax amounting to Rs. 2,429 million was 19 percent higher compared to last year. The consolidated profit after tax amounting to Rs. 2,477 million was also 21 percent higher compared with last year.
As mentioned in note 42 on page 113 the tax department continues to issue what is being referred to as “protective assessment” seeking to disallow unabsorbed depreciation relating to PTA assets. The Company’s contention is that these are unwarranted actions and have filed appeals in High Court of Sindh against this highhanded action of the department.
Earnings per share at Rs 17.50 for the year was higher by 19 percent compared to last year.
Future outlookMacro economic outlook is very challenging and business conditions are expected to remain difficult. The debilitating power cuts and widening gap between demand and supply of gas in the absence of a sound energy policy and adhoc allocation of gas to the manufacturing units, has badly affected the industrial sector of Pakistan. If the government does not move to address these issues it will damage the industrial sector of Pakistan with far reaching consequences.
ICI Dulux color studio Pan-Pakistan CE engagement session Our Pharmaceuticals team at the launchof Amybact
ICI Pakistan Limited Annual Report 2010 | Report of the Directors | 21

With its diverse portfolio, strong market positions and excellent management your Company is well positioned to grow if the external limitations mentioned above are managed by the Government of Pakistan.
Your Company’s future performance will be influenced by the issue around energy supplies and macro economic conditions.
AcknowledgmentThe results of your Company are a reflection of the commitment and contribution by the strong pool of talented employees and the trust reposed in the Company by its customers, suppliers and service providers.
AuditorsThe present auditors KPMG Taseer Hadi & Co., Chartered Accountants retire and being eligible, have offered themselves for reappointment with their partner in charge of audit Mr. Amir Jamil Abbasi.
Compliance with the code of corporate governanceAs required under the code of corporate governance dated March 28, 2002, the Directors are pleased to state as follows:
• The financial statements prepared by the management of the Company present fairly its state of affairs, the results of its operations, cash flows and changes in equity.
• Proper books of accounts of the Company have been maintained.• Appropriate accounting policies have been consistently applied in
preparation of financial statements and accounting estimates are based on reasonable and prudent judgment.
• International Accounting Standards, as applicable in Pakistan, have been followed in preparation of financial statements.
• The system of internal control is sound in design and has been effectively implemented and monitored.
• There are no doubts upon the Company’s ability to continue as a going concern.
• There has been no material departure from the best practices of corporate governance as detailed in the Listing Regulations.
• Key operating and financial data for the last 10 years is summarized on page 12
• Outstanding taxes and levies are given in the Notes to the Financial Statements.
• The management of the Company is committed to good corporate governance, and appropriate steps are taken to comply with best practices.
Investment in retirement benefitsThe value of investments, made by the staff retirement funds operated by the trustees of the funds as per their respective audited financial statements for the year ended December 31, 2009, are as follows:
Value (Rs ‘000)1. ICI Pakistan Management Staff Provident Fund 662,0662. ICI Pakistan Management Staff Gratuity Fund 329,2203. ICI Pakistan Management Staff Pension Fund 1,048,477
4. ICI Pakistan Management Staff Defined Contribution Superannuation Fund 259,620
5. ICI Pakistan Non-Management Staff Provident Fund 404,718
AttendanceDuring the year, 4 (four) Board of Directors, 5 (five) Audit Committee and 1 (one) Remuneration Committee meetings were held. Attendance by each Director/CFO/Company Secretary/Secretary Audit Committee was as follows.
Name of Board of Audit RemunerationDirector Directors Committee Committee Attendance Attendance Attendance
1 Mr. M J Jaffer 4 5 –2. Mr. Waqar A Malik 4 – –3. Mr. Mueen Afzal 3 4 –4. Mr. Nawaz Tiwana 3 – 15. Mr. Ali A Aga 4 – –6. Mr. Derek W Welch 3 – –7. Mr. Tariq Iqbal Khan1 – – –8. Mr. Feroz Rizvi 3 4 –9. Mr. Bart Kaster 3 5 –10. Mr. James R Rees 3 – 111. Mr. Rogier M G Roelen2 1 – –12. Ms. Saira Nishtar (Company Secretary) 4 – –13. Mr Zia U Syed – 4 – (Secretary Audit Committee) 1 Resigned w.e.f., July 19, 2010 2 Appointed w.e.f., August 13, 2010
Leave of absence was granted to Directors who could not attend some of the Board meetings
22 | Report of the Directors | ICI Pakistan Limited Annual Report 2010
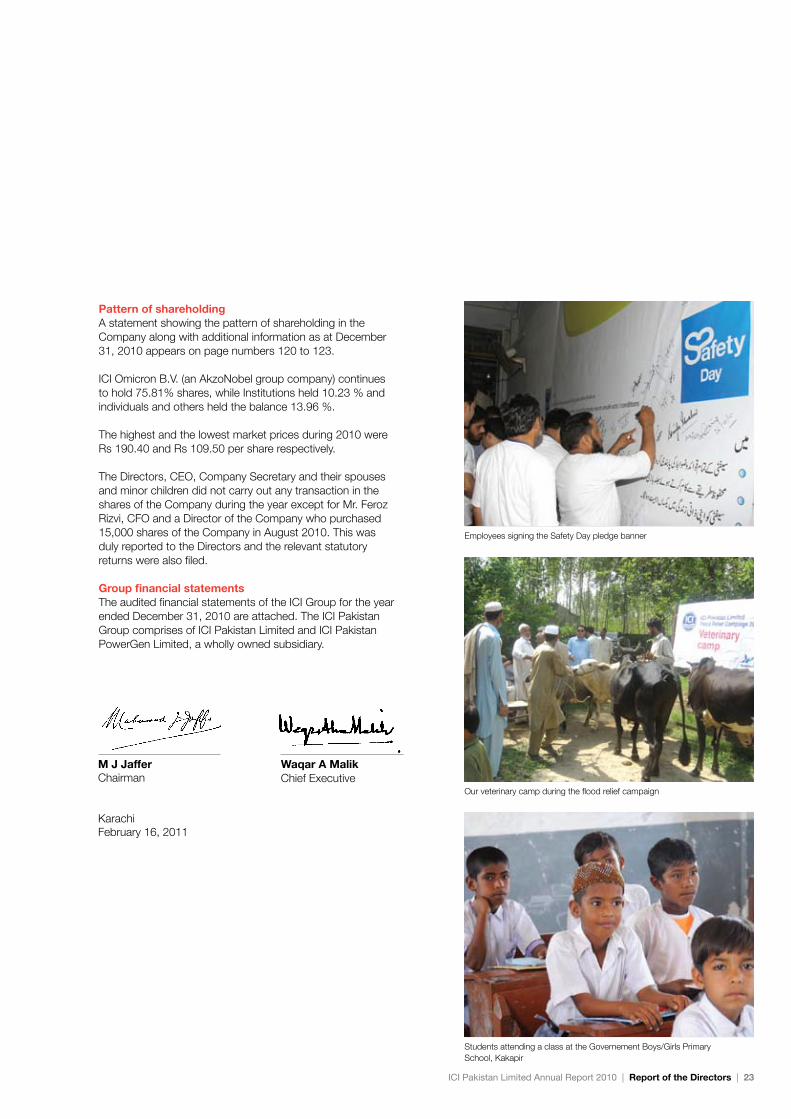
Pattern of shareholdingA statement showing the pattern of shareholding in the Company along with additional information as at December 31, 2010 appears on page numbers 120 to 123.
ICI Omicron B.V. (an AkzoNobel group company) continues to hold 75.81% shares, while Institutions held 10.23 % and individuals and others held the balance 13.96 %.
The highest and the lowest market prices during 2010 were Rs 190.40 and Rs 109.50 per share respectively.
The Directors, CEO, Company Secretary and their spouses and minor children did not carry out any transaction in the shares of the Company during the year except for Mr. Feroz Rizvi, CFO and a Director of the Company who purchased 15,000 shares of the Company in August 2010. This was duly reported to the Directors and the relevant statutory returns were also filed.
Group financial statementsThe audited financial statements of the ICI Group for the year ended December 31, 2010 are attached. The ICI Pakistan Group comprises of ICI Pakistan Limited and ICI Pakistan PowerGen Limited, a wholly owned subsidiary.
Employees signing the Safety Day pledge banner
Our veterinary camp during the flood relief campaign
Students attending a class at the Governement Boys/Girls PrimarySchool, Kakapir
ICI Pakistan Limited Annual Report 2010 | Report of the Directors | 23
M J Jaffer Chairman
KarachiFebruary 16, 2011
Waqar A MalikChief Executive

This statement is being presented to comply with the Code of Corporate Governance contained in the listing regulations of the stock exchanges for the purpose of establishing a framework of good governance, whereby a listed company is managed in compliance with the best practices of corporate governance.
The Company has applied the principles contained in the Code in the following manner:
1. The Company encourages representation of independent, non-executive directors and directors representing minority interests on its Board of Directors. At present the Board includes seven non-executive directors and three executive directors.
2. The directors voluntarily confirmed that none of them is serving as a director in more than ten listed companies, including ICI Pakistan Limited.
3. The Directors have voluntarily declared that all the resident directors of the Company are registered taxpayers and none of them has defaulted in payment of any loan to a banking company, a DFI or an NBFI. None of the directors is a member of a stock exchange.
4. One casual vacancy occurred in the Board on July 19, 2010 which was filled up on August 13, 2010.
5. The Board of Directors of the Company, in its meeting held on February 23, 2001, adopted a Statement of Ethics and Business Practices. This statement under its title ‘The Way We Do Things Around Here’ and then ‘ICI Way’ had been regularly circulated within the Company since 2001. On October 23, 2008, the Directors adopted a new Code of Conduct which was circulated among all employees of the Company. Training sessions were held at various locations in order to apprise all employees about the revised Code of Conduct. In 2010, the employees and the directors of the Company signed a statement on the Code of Conduct reaffirming their pledge that they are aware of the Code and abide by it at all times.
6. The Board of Directors at its meeting held on February 25, 2005 approved and adopted a mission statement which has been circulated to the employees of the Company. A separate vision statement under the title of ‘ICI Pakistan - Our Ambition’ was approved by the Board on February 18, 2010. The Board of Directors has also approved and adopted a corporate strategy for the Company and significant policies. The corporate strategy is reviewed by the Board from time to time as appropriate.
7. All the powers of the Board have been duly exercised and decisions on material transactions, including appointment and determination of remuneration and terms and conditions of employment of the CEO and other Executive Directors, have been taken by the Board.
8. During the year four regular meetings of the Board were held which were all presided over by the Chairman. Written notices of the regular Board Meetings, along with agenda and working papers, were circulated at least seven days before the meetings. The minutes of all four meetings were appropriately recorded and circulated in time.
9. The Directors have been provided with copies of the Listing Regulations of the Stock Exchange, the Company’s Memorandum and Articles of Association and the Code of Corporate Governance. Orientation courses, both in-house and external, were also arranged for the Board in 2003 & 2006. Besides a comprehensive paper on ‘Roles and Responsibilities of Directors’ was also circulated to the directors for their perusal in November 2006. In April 2008, another booklet titled, “A Handbook of Directors” was circulated amongst the Directors. A presentation on corporate governance and the roles and responsibilities of directors was arranged for the new Director, Mr Rogier Roelen in 2010. The directors are, therefore, well conversant with their duties and responsibilities.
10. No new appointment of CFO or Head of Internal Audit has been made during the year. New Company Secretary, Ms Saira Nishtar was appointed by the Board on February 1, 2010.
11. The Report of the Directors for the year ended December 31, 2010 has been prepared in compliance with the requirements of the Code and fully describes the salient matters required to be disclosed.
12. The financial statements of the Company were duly endorsed by the CEO and CFO before approval of the Board. The 2nd quarterly and annual accounts were also initialed by the external auditors before presentation to the Board.
13. The Company maintains a list of related parties which is updated on a regular basis. All transactions with related parties are placed before the Audit Committee on a quarterly basis and approved by the Board along with the methods for pricing.
14. The Directors, CEO and executives do not hold any interest in the shares of the Company other than that disclosed in the pattern of shareholding.
15. The Company has complied with all the corporate and financial reporting requirements of the Code.
16. The Audit Sub Committee of the Board has been in existence since 1992. It comprises three members, all of whom are non-executive directors including the chairman of the committee. ICI Pakistan also has a Remuneration Committee comprising two non-executive Directors, which has also been in operation since 1997.
Statement of Compliancewith the Code of Corporate Governance for the yearended December 31, 2010
24 | Statement of Compliance | ICI Pakistan Limited Annual Report 2010

17. There have been five Audit Committee meetings during the year under review. The Directors have approved the revised terms of reference of the Audit Committee in light of the Code of Corporate Governance.
18. ICI Pakistan has an effective internal audit function in place. The Board has outsourced the internal audit function to M/s Ford Rhodes Sidat Hyder & Co. Chartered Accountants, who are considered suitably qualified and experienced for the purpose and are conversant with the policies and procedures of the Company. They are involved in the internal audit function on a full time basis.
19. The statutory auditors of the Company have confirmed that they have been given a satisfactory rating under the quality control review programme of the Institute of Chartered Accountants of Pakistan, that they or any of the partners of the firm, their spouses and minor children do not hold shares of the Company and that the firm and all its partners are in compliance with International Federation of Accountants (IFAC) guidelines on Code of Ethics as adopted by Institute of Chartered Accountants of Pakistan.
20. The statutory auditors or the persons associated with them have not been appointed to provide other services except in accordance with the listing regulations and the auditors have confirmed that they have observed IFAC guidelines in this regard.
21. We confirm that all other material principles contained in the Code have been complied with.
We have reviewed the Statement of Compliance with the best practices contained in the Code of Corporate Governance prepared by the Board of Directors of ICI Pakistan Limited to comply with the listing regulations of the respective Stock Exchanges, where the Company is listed.
The responsibility for compliance with the Code of Corporate Governance is that of the Board of Directors of the Company. Our responsibility is to review, to the extent where such compliance can be objectively verified, whether the Statement of Compliance reflects the status of the Company’s compliance with the provisions of the Code of Corporate Governance and report if it does not. A review is limited primarily to inquiries of the Company personnel and review ofvarious documents prepared by the Company to complywith the Code.
As part of our audit of financial statements we are required to obtain an understanding of the accounting and internal control systems sufficient to plan the audit and develop an effective audit approach. We have not carried out any special review of the internal control system to enable us to express an opinion as to whether the Board’s statement on internal control covers all controls and the effectiveness of such internal controls.
Further sub-regulation (xiii) of Listing Regulations 35 (previously Regulation No. 37) notified by the Karachi Stock Exchange (Guarantee) Limited vide circular no. KSE/N-269 dated January 19, 2009 requires the Company to place before the Board of Directors for their consideration and approval related party transactions distinguishing between transactions carried out on terms equivalent to those that prevail in arm’s length transactions and transactions which are not executed at arm’s length price recording proper justification for using such alternate pricing mechanism. Further, all such transactions are also required to be separately placed before the audit committee. We are only required and have ensured compliance of requirement to the extent of approval of related party transactions by the board of directors and placement of such transactions before the audit committee. We have not carried out any procedures to determine whether the related party transactions were undertaken at arm’s length price or not.
Based on our review, nothing has come to our attention which causes us to believe that the Statement of Compliance does not appropriately reflect the Company’s compliance, in all material respects, with the best practices contained in the Code of Corporate Governance as applicable to the Company for the year ended 31 December 2010.
February 16, 2011 KPMG Taseer Hadi & Co.Karachi Chartered Accountants
Review report to the members on statement of compliance withbest practices of code of corporate governance
M J Jaffer Chairman
KarachiFebruary 16, 2011
Waqar A MalikChief Executive
ICI Pakistan Limited Annual Report 2010 | Review report | 25

Executive management committeeThe CE is the Chairman of the Executive management committee. The committee comprises the Chief Financial Officer, Business Vice Presidents, and Head of Human Resources. This committee meets once a month under the chairmanship of the Chief Executive and is responsible for strategic business planning, decision making and overall management of the Company.
HSE management committeeThe Health, Safety & Environment committee, chaired by the CE, periodically reviews and monitors company-wide practices. It oversees the health, safety & environment functions of our company and is also responsible for ensuring that all our operations are environment-friendly and compliant with regulatory and AkzoNobel framework.
Succession planning forumThis forum is chaired by the CE and meets annually to review the company’s succession planning and talent pipeline at all levels. This forum is supported by the following capability groups:
• Commercial Capability Group• Technical Capability Group• Finance, IT, Legal & Administration Capability Group• HR Capability Group
Management committees
Ali A Aga Vice President, Soda Ash Business
M Asif Malik Vice President, Corporate HR & Life Sciences Business
Suhail A Khan Vice President, Polyester Business
Waqar A Malik Chief Executive
Khalid Alvi Vice President, Chemicals Business
Feroz Rizvi Chief Financial Officer
Jehanzeb Khan Vice President, Paints Business
Executive Management Team
1 2 3 4 5 6 7
1 3 5 7
2 4 6
26 | Management committees | ICI Pakistan Limited Annual Report 2010

Chief Executive
Corporate Technical
Chief FinancialOfficer
HumanResources
Soda AshBusiness
PolyesterBusiness
PaintsBusiness
Life SciencesBusiness
ChemicalsBusiness
Corporate Communications
Supply Chain networkChaired by the Vice President Paints Business, the Supply Chain Network comprises of Supply Chain managers, and aims to improve procurement and material handling effectiveness by seeking and capitalizing of synergistic opportunities and sharing of best practices.
Sustainability CouncilThe objective of the Sustainability Council is to implement a sustainable business strategy for the company and stakeholders. It comprises of a multi-disciplinary team representing the following segments of ICI Pakistan Limited.
• Compliance and Risk Management • Community investment• Manufacturing• HSE• HR• Operations• Supply Chain The Council is formulated with the agenda of including sustainability in all aspects of our value chain; to develop and retain leadership positions in all sustainability indicators.
Organizational structure
ICI Pakistan Limited Annual Report 2010 | Management committees | 27

How we govern our affairs is what dictates our long-term performance. A transparent structure to monitor and report our performance is what governance is all about.
ICI Pakistan’s corporate governance structure is based on the company’s articles of association, statutory, regulatory and other compliance requirements applicable to companies listed on the stock exchanges, complemented by several internal procedures. These procedures include a risk management assesment and control system, as well as a system of assurances of compliance with the applicable laws, regulations and company's code of conduct.
Corporate Governance Statement ICI Pakistan Limited is a public limited company established under the laws of Pakistan. The shares of the Company are listed on the three stock exchanges of the country, the Karachi Stock Exchange (G) Limited, Lahore Stock Exchange (G) Limited and Islamabad Stock Exchange (G) Limited.
The Board of Directors is responsible for setting the goals, objectives and strategies the Company has to adopt and for formulating the policies and guidelines towards achieving those goals and objectives. The Board is accountable to the shareholders for the discharge of its fiduciary function. The management is responsible for carrying out the
implementation of the aforesaid goals and strategies in accordance with the policies and guidelines laid down by the Board of Directors. In order to facilitate a smooth running of the day to day affairs of the Company, the Board entrusts the Chief Executive with necessary powers and responsibilities who in turn is assisted by an Executive Management Team comprising the Chief Financial Officer and the Heads of businesses and functions. The Board is also assisted by a number of sub-committees comprising mainly non-executive directors.
ICI Pakistan’s corporate governance structure is based on the requirements of the Companies Ordinance, 1984, alongwith other circulars and guidelines issued by the Securities and Exchange Commission of Pakistan, listing Regulations of the three stock exchanges, the Code of Corporate Governance, the Company’s Articles of Association and Company's Code of Conduct.
ICI Pakistan Limited has always held in high esteem the best practices of corporate governance and believes in widely propagating the values and the ethics for strict adherence by all the employees, contractors, suppliers and others while doing business for the Company. Even before the introduction of the requirement in the Code of Corporate Governance in 2002 (‘the Code’), ICI Pakistan had a Code of Conduct which was circulated to all the employees for necessary compliance. In order to apprise the employees of the Code of Conduct, the Company organizes training sessions and induction programs on a regular basis. Besides this, every employee and director of the Company is required to sign, on an annual basis, a statement to the effect that he or she understands the Code of Conduct and that he or she abides by it at all times while doing business for the Company.
In order to facilitate strict adherence to the Code of Conduct, the employees also have access to a ‘Speak Up’ program whereby any employee can report any unethical dealing by any Company employee on a confidential basis either through telephone or e-mail. Complete anonymity of the person using this facility is assured and all complaints are thoroughly investigated either by the Company internally or by assigning it to the Internal Auditors. Results of the investigation are communicated to the complainant.
The present Board of ICI Pakistan comprises a well balanced mix of executive and non-executive directors. It has ten directors which include three executive directors (including the Chief Executive) and seven non-executive directors out of whom three are independent directors and four represent the majority shareholders, ICI Omicron B.V. The Chairman of the Board is a non-executive director. Thus the positions of Chairman and Chief Executive are held by separate individuals with clearly defined roles and responsibilities.
ICI Pakistan has had an Audit Sub Committee and a Remuneration Sub Committee of the Board much before the introduction of the Code of Corporate Governance comprising all non-executive directors including
Corporate Governance andCompliance
28 | Corporate Governance and Compliance | ICI Pakistan Limited Annual Report 2010

I am proud to work for a company that is among those leading the way forward in corporate governance practices in Pakistan.
Saira NishtarGeneral Counsel &
Company Secretary
the Chairman. The terms of reference of these Committees have been given elsewhere in this Report.
ICI Pakistan Limited has a sound system of internal control and risk management. The internal audit function which is mainly responsible for internal control, has been outsourced to M/s Ernst & Young Ford Rhodes Sidat Hyder & Co. and reports directly to the Chairman of the Audit Committee. As a consequence of regular review over several years the company now has an extremely robust system of internal controls which was further strengthened in 2005 when the Company had to go through a comprehensive implementation of the Sarbanes and Oxley Act (SOX) due to listing of its previous parent company’s shares on the New York Stock Exchange. Although this requirement is no longer applicable to ICI Pakistan Limited as a result of delisting of its ultimate parent company from the New York stock exchange, the Company continued with the control measure then adopted.
The Company has a stringent policy on insider trading and securities transactions. The policy paper which is circulated to all the employees of the Company from time to time, divides the employees in certain categories on the basis of their position and involvement in day-to-day decision making process and access to price sensitive information. Certain senior executives and the finance staff are categorized as ‘Permanent Insiders’. While ‘Executives’ (as defined in the Code of Corporate Governance) some of whom may not be ‘Permanent Insiders’, can deal in the Company’s shares any time outside the closed period announced by the Company on the eve of the quarterly Board meetings, the ‘Permanent Insiders’ can deal in the Company’s shares only during the open period specifically announced by the Company immediately after the quarterly Board meetings and the announcement of financial results. This open period does not exceed 15 calendar days in each quarter from the date of announcement of the financial results. All such transactions are required to be reported to the Company Secretary within four days of execution of the transaction with relevant details of purchase/ sale of shares.
Competition LawAs embodied in our Code of Conduct, ICI Pakistan supports the principles of free enterprise and fair competition. ICI Pakistan competes vigorously but fairly with its competitors within the framework of applicable laws - all to provide better and increasingly useful products and more efficient services to our customers.
The Legal Department conducted Competition Law Training of156 relevant employees in 2009. All relevant employees are required to sign an additional declaration of compliance with the Competition Law.
We continue to regularly hold training sessions to ensure compliance with competition laws for relevant employees.
United Nations Global Compact (UNGC)ICI Pakistan remains committed in making the UNGC’s Ten Principles part of our strategy, culture and day-to-day operations. The Ten Principles form a set of core values in the areas of human rights, labor standards, the environment and anti-corruption.
Adequate DisclosureAt ICI Pakistan, it is our endeavor to continue to be transparent in all our dealings, with all stakeholders. This is achieved through adequate and comprehensive disclosure of all communications to our shareholders and other stakeholders, including our financial statements.
All critical accounting estimates, rules and procedures governing extraordinary transactions, or any changes in accounting policies along with their financial impact, are disclosed in the notes to our financial statements. We follow the Companies Ordinance and applicable IAS and IFRS (that’s International Accounting Standards and International Financial Reporting Standards). In addition, we endeavor to provide as much supplementary information in the financial statements as possible.
Annual General MeetingThe company holds its annual general meeting of the shareholders in light of the Companies Ordinance, Listing Regulations, Code of Corporate Governance and our Articles of Association. We request all our shareholders to participate. We also ensure that a copy of the annual report containing the agenda and notice of our AGM is dispatched to every shareholder at her/his registered address.
Ownership & Control StructureComplete disclosure of ICI Pakistan’s shareholding structure is given in the pattern pursuant to the Companies Ordinance and the Code of Corporate Governance in the printed accounts of the company. Our share capital is comprised of ordinary shares. No other class of shares is issued by the company. ICI Omicron B.V. holds 75.81 percent shares in the company. The rest of the shares are held by the general public and institutions.
Related Party TransactionsWe maintain a complete and updated list of related parties. All transactions with related parties are carried out on an unbiased, arms length basis as per formulas approved by the Board of Directors. A complete list of all related party transactions is compiled and submitted to the Audit Committee every quarter. After review by the Audit Committee the transactions are placed before the Board for their consideration and approval.
ICI Pakistan Limited Annual Report 2010 | Corporate Governance and Compliance | 29

Material Interests of Board MembersDirectors are required to disclose, at the time of appointment and on an annual basis the directorships or memberships they hold in other corporations. This is in pursuance with the Companies Ordinance, Section 214, which also requires them to disclose all material interests. We use this information to help us maintain an updated list of related parties. In case any conflict of interest arises, we refer the matter to the Board’s Audit Committee.
Chief Executive Performance CriteriaThe performance of the Chief Executive is evaluated on a blend of quantitative ‘value’ and qualitative ‘values’ driven objectives. Value driven objectives relate to growth and financial performance of the company while values relate to the company’s performance on sustainability parameters. Underpinning both these objectives is the ‘how’ component which measures what processes and policies were implemented and complied with. Committees of the BoardAudit committee with brief terms of refernceThe Audit Committee ensures that the Company has a sound system of internal financial and operational controls.
It serves as ‘the eyes and the ears’ of the Board, assisting it in discharge of its fiduciary responsibilities.
The Audit Committee reviews the periodical financial statements of the Company and announcements of results to the stock exchanges.
One important responsibility of the Committee is to recommend to the Board the appointment of external auditors and facilitate the external audit and discuss with the external auditors major observations arising from interim and final audits. In doing so, the Committee also reviews the management letter issued by the external auditors and management’s response thereto.
Besides this, risk management, compliance with relevant statutory requirements, review of legal matters which may significantly impact the financial statements, monitoring compliance with the best practices of corporate governance and investigating any violations thereof and ensuring coordination between internal and external auditors are also the main responsibilities of the Audit Committee.
In carrying out its duties the Audit Committee has the authority to discuss any issue within its remit directly with the management, internal auditors or external auditors and may obtain outside legal or professional advice on it, if it considers necessary.
The Audit Committee comprises three directors all of whom are non-executive directors including the Chairman. The Chief Financial Officer and representatives of internal auditors attend the Committee meetings by invitation.
The Audit Committee meets at least four times in a year. At least once a year, it meets the external auditors without the CFO or the internal auditors being present. It further meets at least once a year, the internal auditors without the CFO being present.
The Audit Committee met five times during the year under review.
Remuneration committeeThe Remuneration committee is a Sub-Committee of the Board and is responsible for reviewing the remuneration and benefits of the Chief Executive, executive directors and other senior managers. It also reviews the overall remuneration budget of the Company.
The Committee consists of two non-executive directors. The Vice President Human Resources acts as the Secretary and the committee meets at least once a year.
Banking CommitteeThis Committee comprising two executive and one non-executive director has been constituted to approve matters relating to opening, closing and day to day operations of bank accounts. The resolutions passed by the Banking Committee are subsequently ratified by the Board.
Share transfer committeeThe share transfer committee consists of two executive and one non-executive director. This committee approves registrations, transfers and transmission of shares. Resolutions passed by the Shares transfer committee are subsequently placed at Board meetings for ratification.
30 | Corporate Governance and Compliance | ICI Pakistan Limited Annual Report 2010

Risk Management The Board has an overall responsibility for the risk management process, incorporating risk management and internal control procedures. The Company’s documented and regularly reviewed procedures are designed to safeguard our assets, address risks facing the business, and ensure timely reporting to the Board and senior management.
We maintain a clear organizational structure with defined delegation of authorities. Our senior management takes the day-to-day responsibility for implementation of procedures; ongoing risk monitoring; and effectiveness of controls. On an ongoing basis, we monitor risks faced by our various businesses to ensure pertinent control arrangements.
Our risk and control procedures are supported through:
Control Self Assessment Tool In 2010 the Control and Self Assessment Tool (CSAT) was introduced by AkzoNobel which assisted in the thorough assessment of controls to ensure a robust control structure. Senior management, along with the active involvement of each unit’s management, led this annual self assessment exercise in 2010. Existing controls were identified, assessed and documented with the help of the online tool. Weaknesses highlighted through this exercise were documented through action plans which clearly defined the corresponding actions to close the identified weaknesses in the system and processes. Our internal auditors, Ernst and Young, also tested the results of the CSAT exercise. Further, action plans are followed up rigorously to ensure that timely corrective action is implemented for the effective functioning of controls.
Enterprise Risk Management The Enterprise Risk Management (ERM) methodology is part of AkzoNobel’s effort to clearly and structurally prioritize the main risks affecting our operations and organizations, in order to focus the company’s efforts on those risks that are not controlled in an acceptable
manner. For this purpose, ERM workshops were conducted across all our Businesses. The purpose and goal of the ERM workshops was to identify, assess and develop responses to the main risks that are affecting or could in the future affect ICI Pakistan Ltd in achieving its strategy and objectives (financial & non-financial). A cross-functional Business Executive Team identified a detailed list of overall business risk exposures. This exercise was performed by all businesses during 2010 and the main outcome of these workshops was the development of a current and complete risk profile upon which necessary action plans was developed to mitigate the main risks.
ComplianceNon-Financial and Financial Letter of RepresentationThe Non-Financial Letter of Representation is the representation of management to its higher level of management and the group on how management has dealt with the delegated responsibility, has adhered to the rules and regulations and explains exceptions and deviations that occurred during the year.The respective Business and Function Heads submitted an annual representation to the Chief Executive. A consolidated version is sent to the Group.
Internal and External AuditOur Corporate Audit function plays a key role in providing the management and the Board an objective view and reassurance of the effectiveness of the risk management and related control systems throughout the entity. The Board, through the Audit Committee, has reviewed the assessment of risks, internal and disclosure controls and procedures and suggested remedial actions where applicable. The role of the Audit Committee is to assist the Board in fulfilling their oversight responsibilities regarding the integrity of ICI Pakistan’s financial statements, risk management and internal control, compliance with legal and
regulatory requirements, the external auditors’ performance, qualifications and independence, and the performance of the internal audit function.
The external auditors are appointed by the shareholders on a yearly basis at the annual general meeting on the recommendation of the board of directors. The partner in charge of our audit is rotated every five years as per the local regulations.
In this uncertain world, management of operational risks is a top priority. We have formal risk assessment processes in place to give reasonable assurances to our stakeholders and to safeguard our interests.Zia U SyedCorporate Compliance & Shared Services Manager

Strategic
Operational
Major risk factors assessed
Internal
• Change in brand identity due to change in ownership. Risk of failure to successfully implement and merge the transition strategy can result in contraction of brand equity leading to loss in sales volume especially in Paints business.
The transition is minimized and risk is managed through active engagement process.
• Dependence on a single source supplier. Inability to access raw materials may adversely influence the future results of the company.
The company aims to use its purchasing power and long term relationships with the suppliers to ensure continuous availability of raw materials and safeguard their constant delivery at the best conditions. We have also acquired our own salt mine on lease to ensure availability of vital raw material for Soda Ash.
• Risk of failure to develop the talents of our people in line with changing organizational needs impacting overall Company sustainability.
External
• Risk of large scale cheap imports or dumping of soda ash in Pakistan by major international manufacturers, in view of oversupply in global soda ash industry owing to economic recession, resulting in domestic sales / market share going down.
• Ad-hoc tariff adjustments on imports negatively impacting competitiveness of local producers like ourselves.
• Risk of expansion/ productivity enhancement projects deliverables and business continuity being impacted by volatile law & order situation.
One of the key uncertainties is the manner through which government policies evolve and their consistency. The Board and management endeavor to define and implement a clear strategy to overcome these strategic external risks and continuously seek dialogue with the policy makers through various business forums in the overall interest of the domestic industries.
• Risk of disruption of electricity and natural gas, because of unavailability of resources, can negatively impact business deliverables due to delay in local manufactured items/ material and due to reduction in Contribution Margin as a result of using expensive alternate fuels.
Another principal uncertainty facing the company is the extent of economic downturn based on above uncontrollable factors. The Board and the management closely monitor the economic and market developments and keep in-touch with our partners in the value chain. The company is assessing the implementation of an alternate energy option in its Soda Ash business.
As a result of the ERM exercises, our risk profile emerged. In the matrix below, we share some of these risks along with the action being taken to mitigate such risks.
32 | Corporate Governance and Compliance | ICI Pakistan Limited Annual Report 2010

External
• Risk of default in payments, in highly difficult economic conditions, leading to adverse financial impact on the company.
The company’s counterparty risk is sufficiently diversified with established limits for key customers. Credit reviews are regularly conducted to align the exposure in line with the changing conditions while remaining within the overall risk appetite of the company.
Operationalcontinued
Financial
Internal
The board and management put great emphasis on attracting, educating, motivating and retaining staff, using engagement tools such as performance and development appraisals and dialogs, employees surveys, leadership identification and review as well as leadership development. It’s a firm belief that without people we would not have a business and growing business means having to develop our people.
ICI Pakistan Limited Annual Report 2010 | Corporate Governance and Compliance | 33

Month Event
February Board Meeting Audit Committee Meeting Remuneration Committee Meeting
March Annual General Meeting
April Board Meeting Audit Committee Meeting
August Board Meeting Audit Committee Meeting
October Board Meeting Audit Committee Meeting
November Long Service Awards Lahore
December HSE Management Meeting Succession Planning Meeting Long Service Awards Karachi
Awards &achievements
We know that excellence speaks for itself, but we’re also proud of being recognized by external corporate and government bodies for our efforts in various areas.
Best Corporate Report AwardOur Annual Report 2009 was amongst the top five in the Chemicals and Fertilizers category of the ICAP Best Corporate Report Awards. This is the fourth successive year that we have had the honor of winning the Best Corporate Report Award.
PCP Recognition for Best Corporate Giving We received recognition from the Pakistan Center for Philanthropy (PCP) for being amongst the top corporate givers for 2010.
7th Annual Environment Excellence Award 2010 We were among the winners of the 2010 Environment Excellence Awards organized by Pakistan’s National Forum for Environment and Health (a non-profit affiliated with the UN Environmental Program).
Calendar ofmajor eventsMeetings
Communication is not just another job; every day I have the chance to come up with new ideas and new ways of putting across to the world what we as a company are all about.Hafsa ZubairBrand Manager,CorporateCommunications& Public Affairs
34 | Awards & achievements | ICI Pakistan Limited Annual Report 2010

Vision To proactively partner with the businesses and functions of ICI Pakistan, in order to help them achieve their Key Strategic Objectives, through innovative and cost effective IT solutions.
Highlights of 2010 • Strategic initiative to implement SAP at the Paints business • Deploying McAfee End Point to enhance security of information assets• Remote Disaster Site completed to strengthen business continuity• Migration from Lotus to MS Outlook / SharePoint in line with global policies• Enabling smarter business collaboration through tools such as video
conference, web meetings etc.
TeamThe team is a blend of rich experience and youthful energy. Our people have talent, creative drive and enthusiasm. This has been reflected in the delivery of very challenging projects, which are aimed at achieving best in class in terms of processes, efficiencies and controls.
Major Projects / ImprovementsOur focus was on delivering key strategic initiatives emanating from the 5-year strategy roadmap. Leveraging on our current SAP platform, which has enabled our businesses to run efficiently on processes derived from industry best practices, delivering value, efficiency and controls, was key to our strategy. In line with this strategic thrust it was decided to implement SAP at Paints. The migration of our e-mail and non-ERP applications to Microsoft Outlook and SharePoint is aimed at both, alignment with the group, and an opportunity to consolidate and standardize, thereby simplifying the IM landscape. We have undertaken expansion of the IT infrastructure with the latest technology to enable our people to collaborate more effectively through the use of tools for video conferencing, web meetings etc. The security of our information assets is made more robust with the deployment of end point security, and the establishment of a remote DR site.
Future OutlookWe will continue to look for opportunities and innovations that will enable our businesses to work smarter and faster. We will need to leverage the investments that have been made in our applications, continue focus on the development of our people, and ensure business continuity and sustainability are strengthened.
Technology developments
In an increasingly technology-dependant workplace, the ever-morphing need for improvementprovides constant challenges. Finding solutions for today and newanswers for tomorrow is the excitement of my job!
Zain Zafar AlviSAP Consultant
Before 2004 2004 - 2010
Bespoke systems in SAP Implemented inICI Pakistan ICI Pakistan
BPCS at Paints SAP roll out in Paints 2010 - 2011
De-centralize IT organization IT re-organized as a central shared service function
Heterogeneous IT infrastructure Consolidation and standardization of IT infrastructure. State of the art central data center
Capability gap ITO scheme introduced

Communityinvestment
Working to ensure a positive impact on our surrounding communities and society as a larger whole is something we as a company have focused on since our early days. We work to promote development and sustainable investment in various areas of social and community welfare.
EducationEducation is a prime focus in a developing country like Pakistan. We support various schools throughout Pakistan, especially in localities near our operations.
Government Boys’ Primary School, Kakapir: This school caters to children from the locality of Kakapir, a small coastal fishing village. We have been helping run this school for the past six years.
Government Girls’ Middle School, Bararkot, Tehsil Gari Habibullah: This school was completely devastated in the 2005 earthquake. We worked with local authorities and rebuilt the school in 2006 and since then have helped run it. Last year we upgraded the school, from primary to secondary level.
Tibbi Hariya School, Sheikhupura: For the past six years we have supported this school near our Polyester plant.
Institute of Behavioral Psychology (IBP): We have completed twenty years of support to IBP, which provides children with learning disabilities an education, and helps give them the tools to become productive members of society
EnvironmentProtecting and maintaining the environment is becoming a more critical need with every passing day. We run and support a variety of initiatives, both internal and external, in this regard.
Save the Turtle Project: Since 2005, we have supported the WWF's ‘Save the Turtle Project’. WWF Pakistan carries out this project in collaboration with the City District Government of the port city of Karachi, which has several important marine turtle nesting beaches. This program involves keeping nesting beaches free from litter and debris which endangers marine turtles; educating the local population; and raising general awareness by involving the public in regular beach-cleaning efforts.
When we became engaged with the project, 2204 hatchlings were released each season. This number has now increased to 35,000 hatchlings every season. Over six years we have helped contribute to the safe release of 210,000 hatchlings. We have also participated regularly in WWF’s annual Nature Carnival which educates children on environmental issues.
Reducing carbon emissions We launched a company-wide carpooling drive with the objective of reducing our carbon emissions, consequently reducing our individual and collective carbon footprint. our employees participated in this drive and carpooled to work in 2010, saving 63.5 kg of carbon dioxide.
HealthPakistan’s large rural population is faced with a severe lack of adequate healthcare facilities, and we have tried through our efforts over the years to combat this serious problem.
36 | Community investment | ICI Pakistan Limited Annual Report 2010

LRBT Eye Clinics: Since 1991 our Soda Ash Business has run surgical eye camps in collaboration with LRBT, providing free of cost treatment to local residents of the Khewra and Pind Dadan Khan area. A team of LRBT ophthalmologists from LRBT Karachi, carry out these free eye checkups, medical screenings and surgeries using the facilities at our Winnington Hospital.
We now have initiated the same program for the community near our Polyester plant in Sheikhupura, with the first eye camp being held in November 2010 examining nearly 200 patients.
Blood Donation Camps: In 2010 our Life Sciences Business initiated a country-wide blood donation drive in collaboration with the Fatimid Foundation, which is a non-profit organization that works to provide life-saving hematology services to thalassemia patients.
During this drive there were two separate blood donation camps organized in which over 200 employees donated blood.
Volunteer programLaunched in 2009, our volunteer program has completed its second successful year. Employees from across the company volunteered in a variety of initiatives ranging from taking students out on field trips, to visiting hospitals and organizing relief efforts.
Students of the Bararkot school during a performance
A patient being examined at our free LRBT eye camp
A student of the Kakapir school Distributing relief goods to the flood survivors in the flooded areas

Flood Relief and Rehabilitation In 2010, the worst floods in Pakistan’s history left 20 million people displaced. Pakistan’s devastating floods were traumatizing for the whole nation, destroying livelihoods, homes, crops, schools and more.
At ICI Pakistan Limited we worked actively to provide relief to those affected by the floods across the country. We initiated an immediate emergency relief program through the ICI Pakistan Foundation to provide food and medical assistance to areas that were severely flooded and cut off.
Staff from our businesses all around Pakistan volunteered their time and helped put together 10,000 emergency care packs filled with immediate sustenance items such as dates and biscuits, along with water and basic medical and sanitation supplies.
Medical campsOur Life Sciences team also set up 15 medical camps in flood-affected areas of Punjab and Khyber Pakhtoon Khuwa. Nine veterinary camps were also set up for flood affected livestock.
The volunteer work I did during the Flood Relief Campaign was one of the most satisfying experiences of my life, and was a reward in itself.Muhammad Umar MushtaqProduction Manager, Soda Ash
38 | Community investment | ICI Pakistan Limited Annual Report 2010
Our volunteer team headed by Waqar A Malik visiting flood affected areas in Sukkur

One million mealsThe ICI Pakistan Foundation contributed Rs. 36 million for flood relief. The Foundation dispatched one million meals in the form of essential rations and clean drinking water to affected areas. By August end, we were able to dispatch rations all over Pakistan and achieved our 'million meal' target.
Relief camp visitICI Pakistan Limited Volunteers also visited a relief camp set up and operated by the Pakistan Navy in Thatta, Sindh, and distributed 400 specially prepared packs to children on the occasion of Eid. These packs contained sweets, biscuits, juice, milk, coloring books, and pencil cases with crayons etc. Our volunteers also donated 5 water filtration devices to the camp.
RehabilitationAfter the success of our Relief Program, we have initiated a Rehabilitation Program for flood affectees, starting with six schools in Nowshera Kalan that were destroyed in the floods. We are now reconstructing houses in collaboration with Karachi Relief Trust (KRT). The Foundation signed an agreement to build houses in Rahim Yar Khan, Punjab and Munda Headworks in Khyber Pakhtun Khuwa. Construction of our first model village isnearing completion.
Each house constructed in the model village has two rooms, a bathroom, a kitchen and a front open area.
Company-wide care pack drive A young flood survivor A flood survivor carrying a box of relief goods One of the schools that were painted during the flood relief efforts

Health, Safety,Environment & Security
Beliefs and PrinciplesAt ICI Pakistan we remain committed to maintaining our leadership position as a Responsible Care Company. The health and safety of our employees, protection of environment and focus on sustainable development remains a cornerstone of our strategic decision-making. We strive at all levels to create business value, opportunities and competitive advantage through our HSE&S performance.
HSE&S Management SystemOur HSE&S management system is at the heart of ICI Pakistan’s continuous improvement drive. It comprises of seven elements each outlining the minimum requirements to meet our HSE&S policy. These elements are as follows:
1. Managing improvement2. Health and safety of employees and
contractors3. Security of people and assets4. Product stewardship5. Emergency response and community
awareness6. Asset integrity and process safety7. Site environmental protection & pollution
prevention
Compliance to local regulatory requirements and codes of practice applicable in Pakistan is mandatory covering all our business and operational activities.
While the drive to sustain and continuously improve our Health, Safety, Environment and Security performance is the responsibility of ICI Pakistan’s Executive Board, the successful achievement of results require the active participation of every employee of the company.
HSE&S Assurance ProcessesOur slogan for sustaining this excellent HSE record is simple: 'Keep Doing the Basics Right', and some of these basics are:
1. Continue recognizing, reporting and correcting hazardous conditions and unsafe acts through our Learning Events Database system and of course, Behavior Based Safety.
2. Ensuring that employees are provided information, instructions, supervision and training to operate and maintain our equipment and facilities in a “Fit for Purpose” state.
3. Adhering to all systems and procedures that ensure health and safety of people, plants and environment.
4. Strict and to the book 'Management of Change'
5. Effective Communication to promote HSE 6. Comprehensive Auditing of HSE
Performance to progress issues.
Our PerformanceHealthThere was no reportable occupational illness to our employees or supervised contractors in 2010.
SafetyDuring the year, two minor injuries were reported by our Paints site involving supervised contractors who resumed their jobs after treatment. The Safety performance at other sites remained well controlled. Soda Ash achieved 23.4 million man hours, Polyester achieved 19.9 million man hours, Specialty Chemicals achieved 5.4 millions man hours and Life Sciences achieved 7.3 million man hours without LTI (Lost Time Injury) to
employees and supervised contractors.Implementation of Asset Integrity Plans and launch of Behavior Based Safety during the year further aim to improve our Health and Safety Performance moving forward.
EnvironmentEnergy consumption and CO2 emissions were lower by 5.3% and 3% respectively on like to like basis as compared with 2009. Notable energy conservation initiatives included the Reverse Osmosis Water Plant at Soda Ash brought on line in Q4 2010.
What happened in 2010Safety DayBeing part of the AkzoNobel group, ICI Pakistan celebrated Safety Day throughout the company on October 26, 2010. The activities on this day were designed to enhance focus on employees’ safety and to reinvigorate the spirit which has helped maintain an excellent safety record over the years for ICI Pakistan. One of the key activities was recording of an individual safety pledge by each employee committing to do something positive to improve their own safety and those of around them. More than 95% employees participated in this pledge-making.
HSE&S TrainingTraining on HSE&S remained a key focus during 2010. 16% of our total training hours were spent on HSE training. Five HSE&S Awareness Courses, four Leading in HSE&S Courses and one Accident Investigation Workshop were conducted. In all 187 managers from our five businesses and corporate offices attended these courses.
It's great to be a part of a company that has a strong culture of sustainability and considers health, safety and environment an essential catalyst for future success.Sabir MahmoodHSE & Training Manager,Soda Ash
2010 was all about fully comprehending the scope of our sustainability framework, and in 2011 I look forward to taking on sustainable development in diverse areas such as HSE, eco-efficient products and sustainable water management.Syed Iqbal HaiderGroup Technical Manager

Safety Day was celebrated throughout the company on October 26 2010
Our Paints factory staff on Safety Day
The immense opportunity of learning in the world of AkzoNobel's HSE&S systems motivates me and keeps me excited about my job.Muhammad AfaqHSE & Training Manager, Polyester
CP BBS Training ProgramBehavior Based Safety is a program for safety through people. An implementation team headed by the Corporate HSE Manager was formed. The team developed the training modules and devised strategy for the implementation soon after that. The training and follow-up sessions have been successfully completed and all businesses are BBS compliant.
Course Name No. of No of Sessions Participants
HSE Awareness Course 5 102
Leading in HSE (Non-Manufacturing & Manufacturing) 4 68
Accident Investigation Workshop 1 17
HSE&S Framework
Signing of the Safety Day banner
There were two reportable injuries (one Lost Time Injury and one Restricted Work Injury) in 2010.
ICI Pakistan Limited Annual Report 2010 | HSE&S | 41

We believe that attraction, development and retention of talented people is just as important to the success of our Company as the development, manufacturing and sales of great products. For this reason we call ourselves the Talent Factory.
Our Talent Factory AmbitionWe strive to create a working environment that’s entrepreneurial and customer-driven, which consequently helps our employees to develop their potential and sharpen their skills. The result of this strategy is strong, talented leaders who can truly contribute to the sustainable growth of our business.
Fulfilling the ambitionWork Environment• Performance & Development Dialog (P&D Dialog) This is our
global performance management and employee development program which is designed around our company values. For continuous improvement in performance, our employees and their supervisors focus on individual and team goals. Through regular dialog, review and candid feedback, our aim is to achieve better business results and reward our employees for their good work. The P&D Dialog makes our evaluation process simpler and more transparent. Through a documented set of activities and agreed results and behaviors, the goal is to give clear direction and support necessary to achieve desired outcomes.
• Viewpoint Employee Engagement We believe employee engagement is a fundamental driver of business success. To make sure that our employees are involved and committed to their roles, we embarked on the engagement journey in 2010.
Our first survey was very well received, where a staggering 94% of our employees participated, to have their say and make a difference. Through dedicated training sessions across all businesses, we have equipped our managers with knowledge and skills to take effective action within their teams to achieve engagement and subsequently, better business performance.
Using global benchmarks, expert advice and highly committed managers, we want to create an environment where people enjoy their work and feel positive about it.
• Diversity & Inclusion (D&I) We are taking steps to create a place where everyone is valued, where everyone counts, and where everyone can be the best at what they do. For us to make real progress on D&I we ensure everyone goes through the e-learning awareness module to clearly understand what it means and how we can bring about changes in the way we think and across our businesses. We want to create a work place where everyone has the opportunity to develop skills and talents consistent with our company values and objectives, a place where we harness the power of all the ways in which we are different.
Our TalentFactory
I started the year in Marketing at the Polyester Business in Pakistan, and ended it as a Global Program Manager D&I, at the Head Office in Amsterdam. That's the thrill of this company – the sheer diversity of opportunities!
Bilal SalahuddinGlobal Program Manager, Diversity & Inclusion
Head Office, Amsterdam
People are my inspiration,and working with them is the best part of my job Zainab KhanHuman Resource Manager, Paints

Opportunities for Learning and Development The overarching objective of our learning and development cell is to create an enabling environment where all our employees have access to the necessary tools, techniques and desired exposure, that will help them to grow in the organization through professional learning. In 2010, over 27,000 man hours were dedicated to formal training across all businesses and functions.• Sustainability Leadership Program is designed to increase
understanding of the environmental impact we have on our planet and the unique responsibilities we have as leaders to do something about it and to use those insights to the advantage of our businesses.
• Impact is a general management program developed and run in partnership with INSEAD, France. It pays particular attention to our success factors ‘Create Customer Value’ and ‘Dare to Re-Invent’. This is our way to ensure that our managers are living examples of our Company values. Two of our managers attended the Impact program in 2010.
• Octagon is a program that trains our managers on enterprise level thinking so they get a deeper understanding of different business perspectives. One of our senior managers attended Octagon in 2010 and was part of a global team of eight, working on a business project assigned by the Board of Management of AkzoNobel and
top executives.• Executive Leadership Forum is a top leadership program where
new executives across the globe are collectively trained by the top leadership team at AkzoNobel Headquarters.
• Advanced Management Program is designed to help senior and middle managers in becoming more proficient in leading large and/or complex functional teams, positively influencing their work culture, develop leadership talent among their staff and create high performing teams. Approximately 90% of our relevant managers have now been certified in the AMP.
• Management Essentials Program Through this program, we have certified over 70% of all our managers, by virtue of which they have acquired the necessary people development skills including techniques such as the ‘Situational Leadership’ that will ensure continuous capability development.
• Core development We provide our employees the tools to help them meet customer expectations and position the company as customers' clear choice. Employees seeking functional learning opportunities committed to a total of over 8,000 man hours of training on these programs in 2010.
Cross-business and functional opportunities• Business Learning and growth opportunities for our employees
our endless! Through the year we have made sure our talented employees capitalize on cross-functional and business opportunities that can only be made possible in an environment like ours. Our five diverse business units across the country, cater to virtually every industry in Pakistan. The result is a group of talented employees who have, over the years, not only acquired multi functional skills but also worked in different business segments.
• International Assignments Global mobility of our employees plays an important role in our internationally managed business. International assignments help the Group with the transfer of critical skills, the development of key employees and of leadership talent.
Building an industry-leading Talent FactoryEvery day our dedicated team of employees and managers across all businesses and functions position us closer to our longer term goal – "Building an industry-leading Talent Factory," by creating a work environment that enables greatness in our people, giving our company deeper dimensions.
I am proud to be part of a functionthat is integral in making my company an even better place to work.Muddassir Khalid Human Resource Manager, Polyester

Adding color to people’s livesThe coatings industry is more than just a business. It is a form of expression for people and thereby weaves us closely to their lives. So the quest for excellence is not just in terms of functionality and technological advancements; but how we can affect and improve lives with everything we do.
At our Paints Business, we take this responsibility very seriously and have identified the purpose of our business as ‘Adding color to people’s lives’. This is what defines us... this is what excites us… this is who we are!
Everyone wants a more 'colorful' life and decorating our surroundings is one way of expressing this to ourselves and to others.
Paint is one of the most powerful and affordable tools for bringing a large color effect into a space. We offer a color palette of more than 6000 colors. We have set up color studios across the country where you can simply walk in and be transported to a wonderful world of color. Along with this, we offer free consultancy at all our studios where our color ambassadors will help you transform your surroundings. So, just dial 0800 - Dulux or visit us at www.icidulux.com.pk and let us add more color to your life.


ProductsOur two brands, ICI Dulux and Paintex each have a complete product portfolio with ICI Dulux catering to the premium and super-premium tiers, and Paintex to the mid and low tiers. ICI Dulux is our flagship brand that has earned its reputation based on its consistent ability to outperform both competitors and the expectations of its consumers with its product quality and innovation (products and services).ICI Paintex is our value for money brand that caters to consumers who aspire to bring home results that offer value at its best. We have a direct network that spans the country reaching millions of consumers across Pakistan.
Customer Connectivity & Engagement An ICI Dulux InnovationThe paint category in Pakistan is rapidly maturing and consumers are becoming more conscious and aware of their needs. ICI Dulux has always been at the forefront of innovation through top quality products and cutting edge technology. ICI Dulux is the pioneer of the Tinting System in Pakistan under the label of ICI Dulux Color Solutions. ICI Dulux Point of Sale Tinting (POST) offers over 2000 shades available all over Pakistan at designateddealer outlets.
Color consistency and quality is our forte and our customers can be confident that the color they bring home is exactly what they want. To locate ICI Dulux Point of Sale Tinting near you simply log on to www.icidulux.com.pk
Mobile Color SolutionsToday’s customer is more informed and involved in the paint process. ICI Dulux appreciates the new attitude and intends to set new precedents. Customer comfort and convenience is the need of the hour. ICI Dulux Mobile Color Solution Center visited premium residential and commercial localities in Lahore, Karachi and Islamabad to provide services such as color consultancy, interior decoration advice, technical assistance and paint previews at the customer's doorstep. Painter TrainingPainters represent an extremely key group of influencers. A significant issue in the local market is that painters have little or no formal training. Trade is passed from master to student, resulting in a lack of technical knowledge and standardized practices.
To formalize the trade and bring about more professionalism, we initiated a pilot program with the Construction Technology Training Institute (CTTI) Islamabad. Our Paints team in collaboration with CTTI is training building painters in paint application techniques, trouble shooting, color selection and good safety and environmental practices.
K’ArchcitectureICI Dulux sponsored a compilation of photo essays applauding the architectural heritage of the city of Karachi, called K’Archcitecture. The book is an overview of Karachi’s rich architecture seen through the lenses of some of Pakistan’s most distinguished photographers.
Architect engagement eventsWe hosted grand evenings at the historic Barood Khana Haveli in Lahore and at the Mohatta Palace in Karachi as part of our architect engagement plan. Eminent architects and industrial partners attended these events featuring leading musicians from Pakistan’s film industry. These events reiterated our commitment to our stakeholders and promised to strengthen existing, time-tested partnerships, celebrate successes together and support each other in the drive for Tomorrow’s Answers Today™.
PaintsDecorative
The best part of my job is that I am surrounded by friends, not colleagues. Some of the best friends I've made in life are people who work with me every day.Bashar RasheedSupply Chain Manager
In 2011, I look forward to working with more zeal,
interacting with more diversity, contributing
more to my business and spreading more color!
Saad Masood KhanAssistant Brand Manager

What happened in Deco this yearICI Dulux Thematic Campaign - A Theme for Every DreamThis campaign centered on the tagline ‘A Theme for Every Dream’, and reinforced the ICI Dulux brand personality as the leading innovative one-stop shop decorative solution provider in Pakistan. The campaign subtly introduced AkzoNobel as the new parent company and highlighted ICI Dulux ground-breaking services such as Customer contact center (0800-Dulux), color consultancy/interior decoration advice service and color studios. All communication platforms including television, radio, newspapers and outdoor exemplified an assortment of colorful themes nationwide.
Product Development - ICI Paintex range expansionWe introduced new products into the ICI Paintex range with the launch of ICI Paintex Ultra Prime and ICI Paintex Duraguard. The ICI Paintex portfolio now offers interior and exterior emulsion, enamel, wall putty and sealer. With these launches complete before painting season this year we look forward to serving a broader customer base thereby resulting in a higher market presence.
Global Color Week
Global Color WeekThe global ambition for the Paints Businesses of AkzoNobel is "Adding Color to People's Lives", and in line with this, we had our first-ever Global Color Week. The week was dedicated to learning what ‘adding color’ is about and experiencing the transformative power of paint. The objectives of this event were to create Color Awareness, promote Color Futures – the global style and transform our communities by sharing our excitingcolor range.
Business Performance We have been market leaders for over two decades and enjoy a strong equity. This year we saw improved volumes despite slowdown in the construction industry and lengthening of the maintenance paint cycle. Operational Excellence During 2010, we set the following records:• Best ever Right First Time (RFT), at
96% (for Decorative business during November 2010). RFT is a measure of manufacturing process control – the higher the better
• Best ever right first time at 98% (for Coatings business during July, October & November 2010)
• Best ever cycle time at 15 hours (for Decorative business during November 2010). Cycle time is a measure of how quickly batches are being manufactured (the lower the better)
ChallengesThis year we continued to experience the impact of the global economic slowdown resulting in reduced consumer buying power.
Future outlookThe year 2011 is expected to witness a gradual recovery after the economic slow down with the business geared towards focusing on AkzoNobel’s core value, ‘Focusing on the Customer’s Future First’, with the launch of ‘YES - Year of Excellence in Service’ for internal and external customers, new product developments, and several customer-centric activities that will forge robust, sustainable and long-lasting relationships.
ICI Dulux participates in the ArchAsia2010 Expo
ICI Dulux architect engagement event held at a historic location in Lahore
Employees' children participate in Global Color Week drawing competition
Deco employees adding color to their workspaces during Global Color Week
What excites me and keeps me motivated are the diverse responsibilities given to me over a period of 8 years, which strengthen my skills and challenge me.
Fawad Ali Asif MirzaRegional Sales Manager Center


Our focus: your success Achieving a perfect repair is one thing, but creating a smooth and efficient repair process is another. When it comes to pro-ductivity and efficiency you need more than just good paint. En-abling bodyshop profitability has always been at the heart of the Sikkens philosophy. We offer the finest products on the market, together with services, training and support: a powerful formula for perfect results and high bodyshop profitability.
In a recession hit-market where managing cost remains a priority for customers; the focus of our team in 2010 was on improving bodyshop profitability. Scans of each setup were carried out to allow a review of overall functioning, including process analysis, cycle time and equipment. Based on the scans, we gave suggestions on how to improve each of these parameters, as well as advice on how to monitor and quantify results. We provided tools allowing bodyshops to benchmark their performance helping them understand how this affectstheir profitability.
By combining our passion and expertise with the ambition and knowledge of our customers, we worked towards a common goal – increasing bodyshop profitability and sustainability. Helping customers run their business with outstanding success – today, tomorrow and beyond; this is our philosophy, this is what drives us, this is how we do our business.

Market OverviewThe automotive coatings market sizeis estimated at 3 million liters, worthapproximately Rs. 850 million andrepresented by 2.2 million road-going cars.Three Japanese car brands dominate themarket, with no formal approval system forautomotive coatings to allow their after-salesnetwork to exercise cost independence.
Overall, Pakistan’s organized automotivecoatings market is still in its nascent stages,however, low incomes and a high accidentratio, driven by poor road infrastructure and anaging car park have prompted strong growthof the unorganized sector over the last tenyears. This situation is further exacerbated bya lack of technical education and awareness atthe end user level.
With this limited focus on quality, and a strongfocus on costs (a mainstay characteristicof the unorganized sector), less than 18%of the market is represented by Top andMid-tier paints (two-component technology).Meanwhile, 72% of the market is stillrepresented by Automotive Enamels, NCbased color technology and thinners.
Business Performance An inconsistent year for automotive refinishactivities in Pakistan, 2010 was marked byweakening consumer confidence, inconsistentworkflows and an increased incidence of down-trading. For our business, however, afocus on customers, cost and cash helped
capitalize on this situation and reinvent theimage, commitment and loyalty for AkzoNobel’s Automotive Coating brands inthe market.
A focus on improving customer economicsthrough process and efficiency initiativeshelped the business gain market share to deliver a 20% increase in sales volumes, while a focus on cash provided the business with insulation against the liquidity pressures commonplace in the market, particularly post the floods in Q3.
Apart from the above-mentioned financialachievements, the business also made notablestrides in getting Pakistan recognized as aplayer in the CV export markets – providingextensive technical support and color solutionsto Pakistan’s first export bus project and therefurbishment of Vespa Scooters for export to the Italian market. Product We launched the Sikkens Automotive Coatingsportfolio in Pakistan at the end of 2008, supported extensively by value added services aimed at improving downstream bodyshop processes and profitability.
Collaborative programs with various OEMpartners, coupled with extensive technicalsupport prompting switchover fromestablished brands, saw Sikkens gainingacceptance and market share at more than75% of the organized vehicle repair operations across Pakistan.
Post the successful launch of Sikkens, weintroduced DynaCoat in 2010. Speciallydeveloped for the mid market in car repair,DynaCoat offers a complete range ofquality refinish solutions aimed at the market with lower levels of technological advancement.
DynaCoat is based on the mixing machineconcept that allows bodyshops and retailers to accurately deliver any local and internationalcolor – be it solid, metallic or pearl finish, while maintaining a low complexity of stock. The DynaCoat product assortment is supplemented by professional color documentation and tinting formula’s especially developed for the mid market in car repair.
Customer Engagement The thrust of our efforts is to improvebodyshop profitability by developingcustomized service programs for bodyshopowners. We have developed differentprograms for different customer categories:
Paints Automotive &Aerospace Coatings
Even after 10 years with the company, I relive the reasons I joined ICI in the first place; it's one of the few companies where you can be part of a team dedicated to redrafting the fundamentals of a business by investing resources in the downstream industry instead of only investing in thebrand.Syed Imran QutabMarketing Manager
One of the best things
about my job is that I manage change - helping to bridge the gap between
the customer and my team. Each day is therefore a new challenge,
prompting me to explore and expand the boundaries of my own potential.Aneka Fahima SufiAssistant Manager Marketing Services

OEM: For our OEM customers, we focusedon process development and helped themupgrade the service levels of their after-salesservice programs. Toyota: For Toyota we developed technicaltraining programs aimed at improving bodyshop profitability
Honda: At Honda we conducted week-longon-the-job training sessions at each dealership
Suzuki: With Suzuki we carried out regionaltraining for service managers and paint shopmanagers. This training focused on paint andcolor matching
Bodyshops: For bodyshops the targetwas to improve cost and profitability. Aftercomprehensive analysis of their overallfunctioning, we suggested improvements aswell as providing tools to assist bodyshops tobenchmark and enhance their performanceand profitability.
Painters: The most significant issue in thelocal market is that painters have little orno formal training. Most painters enter theprofession as apprentices and the trade ispassed from master to student, resulting in alack of technical knowledge and standardizedpractices.
To address this concern, we initiated a pilotprogram with one of our OEM customers,Indus Motors, in collaboration with St Patrick’sTechnical School, offering a technical trainingdiploma. This program trains students onbody shop processes and paint techniques.The first batch to graduate was provided a6 month internship with these dealerships.We developed and executed the program inentirety from developing syllabi and manuals toproviding trainers. Challenges Within the vehicle repair industry, the penetration of the unorganized market, a segment with the largest market share, remains the biggest challenge.
As high competition and profitability of operations remains a common issue across this segment, players within this segment are focused on finding the lowest prices for paints with little concern for quality, actual costs of repair, process efficiency or waste.
An over-whelming need exists to help this sector transition from “price-shopping” and reinforce a culture focused on cost reduction based on technological advancement, quality consciousness and process optimization.
The business has taken on this challenge with the launch of its mid-market training programs, a balanced mix of technical as well as commercial modules, targeting the improvement of awareness and education across a wide cross section of stake-holders in this segment.
Future outlook In addition to exploring opportunities to further expand our product and customer portfolio, the business plans to continue focusing on improving the overall profitability of its customers. Future plans include the launching of formalized services packages, transcending the bodyshop, to aid customers in areas of sales development, process development, material management, sustainability, financial optimization and marketing effectiveness.
Further, progress to end-user development programs shall also be made, with the expansion of the Painter Vocational Training program from its pilot stage to larger programs in Karachi, Islamabad and Lahore.
The Automotive team during the color-matching process Our automotive coatings being applied toa vehicle
While 2010 delivered a lot of excitement through the opportunity to manage and exceed targets, 2011 promises an even greater
thrill to excel, with stretched responsibilities and targets.
Shaukat AliRegional Sales Manager
A Vehicle Repair 76 mid marketB Vehicle Repair 23 PremiumC Commercial Vehicle 1
ICI Pakistan Limited Annual Report 2010 | Paints | 51


On the surfaceWhen you look at a new car, one of the first things you notice is the finish. On any vehicle, the coating is the most visible part of the product, and its durability and aesthetic appeal are of great importance. World class car manufacturers including our cus-tomers Pak Suzuki Motor Company and Indus Motor Company, have stringent quality requirements, and for many years have mainly used Japan-based paint brands.
To develop our business in this market, our R&D team worked hard to develop new coatings of high quality and durability, and after successfully completing the testing phase, we were able to offer our customers a high quality coating solution that is made in Pakistan, with benefits comparable to any world class products.
This achievement was further built upon by our Sales Team, which managed to make breakthroughs into the Japanese passenger vehicle segment. By offering added benefits to the client such as assured availability of supplies and technical services, we improved our value proposition.
Currently over 70 vehicles from Pak Suzuki Motor Company coated with our locally-developed white top coat have been rolled out in the market for feedback and evaluation purposes. More than 150 vehicles have been coated with our topcoats at Indus Motor Company and additionally we have secured an order for plastic white topcoat. These significant developments will provide us ground to further expand our share in the top coats segment at both IMC and PSMC, while making our business more sustainable.

Market OverviewWe operate in a diversified market and our vast product range provides solutions for passenger cars, motorcycles, commercial vehicles and tractors. We also offer products in the appliances and the projects segment.
Our customers are major automotive manufacturers; Pak Suzuki Motor Company (PSMC) and Indus Motor Company (IMC) in the passenger car segment, Hino and Nissan in the commercial vehicle segment, AHL, Dawood Yamaha and Suzuki in our motorcycle portfolio, and Millat and Al Ghazi in the tractor segment. Our relationship with some of these customers extends beyond two decades.
We also cater to major government and private projects in the country, such as expansion of the Engro plant, Benazir International Airport, tank lining at Pakistan Refinery, road line markings for the Lahore-Islamabad Motorway and many others.
Customer FocusAtlas Honda Customer Service ImprovementSharing our best practices benefits our customers, and so in 2010, we provided training to the line staff (mostly comprising of painters) at Atlas Honda. This not only created a competitive edge, but also taught our customers the efficient use of painting techniques and equipments as well as health, safety and environmental awareness.
Millat Tractors Service level improvements In recent years numerous initiatives have been undertaken to address the changing requirements of Millat Tractors Limited (MTL), a key customer for many years. To improve things further, this year we took the initiative of providing more in-depth customer support. A full-time dedicated resource was deployed at the MTL production line to carry out pre-treatment and paint line testing daily, and to ensure activities were efficiently managed. A laboratory was also set up at the site where solutions are prepared at any time. MTL now has on-line technical service readily available to attend to any issue that arises.
Along with these efforts, line audits and on job trainings for paint line staff are also conducted.
Measuring customer satisfactionKeeping our customers engaged and satisfied is one of the mainstays of our business. To measure how successfully we meet their needs, we held two customer satisfaction surveys. Results showed that our service levels are improving, having increased from 79 % in February to 81% in October. We strive to continue to enhance our service levels for the benefit of our customer.
Business DevelopmentHyderabad Motorcycle Market Motorcycles are a primary means of transport in the rural areas of Pakistan, and this segment has significant volume. It is also a challenging environment as Hyderabad’s huge motorcycle market has many manufacturers operating in it, both in the high and low-tier segments. Our focus has been high in this segment, and we have begun actively servicing the needs of this market with leading players like DS Motors, one of the largest motorcycle and three-wheeler manufacturers in Hyderabad, preferring to use our products and services.
PaintsIndustrial
Coming to work each day knowing that there's a world of opportunities just waiting to be seized, and working with our teams to capitalize on these in better, more sustainable ways is the exciting part of my job! Mohsin R. NaqviMarketing Manager

This unprecedented success allowed us to establish ourselves in place of previous brands at DS Motors in particular and in the motorcycle segment in Hyderabad at large, over the past few years. We intend to continue our efforts to secure other Chinese manufacturers in this division and become the leading suppliers in this target market.
International brand launched We successfully closed our first sale of AkzoNobel’s ‘International’ brand in the Marine Coatings segment. The first sale was made to the Karachi Shipyard & Engineering Works to coat Pakistan Navy’s Special Utility Tanker Ships. These include highly specialized paints such as the Intersmooth range, which is a high performance, Tributyltin (TBT) free, self polishing copolymer (SPC) antifouling system with patented Copper Acrylate technology as well as the Intershield range which is a light colored, abrasion resistant, aluminum pure epoxy coating giving excellent long term anticorrosive protection and low temperature application capability.
Breaking into the OEM Market Focused efforts by our R&D and commercial teams have led to the first order for the line run for locally produced white top coats at Pakistan Suzuki (PSMC). More than 70 vehicles have been coated with our white top coat and have been rolled out into the market
for evaluation and feedback. Our white top coat for plastic parts was also approved for application on more than 100 vehicles at Indus Motor Corporation for their leading brand, Corolla.
AkzoNobel’s Interseal used at Pakistan Refinery Limited Pakistan Refinery Limited (PRL) is now the first refinery in Pakistan to be using AkzoNobel’s surface Tolerant Epoxy Interseal 670HS. Interseal is a superior coating solution which will be applied in highly flammable zones and will significantly increase time between maintenance activities.
New automotive line uses Nihon Parkerizing Master Motors Corporation, a Chinese truck manufacturer, was in the process of acquiring Mitsubishi licensing in Pakistan and required pre-treatment metal sheets of international standards. Seeing this as an opportunity for business development we succeeded in getting them to use Nihon Parkerizing technology for their pretreatment, not only for their upcoming Japanese brand but also for their Chinese brand.
Ceilcote This year we closed our first ever sale of AkzoNobel’s Ceilcote Flakeline coatings in Pakistan. These highly specialized coatings were sold to Lotte Pakistan for their chemical storage tanks. Ceilcote Flakeline is a flake filled novolac vinyl ester coating
which exhibits excellent resistance to both aliphatic and aromatic organic solvents and to concentrated organic and inorganic acids. It offers outstanding chemical resistance with quick turnaround for service and also high temperature resistance. Ceilcote is geared towards clients that are looking for longevity in corrosion protection or are storing extremely corrosive materials.
Challenges While we continued our focus on exploring new markets and customizing solutions for our existing base, the year 2010 was challenging. Passenger cars and tractors performed well, however in the second half of the year tractor and motorcycle sales were affected because of the floods. A general economic slowdown was experienced with fewer new projects than before.
Future outlook We aim to continue our focus on providing new and innovative solutions and introducing the portfolio AkzoNobel offers. We plan to explore packaging coatings after a successful trial program in 2010. It is expected that this business will add to our organic growth outlook in 2011.
The Industrial Team with OEM manufacturers Indus Motor Company
From leftSajjad A. LodhiSalman AhmedMohsin R. NaqviMuhammed IqbalAsgher SherazSamiullah QureshiShahid IslamAbdul Rehman Aleem
ICI Pakistan Limited Annual Report 2010 | Paints | 55

Going green In a world of limited resources, every little bit counts. We make ourselves more sustainable when we are able to achieve more by consuming less, and this is exactly what we have accomplished with Product Salvage. The concept of Product Salvage developed when, as part of our continued sustainability focus we decided in 2008, to try and reduce our Off Specification Output (OSO). After extensive technical and commercial work, it was agreed that the most sustainable way to do so was to recycle OSO into our primary product, Polyester Fiber. While the development of this product was successful, we had struggled to establish a sustainable customer base for it. In 2010 therefore, we re-evaluated our strategy to make the venture more sustainable and profitable. We did this by reducing the cost of production (by increasing the ratio of OSO used), and by creating a value proposition for our customers.
The product was then widely introduced in the market and trials were conducted at over 35 customer sites. By the end of Q3 we were able to sell and achieve the product potential.
Product Salvage helped deliver significant benefits, both to our business and to our customers in the form of improved raw material efficiency at our plant as well as improved profitability for us and our customers. This initiative also made it easier for us to build stocks at the time of shutdown enabling effective inventory management for shutdown time.
Today, with its improved cost and large customer base, Product Salvage has become a sustainable variant in the Terylene line that will continue to support our business and serve customers.


Market OverviewPTA and MEG are derivates of crude oil and in 2010, reached historical high price levels on the back of strong demand and surging oil and feedstock costs. Accordingly the price of PSF rose regionally and locally, further bolstered by healthy downstream demand, especially in China. Poor cotton crops in China and Pakistan and high demand also drove cotton prices to all time highs making PSF highly attractive in comparison and fuellingdemand further.
Hystorically, strong domestic competition and thin margins caused domestic manufacturers including ICI Pakistan Limited to focus on efficiency improvement and cost reduction initiatives resulting in an industry which is highly efficient compared to global benchmarks.
Despite challenging environmental and economic situations, market conditions have been strong and there has been a growth in the industry.
In the past, there has also been a rationalization of the less efficient spinning industry. A key positive aspect of this was that less efficient units closed down with only medium to large-scale, energy-efficient, robust spinning mills remaing operational. This encourages a more disciplined and professional approach in the industry's future operation.
Polyester
The Polyester Staple Fiber ChainThe PSF industry in Pakistan is the fourth largest in Asia, (representing an investment of USD 500 million plus in Pakistan), and forms the backbone of the domestic textile industry, which in turn accounts for 60% of total exports. PSF is sold to the spinning industry where it is spun into yarn, which is then woven into fabric used to manufacture goods such as clothing, and home textile products. PSF is a key value adder as more than 50% of PSF consumed locally is eventually exported in one form or the other. The two major raw materials in PSF production are Pure Terephathalic Acid (PTA) and Mono-Ethylene Glycol (MEG).
My company is a great place to work, create and innovate, and makes me feel more fulfilled, creative and productive in my job.
Faisal AkhtarBusiness Manager
The best part of my job is the excitement of applying and developing my skills to do something new and challenging every day, with the freedom of doing it my own way.
Shamyl UppalE&I Support Manager
58 | Polyester | ICI Pakistan Limited Annual Report 2010

The people I work with support and encourage my personal and professional
development, and my ideas are valued, which is
very motivating.Amal PirachaCommercial Trainee Officer
OSO - Off Specification Output product A picnic with the special children visiting our Polyester site
The Continuous Process batch line Lorem Ipsum Etue Enisit Faciliquis Ullandio.
Business PerformanceMarket conditions for the textile industry held strong throughout most of the year despite the flood crisis, energy shortages and the recent rise in fiber and feedstock costs. Blend economics has continued to favor PSF largely because of the gap between cotton and polyester prices caused by a cotton supply shortage. Consequently, the business achieved its highest ever sales and sold an impressive 129,737 MT of PSF which was 6,356 MT more than sales in 2009.
Business DevelopmentProduct SalvageWe successfully recycled our Off Specification Output product (OSO) into a viable, profitable product. Dubbed Product Salvage, this innovation has resulted in improved raw material efficiencies and greater profitability for both our business and our customers.
Extra Long Fiber – Enhanced productivityRecently, increasing production costs, lower margins and increasing competitiveness have all compelled spinning mills to look for ways to become more efficient and cost effective in a sustainable way.
Fiber cut-length was an area we decided to explore. Traditionally fiber lengths ranging from 32mm to 51mm have been used in the spinning industry, although the general rule is that the longer the cut-length of the fiber, the higher its productivity. However, technical difficulties at the mills limit the length to 51mm.
Development work by our technical services has resulted in the removal of technical difficulties at mills and hence spinning mills are expected to increase their productivity by 12% with the use of this fiber. We hope to also enhance our fiber sales on a sustainable basis, thanks to this innovative new product.
Challenges High inflation and the overall depressed economic situation coupled with energy crisis in the country were our main challenges. Due to the Co-Gen project commissioned in 2008, the business was able to partly offset difficulties created due to energy and power shortages. However, our customers were greatly affected by lack of power and gas availability affecting continuity of their operations. Overall the cost of doing business in Pakistan escalated.
Future outlookGoing forward, feedstock prices are forecast to be firm due to tightness in PTA and MEG supplies and strong downstream demand. Polyester demand in Asia is showing no signs of stagnation and monetary measures in China are expected to restrict speculation in an attempt to reduce price volatility.
What is worth seeing is the consumer's ability to pay the high prices of value-added fabrics. Domestic market conditions are expected to remain healthy and prices to stay stable to firm. In addition, international and domestic cotton prices are anticipated to remain at high levels due to production estimates being lower than previously forecasted and uncertainty regarding exports of Indian Cotton.
Polyester bales in the warehouse


Decades of Development The bottom line is important to us, but so is the bigger picture. We may be the country’s largest producers of Soda Ash, and this is an achievement we are certainly proud of. However, our Soda Ash business is about a lot more than just our annual production capacity of 350,000 tons.
Our business started out with a production capacity of 18,000 tons per annum in 1944, at a time when Pakistan was yet to come into existence. Today we continue to be the market leaders for this key ingredient and just as importantly, we are a lifeline of sorts for the remote rural community of Khewra where our operations are based.Over the decades while we built our plant capacity to a world class level based on the most modern equipment, we also continuously worked for the betterment of our community. We did this initially by providing employment to a large number of residents of the impoverished localities of Khewra and Pind Dadan Khan, helping to raise the living standards of the community. In addition, we run various community welfare and development initiatives. These initiatives in the health, education and environment sectors extend from Khewra and Pind Dadan Khan, to the adjoining areas. Some of our company’s major community and sustainability initiatives over the decades are based here.
Khewra today is vastly different from the barren, sleepy small town nestled amongst the salt range in the 1940’s when we first started operations. It has flourished in to a developed center with economic activity and improved lifestyle for its inhabitants. Generations have progressed and gone on to change their lives for the better. We have firm belief that true development for any business is only possible when all those associated with it develop alongside.

Business OverviewThe soda ash market in Pakistan continues to evolve, and we know that our decades of experience in the Soda Ash Business are an asset in the face of changing market dynamics. Some of our key assets are the long-term relationships with our customers, and in line with our value ‘Focusing on our customer’s future first’, we are proud to provide customer-centric solutions, by delivering consistently high quality products on time whenever the customer needs them.
We currently manufacture two different varieties of Soda Ash and food grade Refined Sodium Bicarbonate which is a derivative of Soda Ash.
Light Soda Ash: Used as a raw material in detergents, sodium silicate, soap, paper, chemicals and textile industriesDense Soda Ash: Used mainly as a raw material in the glass and sodium silicate industriesRefined Sodium Bicarbonate: Used as baking soda, and also as an ingredient in several industries including poultry/cattle feed, leather tanning and the textile industry
To sum up, soda ash remains a main component in a wide range of end products, including glass (both for construction and domestic purposes), paper, textiles, soaps, detergents and household cleaners.
Contribution to economy We mainly utilize indigenous raw materials in our production and save hundreds of millions in foreign exchange for the country through import substitution of an extremely important industrial raw material. We are also recognized as one of the largest tax payers in the area and have contributed about Rs. 5.6 billion to the national exchequer during the last decade alone. We actively contribute to the uplift of the community where we operate by providing employment to a large number of people directly or indirectly. Most of our employees are residents of this relatively impoverished and water starved rural area of Khewra and Pind Dadan Khan with very little alternate employment opportunities. Apart from benefiting directly through association with ICI Pakistan, the local community also benefits from the indirect effect on the local economy through an increasing number of contractors, transporters etc who have flourished through their association with our business.
Community DevelopmentOver the years, in addition to being a major source of employment and income for a significant number of residents, we have run several long-standing community welfare and development initiatives to benefit the people.
EducationWinnington School The Winnington School is located within our plant premises and provides quality education to our employees' children as well as to children from the local community. We also extend support to local government run schools in the area with the aim of improving the facilities and quality of education. Along with this, we have been assisting Al-Beirooni College, one of the few institutions offering post-matriculate studies. We also have a scholarship program for
deserving children in the community where we provide financial assistance enabling them to pursue their academics. Health ProgramOutpatient care at Winnington Hospital Located within our Khewra premises, this hospital provides a free outpatient facility to the local community, which given the remote location of Khewra, is a highly valued service, much appreciated by the local community. Approximately 300 patients are catered to by our hospital every month. Our hospital team also provides a vital immunization service in accordance with government immunization programs in the area.
Monthly Eye Clinics Since 1991, we have conducted Surgical Eye Clinic programs in collaboration with the Layton Rehmatullah Benevolent Trust (LRBT) every month. Our longest-running healthcare initiative, this eye camp is open to the public, and includes OPD consultations as well as major and minor surgeries and refractions. These clinics are held over three days each month and 11,992 major and minor surgeries and 15,292 refractions have been carried out till year end 2010. In addition, 116,988 outpatients have also been treated. Patients operated on for cataract problems are implanted with free intra-ocular lenses (IOLs.)
Infrastructural Development & SupportDrinking Water for Khewra Like many other areas in the salt range, clean drinking water is an extremely scarce resource in and around Khewra as the underground water is brackish with high salinity due to the proximity of salt range. We try to help the local community by supplying this essential need free of charge. Eleven water supply points installed around our works provide approximately 23,000 gallons of clean drinking water to the residents of Khewra and the vicinity every day. In addition the Business is helping the local government to develop a long term water supply scheme
Soda Ash
At Soda Ash, we have customers from diverse industries from glass to paper, and from detergents
to textiles. I enjoy the challenges of providing customized solutions for each of them.
Aamir ChaudhryNational Sales Manager
We enter 2011 with exciting goals of building employee engagement and a high performance culture.Rizwan AziezHuman Resource Manager

for the area through financial assistance and administrative support.
Fire Fighting Services Our fire fighting department is the only resource of its kind in the entire area and our team of fire fighters is regularly called upon to provide assistance in cases of an emergency. During the last two years many incidents of major fires in the area were handled by our volunteers.
Khewra Railway Station We have undertaken the upkeep and maintenance of the Khewra Railway Station to demonstrate our commitment to the town and the people who use this facility. In addition we regularly undertake free maintenance and upkeep of the areas adjoining our works.
Skill Development (Vocational Training Center) Set up in 1989, our Ladies Vocational Center in Khewra imparts valuable self employment skills like knitting, stitching, embroidery etc to young girls from the community, and is managed by volunteers from the families of our Soda Ash team based in Khewra. Young girls from the community flock to the center enrolling the six month long course the center offers. Many of those trained have gone on to establish similar small centers which are running successfully.
Business DevelopmentAlthough the main focus of our Business remains the domestic market in Pakistan, during the last two years we have successfully
established our products in the export markets to earn foreign exchange for the country. The consistent acceptance of our product in international markets reaffirms our status as a reliable supplier of high quality soda ash. While the business has a number of opportunities available to increase volumes, exports had to be restricted recently due to the energy crisis in the country as gas curtailment impacts our production.
Business PerformanceGlobal Soda Ash demand witnessed some recovery in 2010 based on higher consumption in emerging markets China, India and Brazil during the first three quarters of the year. Demand during Q4 has however witnessed a slight decrease due to some decline in China, resultantly the full year market growth is expected to be about 4-5%.
Domestic Soda Ash market remained affected as downstream industrial activity was severely affected by the unprecedented gas curtailments in 2010 which persisted throughout the year, unlike previous years when curtailment was done during winter months only. The overall gas supply was at an average 25% lower than last year and caused major disruptions across all industries. The domestic market thus continues to remain in an over supply situation as domestic production capacity is significantly higher than domestic demand. This is further aggravated by dumping of soda ash into Pakistan, which is adversely affecting the domestic industry.
All major industrial consumers of soda ash, especially Glass, Silicate and Paper industries were affected, leading to a decline in their consumption of soda ash. However, the negative impact of lower consumption by industrial segment was somewhat mitigated by growth in the bazaar segment, which benefitted from a growth in the unorganized detergent sector.
Overall sales volumes during the year were higher by 12 percent compared to 2009, primarily on the back of exports to various countries in the region as the business successfully established itself in the export market. Business operations were severely impacted by gas supply curtailment to the works and the number of equivalent zero gas days increased from 60 in 2009 to 143 in 2010. Operating result was 13 percent lower than 2009 as the impact of higher revenue was dragged down by the higher usage and higher cost of expensive furnace oil during gas outages. On account of excessive gas outages, the business had to incur an additional cost of Rs 508.21 million on alternate fuels compared to 2009. The focus throughout the year was on optimizing of operational efficiencies and strict cost control in all areas.
Going forward gas curtailments are expected to increase and will keep the industrial activity depressed, impacting soda ash demand in the country. In addition liquidity issues being faced by industrial customers are becoming another area of concern. Dumping of Soda Ash into Pakistan from certain countries also remains a key concern and your Company has filed an anti-dumping application with the National Tariff Commission, seeking an investigation into this practice and initiation of investigation is expected in the near future.
We are also looking at developing a long term solution to mitigate the adverse affects of worsening gas outages in the coming years.
The newly repainted Khewra railway station Project Green at our Soda Ash siteStudents of the Winnington School during the Flood Relief Campaign
Winnington Hospital, where our free eye camps are held every month
I have had the unique privilege of working in three businesses in as many years.My current position in the Soda AshBusiness motivates the process engineerand the scientist in me to find new solutions to challengesevery day.Attika KhanAssistant ManagerDevelopment

A vital part of everyday life From mayonnaise to asphalt, soup to soap, and plastics to fabrics, our chemical ingredients go into the making of a spectrum of products that are trusted by customers every day.
At our Chemicals business, we take pride in the fact that we service practically every industry in the country! Our chemicals are essential in all kinds of manufacturing processes and products ranging from refrigerators and car seats to home insulation, adhesives, paint, crops, petrochemicals, agriculture, textile chemicals etc. We work with trusted technology partners across the globe and bring to Pakistan leading edge innovative solutions.
Our chemical ingredients touch lives in small but meaningful ways every day and this is what challenges us and prompts us to continuously innovate and convert new ideas into customer solutions.
We offer an assortment of chemicals to manufacturers across Pakistan that go into making products used by millions of people. We value the trust placed in us and are proud to be such a vital part of daily life.


Business StructureWe cater to almost every industry and are of key value in various industrial processes. The business has two segments:
General ChemicalsWe have a trading business which operates like a trading house, with products sold on both indent and Ex Stock basis. Our product range caters to many industries including paint, water treatment, food and beverage etc. We also supply polyurethanes, used primarily as insulation and also in flexible foam seating; rigid foam insulation panels; high performance adhesives and sealants etc. Our main customer segment is the appliances industry. We also sell solvents to oil, rubber adhesives and appliances industries.
Specialty ChemicalsThis segment manufactures a range of adhesives, primarily the white glue range Calabond, used in the wood and furniture Industry, and adhesives for PVC pipes.
We also manufacture a range of locally developed textile chemicals, mostly for the wet-processing stage of textile manufacturing. Moreover our product range includes crop emulsifiers which are used by the Pesticide manufacturers. Our product range is inclusive of Liquid Emulsifiers.
Market HighlightsThe 2010 floods were the biggest catastrophe faced by the country and majority of the markets suffered as a result. Along with this gas supply shortages affected the textile industry resulting in plant shutdowns.
Customer Focus • Over the years textile industry processes
have become more advanced requiring the use of superior quality chemicals. To meet customer needs we locally developed a new, complete range of textile chemical products to help them manufacture high quality textiles, and make a mark in the domestic as well as the international market.
• A new partnership was developed with Diversey, Inc which is a leading global provider of cleaning and hygiene solutions to the institutional marketplace.
• A testament of our focus on customers is that we won an award from Dawlance Group for high levels of trust and reliability.
Business Development Textile segment: To retain customer focus and remain competitive in the market, local innovation capability has been identified as an integral part of the segment’s success and reasonable resources and efforts are being put in to develop in-house technical capability to focus on new product development on a regular basis.
Chelates: Our new variants will aid in better soil management of arable land and help improve yield of crop. Commercialization of new chelated nutrients is expected during 2011 as part of our expansion of the Dissolvine range. Three new nutrients to be launched are Copper, Manganese and Iron, all of which are naturally deficient in Pakistani soil. Thus all the new variants will further aid in better soil management of arable land and help improve yield of the crop.
Polyurethane: A sustainable supply of Polyurethane is a key goal the business is expected to achieve through good customer relationships and effective supply chain management. Efforts are underway to develop new deals with suppliers for consistent raw material availability.
Major Highlights• Developed and commercialized five new textile chemicals which were developed locally and helped replace obsolete products in the market.
• Introduced chelated nutrients modified for local soil which helped improve the soil’s pH
• The business ventured into new territories such as Sri Lanka and Tanzania for exports.
Chemicals
I have enjoyed 22 long years with ICI because of its highly ethical value system and because of it's care for people, community and the environment. Currently, my business has implemented sustainability inititiatives such as energy conservation and the Effluent Treatment Recycling Project, showing a continuing commitmentto sustainabilityM Ahsan AnwarPlant HSE&S and Supply Chain Manager
I have spent an amazing time at ICI. Every new day is a challenge that brings new opportunities and the learning curve is exponential.Ali KamalMarketing Manager, General Chemicals
66 | Chemicals | ICI Pakistan Limited Annual Report 2010

• Developed new crop emulsifiers with better chemical properties resulting in effective bonding strength
Challenges The textile industry has suffered greatly throughout the year on the back of gas supply shortages and yarn pricing issues affecting both demand and supply. As a result, the textile industry has shrunk by about 30% over the year. Textile units have not received gas for over 100 days in the year which impacted the sales of textile chemicals.
Government policies in the coming year will determine a lot of our key decisions. These policies will be related to the handling of the energy situation of Pakistan, particularly the gas supply cutoffs for the industrial sector. Moreover the implementation of the textile policy 2014 would be an important factor in the development of the textile sector. The Industry during the year was affected greatly due to the lack of demand and increased Federal Excise duty on appliances.
The recent electricity and gas crisis, along with yarn pricing issues have crippled the textile industry at large and affected the off-take of ICI’s products. This coupled with our mature product range led to a Strategy Review for the segment.
Future outlook• 2011 is expected to be a year of recovery during which economic
indicators affected by floods are expected to improve.
• Majority of the markets are expected to grow only marginally on the back of slow recovery in demand.
• The energy crisis is expected to remain at the same level as this year, if not worse. However any improvement in gas supplies to the industry may result in an improved textile segment
We turned the tide in HR last year with fundamentally significant intitiatives which work around capability-building to bring people to the heart of the business. I'm
excited to see this strategy become a resounding success!
Shifa IbrahimHuman Resource Manager
Our product range includes crop emulsifiers
Our locally developed textile chemicals are widely used in the textile industry
The appliance industry is a key customer segment
ICI Pakistan Limited Annual Report 2010 | Chemicals | 67

Putting down roots As the saying goes, you reap what you sow. It stands to reason then, that if you want to grow healthy crops you have to start with the best quality seeds. Giving farmers improved access to good quality seeds is a critical requirement for sustainable agricultural growth and food security, which is one of the ultimate goals we strive to promote. We also want our business to be truly strong, which requires a degree of self-reliance. We are therefore also focusing on creating our own product range. This not only makes us more sustainable, but creates a host of benefits, both for our business and our customers.
In 2010 we began locally producing our open-pollinated seed varieties and our range now includes several varieties of vegetable seeds. In addition to increasing our own sustainability, this has added to the business’ profitability, and also had the important effect of increasing technical know-how among farmers and local vendors.
The effective use of these improved seeds can result in higher agricultural production and increase the net incomes of farming families, which in turn will have a positive impact on rural economies. We are confident that through our efforts, we are not only putting down sustainable roots for our business, but also for the agricultural community we serve.


Life Sciences
Market OverviewOur Pharmaceutical Business not only markets a strong portfolio of leading and innovative brands of prescription medicines from AstraZeneca, a leading multi-national healthcare company, but also markets its own brands. Moreover, we have recently expanded our antibiotic range with the launch of a number of products in one of the fastest growing segments in the market.
Business DevelopmentThe Pharmaceuticals segment proactively seeks sustainable partners, and one such partnership that came to fruition was Amybact. A new innovative probiotic specially designed for combating diarrhea in the pediatric population was sourced from Europe and launched in 2010. Two new contractual agreements were signed in 2010, one with a local manufacturer and one with a European company.
Business Performance ICI Pakistan, Pharmaceuticals Segment is ranked 23rd with retail sales value of Rs. 1.53 billion and a growth rate of 14.9% and four years CAGR of 15.6%. Out of thirteen AstraZeneca brands that ICI markets in Pakistan; nine are now ranked as number one in their respective segments. While twelve out of these thirteen brands are ranked in the top three. The segment is ranked number one in Cardiology and number 3 in Oncology.
Challenges • Hyper–competitive market• Increasing customer expectations and decreasing brand loyalty• Rampant unethical practices by competitors • High promotional spend by competitors • Strong regulatory environment; all prices fixed and controlled by government• No price increase by the Ministry of Health, intensifying pressure on margins
Future outlookICI Pharmaceuticals has always outperformed the market and with new launches in 2011 is expected to grow faster than the market.
Innovative new products that change the way diseases are treated are the most exciting thing about my job, and we made a major breakthrough in this area in 2010; one of our products will change the way diarrhoea is treated!
Aamir NaveedBusiness Manager
The fact that brands and products I manage bring hope and relief to cancer patients is what drives me to remain dedicated to my work.
Dr Irum Sajid Compliance Manager
& Product Manager Oncology
Pharmaceuticals
OncologyArimidexNolvadexZoladexCasodex
Anti-InfectivesMeronemICEFFortexoneCiprocide
CNSSeroquelZomig
Gastro-intestinalAmybactEtipro
AnthelminticKetress
List of our ProductsCardiovascularTenorminTenoretZestrilZestoreticInderalEtizemPrescard
AnalgesicsSynflexProxenDexifen
AnaestheticDiprivan (EDTA)
Oral Chelator-for ThalassemiaFerriprox
Anti-diabeticGlibetic

Animal Health
Working with a team determined to aggressively grow the business is the most motivating and exciting part ofmy job!
Matin AmjadMarketing Manager
Market OverviewAgriculture sector of Pakistan contributes about 21% to the national GDP and employs nearly 44% of labor force. With abundant natural resources in the shape of a large livestock population, Pakistan is the fourth largest global milk producer. However, the livestock market is still primarily unorganized and technology adoption is a challenge since the livestock population is scattered with average farm holding of one to six animals. The poultry sector is the second largest industry in Pakistan after textiles. Poultry is the largest consumer of grains, especially maize. Poultry meat contributes 19% of the total meat production in the country. A key feature of the industry is its rapid mechanization and introduction of integrated farming systems. Overall, for 2010, the organized animal healthcare market is estimated atRs. 8.5 billion.
Customer Focus'Focusing on our customers future first' is the driver behind our approach of serving farmers at grassroot level across the country. The animal health team is periodically trained on product technologies as well as on general good farm management practices. Our discussions with customers are, therefore, focused on finding the right 'business solutions' to improve 'farm economics', through use of innovative products from our wide range of products as well as adoption of good farm management practices.
Business DevelopmentIn 2010, a number of new products were launched to provide more options and solutions to our valued customers. New products launched during 2010, included Intervet/Schering-Plough Animal Health’s “Coccivac B” a vaccine for poultry coccidiosis disease; LNB International Feeds’ “Nascor” a broiler pre-starter feed to maximize farmer’s profitability through better feed efficiency; “Supervit” and “Broiler Premix” in poultry and “Cattle Top Dressing” in livestock as supplements.
From our “Own Brands” range new launches included “Vanda Pellet” a cattle concentrate feed to enhance homogenous intake and minimize nutritional wastage, “Disulf” an antibiotic, “VAD 3” a vitamins supplement and “Melonac” an NSAID. The Division also marketed DuPont’s world leading brands including “Virkon S”, “Biosolve Plus” and “Hyperox”, cleaning and disinfecting solutions for livestock and poultry farmers.
Business PerformanceOur Animal Health segment crossed theRs. 1 billion mark, with net sales of Rs. 1,040 million, registering a growth of 34% overlast year.
Challenges We witnessed one of the worst ever natural disasters in the country’s history with devastating floods impacting lives and
livelihoods across the country. Our rural population suffered the most and there was high incidence of distress sales of livestock. This coupled with rising inflation and slow economic growth due to both internal and external factors, created difficult business conditions as farmer’s ability to purchase products for their livestock declined. For the poultry sector, rising costs of production due to high energy costs and increasing grain prices made poultry farmers generally more cost conscious in terms of their purchasing of medicines and other required products.
Future outlookDespite the many challenges facing the livestock and poultry markets, this segment has robust plans to continue with the growth momentum through effective execution of well researched marketing plans for the existing portfolio of products and by continuing to add new products/technologies from world leading suppliers including Intervet/Schering-Plough Animal Health, Elanco Animal Health, DuPont and LNB International Feeds (a Cargill company).
Our Pharmaceuticals Team at the Amybact launch Animal Health team with livestock farmersOne of the many blood donation drives arranged by the Pharmceuticals Team

Market OverviewCurrently the estimated value of vegetable seeds in Pakistan is nearly Rs. 2.6 billion with Compound Annual Growth Rate (CAGR) of 13%. The supply of seed is dominated by imports from India which accounts for around 57%, while USA is the 2nd largest supplier with 12% share. The supply of seeds through imports and local production is dependent upon more than 600 companies. Informal supplies through farmers own grown local seeds share a significant portion of Wheat, Vegetables (Open Pollinated Varieties), Rice and Cotton seed supply.
Product RangeCurrently, our segment promotes the most diverse and widespread portfolio of vegetable seed products in the Pakistani market. Our product assortment covers both hybrid and open pollinated seeds. These include 51 varieties of seed covering 13 crops including Okra, Hot Pepper, Tomato, Egg Plant, Bottle Gourd, Ridge Gourd, Bitter Gourd, Sponge Gourd, Cucumber, Spinach, Peas, Coriander, and Cauliflower.
Customer FocusFarmer Training ProgramsWe aim to generate awareness amongst farmers about how integral seed quality is in improving farm economics. We focus our efforts on educating customers to maximize outcome from their limited landholding by enhancing their agronomic practices.
We train them on optimal use of inputs, crop protection, and post harvest handling of produce. In order to disseminate this knowledge, in 2010 our team organized approximately 55 farmers’ meetings across the country. In these meetings we engaged more than 1600 farmers for a shared learning experience.
Product TrialsWe create a strong “Reason to Believe” for our products by generating trials with opinion leading farmers. The immediate impact of desired results provides our customers with the confidence to convert onto our high yielding and genetically adaptable hybrid seed varieties. Similar trials are conducted at public sector research institutes to establish the impact of our products in benefiting farmers across the nation.
Our technical team actively engages growers and middlemen through farmer gatherings where we highlight the greater value proposition of produce that results from our seed. This is done by demonstrating that the produce our seeds generate commands a higher market value than that of conventional seed. This differentiation is based on the shape, size, color, and longer shelf life ofthe fruit.
Business DevelopmentWe benchmark our seed varieties against market leading brands. This research is conducted at a farm in Sahiwal and government research centers in Punjab, Sindh, and Khyber Pakhtoon Khawa, to evaluate crop performance in varied climatic conditions. Our technical team uses this research in assessing proper positioning of our own varieties in
appropriate segments. While at the same time, the product pipeline is augmented and more competitive varieties are brought to the market. Hence we help farmers in finding the most appropriate and climatically adaptable variety that maximizes outcome in terms of enhanced yields and profitability.
Local seed production of Okra and Pea seeds (OPV)Sustainability is critical for our long term success. In order to ensure our future business health, a pilot project for local production was initiated under technical assistance from Advanta, India. This initiative was aimed at generating long term business strength by providing high quality seeds and sharing best agronomic practices with local famers. The project is expected to save valuable foreign exchange and consolidate our margins. In addition, local seed production creates opportunities for farmers and the seed processing industry of Pakistan. In 2011, the segment has planned local production of Peas and Okra on approximately 250 acres of land across Punjab in order to fill the evident gap in the market for high quality open pollinated vegetable seeds.
New varieties introduced To meet longer term business objectives, vegetable seeds segment has engaged Pureline Seeds, a US based company. This company specializes in Peas and Beans. We have conducted initial trials for 5 Peas varieties at government and private farms. These trials have provided promising results in varied settings. Our aim is to generate options for farmers with new varieties of Pea seeds with resistance to tough climatic conditions and better profit margins due to early maturity.
Future Outlook• To be amongst the top 3 Vegetable Seed Companies in Pakistan.• Create a new customer segment focused on quality seed as a priority concern.• To be the leading supplier of quality open pollinated vegetable seed varieties in Pakistan.• To improve farm economics of low income agriculture sector
My time with the company has provided me the chance to perform to the best of my capabilities. Every day is a challenge to do even better, which is a thrill on its own!
Zia ur Rehman KhaliqueMaterials Manager
Vegetable Seeds
The exciting thing for me is that Vegetable Seeds is a new segment, and we are doing everything for the first time; every challenge is fresh and vital and we are keen to take on new projects.
Saboor AhmedManager Supply Chain & Vegetable Seeds

Market OverviewSeed industry is estimated at Rs 40bn where Open-Pollinated Variety (OPV) seed market is around Rs 36.7bn with 92% share and Hybrid seed market is reported at Rs 3.4bn with 8% share of total seed market. ICI is only present in the hybrid market segment along with few other major multinational companies. With increased level of awareness among farmers, share of hybrid seed market is gradually increasing. However, importance of OPV market cannot be overlooked, therefore Seeds segment is constantly striving to find suitable products that could be introduced in this segment of market.
Customer FocusWe take a keen interest in fulfilling customer needs and demands. In line with this we introduced small packs of corn products to effectively meet customer requirements. We also intend to introduce small packs of fodder products to cater to the needs of farmers with small land holdings. We provided free seeds drill plates to solve farmer’s problem of seed sowing in sunflower growing areas of Sindh.
Business DevelopmentWe are working to promote the concept of intercropping of sunflower and canola with sugarcane. We have coordinated with government departments and sugar industries to establish the concept and benefit farmers by increasing their income. We have also
been working on developing the concept of silage for its corn products in coordination with Nestle and Engro staff. New areas were developed in upper Sindh and Punjab for sunflower and corn.
Business Performance Our Seeds segment has shown good volume growth in all its products barring sunflower which was impacted by unfavorable conditions. Volume growth of 43% was recorded in corn, whereas volume growth of 10%, 110% and 100% was recorded in fodder, canola and MR Buster respectively. Segment also maintained strong GM/Sales ratio for 2010.
Challenges Sunflower market faces many challenges which are hampering its growth. Government focus towards wheat affects farm economics making sunflower an unviable crop for farmers. The trend towards early BT cotton is also proving unfavorable for sunflower. Low cost and quality imports of fodder are also a major challenge for our fodder range.
Future outlookWe have chalked out an aggressive growth strategy, where we will strengthen our position in the current market and diversify into other markets to focus on sustainable growth. We are entering into the huge OPV market by
introducing corn fodder and rice varieties which would be followed by other varieties. We are also entering into the lucrative micronutrients market by introducing products like zinc and humic acid; many other micronutrient products are also in the pipeline.
Even though markets were turbulent and environmental factors adverse, we took this as an opportunity to create business diversity in anypossible way.
Sajid MehmoodBusiness Development Manager
Vegetable Seeds Team members during a visit to Advanta India
Seeds Team members at Pacific Seeds in Australia
The floods in 2010 greatly impacted the agriculture sector resulting in a tough
business environment. My biggest challenge was to keep my
team's morale high and motivate them to excel.
Abdul WahabMarketing Manager
SeedsVegetable Seeds Team during a crop handling activity with the farmers
Catering to the sunflower market
ICI Pakistan Limited Annual Report 2010 | Life Sciences | 73

ICI Pakistan LimitedFinancial Statements
ICI Pakistan Limited Annual Report 2010 75


Auditors’ Report to the Members
We have audited the annexed unconsolidated balance sheet of ICI Pakistan Limited (“the Company”) as at 31 December 2010 and therelated unconsolidated profit and loss account, unconsolidated statement of comprehensive income, unconsolidated cash flow statementand unconsolidated statement of changes in equity together with the notes forming part thereof, for the year then ended and we statethat we have obtained all the information and explanations which, to the best of our knowledge and belief, were necessary for the purposesof our audit.
It is the responsibility of the Company's management to establish and maintain a system of internal control, and prepare and presentthe above said statements in conformity with the approved accounting standards and the requirements of the Companies Ordinance,1984. Our responsibility is to express an opinion on these statements based on our audit.
We conducted our audit in accordance with the auditing standards as applicable in Pakistan. These standards require that we plan andperform the audit to obtain reasonable assurance about whether the above said statements are free of any material misstatement. Anaudit includes examining, on a test basis, evidence supporting the amounts and disclosures in the above said statements. An audit alsoincludes assessing the accounting policies and significant estimates made by management, as well as, evaluating the overall presentationof the above said statements. We believe that our audit provides a reasonable basis for our opinion and, after due verification, we reportthat:
a) in our opinion, proper books of account have been kept by the Company as required by the Companies Ordinance, 1984;
b) in our opinion:
i) the balance sheet and profit and loss account together with the notes thereon have been drawn up in conformity with theCompanies Ordinance, 1984, and are in agreement with the books of account and are further in accordance with accountingpolicies consistently applied;
ii) the expenditure incurred during the year was for the purpose of the Company's business; and
iii) the business conducted, investments made and the expenditure incurred during the year were in accordance with theobjects of the Company;
c) in our opinion and to the best of our information and according to the explanations given to us, the unconsolidated balance sheet,unconsolidated profit and loss account, unconsolidated statement of comprehensive income, unconsolidated cash flow statementand unconsolidated statement of changes in equity together with the notes forming part thereof conform with approved accountingstandards as applicable in Pakistan, and, give the information required by the Companies Ordinance, 1984, in the manner sorequired and respectively give a true and fair view of the state of the Company's affairs as at 31 December 2010 and of the profit,its cash flows and changes in equity for the year then ended; and
d) in our opinion Zakat deductible at source under the Zakat and Ushr Ordinance, 1980 (XVIII of 1980), was deducted by the Companyand deposited in the Central Zakat Fund established under section 7 of that Ordinance.
Date: 16 February, 201118 February 2009 KPMG Taseer Hadi & Co.Karachi Chartered Accountants
Amir Jamil Abbasi
ICI Pakistan Limited Annual Report 2010 77

EQUITY AND LIABILITIES
Share Capital and Reserves
Authorised capital1,500,000,000 ordinary shares of Rs 10 each 15,000,000 15,000,000
Issued, subscribed and paid-up capital 3 1,388,023 1,388,023
Capital reserves 4 465,845 465,845
Unappropriated profit 12,694,225 11,628,928
Total Equity 14,548,093 13,482,796
Surplus on Revaluation of Property, Plant and Equipment 5 907,352 931,846
LIABILITIES
Non-Current Liabilities
Provisions for non-management staff gratuity and eligible retired employees' medical scheme 6 222,942 183,019
Deferred tax liability - net 7 870,248 1,025,098
1,093,190 1,208,117
Current Liabilities
Trade and other payables 8 5,482,037 5,799,898
Contingencies and Commitments 9
Total Equity and Liabilities 22,030,672 21,422,657
Balance SheetAs at December 31, 2010
Note 2010 2009
Amounts in Rs ’000
78 Annual Report 2010 ICI Pakistan Limited

ASSETS
Non-Current Assets
Property, plant and equipment 10 8,895,091 9,225,110
Intangible assets 11 180,102 -
9,075,193 9,225,110
Long-term investments 12 712,500 712,500
Long-term loans 13 324,264 330,801
Long-term deposits and prepayments 14 40,458 29,078
1,077,222 1,072,379
10,152,415 10,297,489
Current Assets
Stores and spares 15 450,596 496,401
Stock-in-trade 16 3,786,345 3,244,525
Trade debts 17 792,867 919,463
Loans and advances 18 590,722 406,739
Trade deposits and short-term prepayments 19 443,674 452,438
Other receivables 20 606,280 677,111
Taxation recoverable 545,951 460,240
Cash and bank balances 21 4,661,822 4,468,251
11,878,257 11,125,168
Total Assets 22,030,672 21,422,657
The annexed notes 1 to 46 form an integral part of these financial statements.
Note 2010 2009
Amounts in Rs ’000
M J Jaffer Waqar A Malik Feroz RizviChairman / Director Chief Executive Chief Financial Officer
ICI Pakistan Limited Annual Report 2010 79

Turnover 24 39,532,506 32,399,181
Sales tax, excise duty, commission and discounts 23 (4,402,526) (3,969,284)
Net sales, commission and toll income 35,129,980 28,429,897
Cost of sales 24 (28,443,690) (22,754,005)
Gross profit 6,686,290 5,675,892
Selling and distribution expenses 26 (1,674,719) (1,470,174)
Administration and general expenses 27 (1,299,005) (1,178,064)
Operating result 3,712,566 3,027,654
Financial charges 28 (163,880) (167,541)
Other operating charges 29 (303,426) (247,590)
(467,306) (415,131)
Other operating income 30 486,256 459,983
Profit before taxation 3,731,516 3,072,506
Taxation 31 (1,302,690) (1,027,768)
Profit after taxation 2,428,826 2,044,738
(Rupees) (Rupees)
Earnings per share - Basic and diluted 32 17.50 14.73
The annexed notes 1 to 46 form an integral part of these financial statements.
Profit and Loss AccountFor the year ended December 31, 2010
Note 2010 2009
Amounts in Rs ’000
M J Jaffer Waqar A Malik Feroz RizviChairman / Director Chief Executive Chief Financial Officer
80 Annual Report 2010 ICI Pakistan Limited

Profit for the year 2,428,826 2,044,738
Other comprehensive income - -
Total Comprehensive income for the year 2,428,826 2,044,738
The annexed notes 1 to 46 form an integral part of these financial statements.
Statement of Comprehensive IncomeFor the year ended December 31, 2010
2010 2009
Amounts in Rs ’000
M J Jaffer Waqar A Malik Feroz RizviChairman / Director Chief Executive Chief Financial Officer
ICI Pakistan Limited Annual Report 2010 81

Cash Flows from Operating Activities
Profit before taxation 3,731,516 3,072,506
Adjustments for:
Depreciation and amortisation 943,811 870,688
Gain on disposal of property, plant and equipment (10,211) (5,293)
Provision for non-management staff gratuity and eligible retired employees' medical scheme 58,991 56,008
Mark-up on bank deposits and loan to subsidiary (351,957) (228,624)
Interest / mark-up expense 101,888 88,118
4,474,038 3,853,403
Movement in:
Working capital (730,786) 1,083,497
Long-term loans (15,685) (196)
Long-term deposits and prepayments (11,380) 1,606
Cash generated from operations 3,716,187 4,938,310
Payments for :
Non-management staff gratuity and eligible retired employees' medical scheme (19,068) (15,239)
Taxation (1,543,251) (513,680)
Interest / mark-up (101,888) (97,097)
Profit / mark-up received on bank deposits 282,448 163,937
Net cash generated from operating activities 2,334,428 4,476,231
Cash Flows from Investing Activities
Payments for capital expenditure (854,342) (826,402)
Proceeds from disposal of property, plant and equipment 33,033 17,148
Profit / mark-up received on loan to subsidiary 68,479 58,211
Loan / Standby finance facility to subsidiary company - net - (187,000)
Net cash used in investing activities (752,830) (938,043)
Cash Flow StatementFor the year ended December 31, 2010
2010 2009
Amounts in Rs ’000
82 Annual Report 2010 ICI Pakistan Limited

Cash Flows from Financing Activities
Dividend paid (1,388,027) (1,041,018)
Net cash used in financing activities (1,388,027) (1,041,018)
Net increase in cash and cash equivalents 193,571 2,497,170
Cash and cash equivalents at January 1 4,468,251 1,971,081
Cash and cash equivalents at December 31 - note 21 4,661,822 4,468,251
Movement in Working Capital
(Increase) / Decrease in current assets
Stores and spares 45,805 42,139
Stock-in-trade (541,820) (292,569)
Trade debts 126,596 (112,851)
Loans and advances (161,761) (26,485)
Trade deposits and short-term prepayments 8,764 (47,776)
Other receivables 71,861 78,753
(450,555) (358,789)
(Decrease) / Increase in current liability
Trade and other payables (280,231) 1,442,286
(730,786) 1,083,497
The annexed notes 1 to 46 form an integral part of these financial statements.
2010 2009
Amounts in Rs ’000
M J Jaffer Waqar A Malik Feroz RizviChairman / Director Chief Executive Chief Financial Officer
ICI Pakistan Limited Annual Report 2010 83

Balance as on January 1, 2009 1,388,023 465,845 10,594,258 12,448,126
Final dividend for the year ended December 31, 2008 @ Rs 4.00 per share - - (555,209) (555,209)
Interim dividend for the year 2009 @ Rs 3.50 per share - - (485,808) (485,808)
Transactions with owners, recorded directly in equity - - (1,041,017) (1,041,017)
Total comprehensive income for the year ended December 31, 2009 - - 2,044,738 2,044,738
Transfer from surplus on revaluation of property, plant and equipment incremental depreciation for the period - net of deferred tax - note 5 - - 30,949 30,949
- - 2,075,687 2,075,687
Balance as on December 31, 2009 1,388,023 465,845 11,628,928 13,482,796
Final dividend for the year ended December 31, 2009 @ Rs 4.50 per share - - (624,610) (624,610)
Interim dividend for the year 2010 @ Rs 5.50 per share - - (763,413) (763,413)
Transactions with owners, recorded directly in equity - - (1,388,023) (1,388,023)
Total comprehensive income for the year ended December 31, 2010 - - 2,428,826 2,428,826
Transfer from surplus on revaluation of property, plant and equipment incremental depreciation for the period - net of deferred tax - note 5 - - 24,494 24,494
- - 2,453,320 2,453,320
Balance as on December 31, 2010 1,388,023 465,845 12,694,225 14,548,093
The annexed notes 1 to 46 form an integral part of these financial statements.
Statement of Changes in EquityFor the year ended December 31, 2010
Issued, Capital Unappropriated Total subscribed reserves profitand paid-up
capital
Amounts in Rs ’000
M J Jaffer Waqar A Malik Feroz RizviChairman / Director Chief Executive Chief Financial Officer
84 Annual Report 2010 ICI Pakistan Limited

1. Status and Nature of Business
ICI Pakistan Limited (“the Company”) is incorporated in Pakistan and is listed on the Karachi, Lahore and Islamabad StockExchanges. The Company is engaged in the manufacture of polyester staple fibre, POY chips, soda ash, paints, specialty chemicals,sodium bicarbonate, polyurethanes; marketing of seeds, toll manufactured and imported pharmaceuticals and animal healthproducts; and merchanting of general chemicals. It also acts as an indenting agent and toll manufacturer. The Company's registeredoffice is situated at 5 West Wharf, Karachi.
2. Summary of Significant Accounting Policies
The accounting policies adopted are the same as those which were applied for the previous financial year.
2.1 Statement of compliance
These financial statements have been prepared in accordance with approved accounting standards as applicable in Pakistan.Approved accounting standards comprise of such International Financial Reporting Standards (IFRS) issued by the InternationalAccounting Standards Board as are notified under the Companies Ordinance, 1984, provisions of and directives issued underthe Companies Ordinance, 1984. In case requirements differ, the provisions of, or directives issued under the Companies Ordinance,1984 shall prevail.
2.2 Basis of preparation
These financial statements have been prepared under the historical cost convention, except that certain property, plant andequipment have been included at revalued amounts and certain exchange elements referred to in note 2.8 have been recognisedin the cost of the relevant property, plant & equipment.
The preparation of financial statements in conformity with approved accounting standards requires management to make estimates,assumptions and use judgments that affect the application of policies and reported amounts of assets and liabilities and incomeand expenses. Estimates, assumptions and judgments are continually evaluated and are based on historical experience and otherfactors, including reasonable expectations of future events. Revisions to accounting estimates are recognised prospectivelycommencing from the period of revision.
Judgments and estimates made by the management that may have a significant risk of material adjustments to the financialstatements in subsequent years are discussed in note 42.
2.3 Staff retirement benefits
The Company's retirement benefit plans comprise of provident funds, pensions, gratuity schemes and a medical scheme for eligibleretired employees.
Defined benefit plans
The Company operates a funded pension scheme and a funded gratuity scheme for management staff. The pension and gratuityschemes are salary schemes providing pension and lump sums, respectively. Pension and gratuity schemes for management staffare invested through two approved trust funds. The Company also operates gratuity scheme for non-management staff and thepensioners' medical scheme which are unfunded. The pension and gratuity plans are final salary plans. The pensioner's medicalplan reimburses actual medical expenses to pensioners as per entitlement. The Company recognises expense in accordance withIAS 19 “Employee Benefits”.
An actuarial valuation of all defined benefit schemes is conducted every year. The valuation uses the Projected Unit Credit method.Actuarial gains and losses are amortised over the expected average remaining working lives of employees as allowed under therelevant provision of IAS 19 “Employee Benefits”.
Past-service costs are recognised immediately in profit and loss account, unless the changes to the plan are conditional on theemployees remaining in service for a specified period of time (the vesting period). In this case, the past-service costs are amortisedon a straight-line basis over the vesting period.
Defined contribution plans
The Company operates two registered contributory provident funds for its entire staff and a registered defined contributionsuperannuation fund for its management staff, who have either opted for this fund by July 31, 2004 or have joined the Companyafter April 30, 2004. In addition to this the Company also provides group insurance to all its employees.
Notes to the Financial StatementsFor the year ended December 31, 2010
ICI Pakistan Limited Annual Report 2010 85

2.4 Provisions
A provision is recognised in the balance sheet when the Company has a legal or constructive obligation as a result of a past event,and it is probable that an outflow of economic benefits will be required to settle the obligation and a reliable estimate can be madeof the amount of obligation. The amount recognised as a provision reflects the best estimate of the expenditure required to settlethe present obligation at the end of the reporting period.
2.5 Trade and other payables
Trade and other payables are recognised initially at fair value plus directly attributable cost, if any.
2.6 Dividend
Dividend distribution to the Company's shareholders is recognised as a liability in the period in which the dividends are approved.
2.7 Taxation
Income tax expense comprises current and deferred tax. Income tax expense is recognised in the profit and loss account, exceptto the extent that it relates to items recognised directly in other comprehensive income or below equity, in which case it is recognisedin other comprehensive income or below equity respectively.
Current
Provision for current taxation is based on taxable income at the enacted or substantively enacted rates of taxation after taking intoaccount available tax credits and rebates, if any. The charge for current tax includes adjustments to charge for prior years, if any.
Deferred
Deferred tax is recognised using balance sheet method, providing for temporary differences between the carrying amounts ofassets and liabilities for financial reporting purposes and the amounts used for taxation purposes. The amount of deferred taxprovided is based on the expected manner of realisation or settlement of the carrying amount of assets and liabilities, using theenacted or substantively enacted rates of taxation.
The Company recognises a deferred tax asset to the extent that it is probable that taxable profits for the foreseeable future willbe available against which the asset can be utilised. Deferred tax assets are reduced to the extent that it is no longer probablethat the related tax benefit will be realised. Further, the Company recognises deferred tax asset / liability on deficit / surplus onrevaluation of property, plant and equipment which is adjusted against the related deficit / surplus.
2.8 Property, plant and equipment and depreciation
Property, plant and equipment (except freehold land, leasehold land and plant & machinery) are stated at cost less accumulateddepreciation and impairment losses, if any. Freehold land, leasehold land and plant & machinery are stated at revalued amountsless accumulated depreciation. Capital work-in-progress is stated at cost. Cost of certain property, plant and equipment compriseshistorical cost, exchange differences recognised in accordance with the previous Fourth Schedule to the Ordinance, cost ofexchange risk cover in respect of foreign currency loans obtained for the acquisition of property, plant and equipment upto thecommencement of commercial production and the cost of borrowings during construction period in respect of loans taken forspecific projects.
Depreciation charge is based on the straight-line method whereby the cost or revalued amount of an asset is written off to profitand loss account over its estimated useful life after taking into account the residual value, if material. The cost of leasehold landis amortised in equal installments over the lease period. Depreciation on additions is charged from the month in which the assetis available for use and on disposals up to the month of disposal.
The residual value, depreciation method and the useful lives of each part of property, plant and equipment that is significant inrelation to the total cost of the asset are reviewed, and adjusted if appropriate, at each balance sheet date.
Surplus on revaluation of property, plant and equipment is credited to the surplus on revaluation account. To the extent of theincremental depreciation charged on the revalued assets the related surplus on revaluation of property, plant and equipment (netof deferred taxation) is transferred directly to unappropriated profit.
Maintenance and normal repairs are charged to income as and when incurred. Improvements are capitalised when it is probablethat respective future economic benefits will flow to the Company and the cost of the item can be measured reliably. Assetsreplaced, if any, are derecognised.
Notes to the Financial StatementsFor the year ended December 31, 2010
86 Annual Report 2010 ICI Pakistan Limited

Gains and losses on disposal of assets are taken to the profit and loss account, and the related surplus on revaluation of property,plant and equipment is transferred directly to retained earnings (unappropriated profits).
2.9 Intangible asset and amortisation
Intangible assets with a finite useful life, such as certain softwares, licenses and property rights, are capitalised initially at costand subsequently stated at cost less accumulated amortisation and impairment losses, if any.
Subsequent expenditure is capitalised only when it increases the future economic benefits embodied in the specific asset to whichit relates. All other expenditures are recognised in profit and loss as incurred.
Amortisation is based on the cost of an asset less its residual value. Amortisation is recognised in profit and loss on a straight-line basis over the estimated useful lives of intangible assets. Amortisation methods, useful lives and residual values are reviewedat each reporting date and adjusted, if appropriate.
2.10 Impairment
Financial assets (including receivables)
Financial assets are assessed at each reporting date to determine whether there is objective evidence that they are impaired. Afinancial asset is impaired if objective evidence indicates that a loss event has occurred after the initial recognition of the assetand that the loss event had a negative effect on the estimated future cash flows of that asset that can be estimated reliably.Objective evidence that financial assets are impaired may include default or delinquency by a debtor, indications that a debtor orissuer will enter bankruptcy.
All individually significant receivables are assessed for specific impairment. All individually significant receivables found not to bespecifically impaired are then collectively assessed for any impairment that has been incurred but not yet identified. Receivablesthat are not individually significant are collectively assessed for impairment by grouping together receivables with similar riskcharacteristics.
An impairment loss in respect of a financial asset measured at amortised cost is calculated as the difference between its carryingamount and the present value of the estimated future cash flows discounted at the asset's original effective interest rate. Lossesare recognised in profit and loss and reflected in an allowance account against receivables. Interest on the impaired asset continuesto be recognised through the unwinding of the discount. When a subsequent event causes the amount of impairment loss todecrease, the decrease in impairment loss is reversed through profit and loss account.
Non-Financial assets
The carrying amounts of non-financial assets other than inventories and deferred tax asset, are reviewed at each reporting dateto determine whether there is any indication of impairment. If any such indication exists, then the asset's recoverable amount isestimated. The recoverable amount of an asset or cash-generating unit is the greater of its value in use and its fair value less coststo sell. In assessing value in use, the estimated future cash flows are discounted to their present value using a pre-tax discountrate that reflects current market assessment of the time value of money and the risks specific to the asset. For the purpose ofimpairment testing, assets that cannot be tested individually are grouped together into the smallest group of assets that generatescash inflows from continuing use that are largely independent of the cash inflows of other assets or groups of assets (the “cash-generating unit, or CGU”).
The Company's corporate assets do not generate separate cash inflows. If there is an indication that a corporate asset may beimpaired, then the recoverable amount is determined for the CGU to which the corporate asset belongs. An impairment loss isrecognised if the carrying amount of an asset or its CGU exceeds its estimated recoverable amount. Impairment losses arerecognised in profit and loss account.
Impairment loss recognised in prior periods is assessed at each reporting date for any indications that the loss has decreased orno longer exists. An impairment loss is reversed if there has been a change in the estimates used to determine the recoverableamount. An impairment loss is reversed only to the extent that the asset's carrying amount does not exceed the carrying amountthat would have been determined, net of depreciation or amortisation, if no impairment loss had been recognised.
2.11 Investments
Investments in subsidiary (ICI Pakistan PowerGen Limited) and unquoted equity securities classified as available for sale arestated at cost less provision for impairment, if any.
ICI Pakistan Limited Annual Report 2010 87

2.12 Stores and spares
Stores and spares are stated at the lower of cost and net realisable value. Cost is determined using the weighted average method.
2.13 Stock-in-trade
Stock-in-trade is valued at lower of weighted average cost and estimated net realisable value.
Cost comprises all costs of purchase, costs of conversion and other costs incurred in bringing the inventories to their present locationand condition. Net realisable value signifies the estimated selling price in the ordinary course of business less net estimated costsof completion and selling expenses.
2.14 Trade debts and other receivables
Trade debts and other receivables are recognised initially at fair value plus directly attributable cost, if any. A provision for impairmentof trade and other receivables is established when there is objective evidence that the Company will not be able to collect allamounts due according to the original terms of receivables (Refer note 39.6.1).
2.15 Foreign currency translation
Transactions denominated in foreign currencies are translated to Pak Rupees, at the foreign exchange rate prevailing at the dateof transaction. Monetary assets and liabilities in foreign currencies are translated into Pak Rupees at the foreign exchange ratesat the balance sheet date. Exchange differences are taken to the profit and loss account.
2.16 Functional and presentation currency
Items included in the financial statements are measured using the currency of the primary economic environment in which theCompany operates. The financial statements are presented in Pak Rupees, which is the Company's functional and presentationcurrency.
2.17 Revenue recognition
• Revenue from the sale of goods is recognised when the significant risks and rewards of ownership have been transferred tothe customer. For those products which are often sold with a right of return, accumulated experience is used to estimate andprovide for such returns at the time of sale.
• Commission income is recognised on the date of shipment from suppliers.
• Profit on short-term deposits and mark-up on loan to subsidiary is accounted for on a time-apportioned basis using the effectiveinterest rate method.
• Dividend income is recognised when the right to receive dividend is established.
• Toll manufacturing income is recognised when services are rendered.
2.18 Financial expense and finance income
Financial expenses are recognised using the effective interest rate method and comprise foreign currency losses and mark-up /interest expense on borrowings.
Finance income comprises interest income on funds invested. Mark-up / Interest income is recognised as it accrues in profit andloss account, using the effective interest rate method.
2.19 Segment reporting
Segment reporting is based on the operating (business) segments of the Company. An operating segment is a component of theCompany that engages in business activities from which it may earn revenues and incur expenses, including revenues andexpenses that relate to transactions with any of the Company's other components. An operating segment's operating results arereviewed regularly by the CEO to make decisions about resources to be allocated to the segment and assess its performance,and for which discrete financial information is available.
Segment results that are reported to the CEO include items directly attributable to a segment as well as those that can be allocatedon a reasonable basis. Unallocated items comprise mainly corporate assets, income tax assets, liabilities and related income and
88 Annual Report 2010 ICI Pakistan Limited
Notes to the Financial StatementsFor the year ended December 31, 2010

expenditure. Segment capital expenditure is the total cost incurred during the period to acquire property, plant and equipment.The business segments are engaged in providing products or services which are subject to risks and rewards which differ fromthe risks and rewards of other segments. Segments reported are Polyester, Soda Ash, Paints, Life Sciences and Chemicals, whichalso reflects the management structure of the Company.
2.20 Finance lease
Leases that transfer substantially all the risks and rewards incidental to ownership of an asset are classified as finance leases.Assets subject to finance lease are stated at amounts equal to the fair value or, if lower, the present value of the minimum leasepayments. The minimum lease payments are apportioned between the finance charge and the reduction of the outstanding liability.Assets acquired under finance leases are depreciated in accordance with the Company's depreciation policy on property, plantand equipment. The finance cost is charged to profit and loss account and is included under financial charges.
2.21 Operating lease / Ijarah contract
Leases in which a significant portion of the risks and rewards of ownership are retained by the lessor are classified as operatingleases. Payments made under operating leases (net of any incentives received from the lessor) are charged to the profit and lossaccount on a straight-line basis over the period of the lease.
Payments made under Ijarah contracts are recognised in the profit and loss account on a straight-line basis over the term of thelease.
2.22 Cash and cash equivalents
Cash and cash equivalents comprise of cash in hand and current and deposit accounts held with banks. Running finance facilitiesavailed by the Company, which are payable on demand and form an integral part of the Company's cash management are includedas part of cash and cash equivalents for the purpose of statement of cash flows.
2.23 Borrowings and their cost
Borrowings are recognised initially at fair value, net of transaction costs incurred. Borrowing costs are recognised as an expensein the period in which these are incurred except to the extent of borrowing costs that are directly attributable to the acquisition,construction or production of a qualifying asset. Such borrowing costs, if any, are capitalised as part of the cost of that asset.
2.24 Financial liabilities
All financial liabilities are initially recognised at fair value plus directly attributable cost, if any, and subsequently measured atamortised cost.
2.25 Derivative financial instruments
The Company uses derivative financial instruments to hedge its exposure to foreign exchange and interest rate risks arising fromoperational, financing and investment activities. In accordance with its treasury policy, the Company does not hold or issue derivativefinancial instruments for trading purposes. However, derivatives that do not qualify for hedge accounting are accounted for astrading instruments.
2.26 Off-setting
Financial assets and liabilities are offset and the net amount is reported in the financial statements only when there is a legallyenforceable right to set-off the recognised amount and the Company intends either to settle on a net basis, or to realise the assetsand to settle the liabilities simultaneously.
2.27 Earnings per Share
The Company presents basic and diluted earnings per share (EPS) data for its ordinary shares. Basic EPS is calculated by dividingthe profit after tax attributable to ordinary shareholders of the Company by the weighted average number of ordinary sharesoutstanding during the period.
ICI Pakistan Limited Annual Report 2010 89

3. Issued, Subscribed and Paid-up Capital
Ordinary shares of Rs 10 each fully paid125,840,190 125,840,190 in cash 1,258,402 1,258,402
Ordinary shares of Rs 10 each issued as fully paid for consideration other than cash under
318,492 318,492 scheme of arrangement for amalgamation 3,185 3,185
Ordinary shares of Rs 10 each issued as 25,227 25,227 fully paid bonus shares 252 252
Ordinary shares issued pursuant to the Scheme as fully paid for consideration of
12,618,391 12,618,391 investment in associate (note 3.1) 126,184 126,184
138,802,300 138,802,300 1,388,023 1,388,023
3.1 With effect from October 1, 2000 the Pure Terephthalic Acid (PTA) Business of the Company was demerged under a Scheme ofArrangement (“the Scheme”) dated December 12, 2000 approved by the shareholders and sanctioned by the High Court of Sindh.
3.2 ICI Omicron B.V., which is a wholly owned subsidiary of AkzoNobel N.V., held 105,229,125 (2009: 105,229,125) ordinary sharesof Rs 10 each at December 31, 2010. AkzoNobel N.V., acquired ICI PLC, UK, effective January 2, 2008, the parent company ofICI Omicron B.V., and became the ultimate holding company of ICI Pakistan Limited. ICI Pakistan Limited continues to be thedirect subsidiary of ICI Omicron B.V..
4. Capital Reserves
Share premium - note 4.1 465,259 465,259
Capital receipts - note 4.2 586 586
465,845 465,845
4.1 Share premium includes the premium amounting to Rs 0.902 million received on shares issued for the Company's Polyester Plantinstallation in 1980 and share premium of Rs 464.357 million representing the difference between nominal value of Rs 10 pershare of 12,618,391 ordinary shares issued by the Company and the market value of Rs 590.541 million of these sharescorresponding to 25% holding acquired in Lotte Pakistan PTA Limited, an ex-associate, at the date of acquisition i.e. November2, 2001 and the number of shares that have been issued were determined in accordance with the Scheme in the ratio betweenmarket value of the shares of two companies based on the mean of the middle market quotation of the Karachi Stock Exchangeover the ten trading days between October 22, 2001 to November 2, 2001.
4.2 Capital receipts represent the amount received from various ICI PLC group companies overseas for the purchase of property,plant and equipment. The remitting companies have no claim to their repayments.
5. Surplus on Revaluation of Property, Plant and Equipment
Balance as on January 1 931,846 962,795
Less: Transfer to unappropriated profit in respect of incremental depreciation charged during the year net of deferred tax (24,494) (30,949)
Balance as on December 31 907,352 931,846
2010 2009 2010 2009(Numbers)
Amounts in Rs ’000
90 Annual Report 2010 ICI Pakistan Limited
Notes to the Financial StatementsFor the year ended December 31, 2010

6. Provisions for non-management staff gratuity and eligible retired employees' medical scheme - note 6.1 222,942 183,019
6.1 Staff Retirement Benefits2010 2009
Funded Unfunded Funded UnfundedPension Gratuity Total Pension Gratuity Total
6.1.1 The amounts recognised in the profit and loss account against defined benefit schemes are as follows:
Current service cost 47,010 31,885 78,895 9,741 24,526 26,223 50,749 7,535Interest cost 156,844 56,301 213,145 40,426 153,634 62,926 216,560 41,173Expected return on plan assets (133,250) (39,920) (173,170) - (98,449) (31,903) (130,352) -Termination cost - - - - 13,043 - 13,043 -Recognition of actuarial loss 105,175 12,060 117,235 8,824 101,997 13,582 115,579 7,300Net charge for the year 175,779 60,326 236,105 58,991 194,751 70,828 265,579 56,008
6.1.2 Movements in the net asset / (liability) recognised in the balance sheet are as follows:
Opening balance 319,437 33,867 353,304 (183,258) 238,716 62,148 300,864 (142,489)Net Charge for the year - note 6.1.1 (175,779) (60,326) (236,105) (58,991) (194,751) (70,828) (265,579) (56,008)Contributions / payments during the year 198,926 46,294 245,220 19,068 275,472 42,547 318,019 15,239Closing balance 342,584 19,835 362,419 (223,181) * 319,437 33,867 353,304 (183,258)*
6.1.3 The amounts recognised in the balance sheet are as follows:
Fair value of plan assets - note 6.1.5 1,380,173 391,304 1,771,477 - 1,037,319 317,150 1,354,469 -Present value of defined benefit obligation - note 6.1.4 (1,547,841) (553,363) (2,101,204) (381,842) (1,285,827) (462,971) (1,748,798) (340,084)Deficit (167,668) (162,059) (329,727) (381,842) (248,508) (145,821) (394,329) (340,084)Unrecognised actuarial loss 510,252 181,894 692,146 158,661 567,945 179,688 747,633 156,826Recognised asset / (liability) 342,584 19,835 362,419 (223,181) * 319,437 33,867 353,304 (183,258)*
6.1.4 Movement in the present value of defined benefit obligation:
Opening balance 1,285,827 462,971 1,748,798 340,084 1,117,525 442,477 1,560,002 259,784Current service cost 47,010 31,885 78,895 9,741 24,526 26,223 50,749 7,535Interest cost 156,844 56,301 213,145 40,426 153,634 62,926 216,560 41,173Benefits paid (64,610) (30,744) (95,354) (19,068) (286,286) (103,768) (390,054) (15,239)Termination cost - - - - 13,043 - 13,043 -Actuarial loss 122,770 32,950 155,720 10,659 263,385 35,113 298,498 46,831Present value of defined benefit obligation at the end of the year 1,547,841 553,363 2,101,204 381,842 1,285,827 462,971 1,748,798 340,084
6.1.5 Movement in the fair value of plan assets:
Opening balance 1,037,319 317,150 1,354,469 - 815,658 310,404 1,126,062 -Expected return 133,250 39,920 173,170 - 98,449 31,903 130,352 -Contributions 198,926 46,294 245,220 - 275,472 42,547 318,019 -Benefits paid (64,610) (30,744) (95,354) - (286,286) (103,768) (390,054) -Actuarial gain 75,288 18,684 93,972 - 134,026 36,064 170,090 -Fair value of plan assets at the end of the year 1,380,173 391,304 1,771,477 - 1,037,319 317,150 1,354,469 -
6.1.6 Historical information
As at December 31 2010 2009 2008 2007 2006Present Value of defined benefit obligation 2,483,046 2,088,882 1,819,786 1,555,387 1,236,483Fair value of plan assets 1,771,477 1,354,469 1,126,062 1,312,938 1,067,109Deficit 711,569 734,413 693,724 242,449 169,374
Experience adjustments on plan liabilities 7% 3% 13% 16% 1%Experience adjustments on plan assets 5% 13% (27%) 7% (9%)
6.1.7 Major categories / composition of plan assets are as follows:2010 2009
Debt instruments 62% 50%Equity at market value 30% 32%Cash 8% 18%
Mortality of active employees and pensioners will be represented by the LIC(96-98) Table. The table has been rated down three years for mortality of female pensionersand widows.
The return on plan assets was assumed to equal the discount rate. Actual (loss) / return on plan assets during 2010 was Rs 267.142 million (2009: Rs 300.442 million).
2010 2009
Amounts in Rs ’000
ICI Pakistan Limited Annual Report 2010 91

6.1.8 The principal actuarial assumptions at the reporting date were as follows:
Discount rate 14.25% 12.75%Expected return on plan assets 14.25% 12.75%Future salary increases 12.00% 10.60%Future pension increases 8.75% 7.38%
6.1.9 Medical cost trend is assumed to follow inflation. The sensitivity to reflect the effect of a 1% movement in the assumed medicalcost trend were as follows:
2010 Increase Decrease
8.75% 9.75% 7.75%
Effect on the aggregate of the current service cost and interest cost 35,905 44,139 32,003
Effect on the defined benefit obligation 291,807 335,025 255,287
These figures are based on the latest actuarial valuation, as at December 31, 2010. The valuation uses the Projected Unit Creditmethod. Actuarial gains and losses are amortised over the expected future service life of current members.
* The unfunded liability included in the above table includes Rs 0.239 million (2009: Rs 0.239 million) pertaining to ICI PakistanPowerGen Limited.
6.1.10 The Company contributed Rs 62.698 million (2009: Rs 55.553 million) and Rs 35.269 million (2009: Rs 29.321 million) to theprovident fund and the defined contribution superannuation fund respectively during the year.
2010 2009
Opening Reversal Closing Opening Charge Closing
7. Deferred Tax (Liability) / Asset - net
Deductible temporary differencesTax losses carried forward - - - 272,421 (272,421) -Provisions for retirement benefits, doubtful debts and others 336,321 133,784 470,105 355,745 (19,424) 336,321
Taxable temporary differencesProperty, plant and equipment (1,361,419) 21,066 (1,340,353) (1,098,870) (262,549) (1,361,419)
(1,025,098) 154,850 (870,248) (470,704) (554,394) (1,025,098)
8. Trade and Other Payables 2010 2009
Trade creditors - note 8.1 1,020,565 963,992
Bills payable 1,987,933 2,270,321
Sales tax, excise and custom duties 125,567 177,618
Accrued interest / return on unsecured loan - note 8.2 305,109 299,647
Accrued expenses 1,155,649 1,150,995
Technical service fee / royalty 30,316 35,975
Workers' profit participation fund - note 8.3 204,104 164,599
Workers' welfare fund 76,153 119,760
Distributors' security deposits - payable on termination of distributorship - note 8.4 80,700 71,993
Contractors' earnest / retention money 11,653 10,103
Advances from customers 253,752 248,727
Unclaimed dividends 4,544 4,548
Payable for capital expenditure 99,184 136,810
Provision for compensated absences - note 8.5 20,000 20,000
Others 106,808 124,810 5,482,037 5,799,898
2010 2009
Amounts in Rs ’000
92 Annual Report 2010 ICI Pakistan Limited
Notes to the Financial StatementsFor the year ended December 31, 2010

8.1 The above balances include amounts due to following associated undertakings:
ICI Paints UK (part of AkzoNobel group) 174 6,911ICI Paints (Asia Pacific) Pte Ltd (part of AkzoNobel group) 15 26,105AkzoNobel Paints Malaysia - 3,392Marine Protective International Coating Malaysia (part of AkzoNobel group) - 1,400C&P Residual (part of AkzoNobel group) 1,197 -AkzoNobel NV 36,280 -AkzoNobel Functional Chemicals 3,995 -International Paint Netherland (part of AkzoNobel group) 154 -ICI Packaging Coatings (part of AkzoNobel group) 197 -AkzoNobel Functional Chemicals BV 11,592 -AkzoNobel Functional Chemicals Pte Ltd 2,827 -AkzoNobel Surface Chemistry Pte Ltd 3,014 -ICI Paints Thailand (part of AkzoNobel group) 25 -ICI Paints Indonesia (part of AkzoNobel group) - 101CR Netherlands (part of AkzoNobel group) - 5,339AkzoNobel Car Refinishes BV 23,103 -
82,573 43,248
8.2 This represents amount payable to Mortar Investments International Limited.
8.3 Workers' profit participation fund
Balance as on January 1 164,599 148,214Allocation for the year - note 29 196,761 161,822
361,360 310,036Interest on funds utilised in the Company's businesses at 60.00 percent (2009: 41.25 percent) per annum - note 28 6,948 2,105
368,308 312,141Less:- Amount paid on behalf of the Fund 72,017 72,260- Deposited with the Government of Pakistan 92,187 75,282
164,204 147,542Balance as on December 31 204,104 164,599
8.4 Interest on security deposits from certain distributors is payable at 11.5 percent (2009: 7.5 percent) per annum as specified in therespective agreements.
8.5 This figure is based on the actuarial valuation, as at December 31, 2009.
9. Contingencies and Commitments
9.1 Claims against the Company not acknowledged as debts are as follows:
Local bodies 14,178 14,631Sales Tax authorities 91,336 93,323Others 137,934 53,396
243,448 161,350
9.2 A notice was issued by the Environmental Protection Authority (EPA) against the Paints factory located at Ferozpur Road, Lahore.Pursuant to this an order was passed by the EPA for violation of certain provisions of the 'Act'. The Company is of the opinionthat the order was not justified and has filed an appeal against the order in the Environmental Tribunal in Lahore, which is pending.
9.3 Guarantees issued by the Company in respect of financial and operational obligations of Lotte Pakistan PTA Limited pursuant tothe Scheme of arrangement, amounting to Rs 2,190 million (2009: Rs 2,280 million) against which Lotte Pakistan PTA Limitedand KP Chemical Corporation Limited have issued counter guarantees to the Company.
2010 2009
Amounts in Rs ’000
ICI Pakistan Limited Annual Report 2010 93

9.4 Guarantee issued by the Company to a bank in respect of financing obtained by Senior Executives amounted to Rs 35 million(2009: Rs 35 million), in accordance with the terms of employment.
9.5 Guarantee issued by the Company of Rs 133 million (2009: Rs 133 million) to a bank on behalf of its subsidiary ICI PakistanPowerGen Limited for availing funded facility.
9.6 Commitments in respect of capital expenditure amounted to Rs 138.35 million (2009: Rs 23.875 million).
9.7 Commitments for rentals under operating lease / ijarah contracts in respect of vehicles amounting to Rs 164.159 million (2009:Rs 195.166 million) are as follows:
Year2010 - 66,7462011 67,470 58,1652012 56,785 45,3052013 32,769 23,6802014 7,135 1,270
164,159 195,166
Payable not later than one year 67,470 66,746Payable later than one year but not later than five years 96,689 128,420
164,159 195,166
10. Property, Plant and Equipment
10.1 The following is a statement of property, plant and equipment:
Operating property, plant and equipment - note 10.2 8,677,493 8,835,201Capital work-in-progress - note 10.6 217,598 389,909
8,895,091 9,225,110
10.2 The following is a statement of operating property, plant and equipment:
Land Lime beds Buildings Plant and Railway Rolling Furniture TotalFreehold Leasehold on freehold On On machinery sidings stock and and
land freehold leasehold vehicles equipmentland land
2010
Net carrying value basisYear ended December 31, 2010Opening net book value (NBV) 836,702 2,837 68,515 223,211 725,377 6,789,648 - 26,082 162,829 8,835,201Addition/transfer (at cost) 27,934 - 30,980 47,455 48,633 523,166 - 8,724 92,283 779,175Disposal/transfer (at NBV) - - (32) - - (18,871) - (2,865) (1,054) (22,822)Depreciation charge - (72) (9,800) (36,307) (68,775) (734,939) - (10,498) (53,670) (914,061)Closing net book value (NBV) 864,636 2,765 89,663 234,359 705,235 6,559,004 - 21,443 200,388 8,677,493
Gross carrying value basisAt December 31, 2010Cost/Revaluation 864,636 567,799 164,750 949,309 1,341,783 17,267,715 297 126,071 719,335 22,001,695Accumulated Depreciation - (565,034) (75,087) (714,950) (636,548) (10,708,711) (297) (104,628) (518,947) (13,324,202)Net book value 864,636 2,765 89,663 234,359 705,235 6,559,004 - 21,443 200,388 8,677,493
Depreciation rate % per annum - 2 to 4 3.33 to 7.5 5 to 10 2.5 to 10 3.33 to 10 3.33 10 to 25 10 to 33.33
2009
Net carrying value basisYear ended December 31, 2009Opening net book value (NBV) 836,702 7,149 78,256 224,676 455,945 5,753,476 - 31,742 128,812 7,516,758Addition/transfer (at cost) - - - 30,721 332,621 1,743,504 - 7,560 78,880 2,193,286Disposal/transfer (at NBV) - - - - - (9,229) - (2,077) (549) (11,855)Depreciation charge - (4,312) (9,741) (32,186) (63,189) (698,103) - (11,143) (44,314) (862,988)Closing net book value (NBV) 836,702 2,837 68,515 223,211 725,377 6,789,648 - 26,082 162,829 8,835,201
Gross carrying value basisAt December 31, 2009Cost/Revaluation 836,702 567,799 133,820 901,854 1,293,917 16,790,858 297 120,598 668,909 21,314,754Accumulated Depreciation - (564,962) (65,305) (678,643) (568,540) (10,001,210) (297) (94,516) (506,080) (12,479,553)Net book value 836,702 2,837 68,515 223,211 725,377 6,789,648 - 26,082 162,829 8,835,201
Depreciation rate % per annum - 2 to 4 3.33 to 7.5 5 to 10 2.5 to 10 3.33 to 10 3.33 10 to 25 10 to 33.33
2010 2009
Amounts in Rs ’000
94 Annual Report 2010 ICI Pakistan Limited
Notes to the Financial StatementsFor the year ended December 31, 2010

10.3 Subsequent to revaluation on October 1, 1959 and September 30, 2000, which had resulted in a surplus of Rs 14.207 million andRs 1,569.869 million respectively, the land and plant and machinery were revalued again on December 15, 2006 resulting in anet surplus of Rs 667.967 million. The valuation was conducted by independent valuers. Valuations for plant and machinery wasthe open market value of the asset based on estimated gross replacement cost, depreciated to reflect the residual service potentialof the asset having paid due regard to age, condition and obsolescence. Land was valued on the basis of fair market value.
10.4 As at December 31, 2010 plant and machinery included equipments held with Searle Pakistan Limited and Maple Pharmaceutical(Private) Limited (toll manufacturers), having cost and net book values as follows:
Cost 4,100 3,200
Net book value 3,100 2,500
10.4.1 Had there been no revaluation, the net book value of specific classes of operating property, plant and equipment would haveamounted to:
Net Book Value
Freehold land 48,863 20,929Plant and machinery 6,381,889 6,575,035Rolling stock and vehicles 21,443 26,082Furniture and equipment 200,388 162,829
6,652,583 6,784,875
10.5 The depreciation charge for the year has been allocated as follows:
Cost of sales - note 25 858,479 815,543Selling and distribution expenses - note 26 10,956 12,726Administration and general expenses - note 27 44,626 34,719
914,061 862,988
10.6 The following is a statement of capital work-in-progress:
Civil works and buildings 39,836 50,634Plant and machinery 130,655 183,965Miscellaneous equipment 8,993 33,664Advances to suppliers / contractors 38,114 121,646
217,598 389,909
10.7 Details of operating property, plant and equipment disposals having net book value in excess of Rs 50,000 are as follows:
2010
Mode of sale Cost Accumulated Net book Sale Particulars of buyers depreciation value proceeds
Plant and machinery
Gas condenser & Various items Tender 27,095 12,157 14,938 4,917 Alfa Laval Middleeast Ltd. and Muhammad Akram Ghouri,Mandi Bahauddin
Tinting Machines & Dispenser Negotiation 4,180 788 3,392 3,111 Al Habib, Awami Paints, Saad contractor,Asian Paints, Roomi Paints,Khurram Contractors, Lahore
Rolling stock and vehicles
Honda City & Toyota Corolla Auction 1,510 192 1,318 1,924 Murtaza Khan Babar and Syed Farhat Abbas Jafri, Karachi
Honda Motorcycle Auction 80 3 77 70 Syed Ghulam Mustafa, Lahore
Furniture and equipment
Water cooling coil and Chiller Auction 467 323 144 194 Habibullah Khan, Karachi
2009
Plant and machinery
Dust extraction unit and other items Auction 28,576 23,089 5,487 3,338 Hi-Tech Electronics & Machinery, KarachiTinting Machines Negotiation 4,429 710 3,719 3,719 Jaffer and Sons., Chaudhry Paint House,
Color Bank and Awan Brothers, Lahore
Rolling stock and vehicles
Toyota Corolla - 2 nos Negotiation 1,481 734 747 2,088 Tufail Iqbal & M Inam, LahoreHino Dump Trucks Auction 8,808 7,519 1,289 1,902 Hi-Tech Electronics & Machinery, Karachi
2010 2009
Amounts in Rs ’000
ICI Pakistan Limited Annual Report 2010 95

Amounts in Rs ’000
11. Intangible Assets2010
Software Licenses Under Total development
Net carrying value basis Year ended December 31Opening net book value (NBV) - - - -Additions (at cost) 57,364 87,136 65,352 209,852Amortisation charge (8,605) (21,145) - (29,750)Closing net book value (NBV) 48,759 65,991 65,352 180,102
Gross carrying amount At December 31Cost 226,145 87,136 65,352 378,633Accumulated amortisation (177,386) (21,145) - (198,531)Net book value 48,759 65,991 65,352 180,102
Rate of amortisation % per annum 20 20 to 50 -
2009
Net carrying value basis Year ended December 31Opening net book value (NBV) 7,700 - - 7,700Additions (at cost) - - - -Amortisation charge (7,700) - - (7,700)Closing net book value (NBV) - - - -
Gross carrying amount At December 31Cost 168,781 - - 168,781Accumulated amortisation (168,781) - - (168,781)Net book value - - - -
Rate of amortisation % per annum 20 - -
11.1 The amortisation charge for the year has been allocated as follows:
Cost of sales - note 25 7,746 3,636Selling and distribution expenses - note 26 2,565 639Administration and general expenses - note 27 19,439 3,425
29,750 7,700
12. Long Term Investments - at cost
Unquoted
Subsidiary
- ICI Pakistan PowerGen Limited (wholly owned) - note 12.1 7,100,000 ordinary shares (2009: 7,100,000) of Rs 100 each 710,000 710,000
Others
Equity security available for sale
- Arabian Sea Country Club Limited 2,500 2,500
712,500 712,500
12.1 The value of the Company's investment on the basis of net assets of the Subsidiary as disclosed in the audited financial statementsfor the year ended December 31, 2010 amounted to Rs. 306.706 million (2009: Rs 258.426 million).
2010 2009
96 Annual Report 2010 ICI Pakistan Limited
Notes to the Financial StatementsFor the year ended December 31, 2010

13. Long-Term Loans - Considered good
Due from Subsidiary - Unsecured- Long term portion - note 13.1 177,778 200,000Due from Executives and Employees - note 13.2 146,486 130,801
324,264 330,801
13.1 This represents loan given to ICI Pakistan PowerGen Limited (wholly owned subsidiary) of Rs 200 million carrying mark-up at 3months KIBOR + 2%. This loan is repayable in nine equal semi annual installments commencing from October 1, 2011.
13.2 Due from Directors, Executives and EmployeesMotor car House Total Total
building
Due from Directors and Executives - note 13.3 101,847 51,568 153,415 121,756Less: Receivable within one year - note 18 19,270 25,424 44,694 25,119
82,577 26,144 108,721 96,637
Due from Employees 65,762 54,237Less: Receivable within one year - note 18 27,997 20,073
37,765 34,164 146,486 130,801
Outstanding for period: - less than three years but over one year 69,306 70,338 - more than three years 77,180 60,463
146,486 130,801
13.3 Reconciliation of the carrying amount of loans to Directors and Executives:
Opening balance at beginning of the year 121,756 102,117Disbursements 84,215 79,293Repayments (52,556) (59,654)Balance at end of the year 153,415 121,756
The above loan balance includes an amount of Rs 0.319 million (2009: Rs 1.595 million) in respect of house building relating tokey management personnel. Loan outstanding during the year relates to Mr. Ali A. Aga (Director), who was provided this loan asper his terms of employment.
13.4 Loans for purchase of motor cars and house building are repayable between two to ten years. These loans are interest free andgranted to the employees including executives of the Company in accordance with their terms of employment.
13.5 The maximum aggregate amount of long-term loans due from the Executives at the end of any month during the year was Rs161.509 million (2009: Rs 125.362 million).
14. Long-Term Deposits and Prepayments
Deposits 22,873 21,211Prepayments 17,585 7,867
40,458 29,078
15. Stores and Spares
Stores (include in-transit Rs 20.058 million; 2009: Rs 11.688 million) 36,801 37,613Spares 512,019 493,799Consumables 77,547 76,660
626,367 608,072Less: Provision for slow moving and obsolete items - note 15.1 175,771 111,671
450,596 496,401
2010 2009
Amounts in Rs ’000
ICI Pakistan Limited Annual Report 2010 97

15.1 Movement of provision in stores and spares
Provision as at January 1 111,671 104,661
Charge for the year - note 27 64,100 40,000
Write-off - (32,990)
Provision as at December 31 175,771 111,671
16. Stock-in-Trade
Raw and packing material (include in-transit Rs 436.887 million; 1,786,092 1,282,701 2009: Rs 219.873 million) - note 16.2
Work-in-process 48,553 83,229
Finished goods (include in-transit Rs 9.490 million; 2009: Rs 9.23 million) 2,107,225 1,997,408
3,941,870 3,363,338
Less: Provision for slow moving and obsolete stocks - note 16.1
- Raw material 87,463 63,944
- Finished goods 68,062 54,869
155,525 118,813
3,786,345 3,244,525
16.1 Movement of provision in stock-in-trade
Provision as at January 1 118,813 113,865
Charge for the year - note 27 55,510 38,617
Reversal - (5,000)
Write-off (18,798) (28,669)
Provision as at December 31 155,525 118,813
Stocks amounting to Rs Nil (2009: Rs 18.663 million) are measured at net realisable value and has been written down by Rs Nil(2009: Rs 1.62 million) to arrive at its net realisable value.
16.2 Raw and packing materials include Rs 283.341 million (2009: Rs. 148.524 million) which are held with toll manufacturers namelySearle Pakistan Limited, Maple Pharmaceutical (Private) Limited, Epla Laboratories (Private) Limited, Breeze Pharma (Private)Limited, NovaMed Pharmaceuticals and Polymer International (Private) Limited.
17. Trade Debts
Considered good - Secured 267,755 356,608
- Unsecured 974,365 812,677
1,242,120 1,169,285
Considered doubtful 343,490 277,631
1,585,610 1,446,916
Less: Provision for:
- Doubtful debts - note 39.6 343,490 277,631
- Discounts payable on sales 449,253 249,822
792,743 527,453
792,867 919,463
2010 2009
Amounts in Rs ’000
98 Annual Report 2010 ICI Pakistan Limited
Notes to the Financial StatementsFor the year ended December 31, 2010

2010 2009
Amounts in Rs ’000
18. Loans and Advances
Considered goodLoans due from: Directors and Executives - note 13.2 44,694 25,119
Employees - note 13.2 27,997 20,073Due from Subsidiary: - Current portion of long term loan - note 13.1 22,222 - - Unsecured - note 18.1 283,000 283,000
377,913 328,192Advances to:
Directors and Executives - note 18.2 5,003 6,012Employees 2,761 6,626Contractors and suppliers 200,128 60,355Others 4,917 5,554
212,809 78,547 590,722 406,739
Considered doubtful 10,620 8,120 601,342 414,859
Less: Provision for doubtful loans and advances - note 39.6 10,620 8,120 590,722 406,739
18.1 A standby finance facility of Rs 300 million (2009: Rs 300 million) is provided to ICI Pakistan PowerGen Limited (wholly ownedsubsidiary) which is repayable on demand at a markup rate of 3 months KIBOR + 1.65% (2009: 3 months KIBOR + 1.65%).
18.2 The maximum aggregate amount of advances due from the Directors and Executives at the end of any month during the yearwere Rs 3.245 million and Rs 7.364 million (2009: Rs 3.967 million and Rs 4.446 million) respectively.
19. Trade Deposits and Short-Term Prepayments
Trade deposits 22,245 21,700Short-term prepayments 421,429 430,738
443,674 452,438
20. Other Receivables
Considered goodDuties, sales tax and octroi refunds due 269,815 212,244Due from Associate - note 20.1 & 20.2 78,721 85,225Insurance claims 9,965 11,887Commission receivable 47,341 39,829Interest income receivable from subsidiary 16,805 16,233Interest income receivable 4,516 4,058Rebates receivable - 123,427Others 179,117 184,208
606,280 677,111
Considered doubtful 16,982 17,383 623,262 694,494
Less: Provision for doubtful receivables - note 20.3 16,982 17,383 606,280 677,111
ICI Pakistan Limited Annual Report 2010 99

Amounts in Rs ’000
2010 2009
20.1 The maximum aggregate amount due from ICI Omicron B.V. at the end of any month during the year was Rs 80.755 million (2009:Rs 81.978 million).
20.2 The above balances include amounts due from following associated undertakings:
ICI Omicron B.V. wholly owned subsidiary of AkzoNobel N.V. 78,586 80,420ICI Swire Paints (Shanghai) Limited (part of AkzoNobel group) 89 4,805AkzoNobel Functional Chemicals 46 -
78,721 85,225
20.3 Movement of provision for doubtful receivables
Provision as at January 1 17,383 17,533Charge for the year - note 27 1,004 -Reversal (1,405) (150)Provision as at December 31 16,982 17,383
21. Cash and Bank Balances
Short term deposits - note 21.1 2,927,000 3,350,000Current accounts 1,489,720 936,795In hand
- Cheques 230,942 169,633 - Cash 14,160 11,823
4,661,822 4,468,251
21.1 These are placed with various banks with maturity up to January 2011. The markup return on these deposits ranges between11.30% to 11.71%.
22. Short-Term Financing
The facilities for running finance available from various banks amounted to Rs 2,471 million (December 31, 2009: Rs 2,691 million)and carried mark-up during the period ranging from relevant KIBOR + 0.75% to 3.47% per annum with an average mark-up rateas on December 31, 2010 at relevant KIBOR + 1.30% per annum (December 31, 2009: 12.64 to 17.37 percent per annum). Thefacilities are secured by hypothecation charge over the present and future stock-in-trade and book debts of the Company andfirst pari passu charge over plant and machinery of Soda Ash Business of the Company.
100 Annual Report 2010 ICI Pakistan Limited
Notes to the Financial StatementsFor the year ended December 31, 2010

23. Operating Segment ResultsPolyester Soda Ash Paints Life Sciences Chemicals Company
Note 2010 2009 2010 2009 2010 2009 2010 2009 2010 2009 2010 2009
SalesAfghanistan - - 1,210 - 105,623 88,800 - - - - 106,833 88,800
Bangladesh - - 156,953 86,476 - - - - 1,692 6,888 158,645 93,364
India - - 419,359 27,882 - - - - - - 419,359 27,882
South Africa - - 97,790 76,605 - - - - - - 97,790 76,605
United ArabEmirates - - 28,934 16,556 - - - - - 158 28,934 16,714
Others - - 14,242 3,989 - - - 810 11,207 18,055 25,449 22,854
- - 718,488 211,508 105,623 88,800 - 810 12,899 25,101 837,010 326,219
Inter-segment - - - - - - - - 417,420 276,573 417,420 276,573
Local 18,033,688 13,242,345 7,350,542 6,360,285 6,516,258 6,136,722 4,115,180 3,740,030 2,580,289 2,508,705 38,595,957 31,988,087
18,033,688 13,242,345 8,069,030 6,571,793 6,621,881 6,225,522 4,115,180 3,740,840 3,010,608 2,810,379 39,850,387 32,590,879
Commission /Toll income - - - - - - - - 99,539 84,875 99,539 84,875
Turnover 18,033,688 13,242,345 8,069,030 6,571,793 6,621,881 6,225,522 4,115,180 3,740,840 3,110,147 2,895,254 39,949,926 32,675,754
Sales tax - - 1,263,579 1,073,105 900,599 811,979 1,119 - 290,709 272,088 2,456,006 2,157,172
Excise Duty - - 60,160 52,328 54,115 49,947 - - 7,546 7,010 121,821 109,285
Commission and discounts to distributors and customers 52,933 44,517 282,270 107,539 986,298 1,006,822 352,587 374,927 150,611 169,022 1,824,699 1,702,827
52,933 44,517 1,606,009 1,232,972 1,941,012 1,868,748 353,706 374,927 448,866 448,120 4,402,526 3,969,284
Net sales, commission & toll income 17,980,755 13,197,828 6,463,021 5,338,821 4,680,869 4,356,774 3,761,474 3,365,913 2,661,281 2,447,134 35,547,400 28,706,470
Cost of sales 25 15,620,929 11,794,598 5,074,124 3,896,339 3,333,661 2,986,743 2,681,386 2,383,614 2,151,010 1,969,284 28,861,110 23,030,578
Gross profit 2,359,826 1,403,230 1,388,897 1,442,482 1,347,208 1,370,031 1,080,088 982,299 510,271 477,850 6,686,290 5,675,892
Selling and distribution
expenses 26 72,543 75,236 203,173 112,223 765,075 725,114 493,036 424,700 140,892 132,901 1,674,719 1,470,174
Administration and general expenses 27 265,191 239,111 290,708 291,821 448,873 381,949 148,242 137,107 145,991 128,076 1,299,005 1,178,064
Operating result 2,022,092 1,088,883 895,016 1,038,438 133,260 262,968 438,810 420,492 223,388 216,873 3,712,566 3,027,654
23.1 Segment assets 1,172,960 6,262,004 6,369,128 6,042,615 6,007,580 2,317,535 2,872,583 1,429,433 1,344,384 767,910 17,766,635 16,819,497
23.2 Unallocated assets 4,264,037 4,603,160
22,030,672 21,422,657
23.3 Segment liabilities 2,236,516 2,297,646 1,955,050 1,998,609 480,080 753,310 1,131,839 1,331,383 462,089 322,872 6,265,574 6,703,820
23.4 Unallocated liabilities 309,653 304,195
6,575,227 7,008,015
23.5 Non-cash items(Provision for non-management 10,795 10,249 28,493 27,052 8,554 8,121 5,309 5,041 5,840 5,545 58,991 56,008 staff gratuity and eligible retired employees' medical scheme)
23.6 Depreciation & amortisation 335,033 326,976 475,600 436,885 90,644 72,376 15,645 14,507 26,889 19,944 943,811 870,688
23.7 Capital expenditure 109,785 83,573 469,040 461,508 176,238 148,599 25,883 16,489 35,770 36,015 816,716 746,184
23.8 Inter-segment pricingTransactions among the business segments are recorded at arm's length prices using admissible valuation methods.
23.9 There was no major customer of the Company which formed 10 percent or more of the Company's revenue.
Amounts in Rs ’000
ICI Pakistan Limited Annual Report 2010 101

24. Reconciliations of reportable segment turnover, cost of sales, assets and liabilities
24.1 Turnover
Total turnover for reportable segments - note 23 39,949,926 32,675,754
Elimination of inter-segment turnover (417,420) (276,573)
Total turnover 39,532,506 32,399,181
24.2 Cost of sales
Total cost of sales for reportable segments - note 25 28,861,110 23,030,578
Elimination of inter-segment purchases (417,420) (276,573)
Total cost of sales 28,443,690 22,754,005
24.3 Assets
Total assets for reportable segments 17,766,635 16,819,497
Taxation recoverable 545,951 460,240
Bank deposits - note 21 2,927,000 3,350,000
Due from Associates - note 20.2 78,586 80,420
Long term Investments - note 12 712,500 712,500
Total Assets 22,030,672 21,422,657
24.4 Liabilities
Total liabilities for reportable segments 6,265,574 6,703,820
Accrued interest / return on unsecured loan - note 8.2 305,109 299,647
Unclaimed dividends - note 8 4,544 4,548
Total liabilities 6,575,227 7,008,015
2010 2009
Amounts in Rs ’000
102 Annual Report 2010 ICI Pakistan Limited
Notes to the Financial StatementsFor the year ended December 31, 2010

25. Cost of SalesPolyester Soda Ash Paints Life Sciences Chemicals Company
2010 2009 2010 2009 2010 2009 2010 2009 2010 2009 2010 2009
Raw and packing materials consumed
Opening stock 612,350 512,080 74,436 370,987 285,368 324,080 146,489 111,021 100,114 104,334 1,218,757 1,422,502
Purchases
Inter-segment - - - - 417,420 276,573 - - - - 417,420 276,573
Others 13,674,630 10,263,852 1,877,621 1,251,854 2,489,024 2,328,255 973,217 776,709 930,155 840,470 19,944,647 15,461,140
13,674,630 10,263,852 1,877,621 1,251,854 2,906,444 2,604,828 973,217 776,709 930,155 840,470 20,362,067 15,737,713
14,286,980 10,775,932 1,952,057 1,622,841 3,191,812 2,928,908 1,119,706 887,730 1,030,269 944,804 21,580,824 17,160,215
Closing stock - note 16 (867,612) (612,350) (203,975) (74,436) (259,951) (285,368) (282,021) (146,489) (85,070) (100,114) (1,698,629) (1,218,757)
Raw material consumed 13,419,368 10,163,582 1,748,082 1,548,405 2,931,861 2,643,540 837,685 741,241 945,199 844,690 19,882,195 15,941,458
Salaries, wages and benefits 336,069 332,146 540,016 499,952 96,312 81,234 3,078 3,037 39,211 37,879 1,014,686 954,248
Stores and spares consumed 118,723 90,109 119,593 114,679 3,704 4,476 - - 3,510 2,801 245,530 212,065
Conversion fee paid to contract manufacturers - - - - - - 201,368 186,899 4,341 4,416 205,709 191,315
Oil, gas and electricity 1,394,075 841,024 1,962,927 1,406,785 28,851 28,235 - - 7,523 8,128 3,393,376 2,284,172
Rent, rates and taxes 1,234 846 1,379 655 15,893 6,210 - - 8,612 9,857 27,118 17,568
Insurance 17,722 15,497 16,236 12,755 27,849 26,518 2 3 973 300 62,782 55,073
Repairs and maintenance 1,670 950 695 43 15,585 18,190 9 11 3,242 3,174 21,201 22,368
Depreciation & amortisation charge - note 10.5 & 11.1 319,963 320,585 455,542 423,211 75,205 60,803 428 694 15,087 13,886 866,225 819,179
Technical fees - - - - 23,270 19,279 1,815 1,445 5,750 3,010 30,835 23,734
Royalty - - - - - - 2,076 1,008 24,862 24,470 26,938 25,478
General expenses 106,805 92,148 83,627 64,268 67,637 57,373 400 452 10,965 10,431 269,434 224,672
Opening stock of work-in-process 54,163 108,866 - - 15,600 19,851 11,811 5,024 1,655 496 83,229 134,237
Closing stock of work-in-process - note 16 (24,388) (54,163) - - (10,976) (15,600) (12,464) (11,811) (725) (1,655) (48,553) (83,229)
Cost of goods manufactured 15,745,404 11,911,590 4,928,097 4,070,753 3,290,791 2,950,109 1,046,208 928,003 1,070,205 961,883 26,080,705 20,822,338
Opening stock of finished goods 509,236 392,244 207,554 33,140 246,586 221,852 837,505 476,184 141,658 271,797 1,942,539 1,395,217
Finished goods purchased 91,316 - - - 64,800 85,700 1,583,188 1,826,217 1,193,235 882,262 2,932,539 2,794,179
16,345,956 12,303,834 5,135,651 4,103,893 3,602,177 3,257,661 3,466,901 3,230,404 2,405,098 2,115,942 30,955,783 25,011,734
Closing stock of finished goods - note 16 (725,027) (509,236) (58,912) (207,554) (246,547) (246,586) (774,839) (837,505) (233,838) (141,658) (2,039,163) (1,942,539)
Provision for obsolete stocks- note 27 - - (2,615) - (21,969) (24,332) (10,676) (9,285) (20,250) (5,000) (55,510) (38,617)
15,620,929 11,794,598 5,074,124 3,896,339 3,333,661 2,986,743 2,681,386 2,383,614 2,151,010 1,969,284 28,861,110 23,030,578
25.1 Staff retirement benefits
Salaries, wages and benefits include Rs 162.681 million (2009: Rs 193.055 million) in respect of staff retirement benefits.
Amounts in Rs ’000
ICI Pakistan Limited Annual Report 2010 103

Amounts in Rs ’000
26. Selling and Distribution ExpensesPolyester Soda Ash Paints Life Sciences Chemicals Company
2010 2009 2010 2009 2010 2009 2010 2009 2010 2009 2010 2009
Salaries and benefits 46,473 40,591 21,759 24,581 220,879 195,676 197,442 184,344 61,696 63,531 548,249 508,723
Repairs and maintenance 14 122 1,079 1,063 3,933 3,537 2,179 1,862 1,381 1,033 8,586 7,617
Advertising and publicity expenses 1,163 15,480 10,948 896 253,121 262,189 86,049 64,513 817 987 352,098 344,065
Rent, rates and taxes - - 1,282 922 19,323 23,491 5,897 4,404 739 1,182 27,241 29,999
Insurance - - 1,028 434 - - 6,522 3,866 3,530 3,340 11,080 7,640
Lighting, heating and cooling 15 17 1,088 873 6,683 4,807 2,297 1,969 2,164 1,980 12,247 9,646
Depreciation & amortisation charge - note 10.5 & 11.1 - 59 277 327 - - 11,093 11,195 2,151 1,784 13,521 13,365
Outward freight and handling 9,626 7,078 149,095 69,972 179,945 172,953 35,329 22,395 31,538 28,089 405,533 300,487
Travelling expenses 7,022 3,206 2,703 1,882 30,082 30,588 68,932 63,407 12,171 11,567 120,910 110,650
Postage, telegram, telephone and telex 529 423 1,325 774 7,046 5,801 10,728 9,759 3,688 3,447 23,316 20,204
General expenses 7,701 8,260 12,589 10,499 44,063 26,072 66,568 56,986 21,017 15,961 151,938 117,778
72,543 75,236 203,173 112,223 765,075 725,114 493,036 424,700 140,892 132,901 1,674,719 1,470,174
26.1 Staff retirement benefits
Salaries, wages and benefits include Rs 81.569 million (2009: Rs 67.593 million) in respect of staff retirement benefits.
27. Administration and General Expenses
Salaries and benefits 129,271 134,531 191,647 193,284 168,579 134,481 85,980 93,672 81,934 72,479 657,411 628,447
Repairs and maintenance 2,986 2,715 3,930 3,478 9,147 8,828 1,872 1,352 1,003 780 18,938 17,153
Advertising and publicity expenses 1,837 2,855 3,681 6,013 1,372 1,807 788 1,134 866 1,452 8,544 13,261
Rent, rates and taxes 2,675 2,551 2,954 2,877 5,060 6,302 649 543 680 587 12,018 12,860
Insurance 735 552 1,858 1,454 692 7,438 3,857 2,137 425 316 7,567 11,897
Lighting, heating and cooling 3,637 3,172 6,200 5,273 4,655 3,518 4,664 3,590 1,416 1,077 20,572 16,630
Depreciation & amortisation charge
- note 10.5 & 11.1 15,070 6,332 19,781 13,347 15,439 11,573 4,124 2,618 9,651 4,274 64,065 38,144
Provision fordoubtful debts
- trade - note 39.6 - 5,610 - - 138,262 69,040 477 7 401 641 139,140 75,298
- others - note 20.3 & 39.6 - - 381 - 2,500 - 623 - - - 3,504 -
Provision for obsolete stocks - Note 16.1 - - 2,615 - 21,969 24,332 10,676 9,285 20,250 5,000 55,510 38,617
Provision for obsolete spares - Note 15.1 59,100 40,000 - - 5,000 - - - - - 64,100 40,000
Travelling expenses 10,138 6,491 9,652 8,142 12,732 14,626 6,192 5,631 6,791 5,349 45,505 40,239
Postage, telegram, telephone and telex 2,329 1,337 3,948 2,149 5,814 8,999 2,891 2,516 1,678 1,148 16,660 16,149
General expenses 37,413 32,965 44,061 55,804 57,652 91,005 25,449 14,622 20,896 34,973 185,471 229,369
265,191 239,111 290,708 291,821 448,873 381,949 148,242 137,107 145,991 128,076 1,299,005 1,178,064
27.1 Staff retirement benefits
Salaries, wages and benefits include Rs 148.813 million (2009: Rs 132.772 million) in respect of staff retirement benefits.
104 Annual Report 2010 ICI Pakistan Limited
Notes to the Financial StatementsFor the year ended December 31, 2010

28. Financial Charges
Mark-up on short-term financing - 1,587
Interest on workers' profit participation fund - note 8.3 6,948 2,105
Discounting charges on receivables 94,940 82,383
Exchange losses 59,564 74,454
Interest on security deposits and others 2,428 7,012
163,880 167,541
29. Other Operating Charges
Auditors' remuneration - note 29.1 8,235 6,600
Donations - note 29.2 22,277 16,464
Workers' profit participation fund - note 8.3 196,761 161,822
Workers' welfare fund 76,153 62,704
303,426 247,590
29.1 Auditors' remuneration
Audit and Group reporting fee 5,770 4,950
Half yearly review and other certifications 1,815 1,015
Out of pocket expenses 650 635
8,235 6,600
29.2 Donations include Rs 15.795 million (2009: Rs 13.97 million) to ICI Pakistan Foundation (Head office, Karachi). Mr. Waqar A Malik,Chief Executive; Mr. Ali Asrar Aga and Mr. Feroz Rizvi, Directors of the Company and Mr. Suhail Aslam Khan and Ms.Seemi Saad,Executives of the Company are amongst the Trustees of the Foundation.
30. Other Operating Income
Income from related parties
Return on loan due from Subsidiary 69,051 60,629
Service fees from related parties - note 30.1 1,980 4,636
Return from other financial assets
Profit on short-term and call deposits 282,906 167,995
Income from non-financial assets
Scrap sales 48,724 56,988
Gain on disposal of property, plant and equipment 10,211 5,293
Others
Provisions and accruals no longer required written back 15,964 104,768
Income on technical assistance - 244
Income on sale of Adhesive to Henkel - 14,662
Sundries 57,420 44,768
486,256 459,983
30.1 This represents amount charged by the Company for certain management and other services rendered to its related parties (LottePakistan PTA Limited, upto September 2009, and ICI Pakistan PowerGen Limited), in accordance with the Service Agreementsbased on commercial terms between the companies.
Amounts in Rs ’000
2010 2009
ICI Pakistan Limited Annual Report 2010 105

Amounts in Rs ’000
31. Taxation
Current 1,457,540 490,813
Prior years - (17,439)
Total current tax charge 1,457,540 473,374
Deferred - note 7 (154,850) 554,394
Net tax charged - note 31.1 1,302,690 1,027,768
31.1 Tax reconciliation
Profit before tax 3,731,516 3,072,506
Tax @ 35% 1,306,031 1,075,377
Prior years' tax charge - (17,439)
Tax impact on income under FTR of the current year 2,992 (40,712)
Permanent difference - 5,762
Other (6,333) 4,780
Net tax charged 1,302,690 1,027,768
32. Earnings per share - Basic and diluted
Profit after taxation for the year 2,428,826 2,044,738
Number of sharesWeighted average number of ordinary shares in issue during the year 138,802,300 138,802,300
RupeesEarnings per share 17.50 14.73
33. Remuneration of Directors and Executives
The aggregate amounts charged in the financial statements for the remuneration, including all benefits, to the Chairman, ChiefExecutive, Directors and Executives of the Company were as follows:
Chairman Chief Executive Directors Executives Total
2010 2009 2010 2009 2010 2009 2010 2009 2010 2009
Managerial remuneration 1,230 1,162 25,363 21,135 34,209 33,863 501,721 418,814 562,523 474,974
Retirement benefits - - 6,362 5,321 7,555 7,383 144,796 107,981 158,713 120,685
Group insurance - - 42 42 84 126 5,062 4,512 5,188 4,680
Rent and house maintenance - - 6,022 5,268 - - 148,163 122,368 154,185 127,636
Utilities - - 775 647 - - 36,656 30,310 37,431 30,957
Medical expenses - - 91 203 221 419 19,661 15,410 19,973 16,032
1,230 1,162 38,655 32,616 42,069 41,791 856,059 699,395 938,013 774,964
Number of persons 1 1 1 1 4 5 381 328 387 335
2010 2009
106 Annual Report 2010 ICI Pakistan Limited
Notes to the Financial StatementsFor the year ended December 31, 2010

Amounts in Rs ’000
33.1 In addition to this, an amount of Rs 228.9 million (2009: Rs 209.8 million) on account of variable pay, to employees, has beenrecognised in the current year. This amount is payable in 2011 after verification of achievements against target. Further, a specialbonus of Rs 12.0 million (2009: Rs 28.9 million) payable to certain employees has been recognised in the financial statementswhich is payable in 2011.
Out of variable pay recognised for 2009 and 2008 following payments were made:Paid in 2010 Paid in 2009relating to relating to
2009 2008
Chief Executive 13,163 11,765
Directors 33,529 11,400
Executives 125,444 92,752
Other employees 9,192 37,131
181,328 153,048
33.2 The Directors and certain Executives are provided with free use of Company cars in accordance with their entitlement. The ChiefExecutive is provided with Company maintained furnished accommodation and free use of Company car.
33.3 Aggregate amount charged in the financial statements for remuneration to three Non-executive Directors was Rs 3.225 million(2009: Rs 3.228 million). This includes fees paid to directors amounting to Rs. 0.220 million (2009: Rs. 0.249 million) for attendingboard and other meetings which is not included above.
33.4 The above balances include an amount of Rs 188.114 million (2009: Rs 141.359 million) on account of remuneration of keymanagement personnel out of which Rs 26.274 million (2009: Rs 24.356 million) relates to post employment benefits.
34. Transactions with Related Parties
The related parties comprise parent company (ICI Omicron B.V.), ultimate parent company (AkzoNobel N.V.), related groupcompanies, local associated company, directors of the Company, companies where directors also hold directorship, key employees(note 33) and staff retirement funds (note 6). Details of transactions with related parties, other than those which have beenspecifically disclosed elsewhere in these financial statements are as follows:
2010 2009
Subsidiary Company
Purchase of goods, materials and services 956,672 676,003
Provision of services and other receipts 1,980 1,980
Return on loan to Subsidiary 69,051 60,629
Loan to subsidiary company - (net of repayment) - 96,000
Stand by finance facility availed by Subsidiary - 283,000
Associated companies
Purchase of goods, materials and services 118,487 5,750,335
Provision of services and other receipts 4,600 6,440
Sale of goods and materials 131,099 126,429
Dividends 1,052,291 789,218
Donations 15,795 13,970
ICI Pakistan Limited Annual Report 2010 107

Amounts in Rs ’000
35. Plant Capacity and Annual Production
- in metric tonnes except Paints which is in thousands of litres:
2010 2009
Annual Production Annual ProductionName Plate Name Plate
Capacity Capacity
Polyester 122,000 129,445 122,000 123,642
Soda Ash - note 35.1 350,000 278,650 350,000 269,500
Paints - note 35.2 - 34,748 - 33,741
Chemicals - note 35.2 - 9,082 - 8,477
Sodium Bicarbonate 20,000 23,700 20,000 22,580
35.1 Production was below name plate capacity due to gas curtailment.
35.2 The capacity of Paints and Chemicals is indeterminable because these are multi-product plants.
36. Fair Value of Financial Assets and Liabilities
The carrying amounts of the financial assets and financial liabilities approximate their fair values and is determined on the basisof non observable market data.
37. Financial Risk Management
The Company's activities expose it to a variety of financial risks: market risk (including currency risk, interest rate risk and pricerisk), credit risk and liquidity risk. The Company's overall risk management policy focuses on the unpredictability of financial marketsand seeks to minimize potential adverse effects on the Company's financial performance.
37.1 Risk Management Framework
The Board of Directors has overall responsibility for establishment and over sight of the Company's risk management framework.The executives management team is responsible for developing and monitoring the Company’s risk management policies. Theteam regularly meets and any changes and compliance issues are reported to the Board of Directors through the audit committee.
Risk management systems are reviewed regularly by the executive management team to reflect changes in market conditionsand the Company’s activities. The Company, through its training and management standards and procedures, aims to develop adisciplined and constructive control environment in which all employees understand their roles and obligations.
The audit committee oversees compliance by management with the Company’s risk management policies and procedures, andreviews the adequacy of the risk management framework in relation to the risks faced by the Company.
38. Market Risk
Market risk is the risk that the fair value or future cash flows of a financial instrument will fluctuate because of changes in marketprices. Market risk comprises of interest rate risk, currency risk and other price risk.
108 Annual Report 2010 ICI Pakistan Limited
Notes to the Financial StatementsFor the year ended December 31, 2010

Amounts in Rs ’000
2010 2009
38.1 Interest Rate Risk
Interest rate risk is the risk that the fair values of future cash flows of a financial instrument will fluctuate because of changes inmarket interest rates. At the reporting date the interest rate profile of Company's interest-bearing financial instruments were:
Carrying Amount
Fixed rate instrumentsFinancial assets - Note 21 2,927,000 3,350,000Financial liabilities - Note 8 (80,700) (71,993)
2,846,300 3,278,007
Variable rate instrumentsFinancial assets - Note 13 & 18 483,000 483,000
Sensitivity analysis for fixed rate instrumentsThe Company does not account for any fixed rate financial assets and liabilities at fair value through profit or loss, therefore achange in interest rates at the reporting date would not affect profit and loss.
Sensitivity analysis for variable rate instrumentsIf KIBOR had been 1% higher / lower with all other variables held constant, the impact on the profit after tax for the year wouldhave been Rs 4.83 million (2009: Rs 4.83 million).
38.2 Foreign currency risk
Foreign currency risk is the risk that the fair value or future cash flows of a financial instrument will fluctuate because of changesin foreign exchange rates. Foreign currency risk arises mainly where receivables and payables exist due to transactions enteredin foreign currencies. The Company is exposed to foreign currency risk on sales, purchases and borrowings, which, are enteredin a currency other than Pak Rupees. However, the forward foreign exchange contracts were not available for imports in 2010 inaccordance with State Bank of Pakistan instructions.
SGD EURO USD GBP JPY2010
Trade debts - - 9,641 - -Other receivables - 10,859 17,665 11,812 -Due from Associates - note 20.2 - - 135 78,586 -Cash and bank balances - - 98,227 - - - 10,859 125,668 90,398 -Trade and other payables - 107,789 1,235,916 662,294 -Accrued interest / return on unsecured loan - note 8.2 - - 305,109 - -Due to Associates - note 8.1 15 59,580 21,607 1,371 -
15 167,369 1,562,632 663,665 -Gross balance sheet exposure (15) (156,510) (1,436,964) (573,267) -
2009Trade debts - 2,800 11,667 - -Other receivables - - 123,427 - -Due from Associates - note 20.2 - - 4,805 80,420 -Cash and bank balances - - 62,287 - -
- 2,800 202,186 80,420 -Trade and other payables 4,719 57,646 1,687,759 504,207 5,293Accrued interest / return on unsecured loan - note 8.2 - - 299,647 - -Due to Associates - note 8.1 26,105 5,340 4,774 7,029 -
30,824 62,986 1,992,180 511,236 5,293Gross balance sheet exposure (30,824) (60,186) (1,789,994) (430,816) (5,293)
Significant exchange rates applied during the year were as follows:Average rate for the year Spot rate as at December 312010 2009 2010 2009
Rupees per Rupees Rupees
EURO 113.09 113.84 114.30 121.37USD 85.18 81.69 85.75 84.24GBP 131.75 127.85 132.72 137.81JPY 0.97 0.87 1.05 0.91SGD 62.55 56.52 66.87 60.06
ICI Pakistan Limited Annual Report 2010 109

Sensitivity analysis Every 1% increase or decrease in exchange rate with all other variables held constant will increase or decrease profit after taxfor the year by Rs 21.7 million (2009: Rs 23.2 million).
39. Credit Risk
Credit risk represents the accounting loss that would be recognised at the reporting date if counter-parties failed completely to performas contracted. The Company does not have significant exposure to any individual counterparty. To reduce exposure to credit riskthe Company has developed a formal approval process whereby credit limits are applied to its customers. The management alsocontinuously monitors the credit exposure towards the customers and makes provision against those balances considered doubtfulof recovery. To mitigate the risk, the Company has a system of assigning credit limits to its customers based on an extensive evaluationbased on customer profile and payment history. Outstanding customer receivables are regularly monitored. Business with customersis also secured, where possible, by way of inland letters of credit, cash security deposit and bank guarantees.
The Company's maximum exposure to credit risk at the reporting date is as follows:
39.1 Financial Assets
Long Term Investments - note 12 712,500 712,500
Long term loans - note 13 324,264 330,801
Long term deposits - note 14 22,873 21,211
Trade debts - note 17 792,867 919,463
Loans and advances - note 18 590,722 406,739
Trade deposits - note 19 22,245 21,700
Other receivables - note 20 336,465 464,867
Bank balances - note 21 4,647,662 4,456,428
7,449,598 7,333,709
39.2 The Company has placed its funds with banks which are rated A-1 by Standard & Poor's and P-1 by Moody's.
39.3 Financial Assets
- Secured 494,696 545,239
- Unsecured 6,954,902 6,788,470
7,449,598 7,333,709
39.4 The ageing of bank balances, trade debts and loans and advances at the reporting date is as follows:
Not past due 5,893,674 5,461,849
Past due but not Impaired:
Not more than three months 122,131 281,317
Past due and Impaired:
more than three months and not more than six months 30,893 63,002
more than six months and not more than nine months 12,327 25,352
more than nine months and not more than one year 27,165 43,378
more than one year 299,171 193,483
491,687 606,532
Less: Provision for:
- Doubtful debts 343,490 277,631
- Doubtful loans and advances 10,620 8,120
354,110 285,751
6,031,251 5,782,630
Amounts in Rs ’000
2010 2009
110 Annual Report 2010 ICI Pakistan Limited
Notes to the Financial StatementsFor the year ended December 31, 2010

39.5 The maximum exposure to credit risk for past due and impaired at the reporting date by type of counterparty was:
Wholesale customers 202,884 138,510
Retail customers 109,691 284,408
End-user customers 179,112 183,614
491,687 606,532
Less: Provision for:
- Doubtful debts 343,490 277,631
- Doubtful loans and advances 10,620 8,120
354,110 285,751
137,577 320,781
39.6 Movement of provision for trade debts and loans and advances:
Trade Debts Loans and Total Advances
Opening 277,631 8,120 285,751 201,483
Additional provision - note 27 139,140 2,500 141,640 75,298
(Write-off) / Provision utilised against write-offs (57,409) - (57,409) 9,646
Provision no longer required (15,872) - (15,872) (676)
343,490 10,620 354,110 285,751
39.6.1 The recommended approach for provision is to assess the top layer (covering 50%) of trade receivables on an individual basisand apply a dynamic approach to the remainder of receivables. The procedure introduces a company-standard for dynamicprovisioning:• Provide impairment loss for 50% of the outstanding receivable when overdue more than 90 days, and• Provide an impairment loss for 100% when overdue more than 120 days.
39.7 Concentration Risk
The sector wise analysis of receivables, comprising trade debts, loans and advances and bank balances are given below:
Textile 66,590 217,085
Glass 14,415 22,679
Ceramics - 2,985
Paper and Board 24,641 18,137
Chemicals 240,731 232,624
Pharmaceuticals 36,880 18,799
Construction 12,701 31,972
Transport 36,976 60,264
Paints 621,046 516,308
Bank 4,647,662 4,456,428
Subsidiary 283,000 283,000
Others 400,719 208,100
6,385,361 6,068,381
Less: Provision for:
- Doubtful debts 343,490 277,631
- Doubtful loans and advances 10,620 8,120
354,110 285,751
6,031,251 5,782,630
2010 2009
Amounts in Rs ’000
ICI Pakistan Limited Annual Report 2010 111
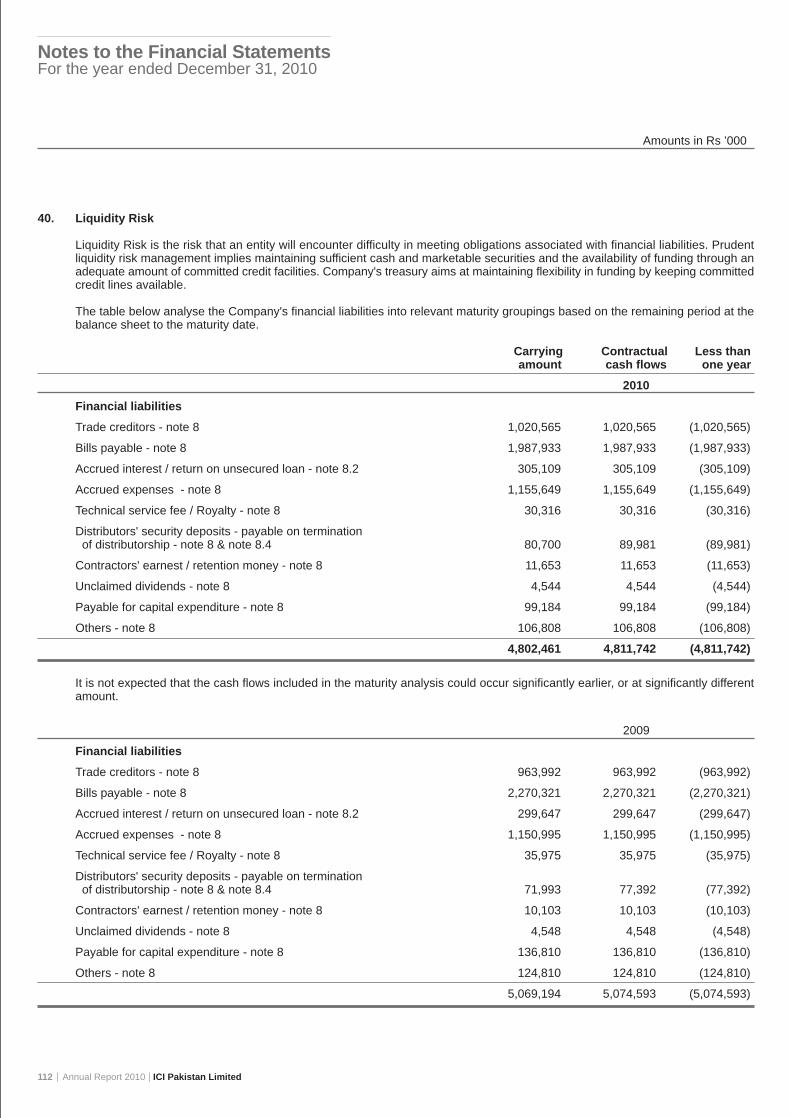
40. Liquidity Risk
Liquidity Risk is the risk that an entity will encounter difficulty in meeting obligations associated with financial liabilities. Prudentliquidity risk management implies maintaining sufficient cash and marketable securities and the availability of funding through anadequate amount of committed credit facilities. Company's treasury aims at maintaining flexibility in funding by keeping committedcredit lines available.
The table below analyse the Company's financial liabilities into relevant maturity groupings based on the remaining period at thebalance sheet to the maturity date.
Carrying Contractual Less than amount cash flows one year
2010
Financial liabilities
Trade creditors - note 8 1,020,565 1,020,565 (1,020,565)
Bills payable - note 8 1,987,933 1,987,933 (1,987,933)
Accrued interest / return on unsecured loan - note 8.2 305,109 305,109 (305,109)
Accrued expenses - note 8 1,155,649 1,155,649 (1,155,649)
Technical service fee / Royalty - note 8 30,316 30,316 (30,316)
Distributors' security deposits - payable on termination of distributorship - note 8 & note 8.4 80,700 89,981 (89,981)
Contractors' earnest / retention money - note 8 11,653 11,653 (11,653)
Unclaimed dividends - note 8 4,544 4,544 (4,544)
Payable for capital expenditure - note 8 99,184 99,184 (99,184)
Others - note 8 106,808 106,808 (106,808)
4,802,461 4,811,742 (4,811,742)
It is not expected that the cash flows included in the maturity analysis could occur significantly earlier, or at significantly differentamount.
2009
Financial liabilities
Trade creditors - note 8 963,992 963,992 (963,992)
Bills payable - note 8 2,270,321 2,270,321 (2,270,321)
Accrued interest / return on unsecured loan - note 8.2 299,647 299,647 (299,647)
Accrued expenses - note 8 1,150,995 1,150,995 (1,150,995)
Technical service fee / Royalty - note 8 35,975 35,975 (35,975)
Distributors' security deposits - payable on termination of distributorship - note 8 & note 8.4 71,993 77,392 (77,392)
Contractors' earnest / retention money - note 8 10,103 10,103 (10,103)
Unclaimed dividends - note 8 4,548 4,548 (4,548)
Payable for capital expenditure - note 8 136,810 136,810 (136,810)
Others - note 8 124,810 124,810 (124,810)
5,069,194 5,074,593 (5,074,593)
Amounts in Rs ’000
112 Annual Report 2010 ICI Pakistan Limited
Notes to the Financial StatementsFor the year ended December 31, 2010

41. Capital Risk Management
The Company's objective when managing capital is to safe guard the Company's ability to continue as a going concern so that itcan continue to provide returns for shareholders and benefits for other stakeholders; and to maintain a strong capital base tosupport the sustained development of its businesses.
The Company manages its capital structure by monitoring return on net assets and makes adjustments to it in the light of changesin economic conditions. In order to maintain or adjust the capital structure, the Company may adjust the amount of dividend paidto shareholders or issue new shares.
42. Accounting Estimates and Judgements
Income Taxes
The Company takes into account the current income tax law and decisions taken by appellate authorities. Instances where theCompany's view differs from the view taken by the income tax department at the assessment stage and where the Companyconsiders that its view on items of material nature is in accordance with law, the amounts are shown as contingent liabilities (unlessthere is remote possibility of transfer of benefits).
The Income Tax Appellate Tribunal earlier set aside the assessment for the assessment year 1998-99 on the issues of date ofcommissioning of PTA plant & depreciation thereon, restriction of cost of capitalisation of PTA plant and addition to income inrespect of trial production stocks. The re-assessment was finalised by the department during the year giving rise to an additionaltax demand. The Company has filed an appeal against the said order before the CIT(Appeals), hearing of appeal has beencompleted and the order is awaited.
The tax department reopened the income tax assessment for the assessment year 2001-2002 on the ground that demerger ofPTA business from ICI Pakistan Ltd. was effective from the completion date i.e. August 6, 2001. This was challenged by theCompany in the High Court which upheld the Company’s contention that the department did not have the right to reopen thisfinalised assessment. The department filed an appeal in the Supreme Court against the High Court’s order. The appeal wasdismissed by the Supreme Court.
For the assessment year 2002-2003 on receipt of notice under section 62 of the Income Tax Ordinance, 1979, the Company hadfiled a writ petition in the Supreme Court challenging the tax department’s notice that the effective date of PTA’s demerger wasAugust 6, 2001 rather than the effective date given in the Scheme of Arrangement as October 1, 2000. That notice had raisedcertain issues relating to vesting of PTA assets by the company which has been settled in the assessment year 2001-2002. Whilethis case is pending for adjudication, in view of the Supreme Court's decision relating to assessment year 2001-2002 it is unlikelythat the department can take an adverse action.
Whilst amending the assessment for the Tax Year 2003 and 2004, tax department has taken certain action in the order, consideredby the department as “protective assessment” on the matter of unabsorbed depreciation carried forward. It is the Company’scontention that such an action is unwarranted. An appeal before the CIT (Appeals) , on the matter has been filed which is pending.The very basis of such an action have also been challenged before the High Court of Sindh which are pending for hearing. Whilethis case is pending for adjudication, in view of the Supreme Court's decision relating to assessment year 2001-2002 it is unlikelythat the department can take an adverse action.
Notice under section 221 of the Income Tax Ordinance 2001 for rectification of deemed assessment order for the Tax Year 2005has been issued to disallow unabsorbed depreciation carried forward. A writ petition against the said notice has been filed withthe High Court of Sindh which is pending for hearing. While this case is pending for adjudication, in view of the Supreme Court'sdecision relating to assessment year 2001-2002 it is unlikely that the department can take an adverse action.
Pension and Gratuity
Certain actuarial assumptions have been adopted as disclosed in note 6 to the financial statements for valuation of present valueof defined benefit obligations and fair value of plan assets. Any changes in these assumptions in future years might affectunrecognised gains and losses in those years.
ICI Pakistan Limited Annual Report 2010 113

Property, plant and equipment
The estimates for revalued amounts, if any, of different classes of property, plant and equipment, are based on valuation performedby external professional valuers and recommendation of technical teams of the Company. The said recommendations also includeestimates with respect to residual values and depreciable lives. Further, the Company reviews the value of the assets for possibleimpairment on an annual basis. The future cash flows used in the impairment testing of assets is based on management's bestestimates which may change in future periods. Any change in the estimates in future years might affect the carrying amounts ofthe respective items of property, plant and equipments with a corresponding affect on the depreciation charge and impairment.
43. Standards or Interpretations not yet effective
The following standards, amendments and interpretations of approved accounting standards are effective for accounting periodsbeginning on or after January 1, 2011. These standards are either not relevant to the Company's operations or are not expectedto have significant impact on the Company's financial statements:
Amendment to IAS 32 Financial Instruments: Presentation – Classification of Rights Issues (effective for annual periodsbeginning on or after February 01, 2010). The IASB amended IAS 32 to allow rights, options or warrants to acquire a fixednumber of the entity’s own equity instruments for a fixed amount of any currency to be classified as equity instruments providedthe entity offers the rights, options or warrants pro rata to all of its existing owners of the same class of its own non-derivativeequity instruments. This interpretation has no impact on the Company's financial statements.
IFRIC 19 Extinguishing Financial Liabilities with Equity Instruments (effective for annual periods beginning on or afterJuly 01, 2010). This interpretation provides guidance on the accounting for debt for equity swaps. This interpretation has no impacton Company's financial statements.
IAS 24 Related Party Disclosures (revised 2009) – effective for annual periods beginning on or after January 01, 2011.The revision amends the definition of a related party and modifies certain related party disclosure requirements for government-related entities. The amendment in future may result in certain changes in disclosures.
Amendments to IFRIC 14 IAS 19 – The Limit on a Defined Benefit Assets, Minimum Funding Requirements and theirInteraction (effective for annual periods beginning on or after January 01, 2011). These amendments remove unintendedconsequences arising from the treatment of prepayments where there is a minimum funding requirement. These amendmentsresult in prepayments of contributions in certain circumstances being recognised as an asset rather than an expense. Thisamendment is not likely to have any impact on Company's financial statements.
Improvements to IFRSs 2010 – In May 2010, the IASB issued improvements to IFRSs 2010, which comprise of 11 amendmentsto 7 standards. Effective dates, early application and transitional requirements are addressed on a standard by standard basis.The majority of amendments are effective for annual periods beginning on or after January 1, 2011. The amendments include listof events or transactions that require disclosure in the interim financial statements and fair value of award credits under thecustomer loyalty programmes to take into account the amount of discounts or incentives that otherwise would be offered tocustomers that have not earned the award credits. Certain of these amendments will result in increased disclosures in the financialstatements.
Amendments to IAS 12 – deferred tax on investment property (effective for annual periods beginning on or after January1, 2012). The 2010 amendment provides an exception to the measurement principle in respect of investment property measuredusing the fair value model in accordance with IAS 40 Investment Property. The amendment has no impact on financial statementsof the Company.
Amendments to IFRS 7 - Disclosures – Transfers of Financial Assets (effective for annual periods beginning on or afterJuly 1, 2011). The amendments introduce new disclosure requirements about transfers of financial assets including disclosuresfor financial assets that are not derecognised in their entirety; and financial assets that are derecognised in their entirety but forwhich the entity retains continuing involvement. These amendments will result in increased disclosures in the financial statements.
114 Annual Report 2010 ICI Pakistan Limited
Notes to the Financial StatementsFor the year ended December 31, 2010

44. Dividend
The directors in their meeting held on February 16, 2011 have recommended a final dividend of Rs 12.00 per share (2009: Rs4.50 per share) in respect of year ended December 31, 2010. The financial statements for the year ended December 31, 2010do not include the effect of the above dividend which will be accounted for in the period in which it is approved.
45. Date of Authorisation
These financial statements were authorised for issue in the Board of Directors meeting held on February 16, 2011.
46. General
46.1 Figures have been rounded off to the nearest thousand rupees except stated otherwise.
46.2 Corresponding Figures
Corresponding figures have been rearranged and reclassified, wherever necessary, for better presentation and disclosure.
Reclassification from component Reclassification to component Amounts in Rs '000
Administration and General Expenses Administration and General Expenses 1,807 -General expenses -Advertising and publicity expenses
Selling and Distribution Expenses Selling and Distribution Expenses -General expenses -Lighting, heating and cooling 1,774
M J Jaffer Waqar A Malik Feroz RizviChairman / Director Chief Executive Chief Financial Officer
ICI Pakistan Limited Annual Report 2010 115

2001 2002 2003* 2004* 2005** 2006 2007 2008 2009 2010Restated Restated Restated
Balance Sheet
Equity and Revaluation Reserve 5,384,581 6,775,438 6,141,682 8,641,044 9,987,387 11,389,230 12,380,997 13,410,921 14,414,642 15,455,445Non Current Liability 66,173 78,895 74,568 82,601 90,604 104,079 119,571 612,954 1,208,117 1,093,190Current Liabilities 7,945,475 6,932,541 7,915,577 5,205,018 5,891,930 5,436,275 6,263,805 4,446,810 5,799,898 5,482,037
Total Equity and Liabilities 13,396,229 13,786,874 14,131,827 13,928,663 15,969,921 16,929,584 18,764,373 18,470,685 21,422,657 22,030,672
Non Current Assets 8,685,242 9,168,174 8,825,935 6,738,979 9,469,783 9,905,729 9,741,603 10,435,258 10,297,489 10,152,415Current Assets 4,710,987 4,618,700 5,305,892 7,189,684 6,500,138 7,023,855 9,022,770 8,035,427 11,125,168 11,878,257
Total Assets 13,396,229 13,786,874 14,131,827 13,928,663 15,969,921 16,929,584 18,764,373 18,470,685 21,422,657 22,030,672
Profit and Loss AccountTurnover 12,815,431 15,073,813 17,572,075 20,865,798 21,054,298 21,947,688 25,988,351 31,921,873 32,399,181 39,532,506Net sales, commission & toll income 10,569,573 12,218,937 18,127,295 17,639,480 18,476,457 19,574,118 23,024,123 27,798,915 28,429,897 35,129,980Cost of sales 8,104,169 9,891,842 15,462,928 14,883,771 15,124,759 15,492,648 18,205,369 22,303,138 22,754,005 28,443,690Gross profit 2,465,404 2,327,095 2,664,367 2,755,709 3,351,698 4,081,470 4,818,754 5,495,777 5,675,892 6,686,290Operating result 1,398,862 1,077,114 1,087,681 1,346,788 1,842,542 2,479,018 2,984,004 3,052,360 3,027,654 3,712,566Profit before taxation 619,777 723,094 806,552 1,110,450 1,612,401 2,117,797 2,768,523 2,812,778 3,072,506 3,731,516Profit after taxation 566,618 1,854,732 766,244 1,057,868 1,572,257 1,455,628 1,784,800 1,862,738 2,044,738 2,428,826
Summary of Cash FlowsCash generated from operations 2,142,354 1,819,224 2,139,564 1,916,503 2,666,900 3,554,048 4,312,406 1,188,392 4,938,310 3,716,187Net cash generated from operating activities 980,784 1,026,536 1,933,065 1,823,927 2,521,959 3,477,093 4,093,537 969,809 4,476,231 2,334,428Net cash used in investing activities (788,962) (32,549) (103,226) 3,379,171 (1,420,757) (1,040,183) (1,397,436) (1,780,969) (938,043) (752,830)Net cash used in financing activities 70,652 (965,730) (1,261,623) (4,542,451) (1,118,221) (2,337,028) (868,583) (832,815) (1,041,018) (1,388,027)Cash and cash equivalents at December 31 447,555 475,812 1,044,028 1,704,675 1,687,656 1,787,538 3,615,056 1,971,081 4,468,251 4,661,822
Ratios
Profitability Ratios
Gross margin % 23.33 19.04 14.70 15.62 18.14 20.85 20.93 19.77 19.96 19.03
Gross profit turnover % 19.24 15.44 15.16 13.21 15.92 18.60 18.54 17.22 17.52 16.91
Operating margin % 13.23 8.82 6.00 7.64 9.97 12.66 12.96 10.98 10.65 10.57
Net Profit margin % 5.36 15.18 4.23 6.00 8.51 7.44 7.75 6.70 7.19 6.91
Profit markup % 30.42 23.53 17.23 18.51 22.16 26.34 26.47 24.64 24.94 23.51
Profit before tax margin % 5.86 5.92 4.45 6.30 8.73 10.82 12.02 10.12 10.81 10.62
Return on equity % 24.05 40.40 14.03 13.13 16.56 14.18 15.70 14.96 15.17 16.70
Return on capital employed % 25.66 15.71 17.50 15.44 18.28 21.57 23.87 21.77 19.38 22.43
Return on assets % 4.23 13.45 5.42 7.59 9.85 8.60 9.51 10.08 9.54 11.02
Return on fixed assets % 23.53 18.76 19.68 25.01 25.18 29.46 34.92 32.61 32.82 40.91
Growth Ratios
Net sales % 8.03 15.60 48.35 (2.69) 4.74 5.94 17.63 20.74 2.27 23.57
Operating results % (9.29) (23.00) 0.98 23.82 36.81 34.54 20.37 2.29 (0.81) 22.62
EBITDA % (41.64) (15.42) 1.61 16.80 25.34 25.95 20.58 - 1.04 19.45
Profit after tax % (52.88) 227.33 (58.69) 38.06 48.63 (7.42) 22.61 4.37 9.77 18.78
Operating working capital % (31.08) (11.43) 53.16 (104.67) (324.95) (199.82) (118.86) 218.10 (82.19) 320.64
Comparison of Results for Ten YearsAs at December 31
116 Annual Report 2010 ICI Pakistan Limited

2001 2002 2003* 2004* 2005** 2006 2007 2008 2009 2010Restated Restated Restated
Balance Sheet
Equity and Revaluation Reserve 5,384,581 6,775,438 6,141,682 8,641,044 9,987,387 11,389,230 12,380,997 13,410,921 14,414,642 15,455,445Non Current Liability 66,173 78,895 74,568 82,601 90,604 104,079 119,571 612,954 1,208,117 1,093,190Current Liabilities 7,945,475 6,932,541 7,915,577 5,205,018 5,891,930 5,436,275 6,263,805 4,446,810 5,799,898 5,482,037
Total Equity and Liabilities 13,396,229 13,786,874 14,131,827 13,928,663 15,969,921 16,929,584 18,764,373 18,470,685 21,422,657 22,030,672
Non Current Assets 8,685,242 9,168,174 8,825,935 6,738,979 9,469,783 9,905,729 9,741,603 10,435,258 10,297,489 10,152,415Current Assets 4,710,987 4,618,700 5,305,892 7,189,684 6,500,138 7,023,855 9,022,770 8,035,427 11,125,168 11,878,257
Total Assets 13,396,229 13,786,874 14,131,827 13,928,663 15,969,921 16,929,584 18,764,373 18,470,685 21,422,657 22,030,672
Profit and Loss AccountTurnover 12,815,431 15,073,813 17,572,075 20,865,798 21,054,298 21,947,688 25,988,351 31,921,873 32,399,181 39,532,506Net sales, commission & toll income 10,569,573 12,218,937 18,127,295 17,639,480 18,476,457 19,574,118 23,024,123 27,798,915 28,429,897 35,129,980Cost of sales 8,104,169 9,891,842 15,462,928 14,883,771 15,124,759 15,492,648 18,205,369 22,303,138 22,754,005 28,443,690Gross profit 2,465,404 2,327,095 2,664,367 2,755,709 3,351,698 4,081,470 4,818,754 5,495,777 5,675,892 6,686,290Operating result 1,398,862 1,077,114 1,087,681 1,346,788 1,842,542 2,479,018 2,984,004 3,052,360 3,027,654 3,712,566Profit before taxation 619,777 723,094 806,552 1,110,450 1,612,401 2,117,797 2,768,523 2,812,778 3,072,506 3,731,516Profit after taxation 566,618 1,854,732 766,244 1,057,868 1,572,257 1,455,628 1,784,800 1,862,738 2,044,738 2,428,826
Summary of Cash FlowsCash generated from operations 2,142,354 1,819,224 2,139,564 1,916,503 2,666,900 3,554,048 4,312,406 1,188,392 4,938,310 3,716,187Net cash generated from operating activities 980,784 1,026,536 1,933,065 1,823,927 2,521,959 3,477,093 4,093,537 969,809 4,476,231 2,334,428Net cash used in investing activities (788,962) (32,549) (103,226) 3,379,171 (1,420,757) (1,040,183) (1,397,436) (1,780,969) (938,043) (752,830)Net cash used in financing activities 70,652 (965,730) (1,261,623) (4,542,451) (1,118,221) (2,337,028) (868,583) (832,815) (1,041,018) (1,388,027)Cash and cash equivalents at December 31 447,555 475,812 1,044,028 1,704,675 1,687,656 1,787,538 3,615,056 1,971,081 4,468,251 4,661,822
Ratios
Profitability Ratios
Gross margin % 23.33 19.04 14.70 15.62 18.14 20.85 20.93 19.77 19.96 19.03
Gross profit turnover % 19.24 15.44 15.16 13.21 15.92 18.60 18.54 17.22 17.52 16.91
Operating margin % 13.23 8.82 6.00 7.64 9.97 12.66 12.96 10.98 10.65 10.57
Net Profit margin % 5.36 15.18 4.23 6.00 8.51 7.44 7.75 6.70 7.19 6.91
Profit markup % 30.42 23.53 17.23 18.51 22.16 26.34 26.47 24.64 24.94 23.51
Profit before tax margin % 5.86 5.92 4.45 6.30 8.73 10.82 12.02 10.12 10.81 10.62
Return on equity % 24.05 40.40 14.03 13.13 16.56 14.18 15.70 14.96 15.17 16.70
Return on capital employed % 25.66 15.71 17.50 15.44 18.28 21.57 23.87 21.77 19.38 22.43
Return on assets % 4.23 13.45 5.42 7.59 9.85 8.60 9.51 10.08 9.54 11.02
Return on fixed assets % 23.53 18.76 19.68 25.01 25.18 29.46 34.92 32.61 32.82 40.91
Growth Ratios
Net sales % 8.03 15.60 48.35 (2.69) 4.74 5.94 17.63 20.74 2.27 23.57
Operating results % (9.29) (23.00) 0.98 23.82 36.81 34.54 20.37 2.29 (0.81) 22.62
EBITDA % (41.64) (15.42) 1.61 16.80 25.34 25.95 20.58 - 1.04 19.45
Profit after tax % (52.88) 227.33 (58.69) 38.06 48.63 (7.42) 22.61 4.37 9.77 18.78
Operating working capital % (31.08) (11.43) 53.16 (104.67) (324.95) (199.82) (118.86) 218.10 (82.19) 320.64
Amounts in Rs ’000
ICI Pakistan Limited Annual Report 2010 117

2001 2002 2003* 2004* 2005** 2006 2007 2008 2009 2010Restated Restated Restated
Efficiency Ratios
Asset turnover Times 0.79 0.89 1.28 1.27 1.16 1.16 1.23 1.51 1.33 1.59
Fixed asset turnover Times 1.78 2.13 3.28 3.28 2.52 2.33 2.69 2.97 3.08 3.87
Inventory turnover Times 3.16 4.14 5.73 4.16 4.73 5.07 6.24 6.39 6.08 6.71
Current asset turnover Times 2.24 2.65 3.42 2.45 2.84 2.79 2.55 3.46 2.56 2.96
Capital employed turnover Times 2.35 2.20 2.83 2.39 2.09 1.91 2.08 2.28 2.07 2.39
Operating working capital turnover Times 16.74 21.85 21.16 (440.62) (108.61) (38.38) (20.62) 21.09 121.06 35.56
Debtor turnover ratio Days 17.66 19.07 13.25 15.09 14.44 12.84 13.65 11.81 11.08 8.90
Creditor turnover ratio Days 58.03 79.58 56.35 75.62 78.70 75.90 78.24 50.52 41.00 40.06
Inventory turnover ratio Days 104.41 91.37 60.06 76.94 81.77 73.67 59.85 52.43 58.00 51.19
Operating cycle Days 64.03 30.86 16.96 16.41 17.52 10.62 (4.74) 13.72 28.08 20.03
Revenue per employee Rs'000 7,438 9,264 13,568 13,434 14,137 15,304 17,946 21,044 21,852 26,878
Net income per employee Rs'000 399 1406 574 806 1,203 1,138 1,391 1,410 1,572 1,858
Capex to sales % 8.01 4.09 2.53 3.12 7.77 5.53 4.65 5.45 2.91 2.43
Cost Ratios
Operating costs (% of sales) % 86.77 91.18 94.00 92.36 90.03 87.34 87.04 89.02 89.35 89.43
Administration costs (% of sales) % 4.14 4.20 3.26 3.77 3.75 3.71 3.30 4.05 4.14 3.70
Selling costs (% of sales) % 5.95 6.03 5.43 4.22 4.41 4.48 4.67 4.74 5.17 4.77
Interest cost (% of sales) *** % 5.99 3.44 2.11 1.44 1.50 1.45 0.44 0.32 - -
Equity Ratios
Price earnings ratio Rs 8.25 4.04 15.40 11.76 12.40 11.01 15.29 5.12 11.44 8.24
Earnings per share Rs 4.28 13.36 5.52 7.62 11.33 10.49 12.86 13.42 14.73 17.50
Dividend per share Rs 2.00 2.25 2.50 4.00 5.00 5.50 6.00 6.50 8.00 17.50
Dividend cover Times 2.14 5.94 2.21 1.91 2.27 1.91 2.14 2.06 1.84 1.00
Dividend (Declared for the year) Yield % 5.67 4.17 2.94 4.46 3.56 4.76 3.05 9.46 4.75 12.13
Dividend (Declared for the year) Payout % 48.99 16.84 45.29 52.48 44.14 52.45 46.66 48.43 54.31 100.01
Market value per share Rs 35.30 53.95 85.00 89.65 140.50 115.50 196.65 68.71 168.49 144.24
Break-up value per share with surplus on revaluation Rs 40.64 48.81 44.25 62.25 71.95 82.05 89.20 96.62 103.85 111.35
Break-up value per share excluding surplus on revaluation Rs 17.78 33.08 39.35 58.02 68.39 73.95 81.91 89.68 97.14 104.81
Liquidity Ratios
Current ratio Ratio 0.59:1 0.67:1 0.67:1 1.38:1 1.10:1 1.29:1 1.44:1 1.81:1 1.92:1 2.17:1
Quick / Acid test ratio Ratio 0.27:1 0.32:1 0.33:1 0.69:1 0.56:1 0.73:1 0.97:1 1.02:1 1.27:1 1.39:1
Cash ratio Ratio 0.06:1 0.07:1 0.13:1 0.33:1 0.29:1 0.33:1 0.58:1 0.44:1 0.77:1 0.85:1
Leverage Ratios
Debt to equity % 25.43 7.44 - 1.39 - 0.04 - - - -
Total debt to capital ratio Ratio 44:56 33:67 40:60 1:99 0:100 0:100 0:100 0:100 0:100 0:100
Interest cover *** Times 1.98 2.72 3.11 5.36 6.82 8.44 28.42 32.29 - -
* Excluding turnover of discontinued furnace oil and coal businesses. Also excluding oneoff profit on sale of PPTA shares in 2004.
** Excluding recognition of deferred tax credit in 2005
*** Interest cover and Interest cost (% of Sales) is zero in 2009 and 2010 due to net interest income
The comparatives (2002 to 2004) have not been restated due to change in accounting policy on adoption of IFRIC 4.
118 Annual Report 2010 ICI Pakistan Limited
Comparison of Results for Ten YearsAs at December 31

2001 2002 2003* 2004* 2005** 2006 2007 2008 2009 2010Restated Restated Restated
Efficiency Ratios
Asset turnover Times 0.79 0.89 1.28 1.27 1.16 1.16 1.23 1.51 1.33 1.59
Fixed asset turnover Times 1.78 2.13 3.28 3.28 2.52 2.33 2.69 2.97 3.08 3.87
Inventory turnover Times 3.16 4.14 5.73 4.16 4.73 5.07 6.24 6.39 6.08 6.71
Current asset turnover Times 2.24 2.65 3.42 2.45 2.84 2.79 2.55 3.46 2.56 2.96
Capital employed turnover Times 2.35 2.20 2.83 2.39 2.09 1.91 2.08 2.28 2.07 2.39
Operating working capital turnover Times 16.74 21.85 21.16 (440.62) (108.61) (38.38) (20.62) 21.09 121.06 35.56
Debtor turnover ratio Days 17.66 19.07 13.25 15.09 14.44 12.84 13.65 11.81 11.08 8.90
Creditor turnover ratio Days 58.03 79.58 56.35 75.62 78.70 75.90 78.24 50.52 41.00 40.06
Inventory turnover ratio Days 104.41 91.37 60.06 76.94 81.77 73.67 59.85 52.43 58.00 51.19
Operating cycle Days 64.03 30.86 16.96 16.41 17.52 10.62 (4.74) 13.72 28.08 20.03
Revenue per employee Rs'000 7,438 9,264 13,568 13,434 14,137 15,304 17,946 21,044 21,852 26,878
Net income per employee Rs'000 399 1406 574 806 1,203 1,138 1,391 1,410 1,572 1,858
Capex to sales % 8.01 4.09 2.53 3.12 7.77 5.53 4.65 5.45 2.91 2.43
Cost Ratios
Operating costs (% of sales) % 86.77 91.18 94.00 92.36 90.03 87.34 87.04 89.02 89.35 89.43
Administration costs (% of sales) % 4.14 4.20 3.26 3.77 3.75 3.71 3.30 4.05 4.14 3.70
Selling costs (% of sales) % 5.95 6.03 5.43 4.22 4.41 4.48 4.67 4.74 5.17 4.77
Interest cost (% of sales) *** % 5.99 3.44 2.11 1.44 1.50 1.45 0.44 0.32 - -
Equity Ratios
Price earnings ratio Rs 8.25 4.04 15.40 11.76 12.40 11.01 15.29 5.12 11.44 8.24
Earnings per share Rs 4.28 13.36 5.52 7.62 11.33 10.49 12.86 13.42 14.73 17.50
Dividend per share Rs 2.00 2.25 2.50 4.00 5.00 5.50 6.00 6.50 8.00 17.50
Dividend cover Times 2.14 5.94 2.21 1.91 2.27 1.91 2.14 2.06 1.84 1.00
Dividend (Declared for the year) Yield % 5.67 4.17 2.94 4.46 3.56 4.76 3.05 9.46 4.75 12.13
Dividend (Declared for the year) Payout % 48.99 16.84 45.29 52.48 44.14 52.45 46.66 48.43 54.31 100.01
Market value per share Rs 35.30 53.95 85.00 89.65 140.50 115.50 196.65 68.71 168.49 144.24
Break-up value per share with surplus on revaluation Rs 40.64 48.81 44.25 62.25 71.95 82.05 89.20 96.62 103.85 111.35
Break-up value per share excluding surplus on revaluation Rs 17.78 33.08 39.35 58.02 68.39 73.95 81.91 89.68 97.14 104.81
Liquidity Ratios
Current ratio Ratio 0.59:1 0.67:1 0.67:1 1.38:1 1.10:1 1.29:1 1.44:1 1.81:1 1.92:1 2.17:1
Quick / Acid test ratio Ratio 0.27:1 0.32:1 0.33:1 0.69:1 0.56:1 0.73:1 0.97:1 1.02:1 1.27:1 1.39:1
Cash ratio Ratio 0.06:1 0.07:1 0.13:1 0.33:1 0.29:1 0.33:1 0.58:1 0.44:1 0.77:1 0.85:1
Leverage Ratios
Debt to equity % 25.43 7.44 - 1.39 - 0.04 - - - -
Total debt to capital ratio Ratio 44:56 33:67 40:60 1:99 0:100 0:100 0:100 0:100 0:100 0:100
Interest cover *** Times 1.98 2.72 3.11 5.36 6.82 8.44 28.42 32.29 - -
* Excluding turnover of discontinued furnace oil and coal businesses. Also excluding oneoff profit on sale of PPTA shares in 2004.
** Excluding recognition of deferred tax credit in 2005
*** Interest cover and Interest cost (% of Sales) is zero in 2009 and 2010 due to net interest income
The comparatives (2002 to 2004) have not been restated due to change in accounting policy on adoption of IFRIC 4.
Amounts in Rs ’000
ICI Pakistan Limited Annual Report 2010 119

Pattern of Shareholdingas at December 31, 2010
No. of Shareholders Categories No. of SharesFrom To
6,019 1 100 210,680
3,952 101 500 951,275
1,103 501 1,000 827,890
1,194 1,001 5,000 2,589,118
157 5,001 10,000 1,167,584
57 10,001 15,000 706,314
36 15,001 20,000 641,154
20 20,001 25,000 462,120
16 25,001 30,000 452,616
6 30,001 35,000 187,953
7 35,001 40,000 260,510
5 40,001 45,000 209,766
7 45,001 50,000 332,693
5 50,001 55,000 265,210
5 55,001 60,000 290,532
2 60,001 65,000 122,284
1 65,001 70,000 68,579
7 70,001 75,000 512,497
1 75,001 80,000 75,700
2 80,001 85,000 167,000
1 85,001 90,000 89,282
1 90,001 95,000 92,101
1 95,001 100,000 100,000
1 100,001 105,000 104,830
2 110,001 115,000 224,634
1 115,001 120,000 116,600
2 145,001 150,000 300,000
1 150,001 155,000 150,217
2 165,001 170,000 337,800
2 170,001 175,000 350,000
1 175,001 180,000 179,873
1 190,001 195,000 191,500
120 Annual Report 2010 ICI Pakistan Limited

1 195,001 200,000 200,000
1 220,001 225,000 225,000
1 270,001 275,000 270,979
1 290,001 295,000 294,749
1 295,001 300,000 300,000
1 310,001 315,000 313,228
1 330,001 335,000 331,990
1 335,001 340,000 335,915
1 345,001 350,000 347,000
1 355,001 360,000 358,300
1 385,001 390,000 386,237
1 395,001 400,000 400,000
1 410,001 415,000 412,532
1 415,001 420,000 418,000
1 440,001 445,000 443,214
1 445,001 450,000 450,000
1 505,001 510,000 505,489
1 530,001 535,000 533,800
1 570,001 575,000 574,231
1 595,001 600,000 600,000
1 605,001 610,000 610,000
1 655,001 660,000 655,115
1 775,001 780,000 775,083
1 870,001 875,000 872,750
1 905,001 910,000 909,900
1 1,095,001 1,100,000 1,100,000
1 1,400,001 1,405,000 1,401,711
1 1,575,001 1,580,000 1,579,044
1 1,970,001 1,975,000 1,970,374
1 3,260,001 3,265,000 3,260,222
1 105,225,001 105,230,000 105,229,125
12,649 138,802,300
No. of Shareholders Categories No. of SharesFrom To
ICI Pakistan Limited Annual Report 2010 121

S.No. Categories of Shareholders No. of Shares Held PercentageShareholders
1 Associated Companies (a) 1 105,229,125 75.81
2 Investment Companies 12 5,788 0.00
3 Insurance Companies 7 2,694 0.00
4 Joint Stock Companies 25 9,122 0.01
5 Others 25 314,042 0.23
6 Financial Institutions 12 18,453 0.01
7 Modaraba Companies 3 176 0.00
8 Mutual Funds 6 764 0.00
9 Individuals 8,307 2,462,577 1.77
10 Central Depository Company (b) 4,251 30,759,559 22.16
TOTAL 12,649 138,802,300 100.00
(a) Represents the 75.81% shareholding of ICI Omicron, B.V. a subidiary of AkzoNobel N.V.
(b) Categories of Account Holders and Sub Account Holders as per Central Depository Register.
1 Insurance Companies 15 5,679,588 18.46
2 Investment Companies 4 59,179 0.19
3 Joint Stock Companies 97 873,582 2.84
4 Modaraba Management Companies 2 5,001 0.02
5 Modarabas 5 89,325 0.29
6 Mutual Fund 50 11,458,351 37.25
7 Others 39 1,000,051 3.25
8 Financial Institutions 20 5,631,095 18.31
9 Cooperative Societies 1 2,200 0.01
10 Charitable Trusts 6 85,731 0.28
11 Individuals 4,012 5,875,456 19.10
TOTAL 4,251 30,759,559 100.00
122 Annual Report 2010 ICI Pakistan Limited
Pattern of Shareholdingas at December 31, 2010

Shareholder’s Category Number of Number of Shareholders / Shares Held
folios
Associated Companies, Undertakings and Related PartiesICI OMICRON B.V. 1 105,229,125
NIT and ICP (name wise detail)National Bank of Pakistan,Trustee Deptt. NI(U)T Fund 1 1,579,044
Directors, CEO and their spouse and minor children (name wise detail)Mahomed J. Jaffer 1 21,325Mr. Waqar A Malik 1 1Mr. M Nawaz Tiwana 1 1Mr. Feroz Rizvi 2 15,001Mr. Mueen Afzal 1 1Mr. Ali A Aga 1 1Ms. Khatoon M. Jaffer w/o M J Jaffer 1 15,989Mr. Akbar Jaffer s/o M J Jaffer 1 15,081
Executives 42 12,114
Public Sector Companies and Corporations 4 3,262,284
Banks, Development Finance Institutions, 118 17,063,045Non-Banking Finance InstitutionsInsurance Companies, Modarabas and Mutual Funds
Shareholders holding 10% or more voting interestICI OMICRON B.V. 1 105,229,125
ADDITIONAL INFORMATION
Pattern of Shareholding(Under clause (i) of sub-regulation (XIX) of Regulation 35 of chapter (XI)of the Listing Regulations of the Karachi Stock Exchange (Guarantee) Ltd.As at December 31, 2010
ICI Pakistan Limited Annual Report 2010 123

ICI Pakistan Limitedand its Subsidiary Company
ICI Pakistan Limited Annual Report 2010 125

Report of the Directorsfor the year ended December 31, 2010
The Directors are pleased to present their report together with the audited Group results of ICI PakistanLimited for the year ended December 31, 2010. The ICI Pakistan Group comprises of ICI PakistanLimited and ICI Pakistan PowerGen Limited, a wholly owned subsidiary.
The Directors report, giving a commentary on the performance of ICI Pakistan Limited for the yearended December 31, 2010 has been presented separately.
During the year, crude oil prices remained above the price levels of 2009. In 2010, crude oil pricesat Rs 43,650/tonne was on an average higher by 39 percent compared with Rs 31,453/tonne in 2009.Gas tariff was increased in early Q1 2010, however, it remained fairly stable there onwards.
Electricity sales volume for the year was 6 percent higher compared to 2009. This was due to higherdemand from the Polyester plant of ICI Pakistan Limited. This along with revision in electricity tariffat the beginning of the year enabled the Company to achieve an operating result of Rs 121.3 millionwhich was 37 percent higher compared to last year.
Future Outlook
Crude oil prices and furnace oil prices are expected to increase with the worsening of political unrestin Middle East.
M J JafferChairman
Waqar A MalikChief Executive
February 16, 2011
Karachi
126 Annual Report 2010 ICI Pakistan Limited

Auditors’ Report to the Members
We have audited the annexed consolidated financial statements of ICI Pakistan Limited and its subsidiary (the “Group”) comprising
consolidated balance sheet as at 31 December 2010 and the related consolidated profit and loss account, consolidated statement of
comprehensive income, consolidated cash flow statement and consolidated statement of changes in equity together with the notes forming
part thereof, for the year then ended.
These financial statements are the responsibility of the Holding Company’s management. Our responsibility is to express an opinion on
these financial statements based on our audit.
We conducted our audit in accordance with the auditing standards as applicable in Pakistan. These standards require that we plan and
perform the audit to obtain reasonable assurance about whether the above said statements are free of any material misstatement. An
audit includes examining, on a test basis, evidence supporting the amounts and disclosures in the above said statements. An audit also
includes assessing the accounting policies and significant estimates made by management, as well as, evaluating the overall presentation
of the above said statements. We believe that our audit provides a reasonable basis for our opinion.
In our opinion, the consolidated financial statements present fairly the consolidated financial position of the Group as at 31 December
2010, and the consolidated results of its operations, consolidated cash flows and consolidated changes in equity for the year then ended
in accordance with approved accounting standards as applicable in Pakistan.
February 16, 2011 KPMG Taseer Hadi & Co.
Karachi Chartered Accountants
Amir Jamil Abbasi
ICI Pakistan Limited Annual Report 2010 127

EQUITY AND LIABILITIES
Share Capital and Reserves
Authorised capital1,500,000,000 ordinary shares of Rs 10 each 15,000,000 15,000,000
Issued, subscribed and paid-up capital 4 1,388,023 1,388,023
Capital reserves 5 465,845 465,845
Unappropriated profit 12,279,401 11,163,577
Total Equity 14,133,269 13,017,445
Surplus on Revaluation of Property, Plant and Equipment 6 917,380 944,124
LIABILITIES
Non-Current Liabilities
Provisions for non-management staff gratuity and eligible retired employees' medical scheme 7 223,181 183,258
Deferred tax liability - net 8 870,248 1,025,098
1,093,429 1,208,356
Current Liabilities
Short-term financing 9 - 36,038
Trade and other payables 10 5,566,621 5,873,490
5,566,621 5,909,528
Contingencies and Commitments 11
Total Equity and Liabilities 21,710,699 21,079,453
Consolidated Balance SheetAs at December 31, 2010
Note 2010 2009
Amounts in Rs ’000
128 Annual Report 2010 ICI Pakistan Limited
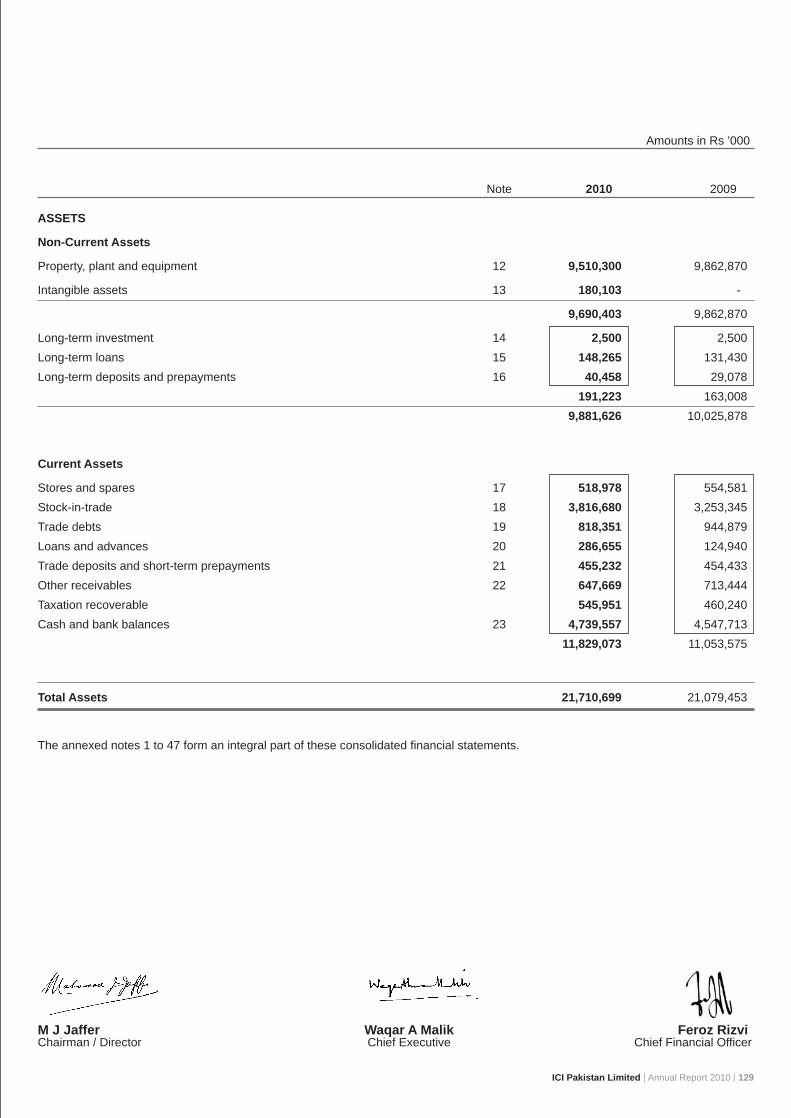
ASSETS
Non-Current Assets
Property, plant and equipment 12 9,510,300 9,862,870
Intangible assets 13 180,103 -
9,690,403 9,862,870
Long-term investment 14 2,500 2,500
Long-term loans 15 148,265 131,430
Long-term deposits and prepayments 16 40,458 29,078
191,223 163,008
9,881,626 10,025,878
Current Assets
Stores and spares 17 518,978 554,581
Stock-in-trade 18 3,816,680 3,253,345
Trade debts 19 818,351 944,879
Loans and advances 20 286,655 124,940
Trade deposits and short-term prepayments 21 455,232 454,433
Other receivables 22 647,669 713,444
Taxation recoverable 545,951 460,240
Cash and bank balances 23 4,739,557 4,547,713
11,829,073 11,053,575
Total Assets 21,710,699 21,079,453
The annexed notes 1 to 47 form an integral part of these consolidated financial statements.
Note 2010 2009
Amounts in Rs ’000
M J Jaffer Waqar A Malik Feroz RizviChairman / Director Chief Executive Chief Financial Officer
ICI Pakistan Limited Annual Report 2010 129

Turnover 25 39,532,506 32,399,181
Sales tax, excise duty, commission and discounts 24 (4,538,017) (4,062,526)
Net sales, commission and toll income 34,994,489 28,336,655
Cost of sales 25 (28,182,149) (22,569,672)
Gross profit 6,812,340 5,766,983
Selling and distribution expenses 27 (1,674,719) (1,470,174)
Administration and general expenses 28 (1,301,775) (1,178,370)
Operating result 3,835,846 3,118,439
Financial charges 29 (165,416) (185,742)
Other operating charges 30 (307,243) (248,436)
(472,659) (434,178)
Other operating income 31 416,606 397,837
Profit before taxation 3,779,793 3,082,098
Taxation 32 (1,302,690) (1,027,768)
Profit after taxation 2,477,103 2,054,330
(Rupees) (Rupees)
Earnings per share - Basic and diluted 33 17.85 14.80
The annexed notes 1 to 47 form an integral part of these consolidated financial statements.
Consolidated Profit and Loss AccountFor the year ended December 31, 2010
Note 2010 2009
Amounts in Rs ’000
M J Jaffer Waqar A Malik Feroz RizviChairman / Director Chief Executive Chief Financial Officer
130 Annual Report 2010 ICI Pakistan Limited

Consolidated Statement of Comprehensive IncomeFor the year ended December 31, 2010
2010 2009
Amounts in Rs ’000
Profit for the year 2,477,103 2,054,330
Other comprehensive income - -
Total Comprehensive income for the year 2,477,103 2,054,330
The annexed notes 1 to 47 form an integral part of these consolidated financial statements.
M J Jaffer Waqar A Malik Feroz RizviChairman / Director Chief Executive Chief Financial Officer
ICI Pakistan Limited Annual Report 2010 131

Cash Flows from Operating Activities
Profit before taxation 3,779,793 3,082,098
Adjustments for:
Depreciation and amortisation 1,027,499 957,309
Gain on disposal of property, plant and equipment (10,211) (5,293)
Provision for non-management staff gratuity and eligible retired employees' medical scheme 58,991 56,008 Mark-up on bank deposits (282,906) (167,995)
Interest / mark-up expense 103,424 106,496
4,676,590 4,028,623
Movement in:
Working capital (765,443) 1,086,307
Long-term loans (16,835) (116)
Long-term deposits and prepayments (11,380) 1,606
Cash generated from operations 3,882,932 5,116,420
Payments for :
Non-management staff gratuity and eligible retired employees' medical scheme (19,068) (15,239) Taxation (1,543,251) (514,838)
Interest / mark-up (104,350) (119,395)
Profit / mark-up received on bank deposits 282,448 163,937
Net cash generated from operating activities 2,498,711 4,630,885
Cash Flows from Investing Activities
Payments for capital expenditure (915,834) (839,156)
Proceeds from disposal of property, plant and equipment 33,032 17,148
Net cash used in investing activities (882,802) (822,008)
Consolidated Cash Flow StatementFor the year ended December 31, 2010
2010 2009
Amounts in Rs ’000
132 Annual Report 2010 ICI Pakistan Limited

Cash Flows from Financing Activities
Dividend paid (1,388,027) (1,041,018)
Net cash used in financing activities (1,388,027) (1,041,018)
Net increase in cash and cash equivalents 227,882 2,767,859
Cash and cash equivalents at January 1 4,511,675 1,743,816
Cash and cash equivalents at December 31 - note 23 4,739,557 4,511,675
Movement in Working Capital
(Increase) / Decrease in current assets
Stores and spares 35,603 26,892
Stock-in-trade (563,335) (287,646)
Trade debts 126,528 (112,817)
Loans and advances (161,715) (26,570)
Trade deposits and short-term prepayments (799) (48,414)
Other receivables 66,233 80,573
(497,485) (367,982)
(Decrease) / Increase in current liabilities
Trade and other payables (267,958) 1,454,289
(765,443) 1,086,307
Cash and cash equivalents at December 31 comprise of:
Cash and bank balances - note 23 4,739,557 4,547,713
Running finances utilised under mark-up arrangements - note 9 - (36,038)
4,739,557 4,511,675
The annexed notes 1 to 47 form an integral part of these consolidated financial statements.
2010 2009
Amounts in Rs ’000
M J Jaffer Waqar A Malik Feroz RizviChairman / Director Chief Executive Chief Financial Officer
ICI Pakistan Limited Annual Report 2010 133

Balance as on January 1, 2009 1,388,023 465,845 10,117,065 11,970,933
Final dividend for the year ended December 31, 2008 @ Rs 4.00 per share - - (555,209) (555,209)
Interim dividend for the year 2009 @ Rs 3.50 per share - - (485,808) (485,808)
Transactions with owners, recorded directly in equity - - (1,041,017) (1,041,017)
Total comprehensive income for the year ended December 31, 2009 - - 2,054,330 2,054,330
Transfer from surplus on revaluation of property, plant and equipment incremental depreciation for the period - net of deferred tax - note 6 - - 33,199 33,199
- - 2,087,529 2,087,529
Balance as on December 31, 2009 1,388,023 465,845 11,163,577 13,017,445
Final dividend for the year ended December 31, 2009 @ Rs 4.50 per share - - (624,610) (624,610)
Interim dividend for the year 2010 @ Rs 5.50 per share - - (763,413) (763,413)
Transactions with owners, recorded directly in equity - - (1,388,023) (1,388,023)
Total comprehensive income for the year ended December 31, 2010 - - 2,477,103 2,477,103
Transfer from surplus on revaluation of property, plant and equipment incremental depreciation for the period - net of deferred tax - note 6 - - 26,744 26,744
- - 2,503,847 2,503,847
Balance as on December 31, 2010 1,388,023 465,845 12,279,401 14,133,269
The annexed notes 1 to 47 form an integral part of these consolidated financial statements.
Consolidated Statement of Changes in EquityFor the year ended December 31, 2010
Issued, Capital Unappropriated Total subscribed reserves profitand paid-up
capital
Amounts in Rs ’000
M J Jaffer Waqar A Malik Feroz RizviChairman / Director Chief Executive Chief Financial Officer
134 Annual Report 2010 ICI Pakistan Limited

1. Status and Nature of Business
The Group consists of:
n ICI Pakistan Limited; and
n ICI Pakistan PowerGen Limited.
ICI Pakistan Limited (“the Company”) is incorporated in Pakistan and is listed on the Karachi, Lahore and Islamabad StockExchanges.
ICI Pakistan PowerGen Limited (“the Subsidiary”) is incorporated in Pakistan as an unlisted public company and is a wholly ownedsubsidiary company of ICI Pakistan Limited.
The Company is engaged in the manufacture of polyester staple fibre, POY chips, soda ash, paints, specialty chemicals, sodiumbicarbonate, polyurethanes; marketing of seeds, toll manufactured and imported pharmaceuticals and animal health products;and merchanting of general chemicals. It also acts as an indenting agent and toll manufacturer.
The Subsidiary is engaged in generating, selling and supplying electricity to the Company.
The Group's registered office is situated at 5 West Wharf, Karachi.
2. Basis of preparation
2.1 Statement of compliance
These consolidated financial statements have been prepared in accordance with approved accounting standards as applicablein Pakistan. Approved accounting standards comprise of such International Financial Reporting Standards (IFRS) issued by theInternational Accounting Standard Board as are notified under the Companies Ordinance, 1984, provisions of and directives issuedunder the Companies Ordinance, 1984. In case requirements differ, the provisions of, or directives issued under the CompaniesOrdinance, 1984 shall prevail.
2.2 Basis of measurement
These consolidated financial statements have been prepared under the historical cost convention, except that certain property,plant and equipment have been included at revalued amounts and certain exchange elements referred to in note 3.7 have beenrecognised in the cost of the relevant property, plant & equipment.
The preparation of financial statements in conformity with approved accounting standards requires management to make estimates,assumptions and use judgments that affect the application of policies and reported amounts of assets and liabilities and incomeand expenses. Estimates, assumptions and judgments are continually evaluated and are based on historical experience and otherfactors, including reasonable expectations of future events. Revisions to accounting estimates are recognised prospectivelycommencing from the period of revision.
Judgments and estimates made by the management that may have a significant risk of material adjustments to the financialstatements in subsequent years are discussed in note 43.
3. Summary of Significant Accounting Policies
The accounting policies adopted are the same as those which were applied for the previous financial year.
3.1 Consolidation
The financial statements of the Subsidiary have been consolidated on a line-by-line basis and all intra-group balances andtransactions have been eliminated.
3.2 Staff retirement benefits
The Group's retirement benefit plans comprise of provident funds, pensions, gratuity schemes and a medical scheme for eligibleretired employees.
Defined benefit plans
The Group operates a funded pension scheme and a funded gratuity scheme for management staff. The pension and gratuityschemes are salary schemes providing pension and lump sums, respectively. Pension and gratuity schemes for management staffare invested through two approved trust funds. The Group also operates gratuity scheme for non-management staff and the
ICI Pakistan Limited Annual Report 2010 135
Notes to the Consolidated Financial StatementsFor the year ended December 31, 2010

pensioners' medical scheme which are unfunded. The pension and gratuity plans are final salary plans. The pensioner's medicalplan reimburses actual medical expenses to pensioners as per entitlement. The Group recognises expense in accordance withIAS 19 “Employee Benefits”.
An actuarial valuation of all defined benefit schemes is conducted every year. The valuation uses the Projected Unit Credit method.Actuarial gains and losses are amortised over the expected average remaining working lives of employees as allowed under therelevant provision of IAS 19 “Employee Benefits”.
Past-service costs are recognised immediately in profit and loss account, unless the changes to the plan are conditional on theemployees remaining in service for a specified period of time (the vesting period). In this case, the past-service costs are amortisedon a straight-line basis over the vesting period.
Defined contribution plans
The Group operates two registered contributory provident funds for its entire staff and a registered defined contribution superannuationfund for its management staff, who have either opted for this fund by July 31, 2004 or have joined the Group after April 30, 2004.In addition to this the Group also provides group insurance to all its employees.
3.3 Provisions
A provision is recognised in the balance sheet when the Group has a legal or constructive obligation as a result of a past event,and it is probable that an outflow of economic benefits will be required to settle the obligation and a reliable estimate can be madeof the amount of obligation. The amount recognised as a provision reflects the best estimate of the expenditure required to settlethe present obligation at the end of the reporting period.
3.4 Trade and other payables
Trade and other payables are recognised initially at fair value plus directly attributable cost, if any.
3.5 Dividend
Dividend distribution to the Group's shareholders is recognised as a liability in the period in which the dividends are approved.
3.6 Taxation
Income tax expense comprises current and deferred tax. Income tax expense is recognised in the profit and loss account, exceptto the extent that it relates to items recognised directly in other comprehensive income or below equity, in which case it is recognisedin other comprehensive income or below equity respectively.
Current
Provision for current taxation is based on taxable income at the enacted or substantively enacted rates of taxation after taking intoaccount available tax credits and rebates, if any. The charge for current tax includes adjustments to charge for prior years, if any.
Deferred
Deferred tax is recognised using balance sheet method, providing for temporary differences between the carrying amounts ofassets and liabilities for financial reporting purposes and the amounts used for taxation purposes. The amount of deferred taxprovided is based on the expected manner of realisation or settlement of the carrying amount of assets and liabilities, using theenacted or substantively enacted rates of taxation.
The Group recognises a deferred tax asset to the extent that it is probable that taxable profits for the foreseeable future will beavailable against which the asset can be utilised. Deferred tax assets are reduced to the extent that it is no longer probable thatthe related tax benefit will be realised. Further, the Group recognises deferred tax asset / liability on deficit / surplus on revaluationof property, plant and equipment which is adjusted against the related deficit / surplus.
3.7 Property, plant and equipment and depreciation
Property, plant and equipment (except freehold land, leasehold land and plant & machinery) are stated at cost less accumulateddepreciation and impairment losses. Freehold land, leasehold land and plant & machinery are stated at revalued amounts lessaccumulated depreciation. Capital work-in-progress is stated at cost. Cost of certain property, plant and equipment compriseshistorical cost, exchange differences recognised in accordance with the previous Fourth Schedule to the Ordinance, cost ofexchange risk cover in respect of foreign currency loans obtained for the acquisition of property, plant and equipment upto thecommencement of commercial production and the cost of borrowings during construction period in respect of loans taken forspecific projects.
Depreciation charge is based on the straight-line method whereby the cost or revalued amount of an asset is written off to profitand loss account over its estimated useful life after taking into account residual value, if material. The cost of leasehold land is
136 Annual Report 2010 ICI Pakistan Limited
Notes to the Consolidated Financial StatementsFor the year ended December 31, 2010

amortised in equal installments over the lease period. Depreciation on additions is charged from the month in which the asset isavailable for use and on disposals up to the month of disposal.
The residual value, depreciation method and the useful lives of each part of property, plant and equipment that is significant inrelation to the total cost of the asset are reviewed, and adjusted if appropriate, at each balance sheet date.
Surplus on revaluation of property, plant and equipment is credited to the surplus on revaluation account. To the extent of theincremental depreciation charged on the revalued assets the related surplus on revaluation of property, plant and equipment (netof deferred taxation) is transferred directly to unappropriated profit.
Maintenance and normal repairs are charged to income as and when incurred. Improvements are capitalised when it is probablethat respective future economic benefits will flow to the Group and the cost of the item can be measured reliably. Assets replaced,if any, are derecognised.
Gains and losses on disposal of assets are taken to the profit and loss account, and the related surplus on revaluation of property,plant and equipment is transferred directly to retained earnings (unappropriated profits).
3.8 Intangible asset and amortisation
Intangible assets with a finite useful life, such as certain softwares, licenses and property rights, are capitalised initially at costand subsequently stated at cost less accumulated amortisation and impairment losses, if any.
Subsequent expenditure is capitalised only when it increases the future economic benefits embodied in the specific asset to whichit relates. All other expenditures are recognised in profit and loss as incurred.
Amortisation is based on the cost of an asset less its residual value. Amortisation is recognised in profit and loss on a straight-line basis over the estimated useful lives of intangible assets. Amortisation methods, useful lives and residual values are reviewedat each reporting date and adjusted, if appropriate.
3.9 Impairment
Financial assets (including receivables)
Financial assets are assessed at each reporting date to determine whether there is objective evidence that they are impaired. Afinancial asset is impaired if objective evidence indicates that a loss event has occurred after the initial recognition of the assetand that the loss event had a negative effect on the estimated future cash flows of that asset that can be estimated reliably.Objective evidence that financial assets are impaired may include default or delinquency by a debtor, indications that a debtor orissuer will enter bankruptcy.
All individually significant receivables are assessed for specific impairment. All individually significant receivables found not to bespecifically impaired are then collectively assessed for any impairment that has been incurred but not yet identified. Receivablesthat are not individually significant are collectively assessed for impairment by grouping together receivables with similar riskcharacteristics.
An impairment loss in respect of a financial asset measured at amortised cost is calculated as the difference between its carryingamount and the present value of the estimated future cash flows discounted at the asset's original effective interest rate. Lossesare recognised in profit and loss and reflected in an allowance account against receivables. Interest on the impaired asset continuesto be recognised through the unwinding of the discount. When a subsequent event causes the amount of impairment loss todecrease, the decrease in impairment loss is reversed through profit and loss account.
Non-Financial assets
The carrying amounts of non-financial assets other than inventories and deferred tax asset, are reviewed at each reporting dateto determine whether there is any indication of impairment. If any such indication exists, then the asset's recoverable amount isestimated. The recoverable amount of an asset or cash-generating unit is the greater of its value in use and its fair value less coststo sell. In assessing value in use, the estimated future cash flows are discounted to their present value using a pre-tax discountrate that reflects current market assessment of the time value of money and the risks specific to the asset. For the purpose ofimpairment testing, assets that cannot be tested individually are grouped together into the smallest group of assets that generatescash inflows from continuing use that are largely independent of the cash inflows of other assets or groups of assets (the “cash-generating unit, or CGU”).
The Group's corporate assets do not generate separate cash inflows. If there is an indication that a corporate asset may beimpaired, then the recoverable amount is determined for the CGU to which the corporate asset belongs. An impairment loss isrecognised if the carrying amount of an asset or its CGU exceeds its estimated recoverable amount. Impairment losses arerecognised in profit and loss account.
Impairment loss recognised in prior periods is assessed at each reporting date for any indications that the loss has decreased orno longer exists. An impairment loss is reversed if there has been a change in the estimates used to determine the recoverable
ICI Pakistan Limited Annual Report 2010 137
amount. An impairment loss is reversed only to the extent that the asset's carrying amount does not exceed the carrying amountthat would have been determined, net of depreciation or amortisation, if no impairment loss had been recognised.
3.10 Investment
Investment in unquoted equity security is classified as available for sale is stated at cost less provision for impairment, if any.
3.11 Stores and spares
Stores and spares are stated at the lower of cost and net realisable value. Cost is determined using the weighted average method.
3.12 Stock-in-trade
Stock-in-trade is valued at lower of weighted average cost and estimated net realisable value.
Cost comprises all costs of purchase, costs of conversion and other costs incurred in bringing the inventories to their presentlocation and condition. Net realisable value signifies the estimated selling price in the ordinary course of business less net estimatedcosts of completion and selling expenses.
3.13 Trade debts and other receivables
Trade debts and other receivables are recognised initially at fair value plus directly attributable cost, if any, and subsequentlymeasured at amortised cost. A provision for impairment of trade and other receivables is established when there is objectiveevidence that the Group will not be able to collect all amounts due according to the original terms of receivables (Refer note 40.5.1).
3.14 Foreign currency translation
Transactions denominated in foreign currencies are translated to Pak Rupees, which is the Group's functional currency, at the foreignexchange rate prevailing at the date of transaction. Monetary assets and liabilities in foreign currencies are translated into Pak Rupeesat the foreign exchange rates at the balance sheet date. All exchange differences are taken to the profit and loss account.
3.15 Functional and presentation currency
Items included in the consolidated financial statements are measured using the currency of the primary economic environmentin which the Group operates. The consolidated financial statements are presented in Pak Rupees, which is the Group's functionaland presentation currency.
3.16 Revenue recognition
• Revenue from the sale of goods is recognised when the significant risks and rewards of ownership have been transferred tothe customer. For those products which are often sold with a right of return, accumulated experience is used to estimate andprovide for such returns at the time of sale.
• Commission income is recognised on date of shipment from suppliers.
• Profit on short-term deposits is accounted for on a time-apportioned basis using the effective interest rate method.
• Dividend income is recognised when the right to receive dividend is established.
• Toll manufacturing income is recognised when services are rendered.
3.17 Financial expense and finance income
Financial expenses are recognised using the effective interest rate method and comprise foreign currency losses and mark-up /interest expense on borrowings.
Finance income comprises interest income on funds invested. Mark-up / Interest income is recognised as it accrues in profit andloss account, using the effective interest rate method.
3.18 Segment reporting
Segment reporting is based on the operating (business) segments of the Group. An operating segment is a component of theGroup that engages in business activities from which it may earn revenues and incur expenses, including revenues and expensesthat relate to transactions with any of the Group's other components. An operating segment's operating results are reviewedregularly by the CEO to make decisions about resources to be allocated to the segment and assess its performance, and for whichdiscrete financial information is available.
138 Annual Report 2010 ICI Pakistan Limited
Notes to the Consolidated Financial StatementsFor the year ended December 31, 2010

Segment results that are reported to the CEO include items directly attributable to a segment as well as those that can be allocatedon a reasonable basis. Unallocated items comprise mainly corporate assets, income tax assets, liabilities and related income andexpenditure. Segment capital expenditure is the total cost incurred during the period to acquire property, plant and equipment.
The business segments are engaged in providing products or services which are subject to risks and rewards which differ fromthe risks and rewards of other segments. Segments reported are Polyester, Soda Ash, Paints, Life Sciences, Chemicals and others(PowerGen), which also reflects the management structure of the Group.
3.19 Finance lease
Leases that transfer substantially all the risks and rewards incidental to ownership of an asset are classified as finance lease.Assets subject to finance lease are stated at amounts equal to the fair value or, if lower, the present value of the minimum leasepayments. The minimum lease payments are apportioned between the finance charge and the reduction of the outstanding liability.Assets acquired under finance leases are depreciated in accordance with the Group's depreciation policy on property, plant andequipment. The finance cost is charged to profit and loss account and is included under financial charges.
3.20 Operating lease / Ijarah contracts
Leases in which a significant portion of the risks and rewards of ownership are retained by the lessor are classified as operatingleases. Payments made under operating leases (net of any incentives received from the lessor) are charged to the profit and lossaccount on a straight-line basis over the period of the lease.
Payments made under Ijarah contracts are recognised in the profit and loss account on a straight-line basis over the term of thelease.
3.21 Cash and cash equivalents
Cash and cash equivalents comprise of cash in hand and current and deposit accounts held with banks. Running finance facilitiesavailed by the Group, which are payable on demand and form an integral part of the Group's cash management are included aspart of cash and cash equivalents for the purpose of statement of cash flows.
3.22 Borrowings and their cost
Borrowings are recognised initially at fair value, net of transaction costs incurred. Borrowing costs are recognised as an expensein the period in which these are incurred except to the extent of borrowing costs that are directly attributable to the acquisition,construction or production of a qualifying asset. Such borrowing costs, if any, are capitalised as part of the cost of that asset.
3.23 Financial liabilities
All financial liabilities are initially recognised at fair value plus directly attributable cost, if any, and subsequently measured atamortised cost.
3.24 Derivative financial instruments
The Group uses derivative financial instruments to hedge its exposure to foreign exchange and interest rate risks arising fromoperational, financing and investment activities. In accordance with its treasury policy, the Group does not hold or issue derivativefinancial instruments for trading purposes. However, derivatives that do not qualify for hedge accounting are accounted for astrading instruments.
3.25 Off-setting
Financial assets and liabilities are offset and the net amount is reported in the financial statements only when there is a legallyenforceable right to set-off the recognised amount and the Group intends either to settle on a net basis, or to realise the assetsand to settle the liabilities simultaneously.
3.26 Earnings per Share
The Group presents basic and diluted earnings per share (EPS) data for its ordinary shares. Basic EPS is calculated by dividingthe profit after tax attributable to ordinary shareholders of the Group by the weighted average number of ordinary shares outstandingduring the period.
ICI Pakistan Limited Annual Report 2010 139

4. Issued, Subscribed and Paid-up Capital
Ordinary shares of Rs 10 each fully paid125,840,190 125,840,190 in cash 1,258,402 1,258,402
Ordinary shares of Rs 10 each issued as fully paid for consideration other than cash under
318,492 318,492 scheme of arrangement for amalgamation 3,185 3,185
Ordinary shares of Rs 10 each issued as 25,227 25,227 fully paid bonus shares 252 252
Ordinary shares issued pursuant to the Scheme as fully paid for consideration of
12,618,391 12,618,391 investment in associate (note 4.1) 126,184 126,184
138,802,300 138,802,300 1,388,023 1,388,023
4.1 With effect from October 1, 2000 the Pure Terephthalic Acid (PTA) Business of the Company was demerged under a Scheme ofArrangement (“the Scheme”) dated December 12, 2000 approved by the shareholders and sanctioned by the High Court of Sindh.
4.2 ICI Omicron B.V., which is a wholly owned subsidiary of AkzoNobel N.V., held 105,229,125 (2009: 105,229,125) ordinary sharesof Rs 10 each at December 31, 2010. AkzoNobel N.V., acquired ICI PLC, UK, effective January 2, 2008, the parent company ofICI Omicron B.V., and became the ultimate holding company of ICI Pakistan Limited. ICI Pakistan Limited continues to be thedirect subsidiary of ICI Omicron B.V.
5. Capital Reserves
Share premium - note 5.1 465,259 465,259
Capital receipts - note 5.2 586 586
- 465,845 465,845
5.1 Share premium includes the premium amounting to Rs 0.902 million received on shares issued for the Company's Polyester Plantinstallation in 1980 and share premium of Rs 464.357 million representing the difference between nominal value of Rs 10 pershare of 12,618,391 ordinary shares issued by the Company and the market value of Rs 590.541 million of these sharescorresponding to 25% holding acquired in Lotte Pakistan PTA Limited, an ex-associate, at the date of acquisition i.e. November2, 2001 and the number of shares that have been issued were determined in accordance with the Scheme in the ratio betweenmarket value of the shares of two companies based on the mean of the middle market quotation of the Karachi Stock Exchangeover the ten trading days between October 22, 2001 to November 2, 2001.
5.2 Capital receipts represent the amount received from various ICI PLC group companies overseas for the purchase of property,plant and equipment. The remitting companies have no claim to their repayments.
6. Surplus on Revaluation of Property, Plant and Equipment
Balance as on January 1 944,124 977,323
Less: Transfer to unappropriated profit in respect of incremental depreciation charged during the year net of deferred tax (26,744) (33,199)
Balance as on December 31 917,380 944,124
2010 2009 2010 2009(Numbers)
Amounts in Rs ’000
140 Annual Report 2010 ICI Pakistan Limited
Notes to the Consolidated Financial StatementsFor the year ended December 31, 2010

7. Provisions for non-management staff gratuity and eligible retired employees' medical scheme - note 7.1 223,181 183,258
7.1 Staff Retirement Benefits2010 2009
Funded Unfunded Funded UnfundedPension Gratuity Total Pension Gratuity Total
7.1.1 The amounts recognised in the profit and loss account against defined benefit schemes are as follows:
Current service cost 47,010 31,885 78,895 9,741 24,526 26,223 50,749 7,535Interest cost 156,844 56,301 213,145 40,426 153,634 62,926 216,560 41,173Expected return on plan assets (133,250) (39,920) (173,170) - (98,449) (31,903) (130,352) -Termination cost - - - - 13,043 - 13,043 -Recognition of actuarial loss 105,175 12,060 117,235 8,824 101,997 13,582 115,579 7,300Net charge for the year 175,779 60,326 236,105 58,991 194,751 70,828 265,579 56,008
7.1.2 Movements in the net asset / (liability) recognised in the balance sheet are as follows:
Opening balance 319,437 33,867 353,304 (183,258) 238,716 62,148 300,864 (142,489)Net Charge for the year - note 7.1.1 (175,779) (60,326) (236,105) (58,991) (194,751) (70,828) (265,579) (56,008)Contributions / payments during the year 198,926 46,294 245,220 19,068 275,472 42,547 318,019 15,239Closing balance 342,584 19,835 362,419 (223,181) 319,437 33,867 353,304 (183,258)
7.1.3 The amounts recognised in the balance sheet are as follows:
Fair value of plan assets - note 7.1.5 1,380,173 391,304 1,771,477 - 1,037,319 317,150 1,354,469 -Present value of defined benefit obligation - note 7.1.4 (1,547,841) (553,363) (2,101,204) (381,842) (1,285,827) (462,971) (1,748,798) (340,084)Deficit (167,668) (162,059) (329,727) (381,842) (248,508) (145,821) (394,329) (340,084)Unrecognised actuarial loss 510,252 181,894 692,146 158,661 567,945 179,688 747,633 156,826Recognised asset / (liability) 342,584 19,835 362,419 (223,181) 319,437 33,867 353,304 (183,258)
7.1.4 Movement in the present value of defined benefit obligation:
Opening balance 1,285,827 462,971 1,748,798 340,084 1,117,525 442,477 1,560,002 259,784Service cost 47,010 31,885 78,895 9,741 24,526 26,223 50,749 7,535Interest cost 156,844 56,301 213,145 40,426 153,634 62,926 216,560 41,173Benefits paid (64,610) (30,744) (95,354) (19,068) (286,286) (103,768) (390,054) (15,239)Termination cost - - - - 13,043 - 13,043 -Actuarial loss 122,770 32,950 155,720 10,659 263,385 35,113 298,498 46,831Present value of the defined benefit obligation at the end of the year 1,547,841 553,363 2,101,204 381,842 1,285,827 462,971 1,748,798 340,084
7.1.5 Movement in the fair value of plan assets:
Opening balance 1,037,319 317,150 1,354,469 - 815,658 310,404 1,126,062 -Expected return 133,250 39,920 173,170 - 98,449 31,903 130,352 -Contributions 198,926 46,294 245,220 - 275,472 42,547 318,019 -Benefits paid (64,610) (30,744) (95,354) - (286,286) (103,768) (390,054) -Actuarial gain 75,288 18,684 93,972 - 134,026 36,064 170,090 -Fair value of plan assets at the end of the year 1,380,173 391,304 1,771,477 - 1,037,319 317,150 1,354,469 -
7.1.6 Historical information
As at December 31 2010 2009 2008 2007 2006
Present Value of defined benefit obligation 2,483,046 2,088,882 1,819,786 1,555,387 1,236,483Fair value of plan assets 1,771,477 1,354,469 1,126,062 1,312,938 1,067,109Deficit 711,569 734,413 693,724 242,449 169,374
Experience adjustments on plan liabilities 7% 3% 13% 16% 1%Experience adjustments on plan assets 5% 13% (27%) 7% (9%)
7.1.7 Major categories / composition of plan assets are as follows:2010 2009
Debt instruments 62% 50%Equity at market value 30% 32%Cash 8% 18%
Mortality of active employees and pensioners will be represented by the LIC(96-98) Table. The table has been rated down three years for mortality of female pensionersand widows.
The return on plan assets was assumed to equal the discount rate. Actual (loss) / return on plan assets during 2010 was Rs 267.142 million (2009: Rs 300.442 million).
2010 2009
Amounts in Rs ’000
ICI Pakistan Limited Annual Report 2010 141

7.1.8 The principal actuarial assumptions at the reporting date were as follows:
Discount rate 14.25% 12.75%Expected return on plan assets 14.25% 12.75%Future salary increases 12.00% 10.60%Future pension increases 8.75% 7.38%
7.1.9 Medical cost trend is assumed to follow inflation. The sensitivity to reflect the effect of a 1% movement in the assumed medicalcost trend were as follows:
2010 Increase Decrease
8.75% 9.75% 7.75%
Effect on the aggregate of the current service cost and interest cost 35,905 44,139 32,003
Effect on the defined benefit obligation 291,807 335,025 255,287
These figures are based on the latest actuarial valuation, as at December 31, 2010. The valuation uses the Projected Unit Creditmethod. Actuarial gains and losses are amortised over the expected future service life of current members.
7.1.10 The Group contributed Rs 63.200 million (2009: Rs 56.006 million) and Rs 35.528 million (2009: Rs 29.564 million) to the providentfund and the defined contribution superannuation fund respectively during the year.
2010 2009
Opening Reversal Closing Opening Charge Closing
8. Deferred Tax (Liability) / Asset - net
Deductible temporary differences
Tax losses carried forward - - - 214,425 (214,425) -
Provisions for retirement benefits, doubtful debts and others 336,321 133,784 470,105 413,741 (77,420) 336,321
Taxable temporary differences
Property, plant and equipment (1,361,419) 21,066 (1,340,353) (1,098,870) (262,549) (1,361,419)
(1,025,098) 154,850 (870,248) (470,704) (554,394) (1,025,098)
2010 2009
9. Short-Term Financing
Running finances utilised under mark-up arrangements - note 9.1 - 36,038
9.1 Running Finance
The facilities for running finance available from various banks amounted to Rs 2,806 million (December 31, 2009: Rs 2,991 million)and carried mark-up during the period ranging from relevant KIBOR + 0.75% to 3.47% per annum with an average mark-up rateas on December 31, 2010 at relevant KIBOR + 1.26% per annum (December 31, 2009: 12.64 to 17.37 percent per annum). Thefacilities are secured by hypothecation charge over the present and future stock-in-trade and book debts of the Group and firstpari passu charge over plant and machinery of Soda Ash Business of the Group.
2010 2009
Amounts in Rs ’000
142 Annual Report 2010 ICI Pakistan Limited
Notes to the Consolidated Financial StatementsFor the year ended December 31, 2010

10. Trade and Other Payables
Trade creditors - note 10.1 1,082,075 977,600Bills payable 1,988,466 2,270,855Sales tax, excise and custom duties 125,570 177,618Mark-up accrued on short-term financing 1,786 2,712Accrued interest / return on unsecured loan - note 10.2 305,109 299,647Accrued expenses 1,169,705 1,177,342Technical service fee / royalty 30,316 35,975Workers' profit participation fund - note 10.3 206,645 165,103Workers' welfare fund 77,139 119,954Distributors' security deposits - payable on termination of distributorship - note 10.4 80,700 71,993Contractors' earnest / retention money 11,653 10,103Advances from customers 253,752 248,727Unclaimed dividends 4,544 4,548Payable for capital expenditure 101,551 139,532Provision for compensated absences - note 10.5 20,000 20,000Others 107,610 151,781
5,566,621 5,873,490
10.1 The above balances include amounts due to following associated undertakings:
ICI Paints UK (part of AkzoNobel group) 174 6,911ICI Paints (Asia Pacific) PTE Ltd (part of AkzoNobel group) 15 26,105AkzoNobel Paints Malaysia - 3,392Marine Protective International Coating Malaysia (part of AkzoNobel group) - 1,400C&P Residual (part of AkzoNobel group) 1,197 -AkzoNobel NV 36,280 -AkzoNobel Functional Chemicals 3,995 -International Paint Netherland (part of AkzoNobel group) 154 -ICI Packaging Coatings (part of AkzoNobel group) 197 -AkzoNobel Functional Chemicals BV 11,592 -AkzoNobel Functional Chemicals Pte Ltd 2,827 -AkzoNobel Surface Chemistry Pte Ltd 3,014 -ICI Paints Thailand (part of AkzoNobel group) 25 -ICI Paints Indonesia (part of AkzoNobel group) - 101CR Netherlands (part of AkzoNobel group) - 5,339AkzoNobel Car Refinishes BV 23,103 -
82,573 43,248
10.2 This represents amount payable to Mortar Investments International Limited.
10.3 Workers' profit participation fund
Balance as on January 1 165,103 148,214Allocation for the year - note 30 199,302 162,326
364,405 310,540
Interest on funds utilised in the Group's businesses at 60.00 percent (2009: 41.25 percent) per annum - note 29 6,948 2,105
371,353 312,645Less: - Amount paid on behalf of the fund 72,521 72,260 - Deposited with the Government of Pakistan 92,187 75,282
164,708 147,542
Balance as on December 31 206,645 165,103
10.4 Interest on security deposits from certain distributors is payable at 11.5 percent (2009: 7.5 percent) per annum as specified in therespective agreements.
10.5 This figure is based on the actuarial valuation, as at December 31, 2009.
2010 2009
Amounts in Rs ’000
ICI Pakistan Limited Annual Report 2010 143

11. Contingencies and Commitments
11.1 Claims against the Group not acknowledged as debts are as follows:
Local bodies 91,336 32,342
Sales tax authorities 31,889 93,323
Others 137,934 53,396
261,159 179,061
11.2 A notice was issued by the Environmental Protection Authority (EPA) against the Paints factory located at Ferozpur Road, Lahore.Pursuant to this an order was passed by the EPA for violation of certain provisions of the 'Act'. The Company is of the opinionthat the order was not justified and has filed an appeal against the order in the Environmental Tribunal in Lahore, which is pending.
11.3 Guarantees issued by the Company in respect of financial and operational obligations of Lotte Pakistan PTA Limited pursuant tothe Scheme of arrangement, amounting to Rs 2,190 million (2009: Rs 2,280 million) against which Lotte Pakistan PTA Limitedand KP Chemicals Corporation have issued counter guarantees to the Company.
11.4 Guarantee issued by the Company to a bank in respect of financing obtained by Senior Executives amounted to Rs 35 million(2009: Rs 35 million), in accordance with the terms of employment.
11.5 Guarantee issued by the Company of Rs 133 million (2009: Rs 133 million) to a bank on behalf of its subsidiary ICI PakistanPowerGen Limited for availing funded facility.
11.6 Commitments in respect of capital expenditure amounted to Rs 152.646 million (2009: Rs 33.875 million).
11.7 Commitments for rentals under operating lease / ijarah contracts in respect of vehicles amounting to Rs 165.144 million (2009:Rs 196.685 million) are as follows:
Year
2010 - 67,213
2011 67,908 58,633
2012 57,223 45,772
2013 32,878 23,797
2014 7,135 1,270
165,144 196,685
Payable not later than one year 67,908 67,213
Payable later than one year but not later than five years 97,236 129,472
165,144 196,685
12. Property, Plant and Equipment
12.1 The following is a statement of property, plant and equipment:
Operating property, plant and equipment - note 12.2 9,224,944 9,445,987
Capital work-in-progress - note 12.6 285,356 416,883
9,510,300 9,862,870
2010 2009
Amounts in Rs ’000
144 Annual Report 2010 ICI Pakistan Limited
Notes to the Consolidated Financial StatementsFor the year ended December 31, 2010

Amounts in Rs ’000
12.2 The following is a statement of operating property, plant and equipment:
Land Lime beds Buildings Plant and Railway Rolling Furniture TotalFreehold Leasehold on freehold On On machinery sidings stock and and
land freehold leasehold vehicles equipmentland land
2010
Net carrying value basisYear ended December 31, 2010Opening net book value (NBV) 836,702 2,837 68,515 241,246 725,377 7,382,392 - 26,082 162,836 9,445,987Addition/transfer (at cost) 27,934 - 30,980 47,954 48,633 543,019 - 8,724 92,283 799,527Disposal/transfer (at NBV) - - (32) - - (18,871) - (2,863) (1,055) (22,821)Depreciation charge - (72) (9,800) (37,391) (68,775) (817,535) - (10,500) (53,676) (997,749)Closing net book value (NBV) 864,636 2,765 89,663 251,809 705,235 7,089,005 - 21,443 200,388 9,224,944
Gross carrying value basisAt December 31, 2010Cost/Revaluation 864,636 567,799 164,750 994,957 1,341,783 18,511,237 297 126,071 720,011 23,291,541Accumulated Depreciation - (565,034) (75,087) (743,148) (636,548) (11,422,232) (297) (104,628) (519,623) (14,066,597)Net book value 864,636 2,765 89,663 251,809 705,235 7,089,005 - 21,443 200,388 9,224,944
Depreciation rate % per annum - 2 to 4 3.33 to 7.5 5 to 10 2.5 to 10 3.33 to 10 3.33 10 to 25 10 to 33.33
2009
Net carrying value basisYear ended December 31, 2009
Opening net book value (NBV) 836,702 7,149 78,256 243,783 455,945 6,431,761 - 31,742 128,825 8,214,163Addition/transfer (at cost) - - - 30,721 332,621 1,743,506 - 7,560 78,880 2,193,288Disposal/transfer (at NBV) - - - - - (9,229) - (2,077) (549) (11,855)Depreciation charge - (4,312) (9,741) (33,258) (63,189) (783,646) - (11,143) (44,320) (949,609)Closing net book value (NBV) 836,702 2,837 68,515 241,246 725,377 7,382,392 - 26,082 162,836 9,445,987
Gross carrying value basisAt December 31, 2009Cost/Revaluation 836,702 567,799 133,820 947,003 1,293,917 18,014,527 297 120,598 669,585 22,584,248Accumulated Depreciation - (564,962) (65,305) (705,757) (568,540) (10,632,135) (297) (94,516) (506,749) (13,138,261)Net book value 836,702 2,837 68,515 241,246 725,377 7,382,392 - 26,082 162,836 9,445,987
Depreciation rate % per annum - 2 to 4 3.33 to 7.5 5 to 10 2.5 to 10 3.33 to 10 3.33 10 to 25 10 to 33.33
12.3 Subsequent to revaluation on October 1, 1959 and September 30, 2000, which had resulted in a surplus of Rs 14.207 million andRs 1,569.869 million respectively, the land and plant and machinery were revalued again on December 15, 2006 resulting in anet surplus of Rs 667.967 million. The valuation was conducted by independent valuers. Valuations for plant and machinery wasthe open market value of the asset based on estimated gross replacement cost, depreciated to reflect the residual service potentialof the asset having paid due regard to age, condition and obsolescence. Land was valued on the basis of fair market value.
12.4 As at December 31, 2010 plant and machinery included equipments held with Searle Pakistan Limited and Maple Pharmaceutical(Private) Limited (toll manufacturers), having cost and net book values as follows:
2010 2009
Cost 4,100 3,200
Net book value 3,100 2,500
12.4.1 Had there been no revaluation, the net book value of specific classes of operating property, plant and equipment would haveamounted to:
Net Book Value
Freehold land 48,863 20,929Plant and machinery 6,901,861 7,155,501Rolling stock and vehicles 21,443 26,082Furniture and equipment 200,388 162,836
7,172,555 7,365,348
12.5 The depreciation charge for the year has been allocated as follows:
Cost of sales - note 26 942,167 902,164Selling and distribution expenses - note 27 10,956 12,726Administration and general expenses - note 28 44,626 34,719
997,749 949,609
ICI Pakistan Limited Annual Report 2010 145

2010 2009
Amounts in Rs ’000
12.6 The following is a statement of capital work-in-progress:
Civil works and buildings 40,261 51,121
Plant and machinery 197,464 209,638
Miscellaneous equipment 8,993 33,664
Advances to suppliers / contractors 38,638 122,460
285,356 416,883
12.7 Details of operating property, plant and equipment disposals having net book value in excess of Rs 50,000 are as follows:
2010
Mode of sale Cost Accumulated Net book Sale Particulars of buyers depreciation value proceeds
Plant and machinery
Gas condenser & Various items Tender 27,095 12,157 14,938 4,917 Alfa Laval Middleeast Ltd. and Muhammad Akram Ghouri,Mandi Bahauddin
Tinting Machines & Dispenser Negotiation 4,180 788 3,392 3,111 Al Habib, Awami Paints, Saad contractor,Asian Paints, Roomi Paints,Khurram Contractors, Lahore
Rolling stock and vehicles
Honda City & Toyota Corolla Auction 1,510 192 1,318 1,924 Murtaza Khan Babar andSyed Farhat Abbas Jafri, Karachi
Honda Motorcycle Auction 80 3 77 70 Syed Ghulam Mustafa, Lahore
Furniture and equipment
Water cooling coil and Chiller Auction 467 323 144 194 Habibullah Khan, Karachi
2009
Plant and machinery
Dust extraction unit and other items Auction 28,576 23,089 5,487 3,338 Hi-Tech Electronics & Machinery, Karachi
Tinting Machines Negotiation 4,429 710 3,719 3,719 Jaffer and Sons., Chaudhry Paint House,Color Bank and Awan Brothers
Rolling stock and vehicles
Toyota Corolla - 2 nos Negotiation 1,481 734 747 2,088 Tufail Iqbal & M Inam, Lahore
Hino Dump Trucks Auction 8,808 7,519 1,289 1,902 Hi-Tech Electronics & Machinery, Karachi
146 Annual Report 2010 ICI Pakistan Limited
Notes to the Consolidated Financial StatementsFor the year ended December 31, 2010

Amounts in Rs ’000
13. Intangible Assets2010
Software Licenses Under Total development
Net carrying value basis Year ended December 31Opening net book value (NBV) - - - -Additions (at cost) 57,365 87,136 65,352 209,853Amortisation charge (8,605) (21,145) - (29,750)Closing net book value (NBV) 48,760 65,991 65,352 180,103
Gross carrying amount At December 31Cost 226,146 87,136 65,352 378,634Accumulated amortisation (177,386) (21,145) - (198,531)Net book value 48,760 65,991 65,352 180,103
Rate of amortisation % per annum 20 20 to 50 -
2009
Net carrying value basis Year ended December 31Opening net book value (NBV) 7,700 - - 7,700Additions (at cost) - - - -Amortisation charge (7,700) - - (7,700)Closing net book value (NBV) - - - -
Gross carrying amount At December 31Cost 168,781 - - 168,781Accumulated amortisation (168,781) - - (168,781)Net book value - - - -
Rate of amortisation % per annum 20 - -
13.1 The amortisation charge for the year has been allocated as follows:
Cost of sales - note 26 7,746 3,636Selling and distribution expenses - note 27 2,565 639Administration and general expenses - note 28 19,439 3,425
29,750 7,700
14. Long-Term Investment - At cost
Unquoted Equity security available for sale- Arabian Sea Country Club Limited 2,500 2,500
15. Long-Term Loans - Considered good
Due from Executives and Employees - note 15.1 148,265 131,430
2010 2009
ICI Pakistan Limited Annual Report 2010 147

Amounts in Rs ’000
2010 2009
15.1 Due from Directors, Executives and EmployeesMotor car House Total Total
building
Due from Directors and Executives - note 15.2 101,847 51,568 153,415 121,756Less: Receivable within one year - note 20 19,270 25,424 44,694 25,119 82,577 26,144 108,721 96,637
Due from Employees 67,778 55,156Less: Receivable within one year - note 20 28,234 20,363 39,544 34,793
148,265 131,430
Outstanding for period:- less than three years but over one year 69,982 70,636- more than three years 78,283 60,794 148,265 131,430
15.2 Reconciliation of the carrying amount of loans to Directors and Executives:
Opening balance at beginning of the year 121,756 102,117Disbursements 84,215 79,293Repayments (52,556) (59,654)Balance at end of the year 153,415 121,756
The above loan balance includes an amount of Rs 0.319 million (2009: Rs 1.595 million) in respect of house building relating tokey management personnel. Loan outstanding during the year relates to Mr. Ali A. Aga (Director), who was provided this loan asper his terms of employment.
15.3 Loans for purchase of motor cars and house building are repayable between two to ten years. These loans are interest free andgranted to the employees including executives of the Group in accordance with their terms of employment.
15.4 The maximum aggregate amount of long-term loans due from the Executives at the end of any month during the year wasRs 161.509 million (2009: Rs 125.362 million).
16. Long-Term Deposits and Prepayments
Deposits 22,873 21,211
Prepayments 17,585 7,867
40,458 29,078
17. Stores and Spares
Stores (include in-transit Rs 20.058 million; 2009: Rs 11.628 million) 36,570 37,563Spares 589,833 562,708Consumables 89,046 86,681
715,449 686,952Less: Provision for slow moving and obsolete items - note 17.1 196,471 132,371
518,978 554,581
17.1 Movement of provision in stores and spares
Opening 132,371 125,361Charge - note 28 64,100 40,000Write-off - (32,990)Closing 196,471 132,371
148 Annual Report 2010 ICI Pakistan Limited
Notes to the Consolidated Financial StatementsFor the year ended December 31, 2010

18. Stock-in-Trade
Raw and packing material (include in-transit Rs 436.887 million; 2009:Rs 219.830 million) - note 18.2 1,816,427 1,291,521Work-in-process 48,553 83,229Finished goods (include in-transit Rs 9.490 million; 2009: Rs 9.23 million) 2,107,225 1,997,408
3,972,205 3,372,158Less: Provision for slow moving and obsolete stocks - note 18.1- Raw materials 87,463 63,944- Finished goods 68,062 54,869
155,525 118,813 3,816,680 3,253,345
18.1 Movement of provision in stock-in-trade
Opening 118,813 113,865Charge - note 28 55,510 38,617Reversal - (5,000)Write-off (18,798) (28,669)Closing 155,525 118,813
Stocks amounting to Rs Nil (2009: Rs 18.663 million) are measured at net realisable value and has been written down byRs Nil (2009: Rs 1.62 million) to arrive at its net realisable value.
18.2 Raw and packing materials include Rs 283.341 million (2009: Rs. 148.524 million) which are held with toll manufacturers namelySearle Pakistan Limited, Maple Pharmaceutical (Private) Limited, Epla Laboratories (Private) Limited, Breeze Pharma (Private)Limited, NovaMed Pharmaceuticals and Polymer International (Private) Limited.
19. Trade Debts
Considered good
- Secured 293,528 382,380 - Unsecured 974,076 812,321
1,267,604 1,194,701Considered doubtful 343,490 277,631
1,611,094 1,472,332Less: Provision for: - Doubtful debts - note 40.4 343,490 277,631 - Discounts payable on Sales 449,253 249,822
792,743 527,453 818,351 944,879
20. Loans and Advances
Considered good
Loans due from: Executives - note 15.1 44,694 25,119 Employees - note 15.1 28,234 20,363
72,928 45,482Advances to: Directors and Executives - note 20.1 5,314 6,012 Employees 2,710 6,808 Contractors and suppliers 200,792 61,019 Others 4,911 5,619
213,727 79,458 286,655 124,940
Considered doubtful 10,620 8,120 297,275 133,060
Less: Provision for doubtful loans and advances - note 40.4 10,620 8,120 286,655 124,940
2010 2009
Amounts in Rs ’000
ICI Pakistan Limited Annual Report 2010 149

20.1 The maximum aggregate amount of advances due from the Directors and Executives at the end of any month during the yearwere Rs 3.245 million and Rs 7.364 million (2009: Rs 3.967 million and Rs 4.446 million) respectively.
21. Trade Deposits and Short-Term Prepayments
Trade deposits 22,451 9,768Short-term prepayments 432,781 444,665
455,232 454,433
22. Other Receivables
Considered good
Duties, sales tax and octroi refunds due 315,403 254,775Due from Associate - note 22.1 & note 22.2 78,721 85,225Insurance claims 9,965 11,887Commission receivable 47,341 39,829Interest income receivable 4,516 4,058Rebates receivable - 123,427Others 191,723 194,243
647,669 713,444Considered doubtful 16,982 17,383
664,651 730,827Less: Provision for doubtful receivables - note 22.3 16,982 17,383
647,669 713,444
22.1 The maximum aggregate amount due from ICI Omicron B.V. at the end of any month during the year was Rs 80.755 million (2009:Rs 81.978 million).
22.2 The above balances include amounts due from following associated undertakings:
ICI Omicron B.V. wholly owned subsidiary of AkzoNobel N.V. 78,586 80,420ICI Paints Vietnam ( Part of AkzoNobel group ) 89 4,805AkzoNobel Functional Chemicals 46 -
78,721 85,225
22.3 Movement of provision for doubtful receivables
Provision as at January 1 17,383 17,533Charge for the year - note 28 1,004 -Reversal (1,405) (150)Provision as at December 31 16,982 17,383
23. Cash and Bank Balances
Short term deposits - note 23.1 2,927,000 3,350,000Current accounts 1,567,365 1,016,353In hand - Cheques 230,942 169,633 - Cash 14,250 11,727
4,739,557 4,547,713
23.1 These are placed with various banks with maturity up to January 2011. The markup return on these deposits ranges between11.30% to 11.71%.
Amounts in Rs ’000
2010 2009
150 Annual Report 2010 ICI Pakistan Limited
Notes to the Consolidated Financial StatementsFor the year ended December 31, 2010

24. Operating Segment ResultsPolyester Soda Ash Paints Life Sciences Chemicals Others-PowerGen Group
2010 2009 2010 2009 2010 2009 2010 2009 2010 2009 2010 2009 2010 2009
Sales Afghanistan - - 1,210 - 105,623 88,800 - - - - - - 106,833 88,800
Bangladesh - - 156,953 86,476 - - - - 1,692 6,888 - - 158,645 93,364
India - - 419,359 27,882 - - - - - - - - 419,359 27,882
South Africa - - 97,790 76,605 - - - - - - - - 97,790 76,605
United Arab Emirates - - 28,934 16,556 - - - - - 158 - - 28,934 16,714
Others - - 14,242 3,989 - - - 810 11,207 18,055 - - 25,449 22,854
- - 718,488 211,508 105,623 88,800 - 810 12,899 25,101 - - 837,010 326,219
Inter-segment - - - - - - - - 417,420 276,573 956,672 676,003 1,374,092 952,576
Local 18,033,688 13,242,345 7,350,542 6,360,285 6,516,258 6,136,722 4,115,180 3,740,030 2,580,289 2,508,705 - - 38,595,957 31,988,087
18,033,688 13,242,345 8,069,030 6,571,793 6,621,881 6,225,522 4,115,180 3,740,840 3,010,608 2,810,379 956,672 676,003 40,807,059 33,266,882
Commission / Toll income - - - - - - - - 99,539 84,875 - - 99,539 84,875
Turnover 18,033,688 13,242,345 8,069,030 6,571,793 6,621,881 6,225,522 4,115,180 3,740,840 3,110,147 2,895,254 956,672 676,003 40,906,598 33,351,757
Sales tax - - 1,263,579 1,073,105 900,599 811,979 1,119 - 290,709 272,088 135,491 93,242 2,591,497 2,250,414
Excise Duty - - 60,160 52,328 54,115 49,947 - - 7,546 7,010 - - 121,821 109,285
Commission and discounts to distributors and customers 52,933 44,517 282,270 107,539 986,298 1,006,822 352,587 374,927 150,611 169,022 - - 1,824,699 1,702,827
52,933 44,517 1,606,009 1,232,972 1,941,012 1,868,748 353,706 374,927 448,866 448,120 135,491 93,242 4,538,017 4,062,526
Net sales, commission & toll income 17,980,755 13,197,828 6,463,021 5,338,821 4,680,869 4,356,774 3,761,474 3,365,913 2,661,281 2,447,134 821,181 582,761 36,368,581 29,289,231
Cost of sales - note 26 & 26.2 15,620,929 11,794,598 5,074,124 3,896,339 3,333,661 2,986,743 2,681,386 2,383,614 2,151,010 1,969,284 696,871 493,410 29,556,241 23,522,248
Gross profit 2,359,826 1,403,230 1,388,897 1,442,482 1,347,208 1,370,031 1,080,088 982,299 510,271 477,850 124,310 89,351 6,812,340 5,766,983
Selling and distribution expenses - note 27 72,543 75,236 203,173 112,223 765,075 725,114 493,036 424,700 140,892 132,901 - - 1,674,719 1,470,174
Administration and general expenses - note 28 & 28.2 265,191 239,111 290,708 291,821 448,873 381,949 148,242 137,107 145,991 128,076 3,010 546 1,301,775 1,178,370
Operating result 2,022,092 1,088,883 895,016 1,038,438 133,260 262,968 438,810 420,492 223,388 216,873 121,300 88,805 3,835,846 3,118,439
24.1 Segment assets 1,172,960 6,262,004 6,369,128 6,042,615 6,007,580 2,317,535 2,872,583 1,429,433 1,344,384 767,910 390,027 366,796 18,156,662 17,186,293
24.2 Unallocated assets 3,554,037 3,893,160
21,710,699 21,079,453
24.3 Segment liabilities 2,236,516 2,297,646 1,955,050 1,998,609 480,080 753,310 1,131,839 1,331,383 462,089 322,872 84,823 109,869 6,350,397 6,813,689
24.4 Unallocated liabilities 309,653 304,195
6,660,050 7,117,884
24.5 Non-cash items(Provision for non-management staff gratuity 10,795 10,249 28,493 27,052 8,554 8,121 5,309 5,041 5,840 5,545 - - 58,991 56,008 and eligible retired employees' medical scheme)
24.6 Depreciation & amortisation 335,033 326,976 475,600 436,885 90,644 72,376 15,645 14,507 26,889 19,944 83,688 86,621 1,027,499 957,309
24.7 Capital expenditure 109,785 83,573 469,040 461,508 176,238 148,599 25,883 16,489 35,770 36,015 61,137 8,766 877,853 754,950
24.8 Inter-segment pricing
Transactions among the business segments are recorded at arm's length prices using admissible valuation methods.
24.9 There was no major customer of the Group which formed 10 per cent or more of the Group's revenue.
Amounts in Rs ’000
ICI Pakistan Limited Annual Report 2010 151

25. Reconciliations of reportable segment revenues, cost of sales, assets and liabilities
25.1 Turnover
Total turnover for reportable segments - note 24 40,906,598 33,351,757
Elimination of inter-segment turnover (417,420) (276,573)
Elimination of inter-segment turnover from subsidiary (956,672) (676,003)
Total turnover 39,532,506 32,399,181
25.2 Cost of sales
Total cost of sales for reportable segments - note 26 29,556,241 23,522,248
Elimination of inter-segment purchases (417,420) (276,573)
Elimination of inter-segment purchases from subsidiary (956,672) (676,003)
Total cost of sales 28,182,149 22,569,672
25.3 Assets
Total assets for reportable segments 18,156,662 17,186,293
Taxation recoverable 545,951 460,240
Bank deposits - note 23 2,927,000 3,350,000
Due from Associates - note 22.2 78,586 80,420
Long term Investments - note 14 2,500 2,500
Total Assets 21,710,699 21,079,453
25.4 Liabilities
Total liabilities for reportable segments 6,350,397 6,813,689
Accrued interest / return on unsecured loan - note 10.2 305,109 299,647
Unclaimed dividends - note 10 4,544 4,548
Total Liabilities 6,660,050 7,117,884
2010 2009
Amounts in Rs ’000
152 Annual Report 2010 ICI Pakistan Limited
Notes to the Consolidated Financial StatementsFor the year ended December 31, 2010

26. Cost of SalesPolyester Soda Ash Paints Life Sciences Chemicals Others-PowerGen Group
2010 2009 2010 2009 2010 2009 2010 2009 2010 2009 2010 2009 2010 2009
Raw and packing materials consumed
Opening stock 612,350 512,080 74,436 370,987 285,368 324,080 146,489 111,021 100,114 104,334 8,820 13,743 1,227,577 1,436,245
Purchases Inter-segment - - - - 417,420 276,573 - - - - - - 417,420 276,573
Others 13,674,630 10,263,852 1,877,621 1,251,854 2,489,024 2,328,255 973,217 776,709 930,155 840,470 357,265 86,268 20,301,912 15,547,408
13,674,630 10,263,852 1,877,621 1,251,854 2,906,444 2,604,828 973,217 776,709 930,155 840,470 357,265 86,268 20,719,332 15,823,981
14,286,980 10,775,932 1,952,057 1,622,841 3,191,812 2,928,908 1,119,706 887,730 1,030,269 944,804 366,085 100,011 21,946,909 17,260,226
Closing stock - note 18 (867,612) (612,350) (203,975) (74,436) (259,951) (285,368) (282,021) (146,489) (85,070) (100,114) (30,335) (8,820) (1,728,964) (1,227,577)
Raw material consumed 13,419,368 10,163,582 1,748,082 1,548,405 2,931,861 2,643,540 837,685 741,241 945,199 844,690 335,750 91,191 20,217,945 16,032,649
Salaries, wages and benefits 336,069 332,146 540,016 499,952 96,312 81,234 3,078 3,037 39,211 37,879 14,456 14,767 1,029,142 969,015
Stores and spares consumed 118,723 90,109 119,593 114,679 3,704 4,476 - - 3,510 2,801 26,707 15,293 272,237 227,358
Conversion fee paid to contract manufacturers - - - - - - 201,368 186,899 4,341 4,416 - - 205,709 191,315
Oil, gas and electricity 1,394,075 841,024 1,962,927 1,406,785 28,851 28,235 - - 7,523 8,128 225,316 271,999 3,618,692 2,556,171
Rent, rates and taxes 1,234 846 1,379 655 15,893 6,210 - - 8,612 9,857 832 1,036 27,950 18,604
Insurance 17,722 15,497 16,236 12,755 27,849 26,518 2 3 973 300 954 1,518 63,736 56,591
Repairs and maintenance 1,670 950 695 43 15,585 18,190 9 11 3,242 3,174 128 151 21,329 22,519
Depreciation and amortisation - 319,963 320,585 455,542 423,211 75,205 60,803 428 694 15,087 13,886 83,688 86,621 949,913 905,800 note 12.5 & 13.1
Excise duty - - - - - - - - - - 8,124 5,854 8,124 5,854
Technical fees - - - - 23,270 19,279 1,815 1,445 5,750 3,010 - - 30,835 23,734
Royalty - - - - - - 2,076 1,008 24,862 24,470 - - 26,938 25,478
General expenses - note 26.2 106,805 92,148 83,627 64,268 67,637 57,373 400 452 10,965 10,431 916 4,980 268,610 227,912
Opening stock of work-in-process 54,163 108,866 - - 15,600 19,851 11,811 5,024 1,655 496 - - 83,229 134,237
Closing stock of work-in-process - note 18 (24,388) (54,163) - - (10,976) (15,600) (12,464) (11,811) (725) (1,655) - - (48,553) (83,229)
Cost of goods manufactured 15,745,404 11,911,590 4,928,097 4,070,753 3,290,791 2,950,109 1,046,208 928,003 1,070,205 961,883 696,871 493,410 26,775,836 21,314,008
Opening stock of finished goods 509,236 392,244 207,554 33,140 246,586 221,852 837,505 476,184 141,658 271,797 - - 1,942,539 1,395,217
Finished goods purchased 91,316 - - - 64,800 85,700 1,583,188 1,826,217 1,193,235 882,262 - - 2,932,539 2,794,179
16,345,956 12,303,834 5,135,651 4,103,893 3,602,177 3,257,661 3,466,901 3,230,404 2,405,098 2,115,942 696,871 493,410 31,650,914 25,503,404
Closing stock of finished goods - note 18 (725,027) (509,236) (58,912) (207,554) (246,547) (246,586) (774,839) (837,505) (233,838) (141,658) - - (2,039,163) (1,942,539)
Provision for obsolete stocks - note 28 - - (2,615) - (21,969) (24,332) (10,676) (9,285) (20,250) (5,000) - - (55,510) (38,617)
15,620,929 11,794,598 5,074,124 3,896,339 3,333,661 2,986,743 2,681,386 2,383,614 2,151,010 1,969,284 696,871 493,410 29,556,241 23,522,248
26.1 Staff retirement benefits
Salaries, wages and benefits include Rs 163.442 million (2009: Rs 193.055 million) in respect of staff retirement benefits.
26.2 Service Charges from subsidiary
This includes amount Rs 1.740 million charged by the Company for certain administrative service charges in accordance with the service level agreement which have been eliminated from the total.
Amounts in Rs ’000
ICI Pakistan Limited Annual Report 2010 153

27. Selling and Distribution ExpensesPolyester Soda Ash Paints Life Sciences Chemicals Others-PowerGen Group
2010 2009 2010 2009 2010 2009 2010 2009 2010 2009 2010 2009 2010 2009
Salaries and benefits 46,473 40,591 21,759 24,581 220,879 195,676 197,442 184,344 61,696 63,531 - - 548,249 508,723
Repairs and maintenance 14 122 1,079 1,063 3,933 3,537 2,179 1,862 1,381 1,033 - - 8,586 7,617
Advertising and publicity 1,163 15,480 10,948 896 253,121 262,189 86,049 64,513 817 987 - - 352,098 344,065
Rent, rates and taxes - - 1,282 922 19,323 23,491 5,897 4,404 739 1,182 - - 27,241 29,999
Insurance - - 1,028 434 - - 6,522 3,866 3,530 3,340 - - 11,080 7,640
Lighting, heating and cooling 15 17 1,088 873 6,683 4,807 2,297 1,969 2,164 1,980 - - 12,247 9,646
Depreciation and amortisation - note 12.5 & 13.1 - 59 277 327 - - 11,093 11,195 2,151 1,784 - - 13,521 13,365
Outward freight and handling 9,626 7,078 149,095 69,972 179,945 172,953 35,329 22,395 31,538 28,089 - - 405,533 300,487
Travelling expenses 7,022 3,206 2,703 1,882 30,082 30,588 68,932 63,407 12,171 11,567 - - 120,910 110,650
Postage, telegram, telephone and telex 529 423 1,325 774 7,046 5,801 10,728 9,759 3,688 3,447 - - 23,316 20,204
General expenses 7,701 8,260 12,589 10,499 44,063 26,072 66,568 56,986 21,017 15,961 - - 151,938 117,778
72,543 75,236 203,173 112,223 765,075 725,114 493,036 424,700 140,892 132,901 - - 1,674,719 1,470,174
27.1 Staff retirement benefits
Salaries, wages and benefits include Rs 81.569 million (2009: Rs 67.593 million) in respect of staff retirement benefits.
28. Administration and General Expenses
Salaries and benefits 129,271 134,531 191,647 193,284 168,579 134,481 85,980 93,672 81,934 72,479 - - 657,411 628,447
Repairs and maintenance 2,986 2,715 3,930 3,478 9,147 8,828 1,872 1,352 1,003 780 - - 18,938 17,153
Advertising and publicity 1,837 2,855 3,681 6,013 1,372 1,807 788 1,134 866 1,452 - - 8,544 13,261
Rent, rates and taxes 2,675 2,551 2,954 2,877 5,060 6,302 649 543 680 587 - - 12,018 12,860
Insurance 735 552 1,858 1,454 692 7,438 3,857 2,137 425 316 - - 7,567 11,897
Lighting, heating and cooling 3,637 3,172 6,200 5,273 4,655 3,518 4,664 3,590 1,416 1,077 - - 20,572 16,630
Depreciation and amortisation -
note 12.5 & 13.1 15,070 6,332 19,781 13,347 15,439 11,573 4,124 2,618 9,651 4,274 - - 64,065 38,144
Provision for doubtful debts - trade - note 40.4 - 5,610 - - 138,262 69,040 477 7 401 641 - - 139,140 75,298
- others - note 22.3 & 40.4 - - 381 - 2,500 - 623 - - - - - 3,504 -
Provision for obsolete stock - Note 18.1 - - 2,615 - 21,969 24,332 10,676 9,285 20,250 5,000 - - 55,510 38,617
Provision for obsolete spares - Note 17.1 59,100 40,000 - - 5,000 - - - - - - - 64,100 40,000
Travelling expenses 10,138 6,491 9,652 8,142 12,732 14,626 6,192 5,631 6,791 5,349 - - 45,505 40,239
Postage, telegram, telephone and telex 2,329 1,337 3,948 2,149 5,814 8,999 2,891 2,516 1,678 1,148 - - 16,660 16,149
General expenses note 28.2 37,413 32,965 44,061 55,804 57,652 91,005 25,449 14,622 20,896 34,973 3,010 546 188,241 229,675
265,191 239,111 290,708 291,821 448,873 381,949 148,242 137,107 145,991 128,076 3,010 546 1,301,775 1,178,370
28.1 Staff retirement benefits Salaries, wages and benefits include Rs 148.813 million (2009: Rs 132.772 million) in respect of staff retirement benefits.
28.2 Service Charges from subsidiary
This includes Rs 0.240 million charged by the Company for certain administrative service charges in accordance with the service level agreement which have been eliminated from the total.
Amounts in Rs ’000
154 Annual Report 2010 ICI Pakistan Limited
Notes to the Consolidated Financial StatementsFor the year ended December 31, 2010

29. Financial Charges
Mark-up on short-term financing 1,536 19,965Interest on workers' profit participation fund - note 10.3 6,948 2,105Discounting charges on receivables 94,940 82,383Exchange losses 59,564 74,454Interest on security deposits and others 2,428 6,835
165,416 185,742
30. Other operating charges
Auditors' remuneration - note 30.1 8,525 6,750Donations - note 30.2 22,277 16,464Workers' profit participation fund - note 10.3 199,302 162,326Workers' welfare fund 77,139 62,896
307,243 248,436
30.1 Auditors' remuneration
Audit and Group reporting fee 6,060 5,080Half yearly review and other certifications 1,815 1,015Out of pocket expenses 650 655
8,525 6,750
30.2 Donations include Rs 15.795 million (2009: Rs 13.97 million) to ICI Pakistan Foundation (Head office, Karachi). Mr. Waqar A Malik,Chief Executive; Mr. Ali Asrar Aga and Mr. Feroz Rizvi, Directors of the Company and Mr. Suhail Aslam Khan and Ms. Seemi Saad,Executives of the Company are amongst the Trustees of the Foundation.
31. Other operating income
Income from related parties
Service fees from related party - note 31.1 - 2,656
Return from financial assets
Profit on short-term and call deposits 282,906 167,995
Income from non-financial assets
Scrap sales 49,543 57,259Gain on disposal of property, plant and equipment 10,211 5,293
Others
Provisions and accruals no longer required written back 16,527 104,960Income on technical assistance - 244Income on sale of Adhesive to Henkel - 14,662Sundries 57,419 44,768
416,606 397,837
31.1 This represents amount charged by the Group for certain management and other services rendered to its related party LottePakistan PTA Limited, upto September 2009, in accordance with the Service Agreement based on commercial terms betweenthe Companies.
2010 2009
Amounts in Rs ’000
ICI Pakistan Limited Annual Report 2010 155

32. Taxation
Current 1,457,540 490,813Prior years - (17,439)Total current tax charge 1,457,540 473,374Deferred - note 8 (154,850) 554,394
Net tax charged - note 32.1 1,302,690 1,027,768
32.1 Tax reconciliation
Profit before tax 3,779,793 3,082,098
Tax @ 35% 1,322,928 1,078,734Prior years' tax charge - (17,439)Permanent difference - 5,762Tax impact on profit of subsidiary - note 32.2 (16,897) (3,357)Tax impact on income under FTR of the current year 2,992 (40,712)Others (6,333) 4,780Net tax charged 1,302,690 1,027,768
32.2 The turnover tax at the rate of 0.5% of turnover has been waived under second schedule of the income tax ordinance 2001.
33. Earnings per Share - Basic and diluted
Profit after taxation for the year 2,477,103 2,054,330
Number of shares Weighted average number of ordinary shares in issue during the year 138,802,300 138,802,300
RupeesEarnings per share 17.85 14.80
34. Remuneration of Directors and Executives
The aggregate amounts charged in the financial statements for the remuneration, including all benefits, to the Chairman, ChiefExecutive, Directors and Executives of the Group were as follows:
Chairman Chief Executive Directors Executives Total
2010 2009 2010 2009 2010 2009 2010 2009 2010 2009
Managerial remuneration 1,230 1,162 25,363 21,135 34,209 33,863 503,348 418,814 564,150 474,974
Retirement benefits - - 6,362 5,321 7,555 7,383 145,226 107,981 159,143 120,685
Group insurance - - 42 42 84 126 5,083 4,512 5,209 4,680
Rent and house maintenance - - 6,022 5,268 - - 148,819 122,368 154,841 127,636
Utilities - - 775 647 - - 36,802 30,310 37,577 30,957
Medical expenses - - 91 203 221 419 19,661 15,410 19,973 16,032
1,230 1,162 38,655 32,616 42,069 41,791 858,939 699,395 940,893 774,964
Number of persons 1 1 1 1 4 5 382 328 388 335
2010 2009
Amounts in Rs ’000
156 Annual Report 2010 ICI Pakistan Limited
Notes to the Consolidated Financial StatementsFor the year ended December 31, 2010

34.1 In addition to this, an amount of Rs 228.9 million (2009: Rs 209.8 million) on account of variable pay, to employees, has beenrecognised in the current year. This amount is payable in 2011 after verification of achievements against target. Further, a specialbonus of Rs 12.0 million (2009: Rs 28.9 million) payable to certain employees has been recognised in the financial statementswhich is payable in 2011.
Out of variable pay recognised for 2009 and 2008 following payments were made:Paid in 2010 Paid in 2009relating to relating to
2009 2008
Chief Executive 13,163 11,765Directors 33,529 11,400Executives 125,444 92,752Other employees 9,192 37,131
181,328 153,048
34.2 The Directors and certain Executives are provided with free use of Company cars in accordance with their entitlement. The ChiefExecutive is provided with Company maintained furnished accommodation and free use of Company car.
34.3 Aggregate amount charged in the financial statements for remuneration to three Non-executive Directors (not included above)was Rs 3.225 million (2009: Rs 3.228 million). This includes fees paid to directors amounting to Rs. 0.220 million (2009: Rs. 0.249million) for attending board and other meetings which is not included above.
34.4 The above balances include an amount of Rs 188.114 million (2009: Rs 141.359 million) on account of remuneration of keymanagement personnel out of which Rs 26.274 million (2009: Rs 24.356 million) relates to post employment benefits.
35. Transactions with Related Parties
The related parties comprise parent company (ICI Omicron B.V.), ultimate parent company (Akzo Nobel N.V.), related groupcompanies, local associated company, directors of the Company, companies where directors also hold directorship, key employees(note 34) and staff retirement funds (note 7). Details of transactions with related parties, other than those which have beenspecifically disclosed elsewhere in these consolidated financial statements are as follows:
2010 2009Associated companies
Purchase of goods, materials and services 118,487 5,750,335Provision of services and other receipts 4,600 6,440Sale of goods and materials 131,099 126,429Dividends 1,052,291 789,218Donations 15,795 13,970
36. Plant Capacity and Annual Production
- in metric tones except Paints which is in thousands of liters and PowerGen which is in thousand of Kilowatts:
2010 2009
Annual Production Annual ProductionName Plate Name Plate
Capacity Capacity
Polyester 122,000 129,445 122,000 123,642Soda Ash - note 36.1 350,000 278,650 350,000 269,500Paints - note 36.2 - 34,748 - 33,741Chemicals - note 36.2 - 9,082 - 8,477Sodium Bicarbonate 20,000 23,700 20,000 22,580PowerGen - note 36.3 221,978 67,343 221,978 63,765
36.1 Production was below name plate capacity due to gas curtailment.
36.2 The capacity of Paints and Chemicals is indeterminable because these are multi-product plants.
36.3 Electricity by PowerGen is produced as per demand.
Amounts in Rs ’000
ICI Pakistan Limited Annual Report 2010 157

37. Fair Value of Financial Assets and Liabilities
The carrying amounts of the financial assets and financial liabilities approximate their fair values and is determined on the basisof non observable market data.
38. FINANCIAL RISK MANAGEMENT
The Group's activities expose it to a variety of financial risks: credit risk, liquidity risk and market risk (including currency risk,interest rate risk and price risk). The Group's overall risk management policy focuses on the unpredictability of financial marketsand seeks to minimize potential adverse effects on the Group's financial performance.
38.1 Risk Management Framework
The Board of Directors has overall responsibility for establishment and over sight of the Group's risk management framework.The executives management team is responsible for developing and monitoring the Group’s risk management policies. The teamregularly meets and any changes and compliance issues are reported to the Board of Directors through the audit committee.
Risk management systems are reviewed regularly by the executive management team to reflect changes in market conditionsand the Group’s activities. The Group, through its training and management standards and procedures, aims to develop a disciplinedand constructive control environment in which all employees understand their roles and obligations.
The audit committee oversees compliance by management with the Group’s risk management policies and procedures, andreviews the adequacy of the risk management framework in relation to the risks faced by the Group.
39. Market Risk
Market risk is the risk that the fair value or future cash flows of a financial instrument will fluctuate because of changes in marketprices. Market risk comprises of currency risk, interest rate risk and other price risk.
39.1 Interest Rate Risk
Interest rate risk is the risk that the fair values of future cash flows of a financial instrument will fluctuate because of changes inmarket interest rates. At the reporting date the interest rate profile of Group's interest-bearing financial instruments were:
Carrying Amount
2010 2009
Fixed rate instruments
Financial assets - Note 23 2,927,000 3,350,000
Financial liabilities - Note 10 (80,700) (71,993)
2,846,300 3,278,007
Sensitivity analysis for fixed rate instrumentsThe Group does not account for any fixed rate financial assets and liabilities at fair value through profit and loss, therefore a changein interest rates at the reporting date would not affect profit and loss.
Amounts in Rs ’000
158 Annual Report 2010 ICI Pakistan Limited
Notes to the Consolidated Financial StatementsFor the year ended December 31, 2010

39.2 Foreign currency risk
Foreign currency risk is the risk that the fair value or future cash flows of a financial instrument will fluctuate because of changesin foreign exchange rates. Foreign currency risk arises mainly where receivables and payables exist due to transactions enteredin foreign currencies. The Group is exposed to foreign currency risk on sales, purchases and borrowings, which, are entered ina currency other than Pak Rupees. However the forward foreign exchange contracts were not available for imports in 2010 inaccordance with State Bank of Pakistan instructions.
SGD EURO USD GBP JPY
2010
Trade debts - - 9,641 - -Other receivables - 10,859 17,665 11,812 -Due from Associate - note 22.2 - - 135 78,586 -Cash and bank balances - - 98,227 - -
- 10,859 125,668 90,398 -Trade and other payables - 107,789 1,235,916 662,294 -Accrued interest / return on unsecured loan - note 10.2 - - 305,109 - -Due to Associates - note 10.1 15 59,580 21,607 1,371 -
15 167,369 1,562,632 663,665 -Gross balance sheet exposure (15) (156,510) (1,436,964) (573,267) -
2009Trade debts - 2,800 11,667 - -Other receivables - - 123,427 - -Due from Associate - note 22.2 - - 4,805 80,420 -Cash and bank balances - - 62,287 - -
- 2,800 202,186 80,420 -Trade and other payables 4,719 57,646 1,687,759 504,207 5,293Accrued interest / return on unsecured loan - note 10.2 - - 299,647 - -Due to Associates - note 10.1 26,105 5,340 4,774 7,029 - 30,824 62,986 1,992,180 511,236 5,293Gross balance sheet exposure (30,824) (60,186) (1,789,994) (430,816) (5,293)
Significant exchange rates applied during the year were as follows:
Average rate for the year Spot rate as at December 312010 2009 2010 2009
Rupees per Rupees Rupees
EURO 113.09 113.84 114.30 121.37USD 85.18 81.69 85.75 84.24GBP 131.75 127.85 132.72 137.81JPY 0.97 0.87 1.05 0.91SGD 62.55 56.52 66.87 60.06
Sensitivity analysis Every 1% increase or decrease in exchange rate with all other variables held constant will increase or decrease profit after taxfor the year by Rs 21.7 million (2009: Rs 23.2 million).
40. Credit Risk
Credit risk represents the accounting loss that would be recognised at the reporting date if counter-parties failed completely toperform as contracted. The Group does not have significant exposure to any individual counterparty. To reduce exposure to creditrisk the Group has developed a formal approval process whereby credit limits are applied to its customers. The management alsocontinuously monitors the credit exposure towards the customers and makes provision against those balances considered doubtfulof recovery. To mitigate the risk, the Group has a system of assigning credit limits to its customers based on an extensive evaluationbased on customer profile and payment history. Outstanding customer receivables are regularly monitored. Business with customersis also secured, where possible, by way of inland letters of credit, cash security deposit and bank guarantees.
Amounts in Rs ’000
ICI Pakistan Limited Annual Report 2010 159

The Group's maximum exposure to credit risk at the reporting date is as follows:
40.1 Financial Assets
Long-Term Investment - note 14 2,500 2,500Long term loans - note 15 148,265 131,430Long term deposits - note 16 22,873 21,211Trade debts - note 19 818,351 944,879Loans and advances - note 20 286,655 124,940Trade deposits - note 21 22,451 9,768Other receivables - note 22 332,266 458,669Bank balances - note 23 4,725,307 4,535,986
6,358,668 6,229,383
The Group has placed its funds with banks which are rated A-1 by Standard & Poor's and P-1 by Moody's.
40.2 Financial Assets - Secured 496,973 546,340 - Unsecured 5,861,695 5,683,043
6,358,668 6,229,383
40.3 The ageing of bank balances, trade receivables and loans and advances at the reporting date is as follows:
Not past due 5,692,736 5,259,252Past due but not impaired: Not more than three months 122,131 281,317Past due and Impaired: more than three months and not more than six months 30,893 63,002 more than six months and not more than nine months 12,327 25,352 more than nine months and not more than one year 27,165 43,378 more than one year 299,171 219,255
491,687 632,304
Less: Provision for: 343,490 277,631 - Doubtful debts 10,620 8,120 - Doubtful loans and advances 354,110 285,751
5,830,313 5,605,805
40.4 Movement of provision for trade debts and loans and advances
Trade Debts Loans Totaland Advances
Opening 277,631 8,120 285,751 201,483Additional provision - note 28 139,140 2,500 141,640 75,298Provision utilised against write offs (57,409) - (57,409) 9,646Provision no longer required (15,872) - (15,872) (676)
343,490 10,620 354,110 285,751
2010 2009
Amounts in Rs ’000
160 Annual Report 2010 ICI Pakistan Limited
Notes to the Consolidated Financial StatementsFor the year ended December 31, 2010

40.5 The maximum exposure to credit risk for past due and impaired at the reporting date by type of counterparty was:
Wholesale customers 202,884 164,282Retail customers 109,691 284,408End-user customers 179,112 183,614
491,687 632,304Less: Provision for: - Doubtful debts 343,490 277,631 - Doubtful loans and advances 10,620 8,120
354,110 285,751 137,577 346,553
40.5.1 The recommended approach for provision is to assess the top layer (covering 50%) of trade receivables on an individual basisand apply a dynamic approach to the remainder of receivables. The procedure introduces a Group-standard for dynamic provisioning:• Provide impairment loss for 50% of the outstanding receivable when overdue more than 90 days, and• Provide impairment loss for 100% when overdue more than 120 days.
40.6 Concentration Risk
The sector wise analysis of receivables, comprising trade debts, loans and advances and bank balances is given below:
Textile 92,073 217,085Glass 14,415 22,679Ceramics - 2,985Paper and Board 24,641 18,137Chemicals 240,731 232,624Pharmaceuticals 36,880 18,799Construction 12,701 31,972Transport 36,976 60,264Paints 621,046 516,308Bank 4,725,307 4,535,986Others 379,653 234,717
6,184,423 5,891,556Less: Provision for: - Doubtful debts 343,490 277,631 - Doubtful loans and advances 10,620 8,120
354,110 285,751 5,830,313 5,605,805
2010 2009
Amounts in Rs ’000
ICI Pakistan Limited Annual Report 2010 161

Amounts in Rs ’000
41. Liquidity Risk
Liquidity Risk is the risk that an entity will encounter difficulty in meeting obligations associated with financial liabilities. Prudentliquidity risk management implies maintaining sufficient cash and marketable securities and the availability of funding through anadequate amount of committed credit facilities. Group's treasury aims at maintaining flexibility in funding by keeping committedcredit lines available.
The table below analyse the Group's financial liabilities into relevant maturity groupings based on the remaining period at thebalance sheet to the maturity date.
Carrying Contractual Less than amount cash flows one year
2010
Financial liabilities
Trade creditors - note 10 1,082,075 1,082,075 (1,082,075)
Bills payable 1,988,466 1,988,466 (1,988,466)
Mark-up accrued on short term financing 1,786 1,786 (1,786)
Accrued interest / return on unsecured loan - note 10.2 305,109 305,109 (305,109)
Accrued expenses 1,169,705 1,169,705 (1,169,705)
Technical service fee / Royalty 30,316 30,316 (30,316)
Distributors' security deposits - payable on termination of distributorship - note 10.4 80,700 89,981 (89,981)
Contractors' earnest / retention money 11,653 11,653 (11,653)
Unclaimed dividends 4,544 4,544 (4,544)
Payable for capital expenditure 101,551 101,551 (101,551)
Others 107,610 107,610 (107,610)
4,883,515 4,892,796 (4,892,796)
It is not expected that the cash flows included in the maturity analysis could occur significantly earlier or at significantly differentamount.
2009
Financial liabilities
Trade creditors - note 10 977,600 977,600 (977,600)
Bills payable 2,270,855 2,270,855 (2,270,855)
Mark-up accrued on short term financing 2,712 2,712 (2,712)
Accrued interest / return on unsecured loan - note 10.2 299,647 299,647 (299,647)
Accrued expenses 1,177,342 1,177,342 (1,177,342)
Technical service fee / Royalty 35,975 35,975 (35,975)
Distributors' security deposits - payable on termination of distributorship - note 10.4 71,993 77,392 (77,392)
Contractors' earnest / retention money 10,103 10,103 (10,103)
Unclaimed dividends 4,548 4,548 (4,548)
Payable for capital expenditure 139,532 139,532 (139,532)
Others 151,781 151,781 (151,781)
5,142,088 5,147,487 (5,147,487)
162 Annual Report 2010 ICI Pakistan Limited
Notes to the Consolidated Financial StatementsFor the year ended December 31, 2010

42. Capital Risk Management
The Group's objective when managing capital is to safe guard the Group’s ability to continue as a going concern so that it cancontinue to provide returns for shareholders and benefits for other stakeholders; and to maintain a strong capital base to supportthe sustained development of its businesses.
The Group manages its capital structure by monitoring return on net assets and makes adjustments to it in the light of changesin economic conditions. In order to maintain or adjust the capital structure, the Group may adjust the amount of dividend paid toshareholders or issue new shares.
43. Accounting Estimates and Judgements
Income Taxes
The Group takes into account the current income tax law and decisions taken by appellate authorities. Instances where the Group'sview differs from the view taken by the income tax department at the assessment stage and where the Group considers that itsview on items of material nature is in accordance with law, the amounts are shown as contingent liabilities (unless there is remotepossibility of transfer of benefits).
The Income Tax Appellate Tribunal earlier set aside the assessment for the assessment year 1998-99 on the issues of date ofcommissioning of PTA plant & depreciation thereon, restriction of cost of capitalisation of PTA plant and addition to income inrespect of trial production stocks. The re-assessment was finalised by the department during the year giving rise to an additionaltax demand. The Company has filed an appeal against the said order before the CIT(Appeals), hearing of appeal has beencompleted and the order is awaited.
The tax department reopened the income tax assessment for the assessment year 2001-2002 on the ground that demerger of PTA businessfrom ICI Pakistan Ltd. was effective from the completion date i.e. August 6, 2001. This was challenged by the Group in the High Court whichupheld the Group's contention that the department did not have the right to reopen this finalised assessment. The department has howeverfiled an appeal in the Supreme Court against the High Court’s order. The appeal was dismissed by the Supreme Court.
For the assessment year 2002-2003 on receipt of notice under section 62 of the Income Tax Ordinance, 1979, the Company hadfiled a writ petition in the Supreme Court challenging the tax department’s notice that the effective date of PTA’s demerger wasAugust 6, 2001 rather than the effective date given in the Scheme of Arrangement as October 1, 2000. That notice had raisedcertain issues relating to vesting of PTA assets by the Company which has been settled in the assessment year 2001-2002. Whilethis case is pending for adjudication, review of the Supreme Court's decision relating to assessment year 2001-2002 it is unlikelythat the department can take an adverse action.
Whilst amending the assessment for the Tax Year 2003 and 2004, tax department has taken certain action in the order, consideredby the department as “protective assessment” on the matter of unabsorbed depreciation carried forward. It is the Group's contentionthat such an action is unwarranted. An appeal before the CIT (Appeals), on the matter has been filed which is pending. The verybasis of such an action have also been challenged before the High Court of Sindh which are pending for hearing. While this caseis pending for adjudication, review of the Supreme Court's decision relating to assessment year 2001-2002 it is unlikely that thedepartment can take an adverse action.
Notice under section 221 of the Income Tax Ordinance 2001 for rectification of deemed assessment order for the Tax Year 2005has been issued to disallow unabsorbed depreciation carried forward. A writ petition against the said notice has been filed withthe High Court of Sindh which is pending for hearing. While this case is pending for adjudication, in view of the Supreme Court'sdecision relating to assessment year 2001-2002 it is unlikely that the department can take an adverse action.
Pension and Gratuity
Certain actuarial assumptions have been adopted as disclosed in note 7 to the financial statements for valuation of present valueof defined benefit obligations and fair value of plan assets. Any changes in these assumptions in future years might affectunrecognised gains and losses in those years.
Property, Plant and Equipment
The estimates for revalued amounts, if any, of different classes of property, plant and equipment, are based on valuation performedby external professional valuers and recommendation of technical teams of the Group. The said recommendations also includeestimates with respect to residual values and depreciable lives. Further, the Group reviews the value of the assets for possibleimpairment on an annual basis. The future cash flows used in the impairment testing of assets is based on management's bestestimates which may change in future periods. Any change in the estimates in future years might affect the carrying amounts ofthe respective items of property, plant and equipments with a corresponding affect on the depreciation charge and impairment.
44. Standards or Interpretations not yet effective
The following standards, amendments and interpretations of approved accounting standards are effective for accounting periodsbeginning on or after January 1, 2011. These standards are either not relevant to the Group's operations or are not expected tohave significant impact on the Group's financial statements:
Amendment to IAS 32 Financial Instruments: Presentation – Classification of Rights Issues (effective for annual periodsbeginning on or after February 01, 2010). The IASB amended IAS 32 to allow rights, options or warrants to acquire a fixednumber of the entity’s own equity instruments for a fixed amount of any currency to be classified as equity instruments providedthe entity offers the rights, options or warrants pro rata to all of its existing owners of the same class of its own non-derivativeequity instruments. This interpretation has no impact on the Group's financial statements.
ICI Pakistan Limited Annual Report 2010 163

IFRIC 19 Extinguishing Financial Liabilities with Equity Instruments (effective for annual periods beginning on or afterJuly 01, 2010). This interpretation provides guidance on the accounting for debt for equity swaps. This interpretation has no impacton Group's financial statements.
IAS 24 Related Party Disclosures (revised 2009) – effective for annual periods beginning on or after January 01, 2011.The revision amends the definition of a related party and modifies certain related party disclosure requirements for government-related entities. The amendment in future may result in certain changes in disclosures.
Amendments to IFRIC 14 IAS 19 – The Limit on a Defined Benefit Assets, Minimum Funding Requirements and theirInteraction (effective for annual periods beginning on or after January 01, 2011). These amendments remove unintendedconsequences arising from the treatment of prepayments where there is a minimum funding requirement. These amendmentsresult in prepayments of contributions in certain circumstances being recognised as an asset rather than an expense. Thisamendment is not likely to have any impact on Group's financial statements.
Improvements to IFRSs 2010 – In May 2010, the IASB issued improvements to IFRSs 2010, which comprise of 11 amendmentsto 7 standards. Effective dates, early application and transitional requirements are addressed on a standard by standard basis.The majority of amendments are effective for annual periods beginning on or after January 1, 2011. The amendments include listof events or transactions that require disclosure in the interim financial statements and fair value of award credits under thecustomer loyalty programmes to take into account the amount of discounts or incentives that otherwise would be offered tocustomers that have not earned the award credits. Certain of these amendments will result in increased disclosures in the financialstatements.
Amendments to IAS 12 – deferred tax on investment property (effective for annual periods beginning on or after January1, 2012). The 2010 amendment provides an exception to the measurement principle in respect of investment property measuredusing the fair value model in accordance with IAS 40 Investment Property. The amendment has no impact on financial statementsof the Group.
Amendments to IFRS 7 - Disclosures – Transfers of Financial Assets (effective for annual periods beginning on or afterJuly 1, 2011). The amendments introduce new disclosure requirements about transfers of financial assets including disclosuresfor financial assets that are not derecognised in their entirety; and financial assets that are derecognised in their entirety but forwhich the entity retains continuing involvement. These amendments will result in increased disclosures in the financial statements.
45. Dividend
The directors in their meeting held on February 16, 2011 have recommended a final dividend of Rs 12.00 per share (2009: Rs4.50 per share) in respect of year ended December 31, 2010. The consolidated financial statements for the year ended December31, 2010 do not include the effect of the above dividend which will be accounted for in the period in which it is approved.
46. Date of Authorisation
These consolidated financial statements were authorised for issue in the Board of Directors meeting held on February 16, 2011.
47. General
47.1 Figures have been rounded off to the nearest thousand rupees except stated otherwise.
47.2 Corresponding Figures
Corresponding figures have been rearranged and reclassified, wherever necessary, for better presentation and disclosure.
Reclassification from component Reclassification to component Amounts in Rs '000
Administration and General Expenses Administration and General Expenses 1,807-General expenses -Advertising and publicity expenses
Selling and Distribution Expenses Selling and Distribution Expenses-General expenses -Lighting, heating and cooling 1,774
M J Jaffer Waqar A Malik Feroz RizviChairman / Director Chief Executive Chief Financial Officer
164 Annual Report 2010 ICI Pakistan Limited
Notes to the Consolidated Financial StatementsFor the year ended December 31, 2010

Notice of Meeting
Notice is hereby given that the Fifty-Ninth Annual General Meeting of ICI PAKISTAN LIMITED will be held on Wednesday, April 27, 2011 at 11:00 a.m. at the Institute of Chartered Accountants of Pakistan, Chartered Accountants Avenue, Clifton,Karachi, to transact the following business;
ORDINARY BUSINESS
1. To receive, consider and adopt the accounts of the Company for the year ended December 31, 2010, the report of theAuditors thereon and the report of the Directors.
2. To declare and approve Final cash dividend @ 120% i.e., Rs. 12.00 per ordinary share of Rs 10/- each for the yearended December 31, 2010 as recommended by the Directors, payable to the Members whose names appear in theRegister of Members as at April 20, 2011.
3. To appoint the Auditors of the Company and to fix their remuneration.
4. To elect eight Directors in accordance with the provisions of the Companies Ordinance 1984 for a period of three yearscommencing from April 29, 2011.
The retiring Directors are Messrs M J Jaffer, Waqar A Malik, Mueen Afzal, Ali A Aga, Bart Kaster, James R Rees, FerozRizvi, Rogier M G Roelen, M Nawaz Tiwana, Derek W Welch.
SPECIAL BUSINESS
5. To authorize the Executive Directors to hold their respective offices of profit in the Company.
A statement as required by section 160(1)(b) of the Companies Ordinance 1984 in respect of the special business to beconsidered at the Annual General Meeting is annexed.
By Order of the Board
March 21, 2011 Saira NishtarKarachi Company Secretary
ICI Pakistan Limited Annual Report 2010 165

1. Share Transfer Books of the Company will remain closed fromApril 20, 2011 to April 27, 2011 (both days inclusive). Transfersreceived in order at the office of our Shares Registrar, FAMCOAssociates (Pvt) Limited, State Life Building 1-A, 1st Floor, I.I.Chundrigar Road, Karachi-74000, by the close of business onApril 19, 2011 will be in time to entitle the transferees to thefinal dividend and to attend the meeting.
2. All Members are entitled to attend and vote at the meeting.
3. A Member entitled to attend and vote at the meeting is entitledto appoint a proxy to attend, speak and vote for him/her. Aproxy must be a Member of the Company.
4. An instrument of proxy applicable for the meeting is beingprovided with the notice sent to Members. Further copies ofthe instrument of proxy may be obtained from the RegisteredOffice of the Company during normal office hours.
5. An instrument of proxy must, to be valid, be deposited at theRegistered Office of the Company not less than 48 hoursbefore the time of the meeting.
6. Members are requested to submit a copy of their ComputerizedNational Identity Card (CNIC), if not already provided andnotify immediately changes, if any, in their registered addressto our Shares Registrar, FAMCO Associates (Pvt) Ltd.
7. CDC Account Holders will further have to follow the undermentioned guidelines as laid down in Circular 1 dated January26, 2000 issued by the Securities and Exchange Commissionof Pakistan.
A. For Attending the Meeting:
(i) In case of individuals, the account holder or sub-accountholder and/or the person whose securities are in groupaccount and their registration details are uploaded as perthe Regulations, shall authenticate his identity by showinghis original CNIC or original passport at the time of attendingthe meeting.
(ii) In case of corporate entity, the Board of Directors'resolution/power of attorney with specimen signature of thenominee shall be produced (unless it has been providedearlier) at the time of the meeting.
B. For Appointing Proxies:
(i) In case of individuals, the account holder or sub-accountholder and/or the person whose securities are in groupaccount and their registration details are uploaded as perthe Regulations, shall submit the proxy form as per theabove requirement.
(ii) The proxy form shall be witnessed by two persons whosenames, addresses and CNIC numbers shall be mentionedon the form.
(iii) Attested copies of CNIC or the passport of the beneficialowners and the proxy shall be furnished with the proxy form.
(iv) The proxy shall produce his original CNIC or original passportat the time of the meeting.
(v) In case of corporate entity, the Board of Directors'resolution/power of attorney with specimen signature shallbe submitted (unless it has been provided earlier) alongwith proxy form to the Company.
8. Any person who seeks to contest the election of Directorsshall file with the Company at its registered office not laterthan fourteen days before the above said meeting his / herintention to offer himself / herself for the election of the Directorsin terms of Section 178 (3) of the Companies Ordinance, 1984together with (a) consent in Form 28, (b) a Declaration withconsent to act as a Director in the manner as provided underclause (ii) of the Code of Corporate Governance, (c) aDeclaration in terms of clause (iii), (iv) and (v) of the Code ofCorporate Governance.
Notes:
166 Annual Report 2010 ICI Pakistan Limited

This statement sets out the material facts concerning the Special Business to be transacted at the Annual General Meetingto be held on April 27, 2011.
AGENDA ITEM 5
The Executive Directors are to be authorized to hold their respective offices of profit in the Company under their respectivecontracts of service. For this purpose, it is proposed that the following resolutions be considered and passed as an ordinaryresolution:
RESOLVED THAT approval be and is hereby granted for holding of offices of profit in the Company by the ExecutiveDirectors, including the Chief Executive and Alternate Directors (if any), and the payment of remuneration to them for theirrespective periods of service in accordance with their respective contracts of service and the applicable service rules ofthe Company (including without limitation salary, bonuses, incentives, perquisites, allowances and retirement benefits).
FUTHER RESOLVED THAT in the event of any of the aforesaid offices of profit falling vacant, the approval hereby givenshall, subject to the terms of appointment, be equally applicable to any other person appointed to fill such vacancy.
STATEMENT UNDER SECTION 160(1) (b) OF THE COMPANIES ORINANCE, 1984
ICI Pakistan Limited Annual Report 2010 167

The Fifty-ninth Annual General Meeting of ICI Pakistan Limited will be held on Wednesday, April 27, 2011 at11:00 a.m. at the Institute of Chartered Accountants of Pakistan, Chartered Accountants Avenue, Clifton,Karachi.
Company's transport will wait at the corner of Karachi Stock Exchange Road, between 9:45 a.m. and 10:15a.m. on the date of Meeting. Shareholders desirous of attending the Meeting may avail this facility.
Kindly bring this slip duly signed by you for attending the Meeting.
Company Secretary
Name
Shareholder No. Signature
Note:
i) The signature of the shareholder must tally with the specimen signature on the Company's record.
ii) Shareholders are requested to hand over duly completed admission slips at the counter before enteringthe Meeting premises.
CDC Account Holders / Proxies / Corporate Entities:
a) The CDC Account Holder / Proxy shall authenticate his identity by showing his / her identity by showinghis / her original Computerized National Identity Card (CNIC) or original passport at the time of attendingthe Meeting.
b) In case of corporate entity, the Board of Directors’ resolution / power of attorney with specimen signatureof the nominee shall be produced at the time of the Meeting (unless it has been provided earlier).
This Admission Slip is Not Transferable
Admission Slip

Form of Proxy59th Annual General Meeting
I / We
of
being member(s) of ICI Pakistan Limited holding
ordinary shares hereby appoint
of or failing him / her
of who is / are also member(s) of ICI Pakistan Limited as my / ourproxy in my / our absence to attend and vote for me / us and on my / our behalf at the Fifty-ninth AnnualGeneral Meeting of the Company to be held on April 27, 2011 and at any adjournment thereof.
Important:
1. This Proxy Form, duly completed and signed, must be received at the Registered Office of the Company, ICI House, 5West Wharf, Karachi, not less than 48 hours before the time of holding the meeting.
2. No person shall act as proxy unless he himself is a member of the Company, except that a corporation may appoint aperson who is not a member.
3. If a member appoints more than one proxy and more than one instruments of proxy are deposited by a member withthe Company, all such instruments of proxy shall be rendered invalid.
For CDC Account Holders / Corporate Entities:
In addition to the above the following requirements have to be met:
i) The proxy form shall be witnessed by two persons whose names, addresses and CNIC numbers shall be mentionedon the form.
ii) Attested copies of CNIC or the passport of the beneficial owners and the proxy shall be furnished with the proxy form.
iii) The proxy shall produce his original CNIC or original passport at the time of the meeting.
iv) In case of corporate entity, the Board of Directors resolution / power of attorney with specimen signature shall besubmitted (unless it has been provided earlier) along with proxy form to the Company.
Signature onRevenue Stampof Appropriate
Value
This signature shouldagree with thespecimen registeredwith the Company.
Folio / CDC Account No.
As witness my / our hand / seal this day of 2011
Signed by the said
in the presence of 1.
2.

AffixCorrectPostage
The Company SecretaryICI Pakistan LimitedICI House5 West WharfKarachi-74000


Environmental Performance
Emissions Control 16
Water Usage 17
Waste Management 18
Product Stewardship 19
Energy Efficiencies 20
G3 Content Index 21
Assurance statement 23
About us 01
Key Performance Indicators 02
About the report 04
Sustainability Strategy 05
Sustainability Framework 06
Stakeholder Dialogue 07
Economic Performance
Integrity Management 08
Sourcing 09
Social Performance
Employment Practices 10
Community Investment 12
Health, Safety & Security 14
Employee Engagement Community Investment Behavior Based Safety Effluent Treatment Plant Reverse Osmosis
11 13 15 17 20
We have used the G3 Reporting Frameworkissued by the Global Reporting Initiative (GRI)and are applying the GRI Reporting Frameworkat Application Level C+
Rep
ort
Ext
erna
lly A
ssur
ed
Man
dat
ory
Selfdeclared
Thirdparty
checked
Op
tiona
l
C C+ B B+ A A+
GRIchecked R
epor
t E
xter
nally
Ass
ured
(Third-Party-Checked)“United Registrar of Systems (URS)” has checked our reporting and has confirmed it to beApplication Level C+


2009 2010 2015Integrity Management Target
Code of Conduct confirmed incidents number 10 23 0
Code of Conduct trained* % employees 100 100 100**
Management audits including reassurance audits number 6 11 6
Serious incidents – Level 3 number 1 1 0
Serious incidents – Level 1, 2 number 0 2 0
Serious loss of containment – Level 4 number 0 0 0
Regulatory actions – Level 3 number 0 0 0
Sourcing
Vendor Policy signed by key suppliers % 88 83.8 96
Vendor Policy signed by central NPR suppliers*** % **** - -
Supportive supplier visits since 2007 number 21 79 146
Employment Practices
Women executives***** % 0 0 12
On-line P&D Dialog participation % 77 80 90
Management development program No of managers 34 121 338
Employee engagement index % favorable - 75 80
Community Investment Community Program Investment PKR Million 16.464 42.5****** 30
Health, Safety & Security
Fatalities employees number 0 0 0
Total reportable injury rate employees/supervised contractors /million hours 0.28 0.28 0
Lost time injury rate employees/ supervised contractors /million hours 0 0.14 0.
Occupational illness rate employees /million hours 0 0 0
Total illness absence rate employees % 1.79 1.92 1.76
Fatalities contractors (supervised and independent) number 1 0 0
Total reportable injury rate independent contractors /million hours 0.52 0 0
Lost time injury incidence independent contractors number 1 0 0
% sites with BBS program % 0 100 100
Distribution incidents number 1 1 0
Motor vehicle incidents with injury number 0 1 0
Key Performance
02 Sustainability ICI Pakistan Limited Annual Report 2010

2009 2010 2015Emissions Control Target
COD emissions per ton production te 105.37 52.59 49.96
kg/te 0.15 0.11 0.10
VOC emissions per ton production te 161.25 81.81 77.72
kg/te 0.23 0.18 0.16
NOx emissions per ton production te 422.42 430.70 409
kg/te 0.61 0.93 0.83
SOx emissions per ton production te 1431.40 2209.11 2430
kg/te 2.05 4.76 4.95
Direct CO2 emissions (Scope 1) per ton production million te 0.47 0.39 0.37
kg/te 676.13 834.70 753
Indirect CO2 emissions (Scope 2) per ton production te 39,907 2447.82 2324.65
kg/te 57.3 5.3 4.73
Water Usage
Fresh water use million m3 6.49 4.59 4.36
per ton production m3/te 9.8 9.9 8.9
% sites with sustainable fresh water % 25 25 100
Waste Management
Total waste kiloton 19.015 4.412 4.191
per ton production kg/ton 27.32 9.53 8.53
Total hazardous waste kiloton 0.31 0.54 0.51
per ton production kg/ton 0.45 1.17 1.04
Non-reusable waste kiloton 0.408 0.295 0.280
per ton production kg/ton 0.59 0.64 0.57
Hazardous non-reusable waste kiloton 0.151 0.251 0.238
per ton production kg/ton 0.22 0.54 0.48
Hazardous waste to landfill kiloton 0 0 0
per ton production kg/ton 0 0 0
Product Stewardship
Product Eco-premium solutions % sales - - -
* Number of Management and Non-Management Employees** We aim to achieve 100% training level by including contractual staff as well***Major Public Sector Utility suppliers not included in this analysis**** Monitoring started 2010***** Functional and Business Head Positions******This amount includes contribution by stakeholders including ICI Pakistan Limited staff and parent company contribution for floods.
ICI Pakistan Limited Annual Report 2010 Sustainability 03

We began voluntary reporting on sustainability for the first time in 2008with the first report published along with the Annual Report covering theperiod 1 January 2008 to 31 December 2008. This was followed by asecond report in 2009 covering the period January 2009 to 31 December2009.
This is our third effort on presenting a Sustainability Report and wehave used the G3 Reporting Framework issued by the Global ReportingInitiative (GRI) and are applying the GRI Reporting Framework atApplication Level C+.
Report Boundary
This report covers our five Businesses and all our Corporate Functions.ICI Pakistan Limited has four manufacturing sites, three corporate officesand five regional/business offices.
The text and statistics in this Report cover sites owned and operatedwholly by ICI Pakistan Limited during the period 1 January 2010 to 31December 2010. Employee data includes management and non-management staff. Community Investment is handled by the ICI PakistanFoundation which is a separate legal entity registered as a Trust. Allmonetary amounts in this Report are Pakistani Rupees, unless otherwiseindicated.
Reporting Period
The reporting period is January 01, 2010 to December 31, 2010 anddata has mainly been obtained from our financial management reportingsystems, corporate HR information management system and theAkzoNobel and former ICI corporate reporting systems for Health, Safety,Environment & Security (HSE&S) performance indicators.
Report Content
In 2010, an important step towards integrating sustainability within theorganization was conducting a stakeholder dialogue and establishingKey Performance Indicators (KPIs). These KPIs also have targets set for2015 which shall serve as pathfinders for us. The content of this reporthas been developed in accordance with the KPIs and our performanceagainst these. The content of this report has been decided upon by theSustainability Council and has been developed in accordance with ourSustainability framework based on the triple bottom line concept ofeconomic, social and environmental parameters.
Data Collection
Collection: All our environmental, health, safety and security data is derivedfrom our EPM database which is centrally managed by our CorporateHeadquarters in Amsterdam. A quarterly reporting cycle is in practiceand all related information is gathered and entered by respective businessesand functions while the Corporate Health, Safety and EnvironmentManager, reviews and manages the data for ICI Pakistan Limited as awhole. Data pertaining to integrity management, employment practices,sourcing and community investment is compiled and monitored bysustainability council members responsible for each area.
Accuracy: We are confident in the overall reliability of the data reported,but recognize that some of this data is subject to a certain degree ofuncertainty, inherent to limitations associated with measuring and calculatingdata. Senior managers within the organization approved the content andthe quantitative data used in the Sustainability facts and figures relatingto their respective areas of responsibility.
Consistency: The KPIs set and the data reported this year serve as abaseline and reporting standard for the years to come. Any additionaldevelopments shall be reported accordingly however, the reportingframework established this year shall be a consistent baseline standard.
Assurance & Verification
Our sustainability performance is monitored through a multi-disciplinarySustainability Council. This year, we also had Ernst & Young conductingan independent sustainability audit results of which have been incorporatein our improvement plans.
This Sustainability Summary Report forms part of our sustainabilityreporting and is designed for general readership only. United RegistrarSystems (URS) has conducted an independent verification and assuranceof data presented in this report.
The indicators for our sustainability reporting are selected from the G3Reporting Framework issued by the Global Reporting Initiative (GRI). TheGRI is a large multi-stakeholder international network of thousands ofsustainability experts. The GRI G3 Reporting Framework is the mostwidely accepted global standard for corporate responsibility reporting.
Contact Us
We encourage feedback on our Sustainability Report. If you would liketo comment on the report or find out more about our Sustainabilitystrategy and program, please e-mail us at:[email protected]
A soft copy of this report and additional information on our business unitsand products is available on our website at www.akzonobel.com/pk
If you are unable to access these resources or need further information,please contact:
Seemi Saad - Manager Corporate Communications & Public Affairs5 West Wharf, Karachi, Pakistan9221-32313524
Syed Iqbal Haider - Group Technical ManagerICI House63 Mozang, Lahore, Pakistan9242-36369382
Soda Ash Polyester Paints Chemicals Life Sciences
Pharmaceuticals
Animal Health
Seeds
Vegetable Seeds
About the
04 Sustainability ICI Pakistan Limited Annual Report 2010

During 2010 we put in place a framework built around the triple bottomline concept of economic, social and environmental factors. Based onthe framework we conducted a stakeholder engagement program anddeveloped KPIs for each segment in complete alignment with our parentcompany. A company wide awareness of the sustainability frameworkwas created to unify understanding of the sustainability agenda. The nextstep is to restructure the Sustainability Council broadening the base andextending the scope and functionality within the organization to bringabout a more defined action based approach.
Our Sustainability guiding principle is:
We're committed to reducing our impact on the planet and deliveringmore sustainable products and solutions to our customers. And we canonly do this if sustainability is at the heart of everything we do. That'swhy we aim to integrate sustainability into every area of our business -for the benefit of our customers, shareholders, employees and the worldaround us.
Establishing KPIs and Restructuring the Sustainability Council is the firststep towards integrating sustainability within the organization. Once thisis achieved, a formal plan of action and deliverables shall be set to achieve
the overall objective of embedding sustainability into every area of ourbusiness.
The Sustainability Roadmap we have drafted for ourselves is a based onthe following steps:
• Establishing a Sustainability Framework
• Obtaining Stakeholder Feedback
• Defining Key Performance Indicators
• Setting Targets
• Restructuring Sustainability Council
• Including a broader base of decision makers in the council
• Establishing small working groups within the council
• Defining roles, responsibilities and deliverables of each memberand working group
• Monitoring progress against targets
Sustainability
Sustainability Integration Paradigm
2008-2009
2010
2010
2011
2011
2011 - 2015
ICI Pakistan Limited Annual Report 2010 Sustainability 05
Start of theSustainabilityjourney
Basic SustainabilityReport published
Sustainability Councilestablished
Second SustainabilityReport published
Establishing aSustainabilityFramework
Awareness andacceptancewithin theorganization
Defining KeyPerformanceIndicators
StakeholderEngagement
Aligned withAkzoNobel KPIs andstrategic agenda
Defining targets
GRI-compliant reportpublished
RestructuringSustainabilityCouncil
Including a broaderbase of decisionmakers in the council
Establishing smallworking groups withinthe council
Defining roles,responsibilities anddeliverables of eachmember and workinggroup
Defined Plan ofAction for effectivechange
Defined targets, plansof actions, monitoringand evaluation criteriafor progress
Monitoring &Evaluation
Manage progress onset targets
Identify gaps andrealignprocesses

Economic Performance
Integrity Management
Sourcing
Social Performance
Health, Safety and Security
Employment Practices
Community Investment
Environmental Performance
Emissions Control
Water Usage
Waste Management
Product Stewardship
Energy Efficiencies
Sustainability
Economic
Performance
En
viron
mental
Perfo
rmanceSocialPerformance
SustainabilitySustainability
06 Sustainability ICI Pakistan Limited Annual Report 2010

Dialogue is a unique learning experience and is the first step towardsbuilding lasting, healthy relationships with stakeholders. Our mostimportant stakeholders are our customers, employees, suppliers, ownersand regulators. Equally important are the people who live close to oursites, local communities and non-governmental organizations (NGOs).Their claims and expectations vary greatly depending on their individualinterests.
Sustainable solutions can only be developed if all societal groups worktogether. That's why this year we initiated a formal stakeholder dialoguewith our key stakeholders. We commissioned United Registrar of Systems(URS) to conduct the dialogue for us. A comprehensive engagementprocess was initiated with one on one interviews, individual and groupmeetings conducted by the URS team. A detailed feedback report wasshared with us which will now serve as a path finder in our journey ofsustainability. The following stakeholder groups were addressed in thedialogue:
Stakeholder
Stakeholder Target Group Focus Area
Community Community around Soda Ash plant in Khewra How has ICI's presence affected their lives and what improvementscan be further made
Customers Industrial paints customers Gauge service and customer satisfaction levels and what morecan be done to improve
Contractors Contractual Services including Manpower Suppliers Measure impact and progress of safety and environmental programsand Transporters at the Polyester Business extended to contractors
Suppliers Printers and Packagers of Life Sciences Business Gain feedback on effectiveness of supplier supportive programs and other sourcing issues
Regulators Environmental Protection Agency Pakistan Environmental performance and how to improve own andindustry standards
We also conducted an Employee Engagement Survey for our staff in2010. A companywide online survey was held and feedback from staffwas sought on various areas to gauge engagement levels. The feedbackreceived has been consolidated into an action plan for all managers.
ICI Pakistan Limited Annual Report 2010 Sustainability 07

Compliance and integrity management are the backbone of our governanceprocess and form the basis for our license to operate.
At its core is our Code of Conduct that details the requirements onemployees and on the company to operate with integrity, and lays outrules and principles governing issues such as business integrity, laborrelations, health, safety and the environment, and community involvement.
Monitoring Compliance
To ensure effective compliance, integrated procedures and managementprocesses are in place:
Speak Up: A procedure which allows employees to express their concernson (alleged) breaches of the Code of Conduct. A global supplier operatesa confidential telephone and web-based reporting system. All breachesof the Code of Conduct are fully investigated under the supervision of theCompliance Manager.
Non-financial letter of representation: Each Business Unit has processesin place to assure compliance with the Code of Conduct and othercorporate requirements. At the end of the year each senior manager andfinally the business unit manager signs the non-financial letter ofrepresentation to confirm compliance. The outcome is reviewed with theGeneral Counsel and the results are reported to the Executive Committeeand the Audit Committee.
Compliance audits: These are conducted within the company; theoutcome is shared with the Compliance Manager.
Key Performance Indicators
Integrity Management
2009 2010 2015Target
Code of Conduct confirmed incidents number 10 23 0
Code of Conduct trained* % employees 100 100 100**
Management audits including reassurance audits number 6 11 6
Serious incidents - Level 3 number 1 1 0
Serious incidents - Level 1, 2 number 0 2 0
Serious loss of containment - Level 4 number 0 0 0
Regulatory actions - Level 3 number 0 0 0
* Number of Management and Non-Management Employees** We aim to achieve 100% training level by including contractual staff as well
2010 Overview
In 2008 all Management and Non-Management employees were givenCode of Conduct training. For all new employees Code of Conduct trainingis mandatory at the time of induction and HR Managers across thecompany ensure this. For staff having access to email, an online trainingprogram is also available for refresher training.
Our gauge for Code of Conduct incidents is Speak up. The number ofSpeak Up incidents rose from 10 in 2009 to 23 in 2010. The main reasonbehind this is that we conducted various ethics and Code of Conductawareness sessions highlighting our Speak Up process. Consequent tothis, the number people availing the Speak Up option has increased.
Also in 2010 audits of all five businesses, corporate functions, Sustainabilityaudit and four Special / investigative audits were conducted by Ernst &Young The agreed plan of action for future years is to have six audits (fivebusinesses and one corporate) and that is our 2015 target.
The Sustainability audit was conducted for the first time. This audit willfurther help us identify areas of development.
Future Plans
Put in place a companywide robust Code of Conduct training processwith effective monitoring. Also, we aim to extend code of conduct trainingto all contractual staff as well. Also, refresher sessions for all non-management staff are planned for 2011.
08 Sustainability ICI Pakistan Limited Annual Report 2010
Economic

In order to achieve sustainable growth, it is essential for us to build strongbusiness relationships with suppliers whose actual working practicesshould meet our requirements. We aim to do business with partners whoendorse our ethical values and our social and environmental standards.
Measuring Progress
To measure our progress, we have created the following building blocks:
Vendor Compliance LetterBy signing the Vendor Code of Code, our suppliers endorse and agreeto follow the Health, Safety, Environmental and Security standards, asformulated in our Code of Conduct and legislative requirements of thecountry. On an annual basis, we review and strive to maximize the numberof compliant suppliers.
Supplier Supportive VisitsIn line with our Global Supplier Engagement program, we have establisheda program of on-site visits to Critical Suppliers. The objective of these“Supplier Support Visits” is to identify and nurture these critical suppliersas sustainable business partners. As a part of the formal process, wealso conduct HSE assessments which outline a two year process as towhere they are at present and where they need to be. A comprehensivechecklist is used to find strengths and weaknesses after which we helpidentify actions and offer support and guidance on how to achieveimprovements. Through formal feed-back reports and follow-up visits,we work together with our suppliers to improve their overall sustainability.
Key Performance Indicators
2010 Overview
In 2010, we expanded the focus of sourcing to include Non ProductRelated (NPR) suppliers. We made a shift towards centralized complianceby including the assortment of NPR suppliers we engage with on a regularbasis. This has introduced formalized processes for greater efficiency,transparency as well as better buying synergies.
Future Plans
Our critical suppliers with whom we work on improving their sustainability,have appreciated the efforts. This encourages us to further extend suchvisits to more suppliers. While we work towards this end of widening thebase, we would like to continue our current focus in 2011 throughincreased monitoring.
Sourcing
2009 2010 2015Target
Vendor Policy signed by key suppliers % 88 83.8 96
Vendor Policy signed by central NPR suppliers* % **
Supportive supplier visits since 2007 number 21 79 146
*Major Public Sector Utility suppliers not included in this analysis** Monitoring started 2010
ICI Pakistan Limited Annual Report 2010 Sustainability 09
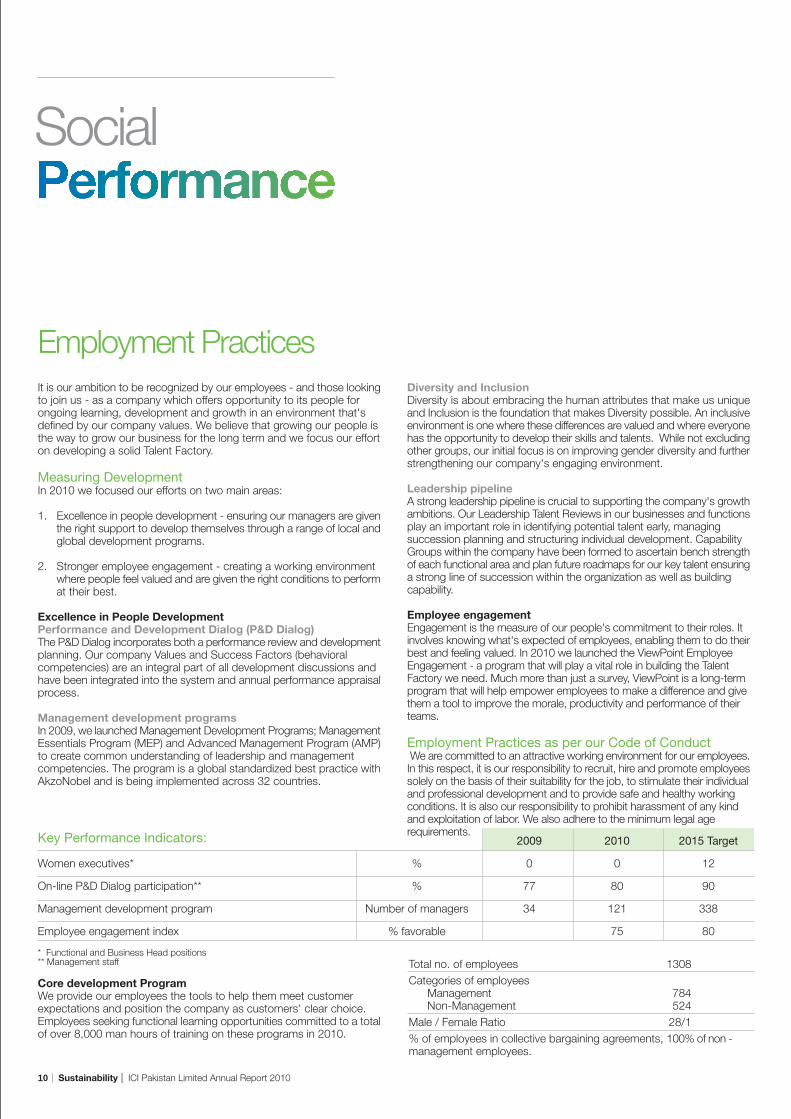
It is our ambition to be recognized by our employees - and those lookingto join us - as a company which offers opportunity to its people forongoing learning, development and growth in an environment that'sdefined by our company values. We believe that growing our people isthe way to grow our business for the long term and we focus our efforton developing a solid Talent Factory.
Measuring DevelopmentIn 2010 we focused our efforts on two main areas:
1. Excellence in people development - ensuring our managers are giventhe right support to develop themselves through a range of local andglobal development programs.
2. Stronger employee engagement - creating a working environmentwhere people feel valued and are given the right conditions to performat their best.
Excellence in People DevelopmentPerformance and Development Dialog (P&D Dialog)The P&D Dialog incorporates both a performance review and developmentplanning. Our company Values and Success Factors (behavioralcompetencies) are an integral part of all development discussions andhave been integrated into the system and annual performance appraisalprocess.
Management development programsIn 2009, we launched Management Development Programs; ManagementEssentials Program (MEP) and Advanced Management Program (AMP)to create common understanding of leadership and managementcompetencies. The program is a global standardized best practice withAkzoNobel and is being implemented across 32 countries.
Core development ProgramWe provide our employees the tools to help them meet customerexpectations and position the company as customers' clear choice.Employees seeking functional learning opportunities committed to a totalof over 8,000 man hours of training on these programs in 2010.
Diversity and InclusionDiversity is about embracing the human attributes that make us uniqueand Inclusion is the foundation that makes Diversity possible. An inclusiveenvironment is one where these differences are valued and where everyonehas the opportunity to develop their skills and talents. While not excludingother groups, our initial focus is on improving gender diversity and furtherstrengthening our company's engaging environment.
Leadership pipelineA strong leadership pipeline is crucial to supporting the company's growthambitions. Our Leadership Talent Reviews in our businesses and functionsplay an important role in identifying potential talent early, managingsuccession planning and structuring individual development. CapabilityGroups within the company have been formed to ascertain bench strengthof each functional area and plan future roadmaps for our key talent ensuringa strong line of succession within the organization as well as buildingcapability.
Employee engagementEngagement is the measure of our people's commitment to their roles. Itinvolves knowing what's expected of employees, enabling them to do theirbest and feeling valued. In 2010 we launched the ViewPoint EmployeeEngagement - a program that will play a vital role in building the TalentFactory we need. Much more than just a survey, ViewPoint is a long-termprogram that will help empower employees to make a difference and givethem a tool to improve the morale, productivity and performance of theirteams.
Employment Practices as per our Code of ConductWe are committed to an attractive working environment for our employees.In this respect, it is our responsibility to recruit, hire and promote employeessolely on the basis of their suitability for the job, to stimulate their individualand professional development and to provide safe and healthy workingconditions. It is also our responsibility to prohibit harassment of any kindand exploitation of labor. We also adhere to the minimum legal agerequirements.
Employment Practices
2009 2010 2015 Target
Women executives* % 0 0 12
On-line P&D Dialog participation** % 77 80 90
Management development program Number of managers 34 121 338
Employee engagement index % favorable 75 80
* Functional and Business Head positions** Management staff
Key Performance Indicators:
Total no. of employees 1308Categories of employees
Management 784Non-Management 524
Male / Female Ratio 28/1% of employees in collective bargaining agreements, 100% of non -management employees.
10 Sustainability ICI Pakistan Limited Annual Report 2010
Social

2010 OverviewAt ICI Pakistan, we take pride in being an equal opportunity employer.Currently, our female employees constitute 7% of our workforce inmanagement cadre. Females also constitute 7% of our senior managementpositions however, at present; we have no female executives (defined asBusiness or Functional Heads). Going forward, it is our intention to continueto further support diversity within our Businesses and Functions andincrease the percentage to at least 12% by 2015.
In 2010, 80 percent (2009: 77 percent) of employees used the web-based process, with a paper system available for the remainder. Ideallyonline P&DD should be at 100% but however due to a large geographicspread and remote locations, this has been difficult to achieve. The focusfor 2011 will be on continuing to increase the number of online usersalong with maintaining our current achievement of 100% overall completionwithin given timelines of the process and the quality of the manager-employee dialogue and development discussions.
There is a need to cover maximum number of managers for ManagementDevelopment Program so that MEP / AMP are embedded quickly andthe whole company can start speaking the same language. By 2015, weaim to cover over 300 managers which represent approximately 30 % ofthe total management population.
Employee Engagement Survey conducted in 2010 resulted in a concreteassessment of engagement levels thereby allowing us to design a greateremployee engagement program Employee Engagement Index for 2010may be marked at 75% (currently we are at an engagement level of 3.74).We aim to increase it to 80% by 2015 which would mean an averagemean score of 4 out of 5.
Key Role - Leadership
• Formalize enterprise level strategy and drive plans
• Communication results / action taken report
• Be role models - be the first one to conduct impactplanning sessions
• Recognize and reward engagement efforts andperformance
• Support engagement initiatives
Case Study
Employee Engagement SurveyOur 2010 employee survey focused on engagement, becauseengaged teams produce better results. The 2010 Gallup Q12survey was open to all employees. In total, 79 percent of our globalworkforce participated. The results indicated an overall engagementscore of 3.56. In Pakistan, 94% of our workforce participated inthe survey and the results indicated an overall engagement scoreof 3.74.
The 2010 results provide us with an initial benchmark of ourengagement levels and an excellent starting point to make thenecessary improvements at all levels of our organization. We willimplement another full survey in 2011, with an ambition of increasing
the overall engagement score to 4 by 2015. This will enable ourmanagers to track their progress and continue to driveimprovements.
EmployeeEngagement
Leadership
Line
ManagersHum
anR
eso
urc
e
Key Role - Line Managers
• Share engagement results with the team
• Lead team feedback on results and impact planning
• Escalate issues not within the control of the team
Key Role - Human Resources
• Create enabling HR systems and processes
• Build managerial capability for effectiveengagement impact planning
• Facilitate and review engagement impactplanning
• Be the sounding board for employees &managers – collate and escalate pervasiveissues
• Drive best practice collation anddissemination

We're as committed to our communities as weare to our customers, shareholders andemployees. Our community investment activitiesare managed through the ICI PakistanFoundation which is a separate legal entity withits own Board of Trustees.
The Foundation is governed by a Trust Deedthat clearly outlines the policies and proceduresand clearly defines the scope of communityinvestment activities. The accounts of theFoundation are audited every year by A.F.Ferguson & Co.
The Foundation is focused towards communitydevelopment through investment in education,health, environment and infrastructuraldevelopment along with disaster relief.
Measuring Progress:Every year, ICI Pakistan Limited donates apercentage of profit of the organization to theFoundation. Over the years, as the companyhas grown, contribution to the Foundation hasalso grown. Other than contributions throughthe Foundation, various businesses also directlyinvest in community projects.
Community investment in Rs. million
Key Performance Indicators
2010 Overview
In 2010, Pakistan faced one of the worstdisasters in the history of the country in theform of floods. ICI Pakistan Limited, its staff,parent company and other related concernscontributed a total of PKR 36 million to theICI Pakistan Foundation for flood relief andrehabilitation. Along with this ICI Pakistan Staffalso made in-kind contribution and put togetherover 10,000 care packs with immediatesustenance items Staff efforts for floods alsoincluded 2000 volunteering hours
Total contribution for Flood Relief: PKR 36 millionAkzoNobel NV: PKR 18 millionICI Pakistan Limited: PKR 15 millionStaff Cash & In-kind: PKR 2 millionOthers: PKR 1 million
With most resources dedicated towards FloodRelief, many community initiatives planned for2010 were deferred. The company spent Rs.6.5 million on health, education andenvironmental programs. A total of 4500
2009 2010 2015Target
Community Program Investment Rs. Million 16.464 42.5* 30
* This amount includes contribution by stakeholders including ICI Pakistan Limited staff and parent company contributionfor floods.
Community Investment
2006
2007
2008
2009
2010
9.44
14.692
21.65
16.464
42.5
PKR 18 millionAkzoNobel NV
PKR 15 millionICI Pakistan Limited
PKR 2million
Staff
PKR 1millionOthers
volunteering hours were contributed by staffduring the year, monetary value of which hasbeen accounted for in consolidation totalcommunity program investment number.
Details given in the Community InvestmentSection of the report on page 36.
Future Plans
We have applied for the PCP (Pakistan Centerfor Philanthropy) Certification to furtherstreamline the operations of the Foundation.PCP Certification is an endorsement of goodhousekeeping practices for charitableinstitutions.
The plans for 2011 centre on developinglearning centers across Pakistan. We havelaunched the 'Ilm-o-Hunar' skill developmentprogram end of 2010 with a pilot painter trainingprogram with Construction Technology &Training Institute (CTTI). In the area of health,we aim to extend our eye care program to otherlocations in collaboration with leading eye careorganizations like LRBT.
12 Sustainability ICI Pakistan Limited Annual Report 2010
Flood Relief Contribution

Case Study
Community InvestmentAs mentioned in our last years Sustainability Report, in 2009, wefunded, constructed and launched the Kakapir Seafood Kitchenin the fishing community of Kakapir Village near Sandspit beachin Karachi. Our idea was to design a self sustaining project thatwould provide the fishing community with alternate livelihood. Thekitchen is designed and equipped for commercial cooking andthe idea is to promote the delicious indigenous seafood cuisineof the area as a food alternative for beach-goers.
In year 2010, the project was run and managed by the villagersearning a steady supplemental income. The profits earned fromthis project not only cover the running expense of the kitchen butare reinvested back into the community. The project now paysfor the salary of a private teacher at the local Community School.
Highlight of the yearOur first rehabilitation project for flood affectees is complete.We have helped build a model village in Khyber Pakhtoon Khuwain partnership with Karachi Relief Trust (KRT).
Each model house has 2 bedrooms, one bathroom, a kitchenand front yard. This project has been completely funded bycontributions from our employees.

ICI Pakistan has always endeavored to remain best in class in terms ofhealth and safety performance measured through Reportable Injuries forEmployees and Contractors per million hours worked and zeroOccupational Reportable Illnesses for the same population.
Similarly, for people security, our system requires that risks to employeesfrom security threats are assessed, reduced, controlled and monitoredin the workplace, while driving on company business and for visitors. Inthe same light, we strive to ensure that arrangements are in place for theappropriate security of assets and information. Product security needsto be maintained from raw material supply to product delivery.
Performance Overview
In 2010 there were two injuries to supervised contractor employees duringthe year. We had a reportable injury rate of 0.28 which is the same aslast year actual. This performance is significantly better compared to thepeer business units within the AkzoNobel Group.
Health & Hygiene assessment and monitoring program was robustlypracticed across the company resulting in a zero Reportable OccupationalIllness. Occupational Illness absence rate is marginally higher than 2009mainly contributed by change of baseline due to PTA demerger.Implementation of the Asset Integrity Guidelines, roll out of Behavior
Based Safety, HSE&S Leadership Training and follow-up on the CorporateAudits 2009 improvement plans were the key strategic objectives for2010.
Employees' involvement and engagement and role of top leadership inHSE&S continuous improvement process are integral in helping maintaintop-of-the-line position in HSE&S performance. Behavior Based Safetyand HSE&S Leadership Training have been part of this drive as AkzoNobelCorporate Initiatives. Both these important 2010 Corporate HSE&S PlanActions were successfully completed.
Another highlight of the year was the completion of Top10 Risk identificationexercise for the company. This risk matrix is an integral part of 2011Improvement Planning across the company.
Future Plans
First cycle review of Behavior Based Safety Program and Asset IntegrityGuidelines implementation will be the significant items for 2011. Similarly,the validation of emergency preparedness will also be high on the corporateagenda. Development Plans for critical HSE resources will be stewardedduring the year.
Health, Safety & Security
2009 2010 2015Target
Fatalities employees number 0 0 0
Total reportable injury rate employees/supervised contractors /million hours 0.28 0.28 0
Lost time injury rate employees/ supervised contractors /million hours 0 0.14 0
Occupational illness rate employees /million hours 0 0 0
Total illness absence rate employees % 1.79 1.92 1.76
Fatalities contractors (supervised and independent) number 1 0 0
Total reportable injury rate independent contractors /million hours 0.52 0 0
Lost time injury incidents in independent contractors number 1 0 0
% sites with BBS program % 0 100 100
Distribution incidents number 1 1 0
Motor vehicle incidents with injury number 0 1 0
Key Performance Indicators
14 Sustainability ICI Pakistan Limited Annual Report 2010

Case Study
Behavior Based SafetyBehavior-Based Safety is a process that helps employees identifyand choose a safe behavior over an unsafe one. Safety in theworkplace is a combination of three measurable components:the person, their environment, and their behavior. Only whenthese three elements are combined can workplace accidents beeliminated.
Behavior-based safety is based on four key components
• A behavioral observation and feedback process
• A formal review of observation data
• Improvement goals
• Reinforcement for improvement and goal attainment
Behavior Based Safety program was initiated in the company inthe second quarter of 2010. The team developed training modulesand devised strategy for the implementation. Safety ImprovementTeams at all businesses were designated as the BBS ProblemSolving Teams. Once the BBS Teams were in place key observerswere identified.
It was decided to engage an external consultant to impart trainingto the observers and help implement BBS effectively in thecompany. The consultant's scope of work covered the following:
• Hold training sessions with observers
• Impart hands on training to observers
• Carry out follow up session with observers
• Arrange summing up presentations by businesses
• Provide assessment and feed back to Corporate and BusinessHSE on progress
The training and follow up sessions stated above have beensuccessfully completed and all five businesses are now BBScompliant. Companywide validation review is planned in Q1 2011to ensure BBS is securely embedded in our systems.

We continue to monitor and manageatmospheric emissions to ensure that there areno unacceptable environmental impacts andthat local consent limits and regulatory permitsare fully complied with. We aim to reduce ourcarbon footprint per ton of production by 10%by 2015 in relation to 2009 baseline.
Environmental Policy
We continue to follow the AkzoNobelEnvironmental Policy comprising of the followingfeatures:
1) Measurement: Measure and report oncradle-to-gate basis and manage carbonalong the value chain.
2) Reduction: Use a structured and consistentcarbon reduction approach, aligned withbusiness objectives.
3) Communication and advocacy: Activelycommunicate and approach staff,customers, suppliers, investors and thegeneral public and encourage dialogue.
4) Best practices: Promote activities to sharegood practice, generate efficiencies andaccelerate improvement.
Key Performance Indicators
Emissions Control
2009 2010 2015Target
COD emissions per ton production Te 105.37 52.59 49.96
kg/te 0.15 0.11 0.10
VOC emissions per ton production Te 161.25 81.81 77.72
kg/te 0.23 0.18 0.16
NOx emissions per ton production te 422.42 430.70 409
kg/te 0.61 0.93 0.83
SOx emissions per ton production te 1431.40 2209.11 2430
kg/te 2.05 4.76 4.95
Direct CO2 emissions (Scope 1) million te 0.47 0.39 0.37
per ton production kg/te 676.13 834.70 753
Indirect CO2 emissions (Scope 2) te 39,907 2447.82 2324.65
per ton production kg/te 57.3 5.3 4.73
2010 Overview
Energy usage for 2009 was actually 0.93 takingPTA into account. PTA was divested in 2009H1 and the figure of 1.1 does not include PTA.
Similarly the 2009 figure for per ton productionof energy related CO2 of 0.64 does not includePTA.
Future Plans
We shall continue to focus on environmentalprotection measures. This will be a significantchallenge considering the natural gas availabilityprojections for 2011.
2005
2006
2007
2008
2009
2010
1.39
1.32
1.3
1.25
1.1
1.04
Energy Usages Tera joule Per ton of Production(Tj / Te x 10-2)
2005
2006
2007
2008
2009
2010
0.73
0.69
0.67
0.66
0.64
0.62
Per ton Production of Energy Related CO2
16 Sustainability ICI Pakistan Limited Annual Report 2010
Environmental

Water management is a key element in oursustainability improvement portfolio. Sustainablefresh water supply is critical for businesscontinuity and sustainability. As per theAkzoNobel Directives and Ambition, 100% ofICI Pakistan manufacturing sites are directedto have sustainable fresh water managementsystem in place.
2009 & 2010 have been spent in completingthe fresh water management assessment usingthe AkzoNobel tool.
Water Usage Performance Overview
The absolute water consumption in million m3shows a reduction. Again this is coming fromPTA demerger. The per ton consumption ismarginally increased after incorporating a morecomprehensive water consumption reportingfrom Head Office. At present 25% of our siteshave sustainable fresh water system.
Note: Our reported water figures for the year2009 and 2010 are based on AkzoNobeldefinition, only Fresh Water is reported.
2005
2006
2007
2008
2009
2010
16.2
14.97
12.53
11.92
9.8
9.9
Water Sustainability
2009 2010 2015Target
Fresh water use million m3 6.49 4.59 4.36
……per ton production m3/te 9.8 9.9 8.9
% sites with sustainable fresh water % 25 25 100
Key Performance Indicators
Future Plans
The improvement plans based upon the WaterManagement tool will be acted upon to achieve100% sustainable water sites by 2015.
Case Study
Effluent Treatment PlantAfter significant reduction in electricity and gas consumption, ourChemicals Business successfully implemented another sustainabilityinitiative by recycling and reusing treated water from our Effluent TreatmentPlant (ETP). Part of this recycled water is being used at our Chemicalsplant to wash vessels and floors, and the remaining water is being usedat our adjacent head office premises for horticultural and cleaningpurposes.
About 574 cubic meters (29%) of our total ETP water was recycledfrom May to December 2010, which has reduced our fresh waterconsumption, cut down the environmental impact and has alsominimized HSE hazards associated with water tanker traffic at headoffice.
This initiative helped our Chemicals Business to meet our KPI ofreducing fresh water consumption in 2010. The project commencedin January 2010 and was completed in March 2010.

Effective waste management helps to increaseraw material efficiency in our manufacturingoperations, reduces our environmental footprintand reduces costs. It is our aim to managewaste disposal responsibly and we focus onwaste management using the principles toeliminate, reduce, reuse and recycle.
Waste Management2010 Overview:
Apart from the PTA demerger which mainlycontributed to the variation, total hazardousand non reusable Waste is higher due to thechange in classification of ETP waste at PaintsBusiness turning it into Hazardous Waste. Also,about 12 tons of ETP sludge lying withChemicals Business, Karachi as inventory wastaken into reporting.
Future Plans:
Our manufacturing sites will focus on incrementalimprovement focusing on process and productdesign improvement for eliminating wastes atsource and to find more cost effective disposalroots.
2005
2006
2007
2008
2009
2010
1.228
1.205
1.178
1.174
0.027
0.0095
Waste Management
Key Performance Indicators:
2009 2010 2015Target
Total waste kiloton 19.015 4.412 4.191
per ton production kg/ton 27.32 9.53 8.53
Total hazardous waste kiloton 0.31 0.54 0.51
per ton production kg/ton 0.45 1.17 1.04
Non-reusable waste kiloton 0.408 0.295 0.280
per ton production kg/ton 0.59 0.64 0.57
Hazardous non-reusable waste kiloton 0.151 0.251 0.238
per ton production kg/ton 0.22 0.54 0.48
Hazardous waste to landfill kiloton 0 0 0
per ton production kg/ton 0 0 0
Note: the waste figures for 2009 and 2010 shown in thegraph are on the basis of AkzoNobel definitions.
18 Sustainability ICI Pakistan Limited Annual Report 2010

As a company we embrace product stewardship as one of the keymechanisms to support our future Sustainability. Product Stewardshipstrives to achieve a sustainable and attractive balance between theinherent properties of a chemical and the benefits it provides to all majorstakeholders throughout its lifecycle.
Product Stewardship Policy:We aim to ensure that a product is developed, manufactured, promoted,distributed, marketed and ultimately disposed into the environment in asocially responsible and acceptable manner with respect to HSE & Smatters and it will be demonstrated that this is practiced. In order to fulfillthis responsibility particular attention shall be paid to:
• Provision of appropriate training and information to all our staff,contractor, suppliers and customers for handling, correct usage anddisposal of our products and in a safe and responsible manner soas to minimize chances of injury to people and damage to third partiesor environment arising from its use.
• Product design, development of modification to meet customersneeds and to minimize HSE&S impacts.
• All data on our products and its use shell be made available to ourcustomers and users in order to promote sustainability.
• Procedures that ensure feedback from customers on our productusage and performance.
• Evaluation of suppliers and their regular assessment to ensureconsistency with the HSE&S policy.
• Compliance with the applicable local laws,regulation and standards.
Eco Premium solutions are an ambition in line with our Product StewardshipPolicy. Eco-premium solutions help to create value for our business andour customers. They provide top line growth opportunities because ofimproved performance in areas such as raw material use, manufacturingprocess and product innovation. A product qualifying for the list of Eco-Premium Solutions must meet the following criteria, when assessedagainst the competing mainstream products:
1. It provides the same or better functionality for the customer application.
2. When assessed along the full value chain against the following criteria:
• Energy efficiency (consumption)
• Use of natural resources/raw materials
• Emissions and waste
• Toxicity
• Risks (for accidents during production, transportation etc.)
• Land use, if applicable
a) It is significantly better in at least one criterion
b) It is not significantly worse in any other of the criteria
2010 Overview:
We are planning towards establishing an Eco-Premium Products target.At present, we do not have a monitoring mechanism however we areworking with parent company to develop procedures and methodologiesaround this. In 2011, we will be able to report more progress. Targetsand measure for 2010 and 2015 are therefore not reported.
Future Plans:
• R&D / Marketing / Sales for Eco Premium Products
• Building Sustainability into Purchasing (Supplier Support Visits) /AkzoNobel Vendor Policy implementation
• Product Stewardship Improvements
Product Stewardship
2009 2010 2015Target
Product Eco-premium solutions % sales - - -
Key Performance Indicators:
ICI Pakistan Limited Annual Report 2010 Sustainability 19

Case Study
Reverse OsmosisRecently our Soda Ash Business successfully commissionedits Reverse Osmosis (RO) water purification plant. This new ROplant has completely replaced the old water purification plantwhich was based on an obsolete, maintenance intensive andinefficient technology.
This change will help ICI to cut down on energy consumptionand reduce our carbon footprint, in line with AkzoNobel'ssustainability vision. It is important to note that the RO planthas accomplished 0% water rejection, meaning each and everydrop of the water processed through the plant is being utilizedin one process stream or another.
Objective
We aim to drive energy efficient operations toimprove operational eco-efficiency of ourmanufacturing processes. With ever increasingcost of energy, the focus is going to get sharperand the targets are going to get tougher. Wehave initiated an ‘Energy and Innovation Forum’comprising nominees from all businesses andheaded by Corporate Technical & EngineeringDepartment (CTED) to achieve defined objectivesand targets for greener operations at all sites.
Energy Efficiencies2010 Overview
Overall performance in unit terms is of the sameorder as reported last year. On like to like basis(excluding PPTA), the energy consumption andCO2 emission (energy related) were 5.3% and3% lower as compared to 2009.
Future Plans
We aim to focus on energy conservation at ourmain office locations in Lahore and Karachi.
2009 2010 2015Target
Total energy consumption 1000TJ 6.496 4.8 4.56
per ton production 1000 TJ/te 0.0093 0.01 0.009
Key Performance Indicators

STANDARD DISCLOSURES PART I: Profile DisclosuresProfile Description Cross-ReferenceDisclosure
Strategy and Analysis
1.1 Statement from the most senior decision-maker of the organization AR Page 031.2 Description of key impacts, risks, and opportunities. AR Page 32
Organizational Profile
2.1 Name of the organization. Cover2.2 Primary brands, products, and/or services. AR Page 44-732.3 Operational structure of the organization, including main divisions, operating companies,
subsidiaries, and joint ventures. SR Page 042.4 Location of organization's headquarters. Inside Back Cover SR 012.5 Number of countries where the organization operates, and names of countries with either major operations SR Page 01
or that are specifically relevant to the sustainability issues covered in the report. AR Page 062.6 Nature of ownership and legal form. AR Page 282.7 Markets served (including geographic breakdown, sectors served, and types of customers/beneficiaries). AR Page 44-732.8 Scale of the reporting organization. SR Page 01
2.9 Significant changes during the reporting period regarding size, structure, or ownership. AR Page 16-232.10 Awards received in the reporting period. AR Page 34
Report Parameters
3.1 Reporting period (e.g., fiscal/calendar year) for information provided. CoverSR Page 04
3.2 Date of most recent previous report (if any). SR Page 043.3 Reporting cycle (annual, biennial, etc.) SR Page 043.4 Contact point for questions regarding the report or its contents. SR Page 043.5 Process for defining report content. SR Page 043.6 Boundary of the report (e.g., countries, divisions, subsidiaries, leased facilities, joint ventures, suppliers).
See GRI Boundary Protocol for further guidance. SR Page 043.7 State any specific limitations on the scope or boundary of the report (see completeness principle
for explanation of scope). I SR Page 043.8 Basis for reporting on joint ventures, subsidiaries, leased facilities, outsourced operations, and other entities
that can significantly affect comparability from period to period and/or between organizations. SR Page 043.10 Explanation of the effect of any re-statements of information provided in earlier reports, and the reasons for such
re-statement (e.g.,mergers/acquisitions, change of base years/periods, nature of business, measurement methods). NA3.11 Significant changes from previous reporting periods in the scope, boundary, or measurement methods applied
in the report. SR Page 16-203.12 Table identifying the location of the Standard Disclosures in the report. SR Page 21
Governance, Commitments, and Engagement
4.1 Governance structure of the organization, including committees under the highest governance bodyresponsible for specific tasks, such as setting strategy or organizational oversight. AR Page 26-30
4.2 Indicate whether the Chair of the highest governance body is also an executive officer. AR Page 26 & 28
ICI Pakistan Limited Annual Report 2010 Sustainability 21
AR: Annual Report SR: Sustainability Report

Profile Description Cross-ReferenceDisclosure
4.3 For organizations that have a unitary board structure, state the number of members of the highest governancebody that are independent and/or non-executive members. AR Page 14 & 15
4.4 Mechanisms for shareholders and employees to provide recommendations or direction to the highestgovernance body. AR Page 29
4.14 List of stakeholder groups engaged by the organization. SR Page 074.15 Basis for identification and selection of stakeholders with whom to engage. SR Page 07
STANDARD DISCLOSURES PART III: Performance IndicatorsEconomic
EC8 Development and impact of infrastructure investments and services provided primarily for public benefit AR Page 36through commercial, in-kind, or pro bono engagement. SR Page 12
EC9 Understanding and describing significant indirect economic impacts, including the extent of impacts. AR Page 36 & 60SR Page 12 &13
Environmental
EN2 Percentage of materials used that are recycled input materials. AR Page 56SR Page 17
EN6 Initiatives to provide energy-efficient or renewable energy based products and services, and reductions in AR Page 40energy requirements as a result of these initiatives. SR Page 16-20
EN16 Total direct and indirect greenhouse gas emissions by weight. AR Page 17SR Page 16
EN17 Other relevant indirect greenhouse gas emissions by weight. SR Page 16
Social: Labor Practices and Decent Work
LA4 Percentage of employees covered by collective bargaining agreements. SR Page 10LA7 Rates of injury, occupational diseases, lost days, and absenteeism, and number of work-related fatalities by region. AR Page 41
SR Page 14LA10 Average hours of training per year per employee by employee category. AR Page 41LA11 Programs for skills management and lifelong learning that support the continued employability of
employees and assist them in managing career endings. AR Page 42
Social: Human Rights
HR4 Total number of incidents of discrimination and actions taken. SR Page 08HR5 Operations identified in which the right to exercise freedom of association and collective bargaining may be at
significant risk, and actions taken to support these rights. SR Page 08HR6 Operations identified as having significant risk for incidents of child labor, and measures taken to contribute to
the elimination of child labor. SR Page 10
Social: Society
SO2 Percentage and total number of business units analyzed for risks related to corruption. AR Page 29SO5 Public policy positions and participation in public policy development and lobbying. AR Page 28SO7 Total number of legal actions for anti-competitive behavior, anti-trust, and monopoly practices and their outcomes. AR Page 29
22 Sustainability ICI Pakistan Limited Annual Report 2010

