aker asa q3 2014 presentation final asa... · ltm ebitda n.a. mkt.cap. 49% 51% nibd det norske nok...
TRANSCRIPT

Proud ownership
Aker ASAThird-quarter results 2014Oslo | 14 November 2014
Proud ownership

▪ Net asset value: NOK 22.3 billion in 3Q 2014 vs. NOK 24.2 billion in 2Q 2014, representing a 7.5% decline in the quarter
▪ Cash: NOK 1.6 billion in 3Q 2014 vs. NOK 3.1 billion in 2Q 2014. In addition, Aker held NOK 0.6 billion in liquid fund investments in 3Q 2014
▪ Return: Aker share declined 12.8% to NOK 211 vs. 1.4% decline in the OSEBX
▪ Portfolio events: - Det norske completed a NOK 3.0 billion equity rights issue and signed a USD 3.0 billion
RBL facility (the USD 2.1 billion Marathon Norway acquisition was completed in October)- Kvaerner initiated a process exploring strategic opportunities- Aker Solutions and Akastor became two independent listed companies, both with new
management teams
AKER ASA | Third-quarter results 201414 November 2014 2
Highlights | Third-quarter 2014

314 November 2014 AKER ASA | Third-quarter results 2014
Ocean Yield 3Q 14
0.4
Other
0.0
-7.5%
22.3
24.2
Det norske
(0.2)(0.5)
Aker Solutions / Akastor
(1.6)
2Q 14 Kvaerner
Net asset value change in the periodNOK billion
Note: Changes in share values include the effect of dividend received
Aker ASA and holding companiesNAV decreased by 7.5% in 3Q 2014

14 November 2014 44
Aker ASA and holding companiesShare price decline of 13%, but strong balance sheet
5.4
21.8
2.2
74% +22.3 bn76%
7.1
DebtGross asset value
18%
29.4
Net asset valueNOK billion1)
Cash and liquid fund investments
Industrial HoldingsOther fin. invest2)
NAVDiscountMarket cap.1)
100%32%68%
NOK bn22.3
7.115.3
AKER ASA | Third-quarter results 2014
Net asset valueNOK per share
0
50
100
150
200
250
300
350
-12.8%
3Q 142Q 141Q 144Q 133Q 13
Share priceShare price (div. adj.)
DividendNAV per share
1)As per 30.09.20142)Includes publicly listed financial investments, real estate developments and other financial investments

Portfolio mix
5
21%(6.1bn)
NOK29.4bn
8%(2.4bn)
20%(5.7bn)
14%(4.2bn)
3% (0.7bn)
E&P exposure increased to 20% from 16% following the equity issue in Det norske
Oil Services decreased to 33% from 37% due to share price declines
Maritime assets increased to 18% from 16% due to favourable share price performance in Ocean Yield
20%33%18%
9%6%
14%6%1)
(1.7bn)
3%(0.8bn)
8%(2.2bn)
6%1)
(1.7bn)
6%(1.8bn)
Cash and liquid fund investments
Other
Aker ASA and holding companies53% of gross assets related to oil and gas
AKER ASA | Third-quarter results 2014
1)Privately owned investments, reflected at book value rather than fair market value
14 November 2014
E&P
Seafood and Marine biotechReal EstateCash and other assets
Maritime assetsOil ServicesReal estate
development

6
NOK billion, as per 30.09.2014
Industrial Holdings Financial Investments
21.8 7.6Gross asset value
1.6
5.7Det norske 50.0%
1.7Aker BioMarine2) 99.2%
0.8Kvaerner1) 28.7%
4.2Ocean Yield 73.2%
0.7Havfisk 73.2%
Cash and liquid fund investments6.1 2.2Aker Solutions1)) 34.8%
Other public investments2.1
2.4Akastor1)) 34.5%
Net asset value 22.3
Real Estate Dev. (Fornebuporten)2)1.7
Other financial investments
Unlisted investments
Listed investments
Aker ASA and holding companiesThis is Aker
AKER ASA | Third-quarter results 2014
1)Owned partly through Aker Kvaerner Holding, in which Aker has a 70% ownership interest. Additionally, Aker also has a direct ownership interest in Aker Solutions and Akastor2)Reflected at book value
14 November 2014

714 November 2014
Aker ASA and holding companiesGrowing dividend supported by accelerating upstream cash flowUpstream dividend payments from underlying portfolioNOK million
Ocean Yield
Aker Solutions / Akastor
Kvaerner
852
1 030E
2013
Financial Investments
2014E2010
191
2012
461
2011
175
2009
137
Dividend paid to Aker ASA shareholders
AKER ASA | Third-quarter results 2014
1)Dividends payments from underlying portfolio companies
1)
Aker BioMarine

14 November 2014 8
Industrial HoldingsNOK 1.8bn underlying value decrease in 3Q 2014
AKER ASA | Third-quarter results 2014
-50%
-40%
-30%
-20%
-10%
0%
10%
20%
-6%
11%
-16%
0%
12%, Ocean Yield2)
-27%, Det norske3)
-42%, Aker Solutions1)
18%, Havfisk
-25%, Akastor1)
1)Assumed 30.09.2014 share prices as starting point for new Aker Solutions and Akastor
3Q 2014 13.11.20142Q 2014
-17%, Kvaerner2)
3) Det norske share price adjusted for the equity rights issue in July
-14%
-30%, Oil prices
-17%
-24%, OSX Oil Services Index
2) Share price adjusted for dividend

14 November 2014 9
Industrial HoldingsSolid portfolio balance sheets
AKER ASA | Third-quarter results 2014
1.0x
LTM EBITDA
2.5
NIBD
2.5
AkastorNOK billion
2.3x
LTM EBITDA
1.5
NIBD
3.6
0.9x
LTM EBITDA1)
13.7
NIBD
11.7
216
NIBD2)
633
LTM EBITDA
2.9x
LTM EBITDA
3.7x
NIBD
1.1
0.3
NIBD
0.8
LTM EBITDA
n.a.
49%Mkt.cap. NIBD51%
Det norskeNOK billion
HavfiskNOK billion
Aker SolutionsNOK billion
Ocean YieldUSD million
KvaernerNOK billion
New vessels been delivered, focus on operations and debt repayments
Deleveraged following divestments and refinancing
Refinanced in connection with the acquisition of Marathon Norway
Sound balance sheet based on long term debt facilities
Net interest bearing cash position
Deleveraged following divestments and refinancing
Mkt.cap.
87%
13%
NIBD
66%
34%NIBD
Mkt.cap.
NIBD50%Mkt.cap. 50%NIBD2)
41%
Mkt.cap. 59%
NIBD
Mkt.cap.
100%
1)Assumed unaudited pro forma figures for Det norske including Marathon Norway for 1Q 2014 x 42)Excluded finance lease of USD 166 million related to Aker Wayfarer from interest bearing long-term receivables
Aker
Industrial Holdings
14 November 2014 10AKER ASA | Third-quarter results 2014

14 November 2014
Aker’s ownership agenda
Focus on;
Operational excellence
Improved margins
Capital discipline
Global oil services company providing services, technologies, and product solutions within subsea and field design
21%
% of gross asset value(30.09.14)
Investment value of NOK 6.1 billion
Aker’s investment1)
NOK million
Value as per 30.06.14 -
Demerger in 3Q 6 532
Invested / divested in 3Q -
Value change in 3Q (480)
Key figures2)
NOK million3Q13 3Q14 YTD13 YTD14
Revenues 6 806 8 271 21 577 23 754
EBITDA 567 617 1 494 1 827
Backlog 39 429 48 986
Industrial HoldingsAker Solutions
2) Comparative figures for businesses accounted for as discontinued operations have been restated
1) Investment held through Aker Kvaerner Holding and through 6.4% direct ownership
11AKER ASA | Third-quarter results 2014

14 November 2014
Aker’s ownership agenda
Combine operational excellence and M&A
Capital discipline
Discretionary dividend policy
Oilfield services investment company with a flexible mandate for long-term value creation
8%
% of gross asset value(30.09.14)
Investment value of NOK 2.4 billion
Aker’s investment1)
NOK million
Value as per 30.06.14 10 081
Demerger in 3Q (6 532)
Invested / divested in 3Q -
Value change in 3Q (1 104)
Key figures2)
NOK million3Q13 3Q14 YTD13 YTD14
Revenues 4 234 5 096 13 370 16 106
EBITDA 354 852 960 1 117
Backlog 17 320 20 266
Industrial HoldingsAkastor
2) Comparative figures for businesses accounted for as discontinued operations have been restated
1) Investment held through Aker Kvaerner Holding and through 6.3% direct ownership
12AKER ASA | Third-quarter results 2014

14 November 2014
Aker’s ownership agenda
Secure new NCS contracts
Flawless execution of order backlog
Maintain a growing dividend to shareholders
Explore strategic options
Specialised oil and gas-related EPC company
3%
% of gross asset value(30.09.14)
Investment value of NOK 0.8 billion
Aker’s investment1)
NOK million
Value as per 30.06.14 973
Invested / divested in 3Q -
Dividend received in 3Q -
Value change in 3Q (154)
Key figures2)
NOK million3Q13 3Q14 YTD13 YTD14
Revenues 3 080 4 004 9 021 10 354
EBITDA 180 194 456 653
Backlog 25 647 19 353
Industrial HoldingsKvaerner
2) Comparative figures for businesses accounted for as discontinued operations have been restated
1) Investment held through Aker Kvaerner Holding
13AKER ASA | Third-quarter results 2014

14 November 2014
Aker’s ownership agenda
Complete the integration of Marathon Norway and safeguard continued high operational performance
Execute Ivar Aasen project on time and on budget
Secure the ownership in the unitised Johan Sverdrup field
Actively manage portfolio to enhance values
Exploration & Production company on the Norwegian continental shelf
20%
% of gross asset value(30.09.14)
Investment value of NOK 5.7 billion
Aker’s investmentNOK million
Value as per 30.06.14 4 713
Invested / divested in 3Q 1 501
Dividend received in 3Q -
Value change in 3Q (466)
Key figures NOK million
3Q13 3Q14 YTD13 YTD14
Revenues 324 112 690 724
EBITDAX 241 45 402 468
Industrial HoldingsDet norske
14AKER ASA | Third-quarter results 2014

14 November 2014
Industrial HoldingsMarathon Norway - a company maker for Det norske
15AKER ASA | Third-quarter results 2014
11.6
0.7
Pre-tax profitFirst nine months 2014, (NOKbn)
RevenuesFirst nine months 2014, (NOKbn)
Pre-tax profit in MONAS1) of NOK 9.5 billion, compared to a pre-tax loss of NOK 1.1 billion in Det norske
Revenues in MONAS1) of NOK 11.6 billion, compared to revenues of NOK 724 million in Det norske
1)From Marathon Norway AS unaudited separate financial accounts in accordance with NGAAP accounting principlesSource: Det norske
9.5
-1.1Det norske Marathon
NorwayDet norske Marathon
Norway
65.4
2.6
Net average daily productionFirst nine months 2014, (‘000 boepd)
Net production from the Greater Alvheimarea averaged 65,400 boepd, compared to 2,641 boepd in Det norske
Det norske Marathon Norway

14 November 2014
Aker’s ownership agenda
Expand and diversify portfolio
Build backlog, with long-term charters against solid counterparties
Drive down cost of capital
Predictable and growing cash dividends
A maritime assets company with focus on long-term contracts
14%
% of gross asset value(30.09.14)
Investment value of NOK 4.2 billion
Aker’s investmentNOK million
Value as per 30.06.14 3 881
Invested / divested in 3Q -
Dividend received in 3Q (80)
Value change in 3Q 443
Key figuresUSD million
3Q13 3Q14 YTD13 YTD14
Revenues 62 65 178 187
EBITDA 56 54 155 163
EBITDA backlog 1 782 2 205
Industrial HoldingsOcean Yield
16AKER ASA | Third-quarter results 2014

14 November 2014
Aker’s ownership agenda
Build and expand the market for krill-derived products, ingredients and applications
Start-up of commercial production at the Houston krill oil facility
Explore options to further reveal underlying values and render investment more liquid
Integrated biotech company – specialised in krill harvesting and processing
6%
% of gross asset value(30.09.14)
Book value of NOK 1.7 billion
Aker’s investmentNOK million
Book value as per 30.06.14 1 743
Invested / divested in 3Q 4
Dividend received in 3Q -
Value change in 3Q -
Key figures1)
USD million1Q14 2Q14 3Q14 YTD14
Revenues 23 34 29 86
EBITDA 7 8 0 15
Industrial HoldingsAker BioMarine
17AKER ASA | Third-quarter results 2014
1) Figures include Trygg Pharma Group

14 November 2014
Aker’s ownership agenda
Operational excellence and improved profitability
Optimise vessel and quota portfolio
Introduce annual dividend
Leading whitefish harvesting company
3%
% of gross asset value(30.09.14)
Investment value of NOK 0.7 billion
Aker’s investmentNOK million
Value as per 30.06.14 741
Invested / divested in 3Q -
Dividend received in 3Q -
Value change in 3Q 3
Key figuresNOK million
3Q13 3Q14 YTD13 YTD14
Revenues 189 296 519 736
EBITDA 45 85 119 200
Industrial HoldingsHavfisk
18AKER ASA | Third-quarter results 2014

Aker
Financial Investments
14 November 2014 19AKER ASA | Third-quarter results 2014

14 November 2014
Key events 3Q:
Cash decreased to NOK 1.6 billion vs. NOK 3.1 billion in 2Q
Underlying value in line with 2Q
NOK 1.0 billion will be returned to Aker in 4Q, following sale of the first phase of Aberdeen business park project
20
26%
% of gross assets
Financial InvestmentsNOK billion
0
2
4
6
8
10
4Q 2013 2Q 2014 3Q 2014
Other financial investments
Real estate development(Fornebuporten)Other public investments
Liquid fund investments
Cash
Financial InvestmentsNOK 3.0bn realisation target remains on track
AKER ASA | Third-quarter results 2014
Financial InvestmentsCash and Liquid fund investments
14 November 2014 21
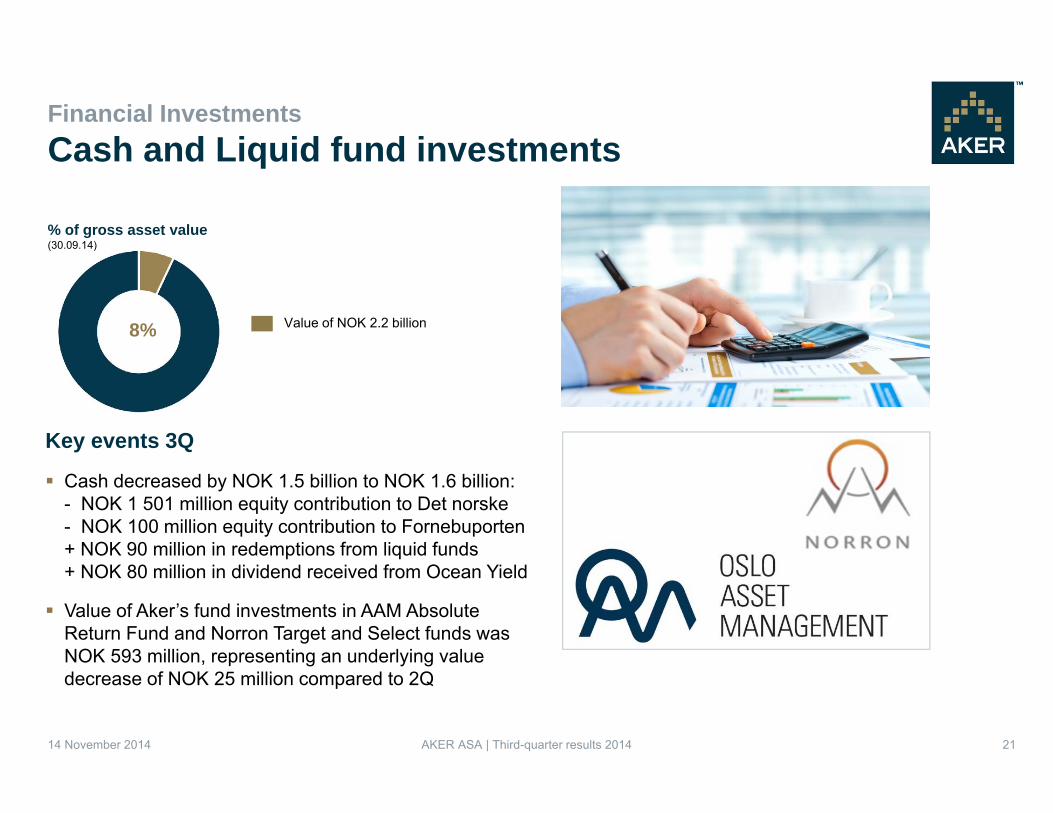
Key events 3Q
Cash decreased by NOK 1.5 billion to NOK 1.6 billion:- NOK 1 501 million equity contribution to Det norske- NOK 100 million equity contribution to Fornebuporten+ NOK 90 million in redemptions from liquid funds + NOK 80 million in dividend received from Ocean Yield
Value of Aker’s fund investments in AAM Absolute Return Fund and Norron Target and Select funds was NOK 593 million, representing an underlying value decrease of NOK 25 million compared to 2Q
8%
% of gross asset value(30.09.14)
Value of NOK 2.2 billion
AKER ASA | Third-quarter results 2014

Financial InvestmentsPublic financial investments
14 November 2014 22
7%
% of gross asset value(30.09.14)
Value of NOK 2.1 billion
1) Includes security deposits in escrow accounts related to TRS agreements
Key figuresNOK million
4Q 13 2Q14 3Q14
AKPS 1 017 1 151 1 122
AMSC (incl. TRS)1) 588 908 1 000
Other 4 4 -
Total value 1 609 2 064 2 122
AKER ASA | Third-quarter results 2014
Key events 3Q
The value of public financial investments increased by NOK 58 million, primarily due to a value increase in American Shipping Company
Process initiated to evaluate strategic alternatives for the two US Jones Act companies with the aim to maximise shareholder value

Key events 3Q
Construction of office and residential buildings at Fornebuporten progressing as planned
More than 80% of retail and office space leased out as of today, with more leases in the pipeline
First phase of Aberdeen business park sold to Legal & General in November, approximately NOK 1 billion will be returned to Aker in 4Q
Financial InvestmentsReal estate development (Fornebuporten)
14 November 2014 23
6%
% of gross asset value(30.09.14)
Receivable and equity investments of NOK 1.7 billion
AKER ASA | Third-quarter results 2014

Key events 3Q
Other financial investments remained at NOK 1.6 billion, in line with levels from 2Q
Largest contributors are Align, Navigator Marine, Setanta Energy, Ocean Harvest and intangible, fixed and non-interest-bearing assets
Aim to gradually reduce exposure through exits / monetisations
Financial InvestmentsOther financial investments
14 November 2014 24AKER ASA | Third-quarter results 2014
5%
% of gross asset value(30.09.14)
Receivable and equity investments of NOK 1.6 billion
Key figuresNOK million
4Q 13 2Q14 3Q14
Other financial investments 2 135 1 622 1 608

Aker
Financial Statements
14 November 2014 25AKER ASA | Third-quarter results 2014

Amounts in NOK million 2013 2Q 2014 3Q 2014
Intangible, fixed, and non-interest-bearing assets 237 250 273Interest-bearing fixed assets 605 534 488Investments 15 762 15 678 16 923Non-interest-bearing short-term receivables 59 21 24Interest-bearing short-term receivables 15 76 82Cash 2 459 3 095 1 637Total assets 19 137 19 655 19 427Equity 12 417 12 621 12 347Non-interest-bearing debt 1 320 412 486Interest-bearing debt, internal 135 5 5Interest-bearing debt, external 5 266 6 617 6 589Equity and liabilities 19 137 19 655 19 427Net interest bearing debt(-)/receivables(+) (2 321) (2 916) (4 386)Equity ratio 65% 64% 64%Equity per share 171.6 174.5 170.7
Aker ASA and holding companiesBalance sheet
14 November 2014 26AKER ASA | Third-quarter results 2014

Aker ASA and holding companiesInterest bearing items and loan guarantees
14 November 2014
Interest bearing debt NOK mill MaturityBond AKER 05 808 2015Bond AKER 08 500 2017Bond AKER 11 1300 2018Bond AKER 07 500 2019Bond AKER 12 1 326 2019Bond AKER 10 700 2020Bond AKER 09 1 000 2022Bank debt 500 2017Internal debt and other (40)Total 6 594
0
1 000
2 000
3 000
4 000
5 000
6 000
7 000
Cash
Interest-bearing receivables
Debt
Net interest bearing liabilities NOK 4.4 billion
0
200
400
600
800
1000
1200
1400
1600
1800
2000
2014 2015 2016 2017 2018 2019 2020 2021 2022
Bank debt
Bonds
27
Financial Covenants Limit Status per30.09.2014
i Total Debt/Equity1) < 80% 45%
ii Group Loans to NAV < 50% 4.5%or Group Loans < NOK 10 bn NOK 1.0 bn
Loan guarantees 2Q 14 3Q 14Aker BioMarine 305 305Fornebuporten loan facility 150 150Other 3 3Total external 458 458
Average debt maturity is 4.3 years
1) Covenant applies to Aker ASA (parent only). Reference is made to loan agreements for details.
AKER ASA | Third-quarter results 2014

Amounts in NOK million 3Q 2013 2Q 2014 3Q 2014 YTD 2013 YTD 2014 Year 2013Operating expenses (57) (50) (63) (166) (171) (236)EBITDA (57) (50) (63) (166) (171) (236)Depreciation (4) (4) (4) (11) (11) (14)Non recurring operating items - - - - (37) -Value change (29) 227 (260) 380 (290) 252Net other financial items 167 436 51 664 439 822Profit before tax 77 609 (276) 867 (70) 825
Aker ASA and holding companiesIncome statement
14 November 2014 28AKER ASA | Third-quarter results 2014

AKER ASA | Third quarter results 2014 29
(in USD million) FY13 2Q 2014 3Q 2014
Revenues from sale of products 117.2 33.9 28.7 Operating profit before depreciation, amortisation and impairments 3.5 8.0 (0.7)Operating profit (13.6) 3.0 (5.1)Net profit before tax (18.8) 1.5 (6.2)
(in USD million) 31.12.2013 30.6.2014 30.9.2014Property, plant and equipment 117 111 110Intangible assets 73 73 73Investments in equity-accounted investee 6 6 6Other assets 58 79 74
Cash and cash equivalents 7 4 3
Total assets 261 272 267Owner’s equity 86 96 90Non-interest bearing debt 27 21 20Interest-bearing debt 148 155 157Total liabilities and owner’s equity 261 272 267
Income Statement
Balance Sheet
* From unaudited combined carve-out financial statements for Aker ASA’s krill business
Aker BioMarineFinancials*

Proud ownership

▪ This Document includes and is based, inter alia, on forward-looking information and statements that are subject to risks and uncertainties that could cause actual results to differ. These statements and this Document are based on current expectations, estimates and projections about global economic conditions, the economic conditions of the regions and industries that are major markets for Aker ASA and Aker ASA’s (including subsidiaries and affiliates) lines of business. These expectations, estimates and projections are generally identifiable by statements containing words such as ”expects”, ”believes”, ”estimates” or similar expressions. Important factors that could cause actual results to differ materially from those expectations include, among others, economic and market conditions in the geographic areas and industries that are or will be major markets for Aker's businesses, oil prices, market acceptance of new products and services, changes in governmental regulations, interest rates, fluctuations in currency exchange rates and such other factors as may be discussed from time to time in the Document. Although Aker ASA believes that its expectations and the Document are based upon reasonable assumptions, it can give no assurance that those expectations will be achieved or that the actual results will be as set out in the Document. Aker ASA is making no representation or warranty, expressed or implied, as to the accuracy, reliability or completeness of the Document, and neither Aker ASA nor any of its directors, officers or employees will have any liability to you or any other persons resulting from your use.
▪ The Aker group consists of many legally independent entities, constituting their own separate identities. Aker is used as the common brand or trade mark for most of this entities. In this document we may sometimes use ”Aker", "Group, "we" or "us" when we refer to Aker companies in general or where no useful purpose is served by identifying any particular Aker company.
Disclaimer
14 November 2014 31AKER ASA | Third-quarter results 2014