airway pathological heterogeneity in asthma: …...airway pathological heterogeneity in asthma:...
TRANSCRIPT

Airway pathological heterogeneity in asthma:Visualization of disease microclusters usingtopological data analysis
Salman Siddiqui, MRCP, PhD,a Aarti Shikotra, BSc, PhD,a Matthew Richardson, BSc, PhD,a Emma Doran, PhD,b
David Choy, BSc,b Alex Bell, MMath,a,d Cary D. Austin, MD, PhD,b Jeffrey Eastham-Anderson, MS,b
Beverley Hargadon, RGN,a Joseph R. Arron, MD, PhD,b Andrew Wardlaw, FRCP, PhD,a
Christopher E. Brightling, FRCP, PhD,a LiamG. Heaney, FRCP,MD,c and Peter Bradding, FRCP, DMa Leicester and Belfast,
United Kingdom, and South San Francisco, Calif
GRAPHICAL ABSTRACT
[2] TOPOLOGICAL DATA ANALYSIS
(TDA)
[3] NETWORK OVERLAY OF OTHER TRAITS AND SEGMENTATION FOR REGIONS OF INTEREST
TDA networks
micro-clusters
patients linked to k nearest neighbours links treated as springs and motion computed
clustering in overlapping intervals post motioncompressed representation of similarity
Data reduction
Nine immuno-pathology attributes
Four attribute dataset
(input to TDA)
n =
202
patie
nts
[1] DISCOVERY COHORT: IDENTIFY KEY PATHOLOGY ATTRIBUTES
Epithelial Area
Airway Smooth Muscle Area
RBM thickness
MBP+eosinophils
[4] REPLICATION OF TOPLOGIES IN AN INDEPENDENT SEVERE ASTHMA COHORT
Adjust for Tissue Shrinkage in
Paraffin
VIETORIS-RIPS filtration method
Compare topologies in discovery and
replication cohorts
Background: Asthma is a complex chronic diseaseunderpinnedbypathological changes within the airway wall. How variations instructural airway pathology and cellular inflammation contributeto the expression and severity of asthma are poorly understood.Objectives: Therefore we evaluated pathological heterogeneityusing topological data analysis (TDA) with the aim of visualizingdisease clusters and microclusters.
From athe Department of Infection Immunity and Inflammation, Institute for Lung
Health, University of Leicester, Glenfield Hospital, Leicester; bGenentech, South
San Francisco; cthe Centre for Infection and Immunity, Health Sciences Building,
Queens University Belfast; and dthe Department of Mathematics, University of
Leicester.
Supported by the National Institute for Health Research (NIHR) Leicester Respiratory
Biomedical Research Unit and project grants (to S.S., P.B., J.R.A., and L.G.H.) from
Asthma UK (AUK-PG-2013-208 [project title: Endotyping asthma for the benefit of
patients]) and from the Jules Thorne Trust Clinical Senior Lecturer Award (‘‘Systems
medicine: novel mathematical approaches to personalised care in asthma patients’’; to
S.S.). The views expressed are those of the author(s) and not necessarily those of the
NHS, the NIHR, or the Department of Health. Additional funding was received from
Genentech (to P.B.) to support this study. Biopsy samples and additional funding from
the GlaxoSmithKline-sponsored studies RES100767 (clinicaltrials.gov:
NCT00331058) and RES100769 (clinicaltrials.gov: NCT00327197) were provided
by GlaxoSmithKline (to A.J.W.) to support this study. In addition, biopsy samples
were provided by C.E.B. to support this study from studies funded by an MRC inter-
mediate and a Wellcome Trust senior fellowship award.
Disclosure of potential conflict of interest: S. Siddiqui declares grants from the Jules
Thorne Trust Grant for Clinical Senior Lecturers, an AsthmaUK Project Grant, a grant
from the NIHR Biomedical Research Centre and consultancy with AstraZeneca,
GlaxoSmithKline, Owlstone, Mundipharma, and Boehringer Ingelheim. D. Choy is
employed by Genentech, a member of the Roche Group; holds patents (planned,
pending or issued) with Genentech, a member of the Roche Group; and has stock/stock
options with Roche. C. D. Austin is employed by, has stock/stock options with, and has
received travel/accommodation/meeting expenses unrelated to activities listed from
Genentech. J. R. Arron is employed by Genentech and has stock/stock options with
Methods: A discovery population of 202 adult patients (142asthmatic patients and 60 healthy subjects) and an externalreplication population (59 patients with severe asthma) wereevaluated. Pathology and gene expression were examined inbronchial biopsy samples. TDA was applied by usingpathological variables alone to create pathology-driven visualnetworks.
Roche Holdings. A.Wardlaw has received a grant fromGlaxoSmithKline; holds board
membership with TEVA; has been a consultant for GlaxoSmithKline, Pulmocide,
Boehringer, and KNOPP; and has received grants from/has grants pending with Pfizer.
C. E. Brightling has received grants from the Wellcome Trust, Asthma UK, and the
MRC; has consultant arrangements with GlaxoSmithKline, AstraZeneca/MedI-
mmune, Chiesi, Novartis, Roche/Genentech, Theravance, Sanofi/Regeneron, Vectura,
and Prep; and has grants from/grants pending with Roche/Genentech, Novartis,
GlaxoSmithKline, AstraZeneca/MedImmune, Mologic, and Pfizer. L. G. Heaney has
received grants from Northern Ireland Chest, Heart & Stroke Association and
Genentech; has consultant arrangements with Hoffman la Roche, AstraZeneca,
Novartis, GlaxoSmithKline, and TEVA; has received grants from/has grants pending
with Novartis UK, Roche/Genentech, MedImmune, and GlaxoSmithKline; has
received payment for lectures, including service on speakers’ bureaus, from Hoffman
la Roche, Novartis, and TEVA; and has received travel/accommodation/meeting
expenses unrelated to activities listed from AstraZeneca, Boehringer Ingelheim,
GlaxoSmithKline, TEVA, Chiesi, and Napp. P. Bradding has received a grant from
Genentech and has Consultant arrangements with Roche. The rest of the authors
declare that they have no relevant conflicts of interest.
Received for publication April 28, 2017; revised November 16, 2017; accepted for pub-
lication December 4, 2017.
Corresponding author: Salman Siddiqui, MRCP, PhD, Institute for Lung Health, Respi-
ratory Biomedical Research Unit, University Hospitals of Leicester, Leicester LE3
9QP, United Kingdom. E-mail: [email protected].
0091-6749/$36.00
Crown Copyright� 2018 Published by Elsevier Inc. on behalf of the American Academy
of Allergy, Asthma & Immunology. All rights reserved
https://doi.org/10.1016/j.jaci.2017.12.982
1

Abbreviations used
ASM: Airway smooth muscle
BOBCAT: Biomarkers in Corticosteroid-refractory Asthma
GINA: Global Initiative for Asthma
GMA: Glycol methacrylate
IQR: Interquartile range
TDA: Topological data analysis
J ALLERGY CLIN IMMUNOL
nnn 2018
2 SIDDIQUI ET AL
Results: In the discovery cohort TDA identified 4 groups/networks with multiple microclusters/regions of interest thatwere masked by group-level statistics. Specifically, TDA group 1consisted of a high proportion of healthy subjects, with amicrocluster representing a topological continuum connectinghealthy subjects to patients with mild-to-moderate asthma.Three additional TDA groups with moderate-to-severe asthma(Airway Smooth MuscleHigh, Reticular BasementMembraneHigh, and RemodelingLow groups) were identified andcontained numerous microclusters with varying pathologicaland clinical features. Mutually exclusive TH2 and TH17 tissuegene expression signatures were identified in all pathologicalgroups. Discovery and external replication applied to the severeasthma subgroup identified only highly similar ‘‘pathologicaldata shapes’’ through analyses of persistent homology.Conclusions: We have identified and replicated novelpathological phenotypes of asthma using TDA. Ourmethodology is applicable to other complex chronic diseases. (JAllergy Clin Immunol 2018;nnn:nnn-nnn.)
Key words: Severe asthma, remodeling, airway inflammation, topo-logical data analysis, phenotyping
Asthma is a complex chronic disease that causes considerablemorbidity1 and is often suboptimally controlled with current ther-apies.2 It is characterized by the presence of airway inflammation,which can be associated with the presence or absence of type 2 in-flammatory cytokines.3 In addition to inflammation, airway remod-eling4 is a common feature of asthma and encompasses a variety ofstructural changes, including reticular basement membrane thick-ening, increased airway smooth muscle (ASM) mass, increasedglandularmass, goblet cell hyperplasia,5 and vascular remodeling.6
The use of endobronchial biopsies to investigate the pathologyof asthmatic airways has greatly improved our understanding ofasthma pathophysiology.4,7 However, studies to date describingairway pathology in asthmatic patients have been limited by (1)relatively small sample sizes, (2) variability in the pathologicalfeatures described, and (3) variability in the techniques used. Inparticular, there has been no comprehensive evaluation of airwaypathology in asthma using a single set of analytical features with aview to identifying pathological subtypes of asthma. Such a studyis important because emerging asthma therapies can target spe-cific features of remodeling, cellular inflammation, or both8-10
and their associated molecular pathways.We hypothesized that (1) patients with asthma comprise distinct
pathological phenotypes and (2) the phenotypes observed inasthma could be replicated by using mathematical techniquessuitable for replication of high-dimensional topologies. We usedunbiased statistical approaches combining data topology andvisualization using topological data analysis (TDA) to generatepathological phenotypes11-13 of patients with asthma across thespectrum of treatment intensity and healthy age-matched subjects.An independent severe asthma external replication cohort was usedto evaluate topology replication. Specifically, we selected TDA asan analytic tool because of the ability to interrogate complex data inhigh-dimensional (>3 dimensions) space and create visualizations(networks) of the data. Unlike classical approaches, such as someforms of cluster analysis, TDA does not require any a priori spec-ification of the number of clusters and has the added advantage ofenhanced visualization of putative phenotypes and microscopicclusters identified as connected nodes of individual patients sharing
similar pathological attributes. Additionally, with classical clus-tering methods, data points that can be naturally connected canbe broken apart, but TDA preserves natural connections and re-flects the ‘‘gradual’’ separation of points in a real data set. Ifwell-separated groups exist within a data set, then TDAwill iden-tify these groups but not at the expense of introducing artificial sep-aration between data points.
METHODS
Patient populationsWe evaluated 2 independent populations (see Fig E1 in this article’s Online
Repository at www.jacionline.org): (1) a discovery population (discovery
cohort) of asthmatic patients across the spectrum of asthma treatment intensity
and age-matched healthy volunteers and (2) an independent replication popula-
tion (replication cohort) of patients with severe asthma at Global Initiative for
Asthma (GINA) treatment steps 4 and 5.1 The replication cohort was evaluated
and compared with the GINA step 4 and 5 population in the discovery cohort.
Discovery cohort. Two hundred two patients (142 asthmatic
patients and 60 healthy volunteers) were recruited prospectively at Glenfield
Hospital, Leicester, United Kingdom, and Queen’s University, Belfast, United
Kingdom. Some pathological features presented here have been reported
previously from subcohorts of patients.6,14-20
Replication cohort. Bronchial biopsy specimens were evaluated in
59 patients from the multicenter Bronchoscopic Exploratory Research Study
of Biomarkers in Corticosteroid-refractory Asthma (BOBCAT) study,21 a
3-visit observational study of patients with uncontrolled severe asthma taking
high-dose inhaled or oral corticosteroids (GINA treatment steps 4-5).
Asthmatic/healthy volunteers: definitionAll patientswith asthmawere current nonsmokers, with a 10 pack year or less
smoking history, andmet the following diagnostic criteria: an expert physician’s
diagnosis of asthma with objective evidence (defined as >_1 of the following:
peak flow variation >_20% over a 2-week period, bronchodilator reversibility>_12% and 200 mL, or airway hyperresponsiveness [methacholine PC20 <_8 mg/
mL]). Asthma treatment intensity was used as a marker of disease severity and
defined according to GINA treatment steps with the following severity strata
(GINA 1, n5 30 [mild], GINA 2-3, n5 31 [moderate], and GINA 4-5 [severe],
n 5 81).1 Healthy volunteers in the discovery cohort (n 5 60) were identified
from local advertising and had no prior history of respiratory disease.
Ethical approvalsAll studies were approved by locally relevant ethics committees and
institutional review boards. A detailed statement on ethical approvals in
provided in the Methods section in this article’s Online Repository at www.
jacionline.org.
Patient characterizationDiscovery cohort. Patients underwent extensive evaluation at
baseline, including a full medical history and lung function testing with
bronchial challenge using methacholine where appropriate and sputum
inflammometry. Tables of data completeness for clinical metadata are reported
in Table E1 in this article’s Online Repository at www.jacionline.org.
J ALLERGY CLIN IMMUNOL
VOLUME nnn, NUMBER nn
SIDDIQUI ET AL 3
Replication cohort. Characterization of patients in the BOBCAT
cohort has been described previously, and results have been compared with
those in the discovery severe asthma cohort (GINA treatment steps 4-5).21
Further details of patient characterization and bronchoscopy in both
cohorts are provided in theMethods section in this article’s Online Repository.
ImmunohistochemistryDiscovery cohort. Two-micrometer glycol methacrylate (GMA)
sections were cut and immunostained, as described previously.22 The
followingmouse primary antibodies were used: anti–neutrophil elastase clone
NP57 (0.1 mg/mL; Dako, Ely, United Kingdom), anti–mast cell tryptase clone
AA1 (0.1 mg/mL; Dako), anti–eosinophil major basic protein clone BMK-13
(0.4 mg/mL; Monosan, Uden, The Netherlands), anti-EN4 (5 mg/mL; Mono-
san), anti–a-smooth muscle actin (1A4, 0.7 mg/mL; Dako), and appropriate
isotype controls (Dako).
Replication cohort. Tissues were fixed with 10% formalin and
embedded in paraffin wax before cutting. Tissue sections (5 mm) were
immunostained for a specific eosinophil marker (eosinophil major basic
protein) by using the alkaline phosphatase technique. Immunoreactivity was
detected with Fast Red and visualized under light microscopy.
Assessment of pathology using
immunohistochemical stainingDiscovery cohort. The following 9 previously validated patholog-
ical features were evaluated in the discovery cohort (see Fig E2 in this article’s
Online Repository at www.jacionline.org). For features 1 to 3, percentages of
epithelial, smooth muscle, and glandular areas in sections were identified16
and measured by using a computer analysis system (Cell F; Olympus,
Hamburg, Germany). The mean of 2 sections at least 10 mm apart was taken
for each analysis. For features 4 to 7, numbers of positively stained nucleated
eosinophils, neutrophils, and mast cells in the lamina propria and mast cells
within the ASM bundle areas were counted and expressed per square milli-
meter. ASM areas of less than 0.1 mm2 were considered insufficient to quan-
tify mast cell numbers.7,15 For feature 8, reticular basement membrane
thickness was measured by using the technique reported by Sullivan et al.23
In addition, for feature 9, the mean Chalkley count, a validated unbiased mea-
sure of vascular size and density, was evaluated in a subset of patients (n5 87
asthmatic and 32 healthy volunteers), as previously reported by us.6
Tables of data completeness for pathological features are reported in Tables
E1, B-D.
All pathological data were assessed by observers blinded to the identity of
the patient. A single blinded observer, A.S. at Leicester, performed cross-
counts in a random selection of asthmatic and healthy cases between F.S. and
S.S. at Leicester (within-center repeatability) and E.D. at Belfast (between-
center repeatability). Good to excellent between- and within-center repeat-
ability was observed for all of the pathological features (intraclass correlation
coefficient > 0.75). Further details relating to intraobserver/interobserver
repeatability of pathology measurements are provided in the Methods and
Table E2 in this article’s Online Repository at www.jacionline.org.
Replication cohort. J.E. and C.A. (Genentech) performed immu-
nohistochemistry analysis with the help of J.R., who identified regions of
interest for analysis and quantification. Because of the known effect of paraffin
embedding, causing tissue shrinkage by approximately 30% in length and
50% in areawhen comparedwithGMA,24 all biopsymeasures in paraffinwere
normalized to account for this effect. We assumed that tissue shrinkage was
isotropic and uniform within biopsy specimens. Further details on normaliza-
tion for paraffin-embedded tissue shrinkage are provided in the Methods sec-
tion in this article’s Online Repository.
Lung function decrease cohortDiscovery cohort. A subgroup of asthmatic patients (67/142; see Fig
E1) in the discovery cohort had longitudinal lung function (prebronchodilator
FEV1) data acquired after bronchial biopsy sampling. The median follow-up
durationwas 2.73 years (Q1-Q3, 0.77-5.34 years). This populationwas used to
evaluate the effect of remodeling phenotype on lung function decrease over
time, although this substudy was not powered to detect interaction of TDA
clusters and time.
Biopsy gene expression cohortDiscovery and replication cohorts. For a subset of biopsy
specimens (see Fig E1), gene expression data were available from bronchial bi-
opsy homogenates. RNAwas isolated fromhomogenized bronchial biopsy spec-
imens, as described previously.10 RNA was amplified (Ambion, Life
Technologies, Grand Island, NY) for Agilent (Santa Clara, Calif) 2-colorWhole
Human Genome 4x44k gene expression microarray analysis. The gene expres-
sion profile of TH2 or TH17 asthma was defined, as previously reported.10,25,26
Additional analyses of genome-wide expression were performed in the severe
asthma fraction (GINA treatment steps 4-5) of both cohorts and are outlined
in the Methods section in this article’s Online Repository.
Statistical analysisBasic summary statistical analysis was performed with R 3.3.1 software (R
Development Core Team) and SAS software (version 9.4; SAS Institute, Cary,
NC). Parametric and nonparametric data are presented as means (SEMs) and
medians (interquartile ranges [IQRs]), respectively, unless otherwise stated.
For comparison of multiple groups characterized by parametric and
nonparametric variables, 1-way ANOVA or the Kruskal-Wallis test was
used, and x2/Fisher exact tests were used for proportions.
A 3-step statistical process was used and incorporated to generate data on
pathological phenotypes in asthmatic patients. Step 1 was defined as factor
analysis to reduce the dimensionality of 9 pathological features (leading to
identification of 4 canonical pathological features highlightedwith asterisks in
Fig E2). Step 2 was defined as TDAwith the input function derived from path-
ological factor analysis (described methodologically in Fig E3 in this article’s
Online Repository at www.jacionline.org). Step 3 was defined as mapping of
variables not used to generate TDA networks to the networks, such as FEV1
decrease (by using linear mixed effects models; see Table E3 in this article’s
Online Repository at www.jacionline.org) and biopsy gene expression
(eg, TH2 and TH17 gene expression scores).
Microclusters were defined as regions within networks of patients (nodes)
that were similar (connected by lines) and to avoid overinterpretation of the
data represented visible substructures within networks, such as loops, tails,
and large regions within networks separated by significant distances. Micro-
clusters were used to understand within-network pathological heterogeneity
within the discovery cohort.
Further details of these analyses are provided in theMethods section in this
article’s Online Repository.
Investigation of topological similarity in the
discovery and replication severe asthma cohortsAn investigation of the topological equivalence of the severe asthma
fraction (GINA treatment steps 4-5) within the discovery and replication data
set was undertaken by using a specific analysis of persistence homology that
evaluates the similarity between data shapes generated by using high-
dimensional topology27-30 with JavaPlex31 in MATLAB R2016b.
Further details are provided in the Methods section and Fig E4 in this arti-
cle’s Online Repository at www.jacionline.org.
RESULTS
Discovery cohort: Airway pathology and asthma
severityClinical characteristics of the study population stratified by
GINA treatment intensity are presented in Tables E4,A andB, andpathological biopsy measurements stratified by GINA treatment
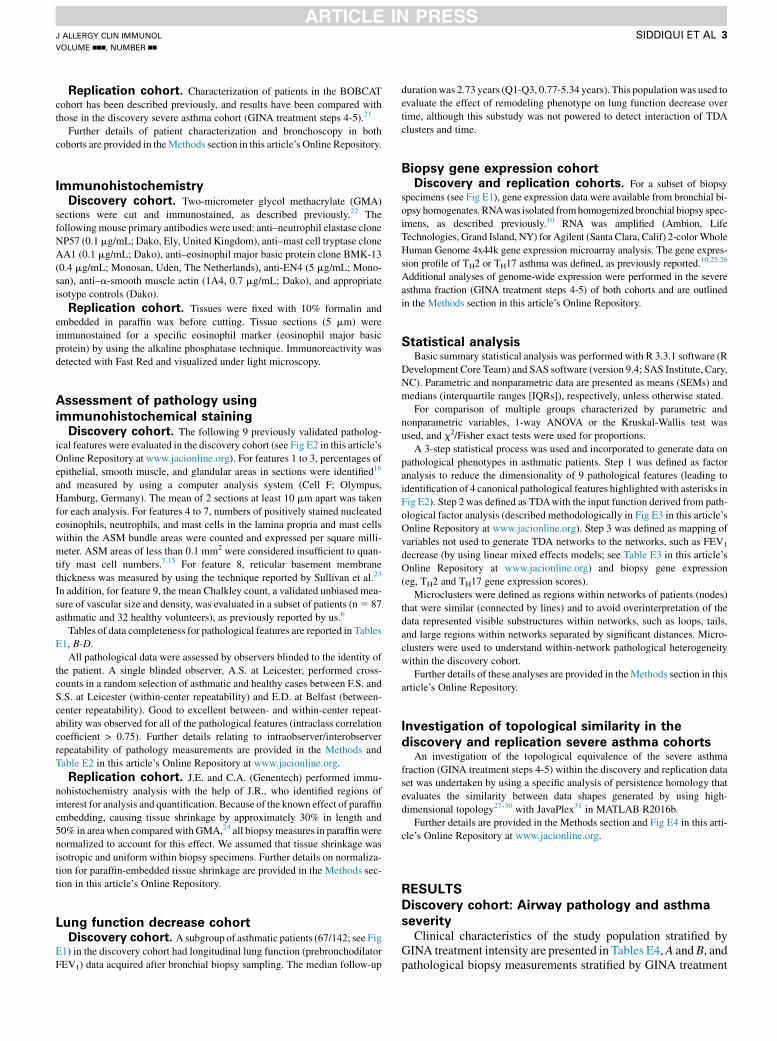
FIG 1. Discovery TDA pathology networks annotated by GINA treatment intensity. TDA networks were
generated by using airway pathology markers in the discovery population of asthmatic and healthy
volunteers. Networks have been colored by GINA treatment intensity (bottom right-hand color key) with
GINA step 0 assigned to healthy volunteers to allow discrimination of asthmatic patients and nonasthmatic
subjects, as well as asthma severity, both within and between networks. Four pathological traits derived af-
ter data reduction, as annotated in the right-hand photomicrograph inset (see Fig E2), were used to generate
pathologically driven TDA networks. There are 4 overall groups of interest, with 1 additional set of cases
who do not fall into any grouping. Patients with severe asthma fall primarily within groups 2 to 4. Healthy
volunteers and patients with mild asthma (GINA steps 1-2) appear to be located primarily in group 1. The
white dotted loop within group 1 identifies a group of patients who are healthy/have mild-to-moderate
asthma without significant airway hyperresponsiveness and with no history of exacerbations that appear
to represent a continuum between health and asthma. Additional healthy volunteers appear to be occasion-
ally located within asthmatic networks (groups 2-4;white arrows) and in some cases are not associated with
a core grouping (orange circle).
J ALLERGY CLIN IMMUNOL
nnn 2018
4 SIDDIQUI ET AL
intensity are shown in Tables E5 and E6 (90th percentile analysis)and Fig E5 in this article’s Online Repository at www.jacionline.org.
Biopsy gene expression analysis and asthma
treatment intensityA total of 11 differentially expressed genes demonstrating
increased (FKBP5, KRT24, SLC25A16, and PHACTR3) orreduced (PHACTR1, RPL23AP32, YME1L1, ROBO3, TMC6,and IGLJ3) expression between patients with severe asthma andhealthy control subjects (after accounting for false discovery)were replicated in the BOBCAT severe asthma cohort (see FigE6 and Table E7 in this article’s Online Repository at www.jacionline.org). Based on these observations, TH2 and TH17gene expression scores10 and a selection of the 11 replicated genes(see Fig E6: FKBP5,32-34 PHACTR3,35-37 and KRT2438) wereused to subsequently annotate TDA networks and colocalizegene expression with various remodeling and clinical features.
Discovery cohort: Identification of pathological
subtypes/phenotypes of asthma by using TDAFig E3 demonstrates a conceptual and mathematical overview
outlining the process used by TDA to generate pathological net-works. Fig 1 demonstrates TDA networks of airway pathologygenerated in a 4-dimensional data space. The networks have
been annotated by using GINA treatment intensity scores, withGINA step 0 assigned to healthy volunteers. The images represent2-dimensional networks of airway pathology in asthmatic pa-tients and healthy volunteers. Each network is a series of nodes(round circle) that represent small clusters of patients who sharesimilar pathology and are connected by lines to other nodes in anetwork.
A total of 190 of 202 patients were identified within 4 discreteTDA groups (Fig 1 and Table I). However, 10 of 202 did notdemonstrate any clear grouping by using TDA (Fig 1).
Healthy volunteers (Fig 1, white arrows and white boundarynodes) appeared to be primarily located in the group 1 networkand within nodes that did not form any particular TDA grouping.In contrast, topological groups 2 to 4 were primarily composed ofpatients with moderate-to-severe asthma, although healthy volun-teers were present within these groups (white arrows, Table I).Higher-resolution images of the TDA groups are reported inFigs 2-5 with summaries for both clinical and immunopathologicdata in the groups presented in Tables I and II and of discoveryTDA groups in Fig 6.
Discovery: High-resolution analysis groups 1 to 4Group 1: Mild-to-Moderate Asthma/HealthyContinuum.
Group 1 (Fig 2) was characterized by patients with asthma(n 5 41/77) and healthy volunteers (n 5 36/77). Asthmatic pa-tients within group 1 had a median GINA treatment intensity of
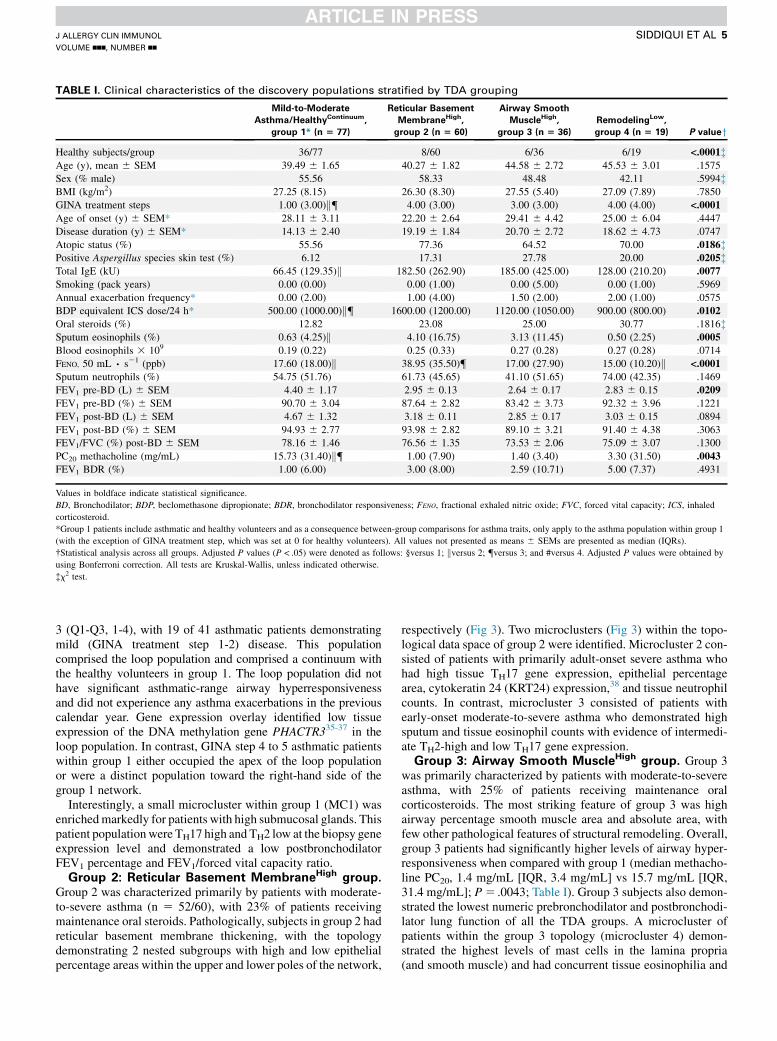
TABLE I. Clinical characteristics of the discovery populations stratified by TDA grouping
Mild-to-Moderate
Asthma/HealthyContinuum,
group 1* (n 5 77)
Reticular Basement
MembraneHigh,
group 2 (n 5 60)
Airway Smooth
MuscleHigh,
group 3 (n 5 36)
RemodelingLow,
group 4 (n 5 19) P valueyHealthy subjects/group 36/77 8/60 6/36 6/19 <.0001�Age (y), mean 6 SEM 39.49 6 1.65 40.27 6 1.82 44.58 6 2.72 45.53 6 3.01 .1575
Sex (% male) 55.56 58.33 48.48 42.11 .5994�BMI (kg/m2) 27.25 (8.15) 26.30 (8.30) 27.55 (5.40) 27.09 (7.89) .7850
GINA treatment steps 1.00 (3.00)k{ 4.00 (3.00) 3.00 (3.00) 4.00 (4.00) <.0001
Age of onset (y) 6 SEM* 28.11 6 3.11 22.20 6 2.64 29.41 6 4.42 25.00 6 6.04 .4447
Disease duration (y) 6 SEM* 14.13 6 2.40 19.19 6 1.84 20.70 6 2.72 18.62 6 4.73 .0747
Atopic status (%) 55.56 77.36 64.52 70.00 .0186�Positive Aspergillus species skin test (%) 6.12 17.31 27.78 20.00 .0205�Total IgE (kU) 66.45 (129.35)k 182.50 (262.90) 185.00 (425.00) 128.00 (210.20) .0077
Smoking (pack years) 0.00 (0.00) 0.00 (1.00) 0.00 (5.00) 0.00 (1.00) .5969
Annual exacerbation frequency* 0.00 (2.00) 1.00 (4.00) 1.50 (2.00) 2.00 (1.00) .0575
BDP equivalent ICS dose/24 h* 500.00 (1000.00)k{ 1600.00 (1200.00) 1120.00 (1050.00) 900.00 (800.00) .0102
Oral steroids (%) 12.82 23.08 25.00 30.77 .1816�Sputum eosinophils (%) 0.63 (4.25)k 4.10 (16.75) 3.13 (11.45) 0.50 (2.25) .0005
Blood eosinophils 3 109 0.19 (0.22) 0.25 (0.33) 0.27 (0.28) 0.27 (0.28) .0714
FENO, 50 mL ∙ s21 (ppb) 17.60 (18.00)k 38.95 (35.50){ 17.00 (27.90) 15.00 (10.20)k <.0001
Sputum neutrophils (%) 54.75 (51.76) 61.73 (45.65) 41.10 (51.65) 74.00 (42.35) .1469
FEV1 pre-BD (L) 6 SEM 4.40 6 1.17 2.95 6 0.13 2.64 6 0.17 2.83 6 0.15 .0209
FEV1 pre-BD (%) 6 SEM 90.70 6 3.04 87.64 6 2.82 83.42 6 3.73 92.32 6 3.96 .1221
FEV1 post-BD (L) 6 SEM 4.67 6 1.32 3.18 6 0.11 2.85 6 0.17 3.03 6 0.15 .0894
FEV1 post-BD (%) 6 SEM 94.93 6 2.77 93.98 6 2.82 89.10 6 3.21 91.40 6 4.38 .3063
FEV1/FVC (%) post-BD 6 SEM 78.16 6 1.46 76.56 6 1.35 73.53 6 2.06 75.09 6 3.07 .1300
PC20 methacholine (mg/mL) 15.73 (31.40)k{ 1.00 (7.90) 1.40 (3.40) 3.30 (31.50) .0043
FEV1 BDR (%) 1.00 (6.00) 3.00 (8.00) 2.59 (10.71) 5.00 (7.37) .4931
Values in boldface indicate statistical significance.
BD, Bronchodilator; BDP, beclomethasone dipropionate; BDR, bronchodilator responsiveness; FENO, fractional exhaled nitric oxide; FVC, forced vital capacity; ICS, inhaled
corticosteroid.
*Group 1 patients include asthmatic and healthy volunteers and as a consequence between-group comparisons for asthma traits, only apply to the asthma population within group 1
(with the exception of GINA treatment step, which was set at 0 for healthy volunteers). All values not presented as means 6 SEMs are presented as median (IQRs).
�Statistical analysis across all groups. Adjusted P values (P < .05) were denoted as follows: §versus 1; kversus 2; {versus 3; and #versus 4. Adjusted P values were obtained by
using Bonferroni correction. All tests are Kruskal-Wallis, unless indicated otherwise.
�x2 test.
J ALLERGY CLIN IMMUNOL
VOLUME nnn, NUMBER nn
SIDDIQUI ET AL 5
3 (Q1-Q3, 1-4), with 19 of 41 asthmatic patients demonstratingmild (GINA treatment step 1-2) disease. This populationcomprised the loop population and comprised a continuum withthe healthy volunteers in group 1. The loop population did nothave significant asthmatic-range airway hyperresponsivenessand did not experience any asthma exacerbations in the previouscalendar year. Gene expression overlay identified low tissueexpression of the DNA methylation gene PHACTR335-37 in theloop population. In contrast, GINA step 4 to 5 asthmatic patientswithin group 1 either occupied the apex of the loop populationor were a distinct population toward the right-hand side of thegroup 1 network.
Interestingly, a small microcluster within group 1 (MC1) wasenrichedmarkedly for patients with high submucosal glands. Thispatient populationwere TH17 high and TH2 low at the biopsy geneexpression level and demonstrated a low postbronchodilatorFEV1 percentage and FEV1/forced vital capacity ratio.
Group 2: Reticular Basement MembraneHigh group.
Group 2 was characterized primarily by patients with moderate-to-severe asthma (n 5 52/60), with 23% of patients receivingmaintenance oral steroids. Pathologically, subjects in group 2 hadreticular basement membrane thickening, with the topologydemonstrating 2 nested subgroups with high and low epithelialpercentage areas within the upper and lower poles of the network,
respectively (Fig 3). Two microclusters (Fig 3) within the topo-logical data space of group 2 were identified. Microcluster 2 con-sisted of patients with primarily adult-onset severe asthma whohad high tissue TH17 gene expression, epithelial percentagearea, cytokeratin 24 (KRT24) expression,38 and tissue neutrophilcounts. In contrast, microcluster 3 consisted of patients withearly-onset moderate-to-severe asthma who demonstrated highsputum and tissue eosinophil counts with evidence of intermedi-ate TH2-high and low TH17 gene expression.
Group 3: Airway Smooth MuscleHigh group. Group 3was primarily characterized by patients with moderate-to-severeasthma, with 25% of patients receiving maintenance oralcorticosteroids. The most striking feature of group 3 was highairway percentage smooth muscle area and absolute area, withfew other pathological features of structural remodeling. Overall,group 3 patients had significantly higher levels of airway hyper-responsiveness when compared with group 1 (median methacho-line PC20, 1.4 mg/mL [IQR, 3.4 mg/mL] vs 15.7 mg/mL [IQR,31.4 mg/mL]; P5 .0043; Table I). Group 3 subjects also demon-strated the lowest numeric prebronchodilator and postbronchodi-lator lung function of all the TDA groups. A microcluster ofpatients within the group 3 topology (microcluster 4) demon-strated the highest levels of mast cells in the lamina propria(and smooth muscle) and had concurrent tissue eosinophilia and

FIG 2. Mild-to-Moderate Asthma/HealthyContinuum TDA network. Higher-magnification image of the group 1
TDA network (top left image). Color annotation keys are provided on the right-hand side of each corre-
sponding TDA image. Gray nodes within the network indicate missing data. BASE and APEX refer to the
bottom and top of the loop structure (white dotted outline). It can be seen that asthmatic patients from
group 1 within the loop structure overall have low exacerbation frequency and low-grade airway hyperres-
ponsiveness, with a gradual transition from TH2 (base of the loop) to TH17 (apex of the loop) tissue gene
expression as corticosteroid exposure increases. The DNA hypermethylation marker of the PHACTR3
gene was found to have low levels of expression in patients with mild asthma and healthy volunteers
(top right image). The TH2-high canonical gene demonstrated a reciprocal relationship with TH17 gene
expression (bottom right images) within tissue, suggesting that these phenotypes are mutually exclusive
(white arrows). The dotted orange box (bottom right) indicates a microcluster (MC1) characterized by
high submucosal percentage glands (this feature was not seen in any other TDA groups), a high TH17 tissue
gene expression score and low postbronchodilator FEV1 percentage and FEV1/forced vital capacity (FVC)
ratio.
J ALLERGY CLIN IMMUNOL
nnn 2018
6 SIDDIQUI ET AL
basement membrane remodeling with associated poor lung func-tion and high exacerbations (Fig 4). Data from the severe asthmadiscovery and replication cohorts indicated that this populationhad a variable TH2 and TH17 tissue inflammatory phenotype(see Fig E9 in this article’s Online Repository at www.jacionline.org).
Group 4: RemodelingLow group. Group 4 was primarilycharacterized by patients with moderate-to-severe asthma(GINA step 4-5: 10/19), although 6 of 19 patients were healthyvolunteers without a diagnosis of asthma. Asthmatic patientswithin this group had the highest numeric exacerbation fre-quency (median, 2 [IQR, 1.0] exacerbations/y; P5 .06, compar-ison across asthmatic patients within TDA groups), despitehaving well-controlled eosinophilic inflammation in blood,sputum, and tissue (Tables I and II). Overall, group 4 had few fea-tures of airway remodeling.
However, a microcluster of patients was identified within thisnetwork, demonstrating a high epithelial percentage area, a non-TH2 and variable high/low TH17 tissue gene expression score,high tissue DNA hypermethylation marker PHACTR3 geneexpression,35-37 and a high frequency of exacerbations. This
group appeared to be enriched markedly for sputum neutrophilia(Fig 5).
Our observations of microclusters in all 4 discovery pathologyphenotypes were masked group level statistics (Tables I and II)and are summarized in Fig 6.
Reciprocal tissue gene expression patternsOverall, TH2 and TH17 gene expression in biopsy tissue was
mutually exclusive across all TDA groups. In addition, the corti-costeroid sensitivity gene FKBP532-34 demonstrated reciprocaltissue expression when compared with PHACTR3 across net-works (Figs 2-5 and see Fig E6).35-37
Discovery: Prebronchodilator FEV1 change analysisMedian decrease slopes in milliliters per year were centered at
zero, with wide Q1-Q3 ranges across the TDA groups; see TableE3, B, and Fig E7 in this article’s Online Repository at www.jacionline.org.

FIG 3. Reticular Basement MembraneHigh TDA network. Higher-magnification image of the group 2 TDA
network. The network is broadly divided into an upper pole and lower pole (correspondingly above and
below the dotted diagonal line). Color annotations for fraction of exhaled nitric oxide (FENO), Sputum
eosinophil values (as a percentage), and biopsy TH2 and TH17 gene expression scores are provided on
the right-hand side of each corresponding TDA image. Gray nodes indicate missing data. It can be seen
that basement membrane thickening is present in both the upper and lower poles of the network; however,
the epithelial area is high in the upper pole and low in the lower pole. Arrows delineate regions of interest
that are subsequently identified as microclusters 2 and 3 (MC2 andMC3, respectively). MC2 is characterized
by adult-onset asthma, high tissue neutrophil counts, and a high epithelial percentage area and TH17 gene
expression score. MC3 is characterized by early-onset atopic refractory eosinophilic asthma, with high tis-
sue and sputum eosinophil counts, a suppressed fraction of exhaled nitric oxide value, and intermediate
TH2 gene expression score. In keeping with previous reports, we identified pockets of TH2-high canonical
gene expression with associated low TH17 gene expression and vice versa (white arrows, bottom right
images).
J ALLERGY CLIN IMMUNOL
VOLUME nnn, NUMBER nn
SIDDIQUI ET AL 7
Replication of airway pathology phenotypes:
Comparison of patients with severe asthma in the
discovery and replication cohortsPatients in the discovery and replication cohorts with severe
asthma were matched for age and sex but differed with respect tothe proportion receiving oral steroids (GINA step 5), bronchodi-lator responsiveness, and baseline spirometry (see Table E8, A-C,in this article’s Online Repository at www.jacionline.org).
The results of computing persistent homology for the discoveryand replication data sets are shown in barcode plots in Fig E8 inthis article’s Online Repository at www.jacionline.org. Both thediscovery and replication populations demonstrated highlysimilar level 0 and level 1 homologies indicative of homologyreplication after accounting for 30% tissue shrinkage because ofparaffin embedding. In contrast, simple visual inspection of net-works (see Fig E9) using TDA did not identify topologicalsimilarities.
DISCUSSIONWe have used novel methods to explore and visualize airway
pathological heterogeneity in asthma and health. Specifically,
high-dimensional pathological objects and networks were gener-ated by using TDA and identified 3 pathological phenotypescorresponding to visualized disease networks: (1) Mild-to-Moderate Asthma/HealthyContinuum, (2) Reticular BasementMembraneHigh, (3) Airway Smooth MuscleHigh, and (4)RemodelingLow.
We selected TDA as an analytical tool because of the ability tointerrogate complex data in high-dimensional space based on thefield of topology/shape analysis of data, machine learning, anddata visualization.11-13 Unlike classical approaches, such as clus-ter analysis, this tool does not require any a priori specification ofthe number of clusters and has the added advantage of enhancedvisualization of putative phenotypes.
TDA group 1 (Mild-to-Moderate Asthma/HealthyContinuum)comprised both patients without asthma and those with mildasthma, forming a distinct topological loop in the data spacewith a smooth transition of airway hyperresponsiveness fromthe nonresponsive range to low-grade hyperresponsiveness, fewfeatures of airway remodeling, and no exacerbations in the previ-ous calendar year, which is indicative of a low risk phenotype.Nested within this pathological group, we identified a small mi-crocluster of patients with TH17-high asthma with a high
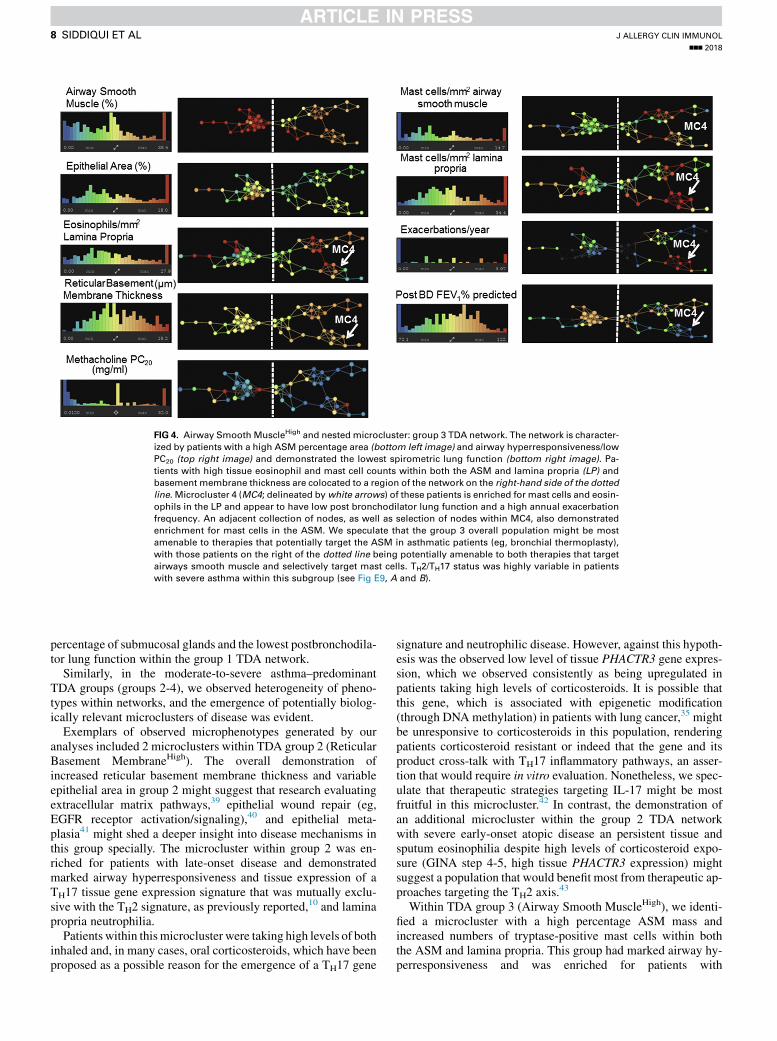
FIG 4. Airway Smooth MuscleHigh and nestedmicrocluster: group 3 TDA network. The network is character-
ized by patients with a high ASM percentage area (bottom left image) and airway hyperresponsiveness/low
PC20 (top right image) and demonstrated the lowest spirometric lung function (bottom right image). Pa-
tients with high tissue eosinophil and mast cell counts within both the ASM and lamina propria (LP) and
basement membrane thickness are colocated to a region of the network on the right-hand side of the dotted
line. Microcluster 4 (MC4; delineated bywhite arrows) of these patients is enriched for mast cells and eosin-
ophils in the LP and appear to have low post bronchodilator lung function and a high annual exacerbation
frequency. An adjacent collection of nodes, as well as selection of nodes within MC4, also demonstrated
enrichment for mast cells in the ASM. We speculate that the group 3 overall population might be most
amenable to therapies that potentially target the ASM in asthmatic patients (eg, bronchial thermoplasty),
with those patients on the right of the dotted line being potentially amenable to both therapies that target
airways smooth muscle and selectively target mast cells. TH2/TH17 status was highly variable in patients
with severe asthma within this subgroup (see Fig E9, A and B).
J ALLERGY CLIN IMMUNOL
nnn 2018
8 SIDDIQUI ET AL
percentage of submucosal glands and the lowest postbronchodila-tor lung function within the group 1 TDA network.
Similarly, in the moderate-to-severe asthma–predominantTDA groups (groups 2-4), we observed heterogeneity of pheno-types within networks, and the emergence of potentially biolog-ically relevant microclusters of disease was evident.
Exemplars of observed microphenotypes generated by ouranalyses included 2 microclusters within TDA group 2 (ReticularBasement MembraneHigh). The overall demonstration ofincreased reticular basement membrane thickness and variableepithelial area in group 2 might suggest that research evaluatingextracellular matrix pathways,39 epithelial wound repair (eg,EGFR receptor activation/signaling),40 and epithelial meta-plasia41 might shed a deeper insight into disease mechanisms inthis group specially. The microcluster within group 2 was en-riched for patients with late-onset disease and demonstratedmarked airway hyperresponsiveness and tissue expression of aTH17 tissue gene expression signature that was mutually exclu-sive with the TH2 signature, as previously reported,
10 and laminapropria neutrophilia.
Patients within thismicrocluster were taking high levels of bothinhaled and, in many cases, oral corticosteroids, which have beenproposed as a possible reason for the emergence of a TH17 gene
signature and neutrophilic disease. However, against this hypoth-esis was the observed low level of tissue PHACTR3 gene expres-sion, which we observed consistently as being upregulated inpatients taking high levels of corticosteroids. It is possible thatthis gene, which is associated with epigenetic modification(through DNA methylation) in patients with lung cancer,35 mightbe unresponsive to corticosteroids in this population, renderingpatients corticosteroid resistant or indeed that the gene and itsproduct cross-talk with TH17 inflammatory pathways, an asser-tion that would require in vitro evaluation. Nonetheless, we spec-ulate that therapeutic strategies targeting IL-17 might be mostfruitful in this microcluster.42 In contrast, the demonstration ofan additional microcluster within the group 2 TDA networkwith severe early-onset atopic disease an persistent tissue andsputum eosinophilia despite high levels of corticosteroid expo-sure (GINA step 4-5, high tissue PHACTR3 expression) mightsuggest a population that would benefit most from therapeutic ap-proaches targeting the TH2 axis.43
Within TDA group 3 (Airway Smooth MuscleHigh), we identi-fied a microcluster with a high percentage ASM mass andincreased numbers of tryptase-positive mast cells within boththe ASM and lamina propria. This group had marked airway hy-perresponsiveness and was enriched for patients with

FIG 5. RemodelingLow and nested microcluster: group 4 TDA network. Color annotations for pathological
and clinical features are provided on the right-hand side of each corresponding TDA image. Overall, this
group exhibited high treatment use and exacerbation frequency. However, microcluster 5 (MC5; white
dotted outline) was identified within this network with a high epithelial percentage area and a non-TH2, pri-
marily non-TH17 tissue gene expression profile. Clinically, this subgroup demonstrated a high annual exac-
erbation frequency, high sputum percentage neutrophil count with a variable tissue neutrophil count, and
concurrent blood eosinophilia in the absence of sputum eosinophilia. Gene expression of the DNA hyper-
methylation marker of the PHACTR3 gene was enriched markedly in this subpopulation (in contrast to TDA
network 1). White arrows represent regions within the network of reciprocal TH2 and TH17 gene expression
in tissue.
J ALLERGY CLIN IMMUNOL
VOLUME nnn, NUMBER nn
SIDDIQUI ET AL 9
exacerbations and lower lung function. Therefore it is possiblethat this group might be more amenable to existing therapeuticstrategies targeting the ASM in asthmatic patients44 and poten-tially novel therapies aimed at targeting tissue mast cells.45 Insupport of this hypothesis, a recent report has identified signifi-cant attenuations in ASM mass in patients with a high baselineASM mass undergoing thermoplasty.19
Finally, group 4 (RemodelingLow) appeared to have frequentexacerbations in the absence of eosinophilic inflammation in tis-sue, sputum, and blood and group-level features of remodeling.However, we identified a microcluster enriched for increasedepithelial area and sputum neutrophilia that appeared to be TH2low, with variable TH17 gene expression in tissue. These observa-tions highlight the fact that our understanding of the inflammatorymechanisms that drive airway pathology beyond the TH2 andTH17 axes in asthmatic patients remain poorly understood.
A common criticism of phenotyping studies is the lack ofreplication of clusters identified within external populations. Weattempted to evaluate this concept using an independent replication
cohort of patients from the BOBCAT severe asthma study,comparing them with patients matched for asthma severity andtreatment in the discovery cohort. It is well recognized that paraffinembedding promotes tissue shrinkage by approximately 30% inlength and 50% in areawhen comparedwithGMA.24 Thereforewenormalized paraffin-embedded biopsy data from BOBCAT by us-ing correction factors that assumed isotropic tissue shrinkage toallow for direct comparisons with GMA in the discovery severeasthma cohort. Our results are one of the first of their kind thatdemonstrate excellent replication of data topology in independentsevere asthma cohorts and highlight the importance of using appro-priate mathematic methods for topology replication.
Our study has a number of limitations. First, all of ourobservations with respect to pathology are cross-sectional. Sec-ond, we did not capture the full complement of remodelingfeatures in biopsy tissue (eg, goblet cell hyperplasia). Third,substudies evaluating FEV1 decrease and TH2/TH17 gene expres-sion in tissue warrant further evaluation in studies with largercohort sizes to study cluster-specific decrease and specific protein

FIG 6. Discovery cohort, TDA cluster, and microcluster summary. A descriptive visual summary of the core
pathological endotypes and microclusters identified in the discovery asthma and healthy volunteer
population is shown. Group number refers to the TDA groups identified in Fig 1 with the corresponding per-
centage identifying the total proportion of the discovery population within a particular group. Five micro-
clusters referred to in Figs 2-5 and denoted as MC1 to MC5 are summarized in the black dotted lines
within their respective group/TDA network.
TABLE II. Pathological features of the discovery population stratified by TDA grouping
Mild-to-Moderate
Asthma/HealthyContinuum,
group 1 (n 5 77)
Reticular Basement
MembraneHigh,
group 2 (n 5 60)
Airway Smooth
MuscleHigh,
group 3 (n 5 36)
RemodelingLow,
group 4 (n 5 19) P value*
Total biopsy area (mm2) 1.62 (1.07) 2.12 (1.46)§ 1.49 (1.27) 1.36 (1.26) .0256
Remodeling parameters
Reticular basement membrane thickness (mm) 6.65 (4.14)�§ 12.83 (3.48)§ 9.65 (3.83) 6.99 (1.64)�§ <.0001
Epithelial area (%) 7.35 (5.98)k 10.47 (10.31)§ 5.83 (4.83) 14.87 (15.78)§ <.0001
ASM area (mm2) 0.24 (0.24)§k 0.16 (0.30)§ 0.51 (0.43) 0.06 (0.08)�§ <.0001
ASM area (%) 13.96 (16.79)§ 9.77 (13.52)§ 28.04 (17.77) 4.60 (6.73)§ <.0001
Glands (%) 0.00 (0.39) 0.00 (0.00) 0.00 (0.31) 0.00 (0.00) .0740
Chalkley count 3.78 (2.00) 4.80 (2.30) 4.00 (2.50) 4.15 (0.70) .0728
Tryptase-positive mast cells in ASM (cells/mm2) 2.59 (6.12) 4.05 (7.26) 6.20 (8.19) 0.00 (6.25) .0475
Lamina propria cells/mm2
Tryptase-positive mast cells 15.84 (15.96) 12.20 (17.66) 18.99 (28.00) 12.21 (14.93) .1482
Major basic protein–positive eosinophils 6.81 (18.52) 9.75 (10.64) 9.87 (17.78) 7.04 (15.58) .6008
Neutrophil elastase–positive neutrophils 9.55 (11.71) 9.04 (13.21) 14.21 (17.12) 8.05 (18.01) .1977
Tissue gene expression
TH2 gene expression score{ 20.33 (1.03) 20.29 (1.96) 21.20 (0.46) 21.17 (1.03) .0635
TH17 gene expression score{ 20.063 (0.95) 20.316 (1.04) 0.587 (4.23) 0.097 (2.21) .2184
FKBP51 gene expression{ 0.20 (0.52) 0.28 (0.41) 0.52 (0.31) 0.38 (0.32) .4473
All values not presented as means 6 SEMs are presented as median (IQRs). Values in boldface indicate statistical significance.
*Statistical analysis across all groups. Adjusted P values (P < .05) are denoted as follows: �versus 1; �versus 2; §versus 3; and kversus 4. Adjusted P values were obtained by using
Bonferroni correction. All tests are Kruskal-Wallis tests.
{Tissue gene expression analyses were only available in a subgroup of patients (see Fig E1).
J ALLERGY CLIN IMMUNOL
nnn 2018
10 SIDDIQUI ET AL
rather than gene expression markers of inflammatory disease,such as IL-17 and IL-22, in patients with TH17 asthma.
Finally, treatment effects might have contributed to TDA groupassignment, but in mitigation against this, TDA networks were
not generated by using GINA scores as an input function, andTDA groups showed clear differences in GINA treatment stepsboth within and between networks. Additionally, because ofpotential oversampling of patients with GINA steps 3 to 5 asthma
J ALLERGY CLIN IMMUNOL
VOLUME nnn, NUMBER nn
SIDDIQUI ET AL 11
compared with steroid-naive/low-dose inhaled steroid takingGINA step 1 to 2 asthma, future studies should comparepathological heterogeneity in both primary and secondary careasthma cohorts. Finally, although we were able to replicate broadtopological structures in severe asthma, the replication of micro-clusters will require novel analytic methods and should form thebasis of future research in this area.
In summary, we have used TDA to identify and visualizepathological disease clusters of asthma. Using this approach, weidentified numerous microclusters (masked by group-level anal-ysis) of disease that warrant further mechanistic evaluation andreplicated pathology phenotypes by using appropriate mathe-matic methods in an independent population with severe asthma.
We thank Ayasdi (Menlo Park, Calif) and Dr Devi Ramanan for access to
the Ayasdi software and SDK platforms for data analysis and Professors
Alexander Gorban (Leicester, Mathematics) and Professor Gunnar Carlsson
(Stanford, Mathematics) for their critique of the manuscript. We also thank
Fiona Symon for pathology counts performed within the Leicester cohort and
Ana Robles for pathology regions of interest identification within the
BOBCAT cohort.
Key messages
d TDA identified 4 pathological phenotypes (Mild-Moder-ate Asthma/HealthyContinuum, Reticular Basement Mem-braneHigh, Airway Smooth MuscleHigh, andRemodelingLow) of patients with asthma/healthy volun-teers, with numerous nested microclusters derived frombronchial biopsy specimens.
d Reciprocal TH2 and TH17 gene expression was demon-strated (1) across pathological phenotypes, (2) across thespectrum of asthma severity, and (3) in healthyvolunteers.
d Our methodology provides new insight into pathologicalheterogeneity in asthmatic patients and is applicable toother complex chronic diseases.
REFERENCES
1. Bousquet J, Mantzouranis E, Cruz AA, A€ıt-Khaled N, Baena-Cagnani CE,
Bleecker ER, et al. Uniform definition of asthma severity, control, and exacerba-
tions: document presented for the World Health Organization Consultation on Se-
vere Asthma. J Allergy Clin Immunol 2010;126:926-38.
2. Partridge MR, van der Molen T, Myrseth SE, Busse WW. Attitudes and actions of
asthma patients on regular maintenance therapy: the INSPIRE study. BMC Pulm
Med 2006;6:13.
3. Robinson D, Humbert M, Buhl R, Cruz AA, Inoue H, Korom S, Hanania NA, et al.
Revisiting type 2-high and type 2-low airway inflammation in asthma: current
knowledge and therapeutic implications. Clin Exp Allergy 2017;47:161-75.
4. Benayoun L, Druilhe A, Dombret MC, Aubier M, Pretolani M. Airway structural
alterations selectively associated with severe asthma. Am J Respir Crit Care Med
2003;167:1360-8.
5. Boucherat O, Boczkowski J, Jeannotte L, Delacourt C. Cellular and molecular
mechanisms of goblet cell metaplasia in the respiratory airways. Exp Lung Res
2013;39:207-16.
6. Siddiqui S, Sutcliffe A, Shikotra A, Woodman L, Doe C, McKenna S, et al.
Vascular remodelling is a feature of asthma and non-asthmatic eosinophilic bron-
chitis. J Allergy Clin Immunol 2007;120:813-9.
7. Siddiqui S, Hollins F, Saha S, Brightling CE. Inflammatory cell microlocalisation
and airway dysfunction: cause and effect? Eur Respir J 2007;30:1043-56.
8. Berair R, Brightling CE. Asthma therapy and its effect on airway remodelling.
Drugs 2014;74:1345-69.
9. Pretolani M, Dombret MC, Thabut G, Knap D, Hamidi F, Debray MP, et al. Reduc-
tion of airway smooth muscle mass by bronchial thermoplasty in patients with se-
vere asthma. Am J Respir Crit Care Med 2014;190:1452-4.
10. Choy DF, Hart KM, Borthwick LA, Shikotra A, Nagarkar DR, Siddiqui S, et al.
TH2 and TH17 inflammatory pathways are reciprocally regulated in asthma. Sci
Transl Med 2015;7:301ra129.
11. Lum PY, Singh G, Lehman A, Ishkanov T, Vejdemo-Johansson M, Alagappan M,
et al. Extracting insights from the shape of complex data using topology. Sci Rep
2013;3:1236.
12. Li L, Cheng WY, Glicksberg BS, Gottesman O, Tamler R, Chen R, et al. Identifi-
cation of type 2 diabetes subgroups through topological analysis of patient similar-
ity. Sci Transl Med 2015;7:311ra174.
13. Nielson JL, Paquette J, Liu AW, Guandique CF, Tovar CA, Inoue T, et al. Topolog-
ical data analysis for discovery in preclinical spinal cord injury and traumatic brain
injury. Nat Commun 2015;6:8581.
14. Sousa AR, Marshall RP, Warnock LC, Bolton S, Hastie A, Symon F, et al. Respon-
siveness to oral prednisolone in severe asthma is related to the degree of eosino-
philic airway inflammation. Clin Exp Allergy 2017;47:890-9.
15. Brightling CE, Bradding P, Symon FA, Holgate ST, Wardlaw AJ, Pavord ID. Mast-
cell infiltration of airway smooth muscle in asthma. N Engl J Med 2002;346:
1699-705.
16. Siddiqui S, Mistry V, Doe C, Roach K, Morgan A, Wardlaw A, et al. Airway hyper-
responsiveness is dissociated from airway wall structural remodeling. J Allergy
Clin Immunol 2008;122:335-41.
17. Shikotra A, Choy DF, Ohri CM, Doran E, Butler C, Hargadon B, et al. Increased
expression of immunoreactive thymic stromal lymphopoietin in patients with se-
vere asthma. J Allergy Clin Immunol 2012;129:104-11.
18. Butler CA, McQuaid S, Taggart CC, Weldon S, Carter R, Skibinski G, et al. Gluco-
corticoid receptor b and histone deacetylase 1 and 2 expression in the airways of
severe asthma. Thorax 2012;67:392-8.
19. Butler CA, McQuaid S, Taggart CC, Weldon S, Carter R, Skibinski G, et al. Increased
expression of bronchial epithelial transient receptor potential vanilloid 1 channels in
patients with severe asthma. J Allergy Clin Immunol 2014;133:704-12.e4.
20. Desai D, Newby C, Symon FA, Haldar P, Shah S, Gupta S, et al. Elevated sputum
interleukin 5 and submucosal eosinophilia in obese individuals with severe asthma.
Am J Respir Crit Care Med 2013;188:657-63.
21. Jia G, Erickson RW, Choy DF, Mosesova S, Wu LC, Solberg OD, et al. Broncho-
scopic exploratory research study of Biomarkers in Corticosteroid-refractory Asthma
(BOBCAT) Study Group. Periostin is a systemic biomarker of eosinophilic airway
inflammation in asthmatic patients. J Allergy Clin Immunol 2012;130:647-54.
22. BraddingP, Feather IH,HowarthPH,MuellerR,Roberts JA,BrittenK, et al. Interleukin
4 is localized to and released by human mast cells. J Exp Med 1992;176:1381-6.
23. Sullivan P, Stephens S, Ansari T, Costello J, Jeffery P. Variation in the measure-
ments of basement membrane thickness and inflammatory cell number in bronchial
biopsies. Eur Respir J 1998;12:811-5.
24. Miller PL, Meyer TW. Effects of tissue preparation on glomerular volume and
capillary structure in the rat. Lab Invest 1990;63:862-6.
25. Woodruff PG, Modrek B, Choy DF, Jia G, Abbas AR, Ellwanger A, et al. T-helper
type 2-driven inflammation defines major subphenotypes of asthma [published
erratum in Am J Respir Crit Care Med 2009;180:796]. Am J Respir Crit Care
Med 2009;180:388-95.
26. Choy DF, Modrek B, Abbas AR, Kummerfeld S, Clark HF, Wu LC, et al. Gene
expression patterns of Th2 inflammation and intercellular communication in asth-
matic airways. J Immunol 2011;186:1861-9.
27. Edelsbrunner H, Letscher D, Zomorodian A. Topological persistence and simplifi-
cation. Discrete Comput Geom 2002;28:511-33.
28. Zomorodian A, Carlsson G. Computing persistent homology. Discrete Comput
Geom 2005;33:249-74.
29. Bubenik P. Statistical topological data analysis using persistence landscapes.
J Machine Learn Res 2015;16:77-102.
30. Terese Fasy B, Lecci F, Rinaldo R, Wasserman L, Balakrishnan S, Singh A. Con-
fidence sets for persistence diagrams. Ann Stat 2014;42:2301-39.
31. JavaPex: a research software package for persistent (co)homology, Proceedings of
ICMS 2014, Lecture Notes in Computer Science 8592, 129–136, 2014. Available
at: http://appliedtopology.github.io/javaplex/. Accessed November 2016.
32. Kelly MM, King EM, Rider CF, Gwozd C, Holden NS, Eddleston J, et al. Cortico-
steroid-induced gene expression in allergen-challenged asthmatic subjects taking
inhaled budesonide. Br J Pharmacol 2012;165:1737-47.
33. Huang YJ, Nariya S, Harris JM, Lynch SV, Choy DF, Arron JR, et al. The airway
microbiome in patients with severe asthma: associations with disease features and
severity. J Allergy Clin Immunol 2015;136:874-84.
34. Wilson SJ, Ward JA, Sousa AR, Corfield J, Bansal AT, De Meulder B, et al. Severe
asthma exists despite suppressed tissue inflammation: findings of the U-BIOPRED
study. Eur Respir J 2016;48:1307-19.

J ALLERGY CLIN IMMUNOL
nnn 2018
12 SIDDIQUI ET AL
35. Hubers AJ, Heideman DA, Burgers SA, Herder GJ, Sterk PJ, Rhodius RJ, et al.
DNA hypermethylation analysis in sputum for the diagnosis of lung cancer:
training validation set approach. Br J Cancer 2015;112:1105-13.
36. Hong Y, Ho KS, Eu KW, Cheah PY. A susceptibility gene set for early onset colo-
rectal cancer that integrates diverse signalling pathways: implication for tumori-
genesis. Clin Cancer Res 2007;13:1107-14.
37. Notterman DA, Alon R, Sierk AJ, Levine AJ. Transcriptional gene expression pro-
files of colorectal adenoma, adenocarcinoma, and normal tissue examined by oligo-
nucleotide arrays. Cancer Res 2001;61:3124-30.
38. Kn€obel M, O’Toole EA, Smith FJ. Keratins and skin disease. Cell Tissue Res 2015;
360:583-9.
39. Burgess JK, Mauad T, Tjin G, Karlsson JC, Westergren-Thorsson G. The extracel-
lular matrix—the under-recognized element in lung disease? J Pathol 2016;240:
397-409.
40. Davies DE, Polosa R, Puddicombe SM, Richter A, Holgate ST. The epidermal
growth factor receptor and its ligand family: their potential role in repair and re-
modelling in asthma. Allergy 1999;54:771-83.
41. Stinson SE, Amrani Y, Brightling CE. D prostanoid receptor 2 (chemoattractant
receptor-homologous molecule expressed on TH2 cells) protein expression in asth-
matic patients and its effects on bronchial epithelial cells. J Allergy Clin Immunol
2015;135:395-406.
42. Busse WW, Holgate S, Kerwin E, Chon Y, Feng J, Lin J, et al. Randomized, double
blind, placebo-controlled study of brodalumab, a human anti-IL-17 receptor mono-
clonal antibody, in moderate to severe asthma. Am J Respir Crit Care Med 2013;
188:1294-302.
43. Gandhi NA, Bennett BL, Graham NM, Pirozzi G, Stahl N, Yancopoulos GD. Tar-
geting key proximal drivers of type 2 inflammation in disease. Nat Rev Drug Dis-
cov 2016;15:35-50.
44. Wright DB, Trian T, Siddiqui S, Pascoe CD, Johnson JR, Dekkers BG, et al. Pheno-
type modulation of airway smooth muscle in asthma. Pulm Pharmacol Ther 2013;
26:42-9.
45. Beunk L, Verwoerd A, van Overveld FJ, Rijkers GT. Role of mast cells in mucosal
diseases: current concepts and strategies for treatment. Expert Rev Clin Immunol
2013;9:53-63.