airport departure flow management system - … periods in excess of the runway ... develop, and...
TRANSCRIPT

1
Airport Departure Flow
Management System
Final Presentation
SYST 798 / OR 680
May 7, 2010
Project Sponsor: Dr. Lance Sherry, CATSR
Course Professor: Dr. Kathryn Laskey
Team AirportDFM: Douglas Disinger (MSSE)
Hassan Hameed (MSSE)
Lily Tran (MSSE)
Kenneth Tsang (MSOR)
Stirling (Chip) West (MSSE)
2
Agenda
• Introduction
• Technical Approach
• Architecture
• Modeling & Simulation
• Evaluation & Recommendations
• Future Work & Acknowledgements

3
IntroductionProblem Definition (1/2)
• Problem Statement
– All major U.S. airports are scheduled with departures at peak
travel periods in excess of the runway departure capacity.
– As a consequence of over-scheduling, and the procedures for
push-back, a free-for-all occurs amongst the airlines to
secure a slot in the long taxiway departure queues that occur
every day.
– These queues result in excess fuel burn and emissions, and
create unnecessary taxiway congestion.
– Airlines are also unable to rearrange queue positions / slots
in the event of delay or disruption.
4
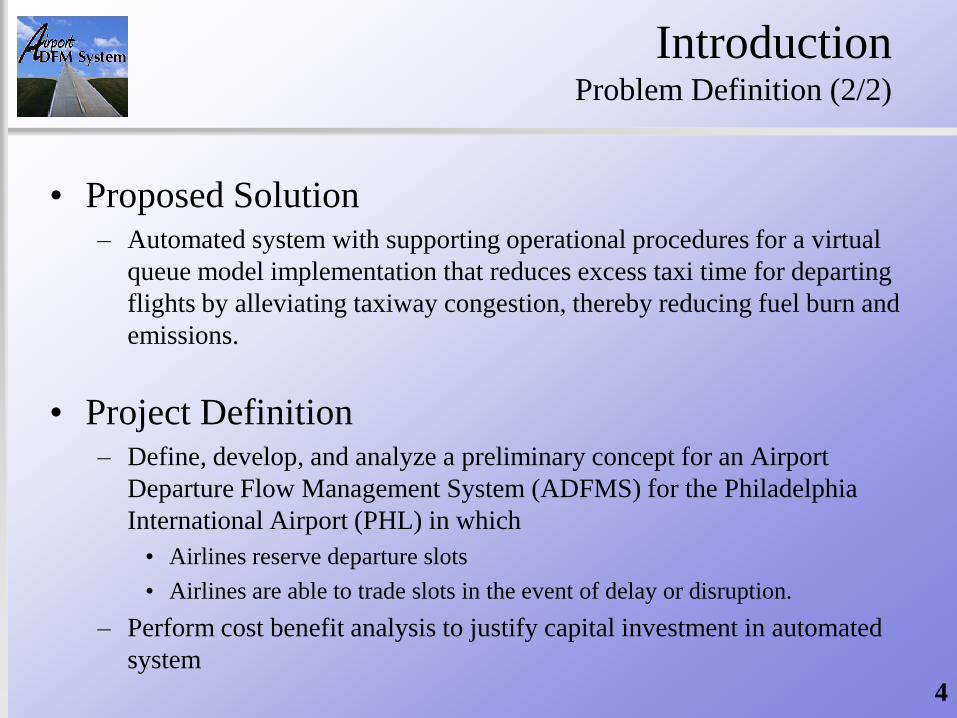
IntroductionProblem Definition (2/2)
• Proposed Solution– Automated system with supporting operational procedures for a virtual
queue model implementation that reduces excess taxi time for departing
flights by alleviating taxiway congestion, thereby reducing fuel burn and
emissions.
• Project Definition– Define, develop, and analyze a preliminary concept for an Airport
Departure Flow Management System (ADFMS) for the Philadelphia
International Airport (PHL) in which
• Airlines reserve departure slots
• Airlines are able to trade slots in the event of delay or disruption.
– Perform cost benefit analysis to justify capital investment in automated
system
5
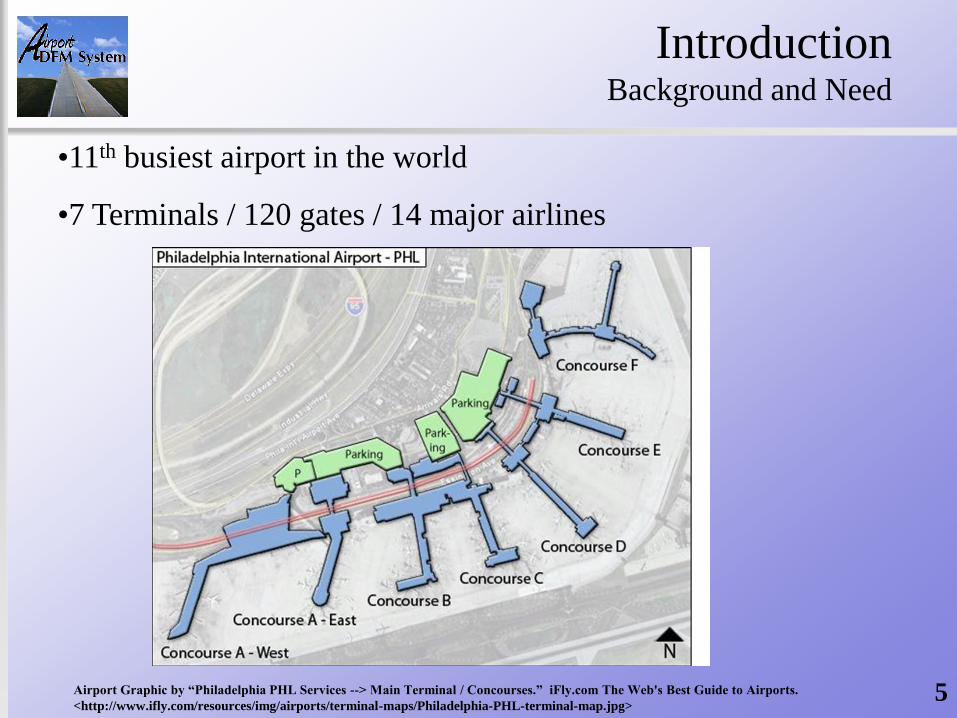
IntroductionBackground and Need
•11th busiest airport in the world
•7 Terminals / 120 gates / 14 major airlines
Airport Graphic by “Philadelphia PHL Services --> Main Terminal / Concourses.” iFly.com The Web's Best Guide to Airports.
<http://www.ifly.com/resources/img/airports/terminal-maps/Philadelphia-PHL-terminal-map.jpg>

27R
27L
"Philadelphia International Airport - Google Maps." Google Maps. Google, n.d. Web. 13 Feb. 2010

7
IntroductionObjectives, Deliverables and Scope
• Project Objectives– Preliminary design and requirements
– Develop a model
– Perform simulation
– Conduct cost-benefit analysis
• Project Deliverables – accepted by Sponsor (Dr. Sherry) System Requirements Document – 25 February 2010
Concept of Operations (CONOPS) Document – 25 February 2010
Scenario Analysis Models and Document – 28 April 2010
Business Case Analysis (Cost-Benefit) – 28 April 2010
• Scope– Philadelphia International Airport (PHL)
– Ground operations and queuing procedures from push-back to departure
• Out of Scope– Impact of Arrivals, Ground Delay Programs, Weather, Volcanoes, General
Aviation Aircraft

8
IntroductionStakeholders
• Stakeholders
– Airlines• Airline Operating Centers (AOCs)
• Station Managers
• Pilots
– PHL Airport Authority• PHL Ramp Control
• Information Technology (IT) Staff
– Federal Aviation Administration (FAA)• PHL Air Traffic Control Tower (ATCT)
• PHL Terminal Radar Approach Control (TRACON)
– Passengers

9
Agenda
• Introduction
• Technical Approach
• Architecture
• Modeling & Simulation
• Evaluation & Recommendations
• Future Work & Acknowledgements
10
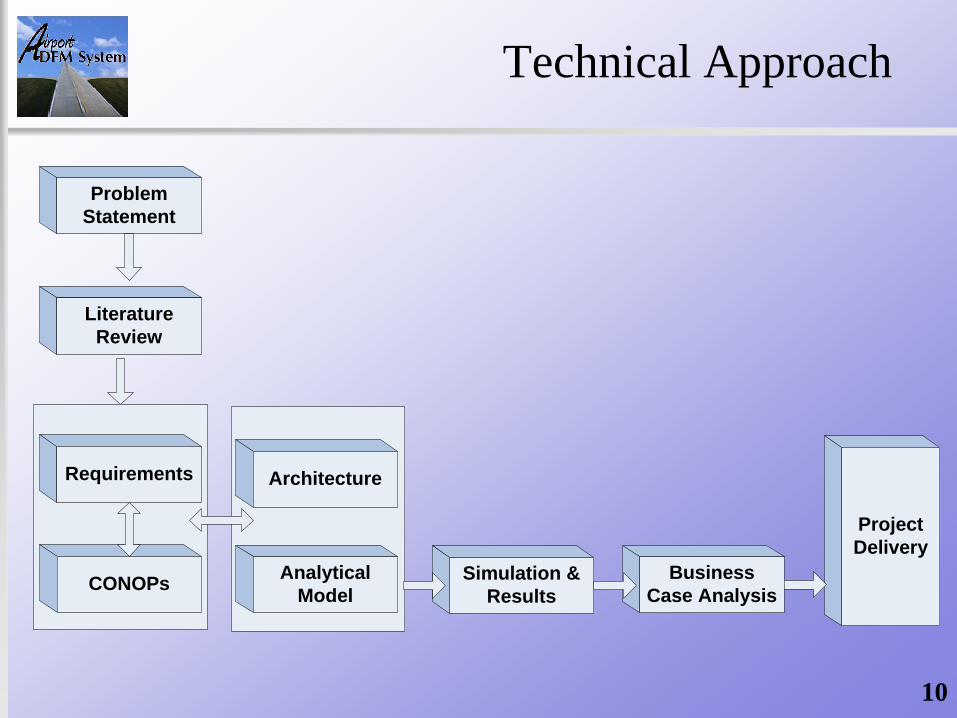
Technical Approach
CONOPs
Project
Delivery
Requirements Architecture
Analytical
ModelSimulation &
Results
Business
Case Analysis
Problem
Statement
Literature
Review

11
Technical ApproachAssumptions & Limitations
• Project Assumptions– Primary cause of departure delays is over-scheduling
– Airlines will accept a slot controlled departure system which limits the number of flights that are scheduled for departure each hour
– Fair weather conditions will give a reasonable approximation for cost-benefits
• Model & Simulation Limitations– Data sources do not show the cause of delay (e.g. mechanical,
congestion, weather etc.)
– Data sources do not show the departure gate
– Model uses one runway for departure (no runway reconfiguration)
– Model does not de-conflict taxiing aircraft within departure queue (e.g. no assignment of expected push-back times)
– De-conflicted departures are manually created, become inputs to the simulation

12
Agenda
• Introduction
• Technical Approach
• Architecture
• Modeling & Simulation
• Evaluation & Recommendations
• Future Work & Acknowledgements
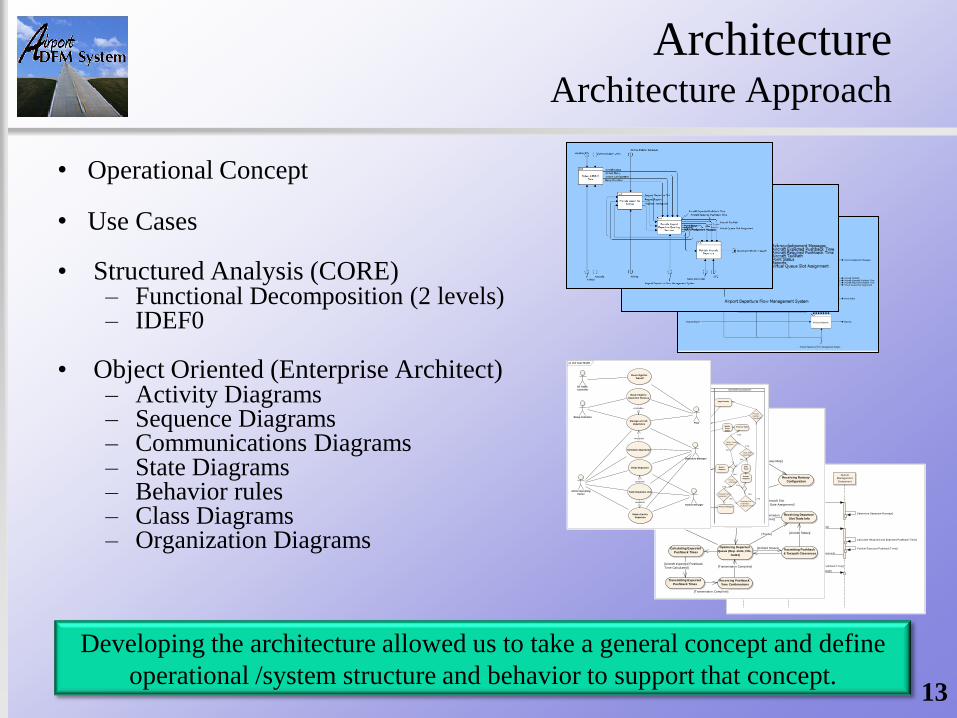
• Operational Concept
• Use Cases
• Structured Analysis (CORE)– Functional Decomposition (2 levels)– IDEF0
• Object Oriented (Enterprise Architect)– Activity Diagrams– Sequence Diagrams– Communications Diagrams– State Diagrams– Behavior rules– Class Diagrams– Organization Diagrams
13
Architecture Architecture Approach
Developing the architecture allowed us to take a general concept and define
operational /system structure and behavior to support that concept.
sd Departure with no trade
:Station Manager
:Scheduling
Component
:Queue
Management
Component
Publish Departure Slots()
Store depature slots()
Determine Departure Runway()
Assign Gates to Flights()
Determine Taxipath()
Calculate Required and Expected Pushback Time()
Publish Expected Pushback Time()
Review Expected Departures()
Confirm Scheduled Pushback Time()
Send Pushback Message()
stm Queue Management Component
Idle
Receiv ing Runway
ConfigurationReceiv ing Gate
Assignments
Receiv ing Departure
Slot Assignments
Calculating Taxipaths
and Required
Pushback Times
Optimizing Departure
Queue (Dep. slots, Flts,
Gates)
Receiv ing Departure
Slot Trade Info
Trasmitting Pushback
& Taxipath Clearances
Calculating Expected
Pushback Times
Transmitting Expected
Pushback Times
Receiv ing Pushback
Time Confirmations
[Airl ine uploading
gate information]
[Scheduler
uploading
departure slots]
[Obtain Runway Map]
[Trade]
[Aircraft Schedule, Aircraft Slot
Assignment, Aircraft Gate Assignment]
[Aircraft Leave Queue]
[Transmission
Complete]
[Aircraft Status]
[Aircraft expected Pushback
Time Calculated]
[Transmission Complete]
[Transmission Complete]
[Airfield Status]
act Near Term Scheduling
Trade Brokering ComponentQueue Management ComponentStation Manager NodeScheduling Component
Publish Departure
Slots Store departure
slots
Assign Gates to
Flights
Determine
Departure Runway
Ready for
Departure?
Desire Earlier
Departure?
Determine
Taxipath
Request Later
Departure
Confirm
Scheduled
Pushback Time
Points
Available?
Request Earlier
Departure
Calculate Required
and Expected
Pushback Time
Request time >
Sechedule
Pushback Time?
Penalty
Number >
Threshold?
Apply Penalty
Reschedule Flight
Offer
Trade
Accept
Request
Reject
Request
Trade Offer
Accepted?
Publish Expected
Pushback TimeRev iew Expected
Departures
Trade for later
slot attempted?
Within Trade
Window?
Update
Point
Totals
Update
Departure
Slots
Send Pushback
Message
Process Request
Process Trade
Request Early
Departure?
[No]
[No]
[Yes]
[No]
[Yes]
[Yes]
[No]
[Yes]
[Yes]
[No]
[Yes]
[No]
[Yes]
[Yes]
[No]
[No]
uc Use Case Model
Airline Operating
Center
Station Manager
Ramp Controller
PilotManage aircraft
departures
Delay Departure
Obtain Earlier
Departure
Route Flight to
Departure Runway
Trade Departure slot
Air Traffic
Controller
Clear Flight for
Takeoff
Schedule departures
Departure Manager
«extend»
«extend»
«include»
«include»

Architecture Operational Concept
14
Ramp
Control
AOCs(US Airways,
United)
• Input schedule,
earliest departure
times and latest
departure times
• Relay current status and
projected delays
PHL
Local Area Network
Wide Area
Network
Station Manager
• Trade Departure Slots
• Coordinate pushback
• Clear airplanes for
pushback from the
gates
• Route planes to
takeoff runway
• Monitor departure
slots
• Clear airplanes for
takeoff
System
Boundary
• Assign aircraft to departure slots
• Manage departure queue
• Facilitate departure slot trading ASDE-X
• Provide airplane
location

Architecture Structured Analysis (Functional Decomposition)
15
Assign Aircraft to
Departure Slots
Provide Airport
Departure
Queueing Svcs
Facilitate Trading
of Aircraft
Departure Slots
Manage Departure
QueueProduce
Reports
Asses for
Departure Slot
Accept Departure
Slots & Send
Acknowledgment
Calculate Aircraft
Taxipath
Calculate Aircraft
Pushback Time
Match Departure
Slots to Requests
Assess for
Trading
Track
Points
Asses Aircraft
In Queue
Adjust Pushback
Time
Adjust Queuing
Slot
Approve
Trade
Assess
Request
Generate
Reports

Architecture Object-Oriented (System Activity Diagram)
Flight Management Trade Brokering
Queue
Management
Scheduling
16
act Near Term Scheduling
Trade Brokering ComponentQueue Management ComponentStation Manager NodeScheduling Component
Publish Departure
Slots Store departure
slots
Assign Gates to
Flights
Determine
Departure Runway
Ready for
Departure?
Desire Earl ier
Departure?
Determine
Taxipath
Request Later
Departure
Confirm
Scheduled
Pushback Time
Points
Available?
Request Earlier
Departure
Calculate Required
and Expected
Pushback Time
Request time >
Sechedule
Pushback Time?
Penalty
Number >
Threshold?
Apply Penalty
Reschedule Flight
Offer
Trade
Accept
Request
Reject
Request
Trade Offer
Accepted?
Publish Expected
Pushback TimeRev iew Expected
Departures
Trade for later
slot attempted?
Within Trade
Window?
Update
Point
Totals
Update
Departure
Slots
Send Pushback
Message
Process Request
Process Trade
Request Early
Departure?
[No]
[No]
[Yes]
[No]
[Yes]
[Yes]
[No]
[Yes]
[Yes]
[No]
[Yes]
[No]
[Yes]
[Yes]
[No]
[No]

Architecture System Components (1 of 3)
Scheduling Module: levels demand across capacity (10 departures per 15-minute
window)
08:00 08:35
08:16 - 08:18
B
08:04 - 08:06
D
08:21 - 08:22
E
08:00
Takeoff Window
Start
08:15
Takeoff Window
Start
08:07 - 08:09
F
08:28 - 08:30
J
08:12 - 08:13
I
08:10 - 08:12
H
08:00 - 08:01
A
08:15 - 08:30
0815 - 0830 Take-Off Window
08:31 - 08:33
B
08:24 - 08:25
G
08:00 - 08:15
0800 – 0815 Take-Off Window
08:03 - 08:04
C
08:13 - 08:15
J
08:27 - 08:28
I
08:19 - 08:21
D
08:06 - 08:07
E
08:30 - 08:31
A
08:22 - 08:24
F
08:09 - 08:10
G
08:30
Takeoff Window
Start
08:18 - 08:19
C
08:15 - 08:16
A
08:01 - 08:03
B
08:25 - 08:27
H
17

Architecture System Components (2 of 3)
Queuing Module: divides departure queue into virtual and physical components;
minimizes excess taxi time by reducing conflicts on PHL surface
18

Architecture System Components (3 of 3)
Trade Brokering Module: uses a point system to facilitate departure slot trading amongst airlines within virtual queue
Point system concepts
• An earlier slot is an asset (more valuable than a later slot) – buy/sell earlier slot
• Number of points required = Number of slots earlier
• If I want to take off later, I sell my earlier slot
• Airline departure slots “missed” are assessed penalty if ADFMS not notified early enough
• ADFMS allows „falling back‟ to later departure slot due to an unforeseen circumstances
• Points awarded periodically / unused points expire periodically
• Point exchange first-in first out (FIFO)
• Unfilled departure slots can be acquired without exchanging points
• No buying when points < 0
19

Architecture Trade Brokering Concept Example
Original
Departure Slot
(Blue)
8:00am 9:00am
Available for
Trade Slot
(Red)
12 minutes (8 slots)Trade Window
Processing Time
Recalculated
Expected
Pushback
(Blue)
Scheduled
Pushbacks
Expected
Pushbacks
Trading for an earlier departure slot: the processing for the change needs to occur prior to the recalculated expected pushback
to facilitate the trade and maximize capacity (maintain the aircraft departure rate) while
continuing to reduce conflicts on the PHL surface areas
20

ArchitectureTrade Demonstration
Airline 1
Age Pts
0 wk 10
1 wk 10
2 wk 10
3 wk 10
Airline 3
Age Pts
0 wk 10
1 wk 10
2 wk 10
3 wk 10
Airline 2
Age Pts
0 wk 10
1 wk 10
2 wk 10
3 wk 10
Broker
Airline 1 Airline 2 Airline 3
B-5
S-5
B-10
S-10
Sell 5 slots
Sell 10 slots
Buy 5 slots
Buy 10 slots
B-5 S-5
• Airline 1 has a flight
ready to leave early.
• Airline 2 owns an earlier
slot and decides to sell it
to Airline 1
• Points are updated
5
15
21
22
Agenda
• Introduction
• Technical Approach
• Architecture
• Modeling & Simulation
• Evaluation & Recommendations
• Future Work & Acknowledgements

Takeoff rate stagnates but taxi time grows in saturation area
15 Minute Window Throughput and Taxi Time By
Queue Size
0
2
4
6
8
10
12
14
0 5 10 15 20 25 30 35
Queue Size
Nu
mb
er
of
Take
off
s
0
10
20
30
40
50
60
70
Taxi
Tim
e (
min
s)
Takeoffs vs QueueSizeTaxi Time vs QueueSizeLinear (Taxi Time vsQueue Size)Poly. (Takeoffs vsQueue Size)
July 2007
Average
Queue
Size
Average
Taxi
Time
(mins)
Overall 16 27.73
Peak
Time20 32.83
Non-
Peak
Time
10 20.92
Modeling & Simulation Observations from Dataset
Saturation Area
23
15 Minute Window Takeoff Rate and
Taxi Time by Queue Size

24
Modeling & Simulation Apply Queue Management to Avoid Congestion
• Example for Ramp Control Spot 2:
• Rules:
– A flight from Control Spot 2 should not pushback exactly two minutes after a flight from Control Spot 3.
– A flight from Control Spot 2 should not pushback at the same time as a flight from Control Spot 11.
Time
(mins)
T=0 T=1 T=2 T=3 T=4 T=5 …… T=24 T=25 T=26
Step Step 1 Step 2 Step 3 Step 4 Step 5 Step 6 …… Step 25 Step 26 Step 27
Flight 1 CS 2 K5 K6 Cross
Runway…… S1
S1-27L
turn 27L
Flight 2 CS 3 Apron Apron-
K5 turn K5 K6
Cross
Runway…… S1
S1-27L
turn 27L
Flight 3 CS 11 H H-E turn Eg …… S1 S1-s7L
turn 27L
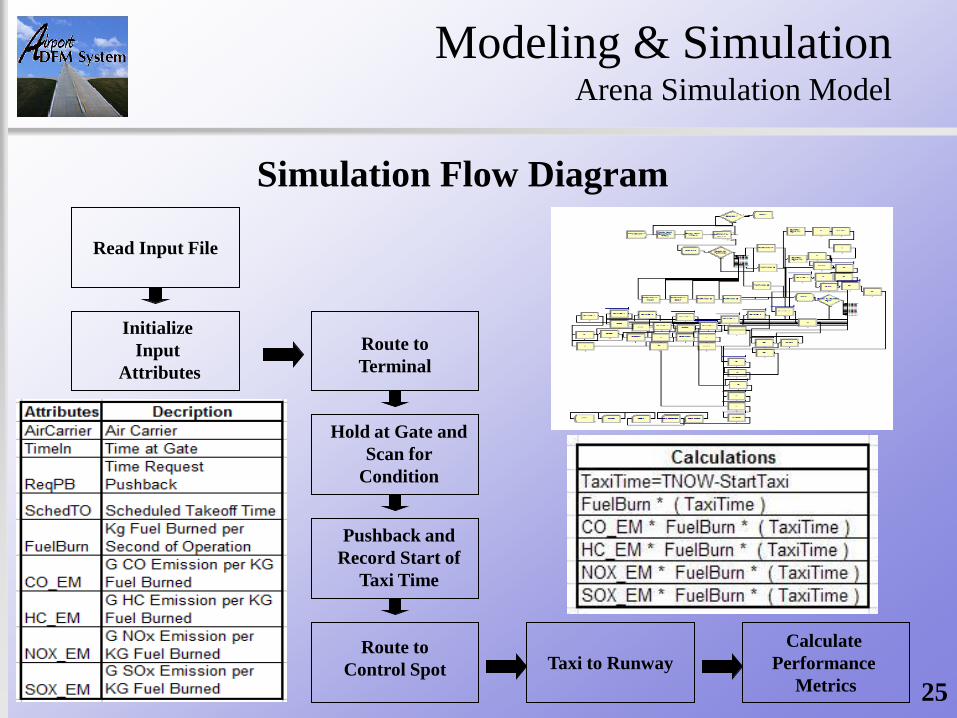
Modeling & Simulation Arena Simulation Model
Simulation Flow Diagram
Read Input File
Calculate
Performance
Metrics
Route to
Terminal
Hold at Gate and
Scan for
Condition
Pushback and
Record Start of
Taxi Time
Route to
Control Spot Taxi to Runway
Initialize
Input
Attributes
25

26
Modeling & Simulation Parameters / Taxi Times
• At demand = capacity [Airport Departure Rate (ADR) of one (1) take-off every 1.5 minutes]
– A: FCFS Baseline – 10 aircraft pushback each 15 minute increment
• Most closely models actual taxi-times
– B: FCFS Improvement – 5 aircraft pushback per 7.5 minute increment
– C: ADFMS – 1 aircraft departure per 1.5 minute increment
• Effective pushback is 1 aircraft pushback per 1.5 minute increment
– X: FCFS Worst case – 20 aircraft pushback each 30 minute increment
• At demand > capacity [ADR of one (1) take-off every 1.5 minutes]
– Y: Simulate 42 aircraft pushback each 60 minute increment
– Z: Simulate 44 aircraft pushback each 60 minute increment
• Maximum for Arena prior to exceeding maximum of 150 concurrent events

27
Modeling & SimulationConflict Reduction
• Conflicts decrease and congestion gets lighter as less
flights pushback simultaneously
Segment
FCFS
with Rate
of 11 per
15
Minutes
FCFS
with Rate
of 21 per
30
Minutes
FCFS
with Rate
of 20 per
30
Minutes
FCFS
with Rate
of 10 per
15
Minutes
FCFS
with Rate
of 5 per
7.5
Minutes
With
Departure
Flow
Managem
ent
Control Spot 3 Y Y N N N N
Control Spot 6 Y Y Y N N N
Control Spot 7 Y Y Y Y N N
Control Spot 8 Y Y Y Y N N
Control Spot 9 Y Y Y Y N N
Control Spot 10 Y Y Y Y Y N
Control Spot 11 Y Y Y Y N N
Intersection Q Y N N N N N
Intersection TA Y N N N N N
Intersection ED Y Y Y N N N
Intersection EG Y Y Y Y N N
Intersection K3A Y Y Y Y Y N
Intersection NB Y Y Y Y N N
Intersection ND Y Y Y Y Y N
Intersection NE Y Y Y Y Y Y
Intersection S1 Y Y Y Y Y Y
27L Runway Y Y Y Y Y Y
Conflicts Experienced (Y=Yes, N=No)

Modeling & SimulationResults
• By leveling demand (departure slot scheduling) and reducing
conflicts (queue management), ADFMS reduces the mean taxi
time and mean fuel burn per flight
• ADFMS also reduces std deviation
• Reductions can be valued in $$$$$
Mean Fuel Burn per Flight by Model
0.0
20.0
40.0
60.0
80.0
100.0
120.0
140.0
160.0
180.0
200.0
FCFS 11
per 15
FCFS 21
per 30
FCFS 20
per 30
Baseline:
FCFS 10
per 15
FCFS 5 per
7.5
DFM
Model
Fue
l Bu
rn (
gal)
Over Capacity At Capacity
Over Capacity At Capacity
Mean Taxi Time and Std Dev by Model
0.0
10.0
20.0
30.0
40.0
50.0
60.0
70.0
80.0
90.0
FCFS 11
per 15
FCFS 21
per 30
FCFS 20
per 30
FCFS 10
per 15
FCFS 5
per 7.5
ADFMS
Model
Mean
Taxi
Tim
e (
min
s)
0.0
2.0
4.0
6.0
8.0
10.0
12.0
14.0
16.0
18.0
20.0
Std
Dev (
min
s)
Mean TaxiTime
StdevMean Taxi Time & Std Dev by Model
Mean Fuel Burn per Flight by Model
28

29
Modeling & SimulationResults
• By reducing taxi time, ADFMS also reduces mean emissions per
flight
Over Capacity At Capacity0
1
2
3
4
5
6
7
Baseline: FCFS 10 per 15 ADFMS
Emis
sion
s (K
ilogr
ams)
Model
Mean Emissions Reduction per Flight Using ADFMS
Reduction
SOx Emissions (Kg)
NOx Emissions (Kg)
HC Emissions (Kg)
CO2 Emissions (Kg)
22%

30
Agenda
• Introduction
• Technical Approach
• Architecture
• Modeling & Simulation
• Evaluation & Recommendations
• Future Work & Acknowledgements

Return Rate 8.00%
Year
Fuel Burn
Reduction
ADFMS
Annual
O&M Costs
Capital
Expenditures Net Savings
Net Savings
(NPV) at Return
Rate
Cumulative Net
Savings
0 $5000 -$5000 -$5000 -$5000
1 $5160 $2000 $3160 $2709 -$2291
2 $5631 $2000 $3631 $2882 $591
3 $6021 $2000 $4021 $2956 $3547
4 $6285 $2000 $4285 $2916 $6463
5 $6480 $2000 $4480 $2823 $9286
6 $6728 $2000 $4728 $2759 $12045
7 $6947 $2000 $4947 $2673 $14718
8 $7137 $2000 $5137 $2570 $17288
9 $7267 $2000 $5267 $2440 $19728
10 $7384 $2000 $5384 $2309 $22037
Total: $22037
Evaluation & Recommendations Cost Benefit Analysis
• Assuming a $5 million investment with $2 million annual operating costs over a 10 year system life cycle, implementing ADFMS would:
– Realize a Net Present Value to stakeholders of $22 million
– Pay off in the second year of operation
31
All numbers in thousands (000’s)

Evaluation & Recommendations Investment Scenarios
Investment
scenarios Pros Cons
FAA • Unbiased arbitrator for perceived
fairness of departure slot
scheduling and queue management
• FAA avoids surface management
issues: core competency is National
Airspace System (NAS); avoid
liability issues
Airlines • Realize greatest dollar value to
successful implementation to
departure flow management
• Hypercompetitive behavior:
inherently unable to cooperate
without arbitrator
PHL
Airport
Authority
• Surface areas are traditionally
managed by local airport
authorities
• Departure queue delays are
directly attributed to PHL, not
individual airlines: would improve
image/reputation of PHL
• As a US Airways hub, PHL AA could
be perceived as biased from the
perspective of other airlines
• Require investment recoupment from
stakeholders (Passenger Facility
Charge (PFC) option)
32

33
Evaluation & Recommendations Recommendation
• Implementation of ADFMS at PHL will:
– Save airlines millions of dollars via reduced fuel consumption
– Reduce emissions into the environment
– Improve passenger satisfaction with airlines and PHL
– Enable trading of departure slots amongst airlines
• Capital investment by PHL Airport Authority is best approach
– Surface management is a local airport authority issue
– Unbiased arbitrator amongst hypercompetitive airlines
– Can levy fair recoupment fees from airlines and/or passengers
34
Agenda
• Introduction
• Technical Approach
• Architecture
• Modeling & Simulation
• Evaluation & Recommendations
• Future Work & Acknowledgements
35
Future Work & AcknowledgementsFuture Work
• Simulation of Departure Slot Assignment function
• Simulation of the Trade Brokering function
• Continued analysis of PHL for out-of-scope constraints
– Alternate runway configurations
– Effects of weather, arrivals, GDPs, etc.
36
Future Work & AcknowledgementsAcknowledgements
• Guidance and support of Dr. Lance Sherry, GMU Center for Air Transportation System Research (CATSR)
• Continuous assessment and guidance from Dr. Laskey, Course Professor
• Wealth of information readily available on World-Wide Web
Airliners.net RITA/BTS DSpace@MIT
AirNav.com Eurocontrol.int CATSR.ite.gmu
iFly.com FAA.gov
LiveATC.net PHL.org
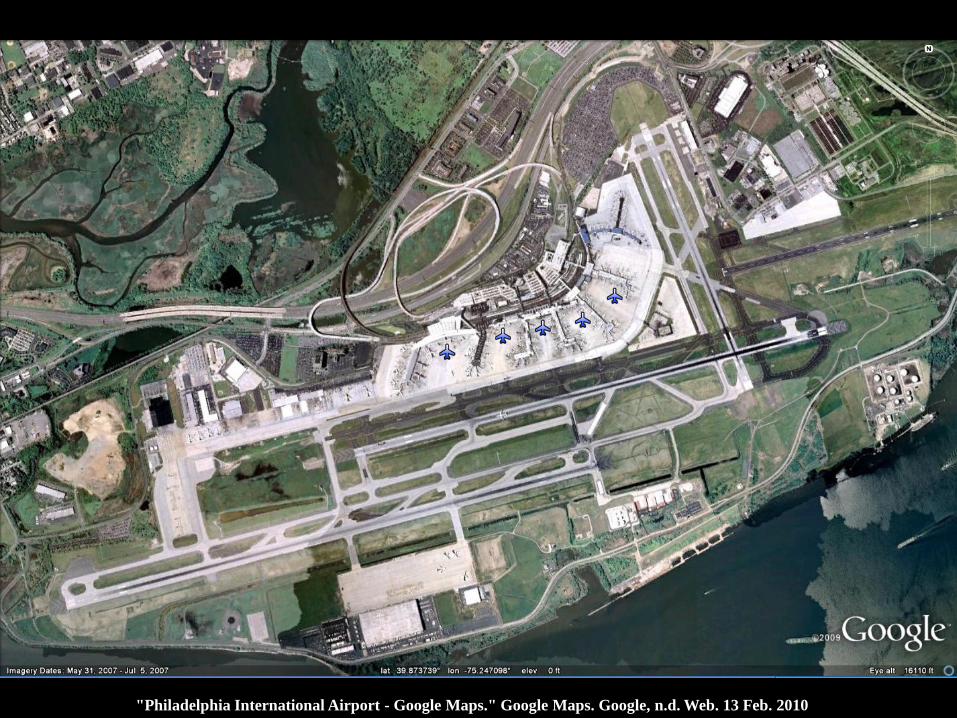
37"Philadelphia International Airport - Google Maps." Google Maps. Google, n.d. Web. 13 Feb. 2010

38
Questions
39
Backups
Backup Slides

Evaluation & Recommendations Cost Benefit Analysis
Actual Taxi Time
per day for PHL
(Peak Day & Non-
Peak Day)
ADFMS Taxi Time
(Mean + Std Dev)
Investment Model
(Cash Flows)
Cost to Implement
(Year 0 &
Years 1 – 20)
Capital
Expenditure
Cost to Operate
(Years 1 through
20)
ADFMS Taxi Time
Reduction
(Mean + Std Dev)
Fuel Savings
(gallons) per
aircraft per day
Reduced Total
Fuel Costs (per
year)
Estimated Fuel
Cost ($/gallon) per
year
Estimated ADFMS
Taxi Time per day
for PHL (Peak Day
& Non-Peak Day)
Status Quo Taxi
Time (Mean + Std
Dev)
Fuel Burn per day
(while Taxi)
(No ADFMS)
Fuel Burn per day
(while Taxi)
(ADFMS)
Estimated Total
Fuel Cost per year
(no ADFMS)
Estijmated Total
Fuel Cost per year
(ADFMS)
Demand = ADR
Sensitivity on Cost to
Implement
Using Fuel Forecast
Net Present Value
Demand > ADR: No analysis
(due to ADFMS Scheduling Module;
slot management: Demand = Capacity)
IT
costs
Personnel
costs
Financing
costs
FCFS
(A, B, X)
ADFMS
(C)
40

Architecture Object-Orientation (Operational Activity Diagram)
41
act Manage aircraft departures
Ramp contoller PilotStation ManagerAirline Operating Center Departure Manager
Request Departure
Slots
Assign departure slots
Manage long term flight
planAssign gate to flight
Detemine scheduled
pushback times
Determine
expected
pushback timeClear flight from gate
Pushback from gate
Clear flight to taxipath
Taxi to departure
runway
Receiv e takeoff
clearance from ATC
Ready for
departure?
Request later
departure slotProcess delay
request
[No]
[Yes]

BackupsAirline Points
Notes:
• System needs to appear fair
• Companies can trade between their own flights without affecting their point totals.
• Equal distribution– Companies with a lot of points per flight (e.g. 9e) tend to become buyers as they will have surplus points
– Companies with lower points per flight (e.g. US) may tend to trade within their own schedule at least for buys
• Varying points by airport use– Companies with lower points (e.g. 9E – 6 points) have a difficult time initiating trading until they can sell some slots.
– Companies with a lot of points (e.g. US – 188 points) tend to become buyers and can also trade within their own schedule.
% of Flights Points % of Gates Points
9E 40 1.6% 6 2.0% 8
AA 40 5.9% 24 5.9% 24
CO 40 2.5% 10 2.0% 8
DL 40 3.9% 15 3.9% 15
OH 40 2.2% 9 2.6% 10
FL 40 3.1% 12 2.7% 11
NW 40 4.3% 17 4.3% 17
UA 40 5.6% 22 5.6% 22
US 40 46.9% 188 48.0% 192
WN 40 24.0% 96 23.0% 92
Total 400 100.0% 400 100.0% 400
Based on % of scheduled
Flights
Based on % of gatesAirline Equal
Distribution
42

43
Point System Overview
• An earlier slot is an asset (more valuable than a later slot) – buy/sell earlier slot
• If I want to take off early, I buy an earlier slot (#slots earlier = # points)– The seller earns points from buyer
– Trade request to sell (earlier) slot must be made in Extended Virtual Queue (>schedule pushback time)
• If I want to take off later, I sell my earlier slot– The buyer spends points to get earlier slot. Buyer must be willing & “able.”
– Able = time available > time request
08:00 08:35
08:16 - 08:18
B
08:04 - 08:06
D
08:21 - 08:22
E
08:00
Takeoff Window
Start
08:15
Takeoff Window
Start
08:07 - 08:09
F
08:28 - 08:30
J
08:12 - 08:13
I
08:10 - 08:12
H
08:00 - 08:01
A
08:15 - 08:30
0815 - 0830 Take-Off Window
08:31 - 08:33
B
08:24 - 08:25
G
08:00 - 08:15
0800 – 0815 Take-Off Window
08:03 - 08:04
C
08:13 - 08:15
J
08:27 - 08:28
I
08:19 - 08:21
D
08:06 - 08:07
E
08:30 - 08:31
A
08:22 - 08:24
F
08:09 - 08:10
G
08:30
Takeoff Window
Start
08:18 - 08:19
C
08:15 - 08:16
A
08:01 - 08:03
B
08:25 - 08:27
H

44
Point System Overview
• Airline departure slots “missed” are assessed penalty if ADFMS not notified early enough
– Notification needs to occur is prior to scheduled push-back time
– Penalties suspended until threshold exceeded
• ADFMS allows „falling back‟ to later departure slot due to an unforeseen circumstances
– Bump up/ compression by subsequent flights in queue to ensure queue efficiency
• Points awarded periodically / unused points expire periodically
• Point exchange first-in first out (FIFO)
• Unfilled departure slots can be acquired without exchanging points
• No buying when points < 0

Week
Ending
20-Feb 27-Feb 6-Mar 13-Mar 20-Mar 27-Mar 3-Apr 10-Apr 17-Apr 24-Apr 1-May
Weekly
Starting
Total 40 40 40 35 50 50 55 45 55 45 50
3 weeks 10 10 10 5 10 10 20 10 15 5 20
2 weeks 10 10 10 10 10 20 10 15 10 20 10
1 week 10 10 10 10 20 10 15 10 20 10 10
current
week 10 10 10 10 10 10 10 10 10 10 10
Buys 10 15 10 20 10
Sells 10 5 10
End of
Week Total 40 30 25 45 50 45 55 55 35 45 40
3 weeks 10 0 0 5 10 0 20 10 0 5 10
2 weeks 10 10 5 10 10 20 10 15 5 20 10
1 week 10 10 10 10 20 10 15 10 20 10 10
current
week 10 10 10 20 10 15 10 20 10 10 10
45
Rolling Points Based on Weeks
Expiring Points 10 points acquired each week

46
Trade for an Earlier Departure
Original
Departure
Slot (Blue)
8:00am 9:00am
Available for
Trade Slot
(Red)
12 minutes (8 slots)
Scheduled
Pushbacks
Expected
Pushbacks
Trade Window
Notes:
1. Each slot is 1 minute & 30 seconds.
2. The processing of the change needs to occur prior to the recalculated
expected departure time. This may or may not be the same as the
current expected departure time because of the difference in location of
the aircraft making the switch.
Processing Time
Recalculated
Expected
Pushback
(Blue)
47
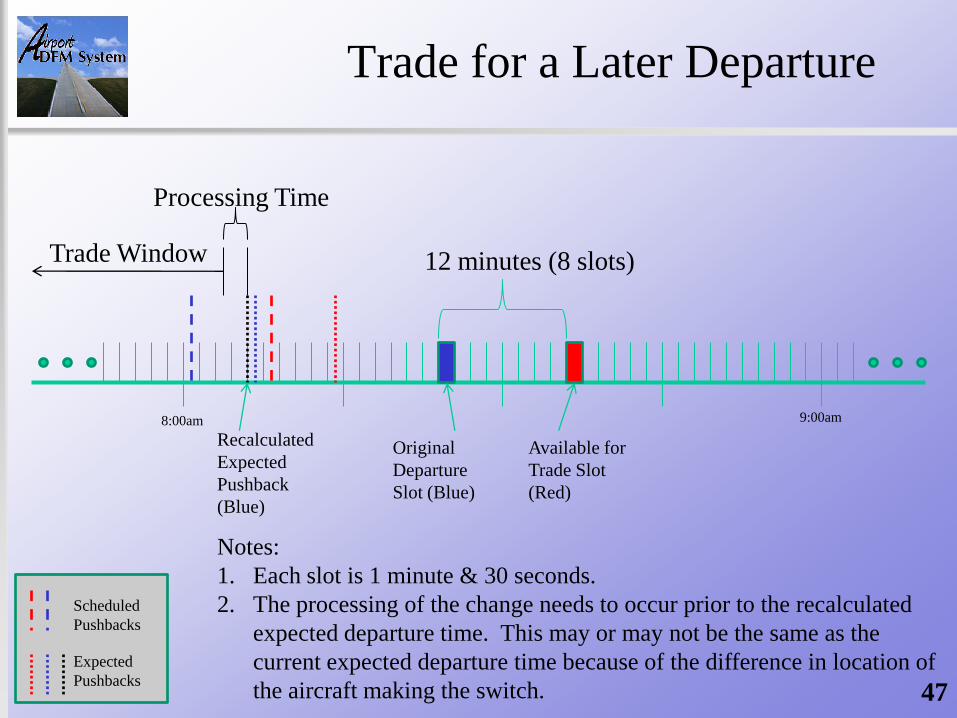
Trade for a Later Departure
Original
Departure
Slot (Blue)
8:00am 9:00am
Available for
Trade Slot
(Red)
12 minutes (8 slots)
Scheduled
Pushbacks
Expected
Pushbacks
Trade Window
Notes:
1. Each slot is 1 minute & 30 seconds.
2. The processing of the change needs to occur prior to the recalculated
expected departure time. This may or may not be the same as the
current expected departure time because of the difference in location of
the aircraft making the switch.
Processing Time
Recalculated
Expected
Pushback
(Blue)
48
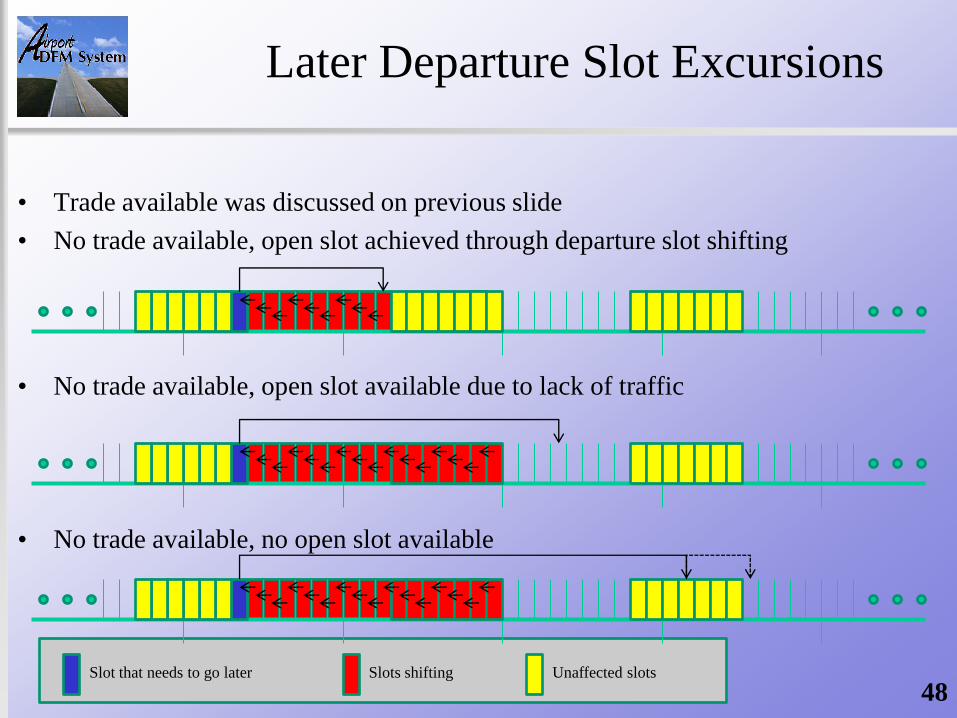
• Trade available was discussed on previous slide
• No trade available, open slot achieved through departure slot shifting
• No trade available, open slot available due to lack of traffic
• No trade available, no open slot available
Later Departure Slot Excursions
Slot that needs to go later Slots shifting Unaffected slots
49
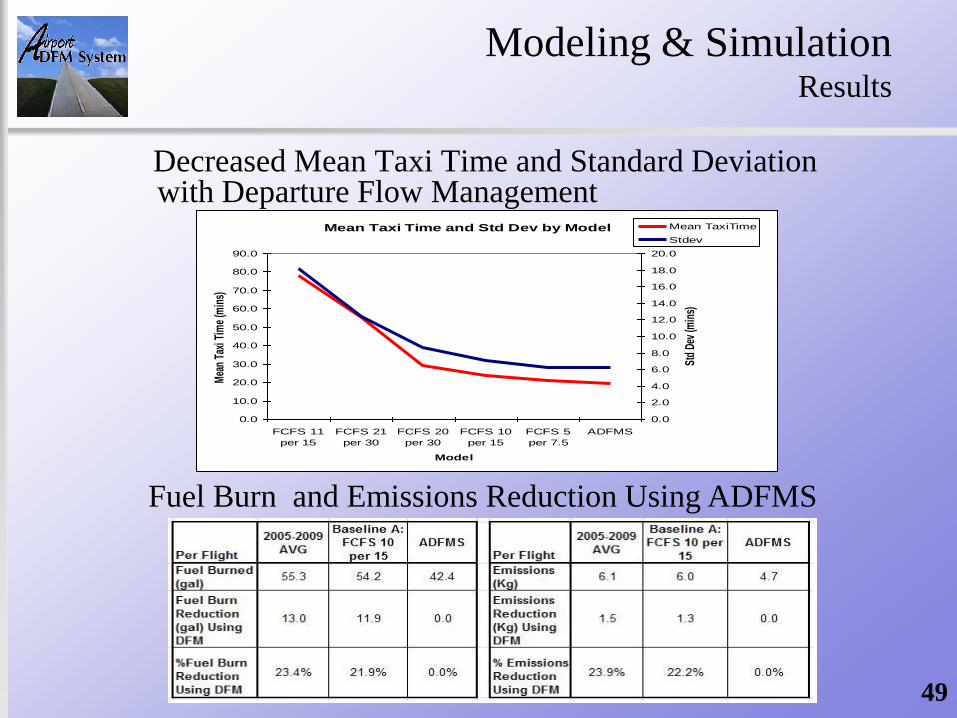
Modeling & SimulationResults
Decreased Mean Taxi Time and Standard Deviation with Departure Flow Management
Fuel Burn and Emissions Reduction Using ADFMS
Mean Taxi Time and Std Dev by Model
0.0
10.0
20.0
30.0
40.0
50.0
60.0
70.0
80.0
90.0
FCFS 11
per 15
FCFS 21
per 30
FCFS 20
per 30
FCFS 10
per 15
FCFS 5
per 7.5
ADFMS
Model
Mea
n Ta
xi T
ime
(min
s)
0.0
2.0
4.0
6.0
8.0
10.0
12.0
14.0
16.0
18.0
20.0
Std
Dev
(min
s)
Mean TaxiTime
Stdev

Modeling & SimulationResults
Results Consistent with Analogous Departure Slot Implementation Studies
Study Hours of Taxi Time Saved per Day at PHL
Collaborative Airport Surface Metering-
Conservative (May 2007)43
GRA Inc Airport CDM at NEXTOR Symposium
(Jan 2010)49
ADFMS 50
http://acast.grc.nasa.gov/wp-content/uploads/icns/2007/Session_H/05-Brinton.pdf
http://www.nextor.org/Conferences/201001_NEXTOR_Symposium/Berardino.pdf
Comparison of Baseline Results with 2005-2009 Averages

Distribution of Time Between Arrivals
51
Distribution: Lognormal
Expression: =-0.001 + LOGN(4.16, 5.11)
Square Error: 0.00169
Number of intervals 10
Degrees of freedom 7
Test Statistic 8.66
Corresponding p-value 0.285
Test Statistic 6.55E-223
Corresponding p-value 6.55E-223
Number of Data Points 602
Min Data Value 0
Max Data Value 18
Sample Mean 1.88
Sample Std Dev 2.2
Histogram Range = -0.001 to 18
Number of Intervals 16
Distribution Summary
Chi Square Test
Kolmogorov-Smirnov Test
Data Summary
Histogram Summary
0 1 2 3 4 5 6 7 8(Mins)
Histogram of Time
Between Arrivals

52
Project Schedule / Progress

53
Earned Value Management

54
Earned Value Management