airline safety losses - annual review 2016 · airline safety & losses – annual review 2016...
TRANSCRIPT


Airline Safety & Losses – Annual Review 2016
Flightglobal.com/Reports 2
2016 was yet another good year for airsafety.
However, again, insurers did not have a good year with incurred all-risk losses exceedingwritten premiums for the fourth year running.
Insurance – All-Risk1
We currently estimate that the cost of incurred airline hull and legal liability losses for 2016 isabout $1,400 million. This is some $300 million less than the estimated cost of claims in2015 and $500 million less than in 2014.
Nevertheless, the cost of claims in 2016 easily exceeds the estimated $1,200 million ofpremiums written during the calendar year2 and is the fourth year running where claims haveexceeded premiums. Written premium in 2016 was lower than in any year since 1999.
However, despite the continued erosion of written premiums, some in the market claim tohave seen some small sign of the market beginning to harden as the year drew to a close,we shall see.
Premiums obviously cannot continue to fall indefinitely but, unless there is a change inexternal conditions or some other ‘shock’ so that there is a withdrawal of capacity fromaviation as an insurance class, the current situation might be considered the new normal.
Airline ‘All-Risk’ Hull & Liability Claims Costs and Written Premium 2007 – 2016(US$ Millions)
Year 2007 2008 2009 2010 2011 2012 2013 2014 2015 2016P
WrittenPremium
1,575 1,660 1,960 2,100 2,050 1,825 1,600 1,650 1,300 1,200
Hull Cost 861 826 858 1,262 729 457 765 511 665 632
LiabilityCost
665 321 930 361 88 102 297 824 425 125
MinorLiability
450 450 475 500 525 550 575 600 625 650
Total Cost 1,976 1,597 2,263 2,123 1,342 1,109 1,637 1,935 1,715 1,407
1 At the time of writing it is still not known whether the disappearance of the Malaysia Boeing 777, MH370, inMarch 2014 or the crash of the Egyptair A320, MS804, in 2016 will be confirmed as war or all-risk losses.Currently, for the sake of these statistics, we are treating the MH370 loss as a deliberate act of violence but theEgyptair loss as an accident. However, we understand that the hull claim in both cases is currently being met,50/50, by the all-risk and war-risk markets and this is reflected in our cost of hull claims numbers.2 The amount of premium written in an “underwriting year” and the cost of claims incurred in a calendar year arenot directly comparable since, nowadays, the inception of the majority of airline policies occurs during the lastquarter of the year with a large number being renewing during December. Therefore most of the premiumswritten in 2016 will not be earned until 2017 and, similarly, most of the 2016 losses will have fallen on 2015policies.

Airline Safety & Losses – Annual Review 2016
Flightglobal.com/Reports 3
Accidents (Airline Operations)
The year 2016, was one of the safest ever, with a global fatal accident rate of one per 3.3million flights and a revenue passenger fatality rate of one per 17.2 million passengerscarried and continues the trend in improving airline safety.
The fatal accident rate for 2015, by far the safest year ever, was one per 4.76 million flightsand for 2014 one per 2.43 million. The average for the last five years is now about one per3.0 million flights. On this basis, airline safety is almost three times better than ten years ago.
Although some years have been better than others, the fatal accident rate has beenimproving for many years. At the start of the 1990s, the rate was about one per 0.6 or 0.7million flights. Therefore, based on this metric, airline operations are now some four or fivetimes safer than they were 20 years ago.
0
1000
2000
3000
4000
5000
6000
US
$M
illio
ns
Airline Hull & Liability Claims Cost and Premium ($m)(Excludes Hull War & Excess TP War)
Claims Cost Written Premium
The amount of premium written in an 'underwriting year' and the cost of
claims incurred in a calendar year are not directly comparable.

Airline Safety & Losses – Annual Review 2016
Flightglobal.com/Reports 4
The number of fatal accidents increased in 2016, going from 8 in 2015 to 12 last year, therewere 15 fatal accidents in 2014. Five of these accidents happened on revenue passengerflights.
The average annual number of fatal accidents for the current decade is 17.1. The annualaverage for the period 2000-2009 was 27.4 while the 1990s average was 37.9. The annualaverages for the 1980s and 1970s were 33.1 and 40.0 respectively.
Annual Fatal Accidents (jet and turboprop aircraft) – 2007 - 2016Year 2007 2008 2009 2010 2011 2012 2013 2014 2015 2016
Fatal Accidents 25 28 23 27 25 15 18 15 8 12
Fatal Accidents (jet and turboprop aircraft) – Decade Averages
Period 1970 - 1979 1980 - 1989 1990 - 1999 2000 - 2009 2010 - 2016
AnnualAverage
40.0 33.1 37.9 27.4 17.1
0.00
1.00
2.00
3.00
4.00
5.00
6.00
1990 1993 1996 1999 2002 2005 2008 2011 2014
Flig
hts
(Millio
ns)
Flights (Millions) per Fatal Accident(Excludes Acts of Violence)
Flights (Millions) per Fatal Accident 5 per. Mov. Avg. (Flights (Millions) per Fatal Accident)
Jet and turboprop aircraft of more than 14 seats or cargo equivalent

Airline Safety & Losses – Annual Review 2016
Flightglobal.com/Reports 5
The number of passenger and crew fatalities last year, at 296, was an increase on 2015when only 158 people were killed but, nevertheless, it still continues the trend to fewer airlinefatalities.
On average, over the last five years, there have been some 300 fatalities per year comparedto perhaps 800 a year ten years ago and maybe 1,200 per year 20 years ago. However, withgenerally so few fatalities in airline operations nowadays, one “bad” accident can make allthe difference to the result.
The annual average number of fatalities for the period 2000-2009 was 793 and that for the1990s was 1,135. The annual average for the current decade (2010-2016) is 402.
Annual Passenger & Crew Fatalities (jet and turboprop aircraft) – 2007 - 2016
Year 2007 2008 2009 2010 2011 2012 2013 2014 2015 2016
Fatalities 737 544 731 822 502 416 187 436 158 296
Passenger & Crew Fatalities (jet and turboprop aircraft) – Decade Averages
Period 1970 - 1979 1980 - 1989 1990 - 1999 2000 - 2009 2010 - 2015
AnnualAverage
1467.4 1072.2 1135.0 792.5 402.4
To put these improvements into perspective, if the current decade’s annual average ismaintained, some 4,400 fewer passengers and crew will be killed in airline accidents duringthe period 2010-2019 than in the previous decade and over 7,300 fewer than during the1990s.
0
5
10
15
20
25
30
35
40
45
50
1990 1993 1996 1999 2002 2005 2008 2011 2014
Fata
lA
ccid
ents
Annual Airline Fatal Accidents
Fatal Accidents (Excl. Violence) Fatal Accidents (Incl. Violence)5 per. Mov. Avg. (Fatal Accidents (Excl. Violence)) 5 per. Mov. Avg. (Fatal Accidents (Incl. Violence))
Jet and turboprop aircraft of more than 14 seats or cargo equivalent

Airline Safety & Losses – Annual Review 2016
Flightglobal.com/Reports 6
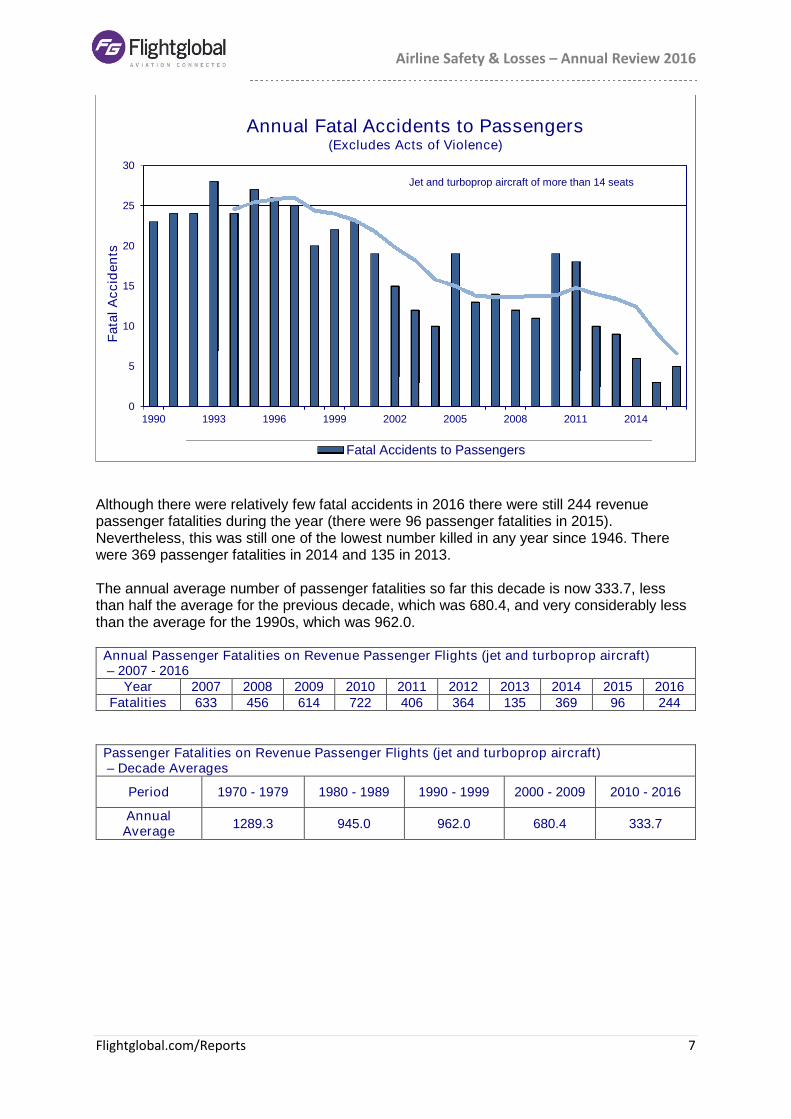
On a more restrictive basis, the five fatal accidents involving passenger deaths on revenuepassenger flights in 2016, again, after 2015, is the lowest seen in any year since 1946. Thisis also less than the previous lowest years, 2014 and 2013, which were, in turn, each “thebest years ever”. However there were 18 such accidents in 2011 and 19 in 2010 so theannual average so far for this decade is still 10.0, not such a marked improvement on theprevious 10 years (2000-2009) when the annual average was 14.7. The annual averagenumber of fatal accidents involving revenue passengers for the 1990s was 24.3.
Annual Fatal Accidents to Passengers (jet and turboprop aircraft) – 2007 - 2016Year 2007 2008 2009 2010 2011 2012 2013 2014 2015 2016
Fatal Accidents 14 12 10 19 18 10 9 6 3 5
Fatal Accidents to Passengers (Jet and turboprop aircraft) – DecadeAverages
Period 1970 - 1979 1980 - 1989 1990 - 1999 2000 - 2009 2010 - 2016
AnnualAverage
28.8 24.6 24.3 14.7 10.0
0
200
400
600
800
1000
1200
1400
1600
1800
2000
1990 1993 1996 1999 2002 2005 2008 2011 2014
Fata
liti
es
Airline Annual Passenger and Crew Fatalities(Excludes Acts of Violence)
Fatalities 5 per. Mov. Avg. (Fatalities)
Jet and turboprop aircraft of more than 14 seats or cargo equivalent
Airline Safety & Losses – Annual Review 2016
Flightglobal.com/Reports 7
Although there were relatively few fatal accidents in 2016 there were still 244 revenuepassenger fatalities during the year (there were 96 passenger fatalities in 2015).Nevertheless, this was still one of the lowest number killed in any year since 1946. Therewere 369 passenger fatalities in 2014 and 135 in 2013.
The annual average number of passenger fatalities so far this decade is now 333.7, lessthan half the average for the previous decade, which was 680.4, and very considerably lessthan the average for the 1990s, which was 962.0.
Annual Passenger Fatalities on Revenue Passenger Flights (jet and turboprop aircraft)– 2007 - 2016
Year 2007 2008 2009 2010 2011 2012 2013 2014 2015 2016Fatalities 633 456 614 722 406 364 135 369 96 244
Passenger Fatalities on Revenue Passenger Flights (jet and turboprop aircraft)– Decade Averages
Period 1970 - 1979 1980 - 1989 1990 - 1999 2000 - 2009 2010 - 2016
AnnualAverage
1289.3 945.0 962.0 680.4 333.7
0
5
10
15
20
25
30
1990 1993 1996 1999 2002 2005 2008 2011 2014
Fata
lA
ccid
en
tsAnnual Fatal Accidents to Passengers
(Excludes Acts of Violence)
Fatal Accidents to Passengers
Jet and turboprop aircraft of more than 14 seats

Airline Safety & Losses – Annual Review 2016
Flightglobal.com/Reports 8
The estimated passenger fatality rate for 2016 was one per 17.2 million passengers carried.Although this is not as good as the one per 42.3 million rate for 2015 or the one per 25.9million rate for 2013, it is still markedly better than the one per 10.4 million in 2014 andcontinues the trend of improving safety. On this basis, 2016 was the third safest year ever.
On average, from the point of view of passengers, the airline industry as a whole is nowmore than three times safer than it was as recently as ten years ago and nine times saferthan 20 years ago.
The passenger fatality rate for the last five years is almost one per 16 million passengerscarried. The rate for the last decade (2000-2009) was one per 3.7 million and for the 1990sone per 1.8 million.
The worst accidents in 2016 were 1) the Lamia Avro RJ that flew into high ground followingfuel exhaustion on approach to Medellin, Colombia on 18 November, killing 68 passengersand 3 crew. There were 73 passengers and 4 crew on board. 2) the Egyptair Airbus A320 on19 May which crashed into the Mediterranean Sea, apparently following an on board fire,towards the end of a flight from Paris, France to Cairo, Egypt, killing all 59 passengers and 7crew on board 3) the flydubai Boeing 737 on 19 March which went out of control andcrashed at the start of a go-around at Rostov-on-Don, Russia killing the 7 crew and 55passengers on board and 4) the PIA ATR 42 that crashed killing all 5 crew and 47passengers on board following a reported engine problem while descending inbound toIslamabad, Pakistan on 7 December.
0
200
400
600
800
1000
1200
1400
1600
1800
2000
1990 1993 1996 1999 2002 2005 2008 2011 2014
Passen
ger
Fata
liti
es
Annual Passenger Fatalities on Revenue PassengerFlights
Rev. Pass. Fatalities (Excl. Violence)Rev. Pass. Fatalities (Incl. Violence)
Jet and turboprop aircraft of more than 14 seats

Airline Safety & Losses – Annual Review 2016
Flightglobal.com/Reports 9
Western-Built Jets
During 2015, western-built jets, which carry more than 90% of the world's traffic, sufferedfive fatal accidents. This is disappointing after 2015 when the class suffered no fatalaccidents but is more or less in line with other recent years.
The annual average number of fatal accidents for the current decade is now 4.0. The annualaverage for the previous decade was 7.7 and that for the 1990s, 10.5.
Annual Fatal Accidents (western-built jets) – 2007 - 2016Year 2007 2008 2009 2010 2011 2012 2013 2014 2015 2016
Fatal Accidents 7 9 9 8 5 3 5 2 0 5
Fatal Accidents (western-built jets) – Decade Averages
Period 1970 - 1979 1980 - 1989 1990 - 1999 2000 - 2009 2010 - 2016
AnnualAverage
12.1 10.5 10.5 7.7 4.0
0.00
5.00
10.00
15.00
20.00
25.00
30.00
35.00
40.00
45.00
1990 1993 1996 1999 2002 2005 2008 2011 2014
Passen
gers
Carr
ied
(Millio
ns)
Passengers Carried (Millions) per Passenger Fatality
on Revenue Passenger Flights(Excludes Acts of Violence)
Passengers Carried (Millions) per Passenger Fatality Five Year Moving Average
Jet and turboprop aircraft of more than 14 seats

Airline Safety & Losses – Annual Review 2016
Flightglobal.com/Reports 10
Western-built jets made some 32 million flights in 2016 and the fatal accident rate for the lastfive years for this class of aircraft stands at about one per 10 million flights.
The fatal accident rate for the current decade is one per 7.2 million flights. On this basisworldwide western-built jet operations are now more than twice as safe as they were 10years ago, almost five times safer than in the 1990s, seven times safer than in the 1980sand more than 10 times safer than in the 1970s.
Fatal Accident Rate (western-built jets)
Period 1970 - 1979 1980 - 1989 1990 - 1999 2000 - 2009 2010 - 2016
Flights(millions) per
Fatal Accident0.67 1.05 1.49 3.0 7.2
0
2
4
6
8
10
12
14
16
1990 1993 1996 1999 2002 2005 2008 2011 2014
Fata
lA
ccid
en
tsAnnual Fatal Accidents - Western-Built Jets
(Excludes Acts of Violence)
Fatal Accidents 5 per. Mov. Avg. (Fatal Accidents)

Airline Safety & Losses – Annual Review 2016
Flightglobal.com/Reports 11
The annual average for passenger and crew fatalities, so far, for the current decade (2010-2016) is 230.0, that for the previous decade was 511.6 and the average for the 1990s was657.8.
Annual Passenger & Crew Fatalities (western-built jets) – 2007 - 2016Year 2007 2008 2009 2010 2011 2012 2013 2014 2015 2016
Fatalities 576 366 414 554 207 281 83 278 0 207
Passenger & Crew Fatalities (western-built jets) – Decade Averages
Period 1970 - 1979 1980 - 1989 1990 - 1999 2000 - 2009 2010 - 2016
AnnualAverage
761.5 587.0 657.8 511.6 230.0
Average Passenger & Crew Fatalities per Fatal Accident (western-built jets)– 2007 - 2016
Year 2007 2008 2009 2010 2011 2012 2013 2014 2015 2016Average Fatalities 82.3 40.7 46.0 69.3 41.4 93.7 16.6 139.0 - 41.4
Passenger & Crew Fatalities per Fatal Accident (western-built jets) – Decade Averages
Period 1970 - 1979 1980 - 1989 1990 - 1999 2000 - 2009 2010 - 2016
AverageFatalities
62.9 55.9 62.6 66.5 57.5
0
2
4
6
8
10
12
14
16
18
20
1990 1993 1996 1999 2002 2005 2008 2011 2014
Flig
hts
(Millio
ns)
Flights (millions) per Fatal Accident
Western-Built Jets(Excludes Acts of Violence)
Flights per fatal accident (all) 5 Year Moving Average

Airline Safety & Losses – Annual Review 2016
Flightglobal.com/Reports 12
There were three fatal accidents in 2016 involved passenger fatalities on revenue passengerflights operated by western-built jets. There were no such accidents in 2015 but two in 2014,three in 2013, three in 2012 and four in 2011. The three fatal accidents in 2016 gave rise to182 passenger fatalities. In 2015, with no fatal accidents there were, of course, no fatalities.There were 266 passenger fatalities in 2014, 63 in 2013 and 269 in 2012.
Annual Fatal Accidents to Passengers (western-built jets) – 2007 - 2016Year 2007 2008 2009 2010 2011 2012 2013 2014 2015 2016
Fatal Accidents 7 6 4 6 4 3 3 2 0 3
Fatal Accidents to Passengers (Western-Built Jets) – Decade Averages
Period 1970 - 1979 1980 - 1989 1990 - 1999 2000 - 2009 2010 - 2016
AnnualAverage
9.1 8.5 7.8 5.5 3.0
The average annual number of fatal accidents (to passengers) so far this decade is 3.0,about 45% down on the last decade’s average of 5.5 and considerably better than that forthe 1990s of 7.8.
0
200
400
600
800
1000
1200
1400
1990 1993 1996 1999 2002 2005 2008 2011 2014
Fata
liti
es
Annual Passenger and Crew Fatalities
Western-Built Jets(Excludes Acts of Violence)
Fatalities

Airline Safety & Losses – Annual Review 2016
Flightglobal.com/Reports 13
The annual average number for passenger fatalities for the current decade so far is 211, lessthan half of that for the previous decade, 472.6. The annual average for the 1990s was 598.
Annual Passenger Fatalities on Revenue Passenger Flights (western-built jets)– 2007 - 2016
Year 2007 2008 2009 2010 2011 2012 2013 2014 2015 2016Fatalities 544 341 363 513 184 269 63 266 0 182
Passenger Fatalities on Revenue Passenger Flights (western-built jets) – Decade Averages
Period 1970 - 1979 1980 - 1989 1990 - 1999 2000 - 2009 2010 - 2016
AnnualAverage
695.3 539.6 598.0 472.6 211.0
0
2
4
6
8
10
12
1990 1993 1996 1999 2002 2005 2008 2011 2014
Fata
lA
ccid
en
tsAnnual Fatal Accidents to Passengers
Western-Built Jets(Excludes Acts of Violence)
Fatal Accidents to Passengers
Airline Safety & Losses – Annual Review 2016
Flightglobal.com/Reports 14
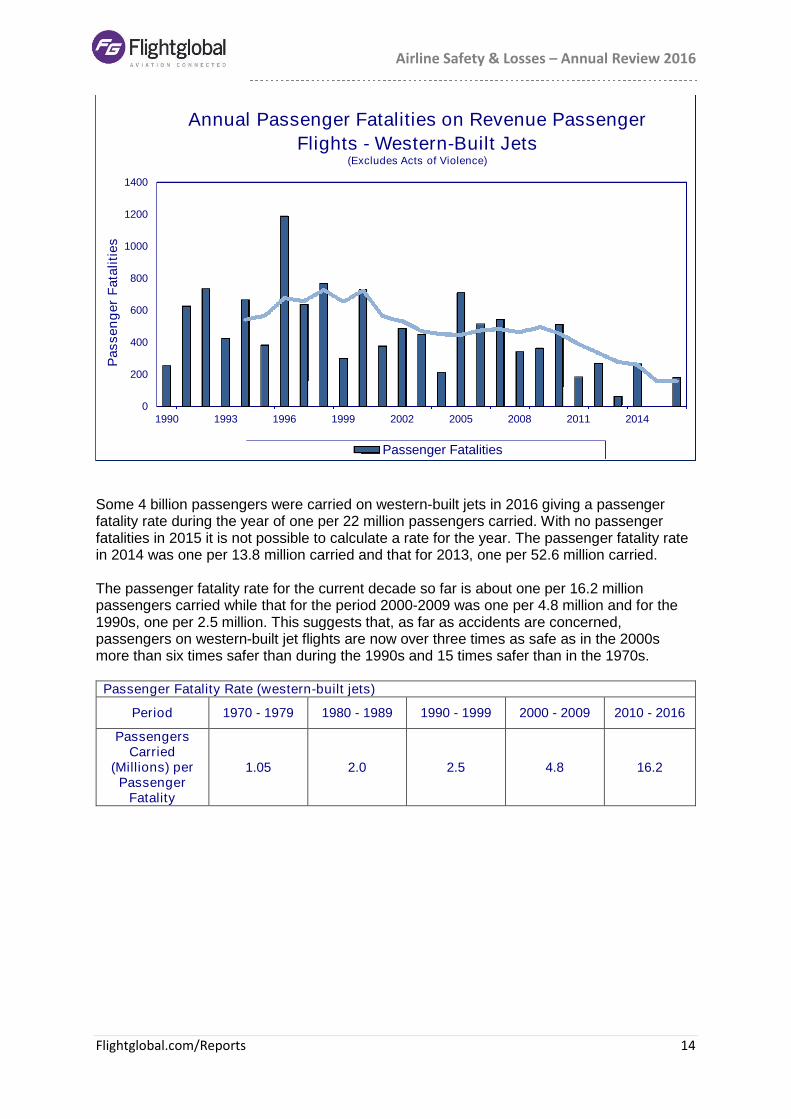
Some 4 billion passengers were carried on western-built jets in 2016 giving a passengerfatality rate during the year of one per 22 million passengers carried. With no passengerfatalities in 2015 it is not possible to calculate a rate for the year. The passenger fatality ratein 2014 was one per 13.8 million carried and that for 2013, one per 52.6 million carried.
The passenger fatality rate for the current decade so far is about one per 16.2 millionpassengers carried while that for the period 2000-2009 was one per 4.8 million and for the1990s, one per 2.5 million. This suggests that, as far as accidents are concerned,passengers on western-built jet flights are now over three times as safe as in the 2000smore than six times safer than during the 1990s and 15 times safer than in the 1970s.
Passenger Fatality Rate (western-built jets)
Period 1970 - 1979 1980 - 1989 1990 - 1999 2000 - 2009 2010 - 2016
PassengersCarried
(Millions) perPassenger
Fatality
1.05 2.0 2.5 4.8 16.2
0
200
400
600
800
1000
1200
1400
1990 1993 1996 1999 2002 2005 2008 2011 2014
Passen
ger
Fata
liti
es
Annual Passenger Fatalities on Revenue Passenger
Flights - Western-Built Jets(Excludes Acts of Violence)
Passenger Fatalities

Airline Safety & Losses – Annual Review 2016
Flightglobal.com/Reports 15
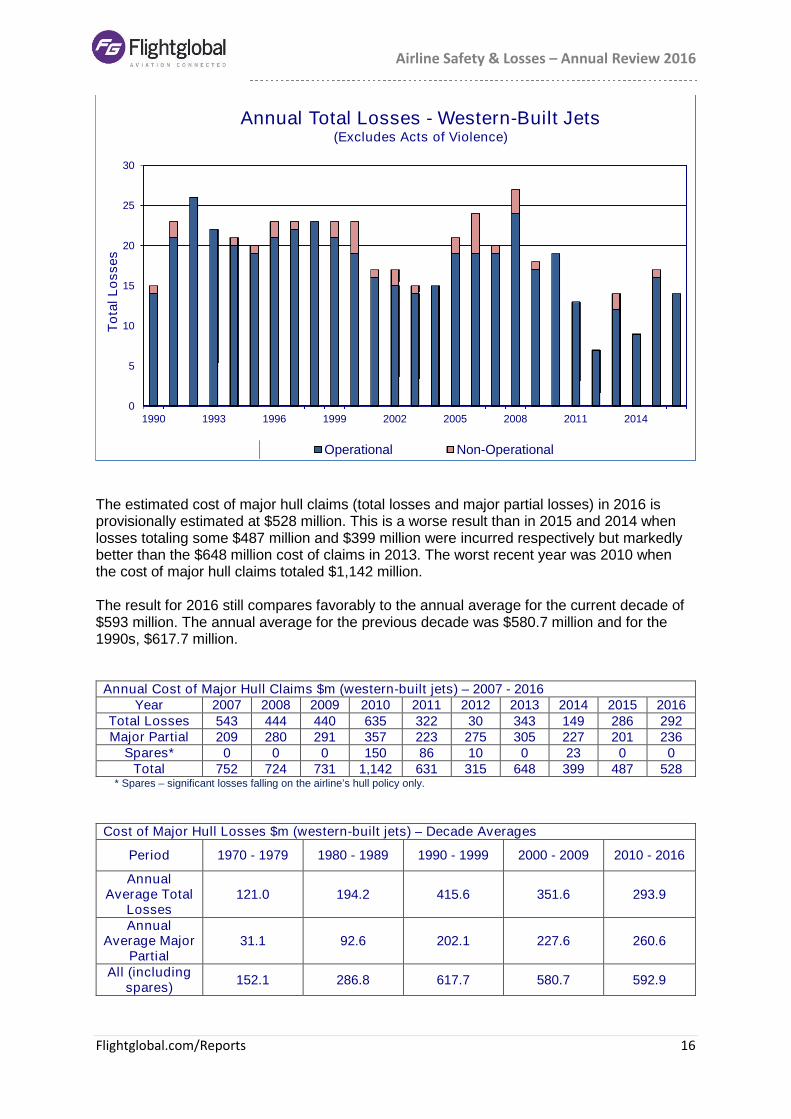
At the time of writing, western-built jets had suffered 14 confirmed operational all-riskinsurance total losses during 2016. This is two less than in 2015 but five more than in 2014.
The average annual number of operational total losses for the current decade is 12.9,increasing to 13.3 if non-operational losses are also included. For the previous decade, itwas 17.7 (19.7 including non-operational losses) and for the 1990s, 20.9 (21.9).
Annual All-Risk Total Losses (western-built jets) – 2007 - 2016Year 2007 2008 2009 2010 2011 2012 2013 2014 2015 2016
Operational 19 24 17 19 13 7 12 9 16 14Non-Operational 1 3 1 0 0 0 2 0 1 0
All 20 27 18 19 13 7 14 9 17 14
All-Risk Total Losses (western-built jets) – Decade Averages
Period 1970 - 1979 1980 - 1989 1990 - 1999 2000 - 2009 2010 - 2016
AnnualAverage
Operational17.6 16.5 20.9 17.7 12.9
AnnualAverage All
18.1 17.4 21.9 19.7 13.3
0
10
20
30
40
50
60
1990 1993 1996 1999 2002 2005 2008 2011 2014
Passen
gers
(Millio
ns)
Passengers Carried (Millions) per Passenger Fatality(Western-Built Jets)(Excludes Acts of Violence)
Passengers Carried (Millions) per Fatality5 Year Moving Average
Airline Safety & Losses – Annual Review 2016
Flightglobal.com/Reports 16
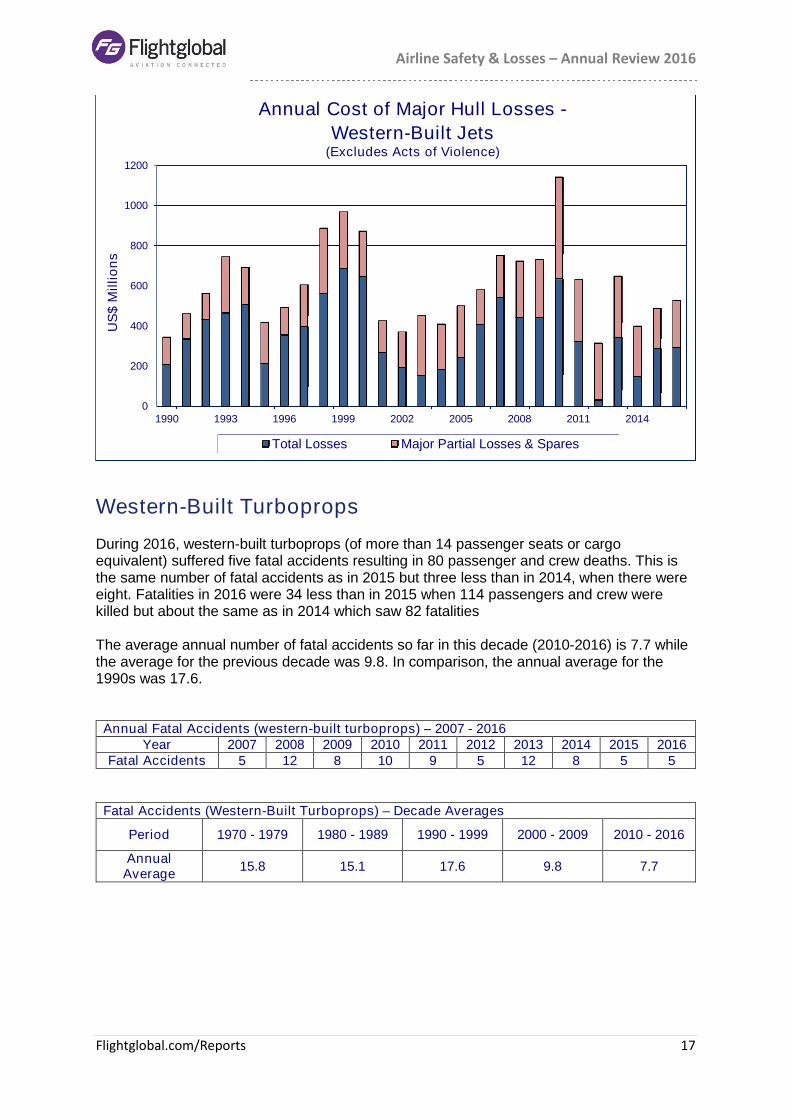
The estimated cost of major hull claims (total losses and major partial losses) in 2016 isprovisionally estimated at $528 million. This is a worse result than in 2015 and 2014 whenlosses totaling some $487 million and $399 million were incurred respectively but markedlybetter than the $648 million cost of claims in 2013. The worst recent year was 2010 whenthe cost of major hull claims totaled $1,142 million.
The result for 2016 still compares favorably to the annual average for the current decade of$593 million. The annual average for the previous decade was $580.7 million and for the1990s, $617.7 million.
Annual Cost of Major Hull Claims $m (western-built jets) – 2007 - 2016Year 2007 2008 2009 2010 2011 2012 2013 2014 2015 2016
Total Losses 543 444 440 635 322 30 343 149 286 292Major Partial 209 280 291 357 223 275 305 227 201 236
Spares* 0 0 0 150 86 10 0 23 0 0Total 752 724 731 1,142 631 315 648 399 487 528
* Spares – significant losses falling on the airline’s hull policy only.
Cost of Major Hull Losses $m (western-built jets) – Decade Averages
Period 1970 - 1979 1980 - 1989 1990 - 1999 2000 - 2009 2010 - 2016
AnnualAverage Total
Losses121.0 194.2 415.6 351.6 293.9
AnnualAverage Major
Partial31.1 92.6 202.1 227.6 260.6
All (includingspares)
152.1 286.8 617.7 580.7 592.9
0
5
10
15
20
25
30
1990 1993 1996 1999 2002 2005 2008 2011 2014
To
talL
osses
Annual Total Losses - Western-Built Jets(Excludes Acts of Violence)
Operational Non-Operational
Airline Safety & Losses – Annual Review 2016
Flightglobal.com/Reports 17
Western-Built Turboprops
During 2016, western-built turboprops (of more than 14 passenger seats or cargoequivalent) suffered five fatal accidents resulting in 80 passenger and crew deaths. This isthe same number of fatal accidents as in 2015 but three less than in 2014, when there wereeight. Fatalities in 2016 were 34 less than in 2015 when 114 passengers and crew werekilled but about the same as in 2014 which saw 82 fatalities
The average annual number of fatal accidents so far in this decade (2010-2016) is 7.7 whilethe average for the previous decade was 9.8. In comparison, the annual average for the1990s was 17.6.
Annual Fatal Accidents (western-built turboprops) – 2007 - 2016Year 2007 2008 2009 2010 2011 2012 2013 2014 2015 2016
Fatal Accidents 5 12 8 10 9 5 12 8 5 5
Fatal Accidents (Western-Built Turboprops) – Decade Averages
Period 1970 - 1979 1980 - 1989 1990 - 1999 2000 - 2009 2010 - 2016
AnnualAverage
15.8 15.1 17.6 9.8 7.7
0
200
400
600
800
1000
1200
1990 1993 1996 1999 2002 2005 2008 2011 2014
US
$M
illio
ns
Annual Cost of Major Hull Losses -
Western-Built Jets(Excludes Acts of Violence)
Total Losses Major Partial Losses & Spares

Airline Safety & Losses – Annual Review 2016
Flightglobal.com/Reports 18
The fatal accident rate for western-built turboprops in 2016 is estimated at about one per 1.4million flights, about the same as in 2015 but considerably better than in 2014 and 2013. Therelatively good result in 2016, following 2015, may, at last, represent the beginning ofimprovement to the safety of this class of aircraft. Until now there has been no significantsustained improvement in the fatal accident rate for this class, which, on average, has nowbeen at around one per 0.8 or 0.9 million flights for more than 10 years.
0
5
10
15
20
25
30
1990 1993 1996 1999 2002 2005 2008 2011 2014
Fata
lA
ccid
en
tsAnnual Fatal Accidents - Western-Built Turboprops
(Excludes Acts of Violence)
Fatal Accidents 5 per. Mov. Avg. (Fatal Accidents)
0
0.2
0.4
0.6
0.8
1
1.2
1.4
1.6
1990 1993 1996 1999 2002 2005 2008 2011 2014
Flig
hts
(Millio
ns)
Flights (millions) per Fatal Accident -
Western-Built Turboprops(Excludes Acts of Violence)
Flights (Millions) per Fatal Accident 5 Year Moving Average

Airline Safety & Losses – Annual Review 2016
Flightglobal.com/Reports 19
The number of passengers and crew killed on western-built turboprops in 2016, 80, isconsiderably better than in 2015 when 114 people were killed on board this class of aircraft.
The annual average for passenger and crew deaths on this class of aircraft so far in thisdecade is 103.6 which is about 20% worse than the annual average for the previous decadeof 86.1. The average for the 1990s was 197.1, for the 1980s, 199.1, and for the 1970s,258.9.
Annual Passenger & Crew Fatalities (western-built turboprops) – 2007 - 2016Year 2007 2008 2009 2010 2011 2012 2013 2014 2015 2016
Fatalities 26 110 108 167 113 70 99 82 114 80
Passenger & Crew Fatalities (western-built turboprops) – Decade Averages
Period 1970 - 1979 1980 - 1989 1990 - 1999 2000 - 2009 2010 - 2016
AnnualAverage
258.9 199.1 197.1 86.1 103.6
Average Passenger & Crew Fatalities per Fatal Accident (western-built turboprops)– Last 10 Years
Year 2007 2008 2009 2010 2011 2012 2013 2014 2015 2016Average Fatalities 5.2 9.2 13.5 16.7 12.6 14.0 8.3 10.3 22.8 16.0
Passenger & Crew Fatalities per Fatal Accident (western-built turboprops) – DecadeAverages
Period 1970 - 1979 1980 - 1989 1990 - 1999 2000 - 2009 2010 - 2016
AverageFatalities
16.4 13.2 10.9 8.8 13.5
0
50
100
150
200
250
300
350
400
1990 1993 1996 1999 2002 2005 2008 2011 2014
Fata
liti
es
Annual Passenger and Crew Fatalities -
Western-Built Turboprops(Excludes Acts of Violence)
Fatalities 5 per. Mov. Avg. (Fatalities)

Airline Safety & Losses – Annual Review 2016
Flightglobal.com/Reports 20
There were just two fatal accidents to passengers on revenue passenger flights during 2016;one less than in 2015. This is the lowest number since 2007 when there were also two suchaccidents. The two accidents in 2016 resulted in 62 passenger deaths, considerably lessthan the 96 killed in 2015 but about equal to the 61 killed in 2014.
The average annual number of fatal accidents (to passengers) for the current decade is 4.4,almost the same as that for the previous decade, 4.5. The average for the 1990s was 11.1.
Annual Fatal Accidents to Passengers (western-built turboprops) – 2006 - 2016Year 2007 2008 2009 2010 2011 2012 2013 2014 2015 2016
Fatal Accidents 2 4 4 7 7 4 5 3 3 2
Fatal Accidents to Passengers (western-built turboprops) – Decade Averages
Period 1970 - 1979 1980 - 1989 1990 - 1999 2000 - 2009 2010 - 2016
AnnualAverage
10.6 10.0 11.1 4.5 4.4
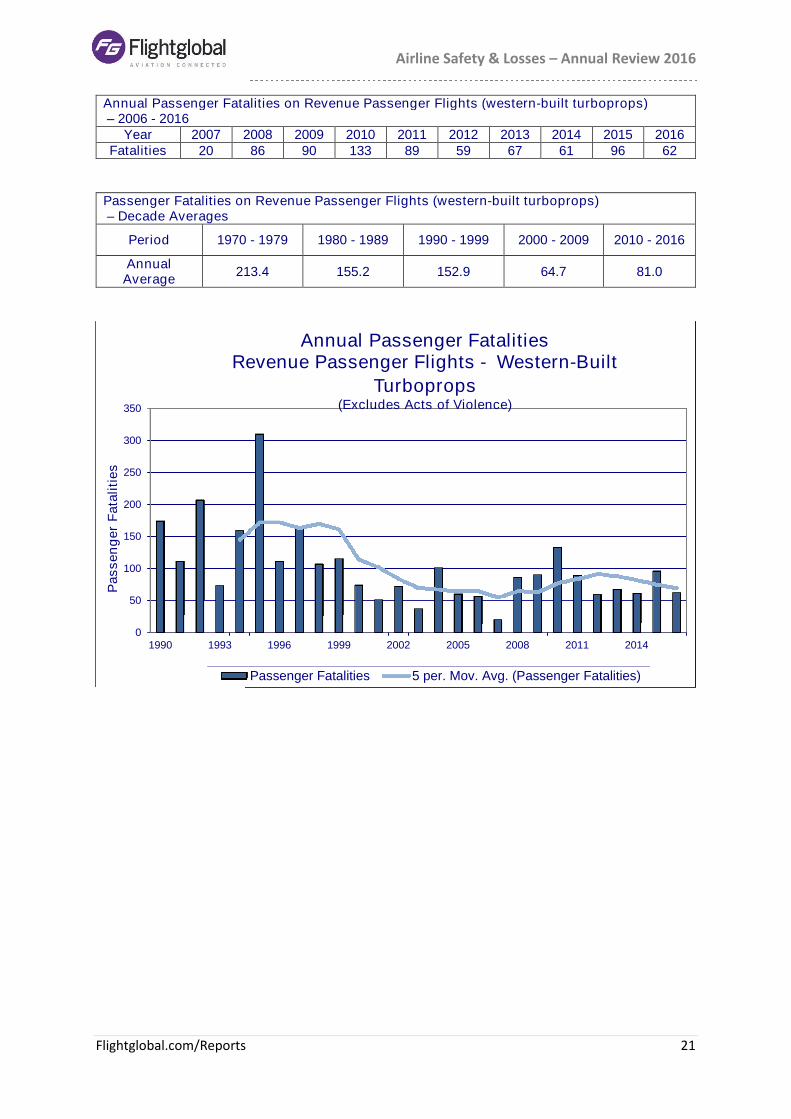
There were 62 passengers killed on revenue passenger flights operated by western-builtturboprops during 2016. This is considerably better than the 96 passengers killed on theseaircraft in 2015.
The average annual number of passenger fatalities for the current decade is 81.0. Theannual average for the previous decade (2000-2009) was 64.7 and that for the 1990s was152.9.
0
2
4
6
8
10
12
14
16
1990 1993 1996 1999 2002 2005 2008 2011 2014
Fata
lA
ccid
en
ts
Annual Fatal Accidents to Passengers -
Western-Built Turboprops(Excludes Acts of Violence)
Fatal Accidents 5 per. Mov. Avg. (Fatal Accidents)
Airline Safety & Losses – Annual Review 2016
Flightglobal.com/Reports 21
Annual Passenger Fatalities on Revenue Passenger Flights (western-built turboprops)– 2006 - 2016
Year 2007 2008 2009 2010 2011 2012 2013 2014 2015 2016Fatalities 20 86 90 133 89 59 67 61 96 62
Passenger Fatalities on Revenue Passenger Flights (western-built turboprops)– Decade Averages
Period 1970 - 1979 1980 - 1989 1990 - 1999 2000 - 2009 2010 - 2016
AnnualAverage
213.4 155.2 152.9 64.7 81.0
0
50
100
150
200
250
300
350
1990 1993 1996 1999 2002 2005 2008 2011 2014
Passen
ger
Fata
liti
es
Annual Passenger FatalitiesRevenue Passenger Flights - Western-Built
Turboprops(Excludes Acts of Violence)
Passenger Fatalities 5 per. Mov. Avg. (Passenger Fatalities)

Airline Safety & Losses – Annual Review 2016
Flightglobal.com/Reports 22
The passenger fatality rate in 2016 for western-built turboprops was one per 3.2 millionpassengers carried. This is an improvement on 2015 when the rate was one per 1.9 millionpassengers carried and also better than other recent years. Unfortunately, despite 2016’sbetter result, there has been no real sustained improvement in the passenger fatality rate forthis class of aircraft for more than 15 years.
The number of confirmed airline insurance total losses suffered by western-built turbopropsduring the year, currently standing at 9 (including one non-operational loss), is half thatrecorded for 2015 and is by far the lowest number of such losses in any year for more than40 years.
Based on experience, it is thought likely that more total losses will be confirmed in thecoming months but that the final figure for 2016 will probably still end up considerably lessthan that for 2015 and the average for the 2000s.
The annual average for the current decade so far is 19.3 (21.0 including non-operationallosses), for the previous decade 23.1 (25.1) and for the 1990s, 30.7 (31.9).
Annual Total Losses (western-built turboprops) – 2007 - 2016Year 2007 2008 2009 2010 2011 2012 2013 2014 2015 2016
Operational 15 32 19 23 21 24 22 20 17 8Non-Operational 0 5 1 4 2 3 0 1 1 1
All 15 37 20 27 23 27 22 21 18 9
Total Losses (western-built turboprops) – Decade Averages
Period 1970 - 1979 1980 - 1989 1990 - 1999 2000 - 2009 2010 - 2016
AnnualAverage
Operational26.2 27.8 30.7 23.1 19.3
AnnualAverage All
27.7 29.5 31.9 25.1 21.0
0
1
2
3
4
5
6
7
8
1990 1993 1996 1999 2002 2005 2008 2011 2014
Passen
gers
Carr
ied
(Millio
ns)
Passengers Carried (millions) per Passenger Fatality
Western-Built Turboprops)(Excludes Acts of Violence)
Passengers Carried (Millions) per Passenger Fatality 5 Year Moving Average
Airline Safety & Losses – Annual Review 2016
Flightglobal.com/Reports 23
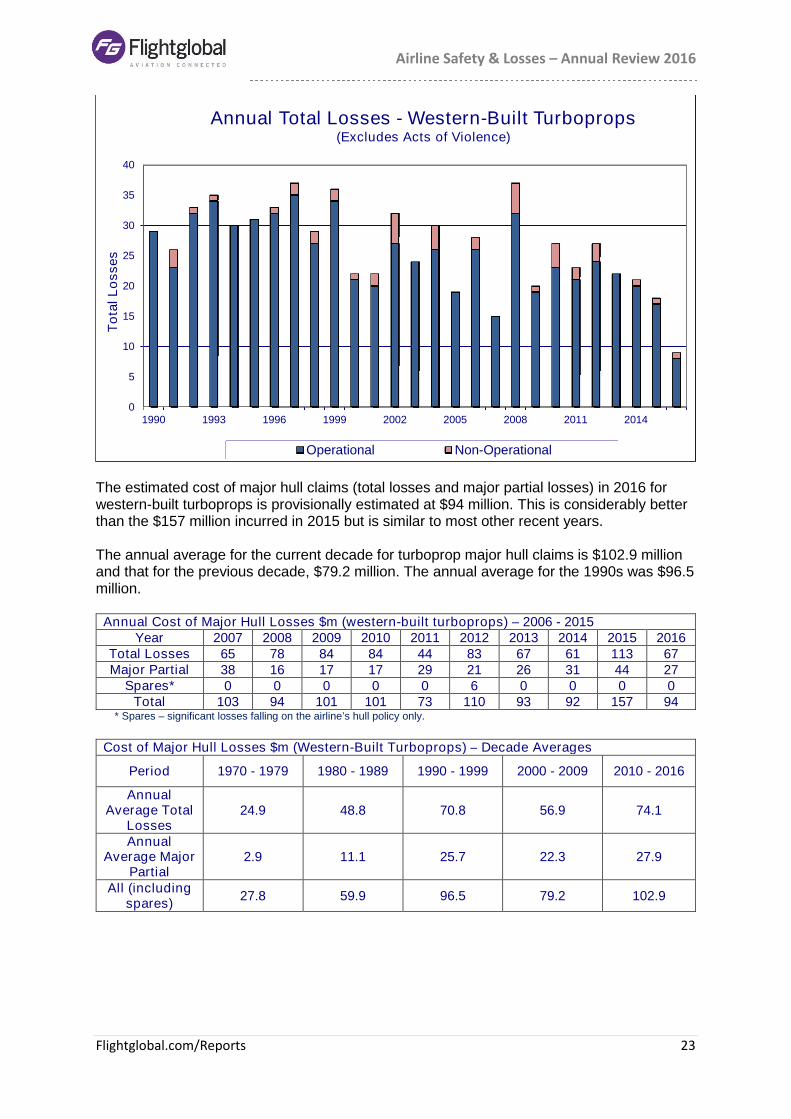
The estimated cost of major hull claims (total losses and major partial losses) in 2016 forwestern-built turboprops is provisionally estimated at $94 million. This is considerably betterthan the $157 million incurred in 2015 but is similar to most other recent years.
The annual average for the current decade for turboprop major hull claims is $102.9 millionand that for the previous decade, $79.2 million. The annual average for the 1990s was $96.5million.
Annual Cost of Major Hull Losses $m (western-built turboprops) – 2006 - 2015Year 2007 2008 2009 2010 2011 2012 2013 2014 2015 2016
Total Losses 65 78 84 84 44 83 67 61 113 67Major Partial 38 16 17 17 29 21 26 31 44 27
Spares* 0 0 0 0 0 6 0 0 0 0Total 103 94 101 101 73 110 93 92 157 94
* Spares – significant losses falling on the airline’s hull policy only.
Cost of Major Hull Losses $m (Western-Built Turboprops) – Decade Averages
Period 1970 - 1979 1980 - 1989 1990 - 1999 2000 - 2009 2010 - 2016
AnnualAverage Total
Losses24.9 48.8 70.8 56.9 74.1
AnnualAverage Major
Partial2.9 11.1 25.7 22.3 27.9
All (includingspares)
27.8 59.9 96.5 79.2 102.9
0
5
10
15
20
25
30
35
40
1990 1993 1996 1999 2002 2005 2008 2011 2014
To
talL
osses
Annual Total Losses - Western-Built Turboprops(Excludes Acts of Violence)
Operational Non-Operational

Airline Safety & Losses – Annual Review 2016
Flightglobal.com/Reports 24
Eastern-Built Jets
Airline-operated eastern-built jets suffered no fatal accidents again in 2016; the fourth yearrunning. This is now also the fifth year running when no revenue passengers have beenkilled. However, the operational eastern-built jet fleet has reduced very considerably overrecent years and, in 2016, these aircraft probably accounted for less than one percent of theworld’s total airline operations. With so little exposure it is not surprising that the fleet hasbeen loss free.
Annual Fatal Accidents (eastern-built jets) – 2007 – 2016Year 2007 2008 2009 2010 2011 2012 2013 2014 2015 2016
Fatal Accidents (All) 1 1 3 2 4 2 0 0 0 0Fatal Accidents(Passengers)
1 0 2 1 3 0 0 0 0 0
Fatal Accidents (eastern-built jets) – Decade Averages
Period 1970 - 1979 1980 - 1989 1990 - 1999 2000 - 2009 2010 - 2016
AnnualAverage (All)
5.5 3.8 4.4 2.5 1.1
PassengerAccidents
4.7 3.5 3.0 1.3 0.6
Annual Fatalities (eastern-built jets) – 2007 - 2016Year 2007 2008 2009 2010 2011 2012 2013 2014 2015 2016
Fatalities (All) 6 4 195 10 103 12 0 0 0 0Fatalities (Passenger) 6 0 161 2 79 0 0 0 0 0
0
20
40
60
80
100
120
140
160
180
1990 1993 1996 1999 2002 2005 2008 2011 2014
US
$M
illio
ns
Annual Cost of Major Hull Losses
Western-Built Turboprops(Excludes Acts of Violence)
Total Losses Major Partial Losses

Airline Safety & Losses – Annual Review 2016
Flightglobal.com/Reports 25
Annual Fatalities (eastern-built jets) – Decade Averages
Period 1970 - 1979 1980 - 1989 1990 - 1999 2000 - 2009 2010 - 2016
All Accidents 234.6 219.7 191.9 104.2 17.9
PassengerAccidents
207.0 200.5 155.9 84.5 11.6
0
1
2
3
4
5
6
7
8
1990 1993 1996 1999 2002 2005 2008 2011 2014
Fata
lA
ccid
en
ts
Annual Fatal Accidents - Eastern-Built Jets(Excludes Acts of Violence)
Fatal Accidents 5 per. Mov. Avg. (Fatal Accidents)
0
50
100
150
200
250
300
350
400
1990 1993 1996 1999 2002 2005 2008 2011 2014
Fata
liti
es
Annual Passenger and Crew Fatalities -
Eastern-Built Jets(Excludes Acts of Violence)
Fatalities 5 per. Mov. Avg. (Fatalities)

Airline Safety & Losses – Annual Review 2016
Flightglobal.com/Reports 26
Eastern-Built Turboprops
Eastern-built turboprops suffered two fatal accidents during 2016, one less than in 2015 anddown on the annual average for the current decade so far of 4.3. The annual average for theprevious decade (2000-2009) was 7.4.
A total of ten passengers and crew died in these accidents. Again this is lower than in 2015when 44 people were killed and considerably better than the annual average for the sevenyear period 2010-2016 which was 51.1.
There were no fatal accidents involving revenue passenger fatalities during 2016, thesecond year running. The annual average for passenger fatalities for the current decade is30.1.
Annual Fatal Accidents (eastern-built turboprops) – 2007 - 2016Year 2007 2008 2009 2010 2011 2012 2013 2014 2015 2016
Fatal Accidents (All) 12 6 3 7 7 5 1 5 3 2Fatal Accidents(Passengers)
4 2 0 5 4 3 1 1 0 0
Fatal Accidents (eastern-built turboprops) – Decade Averages
Period 1970 - 1979 1980 - 1989 1990 - 1999 2000 - 2009 2010 - 2016
FatalAccidents (All)
6.6 3.7 5.4 7.4 4.3
PassengerAccidents
4.4 2.6 2.4 3.4 2.0
Annual Fatalities (eastern-built turboprops) – 2007 - 2016Year 2007 2008 2009 2010 2011 2012 2013 2014 2015 2016
Fatalities (All) 129 64 14 91 79 53 5 76 44 10Fatalities (Passenger) 63 29 0 74 54 36 5 42 0 0
Annual Fatalities (eastern-built turboprops) – Decade Averages
Period 1970 - 1979 1980 - 1989 1990 - 1999 2000 - 2009 2010 - 2016
All Accidents 212.4 66.4 88.2 90.6 51.1
PassengerAccidents
173.6 49.7 55.2 58.6 30.1

Airline Safety & Losses – Annual Review 2016
Flightglobal.com/Reports 27
Paul Hayes, London, January 9, 2017
0
2
4
6
8
10
12
14
16
1990 1993 1996 1999 2002 2005 2008 2011 2014
Fata
lA
ccid
en
tsAnnual Fatal Accidents - Eastern-Built Turboprops
(Excludes Acts of Violence)
Fatal Accidents 5 per. Mov. Avg. (Fatal Accidents)
0
50
100
150
200
250
1990 1993 1996 1999 2002 2005 2008 2011 2014
Fata
liti
es
Annual Passenger and Crew Fatalities - Eastern-Built
Turboprops(Excludes Acts of Violence)
Fatalities 5 per. Mov. Avg. (Fatalities)

Airline Safety & Losses – Annual Review 2016
Flightglobal.com/Reports 28
Aircraft accidents & loss data
No other data provider delivers the depth, range and integrity of our authoritative aircraftaccident and loss information, built on 60 years of comprehensive global data.
Aviation authorities including the International Civil Aviation Organisation (ICAO), the US Federal AviationAdministration (FAA) and the UK Civil Aviation Authority (CAA) turn to Ascend for our timely and detailedaccident reports; global insurers value our unrivalled expertise in analysing safety trends and delivering reliablerecommendations on air safety improvements.
Our Air Safety team uses its unique range of data, industry sources and contacts to deliver tailored-madesolutions and provides immediate assistance to any air safety related enquiry.Our safety databases, specialist reports and services include:
World Aircraft Accident Summary (WAAS)Researched and published on behalf of the UK CAA, WAAS includes detailed descriptions for over 10,000accidents involving jet- and turbo-powered aircraft, as well as helicopters.
Jet Operator Statistics (JOS)Accident and exposure statistics covering more than 45 years, across more than 1,200 airlines, available as acomprehensive database or as a tailor-made subset.
Special BulletinWhen a major accident occurs, Flightglobal promptly publishes a Special Bulletin summarising all the availableinformation about the event, following up with quarterly updates and a special end-of-year report.
Airliner Loss Rates (ALR)ALR provides annual figures for all major airline types covering the different measures of exposure and five-yearaccident rates.
The aviation industry relies on Flightglobal for the most reliableand up-to-date information and insight available
For almost five decades, our international team of experts has delivered independent and trusted advice to helpcompanies achieve results and drive profitable performance.
All over the world, tens of thousands of market opinions are sought using Flightglobal information. Our richsource of proprietary data sources and analytical capabilities are second to none.
Contact us
Email: [email protected]
Twitter: Twitter.com/AscendAviation
LinkedIn: LinkedIn group ‘Ascend – Air Safety & Insurance’
Web: www.flightglobal.com/SafetyReports