airline business models and their respective carbon ... · the key area that airlines need to focus...
TRANSCRIPT
Airline Business Models and their respective carbon footprint: Final Report
Main Thematic Area: Economics
Keith Mason and Chikage Miyoshi Cranfield University January 2009
_____________________________________________________________________________________________________
Page 2 www.omega.mmu.ac.uk
About Omega Omega is a one-stop-shop providing impartial world-class academic expertise on the environmental issues facing aviation to the wider aviation sector, Government, NGO’s and society as a whole. Its aim is independent knowledge transfer work and innovative solutions for a greener aviation future. Omega’s areas of expertise include climate change, local air quality, noise, aircraft systems, aircraft operations, alternative fuels, demand and mitigation policies. Omega draws together world-class research from nine major UK universities. It is led by Manchester Metropolitan University with Cambridge and Cranfield. Other partners are Leeds, Loughborough, Oxford, Reading, Sheffield and Southampton. Launched in 2007, Omega is funded by the Higher Education Funding Council for England (HEFCE). www.omega.mmu.ac.uk
Report prepared by Principal Investigator: Dr Keith Mason Reviewed / checked by Andreas Schafer/Omega Office
© Copyright MMU 2009
_____________________________________________________________________________________________________
Page 3 www.omega.mmu.ac.uk
Airline Business Models – Final Report
Airline Business Models and their respective carbon footprint: Final Report ......................... 1
Executive Summary ......................................................................................................... 4
1.0 Introduction ........................................................................................................... 6
2.0 Fuel Trends ............................................................................................................ 7
3.0 The carbon dioxide footprint of intra-EU air services ................................................. 9
3.1 Underlying database and modelling approach ........................................................... 9
3.2 Intra-EU routes ..................................................................................................... 11
3.3 Business models ................................................................................................... 15
4.0 Key drivers of airline environmental performance .................................................... 22
4.1 Model specification and data used ......................................................................... 22
4.2 Model estimations and implications ....................................................................... 23
4.3 Aircraft weight reduction strategies ........................................................................ 27
5.0 Elasticities of demand for air transport ................................................................... 36
6.0 The future carbon intensity of air transport: scenario model .................................... 38
7.0 Passenger Expectation and Airline Business Models Seminar .................................... 42
8.0 Conclusions .......................................................................................................... 43
References ................................................................................................................... 46
Appendix A – List of Airlines by Business Models ............................................................. 48
Appendix B: Differences among groups using descriptive discriminant analysis ................. 54
_____________________________________________________________________________________________________
Page 4 www.omega.mmu.ac.uk
Executive Summary
The choices that airlines make about the aircraft they fly, the number of seats they have on each aircraft, the routes they fly and the passenger segments they focus on have significant impacts on their environmental performance (which can be assessed in terms of an airline’s CO2 emissions per passenger kilometre, fuel burn or other suitable metric). Each of the main airline business models (network, charter, low cost carrier (LCC), regional) involves practices that may improve or degrade environmental performance. This project analyses the factors that affect each business model’s environmental performance and considers the potential for changes to business models to improve the environmental sustainability of the aviation sector. The evolution of aircraft fuel consumption, average sector length and CO2 emission levels (per passenger kilometre) were investigated. From 1986 to 2004 total fuel consumed by European airlines1 increased by 220%, while the amount of fuel consumed per passenger km has decreased by 27% (or 2% per year). Average distance flown has increased by 21% and the average number of passengers carried per flight by 5%. The CO2 emissions of intra-EU air services from the UK generated by each business model (network, LCC, charter, regional) was established for the years 1997, 2000 and 2006. Emissions were estimated by route, stage length, aircraft type used, number of seats supplied on each aircraft and the distance flown, following the IPCC recommended approach to carbon dioxide calculation. The LCCs share of total emissions has risen to 46% of all intra-EU routes originating in the UK in 2006 from 12% in 1997. At 112g/pkm this group’s CO2 emissions are lower than either network carriers or regional airlines (at 144g/pkms and 216g/pkms respectively) in the EU market. However the lowest emissions level is achieved by charter airlines at 106g/pkm. Some activities airlines have undertaken to reduce on-board weight were also considered. These include reducing water carriage, lowering tankered fuel levels and re-designing the duty free sales process. A calculator that estimates the carbon dioxide emissions that can be prevented by removing weight from a number of aircraft types was developed. It estimates that 456.2 tonnes of CO2 emissions can be prevented if an airline operating a daily North Atlantic service with a Boeing 747-400 could reduce 1 tonne (metric) from its takeoff weight. One of the main policy instruments that can internalise the environmental costs of aviation is the European Emissions Trading Scheme. Prior to its introduction the UK government has increased its Air Passenger Duty as a quasi-environmental taxation measure. The success of such fiscal measures in dampening the demand for air
1 Airline members of the Association of European Airlines.
_____________________________________________________________________________________________________
Page 5 www.omega.mmu.ac.uk
transport will largely depend on the price elasticity of demand and indicative ranges for long and short haul leisure and business passengers are given. A model of air transport CO2 emissions, which was developed to test various scenarios, suggests that should current growth rates continue, emissions for the global aviation market may grow by over 50% between 2009 and 2020. With high growth rates, the share of emissions for low cost carriers would also grow significantly, however, it is also clear that network carrier’s growth of long haul flying also means that the absolute emissions levels of this group is also likely to rise. The output of the model is used to test the sensitivity of changes to business model, such as increasing load factors, increasing the number of seats on board an aircraft, and differing growth rates for each business model. A stakeholder workshop and seminar for this project and a sister Omega project “Passenger Expectations” was held in December 2008. Key outcomes of the seminar was that passengers seem to have little appetite for changes in behaviour (such as willingness to take fewer longer overseas holidays or to holiday within the UK) that might reduce the demand for air services and that further passenger education regarding the relative impact of flying compared to other GHG generating activities is required. Further research is required to assess passenger willingness to forego service levels, timetable frequency, flight times to maximise load factors, minimise aircraft weight and therefore fuel consumption. Future studies may extend this work in two ways: assessing the feasibility of fully adopting the various weight reduction strategies suggested for airlines; and by investigating network carriers’ freight operations as a source of carbon dioxide emissions. Keith Mason and Chikage Miyoshi Cranfield University March 2009
_____________________________________________________________________________________________________
Page 6 www.omega.mmu.ac.uk
1.0 Introduction The choices that airlines make about the aircraft they fly, the number of seats they have on each aircraft, the routes they fly and the passenger segments they focus on have significant impacts on their environmental performance (which can be assessed in terms of an airline’s CO2 emissions per passenger kilometre, fuel burn or other suitable metric). Each of the main airline business models (network, charter, low cost carrier (LCC), regional) have practices that may improve or degrade environmental performance. This project analyses the factors that affect each business model’s environmental performance and considers the potential for changes to business models to improve the environmental sustainability of the aviation sector. Given the different environmental performance of each type of airline, the evolution of the market shares of each will have clear environmental impacts. This project tests various airline market structure scenarios to carbon dioxide emission sensitivity and highlights key differences in business models that give rise to varying carbon dioxide emissions. Aims: The study aims to answer the following questions:
• How do different business models and industry structures influence environmental performance? Which airline business models are least environmentally damaging?
• What are the ramifications of the diversified market business models on the environment and are there market barriers to achieving greater environmental sustainability?
• What are the potential changes of approach / practice to current business models that would to realise environmental performance improvements?
• How might the sector transition to a set of business models with lower environmental footprints?
To address these aims the study considers, firstly, fuel trends in the aviation industry. The evolution of aircraft fuel consumption, average sector length and CO2 emissions per passenger kilometre are all considered. In section 3, the CO2 emissions of intra-EU air services from the UK are considered. In particular the share of emissions generated by each business model is established. This analysis leads to a consideration of the key drivers of airline emissions in section 4. Some activities airlines have undertaken to reduce on-board weight are also considered and a calculator that estimates the carbon dioxide emissions that may be prevented from removing weight from a number of aircraft types is developed. One of the main policy instruments that can internalise the environmental costs of aviation is the European Emissions Trading Scheme (ETS). Prior to the introduction of ETS, the UK government has increased its Air Passenger Duty as a quasi-environmental tax measure. The success of such fiscal measures in dampening the demand for air transport will depend on the price elasticity of demand which is considered in section 5. In section 6 a model of the future carbon dioxide intensity of the air transport industry, depending on various scenarios is developed. The model tests the
_____________________________________________________________________________________________________
Page 7 www.omega.mmu.ac.uk
sensitivity of changes to business model, such as increasing load factor, increasing the number of seats on board an aircraft, and differing growth rates for each business model. A workshop and seminar for this study and a sister Omega project “Passenger Expectations” that considered the willingness of passengers to forego service frequency and onboard service provision to reduce weight and maximise load factors was held in December 2008 and Section 8 highlights the key findings and refers to a fuller report on the seminar. Finally key conclusions are offered in section 8.
2.0 Fuel Trends
Aircraft carbon dioxide emissions are directly related to fuel consumption. Therefore the key area that airlines need to focus on to reduce their CO2 emissions is to reduce fuel burn. Fuel is also a direct and variable cost to all airlines, therefore reductions in fuel burn have direct benefits to an airline’s bottom line. Fuel cost is one of the most important factors in the total operating cost for airlines, representing more than 40% of the total industry costs at the level of fuel prices in 2008 (Halstead, 2008).
Fuel efficiency can be measured in terms of units of traffic (passenger kms or revenue tonne-kms) or capacity (seat-kms or available tonne-kms). The first is derived from the second by applying a load factor (Morrell, 2008). In this study, fuel consumed used per passenger kilometre (p/km) is adopted. Emission efficiency is also defined by the ratio of output to total emissions produced. Hence, carbon efficiency is expressed as the ratio of passenger kilometres to total carbon emissions produced.
The IPCC notes that past fuel efficiency has improved by 75% or 3.4% per year from 1960-2000 and 26% from 1980 to 2000 (Lee et al, 2001).
Figure 1 shows fuel consumption trends from 1986 to 2004 using data from the Association of European Airlines (AEA) for all regions.
_____________________________________________________________________________________________________
Page 8 www.omega.mmu.ac.uk
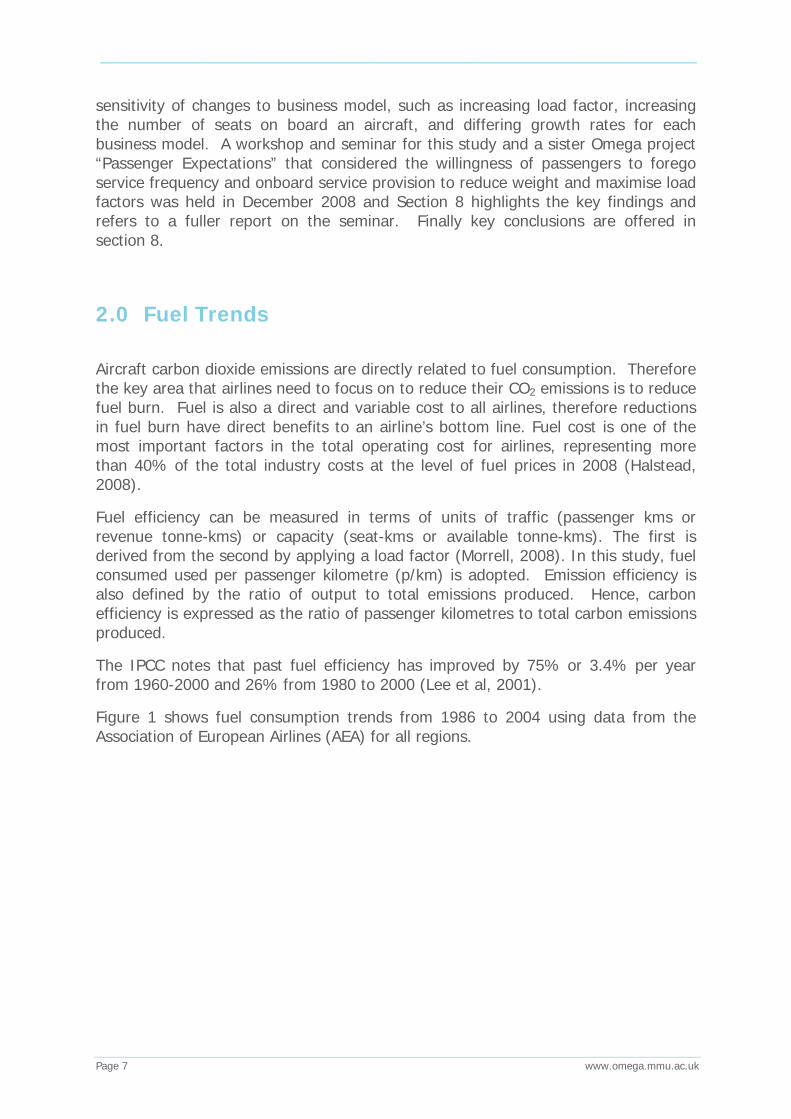
Figure 1: Fuel consumption and traffic trends (AEA airlines flights in all regions)
Data source: AEA (1986-2004)
The figure shows that traffic volume (RPK) increased 3 times between 1986 and 2004, while the total annual fuel consumption increased 2.2 times (4% per year). Thus, the fuel consumed per passenger km has reduced by 27% between 1986 and 2004 (2% per year). Average distance flown has increased by 21% and the average number of passengers carried per flight by 5%.
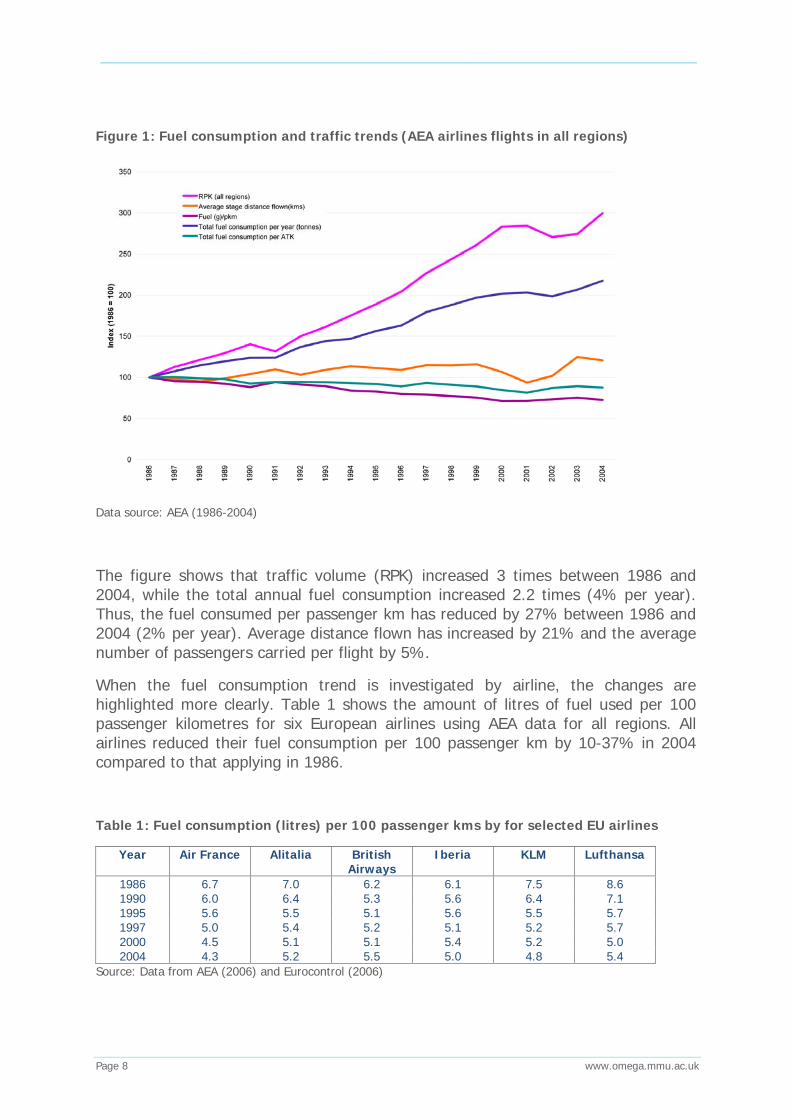
When the fuel consumption trend is investigated by airline, the changes are highlighted more clearly. Table 1 shows the amount of litres of fuel used per 100 passenger kilometres for six European airlines using AEA data for all regions. All airlines reduced their fuel consumption per 100 passenger km by 10-37% in 2004 compared to that applying in 1986.
Table 1: Fuel consumption (litres) per 100 passenger kms by for selected EU airlines
Year Air France Alitalia British Airways
Iberia KLM Lufthansa
1986 6.7 7.0 6.2 6.1 7.5 8.6 1990 6.0 6.4 5.3 5.6 6.4 7.1 1995 5.6 5.5 5.1 5.6 5.5 5.7 1997 5.0 5.4 5.2 5.1 5.2 5.7 2000 4.5 5.1 5.1 5.4 5.2 5.0 2004 4.3 5.2 5.5 5.0 4.8 5.4
Source: Data from AEA (2006) and Eurocontrol (2006)
_____________________________________________________________________________________________________
Page 9 www.omega.mmu.ac.uk
These results are based on the data of AEA network carriers for all regions including long haul routes. However, the emergence of LCCs has led to a change in the EU air transport market since the mid 1990s. In the next section, the impact of LCCs is analysed by investigating their CO2 emissions. Specifically, the section focuses on how emissions levels have changed after the emergence of LCCs and how emissions performance differs between airlines and airline business models.
3.0 The carbon dioxide footprint of intra-EU air services
The evolution of the air transport CO2 emissions since the full liberalisation of the EU air transport market (in 1997 when full domestic cabotage was allowed) has been considered using a carbon dioxide calculation model developed for another Omega funded project “Project ICARUS: A Carbon Reduction Framework for Buyers of Business Travel”.
3.1 Underlying database and modelling approach
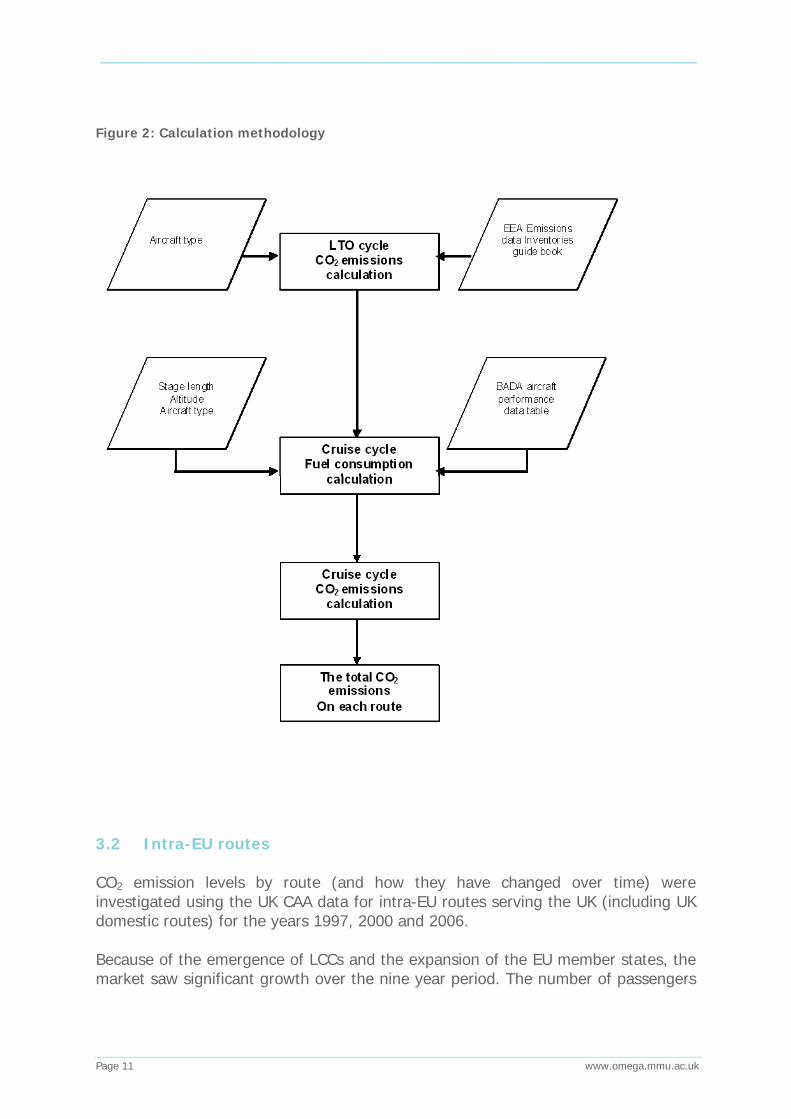
The Intergovernmental Panel on Climate Change (IPCC, 1997) provides a two-tired methodology in the “Greenhouse Gas Inventory Reference Manual” as a framework for estimating and reporting the emissions from aviation. The first tier is the simplest methodology, based only an aggregate number for fuel consumption to be multiplied with average emission factors. The second “Tier 2” methodology estimates CO2 emissions in two flying phases; the Landing and Take Off (LTO), and cruise phases. Fuel burn is higher in the LTO phase than cruise phase as the aircraft engines are working harder. As the aircraft reaches full cruise altitude the engines can work less hard and also less fuel is burnt at higher altitudes due to the thinner atmosphere. Emissions for these two phases are calculated separately and are then aggregated. To develop a carbon dioxide calculation model that accurately reflects actual air transport activity a disaggregated (bottom-up) approach was adopted (see Figure 2). It demonstrates emissions levels in the air transport market by estimating the CO2 emissions by route, stage length, aircraft type used, number of seats supplied on each aircraft and the distance flown on each route. Fundamentally, this approach follows the acknowledged methodologies based on revised 1996 IPCC “Guidelines for National Greenhouse Gas Inventories: Reference Manual and Emission Inventories” (EEA, 2006) for estimating emissions. The detailed calculation methodology adopted in this study can be found in Miyoshi and Mason (2008). The total emissions during the LTO cycle AND cruising stage on each route is calculated by computing the total fuel consumption and the emission factors by
_____________________________________________________________________________________________________
Page 10 www.omega.mmu.ac.uk
aircraft type, altitude and distance. An aircraft’s fuel burn on a route is not linear with distance and an aircraft burns a relatively large amount of fuel in the initial climb and a lower account of fuel while flying typical descent profiles. Emissions during the LTO cycle, by aircraft type, are obtained from the IPCC guidelines (1997) and the Emission Inventory Guidebook (EEA, 2006). Subsequently total fuel consumptions during cruise stage are calculated using performance tables from Base of Aircraft Data (BADA) Revisions 3.4 and 3.6. Traffic data for this study on the UK domestic routes and the intra-EU routes serving UK airports were obtained from the UK CAA traffic statistics (CAA, 1997, 2000, and 2006) allowing the calculation of load factors by airline and route. Data used in this analysis include over 10,000 records for nearly 1,700 routes and 60 aircraft types. The length of the flight is computed using the data the great circle distance and therefore does not model actual flight paths or account for air traffic delays or circuitous routings. The other main limitation of this modelling approach is that air cargo / freight is excluded from the analysis. While some airlines carry no freight (e.g. most of the low cost carriers), network carriers and regional carriers carry varying amounts of cargo and the model could be improved if cargo carriage was accounted for in the analysis, however, due to lack of consistent data this has not been possible.
_____________________________________________________________________________________________________
Page 11 www.omega.mmu.ac.uk
Figure 2: Calculation methodology
3.2 Intra-EU routes CO2 emission levels by route (and how they have changed over time) were investigated using the UK CAA data for intra-EU routes serving the UK (including UK domestic routes) for the years 1997, 2000 and 2006. Because of the emergence of LCCs and the expansion of the EU member states, the market saw significant growth over the nine year period. The number of passengers
_____________________________________________________________________________________________________
Page 12 www.omega.mmu.ac.uk
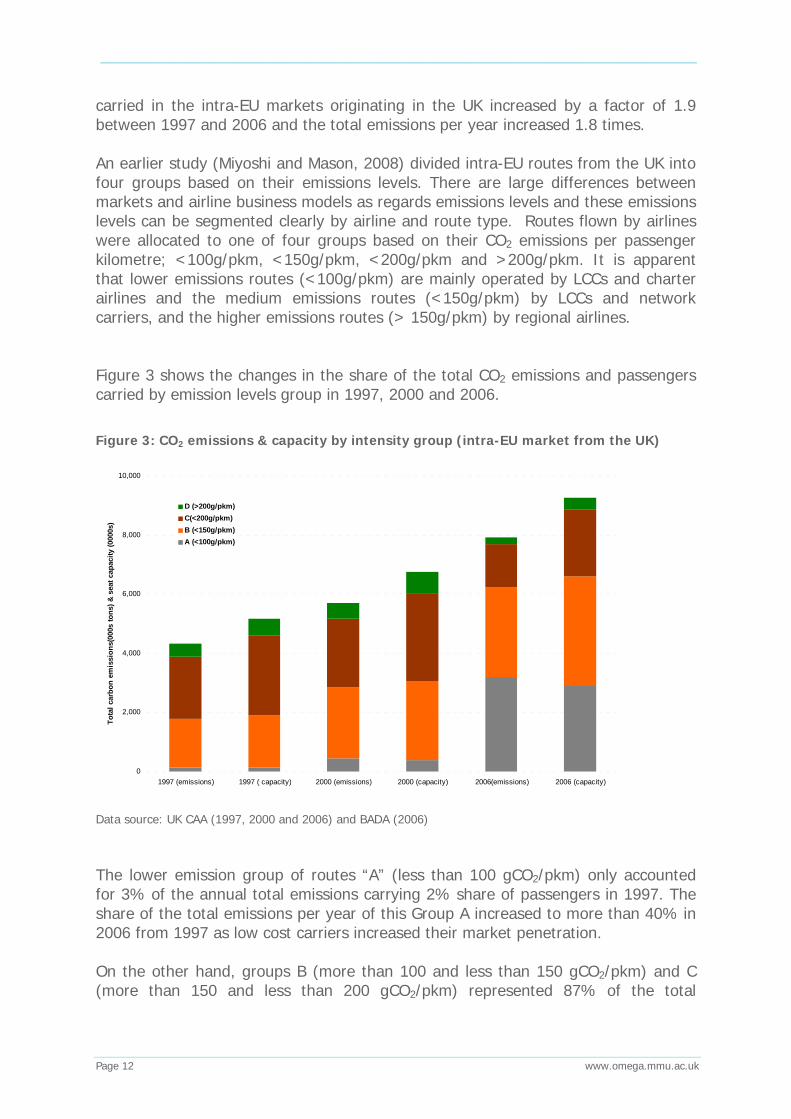
carried in the intra-EU markets originating in the UK increased by a factor of 1.9 between 1997 and 2006 and the total emissions per year increased 1.8 times. An earlier study (Miyoshi and Mason, 2008) divided intra-EU routes from the UK into four groups based on their emissions levels. There are large differences between markets and airline business models as regards emissions levels and these emissions levels can be segmented clearly by airline and route type. Routes flown by airlines were allocated to one of four groups based on their CO2 emissions per passenger kilometre; <100g/pkm, <150g/pkm, <200g/pkm and >200g/pkm. It is apparent that lower emissions routes (<100g/pkm) are mainly operated by LCCs and charter airlines and the medium emissions routes (<150g/pkm) by LCCs and network carriers, and the higher emissions routes (> 150g/pkm) by regional airlines. Figure 3 shows the changes in the share of the total CO2 emissions and passengers carried by emission levels group in 1997, 2000 and 2006.
Figure 3: CO2 emissions & capacity by intensity group (intra-EU market from the UK)
0
2,000
4,000
6,000
8,000
10,000
1997 (emissions) 1997 ( capacity) 2000 (emissions) 2000 (capacity) 2006(emissions) 2006 (capacity)
Tota
l car
bon
emis
sion
s(00
0s to
ns) &
sea
t cap
acity
(000
0s)
D (>200g/pkm)C(<200g/pkm)B (<150g/pkm)A (<100g/pkm)
Data source: UK CAA (1997, 2000 and 2006) and BADA (2006) The lower emission group of routes “A” (less than 100 gCO2/pkm) only accounted for 3% of the annual total emissions carrying 2% share of passengers in 1997. The share of the total emissions per year of this Group A increased to more than 40% in 2006 from 1997 as low cost carriers increased their market penetration. On the other hand, groups B (more than 100 and less than 150 gCO2/pkm) and C (more than 150 and less than 200 gCO2/pkm) represented 87% of the total
_____________________________________________________________________________________________________
Page 13 www.omega.mmu.ac.uk
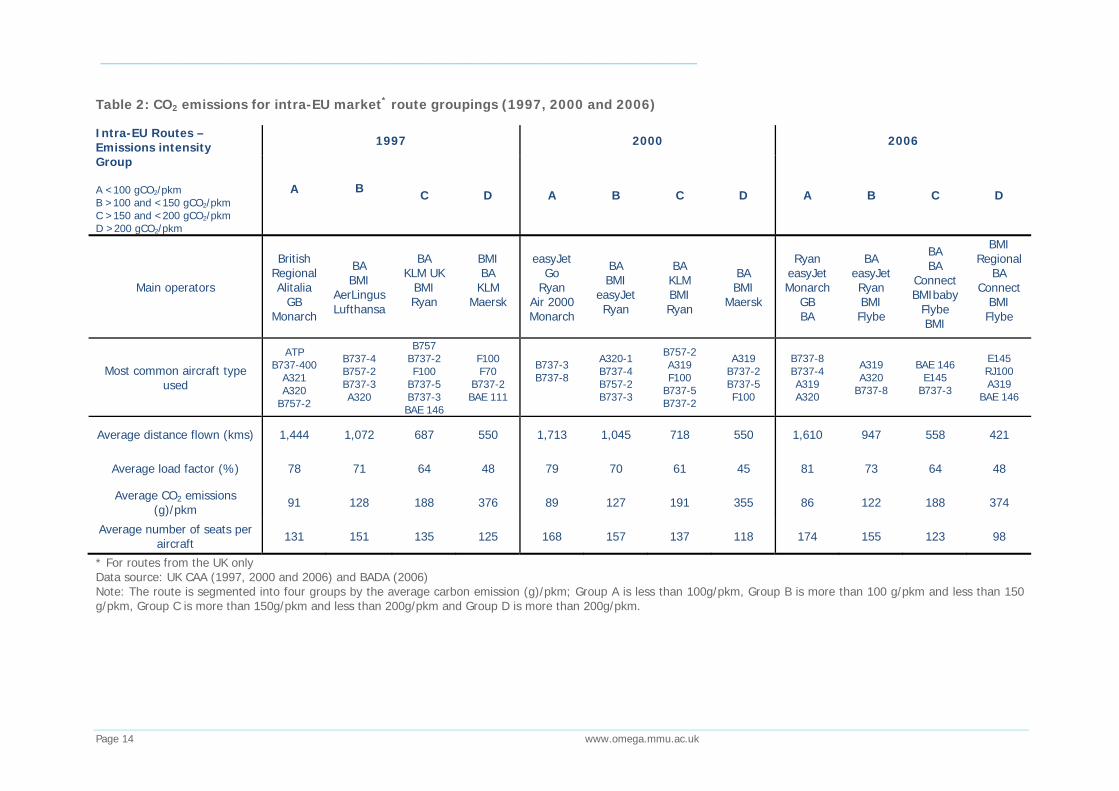
emissions in 1997 and 83% in 2000, but their combined share decreased to 57% in 2006. The higher emissions intensities in Group D (more than 200 gCO2/pkm) accounted for 10% of total emissions and passengers in 1997 and 2000 and fell to just 3% in 2006. The characteristics of each route group by year are shown in Table 2.
_____________________________________________________________________________________________________
Page 14 www.omega.mmu.ac.uk
Table 2: CO2 emissions for intra-EU market* route groupings (1997, 2000 and 2006)
Intra-EU Routes – Emissions intensity Group A <100 gCO2/pkm B >100 and <150 gCO2/pkm C >150 and <200 gCO2/pkm D >200 gCO2/pkm
1997 2000 2006
A
B C D A B C D A B C D
Main operators
British Regional Alitalia
GB Monarch
BA BMI
AerLingus Lufthansa
BA KLM UK
BMI Ryan
BMI BA
KLM Maersk
easyJet Go
Ryan Air 2000 Monarch
BA BMI
easyJet Ryan
BA KLM BMI Ryan
BA BMI
Maersk
Ryan easyJet Monarch
GB BA
BA easyJet Ryan BMI Flybe
BA BA
Connect BMIbaby
Flybe BMI
BMI Regional
BA Connect
BMI Flybe
Most common aircraft type used
ATP B737-400
A321 A320
B757-2
B737-4 B757-2 B737-3 A320
B757 B737-2 F100
B737-5 B737-3 BAE 146
F100 F70
B737-2 BAE 111
B737-3 B737-8
A320-1 B737-4 B757-2 B737-3
B757-2 A319 F100
B737-5 B737-2
A319 B737-2 B737-5 F100
B737-8 B737-4 A319 A320
A319 A320
B737-8
BAE 146 E145
B737-3
E145 RJ100 A319
BAE 146
Average distance flown (kms) 1,444 1,072 687 550 1,713 1,045 718 550 1,610 947 558 421
Average load factor (%) 78 71 64 48 79 70 61 45 81 73 64 48
Average CO2 emissions (g)/pkm 91 128 188 376 89 127 191 355 86 122 188 374
Average number of seats per aircraft 131 151 135 125 168 157 137 118 174 155 123 98
* For routes from the UK only Data source: UK CAA (1997, 2000 and 2006) and BADA (2006) Note: The route is segmented into four groups by the average carbon emission (g)/pkm; Group A is less than 100g/pkm, Group B is more than 100 g/pkm and less than 150 g/pkm, Group C is more than 150g/pkm and less than 200g/pkm and Group D is more than 200g/pkm.
_____________________________________________________________________________________________________
Page 15 www.omega.mmu.ac.uk
In 2006, Group A was mainly operated by low cost carriers (LCCs) and charter airlines with high load factors (average: 81%) and its average stage distance flown covers the range from 1,600 to 2,500 kms. This group of consisted of routes operated by Ryanair (49%), easyJet (25%) and others. However, in 1997, lower emission intensity group A (less than 100 gCO2/pkms) accounted for only 3% of the total emissions carrying 2% share of passengers. This group were mainly operated by airlines which had relatively long distance routes from UK airports such as British Regional, Alitalia, GB Airways and Monarch. The total capacity shares of LCCs (Ryanair and easyJet) were very small (5% of the routes in the grouping). By 2000, however, the situation had changed. 56% of Group A routes were operated by LCCs (easyJet: 24%, Ryanair: 19% and Go 13%) and charter airlines (Air2000: 10%). Across all groups the average distance flown and the number of seats per aircraft increased from 1997 to 2006 except those in Group D. Routes in Groups D and C with shorter sector length and higher frequencies, however, tend to be in competition with surface transportation suggesting that travellers using suitable surface mode transportation where available may avoid the highest emissions airline services. Furthermore, high frequency operations that target business travellers are apt to lead to the lower load factors in these groups leading to higher emissions per passenger. The analysis shows that across the three time periods, the proportion of flights in the lower emission group have increased dramatically, particularly as low cost carriers have grown. The changes to the structure of the airline industry in terms of proportion of flights served by airlines of different business model has been highlighted in this section and the next section focuses on the changes in emissions levels by these different business models.
3.3 Business models
In order to investigate the differences among the airline business models, the intra-EU market, which has been shown to have grown substantially since 1997, is analysed. In this analysis four airline business models are considered:
• Network carriers: These are mainly former flag carriers of the EU Member States that maintain hub and spoke networks, consolidating traffic at key hub airports.
• Charter airlines: Traditionally these airlines have carried passengers at low unit costs, targeting holiday travellers. Most European charter airlines now form part of vertically integrated organisations incorporating a tour operator, travel agency chain, airline and, often hotels and providers of ground transportation (Williams, 2001). Several charter airlines offer scheduled and seat only services as a result of competition with LCCs.
• Low cost carriers: This business model has evolved in different directions, some airlines keeping to a more solid model involving low frequency services
_____________________________________________________________________________________________________
Page 16 www.omega.mmu.ac.uk
to secondary airport, others adapting to the higher-yielding business market serving higher frequencies.
• Regional airlines: These carriers tend to operate shorter sectors both point to point and feeding network carrier hubs, usually with aircraft of less than 100 seats (Cranfield University, 2008).
The list of airlines by business model is shown in Appendix A.
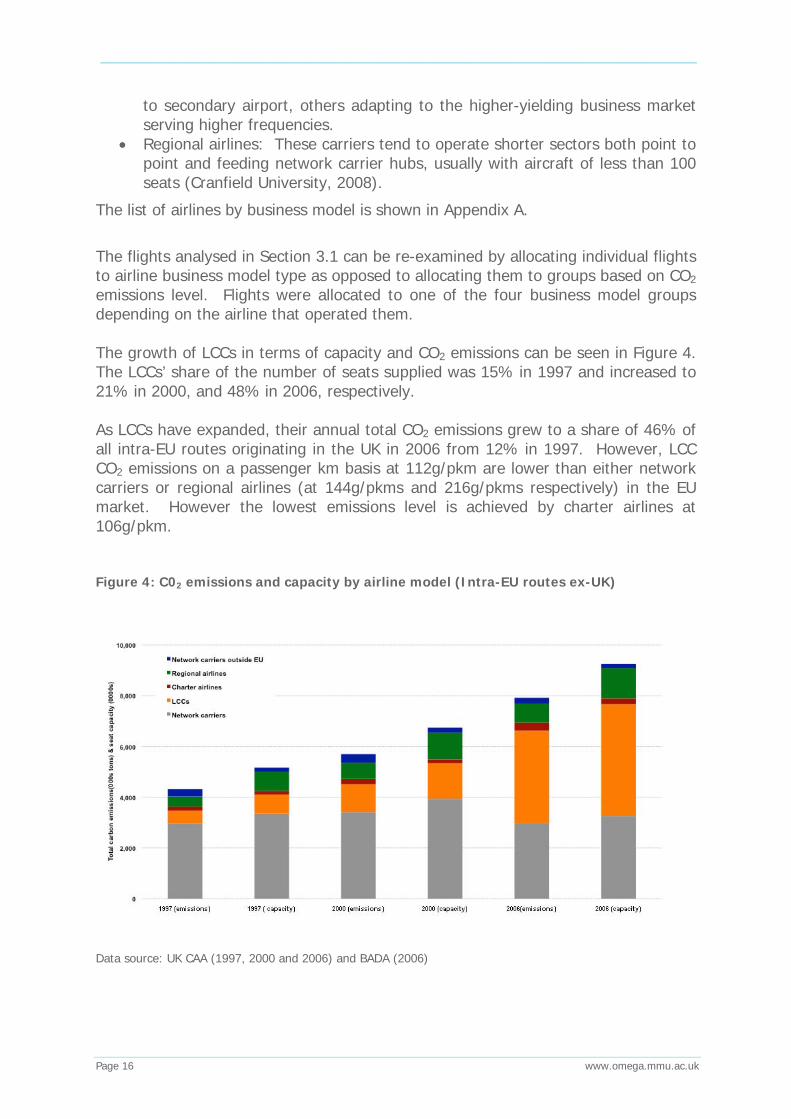
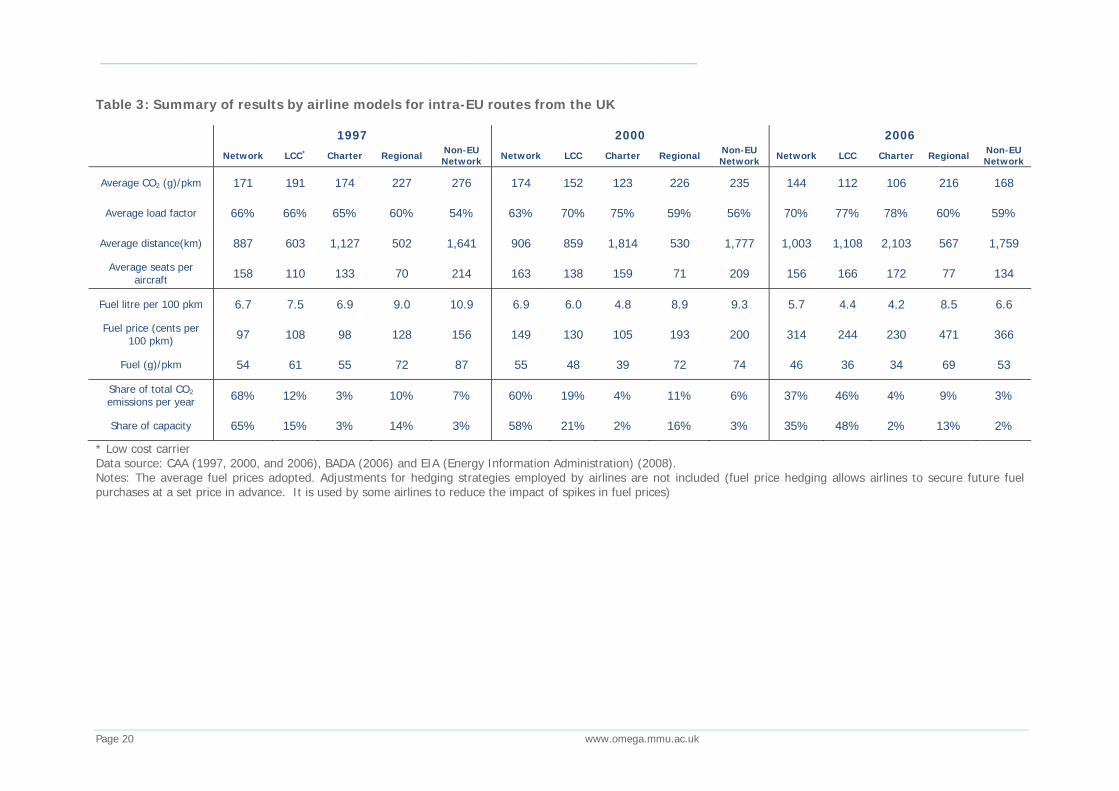
The flights analysed in Section 3.1 can be re-examined by allocating individual flights to airline business model type as opposed to allocating them to groups based on CO2 emissions level. Flights were allocated to one of the four business model groups depending on the airline that operated them. The growth of LCCs in terms of capacity and CO2 emissions can be seen in Figure 4. The LCCs’ share of the number of seats supplied was 15% in 1997 and increased to 21% in 2000, and 48% in 2006, respectively. As LCCs have expanded, their annual total CO2 emissions grew to a share of 46% of all intra-EU routes originating in the UK in 2006 from 12% in 1997. However, LCC CO2 emissions on a passenger km basis at 112g/pkm are lower than either network carriers or regional airlines (at 144g/pkms and 216g/pkms respectively) in the EU market. However the lowest emissions level is achieved by charter airlines at 106g/pkm. Figure 4: C02 emissions and capacity by airline model (Intra-EU routes ex-UK)
Data source: UK CAA (1997, 2000 and 2006) and BADA (2006)
_____________________________________________________________________________________________________
Page 17 www.omega.mmu.ac.uk
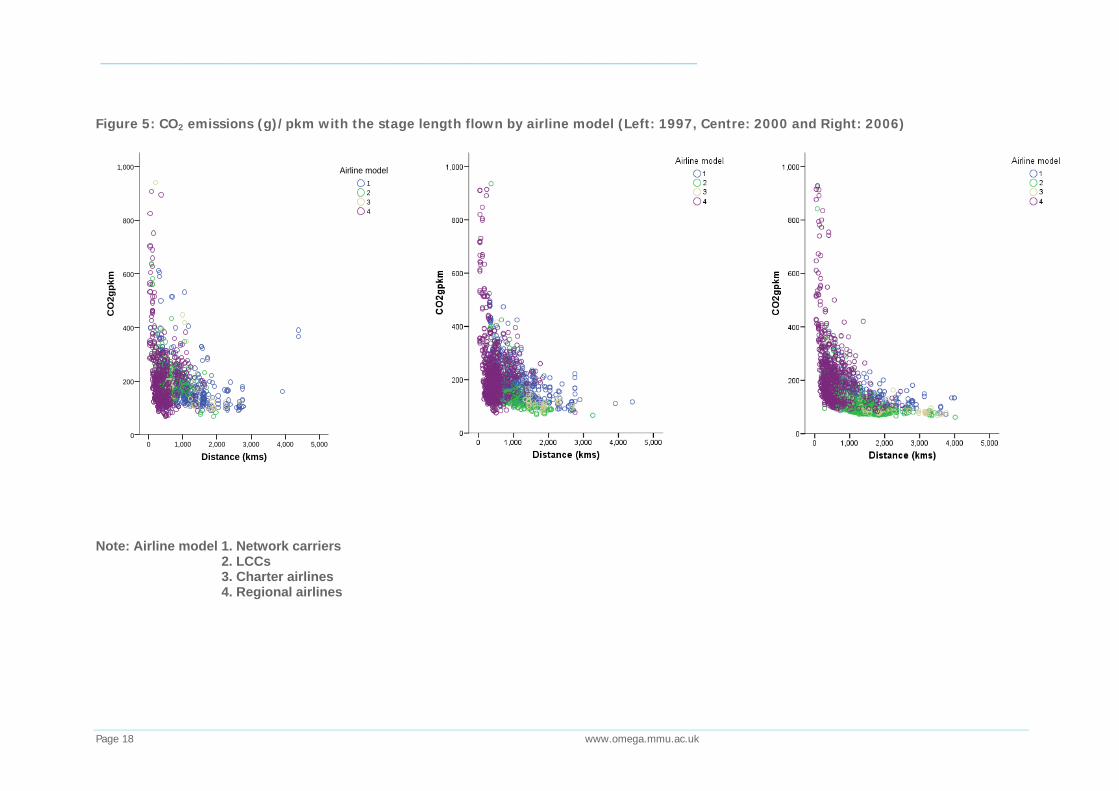
The impact of differences in operation (particularly single cabin and higher load factors) is shown in Figures 5, 6 and Table 3. Figure 5 depicts the differences of CO2 emissions by stage length for the years 1997, 2000 and 2006. The CO2 emissions per passenger kilometre for all airline business models fell between from 1997 to 2006 as the stage length increased, this was particularly true for LCCs where their gCO2/pkm fell from 191 in 1997 to 112 in 2006. Improvements in load factors have contributed to lower CO2 emissions per passenger kilometre. The average number of seats by aircraft is shown in Figure 6. Lower CO2 emissions per passenger are achieved by increasing load factor, increasing the number of seats per aircraft and stage distance. Similar findings are demonstrated in the regional aircraft study in the US using the energy intensity (Babikian et al, 2001; Lee et al, 2004).
_____________________________________________________________________________________________________
Page 18 www.omega.mmu.ac.uk
Figure 5: CO2 emissions (g)/pkm with the stage length flown by airline model (Left: 1997, Centre: 2000 and Right: 2006)
Distance (kms)5,0004,0003,0002,0001,0000
CO
2gpk
m
1,000
800
600
400
200
0
4321
Airline model
Note: Airline model 1. Network carriers 2. LCCs 3. Charter airlines 4. Regional airlines

_____________________________________________________________________________________________________
Page 19 www.omega.mmu.ac.uk
Figure 6: Average numbers of seats per aircraft with stage length by airline model (Left: 1997, Centre: 2000 and Right: 2006)
Note: Airline model 1. Network carriers 2. LCCs 3. Charter airlines 4. Regional airlines
_____________________________________________________________________________________________________
Page 20 www.omega.mmu.ac.uk
Table 3: Summary of results by airline models for intra-EU routes from the UK
1997 2000 2006
Network LCC* Charter Regional Non-EU Network Network LCC Charter Regional Non-EU
Network Network LCC Charter Regional Non-EU Network
Average CO2 (g)/pkm 171 191 174 227 276 174 152 123 226 235 144 112 106 216 168
Average load factor 66% 66% 65% 60% 54% 63% 70% 75% 59% 56% 70% 77% 78% 60% 59%
Average distance(km) 887 603 1,127 502 1,641 906 859 1,814 530 1,777 1,003 1,108 2,103 567 1,759
Average seats per aircraft 158 110 133 70 214 163 138 159 71 209 156 166 172 77 134
Fuel litre per 100 pkm 6.7 7.5 6.9 9.0 10.9 6.9 6.0 4.8 8.9 9.3 5.7 4.4 4.2 8.5 6.6
Fuel price (cents per 100 pkm) 97 108 98 128 156 149 130 105 193 200 314 244 230 471 366
Fuel (g)/pkm 54 61 55 72 87 55 48 39 72 74 46 36 34 69 53
Share of total CO2 emissions per year 68% 12% 3% 10% 7% 60% 19% 4% 11% 6% 37% 46% 4% 9% 3%
Share of capacity 65% 15% 3% 14% 3% 58% 21% 2% 16% 3% 35% 48% 2% 13% 2%
* Low cost carrier Data source: CAA (1997, 2000, and 2006), BADA (2006) and EIA (Energy Information Administration) (2008). Notes: The average fuel prices adopted. Adjustments for hedging strategies employed by airlines are not included (fuel price hedging allows airlines to secure future fuel purchases at a set price in advance. It is used by some airlines to reduce the impact of spikes in fuel prices)

_____________________________________________________________________________________________________
Page 21 www.omega.mmu.ac.uk
Consequently, the distinct characteristics of airlines models can be more clearly discerned in 2006 compared to those of 1997 in terms of CO22 emissions levels. Table 3 shows that average fuel consumption (litres per 100kms) has improved for all airlines models. However, when the fuel cost is converted into the average fuel price (cents per 100 pkms) in each year, the fuel cost has increased significantly since 1997, particularly for charter airlines and regional airlines. Although average LCCs’ fuel cost was relatively lower than other airlines models in the intra-EU market, fuel consumption (litre per 100 pkms) by network carriers across their entire network (see Table 1) is lower (4.3-5.5 litre per 100pkms), as these figures incorporate these carriers’ long haul inter-continental flights. Fuel represents a very large proportion of direct operating costs for LCCs and regional airlines and therefore these carriers are exposed to a higher level of exposure to fuel price volatility than network carriers and changes in fuel prices can have a more marked effect on their financial performance. Furthermore, a higher proportion of LCCs and charter airlines passengers are leisure passengers and these passengers are more likely to reduce their travelling behaviour in times of financial pressure. In the early stage of liberal air markets in 1997, no significant differences were found between airlines and airline business models in terms of carbon dioxide emissions, average load factors, distance flown, and aircraft type used. Several LCCs have subsequently disappeared. The LCCs that have survived have focused on a common aircraft type and high density operations, mainly from secondary airports. However, network carriers and LCCs often compete on the same routes and for the same segments, and in these markets LCCs’ CO2 emissions are generally lower than those of network carriers. Network carriers have tried to maximise their operational efficiency in the past decade by adopting some of the practices of the LCC model. As a result, these airlines’ CO2 emissions performance has improved significantly. Further analysis of the emissions data for 1997, 2000 and 2006 can be found in Appendix B. In this appendix a discriminant analysis of the data is performed. The results of this analysis show that the three principal reasons for the increase in fuel efficiency in the market are. 1) Network airlines facing increased competition from LCCs leading to adoption
of more fuel efficient operations for both segments 2) A fall in demand after 9/11 and fuel price volatility 3) The expansion of the EU to new markets leading to longer sector lengths
_____________________________________________________________________________________________________
Page 22 www.omega.mmu.ac.uk
4.0 Key drivers of airline environmental performance
This section investigates the impacts on carbon emission efficiency of seats on an aircraft, load factor and sector distance using a log liner model for airline data of 2006.
4.1 Model specification and data used
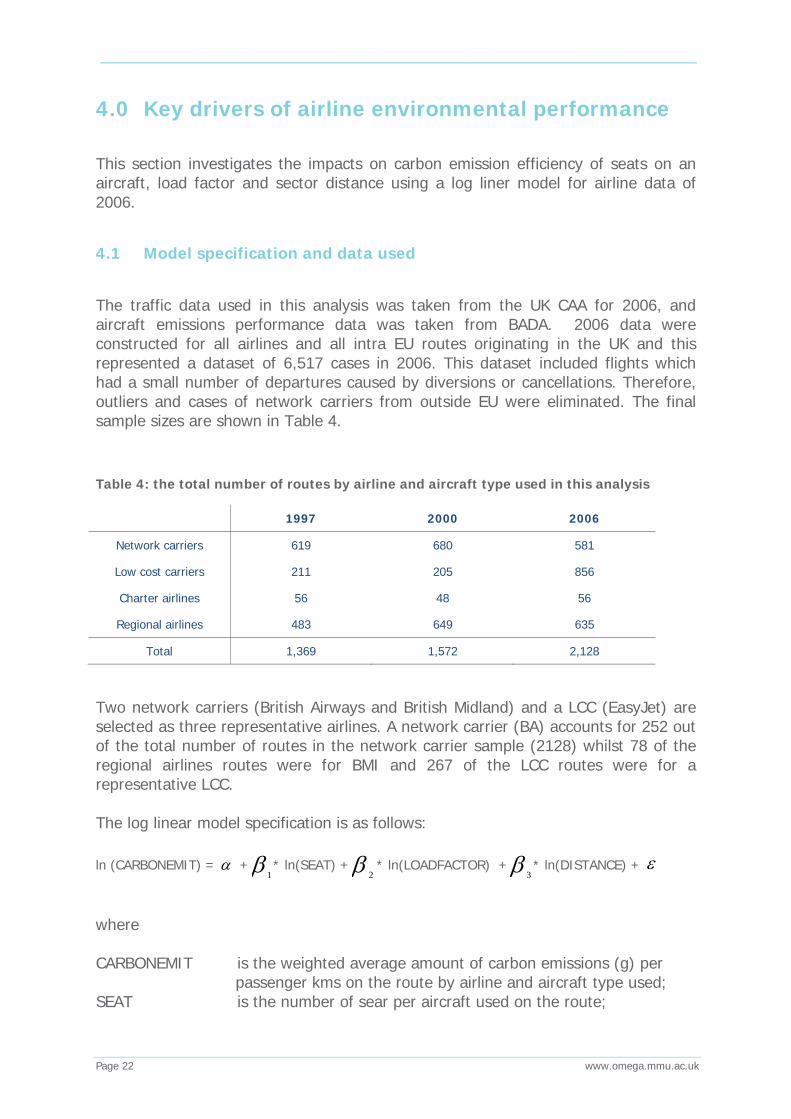
The traffic data used in this analysis was taken from the UK CAA for 2006, and aircraft emissions performance data was taken from BADA. 2006 data were constructed for all airlines and all intra EU routes originating in the UK and this represented a dataset of 6,517 cases in 2006. This dataset included flights which had a small number of departures caused by diversions or cancellations. Therefore, outliers and cases of network carriers from outside EU were eliminated. The final sample sizes are shown in Table 4.
Table 4: the total number of routes by airline and aircraft type used in this analysis
1997 2000 2006
Network carriers 619 680 581
Low cost carriers 211 205 856
Charter airlines 56 48 56
Regional airlines 483 649 635
Total 1,369 1,572 2,128
Two network carriers (British Airways and British Midland) and a LCC (EasyJet) are selected as three representative airlines. A network carrier (BA) accounts for 252 out of the total number of routes in the network carrier sample (2128) whilst 78 of the regional airlines routes were for BMI and 267 of the LCC routes were for a representative LCC. The log linear model specification is as follows: ln (CARBONEMIT) = α +β 1
* ln(SEAT) +β 2* ln(LOADFACTOR) +β 3
* ln(DISTANCE) + ε
where CARBONEMIT is the weighted average amount of carbon emissions (g) per passenger kms on the route by airline and aircraft type used; SEAT is the number of sear per aircraft used on the route;
_____________________________________________________________________________________________________
Page 23 www.omega.mmu.ac.uk
LOADFACTOR is weighted average load factor on the route by airline and aircraft type used;
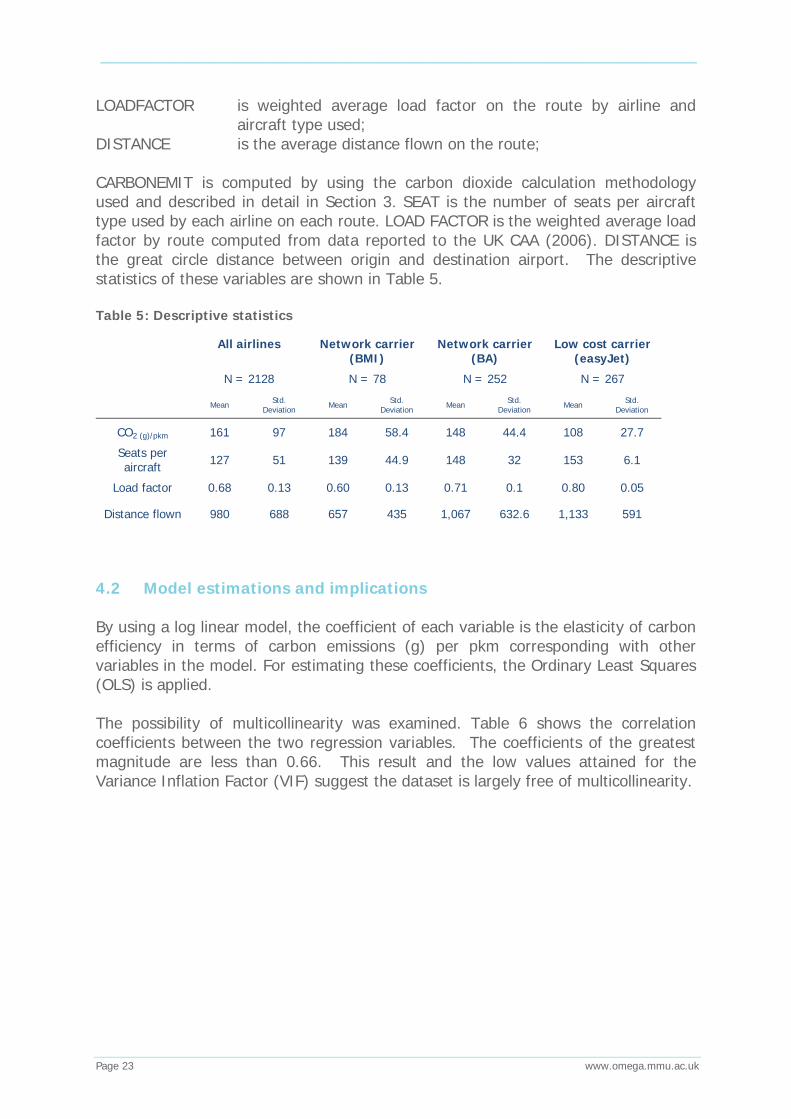
DISTANCE is the average distance flown on the route; CARBONEMIT is computed by using the carbon dioxide calculation methodology used and described in detail in Section 3. SEAT is the number of seats per aircraft type used by each airline on each route. LOAD FACTOR is the weighted average load factor by route computed from data reported to the UK CAA (2006). DISTANCE is the great circle distance between origin and destination airport. The descriptive statistics of these variables are shown in Table 5. Table 5: Descriptive statistics
All airlines Network carrier (BMI)
Network carrier (BA)
Low cost carrier (easyJet)
N = 2128 N = 78 N = 252 N = 267
Mean Std. Deviation Mean Std.
Deviation Mean Std. Deviation Mean Std.
Deviation
CO2 (g)/pkm 161 97 184 58.4 148 44.4 108 27.7
Seats per aircraft 127 51 139 44.9 148 32 153 6.1
Load factor 0.68 0.13 0.60 0.13 0.71 0.1 0.80 0.05
Distance flown 980 688 657 435 1,067 632.6 1,133 591
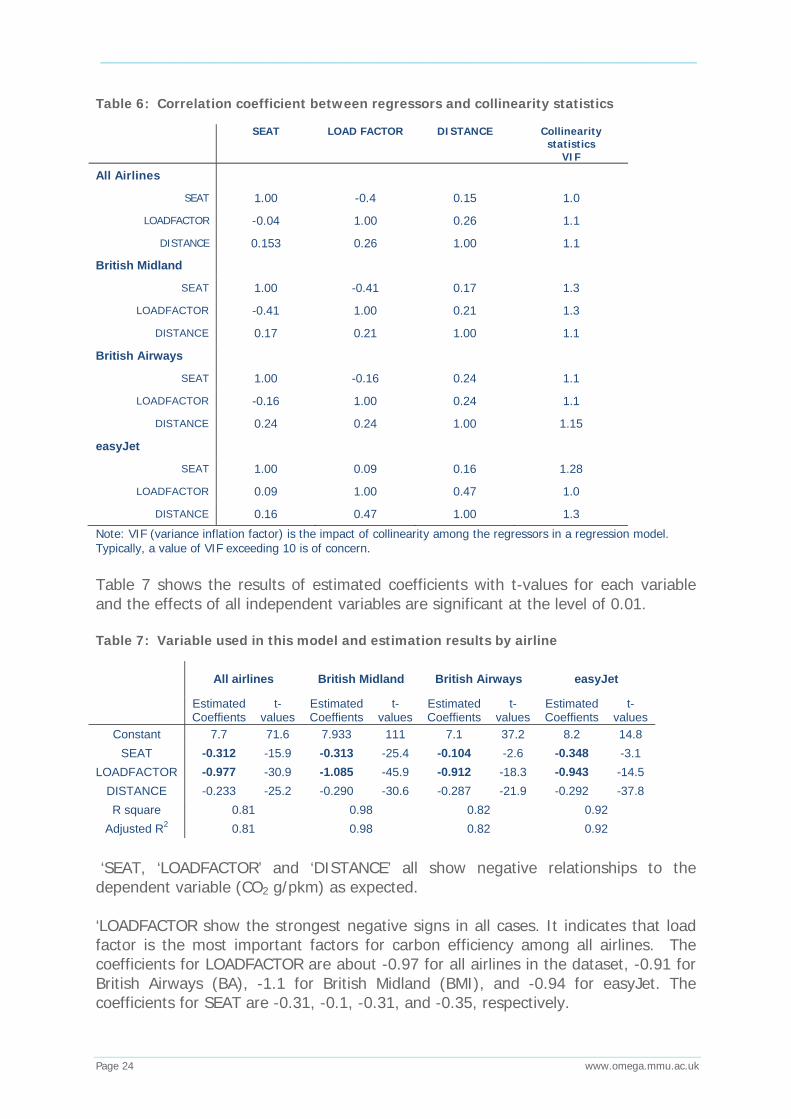
4.2 Model estimations and implications By using a log linear model, the coefficient of each variable is the elasticity of carbon efficiency in terms of carbon emissions (g) per pkm corresponding with other variables in the model. For estimating these coefficients, the Ordinary Least Squares (OLS) is applied. The possibility of multicollinearity was examined. Table 6 shows the correlation coefficients between the two regression variables. The coefficients of the greatest magnitude are less than 0.66. This result and the low values attained for the Variance Inflation Factor (VIF) suggest the dataset is largely free of multicollinearity.
_____________________________________________________________________________________________________
Page 24 www.omega.mmu.ac.uk
Table 6: Correlation coefficient between regressors and collinearity statistics
SEAT LOAD FACTOR DISTANCE Collinearity
statistics VIF
All Airlines
SEAT 1.00 -0.4 0.15 1.0
LOADFACTOR -0.04 1.00 0.26 1.1
DISTANCE 0.153 0.26 1.00 1.1
British Midland
SEAT 1.00 -0.41 0.17 1.3
LOADFACTOR -0.41 1.00 0.21 1.3
DISTANCE 0.17 0.21 1.00 1.1
British Airways
SEAT 1.00 -0.16 0.24 1.1
LOADFACTOR -0.16 1.00 0.24 1.1
DISTANCE 0.24 0.24 1.00 1.15
easyJet
SEAT 1.00 0.09 0.16 1.28
LOADFACTOR 0.09 1.00 0.47 1.0
DISTANCE 0.16 0.47 1.00 1.3 Note: VIF (variance inflation factor) is the impact of collinearity among the regressors in a regression model. Typically, a value of VIF exceeding 10 is of concern. Table 7 shows the results of estimated coefficients with t-values for each variable and the effects of all independent variables are significant at the level of 0.01. Table 7: Variable used in this model and estimation results by airline
All airlines British Midland British Airways easyJet
Estimated Coeffients
t-values
Estimated Coeffients
t-values
Estimated Coeffients
t-values
Estimated Coeffients
t-values
Constant 7.7 71.6 7.933 111 7.1 37.2 8.2 14.8 SEAT -0.312 -15.9 -0.313 -25.4 -0.104 -2.6 -0.348 -3.1
LOADFACTOR -0.977 -30.9 -1.085 -45.9 -0.912 -18.3 -0.943 -14.5 DISTANCE -0.233 -25.2 -0.290 -30.6 -0.287 -21.9 -0.292 -37.8 R square 0.81 0.98 0.82 0.92
Adjusted R2 0.81 0.98 0.82 0.92
‘SEAT, ‘LOADFACTOR’ and ‘DISTANCE’ all show negative relationships to the dependent variable (CO2 g/pkm) as expected. ‘LOADFACTOR show the strongest negative signs in all cases. It indicates that load factor is the most important factors for carbon efficiency among all airlines. The coefficients for LOADFACTOR are about -0.97 for all airlines in the dataset, -0.91 for British Airways (BA), -1.1 for British Midland (BMI), and -0.94 for easyJet. The coefficients for SEAT are -0.31, -0.1, -0.31, and -0.35, respectively.
_____________________________________________________________________________________________________
Page 25 www.omega.mmu.ac.uk
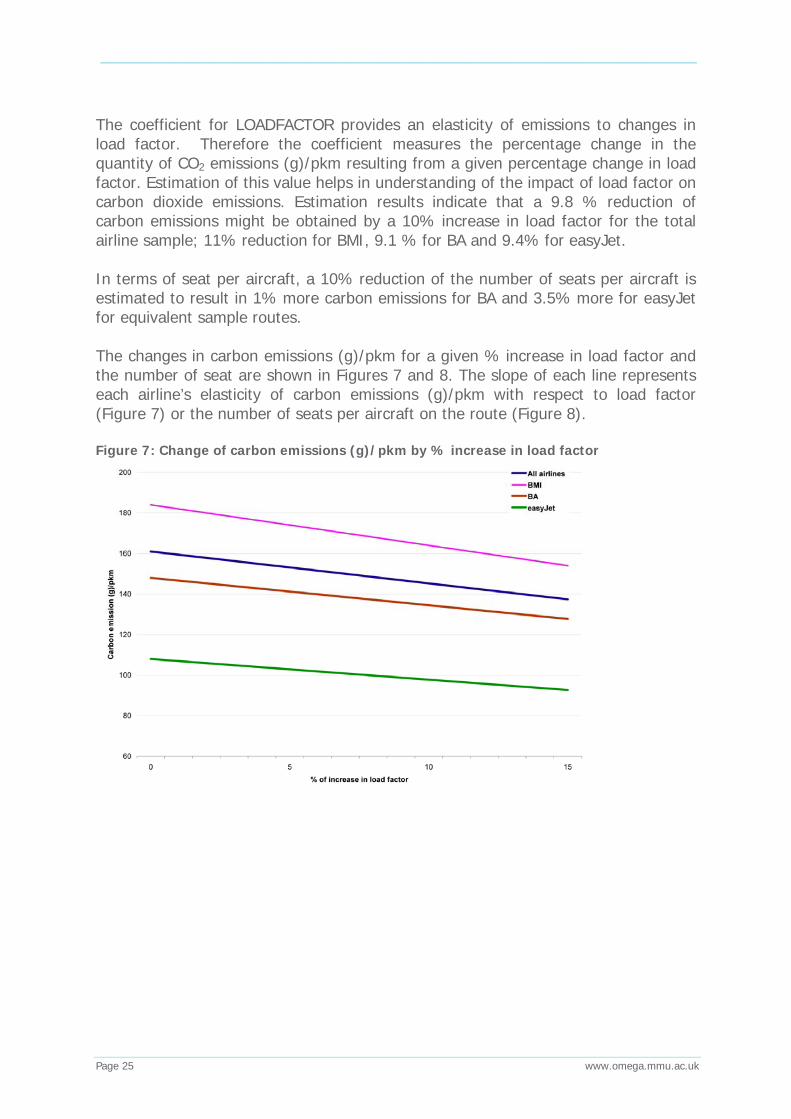
The coefficient for LOADFACTOR provides an elasticity of emissions to changes in load factor. Therefore the coefficient measures the percentage change in the quantity of CO2 emissions (g)/pkm resulting from a given percentage change in load factor. Estimation of this value helps in understanding of the impact of load factor on carbon dioxide emissions. Estimation results indicate that a 9.8 % reduction of carbon emissions might be obtained by a 10% increase in load factor for the total airline sample; 11% reduction for BMI, 9.1 % for BA and 9.4% for easyJet. In terms of seat per aircraft, a 10% reduction of the number of seats per aircraft is estimated to result in 1% more carbon emissions for BA and 3.5% more for easyJet for equivalent sample routes. The changes in carbon emissions (g)/pkm for a given % increase in load factor and the number of seat are shown in Figures 7 and 8. The slope of each line represents each airline’s elasticity of carbon emissions (g)/pkm with respect to load factor (Figure 7) or the number of seats per aircraft on the route (Figure 8). Figure 7: Change of carbon emissions (g)/pkm by % increase in load factor

_____________________________________________________________________________________________________
Page 26 www.omega.mmu.ac.uk
Figure 8: Change of carbons emission (g)/pkm by % increase in the number of seats
These figures suggest that the impact of increasing load factor is higher than that of increasing the number of seats in leading to per passenger reductions in carbon dioxide emissions. Figure 9: The amount of reduction of carbon emissions (g)/pkm estimated for a 5% increase in load factor (left) and the number of seat (right) respectively
0
2
4
6
8
10
12
All airlines BMI BA easyJet
Red
uctio
n of
Car
bon
emis
sion
(g)/p
km
Load factor
The number of seat per aircraft
The reduction of emissions in response to a percentage increase in load factor and seating is show in Figure 9. In all cases, airlines have more opportunity to reduce
_____________________________________________________________________________________________________
Page 27 www.omega.mmu.ac.uk
carbon emissions (g)/pkm by increasing load factor than the number of seat per aircraft. Airlines which have higher elasticity with respect to load factor have greater opportunity to achieve lower CO2 g/pkm emissions. Those airlines with lower elasticities have perhaps already achieved greater levels of carbon efficiency and therefore have less opportunity to make further improvements. Interestingly, the impact on emissions of increasing the number of seats is lower for British Airways than for the other airlines investigated (Figure 9). British Airways operates the bigger aircraft (B757, B767) on the routes (15% of the total number of departures). Clearly, the total amount of CO2 emissions per flight are higher for larger aircraft compared to those of narrow body aircraft, in particular, on short haul sectors. However, the literature suggests that larger aircraft have lower environmental cost per passenger than smaller aircraft (Peeters et al, 2005). Givoni and Rieveld (2009) compare the environmental cost from aircraft emissions on a 500nm flight by aircraft type using the number of seat per aircraft. They conclude that there are no large economies of scale, in terms of environmental impact, in aircraft operation on short / medium haul sectors. These studies are based on the number of seats per aircraft. Therefore, the carbon emissions (g) per passenger km of large aircraft are higher than those of narrow body aircraft on the short/medium haul route unless load factor is sufficiently high. For improving the carbon emissions on the large aircraft, first of all, it is important to improve load factor in order to maximize its capacity efficiency. British Airways operates larger aircraft (B757 and B767) on routes more than 1,000 kms to 2,000kms and narrow body aircraft on the route less than about 1,000kms with higher frequency in order to feed their hub and spoke network.
4.3 Aircraft weight reduction strategies
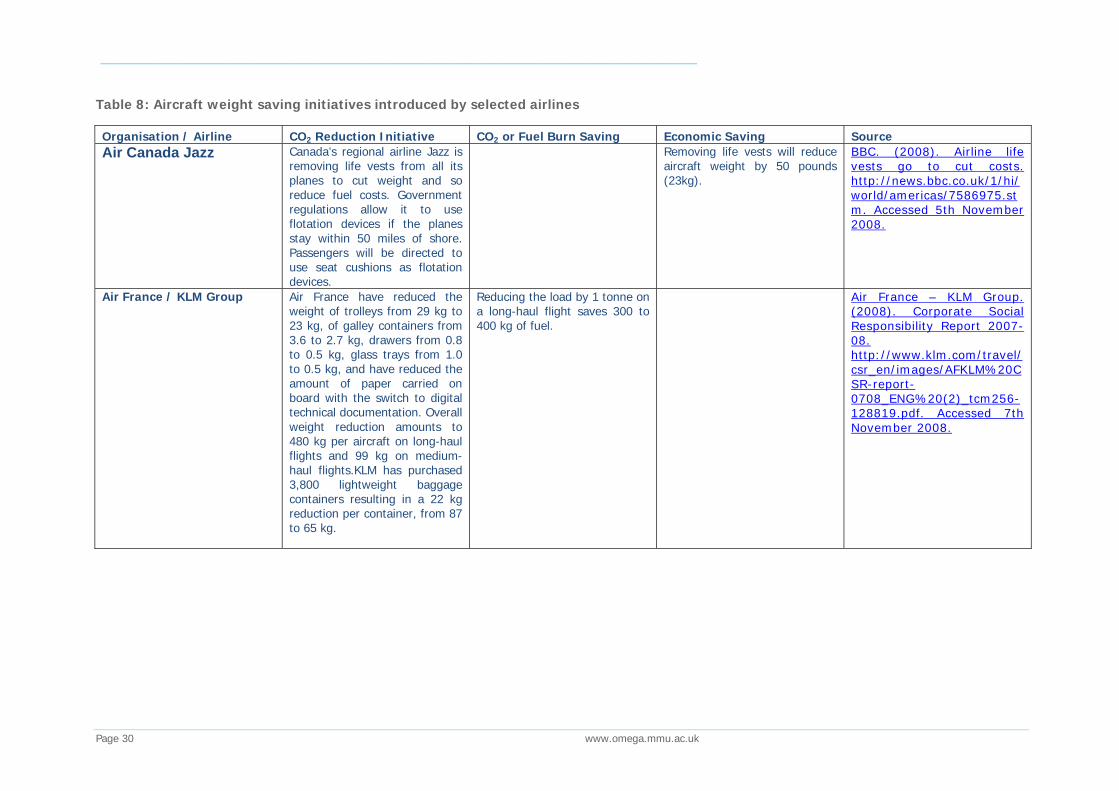
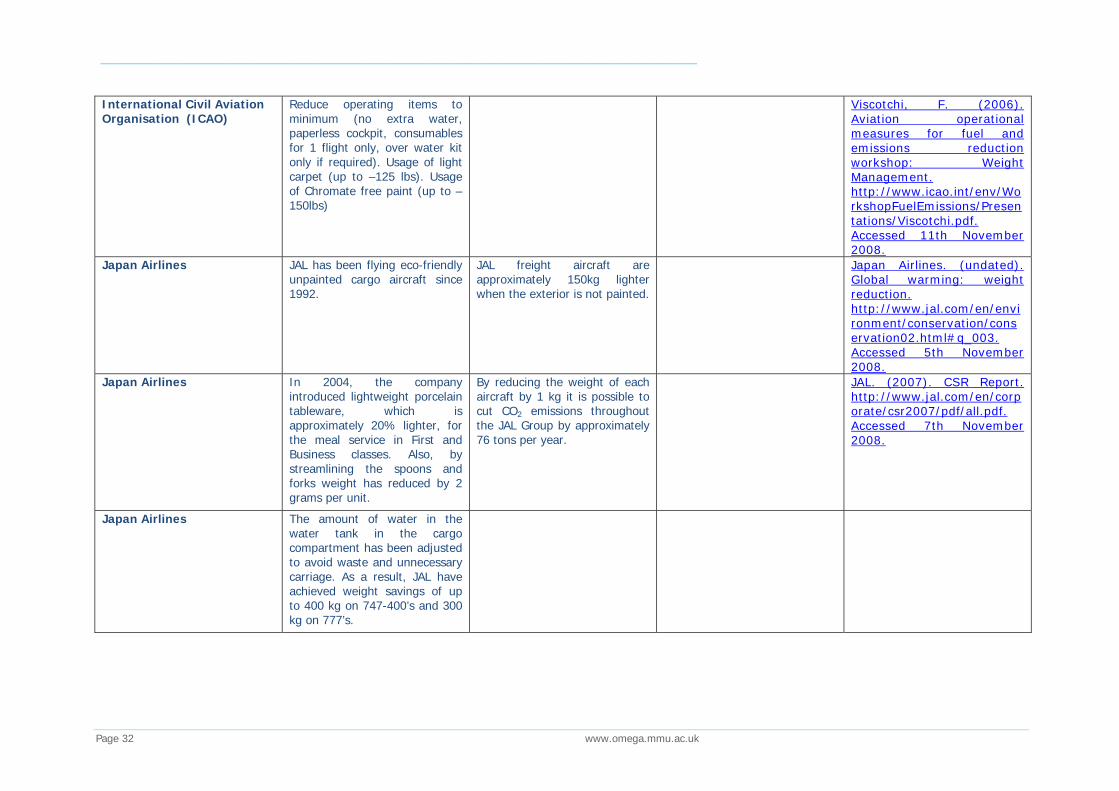
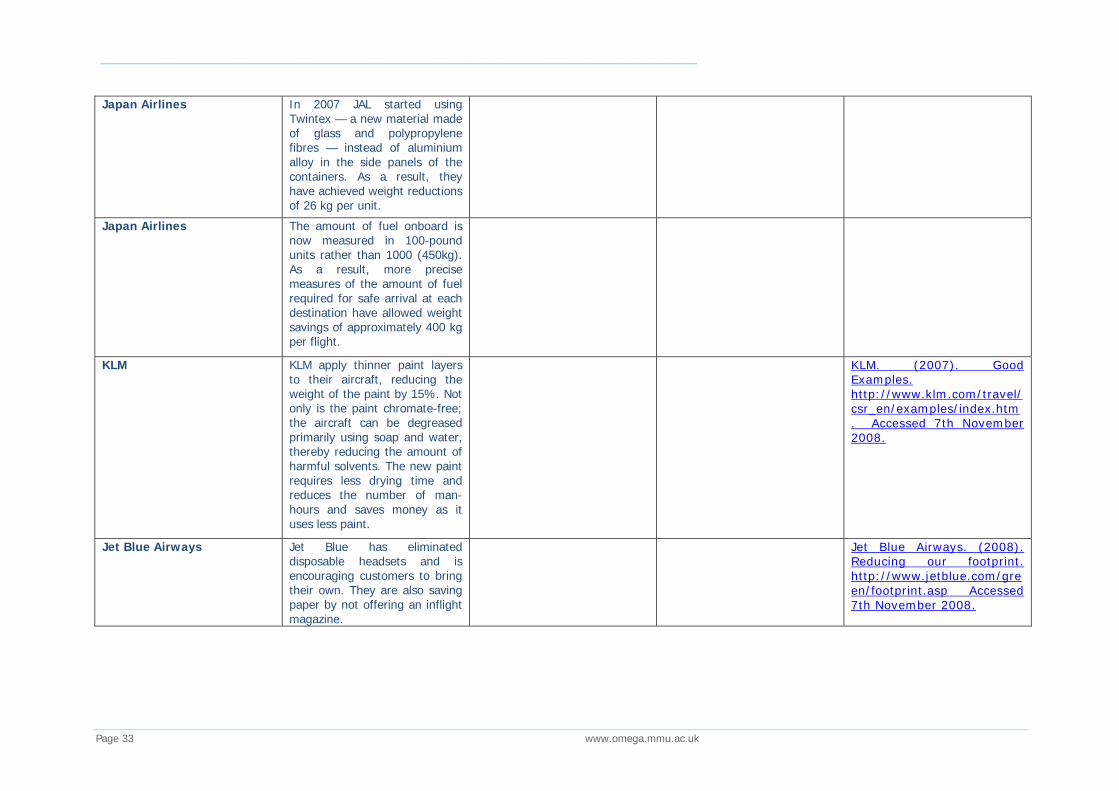
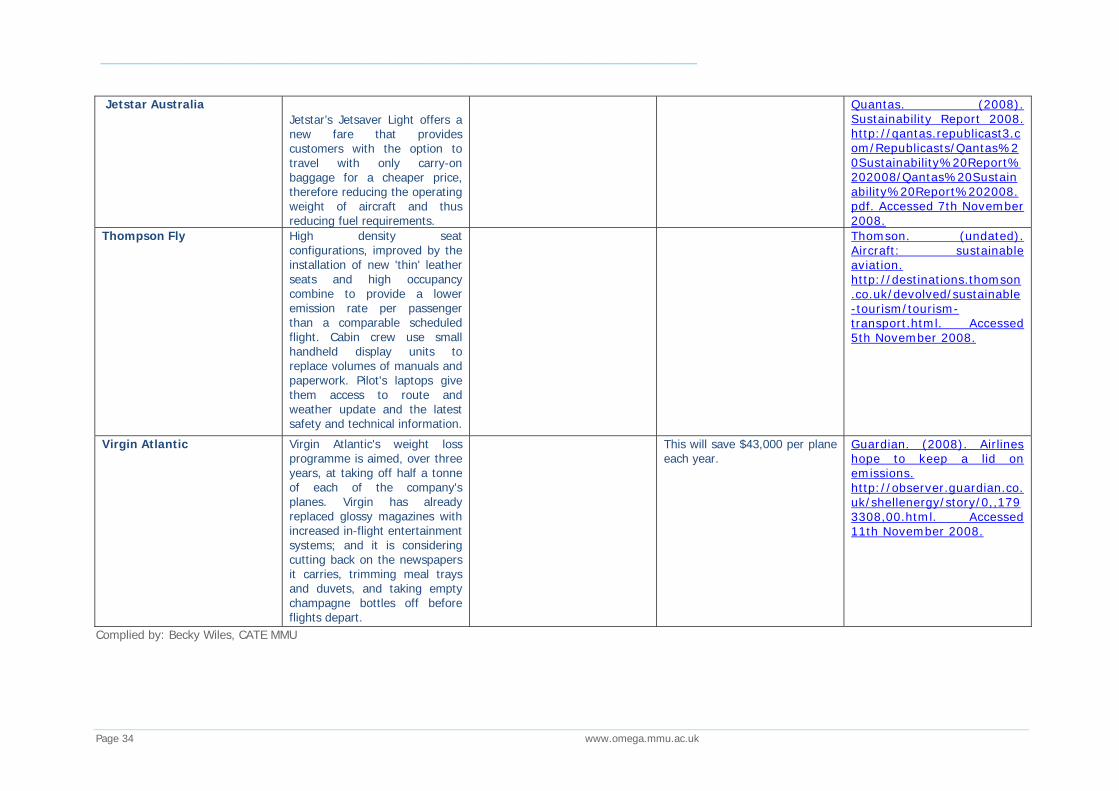
One way airlines of any business model type can reduce their flight-related carbon footprint is to remove unnecessary weight from their aircraft and thus reduce fuel burn. Airlines can reduce weight in many ways. Table 8 lists some of the activities that airlines have undertaken in recent years to reduce on-board weight. These include lighter cutlery and porcelain, using fewer catering trolleys, using lighter materials in external paint, seat frames, seat covers, and carpets, removing in-flight magazines, and replacing flight deck paper-based manuals with computer-based electronic manuals. Reducing excessive fuel reserves is one, although clearly pilots would never jeopardise airline safety in this area.
The impact of the removal any weight from an aircraft’s payload has a direct impact the fuel burned during the flight. There are many factors that will affect how much fuel will be saved by removing a set amount of weight from an individual flight, however, Poll’s first theorem (2008) on aircraft fuel burn, which is independent of
_____________________________________________________________________________________________________
Page 28 www.omega.mmu.ac.uk
aircraft type, and can be used to estimate the fuel saving per sector for a given weight saving.
MTO = MOW + MP + MMF + (Mfres + Mftank)
MTO = (MOE + MP + MMF + Mftank)/(1-0.048)
Where:
MOE = operational empty mass (no fuel and no payload) MP = mass of payload (less than or equal to max payload
MMP) MMF = mission fuel (fuel actual used on flight) MFres = reserve fuel (JAA rules are that the minimum reserve
fuel should be 4.8% of the MTO) MFtank = fuel carried but not burned MFres+MFtank = fuel carried but not consumed MTO = take-off mass (<or equal to max T/O mass MMTO) Source: Poll (2008)
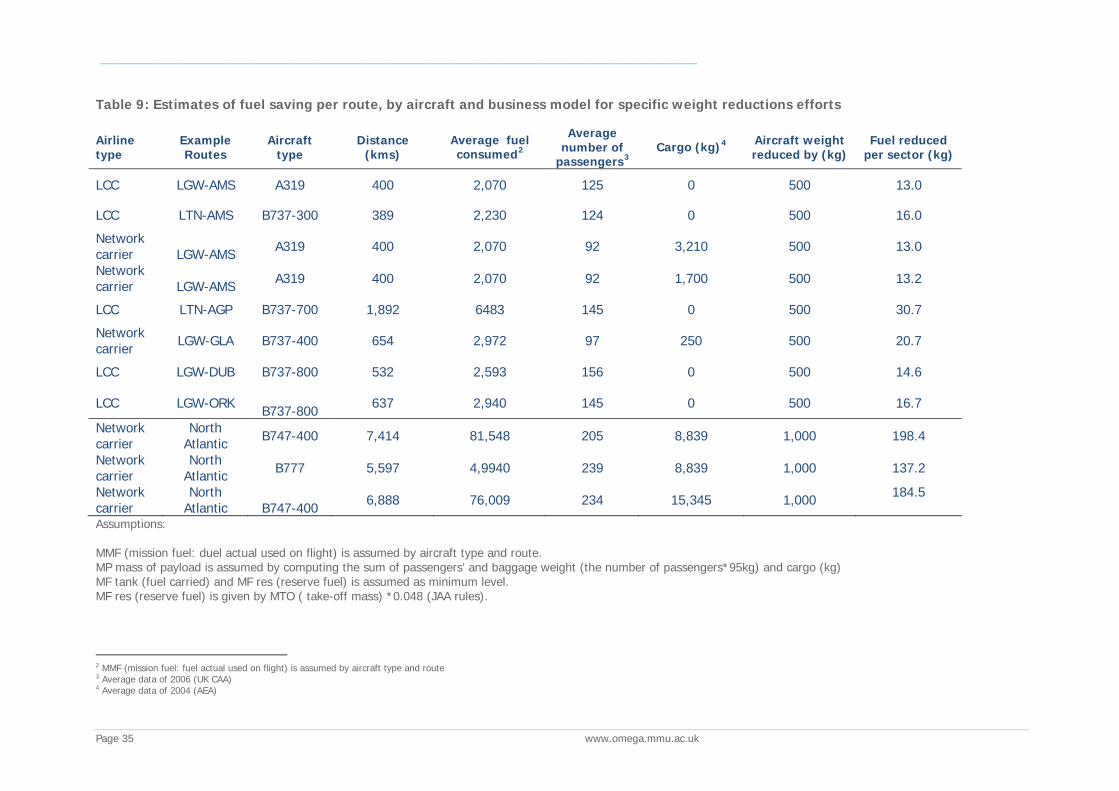
The approach requires a number of assumptions to be made and these can be derived from aircraft performance calculations, and average passenger and cargo numbers for specific routes. Here UK CAA data for 2006 were used for passenger numbers and cargo figures were derived from Association of European Airlines data for 2004. Using Poll’s first theorem (Poll, 2008), Table 9 estimates the fuel savings per sector that derive from taking 500kg (short haul) or 1,000kg (long haul) of weight off the aircraft used. While the fuel savings achieved for a single sector are relatively small when aggregated across a fleet of highly utilised aircraft the savings are significant. For example, for a short haul airline that has 150 aircraft flying six sectors of 1,000km per day might save 35kg of fuel per flight which equates with some 36,217 tonnes of CO2 per annum.
35kg * 6 sectors per day * 365 days *150 aircraft = 11,497.5 tonnes (metric) of fuel not burned
1kg fuel burned = 3.15 kg CO2 emitted
_____________________________________________________________________________________________________
Page 29 www.omega.mmu.ac.uk
11,497.5 tonnes fuel not burned prevents 36,217 tonnes of CO2 emissions.
If an airline was able to remove 1 tonne (metric) from a Boeing 747-400 allocated to North Atlantic operations, and if this aircraft made daily return trips for a year the saving in emissions for that single aircraft would be estimated at 456.2 tonnes of CO2. Therefore although the CO2 emissions prevented for single sectors are relatively small, the benefit of reducing on-board weight across a fleet of highly utilised aircraft assets is certainly worthwhile and justifies airlines investigating potential weight saving areas. The saving also goes directly to the bottom line as less fuel burnt represents real operating cost saving to the airline.
_____________________________________________________________________________________________________
Page 30 www.omega.mmu.ac.uk
Table 8: Aircraft weight saving initiatives introduced by selected airlines
Organisation / Airline CO2 Reduction Initiative CO2 or Fuel Burn Saving Economic Saving Source Air Canada Jazz Canada’s regional airline Jazz is
removing life vests from all its planes to cut weight and so reduce fuel costs. Government regulations allow it to use flotation devices if the planes stay within 50 miles of shore. Passengers will be directed to use seat cushions as flotation devices.
Removing life vests will reduce aircraft weight by 50 pounds (23kg).
BBC. (2008). Airline life vests go to cut costs. http://news.bbc.co.uk/1/hi/world/americas/7586975.stm. Accessed 5th November 2008.
Air France / KLM Group Air France have reduced the weight of trolleys from 29 kg to 23 kg, of galley containers from 3.6 to 2.7 kg, drawers from 0.8 to 0.5 kg, glass trays from 1.0 to 0.5 kg, and have reduced the amount of paper carried on board with the switch to digital technical documentation. Overall weight reduction amounts to 480 kg per aircraft on long-haul flights and 99 kg on medium-haul flights.KLM has purchased 3,800 lightweight baggage containers resulting in a 22 kg reduction per container, from 87 to 65 kg.
Reducing the load by 1 tonne on a long-haul flight saves 300 to 400 kg of fuel.
Air France – KLM Group. (2008). Corporate Social Responsibility Report 2007-08. http://www.klm.com/travel/csr_en/images/AFKLM%20CSR-report-0708_ENG%20(2)_tcm256-128819.pdf. Accessed 7th November 2008.
_____________________________________________________________________________________________________
Page 31 www.omega.mmu.ac.uk
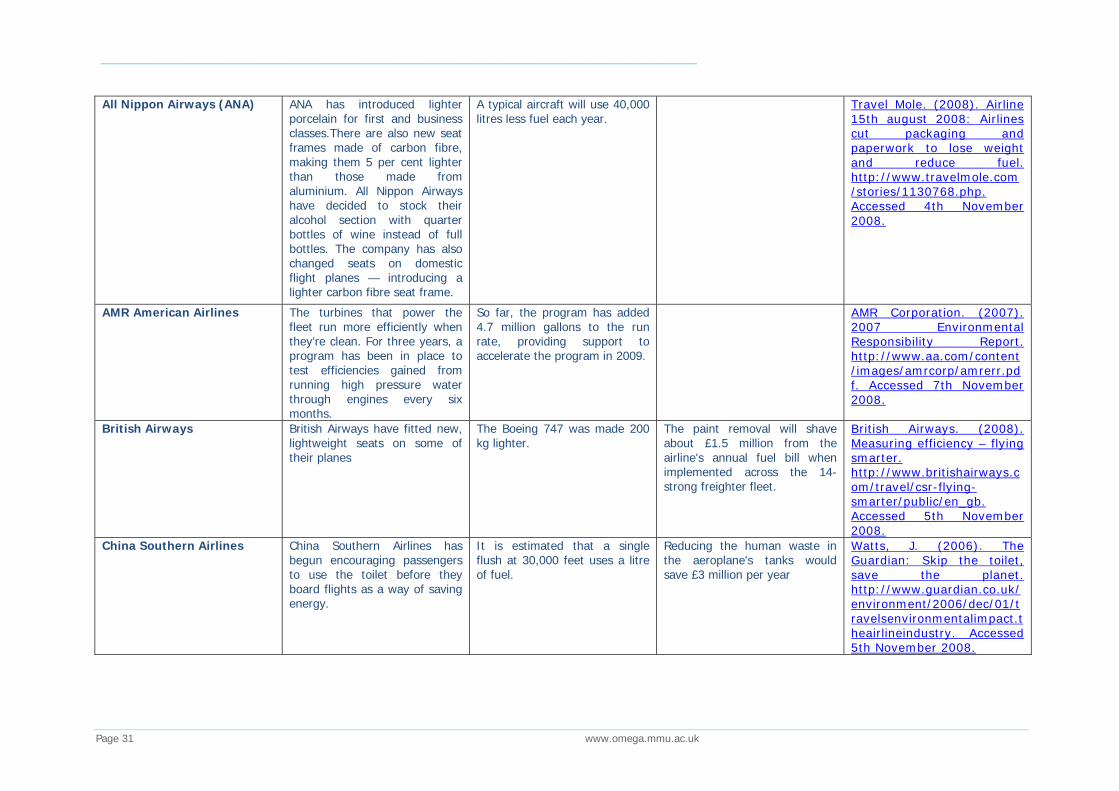
All Nippon Airways (ANA) ANA has introduced lighter porcelain for first and business classes.There are also new seat frames made of carbon fibre, making them 5 per cent lighter than those made from aluminium. All Nippon Airways have decided to stock their alcohol section with quarter bottles of wine instead of full bottles. The company has also changed seats on domestic flight planes — introducing a lighter carbon fibre seat frame.
A typical aircraft will use 40,000 litres less fuel each year.
Travel Mole. (2008). Airline 15th august 2008: Airlines cut packaging and paperwork to lose weight and reduce fuel. http://www.travelmole.com/stories/1130768.php. Accessed 4th November 2008.
AMR American Airlines The turbines that power the fleet run more efficiently when they’re clean. For three years, a program has been in place to test efficiencies gained from running high pressure water through engines every six months.
So far, the program has added 4.7 million gallons to the run rate, providing support to accelerate the program in 2009.
AMR Corporation. (2007). 2007 Environmental Responsibility Report. http://www.aa.com/content/images/amrcorp/amrerr.pdf. Accessed 7th November 2008.
British Airways British Airways have fitted new, lightweight seats on some of their planes
The Boeing 747 was made 200 kg lighter.
The paint removal will shave about £1.5 million from the airline's annual fuel bill when implemented across the 14-strong freighter fleet.
British Airways. (2008). Measuring efficiency – flying smarter. http://www.britishairways.com/travel/csr-flying-smarter/public/en_gb. Accessed 5th November 2008.
China Southern Airlines China Southern Airlines has begun encouraging passengers to use the toilet before they board flights as a way of saving energy.
It is estimated that a single flush at 30,000 feet uses a litre of fuel.
Reducing the human waste in the aeroplane's tanks would save £3 million per year
Watts, J. (2006). The Guardian: Skip the toilet, save the planet. http://www.guardian.co.uk/environment/2006/dec/01/travelsenvironmentalimpact.theairlineindustry. Accessed 5th November 2008.
_____________________________________________________________________________________________________
Page 32 www.omega.mmu.ac.uk
International Civil Aviation Organisation (ICAO)
Reduce operating items to minimum (no extra water, paperless cockpit, consumables for 1 flight only, over water kit only if required). Usage of light carpet (up to –125 lbs). Usage of Chromate free paint (up to –150lbs)
Viscotchi, F. (2006). Aviation operational measures for fuel and emissions reduction workshop: Weight Management. http://www.icao.int/env/WorkshopFuelEmissions/Presentations/Viscotchi.pdf. Accessed 11th November 2008.
Japan Airlines JAL has been flying eco-friendly unpainted cargo aircraft since 1992.
JAL freight aircraft are approximately 150kg lighter when the exterior is not painted.
Japan Airlines. (undated). Global warming: weight reduction. http://www.jal.com/en/environment/conservation/conservation02.html#q_003. Accessed 5th November 2008.
Japan Airlines In 2004, the company introduced lightweight porcelain tableware, which is approximately 20% lighter, for the meal service in First and Business classes. Also, by streamlining the spoons and forks weight has reduced by 2 grams per unit.
By reducing the weight of each aircraft by 1 kg it is possible to cut CO2 emissions throughout the JAL Group by approximately 76 tons per year.
JAL. (2007). CSR Report. http://www.jal.com/en/corporate/csr2007/pdf/all.pdf. Accessed 7th November 2008.
Japan Airlines The amount of water in the water tank in the cargo compartment has been adjusted to avoid waste and unnecessary carriage. As a result, JAL have achieved weight savings of up to 400 kg on 747-400’s and 300 kg on 777’s.
_____________________________________________________________________________________________________
Page 33 www.omega.mmu.ac.uk
Japan Airlines In 2007 JAL started using Twintex — a new material made of glass and polypropylene fibres — instead of aluminium alloy in the side panels of the containers. As a result, they have achieved weight reductions of 26 kg per unit.
Japan Airlines The amount of fuel onboard is now measured in 100-pound units rather than 1000 (450kg). As a result, more precise measures of the amount of fuel required for safe arrival at each destination have allowed weight savings of approximately 400 kg per flight.
KLM KLM apply thinner paint layers to their aircraft, reducing the weight of the paint by 15%. Not only is the paint chromate-free; the aircraft can be degreased primarily using soap and water, thereby reducing the amount of harmful solvents. The new paint requires less drying time and reduces the number of man-hours and saves money as it uses less paint.
KLM. (2007). Good Examples. http://www.klm.com/travel/csr_en/examples/index.htm. Accessed 7th November 2008.
Jet Blue Airways Jet Blue has eliminated disposable headsets and is encouraging customers to bring their own. They are also saving paper by not offering an inflight magazine.
Jet Blue Airways. (2008). Reducing our footprint. http://www.jetblue.com/green/footprint.asp Accessed 7th November 2008.
_____________________________________________________________________________________________________
Page 34 www.omega.mmu.ac.uk
Jetstar Australia Jetstar’s Jetsaver Light offers a new fare that provides customers with the option to travel with only carry-on baggage for a cheaper price, therefore reducing the operating weight of aircraft and thus reducing fuel requirements.
Quantas. (2008). Sustainability Report 2008. http://qantas.republicast3.com/Republicasts/Qantas%20Sustainability%20Report%202008/Qantas%20Sustainability%20Report%202008.pdf. Accessed 7th November 2008.
Thompson Fly High density seat configurations, improved by the installation of new 'thin' leather seats and high occupancy combine to provide a lower emission rate per passenger than a comparable scheduled flight. Cabin crew use small handheld display units to replace volumes of manuals and paperwork. Pilot's laptops give them access to route and weather update and the latest safety and technical information.
Thomson. (undated). Aircraft: sustainable aviation. http://destinations.thomson.co.uk/devolved/sustainable-tourism/tourism-transport.html. Accessed 5th November 2008.
Virgin Atlantic Virgin Atlantic's weight loss programme is aimed, over three years, at taking off half a tonne of each of the company's planes. Virgin has already replaced glossy magazines with increased in-flight entertainment systems; and it is considering cutting back on the newspapers it carries, trimming meal trays and duvets, and taking empty champagne bottles off before flights depart.
This will save $43,000 per plane each year.
Guardian. (2008). Airlines hope to keep a lid on emissions. http://observer.guardian.co.uk/shellenergy/story/0,,1793308,00.html. Accessed 11th November 2008.
Complied by: Becky Wiles, CATE MMU
_____________________________________________________________________________________________________
Page 35 www.omega.mmu.ac.uk
Table 9: Estimates of fuel saving per route, by aircraft and business model for specific weight reductions efforts
Airline type
Example Routes
Aircraft type
Distance (kms)
Average fuel consumed2
Average number of
passengers3 Cargo (kg)4 Aircraft weight
reduced by (kg) Fuel reduced
per sector (kg)
LCC LGW-AMS A319 400 2,070 125 0 500 13.0
LCC LTN-AMS B737-300 389 2,230 124 0 500 16.0
Network carrier
LGW-AMS A319 400 2,070 92 3,210 500 13.0
Network carrier
LGW-AMS A319 400 2,070 92 1,700 500 13.2
LCC LTN-AGP B737-700 1,892 6483 145 0 500 30.7
Network carrier LGW-GLA B737-400 654 2,972 97 250 500 20.7
LCC LGW-DUB B737-800 532 2,593 156 0 500 14.6
LCC LGW-ORK B737-800 637 2,940 145 0 500 16.7
Network carrier
North Atlantic B747-400 7,414 81,548 205 8,839 1,000 198.4
Network carrier
North Atlantic B777 5,597 4,9940 239 8,839 1,000 137.2
Network carrier
North Atlantic
B747-400 6,888 76,009 234 15,345 1,000 184.5
Assumptions: MMF (mission fuel: duel actual used on flight) is assumed by aircraft type and route. MP mass of payload is assumed by computing the sum of passengers’ and baggage weight (the number of passengers*95kg) and cargo (kg) MF tank (fuel carried) and MF res (reserve fuel) is assumed as minimum level. MF res (reserve fuel) is given by MTO ( take-off mass) *0.048 (JAA rules).
2 MMF (mission fuel: fuel actual used on flight) is assumed by aircraft type and route 3 Average data of 2006 (UK CAA) 4 Average data of 2004 (AEA)
_____________________________________________________________________________________________________
Page 36 www.omega.mmu.ac.uk
5.0 Elasticities of demand for air transport
The demand for airline transport may change over time as the travelling public become more conscious of the environmental impact of air travel. Another Omega funded study has looked at changes in traveller perception of the environmental impact of air travel, and changes to traveller behaviour and intention (see Omega project “Passenger Expectations”). This study found that travellers are concerned about climate change and aware of the contribution made by flying. However, passengers generally look to airlines or governments to deal with the environmental problem of aviation, and are unlikely to change their own behaviour to address the issue of climate change without some externally applied cost or culture incentive. The study found some willingness among some passengers to pay more for more environmentally-friendly services and/or to mitigate the consequences of flying through offsetting. However, no studies have yet established the willingness of passengers to accept lower airline service levels in order to allow the airline to reduce on-board weight. Governmental policies to influence traveller behaviour with respect of environmental impact have focused on economic measures. For example, the UK government is committed to having aviation included in the European Union Emissions Trading Scheme as it believes it to be “the most efficient and cost-effective way to aid the sector [aviation] in meeting its external [environmental] costs and playing its part in tackling climate change” (UK Pre-Budget report, 2006). However, it also argued that additional economic instruments are necessary to ensure aviation plays its part in meeting the challenge of climate change. Consequently the UK’s Air Passenger Duty was doubled in Feb 2007 and the Treasury estimated that the 2007 tax rise would cut carbon dioxide emissions by about 0.3 million tonnes a year by 2010-20115.
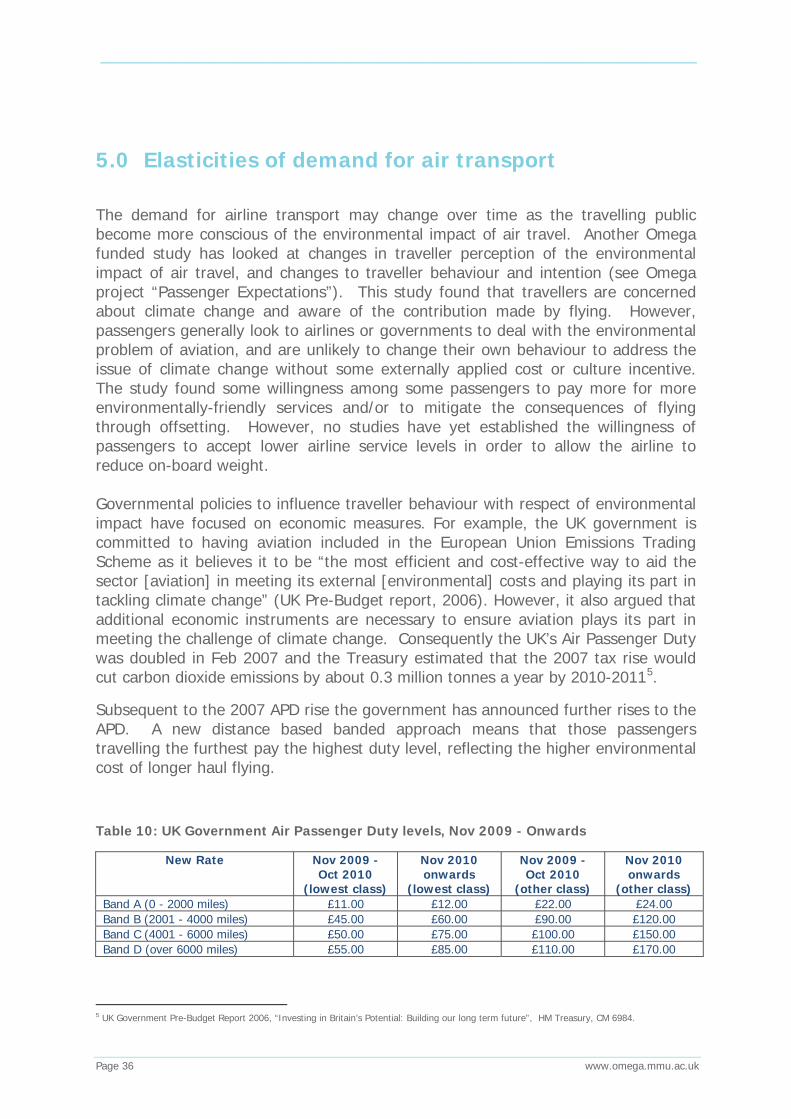
Subsequent to the 2007 APD rise the government has announced further rises to the APD. A new distance based banded approach means that those passengers travelling the furthest pay the highest duty level, reflecting the higher environmental cost of longer haul flying.
Table 10: UK Government Air Passenger Duty levels, Nov 2009 - Onwards
New Rate Nov 2009 - Oct 2010
(lowest class)
Nov 2010 onwards
(lowest class)
Nov 2009 - Oct 2010
(other class)
Nov 2010 onwards
(other class) Band A (0 - 2000 miles) £11.00 £12.00 £22.00 £24.00 Band B (2001 - 4000 miles) £45.00 £60.00 £90.00 £120.00 Band C (4001 - 6000 miles) £50.00 £75.00 £100.00 £150.00 Band D (over 6000 miles) £55.00 £85.00 £110.00 £170.00
5 UK Government Pre-Budget Report 2006, “Investing in Britain’s Potential: Building our long term future”, HM Treasury, CM 6984.
_____________________________________________________________________________________________________
Page 37 www.omega.mmu.ac.uk
The government’s stated5 strategy is to reduce CO2 emissions by increasing the cost of travel and thereby dampening demand (. However, the users of the higher ticket classes are likely to be business travellers. It is generally thought that business travellers have lower price elasticity of demand than leisure travellers as their companies pay for their trip and the need to travel is business related. Consequently the price of the trip is weighed against the business benefit of travelling to meet clients and customers, and the like. Therefore it may be suggested that the higher level APD for long haul, high class travel may not significantly reduce the demand for these services.
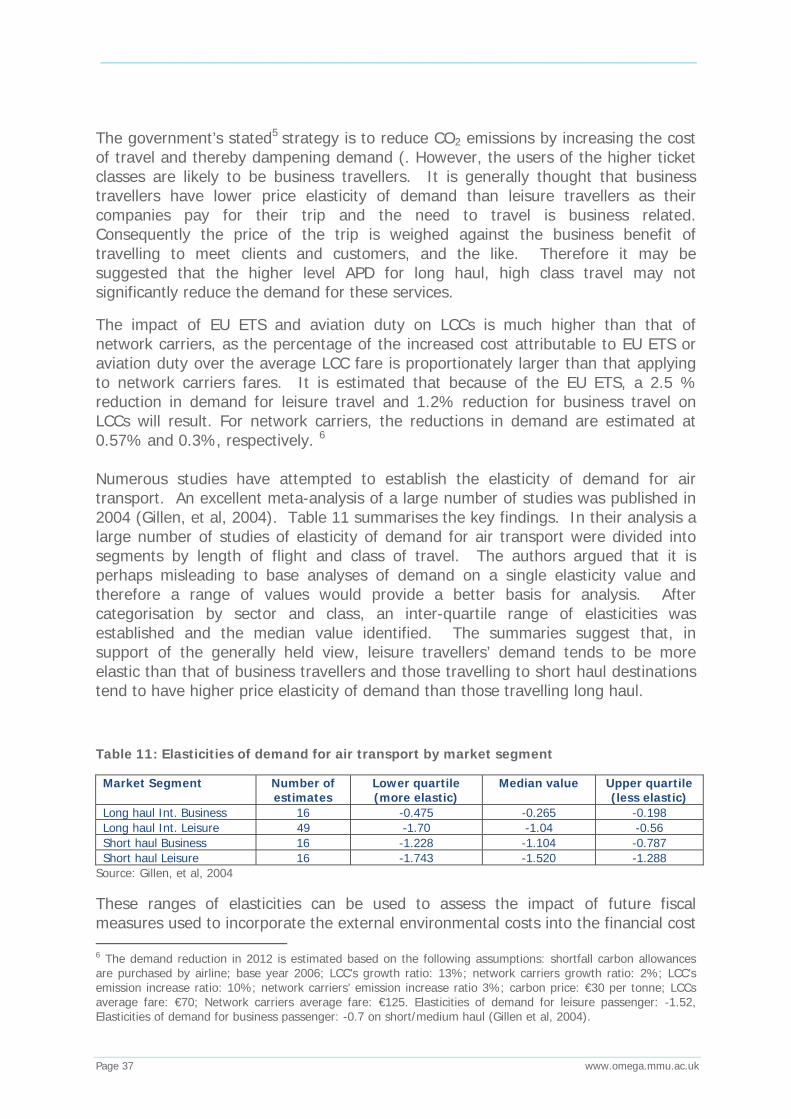
The impact of EU ETS and aviation duty on LCCs is much higher than that of network carriers, as the percentage of the increased cost attributable to EU ETS or aviation duty over the average LCC fare is proportionately larger than that applying to network carriers fares. It is estimated that because of the EU ETS, a 2.5 % reduction in demand for leisure travel and 1.2% reduction for business travel on LCCs will result. For network carriers, the reductions in demand are estimated at 0.57% and 0.3%, respectively. 6 Numerous studies have attempted to establish the elasticity of demand for air transport. An excellent meta-analysis of a large number of studies was published in 2004 (Gillen, et al, 2004). Table 11 summarises the key findings. In their analysis a large number of studies of elasticity of demand for air transport were divided into segments by length of flight and class of travel. The authors argued that it is perhaps misleading to base analyses of demand on a single elasticity value and therefore a range of values would provide a better basis for analysis. After categorisation by sector and class, an inter-quartile range of elasticities was established and the median value identified. The summaries suggest that, in support of the generally held view, leisure travellers’ demand tends to be more elastic than that of business travellers and those travelling to short haul destinations tend to have higher price elasticity of demand than those travelling long haul.
Table 11: Elasticities of demand for air transport by market segment
Market Segment Number of estimates
Lower quartile (more elastic)
Median value Upper quartile (less elastic)
Long haul Int. Business 16 -0.475 -0.265 -0.198 Long haul Int. Leisure 49 -1.70 -1.04 -0.56 Short haul Business 16 -1.228 -1.104 -0.787 Short haul Leisure 16 -1.743 -1.520 -1.288
Source: Gillen, et al, 2004
These ranges of elasticities can be used to assess the impact of future fiscal measures used to incorporate the external environmental costs into the financial cost 6 The demand reduction in 2012 is estimated based on the following assumptions: shortfall carbon allowances are purchased by airline; base year 2006; LCC’s growth ratio: 13%; network carriers growth ratio: 2%; LCC’s emission increase ratio: 10%; network carriers’ emission increase ratio 3%; carbon price: €30 per tonne; LCCs average fare: €70; Network carriers average fare: €125. Elasticities of demand for leisure passenger: -1.52, Elasticities of demand for business passenger: -0.7 on short/medium haul (Gillen et al, 2004).

_____________________________________________________________________________________________________
Page 38 www.omega.mmu.ac.uk
of flying. Airlines will have to assess whether the market will allow them to pass on the full additional costs of items such as APD or ETS vouchers. In a market where an airline does not face much competition, the ability to pass through all of the additional costs is much greater than if the airline is operating in highly competitive markets. In short haul markets, very low fares from low cost carriers have shown that the market has high price elastic of demand and therefore the ability to pass on such costs may be limited. Liberalisation efforts, such as the recent signing of the US-EU bilateral agreement will mean that long haul markets will also become increasingly competitive, and it remains to be seen whether the market will bear the very high additional costs that the APD rates suggests are needed to mitigate environmental damage, or whether the demand for long haul travel will weaken and become increasingly elastic.
6.0 The future carbon intensity of air transport: scenario model
To examine how the carbon dioxide intensity of the air transport industry might evolve in the years to come, a bottom up model of emissions levels was developed. This model drew on the analysis of the analysis of the airline industry as presented in section 3.0 and also earlier work completed for the Omega study “Project Icarus: A Carbon Reduction Framework for buyer of business travel”. The evolution of the airline market in Europe in the past ten years has seen a significant shift in market share away from traditional network carriers to low cost carriers. It has been highlighted that the low cost model tends to have lower CO2 emissions per passenger kilometre, due largely to higher seating density and higher load factors. However, Figure 4 shows clearly that low cost carriers in the intra-EU market (from the UK) now represents the largest amount of carbon dioxide emissions due to their higher market share. The purpose of this section is to investigate how global airline emissions by airline business model may evolve by 2020.
To build this model, exemplar airlines of each of the main business model types were developed. These hypothetical airlines were based on the average route structures, aircraft type and utilisation, load factors and cabin configuration of a number of airlines within each business model sector. Each exemplar airline was then used to typify the environmental performance of all airlines within each business model area. For network carriers and charter carriers these performances were developed for both long and short haul flying. It was assumed that regional and low cost airlines do not participate in the long haul market. While this is currently true, a number of low cost carriers are looking to set up long haul subsidiaries. However, it is not clear quite what business model approach these airlines might follow (such as the aircraft choice and cabin configuration) and whether they will be successful. The indication to date, is that such low cost, long haul operations may likely to be two cabin configurations of wide body aircraft. The use of A380 in an extreme high-density configuration has not been suggested,
_____________________________________________________________________________________________________
Page 39 www.omega.mmu.ac.uk
however, various analysts (for example see Cranfield, 2005), suggest that only these two models are likely to be financially viable. From an environmental perspective, the former is not too dissimilar from current network carrier operations, and the later is unlikely due to limited access to the new aircraft type. Consequently these types have been left out of the model. However, the model can, of course, be revisited if, at a later time, new long haul low cost carriers do begin to take significant market share from network and long haul charter operators.
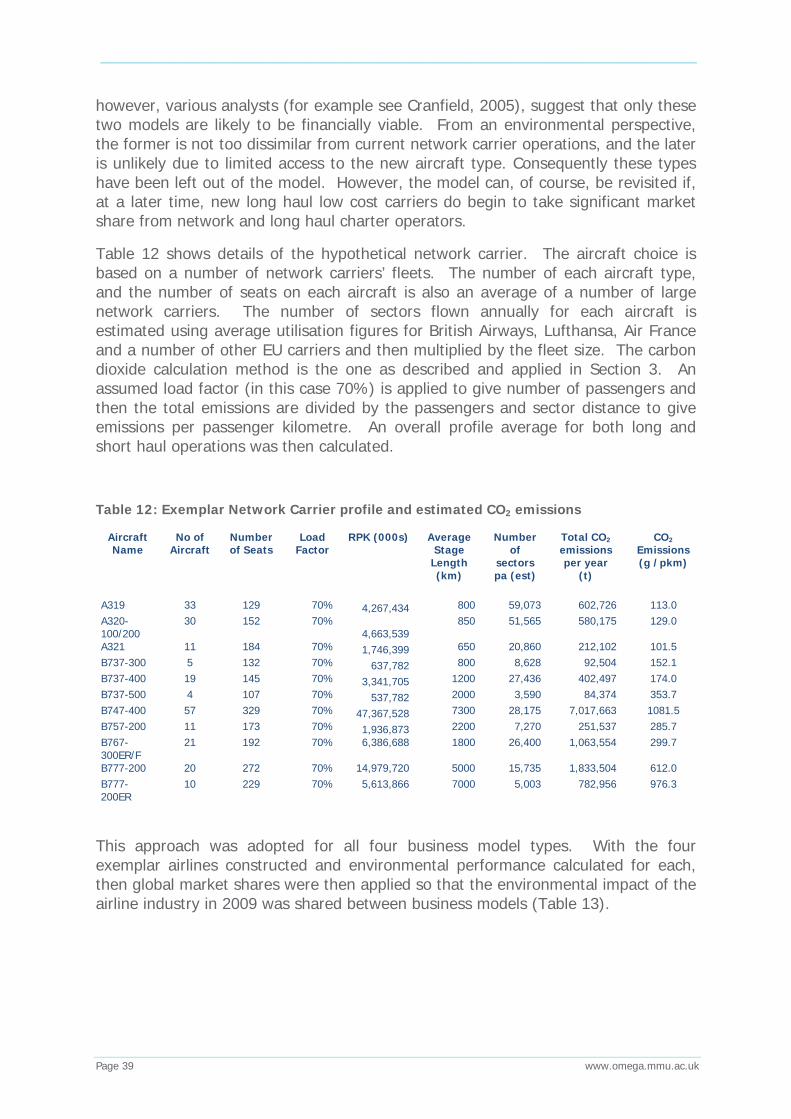
Table 12 shows details of the hypothetical network carrier. The aircraft choice is based on a number of network carriers’ fleets. The number of each aircraft type, and the number of seats on each aircraft is also an average of a number of large network carriers. The number of sectors flown annually for each aircraft is estimated using average utilisation figures for British Airways, Lufthansa, Air France and a number of other EU carriers and then multiplied by the fleet size. The carbon dioxide calculation method is the one as described and applied in Section 3. An assumed load factor (in this case 70%) is applied to give number of passengers and then the total emissions are divided by the passengers and sector distance to give emissions per passenger kilometre. An overall profile average for both long and short haul operations was then calculated.
Table 12: Exemplar Network Carrier profile and estimated CO2 emissions
Aircraft Name
No of Aircraft
Number of Seats
Load Factor
RPK (000s) Average Stage
Length (km)
Number of
sectors pa (est)
Total CO2 emissions per year
(t)
CO2 Emissions (g /pkm)
A319 33 129 70% 4,267,434 800 59,073 602,726 113.0 A320-100/200
30 152 70% 4,663,539
850 51,565 580,175 129.0
A321 11 184 70% 1,746,399 650 20,860 212,102 101.5 B737-300 5 132 70% 637,782 800 8,628 92,504 152.1 B737-400 19 145 70% 3,341,705 1200 27,436 402,497 174.0 B737-500 4 107 70% 537,782 2000 3,590 84,374 353.7 B747-400 57 329 70% 47,367,528 7300 28,175 7,017,663 1081.5 B757-200 11 173 70% 1,936,873 2200 7,270 251,537 285.7 B767-300ER/F
21 192 70% 6,386,688 1800 26,400 1,063,554 299.7
B777-200 20 272 70% 14,979,720 5000 15,735 1,833,504 612.0 B777-200ER
10 229 70% 5,613,866 7000 5,003 782,956 976.3
This approach was adopted for all four business model types. With the four exemplar airlines constructed and environmental performance calculated for each, then global market shares were then applied so that the environmental impact of the airline industry in 2009 was shared between business models (Table 13).
_____________________________________________________________________________________________________
Page 40 www.omega.mmu.ac.uk
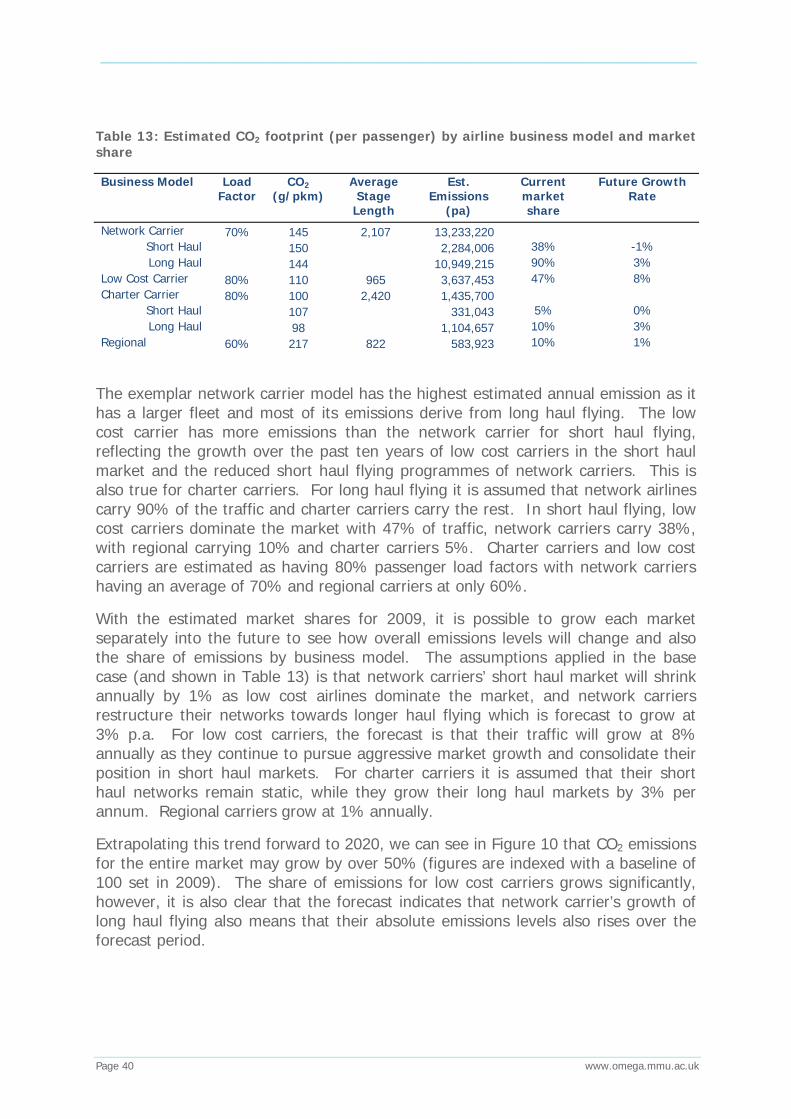
Table 13: Estimated CO2 footprint (per passenger) by airline business model and market share
Business Model Load Factor
CO2 (g/pkm)
Average Stage
Length
Est. Emissions
(pa)
Current market share
Future Growth Rate
Network Carrier 70% 145 2,107 13,233,220 Short Haul 150 2,284,006 38% -1% Long Haul 144 10,949,215 90% 3%
Low Cost Carrier 80% 110 965 3,637,453 47% 8% Charter Carrier 80% 100 2,420 1,435,700
Short Haul 107 331,043 5% 0% Long Haul 98 1,104,657 10% 3%
Regional 60% 217 822 583,923 10% 1%
The exemplar network carrier model has the highest estimated annual emission as it has a larger fleet and most of its emissions derive from long haul flying. The low cost carrier has more emissions than the network carrier for short haul flying, reflecting the growth over the past ten years of low cost carriers in the short haul market and the reduced short haul flying programmes of network carriers. This is also true for charter carriers. For long haul flying it is assumed that network airlines carry 90% of the traffic and charter carriers carry the rest. In short haul flying, low cost carriers dominate the market with 47% of traffic, network carriers carry 38%, with regional carrying 10% and charter carriers 5%. Charter carriers and low cost carriers are estimated as having 80% passenger load factors with network carriers having an average of 70% and regional carriers at only 60%.
With the estimated market shares for 2009, it is possible to grow each market separately into the future to see how overall emissions levels will change and also the share of emissions by business model. The assumptions applied in the base case (and shown in Table 13) is that network carriers’ short haul market will shrink annually by 1% as low cost airlines dominate the market, and network carriers restructure their networks towards longer haul flying which is forecast to grow at 3% p.a. For low cost carriers, the forecast is that their traffic will grow at 8% annually as they continue to pursue aggressive market growth and consolidate their position in short haul markets. For charter carriers it is assumed that their short haul networks remain static, while they grow their long haul markets by 3% per annum. Regional carriers grow at 1% annually.
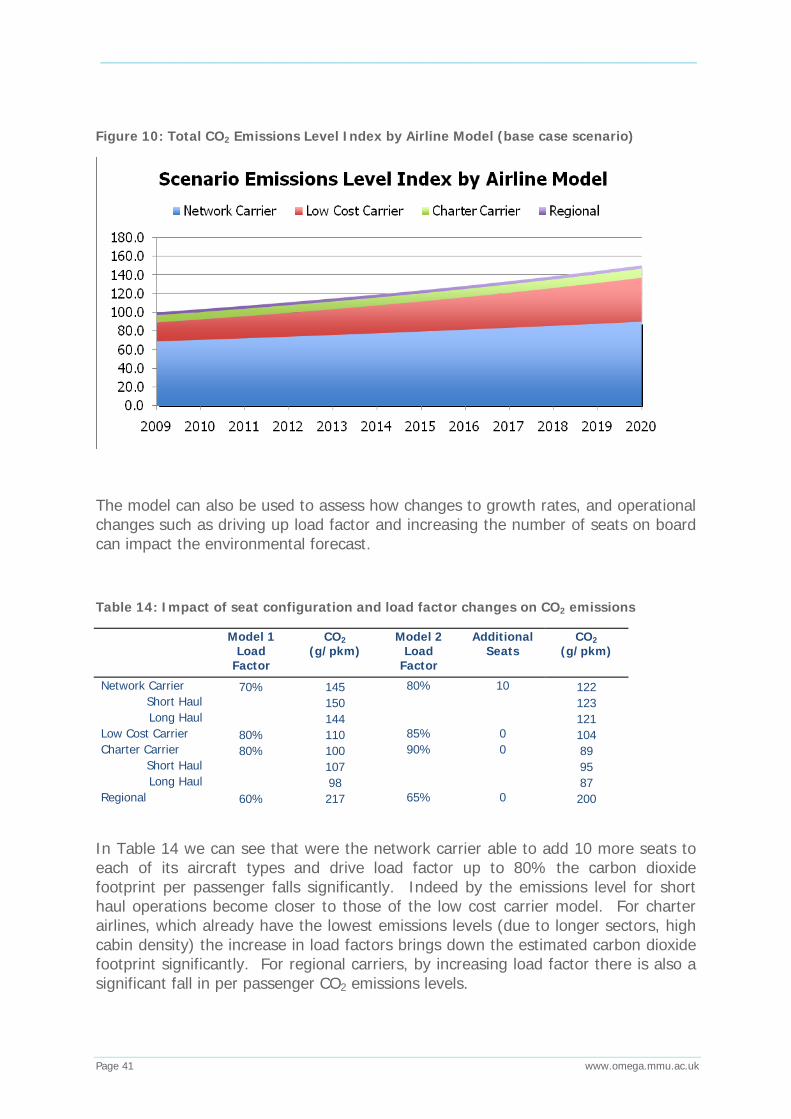
Extrapolating this trend forward to 2020, we can see in Figure 10 that CO2 emissions for the entire market may grow by over 50% (figures are indexed with a baseline of 100 set in 2009). The share of emissions for low cost carriers grows significantly, however, it is also clear that the forecast indicates that network carrier’s growth of long haul flying also means that their absolute emissions levels also rises over the forecast period.
_____________________________________________________________________________________________________
Page 41 www.omega.mmu.ac.uk
Figure 10: Total CO2 Emissions Level Index by Airline Model (base case scenario)
The model can also be used to assess how changes to growth rates, and operational changes such as driving up load factor and increasing the number of seats on board can impact the environmental forecast.
Table 14: Impact of seat configuration and load factor changes on CO2 emissions
Model 1 Load
Factor
CO2 (g/pkm)
Model 2 Load
Factor
Additional Seats
CO2 (g/pkm)
Network Carrier 70% 145 80% 10 122 Short Haul 150 123 Long Haul 144 121
Low Cost Carrier 80% 110 85% 0 104 Charter Carrier 80% 100 90% 0 89
Short Haul 107 95 Long Haul 98 87
Regional 60% 217 65% 0 200
In Table 14 we can see that were the network carrier able to add 10 more seats to each of its aircraft types and drive load factor up to 80% the carbon dioxide footprint per passenger falls significantly. Indeed by the emissions level for short haul operations become closer to those of the low cost carrier model. For charter airlines, which already have the lowest emissions levels (due to longer sectors, high cabin density) the increase in load factors brings down the estimated carbon dioxide footprint significantly. For regional carriers, by increasing load factor there is also a significant fall in per passenger CO2 emissions levels.
_____________________________________________________________________________________________________
Page 42 www.omega.mmu.ac.uk
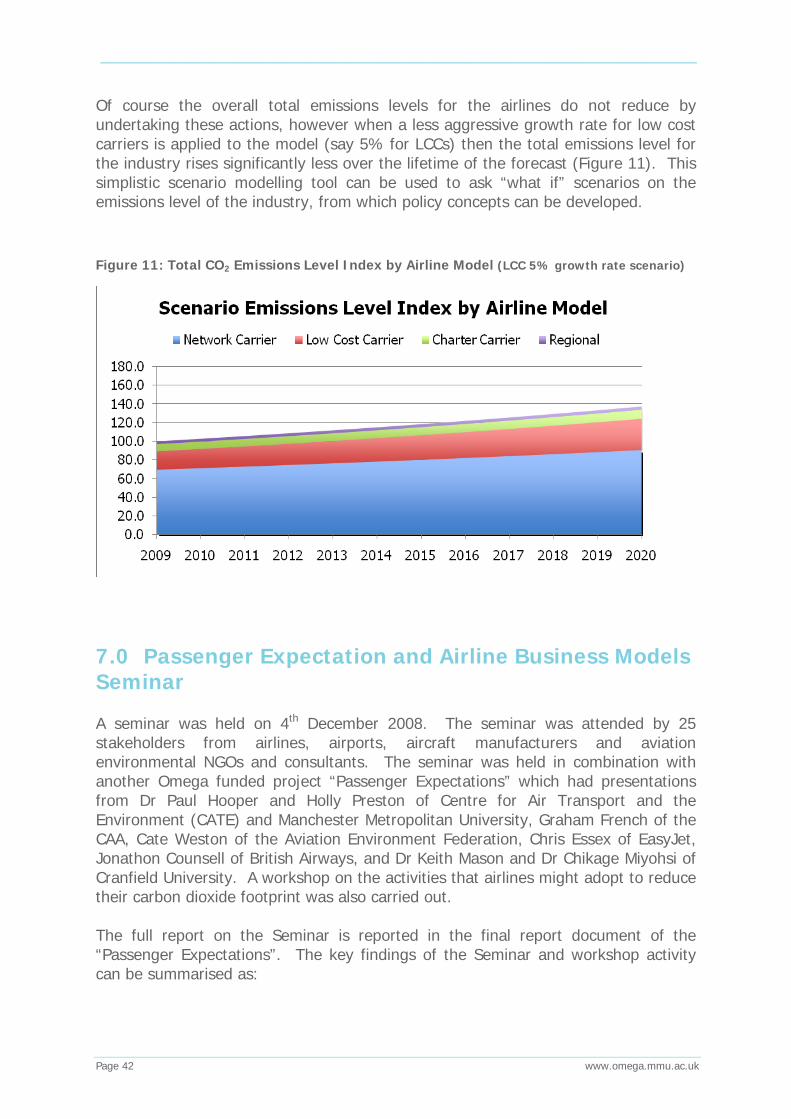
Of course the overall total emissions levels for the airlines do not reduce by undertaking these actions, however when a less aggressive growth rate for low cost carriers is applied to the model (say 5% for LCCs) then the total emissions level for the industry rises significantly less over the lifetime of the forecast (Figure 11). This simplistic scenario modelling tool can be used to ask “what if” scenarios on the emissions level of the industry, from which policy concepts can be developed.
Figure 11: Total CO2 Emissions Level Index by Airline Model (LCC 5% growth rate scenario)
7.0 Passenger Expectation and Airline Business Models Seminar A seminar was held on 4th December 2008. The seminar was attended by 25 stakeholders from airlines, airports, aircraft manufacturers and aviation environmental NGOs and consultants. The seminar was held in combination with another Omega funded project “Passenger Expectations” which had presentations from Dr Paul Hooper and Holly Preston of Centre for Air Transport and the Environment (CATE) and Manchester Metropolitan University, Graham French of the CAA, Cate Weston of the Aviation Environment Federation, Chris Essex of EasyJet, Jonathon Counsell of British Airways, and Dr Keith Mason and Dr Chikage Miyohsi of Cranfield University. A workshop on the activities that airlines might adopt to reduce their carbon dioxide footprint was also carried out. The full report on the Seminar is reported in the final report document of the “Passenger Expectations”. The key findings of the Seminar and workshop activity can be summarised as:
_____________________________________________________________________________________________________
Page 43 www.omega.mmu.ac.uk
• Airlines have been and will continue to pursue incremental changes to service delivery where the benefits are evident (e.g. in fuel savings and GHG emissions reductions) and not seen to conflict with passenger expectations of service.
• More rigorous monitoring of material use in some areas could assist in
tailoring supply to passenger demand on specific routes (e.g. water carriage and duty free stock provision). The potential to reduce water carriage in this way is thought to be quite considerable.
• Awareness raising among pilots of the financial and environmental
consequences of fuel contingency exceedances could yield significant benefits whilst not compromising legitimate pilot concerns for safety.
• In some areas opportunities to reduce weight have reached the limit allowed
by regulation (especially among LCCs), for example, air crew numbers and seating space allowances.
• Passengers need to be educated as to the relative impact of flying compared
to other GHG generating activities and to the significance of specific changes in service delivery if more radical changes to improve efficiencies are to be considered by airlines (e.g. use of slower aircraft, optimised stage lengths, reduced frequency of services to enhance load factors).
• Passenger surveys suggest there is little appetite for changes in behaviour
that could reduce demand for air services such as willingness to take fewer longer overseas holidays or to holiday within the UK.
8.0 Conclusions This study has covered a range of topics that together highlight the structure of the air transport market, in respect of environmental impact, the key operational and strategic changes that airlines can undertake to improve their CO2 emissions, considered the impact of fiscal policies on the demand for air transport and provided a scenario forecasting model that can be used to appraise the future environmental impact of the airline business as the industry grows and shares between differing business models change. The study aimed to answer the following questions:
• What are the ramifications of the diversified market business models on the environment? Which airline business models are least environmentally damaging? How do different business models and industry structures influence environmental performance?
o The study has demonstrated a significant swing from network carrier domination to low cost carriers domination of European short haul
_____________________________________________________________________________________________________
Page 44 www.omega.mmu.ac.uk
markets. Low cost carriers are identified as having somewhat lower environmental impacts on a per passenger basis than network carriers but their substantial market growth in the past ten years has meant a significant rise in fuel burn and thus carbon dioxide emissions. When aggregating long haul trips with short haul flights, the network carriers take account for the lion’s share of environmental pollution from aviation. The future market structure of the industry and therefore environmental impact will depend on the growth rates of each of the business models. Extrapolating current growth patterns sees a near 60% growth in CO2 emissions by 2020 with low cost carriers accounting for a significantly larger proportion than current levels. Maturation of this sector combined with some form of environmental mitigation policy (e.g. EU ETS) may restrict this high level of carbon dioxide emission growth.
• What are the potential changes of approach / practice to current business models in order to realise environmental performance improvements? How might the sector transition to a set of business models with lower environmental footprints?
o The key area for all regional and network carriers to work on is load factor. Driving up load factor, along with increasing seat density has the highest elasticities of demand for environmental performance measured on a per passenger kilometre basis. The potential for charter and low cost carriers to do this is limited as airlines of both models already have adopted high seat density layouts for their aircraft and both achieve load factors that they will struggle to drive these up much further. The seminar and workshop identified a number of weight reduction strategies such as reduced water carriage, and the provision duty free on arrival (thereby reducing duty free stocks carrier) that can have a significant reduction in fuel burn and emissions when applied across an airline’s fleet. The key policy instrument that can internalise the environmental impact of aviation is the sectors inclusion in emissions trading schemes. The cost of carbon vouchers will increase airlines’ costs and the elasticity of demand and competitive environment will influence the amount of additional costs passed through to passengers.
While various suggestions on how airlines might reduce onboard weight have been highlighted in this study, it has been beyond the scope of this study to conduct full feasibility studies for practices such as delivering inflight purchased duty free to passengers on arrival, removing duty free trolleys from the aircraft. Future studies may undertake this work. It is also suggested that future studies look at the network carriers’ freight operations as this area has not been investigated here. Freight operations increase the weight carried and fuel burned by network carriers and the operations that lead to these additional emissions should be examined. Also the full allocation of freight

_____________________________________________________________________________________________________
Page 45 www.omega.mmu.ac.uk
derived emissions to freight operations may also reduce the per passenger emissions levels for network carriers.
_____________________________________________________________________________________________________
Page 46 www.omega.mmu.ac.uk
References AEA, S.T.A.R. Summary of Traffic and Airline Results 2005 (2004 data), Association of European Airlines
AEA, S.T.A.R. Summary of Traffic and Airline Results 2007 (2006 data), Association of European Airlines
Babikian, R., Lukachko, S.P., Waitz, I.A., 2002. The historical fuel efficiency characteristics of regional aircraft from technological, operational, and cost perspectives. Journal of Air Transport Management, 8(6), pp. 389-400.
Civil Aviation Authority, 2006. No-frill carriers: Revolution or evolution? A study by the Civil Aviation Authority. CAP770. London.
Cranfield University, 2005, Study on the Future of Air Transport in the European Union, Dept of Air Transport, Cranfield.
Cranfield University, Department of Air Transport, 2006. AIR TRANSPORT: QUARTERLY REPORT NO.10 1st QUARTER 2006 (January to March), the European Commissions, Brussels. Cranfield University, Department of Air Transport, 2006. Air Transport: Quarterly Report No.12, 3rd Quarter 2006 (July to September), the European Commission, Brussels. Cranfield University, Department of Air Transport, 2008. Air Transport: Quarterly Report No.19 2nd Quarter 2008 (April to June), the European Commission, Brussels. EIA (Energy Information Administration), 2008. http://tonto.eia.doe.gov/dnav/pet/hist/a503700002A.htm , accessed on April 2008.
European Environment Agency (EEA), 2006. EMEP/CORINAIR (Core Inventory of Air Emissions in Europe) Emission Inventory Guidebook-2007, European Environment Agency, Copenhagen.
Eurocontrol, 2006. Aircraft performance summary tables for the base of aircraft data (BADA), Revision 3.3 and 3.6, Brussels.
Gillen, D., Morrison, W.G., Stewart, M.A., 2004. Air travel demand elasticities: Concepts, Issues and measurement, study commissioned by the Department of Finance Canada, 2004.
Givoni, M., Rietveld, P., 2009. The environmental implications of airlines’ choice of aircraft size. Journal of Air transport management, forthecoming.
Green, S., Salkind, N., Akey, T., 2000. Using SPSS for windows- analysing and understaning data, Prentice hall, New Jersey.
_____________________________________________________________________________________________________
Page 47 www.omega.mmu.ac.uk
Halstead, J., 2008. The full-blown fuel crisis. Aviation Strategy, No.129.
Lee, J. J., Lukachko, S, P., Waitz, I, A., Schafer, A., 2001. Histrical and future trends in aircraft performance, cost and emissions. Energy environ , 26, pp.167-200
Lee, J. J., Lukachko, S, P., Waitz, I, A., 2004. Aircraft and energy use. Encyclopedia of Energy, pp.29-38
Miyoshi, C., Mason, K.J., 2008. Toward assessing the environmental performance of differing airline business models using and the potential for companies to reduce their business travel related carbon emissions, accepted for the publication in Journal of Air Transport Management, Special Issue from German Aviation Research Society Conference.
Morrell, P., 2008. The potential for European aviation CO2 emissions reduction through the use of larger jet aircraft. Journal of Air Transport Management, in print.
Poll, D.I.A., 2008. The Optimum Aeroplane and Beyond., Lanchester Lecture, Royal Aeronautical Society, Oct.
Schipper, Y., Rietveld, P., Nijkamp, P., 2002. European airline reform. Journal of transport Economics and Policy, 36, pp.189-209.
Tabachnick, B., Findell, L., 2007. Using multivariate statistics, Pearson Education, Inc, the USA.
Williams, G., 2001. Will Europe's charter carriers be replaced by “no-frills” scheduled airlines? Journal of Air Transport Management, 7(5), pp. 277-286.
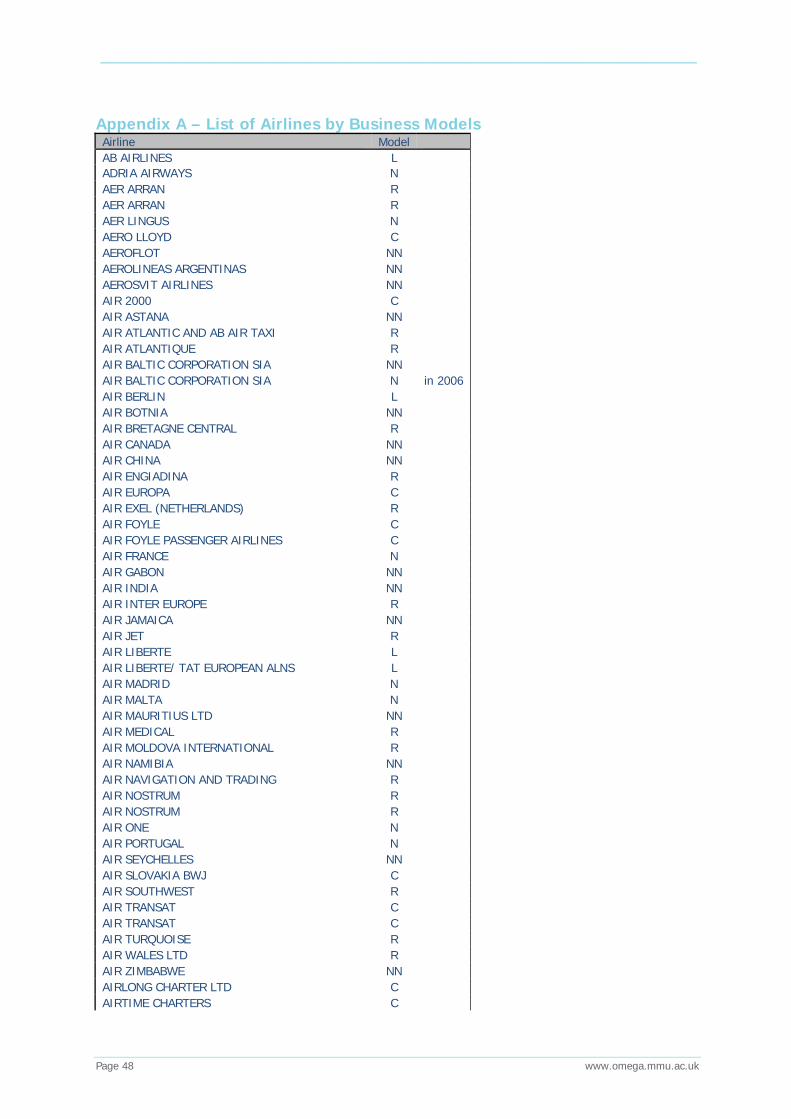
_____________________________________________________________________________________________________
Page 48 www.omega.mmu.ac.uk
Appendix A – List of Airlines by Business Models Airline Model AB AIRLINES L ADRIA AIRWAYS N AER ARRAN R AER ARRAN R AER LINGUS N AERO LLOYD C AEROFLOT NN AEROLINEAS ARGENTINAS NN AEROSVIT AIRLINES NN AIR 2000 C AIR ASTANA NN AIR ATLANTIC AND AB AIR TAXI R AIR ATLANTIQUE R AIR BALTIC CORPORATION SIA NN AIR BALTIC CORPORATION SIA N in 2006 AIR BERLIN L AIR BOTNIA NN AIR BRETAGNE CENTRAL R AIR CANADA NN AIR CHINA NN AIR ENGIADINA R AIR EUROPA C AIR EXEL (NETHERLANDS) R AIR FOYLE C AIR FOYLE PASSENGER AIRLINES C AIR FRANCE N AIR GABON NN AIR INDIA NN AIR INTER EUROPE R AIR JAMAICA NN AIR JET R AIR LIBERTE L AIR LIBERTE/ TAT EUROPEAN ALNS L AIR MADRID N AIR MALTA N AIR MAURITIUS LTD NN AIR MEDICAL R AIR MOLDOVA INTERNATIONAL R AIR NAMIBIA NN AIR NAVIGATION AND TRADING R AIR NOSTRUM R AIR NOSTRUM R AIR ONE N AIR PORTUGAL N AIR SEYCHELLES NN AIR SLOVAKIA BWJ C AIR SOUTHWEST R AIR TRANSAT C AIR TRANSAT C AIR TURQUOISE R AIR WALES LTD R AIR ZIMBABWE NN AIRLONG CHARTER LTD C AIRTIME CHARTERS C
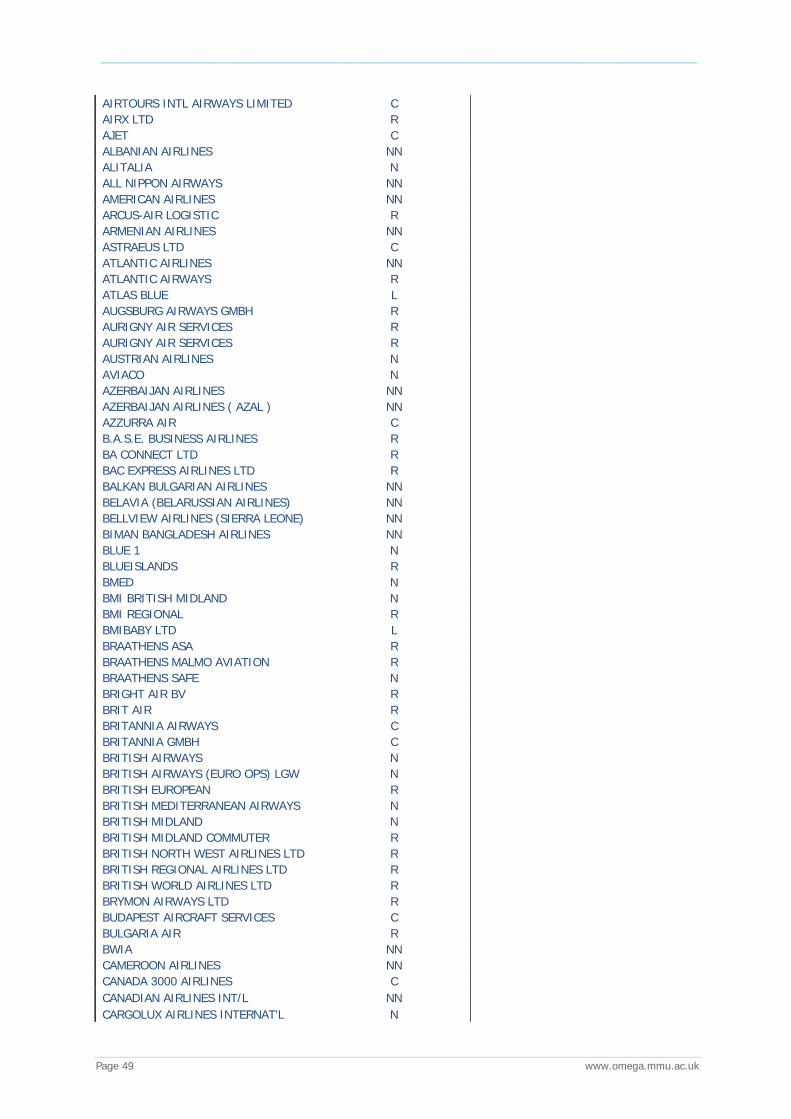
_____________________________________________________________________________________________________
Page 49 www.omega.mmu.ac.uk
AIRTOURS INTL AIRWAYS LIMITED C AIRX LTD R AJET C ALBANIAN AIRLINES NN ALITALIA N ALL NIPPON AIRWAYS NN AMERICAN AIRLINES NN ARCUS-AIR LOGISTIC R ARMENIAN AIRLINES NN ASTRAEUS LTD C ATLANTIC AIRLINES NN ATLANTIC AIRWAYS R ATLAS BLUE L AUGSBURG AIRWAYS GMBH R AURIGNY AIR SERVICES R AURIGNY AIR SERVICES R AUSTRIAN AIRLINES N AVIACO N AZERBAIJAN AIRLINES NN AZERBAIJAN AIRLINES ( AZAL ) NN AZZURRA AIR C B.A.S.E. BUSINESS AIRLINES R BA CONNECT LTD R BAC EXPRESS AIRLINES LTD R BALKAN BULGARIAN AIRLINES NN BELAVIA (BELARUSSIAN AIRLINES) NN BELLVIEW AIRLINES (SIERRA LEONE) NN BIMAN BANGLADESH AIRLINES NN BLUE 1 N BLUEISLANDS R BMED N BMI BRITISH MIDLAND N BMI REGIONAL R BMIBABY LTD L BRAATHENS ASA R BRAATHENS MALMO AVIATION R BRAATHENS SAFE N BRIGHT AIR BV R BRIT AIR R BRITANNIA AIRWAYS C BRITANNIA GMBH C BRITISH AIRWAYS N BRITISH AIRWAYS (EURO OPS) LGW N BRITISH EUROPEAN R BRITISH MEDITERRANEAN AIRWAYS N BRITISH MIDLAND N BRITISH MIDLAND COMMUTER R BRITISH NORTH WEST AIRLINES LTD R BRITISH REGIONAL AIRLINES LTD R BRITISH WORLD AIRLINES LTD R BRYMON AIRWAYS LTD R BUDAPEST AIRCRAFT SERVICES C BULGARIA AIR R BWIA NN CAMEROON AIRLINES NN CANADA 3000 AIRLINES C CANADIAN AIRLINES INT/L NN CARGOLUX AIRLINES INTERNAT'L N
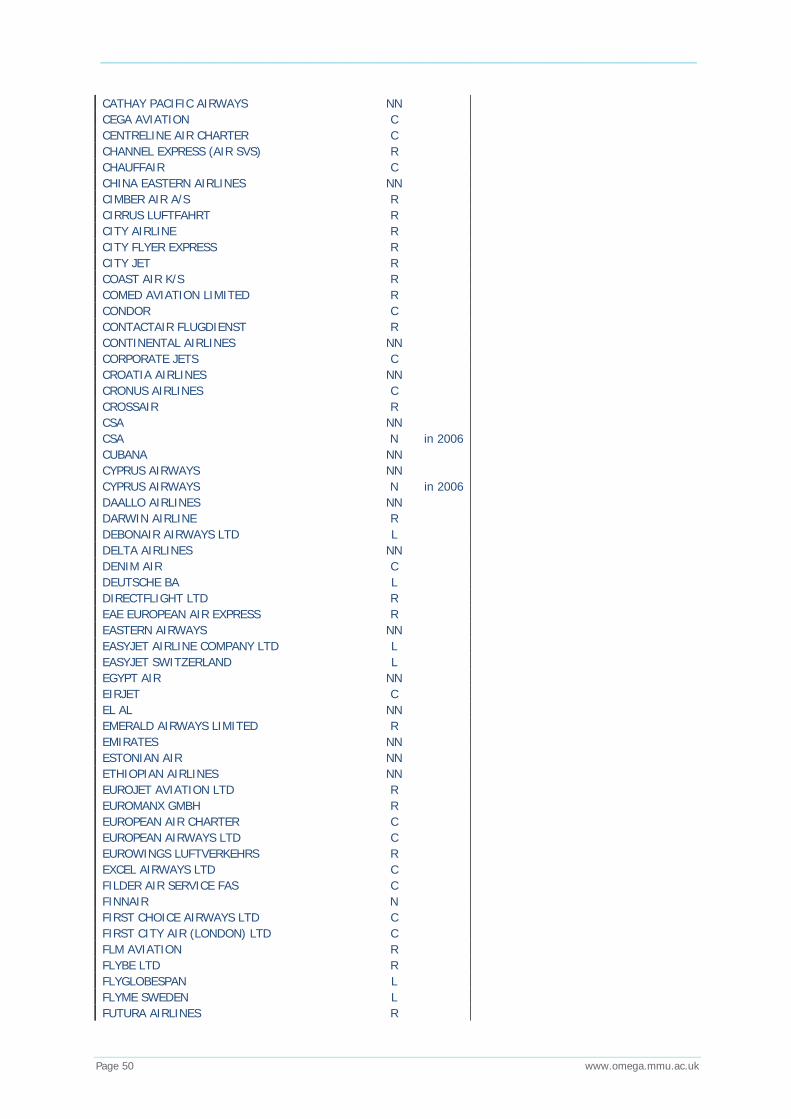
_____________________________________________________________________________________________________
Page 50 www.omega.mmu.ac.uk
CATHAY PACIFIC AIRWAYS NN CEGA AVIATION C CENTRELINE AIR CHARTER C CHANNEL EXPRESS (AIR SVS) R CHAUFFAIR C CHINA EASTERN AIRLINES NN CIMBER AIR A/S R CIRRUS LUFTFAHRT R CITY AIRLINE R CITY FLYER EXPRESS R CITY JET R COAST AIR K/S R COMED AVIATION LIMITED R CONDOR C CONTACTAIR FLUGDIENST R CONTINENTAL AIRLINES NN CORPORATE JETS C CROATIA AIRLINES NN CRONUS AIRLINES C CROSSAIR R CSA NN CSA N in 2006 CUBANA NN CYPRUS AIRWAYS NN CYPRUS AIRWAYS N in 2006 DAALLO AIRLINES NN DARWIN AIRLINE R DEBONAIR AIRWAYS LTD L DELTA AIRLINES NN DENIM AIR C DEUTSCHE BA L DIRECTFLIGHT LTD R EAE EUROPEAN AIR EXPRESS R EASTERN AIRWAYS NN EASYJET AIRLINE COMPANY LTD L EASYJET SWITZERLAND L EGYPT AIR NN EIRJET C EL AL NN EMERALD AIRWAYS LIMITED R EMIRATES NN ESTONIAN AIR NN ETHIOPIAN AIRLINES NN EUROJET AVIATION LTD R EUROMANX GMBH R EUROPEAN AIR CHARTER C EUROPEAN AIRWAYS LTD C EUROWINGS LUFTVERKEHRS R EXCEL AIRWAYS LTD C FILDER AIR SERVICE FAS C FINNAIR N FIRST CHOICE AIRWAYS LTD C FIRST CITY AIR (LONDON) LTD C FLM AVIATION R FLYBE LTD R FLYGLOBESPAN L FLYME SWEDEN L FUTURA AIRLINES R
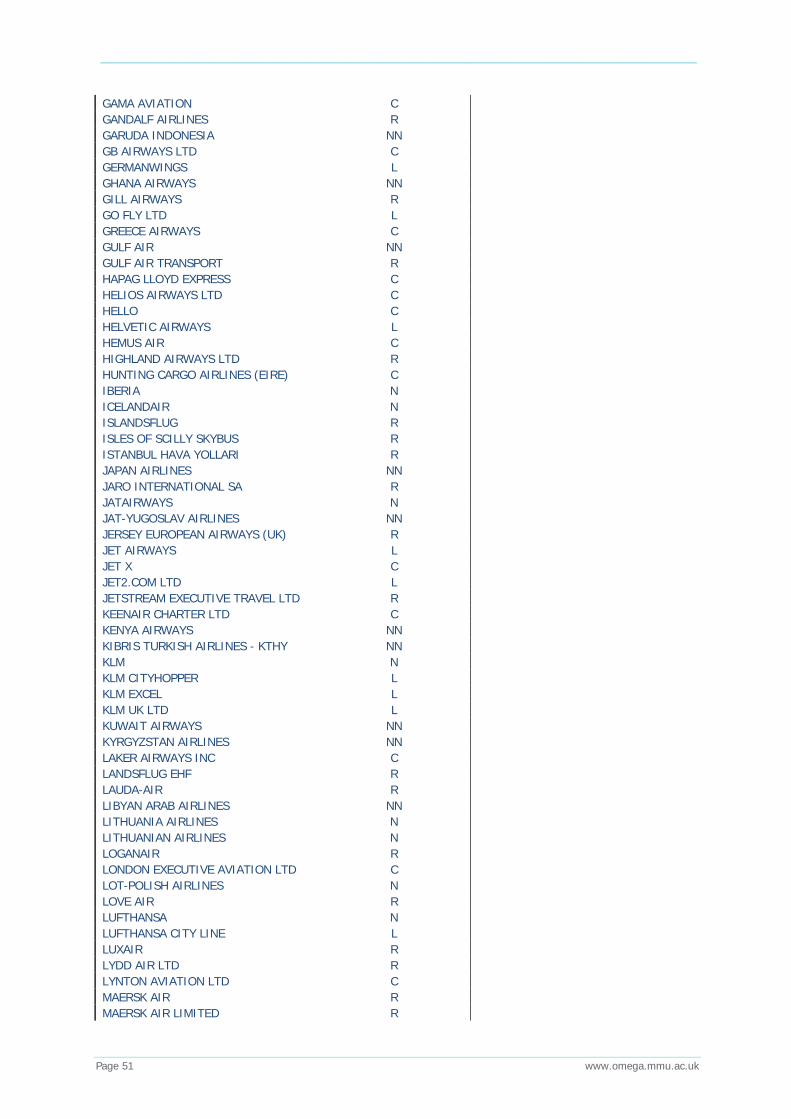
_____________________________________________________________________________________________________
Page 51 www.omega.mmu.ac.uk
GAMA AVIATION C GANDALF AIRLINES R GARUDA INDONESIA NN GB AIRWAYS LTD C GERMANWINGS L GHANA AIRWAYS NN GILL AIRWAYS R GO FLY LTD L GREECE AIRWAYS C GULF AIR NN GULF AIR TRANSPORT R HAPAG LLOYD EXPRESS C HELIOS AIRWAYS LTD C HELLO C HELVETIC AIRWAYS L HEMUS AIR C HIGHLAND AIRWAYS LTD R HUNTING CARGO AIRLINES (EIRE) C IBERIA N ICELANDAIR N ISLANDSFLUG R ISLES OF SCILLY SKYBUS R ISTANBUL HAVA YOLLARI R JAPAN AIRLINES NN JARO INTERNATIONAL SA R JATAIRWAYS N JAT-YUGOSLAV AIRLINES NN JERSEY EUROPEAN AIRWAYS (UK) R JET AIRWAYS L JET X C JET2.COM LTD L JETSTREAM EXECUTIVE TRAVEL LTD R KEENAIR CHARTER LTD C KENYA AIRWAYS NN KIBRIS TURKISH AIRLINES - KTHY NN KLM N KLM CITYHOPPER L KLM EXCEL L KLM UK LTD L KUWAIT AIRWAYS NN KYRGYZSTAN AIRLINES NN LAKER AIRWAYS INC C LANDSFLUG EHF R LAUDA-AIR R LIBYAN ARAB AIRLINES NN LITHUANIA AIRLINES N LITHUANIAN AIRLINES N LOGANAIR R LONDON EXECUTIVE AVIATION LTD C LOT-POLISH AIRLINES N LOVE AIR R LUFTHANSA N LUFTHANSA CITY LINE L LUXAIR R LYDD AIR LTD R LYNTON AVIATION LTD C MAERSK AIR R MAERSK AIR LIMITED R
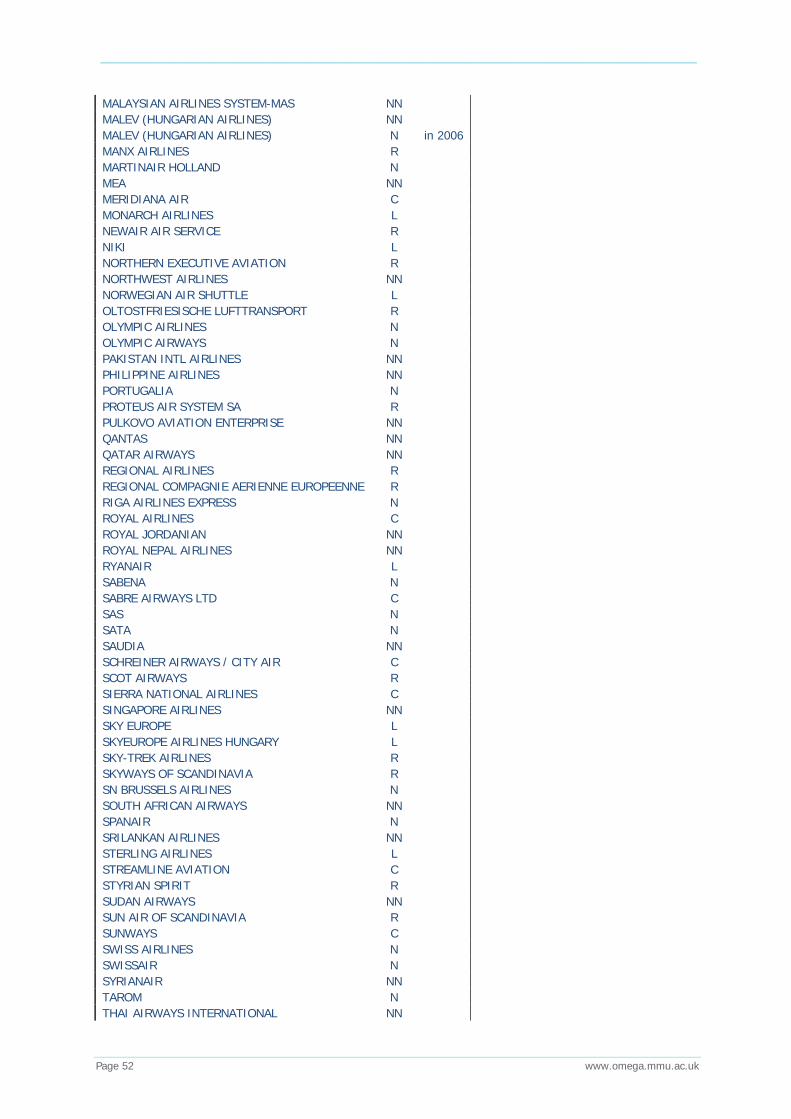
_____________________________________________________________________________________________________
Page 52 www.omega.mmu.ac.uk
MALAYSIAN AIRLINES SYSTEM-MAS NN MALEV (HUNGARIAN AIRLINES) NN MALEV (HUNGARIAN AIRLINES) N in 2006 MANX AIRLINES R MARTINAIR HOLLAND N MEA NN MERIDIANA AIR C MONARCH AIRLINES L NEWAIR AIR SERVICE R NIKI L NORTHERN EXECUTIVE AVIATION R NORTHWEST AIRLINES NN NORWEGIAN AIR SHUTTLE L OLTOSTFRIESISCHE LUFTTRANSPORT R OLYMPIC AIRLINES N OLYMPIC AIRWAYS N PAKISTAN INTL AIRLINES NN PHILIPPINE AIRLINES NN PORTUGALIA N PROTEUS AIR SYSTEM SA R PULKOVO AVIATION ENTERPRISE NN QANTAS NN QATAR AIRWAYS NN REGIONAL AIRLINES R REGIONAL COMPAGNIE AERIENNE EUROPEENNE R RIGA AIRLINES EXPRESS N ROYAL AIRLINES C ROYAL JORDANIAN NN ROYAL NEPAL AIRLINES NN RYANAIR L SABENA N SABRE AIRWAYS LTD C SAS N SATA N SAUDIA NN SCHREINER AIRWAYS / CITY AIR C SCOT AIRWAYS R SIERRA NATIONAL AIRLINES C SINGAPORE AIRLINES NN SKY EUROPE L SKYEUROPE AIRLINES HUNGARY L SKY-TREK AIRLINES R SKYWAYS OF SCANDINAVIA R SN BRUSSELS AIRLINES N SOUTH AFRICAN AIRWAYS NN SPANAIR N SRILANKAN AIRLINES NN STERLING AIRLINES L STREAMLINE AVIATION C STYRIAN SPIRIT R SUDAN AIRWAYS NN SUN AIR OF SCANDINAVIA R SUNWAYS C SWISS AIRLINES N SWISSAIR N SYRIANAIR NN TAROM N THAI AIRWAYS INTERNATIONAL NN
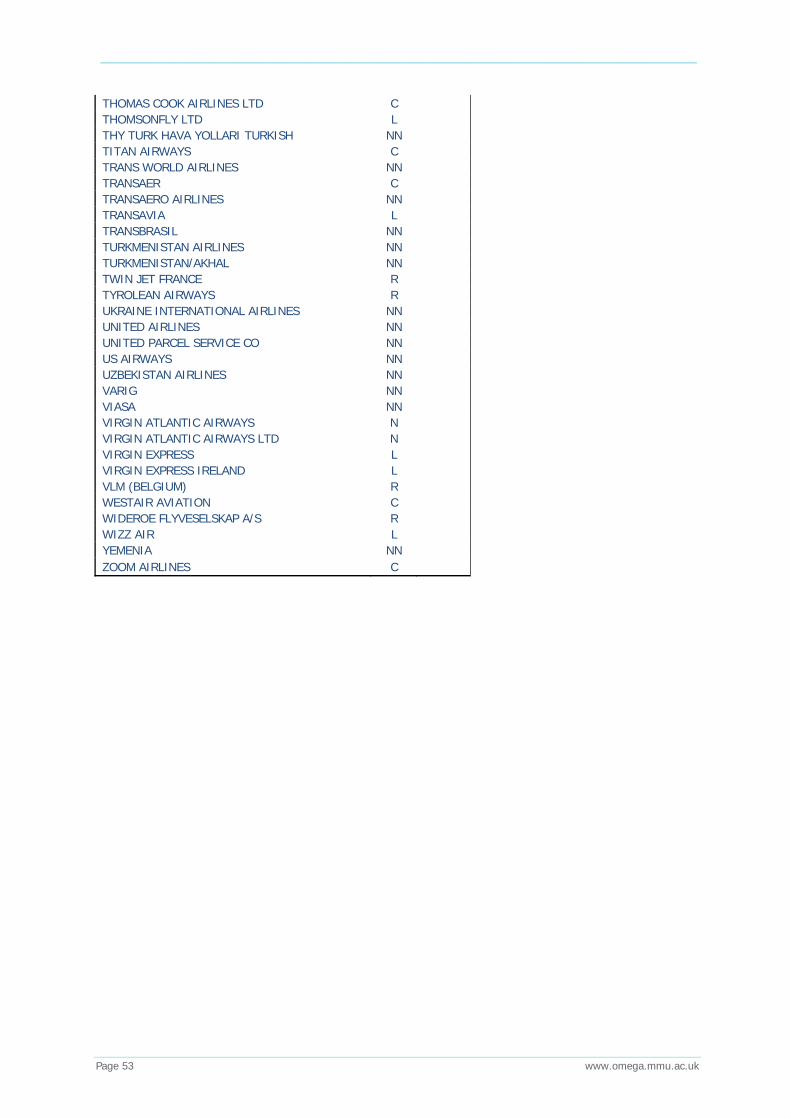
_____________________________________________________________________________________________________
Page 53 www.omega.mmu.ac.uk
THOMAS COOK AIRLINES LTD C THOMSONFLY LTD L THY TURK HAVA YOLLARI TURKISH NN TITAN AIRWAYS C TRANS WORLD AIRLINES NN TRANSAER C TRANSAERO AIRLINES NN TRANSAVIA L TRANSBRASIL NN TURKMENISTAN AIRLINES NN TURKMENISTAN/AKHAL NN TWIN JET FRANCE R TYROLEAN AIRWAYS R UKRAINE INTERNATIONAL AIRLINES NN UNITED AIRLINES NN UNITED PARCEL SERVICE CO NN US AIRWAYS NN UZBEKISTAN AIRLINES NN VARIG NN VIASA NN VIRGIN ATLANTIC AIRWAYS N VIRGIN ATLANTIC AIRWAYS LTD N VIRGIN EXPRESS L VIRGIN EXPRESS IRELAND L VLM (BELGIUM) R WESTAIR AVIATION C WIDEROE FLYVESELSKAP A/S R WIZZ AIR L YEMENIA NN ZOOM AIRLINES C
_____________________________________________________________________________________________________
Page 54 www.omega.mmu.ac.uk
Appendix B: Differences among groups using descriptive discriminant analysis
In this appendix , a descriptive discriminant analysis in used in order to reveal differences between the airline models using variables which represent the CO2 emission performance on each route. Descriptive discriminant analysis has mainly two objectives; (1) to identify differences between groups and (2) classification into groups (Green et al, 2000; Tabachnick and Findell, 2007).
• Difference among groups o Are there any differences between the four airline models (network,
LCC, regional, charter) in the population in linear combination of the fifteen predictor variables?
• Classification into groups
o Can the individuals in the groups be correctly classified into these four categories based on their scores on the fifteen predictor variable?
Discriminant analysis is performed on data for 1997, 2000 and 2006 (see section 3.1 for full description of the data). The results for each of the three years show differences between the airline models and highlights the impact of the low cost carriers on the market as they grew in the market. 1. Discriminant analysis The process of the discriminant analysis is explained (see Figure B-1). This process consists of (1) Checking the data for its suitability for discriminant analysis, (2) Evaluation of the discriminating functions, (3) Interpretation of the functions and (4) Classification the results. 1) Check data For conducting a discriminant analysis, MANOVA is first used to check whether the population means for the variables vary across levels of factors. This is followed by a test of the assumption of homogeneity of the variance–covariance. Box’s M test evaluates whether variances and covariances among the dependent variables are the same for all levels of a factor. If the F test is significant, the homogeneity hypothesis is rejected, and we may conclude that there are differences in the variance-corvariance matrices.

_____________________________________________________________________________________________________
Page 55 www.omega.mmu.ac.uk
2) Evaluation of functions With discriminant analysis, one or more linear combinations of predictors are created. These are called discriminant functions. The number of possible discriminant functions for analysis with N groups and p quantitative variables is either (N-1) or p, whichever is smaller. In this study, three (four airlines model group – 1) discriminant functions are produced. The first discriminant function is extracted such that it maximises the differences for this function between groups. A second discriminant function is then extracted that maximises the differences for this function among groups but that are uncorrelated with the first discriminant function. Eigenvalues7 for each discriminant function demonstrate the strength of the function; the larger the eigenvalue, the better the groups are discriminated. To evaluate how many discriminant functions, a series of chi-square significant tests, Wilks’ Lambda is used. This test assesses whether there are significant differences between groups across the predictor variable. A significant result indicates that there are differences among groups across predictors (variables) in the population. If ‘Wilk’s lambda’ is significant, we can use this discriminant function. 3)Interpretation of the discriminant functions A discriminant function can be named by examining the magnitudes of the standardised coefficients for the predictor variables in the function, the correlation coefficients of the predictor variables, and the function within the group (coefficients in the structure matrix). A negative number for these variables in the structure matrix, e.g. CO2 emissions (g)/pkm, means that the group that scores higher on CO2 (g)/pkm scored lower on the functions. 4) Classification results The final stage of the analysis is to see how well the model performs by comparing the allocated group membership with the group membership predicted by the model.
7 An eigenvalue for a discriminant function is the ratio of the between-groups sum of squares to the within-group sum of squares for an ANOVA that has the discriminant function as the dependent variable and groups as levels of a factor.
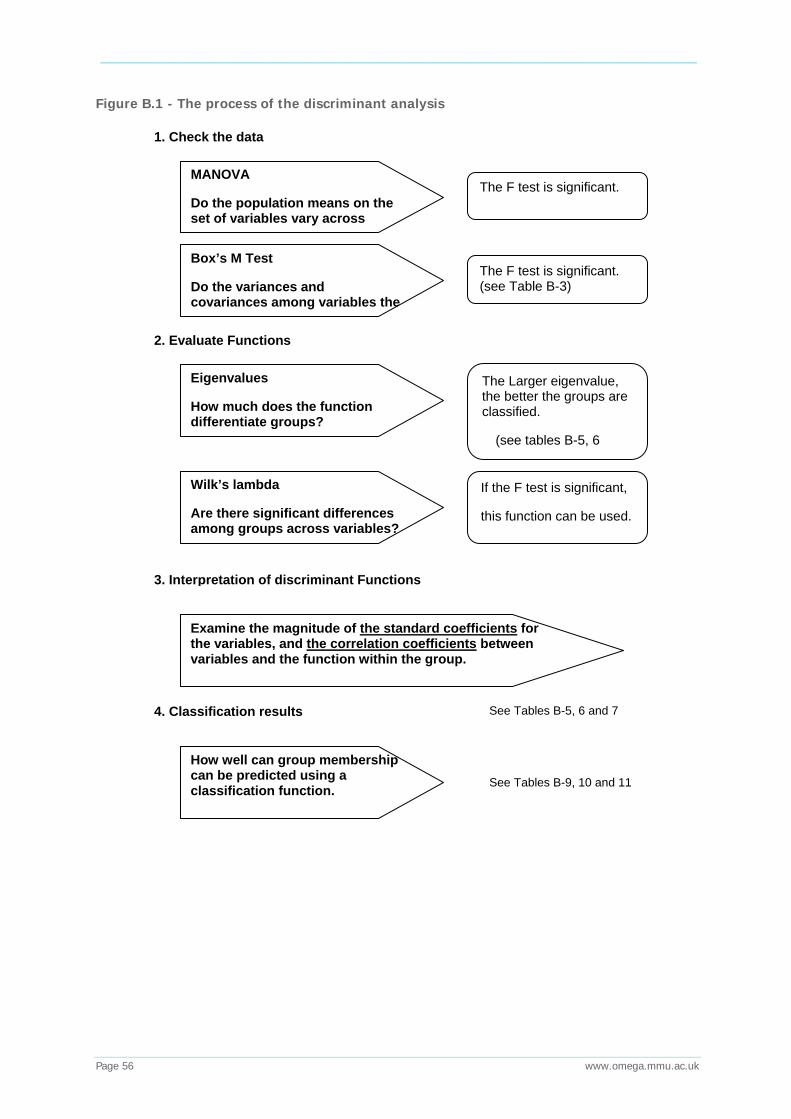
_____________________________________________________________________________________________________
Page 56 www.omega.mmu.ac.uk
Figure B.1 - The process of the discriminant analysis
1. Check the data
2. Evaluate Functions
3. Interpretation of discriminant Functions
4. Classification results
MANOVA
Do the population means on the set of variables vary across
Box’s M Test
Do the variances and covariances among variables the
Eigenvalues
How much does the function differentiate groups?
Wilk’s lambda
Are there significant differences among groups across variables?
Examine the magnitude of the standard coefficients for the variables, and the correlation coefficients between variables and the function within the group.
How well can group membership can be predicted using a classification function.
The F test is significant.
The Larger eigenvalue, the better the groups are classified.
(see tables B-5, 6
The F test is significant. (see Table B-3)
If the F test is significant,
this function can be used.
See Tables B-5, 6 and 7
See Tables B-9, 10 and 11
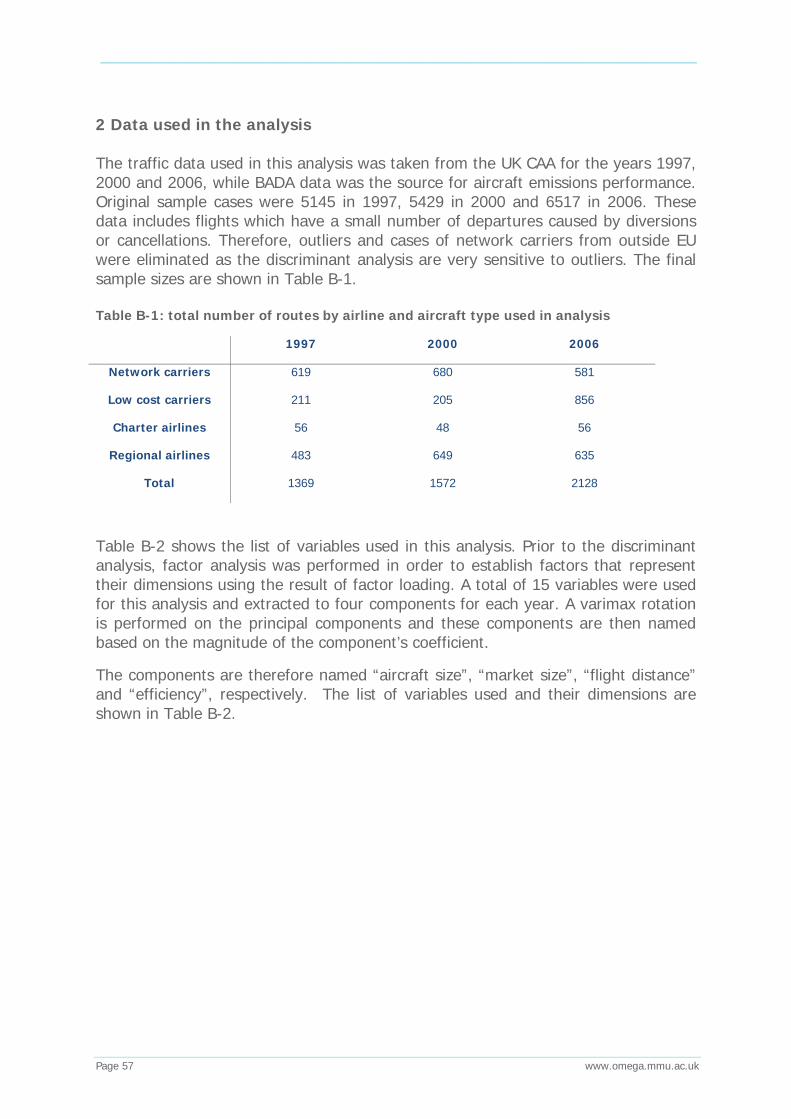
_____________________________________________________________________________________________________
Page 57 www.omega.mmu.ac.uk
2 Data used in the analysis The traffic data used in this analysis was taken from the UK CAA for the years 1997, 2000 and 2006, while BADA data was the source for aircraft emissions performance. Original sample cases were 5145 in 1997, 5429 in 2000 and 6517 in 2006. These data includes flights which have a small number of departures caused by diversions or cancellations. Therefore, outliers and cases of network carriers from outside EU were eliminated as the discriminant analysis are very sensitive to outliers. The final sample sizes are shown in Table B-1. Table B-1: total number of routes by airline and aircraft type used in analysis
1997 2000 2006
Network carriers 619 680 581
Low cost carriers 211 205 856
Charter airlines 56 48 56
Regional airlines 483 649 635
Total 1369 1572 2128
Table B-2 shows the list of variables used in this analysis. Prior to the discriminant analysis, factor analysis was performed in order to establish factors that represent their dimensions using the result of factor loading. A total of 15 variables were used for this analysis and extracted to four components for each year. A varimax rotation is performed on the principal components and these components are then named based on the magnitude of the component’s coefficient.
The components are therefore named “aircraft size”, “market size”, “flight distance” and “efficiency”, respectively. The list of variables used and their dimensions are shown in Table B-2.
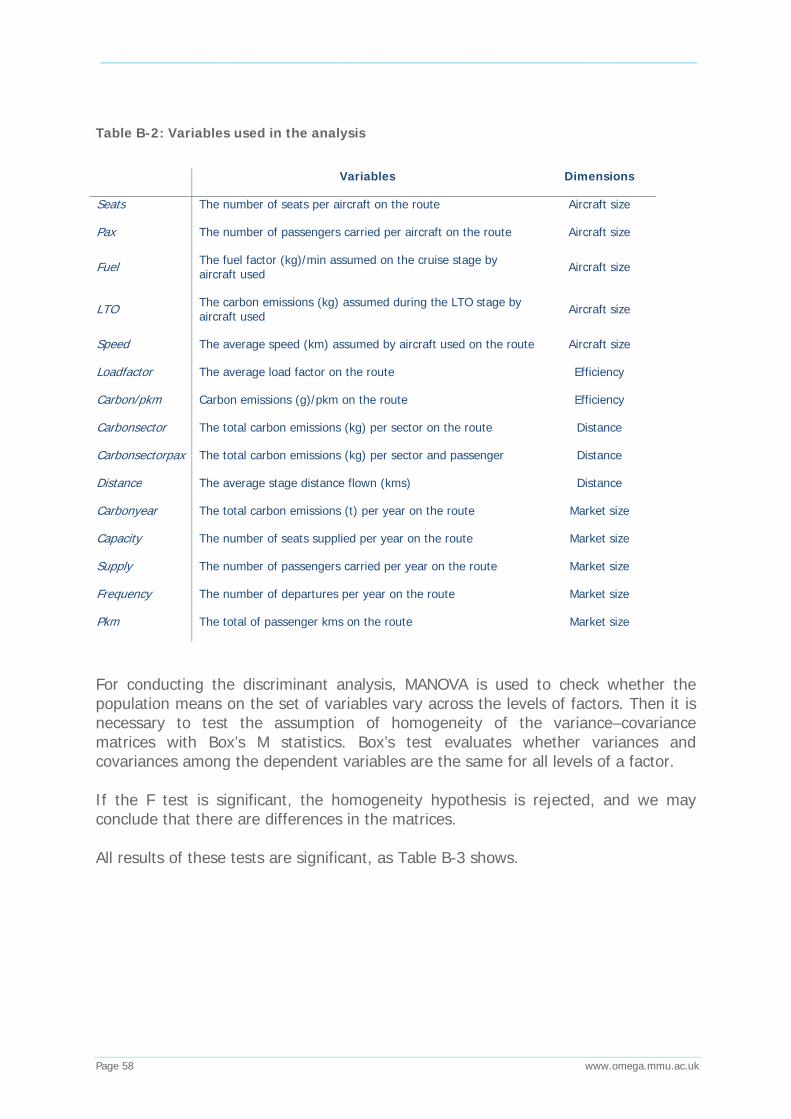
_____________________________________________________________________________________________________
Page 58 www.omega.mmu.ac.uk
Table B-2: Variables used in the analysis
For conducting the discriminant analysis, MANOVA is used to check whether the population means on the set of variables vary across the levels of factors. Then it is necessary to test the assumption of homogeneity of the variance–covariance matrices with Box’s M statistics. Box’s test evaluates whether variances and covariances among the dependent variables are the same for all levels of a factor. If the F test is significant, the homogeneity hypothesis is rejected, and we may conclude that there are differences in the matrices. All results of these tests are significant, as Table B-3 shows.
Variables Dimensions
Seats The number of seats per aircraft on the route Aircraft size
Pax The number of passengers carried per aircraft on the route Aircraft size
Fuel The fuel factor (kg)/min assumed on the cruise stage by aircraft used Aircraft size
LTO The carbon emissions (kg) assumed during the LTO stage by aircraft used Aircraft size
Speed The average speed (km) assumed by aircraft used on the route Aircraft size
Loadfactor The average load factor on the route Efficiency
Carbon/pkm Carbon emissions (g)/pkm on the route Efficiency
Carbonsector The total carbon emissions (kg) per sector on the route Distance
Carbonsectorpax The total carbon emissions (kg) per sector and passenger Distance
Distance The average stage distance flown (kms) Distance
Carbonyear The total carbon emissions (t) per year on the route Market size
Capacity The number of seats supplied per year on the route Market size
Supply The number of passengers carried per year on the route Market size
Frequency The number of departures per year on the route Market size
Pkm The total of passenger kms on the route Market size

_____________________________________________________________________________________________________
Page 59 www.omega.mmu.ac.uk
Table B-3: Results of Box’ M test
1997 2000 2006
Box’s M 10550 13180 19429
F 27.9 34.6 51.7
Df 1 360 360 360
Sig 0.001 0.001 0.001
Note: the results indicate significant differences in means on the predictors among the four airline groups.
Two discriminant functions are used based on the results of the Wilk’s Lambda, Eigenvalues and eta squares. All the Wilk’s Lambda’s results were significant at the 0.05 level and indicate that there are significant differences among groups and variables. Therefore, all three discriminant functions can be used (see Table B-4). Table B-4: Results of the Wilk’s lambda
1997 Test of functions Wilk’s Lambda Chi- square df Sig.
1 through 3 0.448 1092 45 0.001
2 through 3 0.902 140 28 0.001
3 0.971 39 13 0.001
2000 Test of functions Wilk’s Lambda Chi- square df Sig.
1 through 3 0.277 2017 45 0.001
2 through 3 0.715 526 28 0.001
3 0.904 158 13 0.001
2006 Test of functions Wilk’s Lambda Chi- square df Sig.
1 through 3 0.151 4000 45 0.001
2 through 3 0.555 1245 28 0.001
3 0.878 275 13 0.001
For example, in the results of the analysis for 1997, the first discriminant function has an eigenvalue of 1.014. The eta square value means 50.4% of the variability of the scores for the first discriminant function is accounted for by the differences between three airline groups and 7% of the second function, respectively. The results of Eigenvalues and eta squares are shown in Tables B-5, B-6 and B-7.

_____________________________________________________________________________________________________
Page 60 www.omega.mmu.ac.uk
Based on the overall results of the Wilk’s lambda and the eta square values, the first and second discriminant functions are used for further analysis. 3 Interpretations of the discriminant functions The two discriminant functions are estimated for the four airline model groups. The equations are as follows. D1 = ß1Seats + ß2Pax + ß3Fuel + ß4LTO + ß5Speed + ß6Loadfactor + ß7Carbonpkm + ß8CarbonSector +
ß9Carbonsectorpax +ß10Distance + ß11Carbonyear + ß12Capacity + ß13Supply + ß14Frequency + ß15Pkm
Standardised coefficients for each variable in each discriminant function can be interpreted as follows: the larger the standardised coefficient, the greater the contribution of the respective variable to the discrimination between groups (Green et al, 2000). The standard coefficients of each function and structure matrices (correlation coefficients) are shown in Tables B-5, B-6 and B-7.
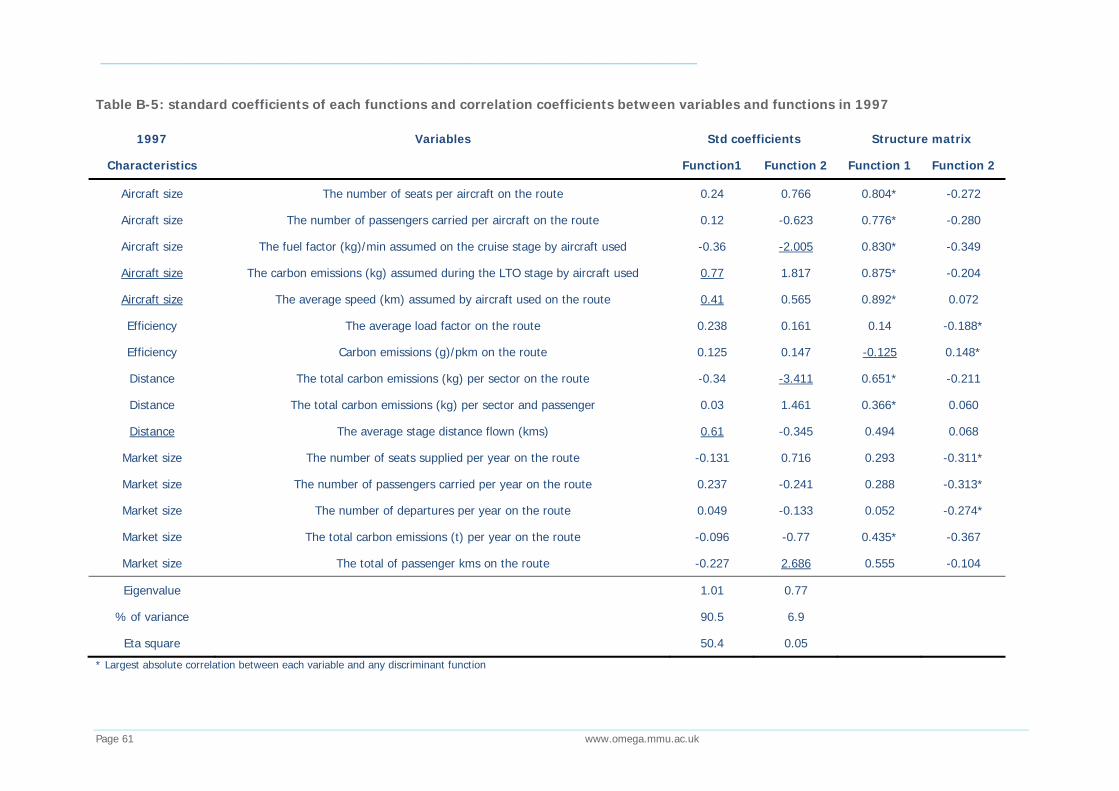
_____________________________________________________________________________________________________
Page 61 www.omega.mmu.ac.uk
Table B-5: standard coefficients of each functions and correlation coefficients between variables and functions in 1997
1997 Variables Std coefficients Structure matrix
Characteristics Function1 Function 2 Function 1 Function 2
Aircraft size The number of seats per aircraft on the route 0.24 0.766 0.804* -0.272
Aircraft size The number of passengers carried per aircraft on the route 0.12 -0.623 0.776* -0.280
Aircraft size The fuel factor (kg)/min assumed on the cruise stage by aircraft used -0.36 -2.005 0.830* -0.349
Aircraft size The carbon emissions (kg) assumed during the LTO stage by aircraft used 0.77 1.817 0.875* -0.204
Aircraft size The average speed (km) assumed by aircraft used on the route 0.41 0.565 0.892* 0.072
Efficiency The average load factor on the route 0.238 0.161 0.14 -0.188*
Efficiency Carbon emissions (g)/pkm on the route 0.125 0.147 -0.125 0.148*
Distance The total carbon emissions (kg) per sector on the route -0.34 -3.411 0.651* -0.211
Distance The total carbon emissions (kg) per sector and passenger 0.03 1.461 0.366* 0.060
Distance The average stage distance flown (kms) 0.61 -0.345 0.494 0.068
Market size The number of seats supplied per year on the route -0.131 0.716 0.293 -0.311*
Market size The number of passengers carried per year on the route 0.237 -0.241 0.288 -0.313*
Market size The number of departures per year on the route 0.049 -0.133 0.052 -0.274*
Market size The total carbon emissions (t) per year on the route -0.096 -0.77 0.435* -0.367
Market size The total of passenger kms on the route -0.227 2.686 0.555 -0.104
Eigenvalue 1.01 0.77
% of variance 90.5 6.9
Eta square 50.4 0.05
* Largest absolute correlation between each variable and any discriminant function
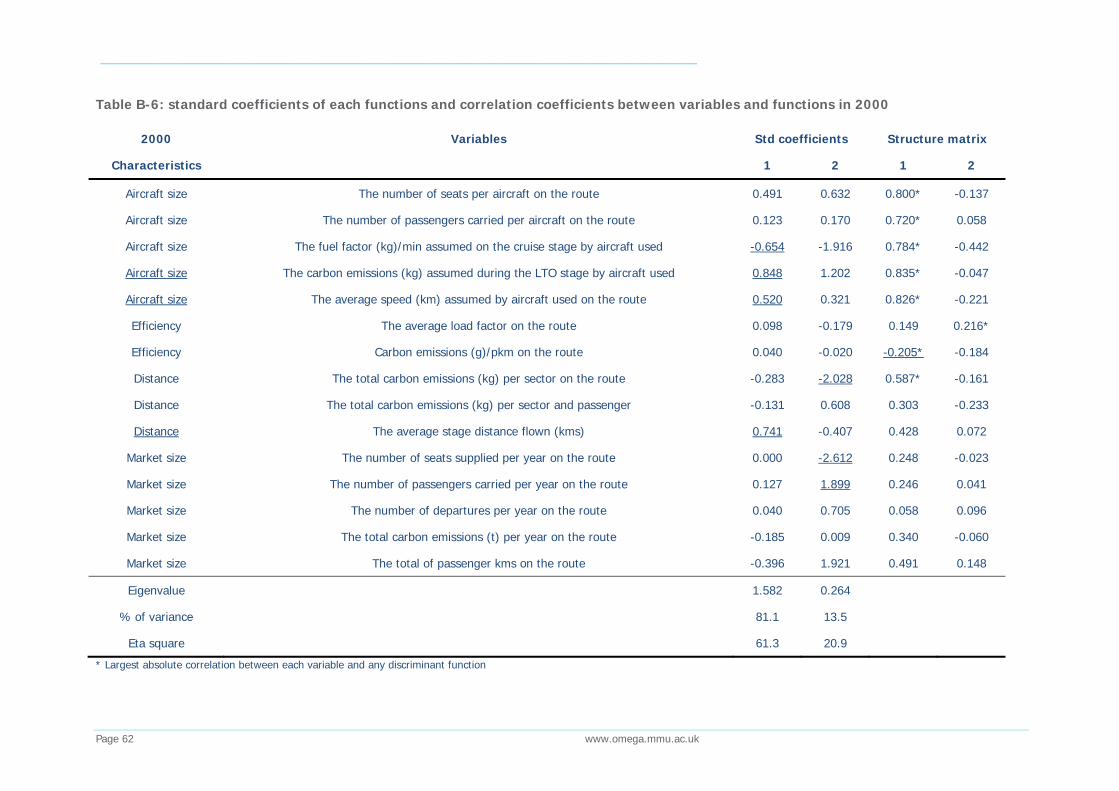
_____________________________________________________________________________________________________
Page 62 www.omega.mmu.ac.uk
Table B-6: standard coefficients of each functions and correlation coefficients between variables and functions in 2000
2000 Variables Std coefficients Structure matrix
Characteristics 1 2 1 2
Aircraft size The number of seats per aircraft on the route 0.491 0.632 0.800* -0.137
Aircraft size The number of passengers carried per aircraft on the route 0.123 0.170 0.720* 0.058
Aircraft size The fuel factor (kg)/min assumed on the cruise stage by aircraft used -0.654 -1.916 0.784* -0.442
Aircraft size The carbon emissions (kg) assumed during the LTO stage by aircraft used 0.848 1.202 0.835* -0.047
Aircraft size The average speed (km) assumed by aircraft used on the route 0.520 0.321 0.826* -0.221
Efficiency The average load factor on the route 0.098 -0.179 0.149 0.216*
Efficiency Carbon emissions (g)/pkm on the route 0.040 -0.020 -0.205* -0.184
Distance The total carbon emissions (kg) per sector on the route -0.283 -2.028 0.587* -0.161
Distance The total carbon emissions (kg) per sector and passenger -0.131 0.608 0.303 -0.233
Distance The average stage distance flown (kms) 0.741 -0.407 0.428 0.072
Market size The number of seats supplied per year on the route 0.000 -2.612 0.248 -0.023
Market size The number of passengers carried per year on the route 0.127 1.899 0.246 0.041
Market size The number of departures per year on the route 0.040 0.705 0.058 0.096
Market size The total carbon emissions (t) per year on the route -0.185 0.009 0.340 -0.060
Market size The total of passenger kms on the route -0.396 1.921 0.491 0.148
Eigenvalue 1.582 0.264
% of variance 81.1 13.5
Eta square 61.3 20.9
* Largest absolute correlation between each variable and any discriminant function
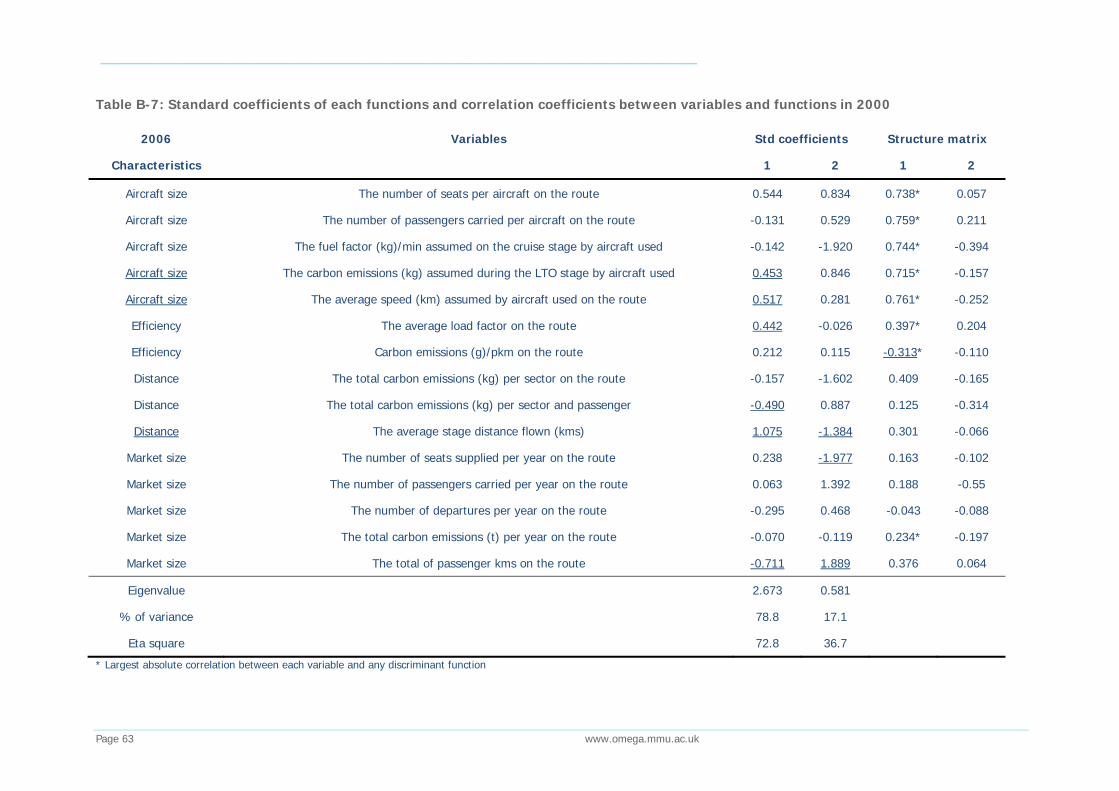
_____________________________________________________________________________________________________
Page 63 www.omega.mmu.ac.uk
Table B-7: Standard coefficients of each functions and correlation coefficients between variables and functions in 2000
2006 Variables Std coefficients Structure matrix
Characteristics 1 2 1 2
Aircraft size The number of seats per aircraft on the route 0.544 0.834 0.738* 0.057
Aircraft size The number of passengers carried per aircraft on the route -0.131 0.529 0.759* 0.211
Aircraft size The fuel factor (kg)/min assumed on the cruise stage by aircraft used -0.142 -1.920 0.744* -0.394
Aircraft size The carbon emissions (kg) assumed during the LTO stage by aircraft used 0.453 0.846 0.715* -0.157
Aircraft size The average speed (km) assumed by aircraft used on the route 0.517 0.281 0.761* -0.252
Efficiency The average load factor on the route 0.442 -0.026 0.397* 0.204
Efficiency Carbon emissions (g)/pkm on the route 0.212 0.115 -0.313* -0.110
Distance The total carbon emissions (kg) per sector on the route -0.157 -1.602 0.409 -0.165
Distance The total carbon emissions (kg) per sector and passenger -0.490 0.887 0.125 -0.314
Distance The average stage distance flown (kms) 1.075 -1.384 0.301 -0.066
Market size The number of seats supplied per year on the route 0.238 -1.977 0.163 -0.102
Market size The number of passengers carried per year on the route 0.063 1.392 0.188 -0.55
Market size The number of departures per year on the route -0.295 0.468 -0.043 -0.088
Market size The total carbon emissions (t) per year on the route -0.070 -0.119 0.234* -0.197
Market size The total of passenger kms on the route -0.711 1.889 0.376 0.064
Eigenvalue 2.673 0.581
% of variance 78.8 17.1
Eta square 72.8 36.7
* Largest absolute correlation between each variable and any discriminant function
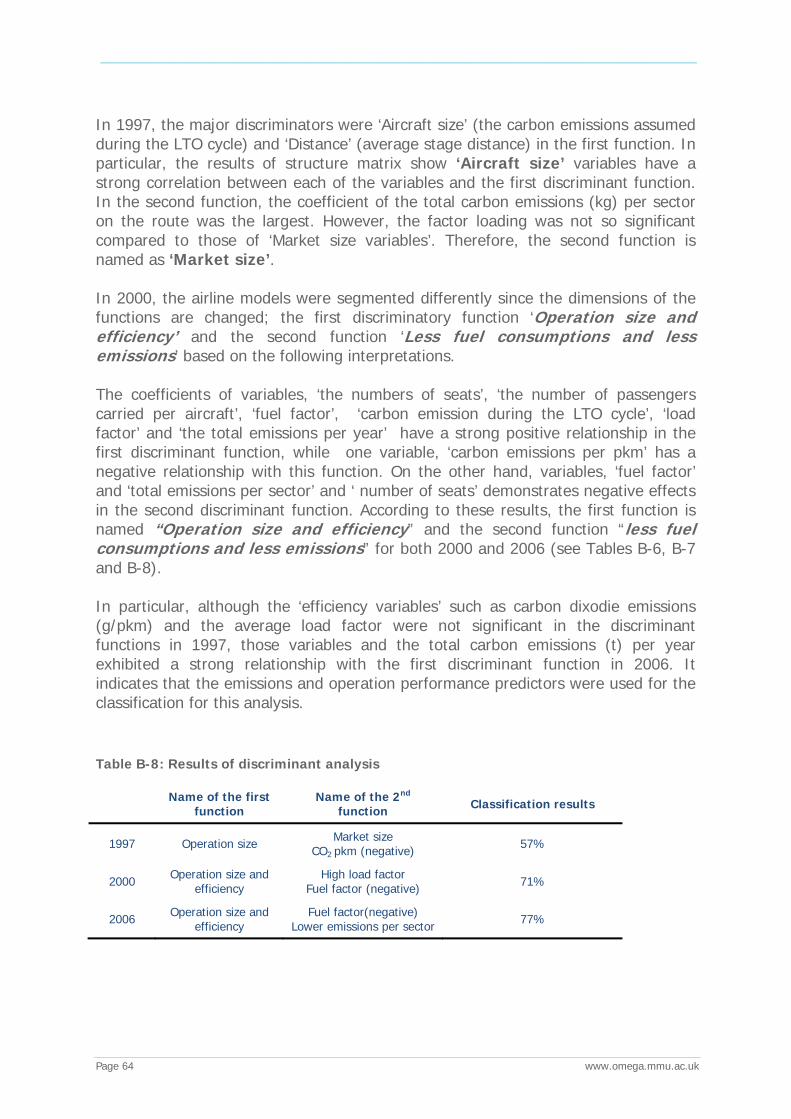
_____________________________________________________________________________________________________
Page 64 www.omega.mmu.ac.uk
In 1997, the major discriminators were ‘Aircraft size’ (the carbon emissions assumed during the LTO cycle) and ‘Distance’ (average stage distance) in the first function. In particular, the results of structure matrix show ‘Aircraft size’ variables have a strong correlation between each of the variables and the first discriminant function. In the second function, the coefficient of the total carbon emissions (kg) per sector on the route was the largest. However, the factor loading was not so significant compared to those of ‘Market size variables’. Therefore, the second function is named as ‘Market size’. In 2000, the airline models were segmented differently since the dimensions of the functions are changed; the first discriminatory function ‘Operation size and efficiency’ and the second function ‘Less fuel consumptions and less emissions’ based on the following interpretations. The coefficients of variables, ‘the numbers of seats’, ‘the number of passengers carried per aircraft’, ‘fuel factor’, ‘carbon emission during the LTO cycle’, ‘load factor’ and ‘the total emissions per year’ have a strong positive relationship in the first discriminant function, while one variable, ‘carbon emissions per pkm’ has a negative relationship with this function. On the other hand, variables, ‘fuel factor’ and ‘total emissions per sector’ and ‘ number of seats’ demonstrates negative effects in the second discriminant function. According to these results, the first function is named “Operation size and efficiency” and the second function “less fuel consumptions and less emissions” for both 2000 and 2006 (see Tables B-6, B-7 and B-8). In particular, although the ‘efficiency variables’ such as carbon dixodie emissions (g/pkm) and the average load factor were not significant in the discriminant functions in 1997, those variables and the total carbon emissions (t) per year exhibited a strong relationship with the first discriminant function in 2006. It indicates that the emissions and operation performance predictors were used for the classification for this analysis.
Table B-8: Results of discriminant analysis
Name of the first function
Name of the 2nd function Classification results
1997 Operation size Market size CO2 pkm (negative) 57%
2000 Operation size and efficiency
High load factor Fuel factor (negative) 71%
2006 Operation size and efficiency
Fuel factor(negative) Lower emissions per sector 77%
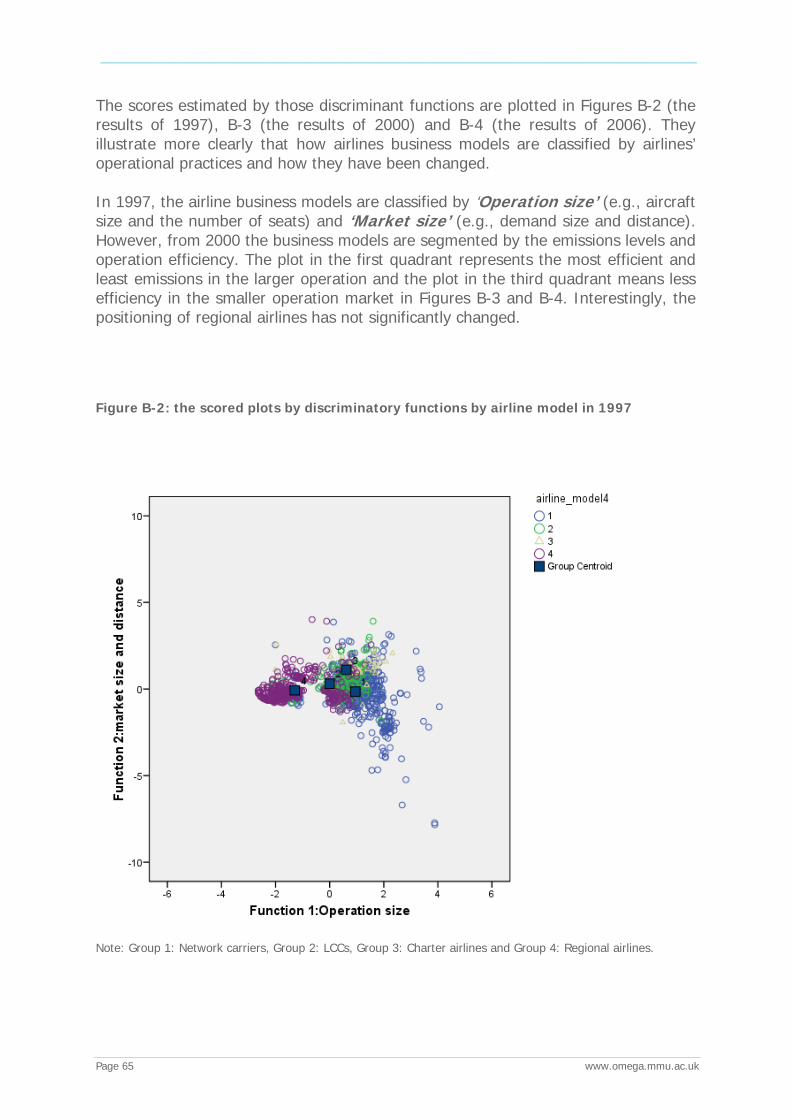
_____________________________________________________________________________________________________
Page 65 www.omega.mmu.ac.uk
The scores estimated by those discriminant functions are plotted in Figures B-2 (the results of 1997), B-3 (the results of 2000) and B-4 (the results of 2006). They illustrate more clearly that how airlines business models are classified by airlines’ operational practices and how they have been changed. In 1997, the airline business models are classified by ‘Operation size’ (e.g., aircraft size and the number of seats) and ‘Market size’ (e.g., demand size and distance). However, from 2000 the business models are segmented by the emissions levels and operation efficiency. The plot in the first quadrant represents the most efficient and least emissions in the larger operation and the plot in the third quadrant means less efficiency in the smaller operation market in Figures B-3 and B-4. Interestingly, the positioning of regional airlines has not significantly changed. Figure B-2: the scored plots by discriminatory functions by airline model in 1997
Note: Group 1: Network carriers, Group 2: LCCs, Group 3: Charter airlines and Group 4: Regional airlines.
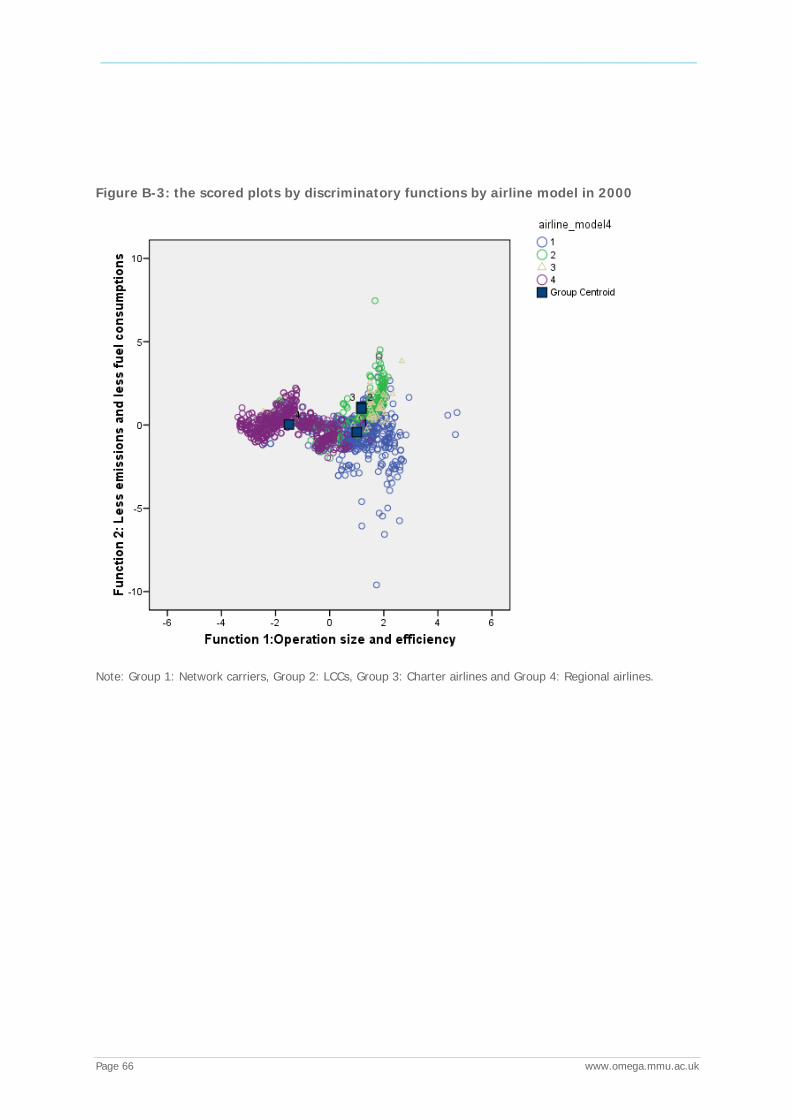
_____________________________________________________________________________________________________
Page 66 www.omega.mmu.ac.uk
Figure B-3: the scored plots by discriminatory functions by airline model in 2000
Note: Group 1: Network carriers, Group 2: LCCs, Group 3: Charter airlines and Group 4: Regional airlines.
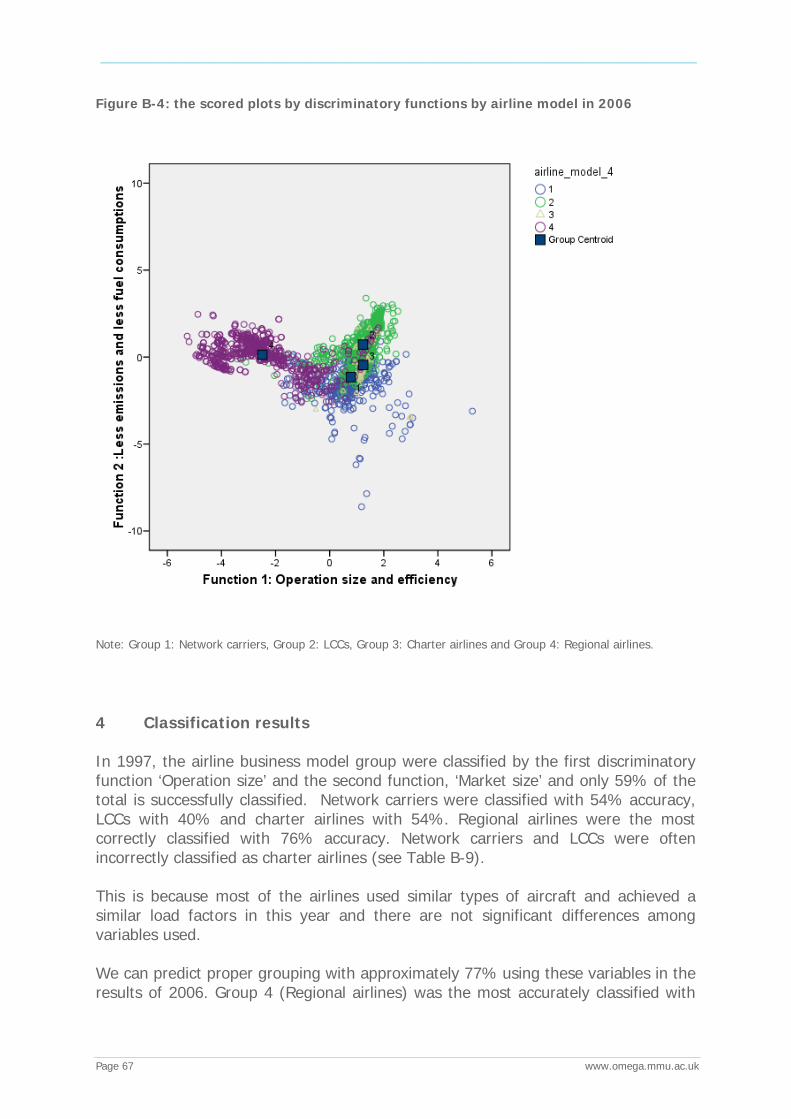
_____________________________________________________________________________________________________
Page 67 www.omega.mmu.ac.uk
Figure B-4: the scored plots by discriminatory functions by airline model in 2006
Note: Group 1: Network carriers, Group 2: LCCs, Group 3: Charter airlines and Group 4: Regional airlines.
4 Classification results In 1997, the airline business model group were classified by the first discriminatory function ‘Operation size’ and the second function, ‘Market size’ and only 59% of the total is successfully classified. Network carriers were classified with 54% accuracy, LCCs with 40% and charter airlines with 54%. Regional airlines were the most correctly classified with 76% accuracy. Network carriers and LCCs were often incorrectly classified as charter airlines (see Table B-9). This is because most of the airlines used similar types of aircraft and achieved a similar load factors in this year and there are not significant differences among variables used. We can predict proper grouping with approximately 77% using these variables in the results of 2006. Group 4 (Regional airlines) was the most accurately classified with

_____________________________________________________________________________________________________
Page 68 www.omega.mmu.ac.uk
82%. Group 2 (LCCs) was next with 76%, followed by Group 1 (Network carriers) with 72%. Group 3 (C: charter airlines) was the least, with 70 %. Incorrectly classified network carriers were most likely to be classified as LCCs and regional airlines rather than charter airlines. LCCs were most likely to be classified as Network carriers. Charter airlines were most likely to be classified incorrectly as network carriers. The results for 2006 imply that network carriers cover similar routes as LCCs using similar types of operational practices compared to charter airlines and regional airlines. Table B-9: Classification results in 1997
Actual airline model
Predicted % of airline business models
Network carriers LCCs Charter
airlines Regional airlines Total
Network carriers LCCs Charter airlines Regional airlines
54% 14% 5% 4%
16% 40% 25% 17%
20% 19% 54% 3%
10% 27% 16% 76%
100% 100% 100% 100%
Overall results 59%
Table B-10: Classification results in 2000
Actual airline model
Predicted % of airline business models
Network carriers LCCs Charter
airlines Regional airlines Total
Network carriers LCCs Charter airlines Regional airlines
65% 14% 6% 20%
16% 64% 8%
0.5%
10% 13% 73% 0.5%
9% 9% 13% 79%
100% 100% 100% 100%
Overall results, 71%
Table B-11: Classification results in 2006
Actual airline model
Predicted % of airline business models
Network carriers LCCs Charter
airlines Regional airlines Total
Network carriers LCCs Charter airlines Regional airlines
72% 13% 20% 15%
17% 76% 10% 3%
6% 9%
70% 0%
5% 2% 0%
82%
100% 100% 100% 100%
Overall results, 77%

_____________________________________________________________________________________________________
Page 69 www.omega.mmu.ac.uk
5. Conclusions In 1997, the airline business models were classified by ‘Operation size’ and ‘Market size’ of the route serving by airlines. The results did not show significant differences between the airlines models as most airlines at that time used similar types of aircraft and had similar operational practices; e.g. they had similar load factors. Since 2000, however, the airlines business models were classified by ‘Operation size and efficiency’ and ‘Emissions level’ and ‘Efficiency’. The scored plots by discriminant functions clearly illustrate the differences among airline business models by 2006. These outcomes indicate that airlines have been focusing on their business model and improving fuel and emission efficiency by increasing load factor, the number of seats per aircraft, the average distance flown and switching more efficiency aircraft for nine years from 1997 to 2006. This may be as a results of competition, fuel price increases after September 11, and the expansion of the EU. In addition, the 2006 analysis shows that the differentiation between LCCs and network carriers is not always clear-cut. Indeed, LCCs were classified as Network carriers in 13% of the total and Network carriers were classified as LCCs in 17% of the total. The results demonstrate that LCCs and network carriers cover similar routes with similar operating and emissions performance as network carriers improved their efficiency on several routes in 2006.