airlift recirculation well final report -southern sector/67531/metadc702651/m2/1/high... ·...
TRANSCRIPT

WSRC-TR-98-O0428
Airlift Recirculation Well Final Report - Southern Sector
by
R. M. White
Westinghouse Savannah River Company
Savannah Rhrer SiteAiken, South Carolina 29808
DOE Contract No. DE-AC09-96SR1 8500
This paper was prepared in connection with work done under the above contract number with the U. S.Department of Energy. By acceptance of this paper, the publisher ancf/or recipient acknowledges the U. S.Government’s right to retain a nonexclusive, royalty-free license in and to any copyright covering this paper,along with the right to reproduce and to authorize others to reproduce all or part of the copyrighted paper.

!$’
WSRC-TR-98-O0428Rev. O
AIRLIFT RECIRCULATION WELL
FINAL REPORT - SOUTHERN SECTOR (U)
RM. white
UNCLASSIFIED
Westinghouse Savannah River CompanySavannah River SiteAIken,SC 29808
Mm ‘“
SAVANNAH RIVER 51TE

WSRC-TR-98-O0428Rev. O
DISCLAIMER
This report was prepared as s.11mco~t of work sponsoti by an agency of the United StatesGovernment. Neither the United Sutes Gov~ent nor my agency thereof, nor any of theiremployees, makes any warranty, express or mphed, or assumes any legal liability orresponsibility for the accuracy, completeness, or usetiess of any information, apparatus,producL or process disclosed, or represents that its use would not infringe privately owned rights.Reference herein to any specific commercial produc~ process, or service by trade name,trademark, manufacturer, or othenvise does not necessarily constitute or imply its endorsemen~recommendation, or favoring by the United States Government or any agency thereof. Theviews and opinions of authors expressed herein do not necessarily state or reflect those of theUnited States Government or any agency thereof.
This report has been reproduced directly km the best avsilable copy.
Available to DOE and DOE contractors finm the Office of Scientific and Technical Information,P.O. Box 62, Oak Ridge, TN 37831; prices available from (615) 576-8401.
Available to the pubIic from the National Technical Information Service, U.S. Department ofCommerce, 5285 Port Royal Road, Springfield, VA 22161.

DISCLAIMER
Portions of this document may be illegiblein electronic image products. Images areproduced from the best available originaldocument.

WSRC-TR-98-O0428Rev. O
AIRLIFT RECIRCULATION WELL
FINAL REPORT - SOUTHERN SECTOR (U)
Publication Date: March 1999
WestinghouseSavannahRiver CompanySavannahRiver SiteA&en, SC 29808

WSRC-TR-98-O0428.Rev. O Airlift Recirculation Well Final ReDort - Southern Sector ii
AIRLIFT RECIRCULATION WELL
FINAL REPORT - SOUTHERN SECTOR
Authentication and Approvals:
R. M. White, Author Date
J. G. Sonnenberg, Manager, ERTS Date

WSRC-TR-98-O0428,Rev. O Airlift Recirculation Well Final ReDort - Southern Sector ““”111
Abstract
Chlorinated solvents used in the A/M-Area at the Savannah River Site (SRS) from 1952-1982 have contaminated the groundwater under the site. Trichloroethylene (TCE) andperchloroethylene (PCE) have migrated downward through the water table and into an underlyingconfined aquifer; the Lost Lake aquifer. The various source locations and the complex hydrologyand geology underlying the A/M Area have resulted in a complex contamimnt plume that isadvancing along several fronts. Portions of the plume are migrating towards a natural seepline inthe vicinity of Tim’s Branch a tributary of the Savamah River. To comply with the requirementsof the current SCDHEC Part B Permit, this plume is being addressed by a multi-phase programunder the direction of the Environmental Restoration Division (ERD) at SRS. This report detailsthe first phase of this prograu the containment of the portion of the plume greater than 500 ppb(TCE) within the Southern Sector of the NM Area.
Airlift Recirculation Well technology was selected to intercept the leading edge of thecontaminant plume in the Southern Sector of the A/M Area. The Airlift Recirculation Well (ARW)is a new and innovative technology with potential for more cost effective implementation thanconventional pump and treat systems. Two Airlift Recirculation Wells have been installed andtested (from Dec. 1996 to March 1999) to establish the feasibility of the technology and to quanti@performance parameters needed to locate a line of these wells along the leading edge of thecontamimnt plume. The wells proved to be very sensitive to proper development, but after thisrequirement was met, performance was very good.
Key design parameters were established to allow the installation of a row of recirculation wellsthat will intercept and treat the contaminant plume. The initial in-well stripping eftlciency wasdetermined to be approximately 60%. A technology enhancement, the Multi-Stage In-Well Aerator(MIA) was identified and deployed. Initial testing indicates that the MIA can achieve in-wellstripping efficiencies of 80-9070 and perhaps higher.
The installation of the remaining wells in the treatment system will be completed and placed inservice in 1999. Additional applications of this technology are under consideration for the WesternSector of the A/M-Area and at the Miscellaneous Chemical Basin.

WSRC-TR-98-O0428.Rev. O Airlift Recirculation Well Final Re~ort - Southern Sector iv
Contents
Abstract .......................................................................................................................... iii
List of Figures .................................................................................................................v
List of Tables ................................................................................................................. vii
Introduction ..................................................................................................................... 1
Conceptual Design ........................................................................................................... 3
Results & Dkcussion .......................................................................................................9Well Development .....................................................................................................9Initial Groundwater Qutity ...................................................................................... 11Zone of Capture ....................................................................................................... 11Zone of Recirculation ............................................................................................... 13
Test Cofigwation ................................................................................................... 14Stripping Efficiency .................................................................................................. 15
Multi-stage In-well Aerator ...................................................................................... 17
Overall Treatment Efficiency .................................................................................... 17Time to Establish a Recirculation Cell ...................................................................... 22
Conclusions ................................................................................................................... 23
References ..................................................................................................................... 26
Appendix ......................................................................................................................27

WSRC-TR-98-O0428,Rev. O Airlift Recirculation Well Final Report - Southern Sector v
List of Figures
1
2
3
4
5
6
7
8
9
10
11
12
13
14
15
16
17
18
19
20
21
22
23
24
Tnchloroethylene plume at 500 ppb .....................................................................2
UVB Concept ......................................................................................................4
Recirculation well operation ................................................................................. 5
SSR-001 piezometer locations .............................................................................. 6
SSR-O 12 piezometer locations .............................................................................. 7
Recirculation well ksta~tion ...............................................................................8
Water flow tests at SSR.012 .............................................................................. 10
Potentiometric heads at lateral piezometers ........................................................ 12
Simulated groundwater flow patterns ................................................................. 13
Bromide tracer concentration at SSM.006B .......................................................28
Bromide tracer concentration at SSM-005B ....................................................... 29
Bromide tracer concentration at SSM.004B .......................................................3O
Bromide tracer concentration at SSM.004C ....................................................... 31
Bromide tracer concentration at SSM-003C ....................................................... 32
Pumping rate nomograph ................................................................................... 15
Multi-stage In-well Aerator ................................................................................ 18
TCE mass removed at SSR.012 ......................................................................... 19
TCE reduction at nearby wells ............................................................................ 19
CFSTR model schematic .................................................................................... 20
CFSTR model results ......................................................................................... 22
Aquifer response at MSB-074 ............................................................................ 23
8,000 ppb Isocontours near SSR-012 with the well in service ............................. 24
8,000 ppb Isocontours near SSR-012 with the well out of service ....................... 25
Groundwater sample analytical results - SSM-001 .............................................. 33

WSRC-TR-98-O0428,Rev. O Airlift Recirculation Well Final Re~ort - Southern Sector vi
25
26
27
28
29
30
31
32
33
34
35
36
37
38
39
40
41
42
43
Groundwater sample analytical results - SSM-O02 .............................................. 34
Groundwater sample analytical results - SSM.~3 .............................................. 35
Groundwater sample analytical results - SSM-004 .............................................. 36
Groundwater sample analytical results - SSM-005 .............................................. 37
Groundwater sample analytical results - SSM.W6 .............................................. 38
Groundwater sample analytical results - MSB-074 ............................................. 39
Groundwater sample analytical results - SSM-007 .............................................. 40
Groundwater sample analytical results - SSM-008 .............................................. 41
Groundwater sample analytical results - SSM-009 .............................................. 42
Dissolved Oxygen concentration - SSM-001 ...................................................... 43
Dissolved Oxygen concentration - SSM-002 ......................................................~
Dissolved Oxygen concentration - SSM-O03 ...................................................... 45
Dissolved Oxygen concentration - SSM.004 ......................................................46
Dissolved Oxygen concentration - SSM-005 ...................................................... 47
Dissolved Oxygen concentration - SSM-006 ......................................................48
Dissolved Oxygen concentration – MSB-074 ..................................................... 49
Dissolved Oxygen concentration - SSM-007 ......................................................5O
Dissolved Oxygen concentration - SSM-008 ......................................................5l
Dissolved Oxygen concentration - SSM-009 ...................................................... 52

WSRC-TR-98-O0428,Rev. O Airlift Recirculation Well Final Report - Southerm Sector vii
List of Tables
1
2
3
4
5
6
7
8
9
Southern Sector Aquifer Parameters ..................................................................... 9
Tracer travel time ............................................................................................... 12
Typical operating parameters @ SSR.012 .......................................................... 13
Results of groundwater sampling Wells SSM-001 and 002 ................................. 53
Results of groundwater sampling Wells SSM-003 and 004 ................................. 54
Results of groundwater sampling Wells MSB-074 and SSM-005 ........................ 55
Results of groundwater sampling Wells SSM-006 and 007 ................................. 56
Results of groundwater sampling Wells SSM-008 and 009 ................................. 56
Results of exhaust air sampling – SSR.012 .........................................................57

WSRC-TR-98-O0428,Rev. O Airlift Recirculation Well Final Report - Southern Sector 1
Introduction
Metal finishing operations at the Savannah River Site (SRS) A/M-Area utilized chlorinatedsolvents for decreasing and cleaning activities from the 1950’s to the 1980’s. From 1952 to 1982an estimated 13 million pounds of chlorinated solvents, primarily trichloroethylene (TCE) andperchloroethylene (PCE), were used in the M-Area. Much of this solvent evaporated during usebut residual solvent was discharged to a process sewer system. Approximately two n-dlionpounds of solvent are estimated to have been released to the M-Area Settling Basin. Another oneand one-half million pounds was released to the A-014 outfall.
TCE and PCE were first identified in the local groundwater in 1981. Pump and treattechnology was initiated in 1983 and continues today. Hazardous materials in the M-AreaSettling Basin have been stabilized and the basin has been capped and closed. The TCE and PCEplumes in the groundwater are in the process of characterization and continue to be monitored.The M-Area RCRA Part B permit allows implementation of innovative technologies for thecharacterization and treatment of dissolved DNAPL (Dense Non-Aqueous Phase Liquid) plumesand soil contamination in the A/M-Areas.
The groundwater plume has moved downward into a confined aquifer (the Lost Lake aquifer)and is continuing generally southward into the southern part of the A/M-Area (the SouthernSector). The Southern Sector is undeveloped and heavily forested. The Part B Permit Applicationfor the Southern Sector of the A/M Area requires the TCE plume to be hydraulically controlledat the 500 ppb isoconcentration location. Airlift Recirculation Well (ARW) technology waschosen for use in this area because of its technical potential and because it treats the groundwaterwithout bringing it to the surface. This eliminates the need to create and permit an outfall for thetreated water discharge, thereby reducing costs and the risk of personnel exposure to listedcontaminants. Recirculation wells also improve conditions for natural bioremediation bymaintaining or increasing levels of dissolved oxygen in the aquifer.
An areal view of the AIM Area of the Savannah River Site is presented on F@u-e 1. TheA/M Area has been divided into sectors, based roughly upon location relative to the central partof the area. Quarterly monitoring well data and depth discrete soil headspace data from soilborings was used to estimate the location of the leading edge of the 500 ppb isoconcentrationcontour of the TCE plume. This plume is shown on Figure 1. The configuration of the TCEplume in the Lost Lake aquifer consists of two primary components within the Southern Sector.A larger lobe was estimated to extend along a half-mile front from the vicinity of monitoring wellMSB-040 to monitoring well MSB-074. A narrower plume appears to follow Tim’s Branch, atributary of the Upper Three Runs Creek, and a receptor of discharges from the A-014 Outfall.

107m -
loocwr -
10504M -
104OOU-
103OCU-
sRs
102004 -
N0r Iolow -t~
1CD300-: .-
S9000 -
ssouo -
97000 -
-\----- \,/’ ‘Central ‘j
‘ A/M Area “1)
WSRC-TR-98-O0428,Rev. O Airlift Recirculation Well Final Report - Southern Sector 2
/’/’
‘~~0 431XXJ 44000 &O 460W 47000 4S(W 49(WI 54M0 5tO(10 52S00 53002 54000 5
errs EoSting
v~~ >520 ~~b TCE Areal View of the 500 ppb TCE Isocontour
— WeaiwnLinecdVRWSptsm with Proposed Lines of Remediation— Eoat6m Line d VW System for Vertical Recirculation Wells
Figure 1: Trichloroethylene plnme at 500 ppb
The objective of this study was to install and to test two airlift recirculation wells (one at eachend of the broader lobe of the plumq i.e. the Eastern Front) and to determine the followinginformation:
. the size of the area under the hydraulic control of the recirculation well (the Zone ofCapture or ZOC);

WSRC-TR-98-O0428,Rev. O Airlift Recirculation Well Final Report - Southern Sector 3
. the size of the area in which treated water is recaptured for another pass through therecirculation well (the Zone of Recirculation or ZOR);
. the in-well vapor stripping efficiency of the wells;
. the overall treatment efficiency of the wells relative to the contaminated plum~
. the length of time necessary to establish the recirculation well Zone of Capture;
. the feasibility of using recirculation well technology to control the contaminant plume atthe 500 ppb isoconcentration line;
. the appropriate well spacing along the Eastern Front for effective plume control;
● operating data necessary for preparation of the revised Corrective Action EngineeringReport and associated permits for this area.
The initial results from this work are described in a progress report (Airlift Recirculation WellTest Results – Southern Sector, WSRC-TR-97-O0246). Problems with temporary utility services,well development, and hightx than expected contaminant levels in the eastern part of the siteresulted in the bulk of the effort being directed towards one well, SSR-O12.
Conceptual Design
Much of the fundamental research concerning recirculation wells can be traced to the work ofHerding and Stamm in developing the GZB concept. The GZB (Gnmwasser Zirkulations Brumenor groundwater circulation wells) concept is a generalization of the UVB concept. The UVB(Unterdruck Verdampfer Brunnen or vacuum vaporizer wells) concept utilizes a motor drivenpump to circulate groundwater and a vacuum system to aerate the water to remove volatilecontaminants. See Figure 2.
The Airlift Recirculation Well is, first of all, an in-well vapor stripping system. Additionally, thesewells set up a recirculation zone within the aquifer. Air injected near the bottom of the airlift pump(see Figure 3) rises toward the surface creating a column of air and water. The air/water mixture,being lighter than the water in the surrounding saturated zone, is pushed upward. As the air/watermixture passes through the pump, volatile contaminants are stripped from the water and aredischarged with the air.
As groundwater is pumped from the bottom of the aquifer and reintroduced at the top of theaquifer a circulating flow of water is created. Depending upon the natural flow patterns present,the recirculating groundwater may pass through the well a number of times before slippingdowngradient.

WSRC-TR-98-O0428,Rev. O Airlift Recirculation Well Final Report - Southern Sector 4
“’awl% mt’tm
Figure 2: UVB concept
Early UVB research led to the development of various distinct systems for in-well vaporstripping. In the United States, the ARW concept was developed by Gorelick & Gvirtzman (theNoVOC’S concept) and by Pennington (the Density Driven Convection concept). The ARWutilizes airlift pumping and direct air injection for the in-well pumping and stripping actions ratherthan vacuum and a pinhole plate as is used in the UVB. All of these technologies, however, areintended to create the same recirculating flow of groundwater in the aquifer. Consequently,Herrling’s original analysis of groundwater flow and recirculation cell development is stillapplicable.
Our fwst two well locations were selected to be just downgradient of the projected 500 ppbisoconcentration contour at each end of the Eastern Front. This established the two ends of aproposed line of recirculation wells intended to capture and treat this plume front.

WSRC-TR-98-O0428,Rev. O Airlift Recirculation Well Final Reuort - Southern Sector 5
Figure 3: Recirculation well operation
Herrling’s approach was used to estimate the number of recirculation wells required to capturethe plume front at various pumping rates. For a flow range of 5 – 80 gp~ the number of wellsrequired was estimated to be from 5 – 13. Twelve was felt to be a conservative number, howeverrather than committing immediately to a fixed number of wells, two initial sites were chosen; one ateach end of the Eastern Front. This would allow the ARW concept to be tested to confiim theproper well spacing necessary before committing the resources needed for a full suite of wells.Twelve wells would result in a uniform well spacing of 252 feet. The first two wells weredesignated SSR-001 and SSR-012. These two wells were completed near the end of 1996.

WSRC-TR-98-O0428,Rev. O Airlift Recirculation Well Final Reuort - Southern Sector 6
97,400
97,380General
Flnw
97,360 -1-
97,340
. . .. Iw
i 97320
!’ 00IB m4b
f
97,300
~ 97,280 I I I I I I I I Iw) t .-.,.- . . . .g I aal-i-uul
l-’●97,260
4 4)
97,240 --l002B 002C
I97,220 1 I I I I I I I I I
97,200 ! I I I I I I I I i
48,200 48,210 48,220 48,230 48,240 48,250 48,260 48,270 48,280 48,290 48,300
SRS Eaat Coordinate
Figure 4: SSR-001 Piezometer locations
A piezometer cluster was located upgradient and downgradient of each recirculation well forobserving groundwater levels and for groundwater sampling. Each cluster consisted of one 2 @chPVC casing screened in the top of the Lost Lake aquifer (the “C” well) and one 2 inch PVC casingscreened in the bottom of the Lost Lake aquifer (the “B’ well). The piezometers were spaced on 10feet lateral centers. The upgradient piezometer cluster at well SSR-001 was located 30 feet ffomthe recirculation well and the downgradient piezometer cluster was located 20 feet from therecirculation well (reference Figure 4).
The piezometer clusters at well SSR-012 were spaced equally, 20 feet upgradient and 20 feetdowngradient (reference Figure 5). The different upgradient spacing was simply to provide anadditional point of reference for the data. In July 1997 three well clusters (SSM-005, SSM-006,and SSM-007) were added to the east of SSR-O12. These wells were spaced to provide a uniformlyspaced series of wells lateral to the natural groundwater flow for use in quantifying the Zone ofCapture. In December 1997 two additional well clusters (SSM-008 and SSM-009) were addedbetween SSR-011 and SSR-012. These wells were added to better evaluate the combined effect ofrunning two adjacent recirculation wells.

WSRC-TR-98-O0428,Rev. O Airlift Recirculation Well Final Report - Southern Sector 7
99,300
General99,250 Groundwater
FbwI O07B
[
I 074C
99,2CX3
3a 99,150a 1 m8 ,.
~ 99,100
,.../
e..,.’
r mz
/009C ●“
~ 99,050Im
99,000 ,..’/
98,950 I
98,900
50,050 50,100 50,150 50,200 50,2.50 50303 50,350 50,400 50,450 50,500
SRS East Coordiite
Figure 5: SSR-012 piezometer locations
The recirculation well consists of an 8 inch schedule 80 PVC well casing with two separate tenfoot long screen zones; one at the top of the aquifer and one at the bottom of the aquifer (referenceFigure 6). The PVC screens have 0.020 inch machined slots on a 1/8 inch spacing. The casing wasgrouted in place with gravel pack at each screen and a bentonite seal between the screens. An airliftpump was constructed horn 4 inch schedule 40 PVC well casing and a 1 inch schedule 80 PVCairline. The 4 inch casing was installed inside the 8 inch casing with an inflatable packer to isolatethe annulus between the two 8 inch screen zones. The bottom of the 4 inch casing (pump inlet) wasplaced just above the 8 inch screen at the bottom of the aquifer. A five foot long screen was placedin the 4 inch casing such that the bottom of the screen was eight feet above the potentiometric headin the top of the aquifer. This is the airlift pump outlet. The 1 inch air line was installed in the 4inch well casing with a discharge diffuser located seven feet above the bottom of the 4 inch casing.The air diffuser was fabricated by drilling 76- 5/32 inch diameter holes in a 12 inch long piece of1 inch schedule 80 PVClaterally while minimizingdirt, bacterial growth, etc.
pipe. The intent was to create relatively small bubbles dischargingbackpressure on the air line and the risk of plugging the tiser with

WSRC-TR-98-O0428,Rev. O Airlift Recirculation Well Final Report - Southern Sector 8
2W
Z6w
235’
220’
19W
17s
15s
14V
13s
Figure 6: Recirculation well installation
A duplex, oil-free air compressor package was installed at each recirculation well to providecompressed air. The compressor package was rated at 110 cfm at 125 psi. Because of the remotelocation of the recirculation wells, initially there were no utilities available. To expedite testing ofthe wells, portable generators were installed at each well site. The installation of permanent powerwas completed in Deeember 1997.
Typical aquifer properties are listed in Table 1. Aquifer thickness, grain size, soil type, andporosity were derived from drill cuttings, core analysis and borehole logs from the recirculationwells and from earlier borings in the vicinity. Measurements from the upper and lower observationwells during pump tests allowed the calculation of hydraulic conductivityy. The anisotropic ratio issimply the ratio of horizontal hydraulic conductivity to vertical hydraulic conductivityy. Thepotentiometric gradient was measured at the observation wells and was used with the conductivity,aquifer thickness and porosity to calculate pore velocity. Transmissivity is the product ofhorizontal hydraulic conductivity and aquifer thickness.

WSRC-TR-98-O0428,Rev. O Airlift Recirculation Well Final Report - Southern Sector 9
Table 1: Southern Sector Aauifer Parameters
Parameter Value
Aquifer thiCkIleSS 54 ft.
Chain sizeV. fine to v. coarse sand predominantly fine
to medium
Sediment type sub-mature quartz sand
Porosity 0.15-0.25
Horizontal hydraulic conductivity 25.8 ftkkly
Vertical hydraulic conductivity 1.43 ftfday
Anisotropic ratio 18
Horizontal pore velocity 0.19 ftlday
Transmissivity 1393 ft2/day
Grundfos sample pumps were used to take water samples horn the observation wells foranalysis. Water samples were analyzed for TCE and PCE concentrations using a gaschromatographywith a headspace analyzer (EPA SW-846 method 8260A). Results are included inthe Appendix (Figures 24 – 43 and Tables 4 – 8). Dissolved oxygen (D.O.) and specificconductivity measurements were made with a YSI analyzer.
Gas samples were taken from the air supply line and horn the exhaust stack at eachrecirculation well and analyzed for TCE and PCE concentrations by direct injection into a gaschromatography(EPA SW-846 method 502 1). Results are tabulated in Table 9 in the Appendix.
Results and Discussion
Well Development
Initial results demonstrated the sensitivity of the recirculation well technology to proper welldevelopment. Special efforts must be made to aggressively develop both the upper and lowerscreens zones independently. In our case the wells were installed with conventional mud rotarydrilling techniques as this is the most practical metkxi at SRS. We were not able to achieveeffective well operation until all residual drilling mud and loose fines were removed from bothsemen zones. This was successfully accomplished at SSR-012 using airlift and pump and swabtechniques. However to date, we have not realized the full potential of SSR-001. This information

WSRC-TR-98-O0428,Rev. O Airlift Recirculation Well Final Reuort - Southern Sector 10
is covered in detail in the earlier progress report (Airlift Recirculation Well Test Results –Southern Sector, WSRC-TR-97-O0246). The use of innovative development techniques are beingplanned to resolve this situation. Alternative well drilling methods that do not rely on drilling mudswill be considered for finure wells. This report will focus upon results achievedatSSR-012.
Since the functionality of the recirculation well depends in large part upon the amount of waterthat can pass through the well, a major concern is the susceptibility of the upper screen to pluggingwith clays and fines from the pumped water. To gauge this we performed a flow test in August1998, and compared the results with those from a similar test in May 1997. This test involvedoperating the well at a high flow rate with a level transducer located in the annular space above theupper 8 inch screen. The air supply to the well is shut off and the change in the water level in theannulus is recorded. This provides a direct measurement of the water flow out of the upper screen.As can be seen in Figure 7, although the flow rate had declined marginally, a significantly higherhead was required to maintain this flow. This indicates that the upper
O.I30 02U 0.40 060 080 I(MI 1’M 140 153 120 21XI
Ehm tinm,tin
Figure 7: Water flow tests at SSR-012

WSRC-TR-98-O0428,Rev. O Airlift Recirculation Well Final ReDort - Southern Sector 11
screen is plugging over time and as should be expected with any injection well, it eventually willneed to be redeveloped The rate of plugging does not appear to be a significant obstacle to longterm operation.
After SSR-012 was redeveloped in April 1997, the 4 inch screen was raised 25 feet to allowadditional head capacity above the upper screen zone to compensate for partial plugging over time.The 4 inch screen in all new wells will be located approximately 30 feet above the staticpotentiometric head
Initial Groundwater Quality
Frior to placing the wells in service, a baseline of water quality in the piezometer clusters wasestablished Referring to Figure 25, the TCE concentration around well SSR-001 was about asexpected; approximately 400 ppb in the bottom of the aquifer and approximately 15-20 ppb at thetop of the aquifer. However at the observation wells around well SSR-012, TCE was found inexcess of 10,000 ppb in the bottom of the aquifer and approximately 3,000 ppb at the top of theaquifer (refer to Figure 27). The contaminant plume appears to extend much farther down gradientin the vicinity ofSSR-012 than expected Although this may lead to the redefinition of the overallplume treatment strategy at this site, it provided an excellent opportunity to evaluate recirculationwell technology in a regime of higher contaminant concentrations.
Dissolved oxygen was found to be near saturation levels at the bottom of the aquifer (seeFigure 37) but at relatively low levels at the top of the aquifer.
Zone of Capture
The Zone of Capture is that part of the aquifer from which groundwater is drawn into a wellwhile it is pumping. In designing a treatment system to capture a contaminant plume, the wellsmust be spaced such that the Zones of Capture overlap to some degree. This helps to insure thatthe entire contaminant plume is captured Initially, the proper well spacing was estimated fromHerrling’s model. Two methods were used to corroborate the original estimate.
First, drawdown measurements were made at the lateral wells to quanti~ the aquifer responseto the operation of the recirculation well. Water level measurements taken at the lateral wells(SSM-005, 006, 007, and MSB-074) are shown in Figure 8. The drawdown levels taken whileSSR-012 was in operation indicate that the hydraulic effect of the well extends at least to MSB-074, approximately 160 feet lateral to the natural groundwater flow. From this data a simpleparticle tracking model was generated to predict the groundwater flow path and travel times ffomMSB-074 to SSR-012 (see Figure 9 and Table 2). The specific methodology is explained in detailin the initial report. Figure 8 illustrates that the hydraulic gradients created by the recirculationwell are much stronger than the existing regional gradient.

WSRC-TR-98-O0428,Rev. O Airlift Recirculation Well Final Report - Southern Sector 12
20
10
SSR412 operating@ 32.5din inlei
t o,T I I I ]f
/ + C wells
/ + B wells/
-20
/
p2J
Radial distancefrom SSR-012
Figure 8: Potentiometric heads at lateral piezometers
As fiwther corroboration, a tracer test was initiated on Feb. 6, 1998. Sodium bromide wasintroduced into MSB-074B at a concentration of 2,700 mg/L at a controlled rate of 1.1 L/rein overan 8 hour period. Samples were taken periodically at the observation wells between MSB-074 andSSR-012 and analyzed for bromide content. The results are shown in Figures 10 – 14 in theAppendix. Figure 9 shows a very strong indication of bromide at well SSM-006B on the 41st day.Table 2 lists the travel times predicted by the model and the actual times of the tracer peaks forcomparison.
Table 2: Tracer Results
Well SSM- SSM- SSM- SSM- SSM-006B 005B 004B 003C 004c
Predicted 40 80 110 111 111peak (&lyS)
Actual peak 41 68 134 143 157(days)
This is a positive indication that the bromide tracer followed the predicted path and was in factunder the hydraulic influence of the recirculation well. The bromide peaks downgradient are quite abit weaker, indicating that the tracer had diffused or migrated slightly southwar~ nevertheless, thepeaks occur at times reasonably close to what was predicted. This supports the conclusion that

WSRC-TR-98-O0428,Rev. O Airlift Recirculation Well Final Report - Southern Sector 13
recirculation well SSR-O12 has established a Zone of Capture of approximately 300 feet indiameter and our initial well spacing of 252 feet is reasonable,
99.200
99,050
99,000
Velecityof mturai
~oundwaterflow
1===1— 0.19II/day
+0.5 ftJday
+ 1.0ftlday
50250 50,300 50,350 50,400 50,450 50,500
SRS mat Ceolallats
Figure 9: Simulated groundwater flow patterns
Zone of Recirculation
As water is drawn into the lower screen of the recirculation well and discharged back into theaquifer ffom the upper screenj a three-dimensional hydraulic gradient is created around the well.Because of the anisotropic ratio, &/KV (horizontal hydraulic conductivity / vertical hydraulicconductivity), the bulk of the discharge from the well flows radially outward taking the path ofleast resistance. A smaller component of the flow is drawn downward and back into the well whereit is again exposed to the stripping effect of the airlift pump. Herrling’s model provides a
theoretical mechanism to predict the relative size of the recirculated component of the welldischarge, but a practical analysis of this ratio is beyond the scope of this report. The portion ofthe aquifer around the well in which this recirculating flow is significant is referred to as the Zoneof Recirculation.
The physical dimensions of the Zone of Recirculation remain the subject of a certain amount ofconjecture. The size of the ZOR is dependent upon the anisotropic ratio, the thickness of theaquifer, the length of the upper and lower screen zones, and the magnitude of the naturalgroundwater flow. Although Herrling’s data provide a theoretical means to estimate the size andshape of the zone, we have no cost effective means of proving it. Herrling’s model predicts that the

WSRC-TR-98-O0428, Rev. O Airlift Recirculation Well Final ReDort - Southern Sector 14
ZOR will be nearly circular in cross-section, extending a distance of 137 feet up and downgradientand 132 feet on either side of the recirculation well, lateral to the natural flow of groundwater.Thus, with the 252 foot well spacing in the Southern Sector, the ZOR should extend completelyfrom one well to the next.
In 1999, work is planned to model the flow patterns aroundSSR-012 on a finer scale. This isan opportunity to corroborate some of Herrling’s results and is intended to provide additionalinsight into localized flow patterns and the ZOR.
Test Configuration
The recirculation well was equipped with variable orifice flowmeters (rotameters) on the inletairline and in the exhaust stack Thermometers and pressure gauges were installed in both airstreams. In order to measure the water pumping rate, the well annulus (the area between the 8 inchwell casing and the 4 inch airlift pump casing) was “calibrated” to establish a relationship betweeninlet airflow and water level. This was simply a stepwise tabulation of measured values. A similarrelationship was then established between the water level in the annulus and the water flow out ofthe upper 8 inch screen. To do this a water level transducer was placed in the annulus below thestatic water level. The airflow was then turned on at a high flow rate (approximately 50 cfm). Afterconditions stabilized (approximately 10 minutes) the airflow was shut off and the decline in waterlevel was recorded at very short time intervals using a data logger. The cross-sectional area of theannulus is constant, thus the decline in water level over incremental periods of time can beconverted into a flow rate. The two relationships were plotted against their common parameter(water level) to create a nomograph that allows pumping rate to be approximated from inletairflow. This nomograph is attached as Figure15. Typical operating parameters at SSR-012 areshown in Table 3.
Table 3: Typical Opersting Parameters at SSR-012I s I
June, 1998 I 33 cfm I 43 gpm I 48 Cfm
TCE Cone. in StrippingExhaust Air Efficiency
62.8 ppmv I 63 %

WSRC-TR-98-O0428, Rev. O Airlift Recirculation Well Final Re~ort - Southern Sector 15
50
45
40
10
5
0
I60
------ -. . ..-. ,------ ------
. . . . . . . . . . .
0 2 4 6 8 10 12 14
Water Level (ft)
Figure 15: Pumping rate nomograph
Stripping Efficiency
Stripping efficiency is of interest because it provides a metric for comparing the effectivenessof the technology. Stripping efficiency is simply the percentage reduction in the contaminant levelof the groundwater as measured at the inlet and outlet of the recirculation well. The strippingefficiency was evaluated by establishing a mass balance around the recirculation well. During theredevelopment of SSR-012 in April 1997, the lower screen zone was thoroughly pumped at 48gpm. A number of water samples were taken which established a background TCE concentrationof 4500 ppb at the bottom of the aquifer. Note that this water is a mixture drawn horn the entireZone of Capture.
A simple mass balance for TCE yields:
Qao Cao + Qwo Cwo = Qai Cai + Qwi Cwi
where:
Qao = air flow rate from exhaust stack
Qai = air flow rate into the well

WSRC-TR-98-O0428, Rev. O Airlift Recirculation Well Final Report - Southern Sector 16
Qwo = groundwater flow out of the upper screen
Qwi = groundwater flow into the lower screen
Cao = concentration of TCE in exhaust air
Cai = concentration of TCE in air supply
Cwo = concentration of TCE in the groundwater discharging into the upper screenzone
Cwi = concentration of TCE in the groundwater at the inlet to the airlift pump.
If we neglect evaporation,
Qwi G Qwo
Periodic testing of the inlet air has confirmed that,
Cai = o
Substituting and rearranging,
Qwo CWO = Qwo Cwi - Qao Cao
Substituting values from Table 3 and converting to common units yields:
Qwo Cwi =
=
Qao Cao =
=
Qwo Cwo =
=
Cwo =
=
43 galhnin X 4,500 lb. TCE/109 lb. HZOX 8.34 lb. / gal
0.0016 lb. TCE / min.
48 ft3air/min X62.8 ft3TCE/10bft3air X
131.5 gTCE/24.5 LTCEX28.3 L/ ft3X 1 lb. /454g
0.0010 lb. TCE / min.
(0.0016 - 0.0010) lb. TCE / min.
0.0006 lb. TCE / min.
0.0006 lb. X 109/ min / (43 galhnin X 8.34 lb./gal)
1673 ppb.

WSRC-TR-98-O0428, Rev. O Airlift Recirculation Well Final Report - Southern Sector 17
Defining single pass stripping el%ciency (qs) as:
‘qS = (Cwi - Cwo) / Cwi
= (4,500 -
= 62.8%.
,673) / 4,500
Historically, the single pass stripping effkiency at SSR-012 has been in the 40 – 70% rangewith the original configuration. While this does not account for supplemental mass removalresulting from the recirculation of the treated water, the first pass stripping effkiency is asignificant quantifiable measure of the performance of the ARW. In an attempt to improve thestripping eftlciency, new technologies were solicited that could be adapted to the originalconfiguration.
Multi-Stage In-Well Aerator
In September, 1998 the airlift pump was removed from SSR-012 and replaced with a Multi-Stage In-Well Aerator (MIA) designed by Davis Environmental.
This technology also utilizes airlift pumping, but as shown in Figure 14, incorporatesadditional spargers in the upper and lower screen zones. Thus it utilizes three stages of stripping.The technology has been successfully applied at the University of California – Davis. Initial testingof this configuration at SSR-O12 has produced single pass stripping rates of 80-90Y0.Although theresults are very promising, additional testing is needed to confirm these results.
Overall Treatment Efficiency
As can be seen from the attached Tables and Charts, recirculation well SSR-012 hasperformed very well. Figure 17 illustrates the contaminant mass removed from the aquifer by therecirculation well. Figure 18 illustrates the decline in contamination levels at the lateral wellsduring the course of the demonstration. Referring back to Figure 1, some of this reduction maybedue to the hydraulic control of the plume itself. As the plume is pulled towards the recirculationwell, cleaner water from the east is drawn in and displaces the more heavily contaminated water.This again is evidence that the recirculation well technology has established hydraulic control overthe edge of the plume.

WSRC-TR-98-O0428, Rev. O Airlift Recirculation Well Final Report - Southern Sector 18
Land Surface
i 1
Upper Well ~Screen
Lost LakeAquifer
Lower Well ~Screen ;
........................... . . ... ... .................................. . . . . . . . . . . . . . . . . . . . . . . . . . . . . . . . . .,:-
I1
11I1I1I
RecirculationWell I
Pump Outlet
...............................................,.,.,....=..,.,,,......... . . . . . . . . . . . . . . . . . . . . . . . . . . . . . . . . . .. . . ... ... .. ...... . . . . . . . . ... ..
PluglUpperAerator
/P
~—
~ Eductor
Sparge Tube
/
Pump Inlet/
.............................. ........ .... ... ....... . ............. . . . . . . . . . . . . . . . . . . . . . ..==---.... =..-. .=.=.
Figure 16: Multi-stage In-well Aerator

WSRC-TR-98-O0428, Rev. O Airlift Recirculation Well Final Report - Southern Sector 19
700
6Q0
500
300
200
10Q
o
1/1 197 3J1/97 5/1/87 711/97 9/1/97 11/1/97 1/1/98 3fli98 5/1/98 7/1/98
1-ii
Figure 17: TCE mass removed at SSR-012
100%
90%
60”/0
60%
60%
40%
30%
20%
1o%
o%
0 20 40 60 80 10Q 120 140 160 180 200
RadiilDistancefromSSR-012(ft.)
Figure 18:TCE reduction at nearby wells
WSRC-TR-98-O0428, Rev. O Airlift Recirculation Well Final Report - Southern Sector 20
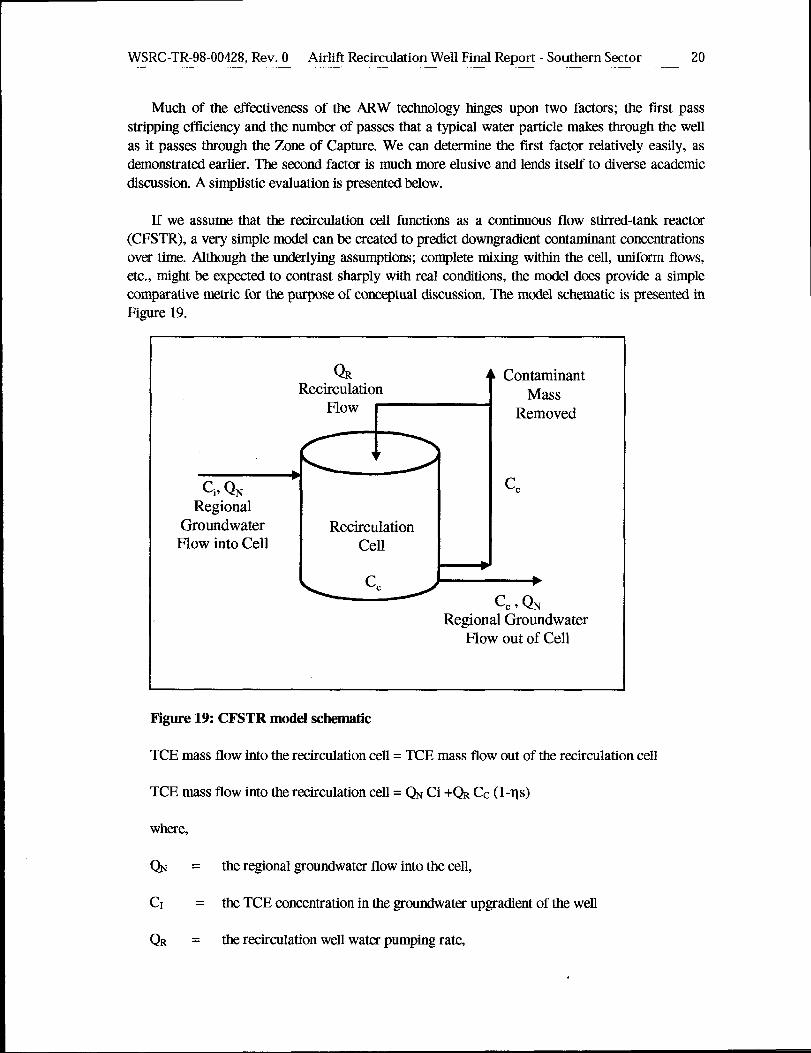
Much of the effectiveness of the ARW technology hinges upon two factors; the frost passstripping efficiency and the number of passes that a typical water particle makes through the wellas it passes through the Zone of Capture. We can determine the first factor relatively easily, asdemonstrated earlier. The second factor is much more elusive and lends itself to diverse academicdiscussion. A simplistic evaluation is presented below.
If we assume that the recirculation cell functions as a continuous flow stirred-tank reactor(CFSTR), a very simple model can be created to predict downgradient contaminant concentrationsover time. Although the underlying assumptions; complete mixing within the cell, uniform flows,etc., might be expected to contrast sharply with real conditions, the model does provide a simplecomparative metric for the purpose of conceptual discussion. The model schematic is presented inFigure 19.
QR A ContaminantRecirculation Mass
Flow Removed
●
Ci, QN ccRegional
Groundwater RecirculationFlow into Cell Cell
●
cc / ➤
CC,QNRegional Groundwater
Flow out of Cell
Figure 19: CFSTR model schematic
TCE mass flow into the recirculation cell= TCE mass flow out of the recirculation cell
TCE mass flow into the recirculation cell= ~ Ci +@ Cc (1-qs)
where,
QN= the regional groundwater flow into the cell,
CI = the TCE concentration in the groundwater upgradient of the well
QR= the recirculation well water pumping rate,

WSRC-TR-98-O0428, Rev. O Airlift Recirculation Well Final Report - Southern Sector 21
cc = the contaminant concentration within the recirculation cell, and
?lS = the first pass stripping efficiency.
@ can be approximated by,
QN= vBDp
where
v = the regional groundwatex velocity
B = the aquifer thickness
D = the width of the recirculation cell, and
P = the porosity of the aquifer.
Substituting values,
QN = (0.19 ft/day) (54 ft) (252 ft) (0.2) (7.48 gal/cu.ft.) (1 day/1440 rein)
= 2.7 gpm.
TCE mass flow out of the recirculation cell = @Cc+ ~ CC,
The initial conditioh were assumed to be
Ci = 10,000 ppb TCE
QR = 43 gpm
cc = 4,500 ppb TCE.
A spreadsheet model was used to calculate the concentration of TCE in the discharge from therecirculation well over a one year period at stripping efficiencies of 50%, 6570, and 100%. As canbe seen in Figure 20, the TCE level was reduced to less than 1,500 ppb within one year and theconcentration was continuing to decline although at a declining rate. Given the simplifyingassumptions used in this exercise, we would expect the actual results to differ somewhat, but thegeneral trend should be similar. More sophisticated modeling techniques are planned for the futureto allow more realistic forecasts.

WSRC-TR-98-O0428. Rev. O Airlift Recim.dation Well Final ReDort - Southern Sector 22
5,0a
4,500 Regional flow rate x 2.7 gpm~
L
L
1,003-● e5%
500-
0.
0 50 100 150 m 250 3(XI 350 400
Tii (days)
Figure 20: Results of CFSTR model
Time to Establish a Recirculation Cell
Early in the testing, pressure transducers were installed in MSB-074 B & C to measure theaquifer response as SSR-012 was started up. The results are shown in Figure 21. One of theobjectives of this project was to determine the time to establish a recirculation cell and how quicklythe cell would degrade after the recirculation well was shut down. This information was to providean idea of how long components could be out of service due to breakdown or for routinemaintenance without adversely effecting the treatment objectives of the system Figure 21 showsthat the gradient controlling the recirculating flow of water is established within minutes of placingthe well in service. The time required for a water particle to travel from the outer edge of the Zoneof Capture to the recirculation well is approximately 140 days as demonstrated in the tracerexperiment. The gradient at the top of the aquifer is not as large as the gradient at the bottom of theaquifer so the flow outward will not be as fast.
This is evident from the dissolved oxygen data presented in Figures 34-43. The low naturallyoccurring D.O. levels at the top of the aquifer create an environment where the dissolved oxygenserves as an effective tracer. Note that after SSR-012 was placed in service the D.O. levels in thesurrounding “C” wells began to rise. We might consider the point at which the D.O. level in each“C” well reached the same level as that of the corresponding “B” well as an indication that therecirculation cell had reached equilibrium. By this measure, the recirculation cell grew to a radiusof 120 feet (at SSM-006) over a period of 265 days (Figure 39). Judging by the tracer test results

WSRC-TR-98-O0428. Rev. O Airlift Recirculation Well Final ReDort - Southern Sector 23
and the D.O. results a complete round trip for a water particle may take between 300 and 500days.
At startup of the recirculation well the actual recirculation cell gradients are formed withinminutes (Figure 21). The recirculation cell then becomes a dynamic mixing zone and may requireyears to establish steady state conditions. The cell will likewise degrade very quickly if the wellsare removed ffom .wrv@ within hours. The aquifer will then return to its natural gradient. Thegroundwater at the southernmost boundary of the recirculation cell will flow out of the Zone ofCapture at the natural flow velocity of 0.19 feetiday. The contaminant concentration of this waterwill be much lower than the untreated upgradient water, conceivably at less than 100 ppb. Giventhe low regional flow gradient, short periods of downtime (a few days at the most) for equipmentmaintenance should not result in gross lapses in groundwater remediation.
0 1(!0 2C0 300 400 500 600 700 800 900 100JI
T- $hce tha start d afiow (rein)
Figure 21: Aquifer response at MSB-074
Conclusions
The test results obtained over the past two years have confirmed the viability of the verticalrecirculation well technology in this particular application. The success of the technology has beendependent upon the particular hydrostratigraphy of the Lost Lake aquifer. The relatively coarsesandy aquifer, with little clay/silt stratificatio~ bounded on the top and bottom by clay rich
WSRC-TR-98-O0428, Rev. O Airlift Recirculation Well Final Report - Southern Sector 24
cotilning layers with an anisotropic ratio of 18 seem to be key parameters for success. The resultsare consistent with model developed by Herrling, et. al.
Figure 17 illustrates the cumulative contaminant mass that has been removed from the aquifersince it was placed in service. The system has proved to be very reliable and has consistentlyremoved over 1 lb. of TCE per day.
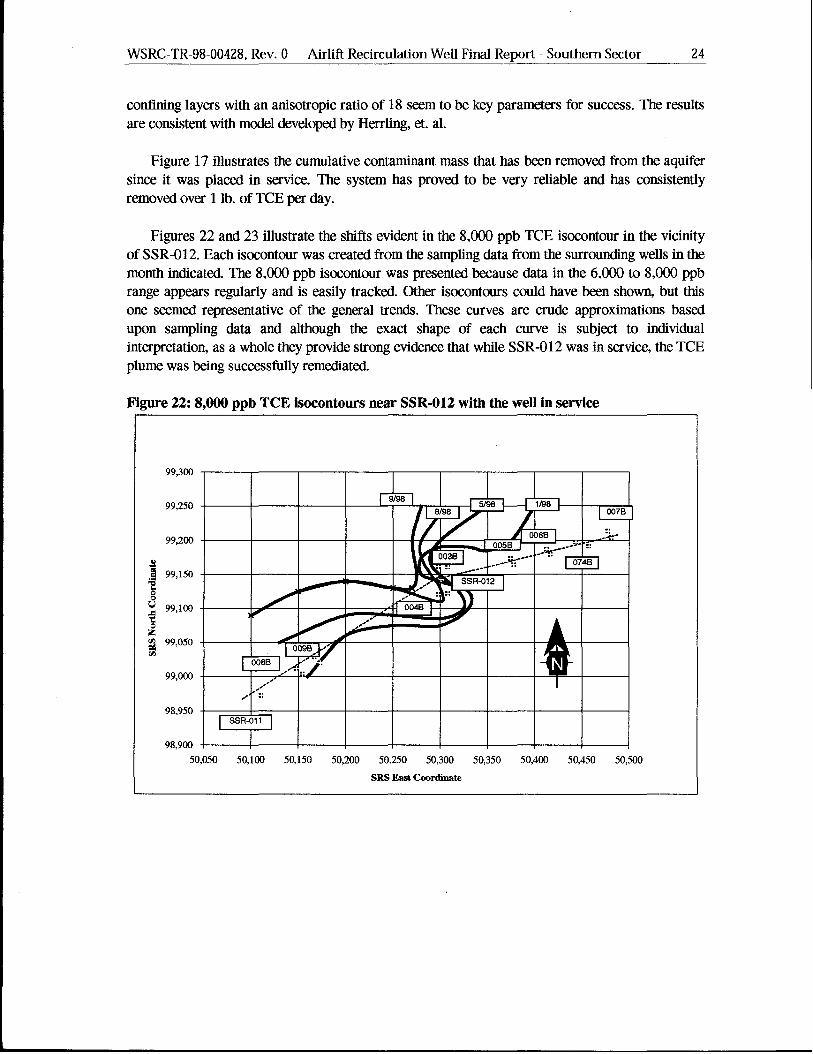
Figures 22 and 23 illustrate the shifts evident in the 8,000 ppb TCE isocontour in the vicinityofSSR-012. Each isocontour was created from the sampling data ilom the surrounding wells in themonth indicated. The 8,000 ppb isocontour was presented because data in the 6,000 to 8,000 ppbrange appears regularly and is easily tracked. Other isocontours could have been show but thisone seemed representative of the general trends. These curves are crude approximations basedupon sampling data and although the exact shape of each curve is subject to individualinterpretatio~ as a whole they provide strong evidence that whileSSR-012 was in service, the TCEplume was being successfully remediated.
Figure 22:8,000 ppb TCE isocontours near SSR-012 with the well in service
99,300
99(250
99,2CQ
99,150
99,100
99,050
99,0C0
98,950 I
ISSR-011
I
98,900
50,050 50,100 50,150 50@) 50,250 50,300 50,350 50,400 50,450 50,500
SRS EastCoordinate

WSRC-TR-98-O0428,Rev. O Airlift Recirculation Well Final Report - Southern Sector 25
Figure 22 illustrates the effect of the recirculation well on the TCE concentration in the aquiferwhile the well was operating. Note that as contaminant mass is being removed from thegroundwata (as demonstrated in Figure 17), the regional TCE concentration is falling. Asdiscussed earlier, the recirculation well was removed from service in September 1998, to allow theinstallation and testing of the Multi-Stage In-Well Aerator. After the initial tests with the MIAcontiguratio~ the well remained out of service while utility and component upgrades werecompleted in the area. Figure 23 illustrates the return of higher contamination levels while the wellwas out of service, corroborating the benefits of the ARW technology.
99,250 - I .. I00?6I
99,200
99,000/.
Y-
98,950 I
ISSR-011
1
98,900
50,050 50,100 50,150 50,200 50,250 50,300 50,350 50,400 50,450 50,500
Figure 23:8,000 ppb TCE isocontours near SSR-012 after the well was shut down
As with many endeavors, as we have gathered information and operating experience with thetechnology, new questions have arisen. Because of the significant promise of improved efficienciesoffered by the MIA technology, it is recommended that further testing be completed to corroboratethe initial results. Additionally, the location of piezometers between SSR-011 andSSR-012 offersan excellent opportunity to study the overlap of the Zones of Capture and Recirculation. Theresulting knowledge will prove valuable as we pursue additional applications for the ARWtechnology.

WSRC-TR-98-O0428, Rev. O Airlift Recirculation Well Final Report - Southern Sector 26
References
Looney, Brian B. and Phifer, Mark A., 1994, A/M Area Groundwater Corrective Action SouthernSector Remediation Technology Alternatives Evaluation WSRC-RP-94-607.
Herrling, B., and Staw J., 1991, Numerical results of calculated 3D vertical circulation flowsaround wells with two screen sections for in situ on on-site remediation, Proc. IXInternational Conference on Computational Methods in Water Resources, Denver, CO.
Alesi, E.J., Brinnel, P., Herding, B., Hirschberger, F., Sick M.R. and Sta~ J., 1991, In Situgroundwater remediation of strippable contaminants by vacuum vaporizer wells (UVB):operation of the well and report about cleaned industrial sites, Third Forum on InnovativeHazardous Waste Treatment Technologies: Domestic and International, Dallas, TX.
Jackson, Dennis G. and Looney, Brian B., 1996, Development of a Vertical Recirculation WellSystem for the A/M Area of the Savannah River, WSRC-RP-96-477.
Hiergesell, R.A. and Nichols, R.L., 1997, Estimation of vertical hydraulic conductivity of the LostLake Aquifer near recirculation well SSR-012, SRT-EST-97-433.
Hiergesell, R.A. and White, R.M., 1997, Airlift Recirculation Well Test Results – SouthernSector, WSRC-TR-97-O0246SRT-EST-97-433.
Stagner, Jm, 1998, Multi-Stage In-Well Aerator Performance Test Results – Well SSR-012.

Appendix
WSRC-TR-98-O0428, Rev. O Airlift Recirculation Well Final Report - Southern Sector 27

WSRC-TR-98-O0428, Rev. O Airlift Recirculation Well Final Re~ort - Southern Sector 28
50
45
40
35
15
10
5
I I
0.08
0.07
0.06
0,05
z@ozg
0.04 *.->.-Z$8
0.03
0.02
0.01
0 20 40 60 60 100 120 140 160
Tirnafrom Injection(days)
Figure 10: Bromide tracer concentration at SSM-006B

WSRC-TR-98-O0428, Rev. O Airlift Recirculation Well Final Report - Southern Sector 29
1.8
Peak on 68th day
= 0“04
1.6
1.4
1.2
0.6
0.4
0.2
0
t
I
I
o 50 100 150 200 250
Timefrom Injection(days)
0.035
0.03
0.025
0.015
0.01
0.005
0
Figure 11: Bromide tracer concentration at SSM-005B

WSRC-TR-98-O0428,Rev. O Airlift Recirculation Well Final Report - Southern Sector 30
0.8+Bromide @ 4B Peak on 134th day
+ Conductivity @ 4B
7A
‘“-V“’’-,””l ‘ ~
0.2
0.1
0.03
0.025
0.02
0.01
0.005
0
0 50 100 150 200
Timefrom Injection(dsys)
Figure 12: Bromide tracer concentration at SSM-004B

WSRC-TR-98-O0428, Rev. O Airlift Recirculation Well Final Report - Southern Sector 31
0.6-
lPeak on 143rd dayl~ ‘“m
0.5
0.4
0.2
0.1
0
0.025
v 0.02
g>.-
0.015 gus6
0.01
0.005
-t~ -o
0 50 100 150 200 250
Timefrom Injection(days)
Figure 13: Bromide tracer concentration at SSM-004C

WSRC-TR-98-O0428, Rev. O Airlift Recirculation Well Final Report - Southern Sector 32
0.6 -0.03+Bromide @ 3C
+Conductivity @ 3CPeak on 157th day
0.5 0.025
0.4 0.02
-zam ,gG >.-5“ 0.3 0.015 g
~4.-5 8
t%
0.2 0.01
0.1 0.005
0-l ~ . 00 50 100 150
Timefrom Injection(days)
200 250
Figure 14: Bromide tracer concentration at SSM-003C

WSRC-TR-98-O0428, Rev. O Airlift Recirculation Well Final Report - Southern Sector 33
Figure 24: Groundwater sample analytical results - SSM-001
800
700
600
500
200
100
———.-.. ——+Ic - Upper
+ 1B - Lower
\
RedevelopI ‘
well4
Shutdown 1
I I4
i i \
i i
i i
n
i. / 3
i
\
i
+
I
I \
n t’
I
— Trrrrml — m — — - — -mlm-l1211 1/26 3/23 5/1S 7i13 9J7 11/2 12/28 2/22 4/19 6[14 S/9 10/4 11/29 1124 3J21
SamplingDataa

WSRC-TR-98-O0428, Rev. O Airlift Recirculation Well Final Report - Southern Sector 34
800
700
600
200
100
+2C - Upper ~
+ 2B - Lower
t
I
a,
Redevelop well\
1
kI
+ ~
1
A
hAk
A\ H t
Shutdown Ti
i iii
I
i i
i i
i iI
1#
I I r
I I
12/1 1/26 3J23 5118 7113 9ff 11/2 IZY28 2/22 4/19 6/14 W9 10/4 11129 1124 3121
sampling Dates
Figure 25: Groundwater sample analytical results - SSM-002

SamplingDataa
Figure 26: Groundwater sample analytical results - SSM-003

WSRC-TR-98-O0428, Rev. O Airlift Recirculation Well Final Report - Southern Sector 36
‘4:IFIIIIIIEu-—.—.—-.—.....-/
16,000 t I IL
i + i
ALA
R I
14,000I 1t
II
i 1 I
I 8,000 u
i-
1 m 1- 1
t
8,000i
i i
I 1
4,000 m m
i i
2,000 9 , m
pq &B E
121 1126 3/23 5J18 7113 9i7 1112 1Z28 2/22 4/19 6/14 6i9 10/4 11129 1124 3121
8amplingDatas
Figure 27: Groundwater sample analytical results - SSM-004

WSRC-TR-98-O0428, Rev. O Airlift Recirculation Well Final Report - Southern Sector 37
8,000+5C - Upper
+ 5B - Lower
7,000 * / ‘
6,000
5,000- — — — —sa as,ga A* 4,000@c?c \ ~‘
e iul
~3,000
A k“
i
1
n I
Redeveloped well
\ i
1 1
1,000 I ! ~ m-/
i I
B 1
0- ~ ‘“””’ ““ ~ “ “ ~ ~ — ~12)1 1/26 3123 5/18 7113 9/7 1112 12/28 2/22 4119 8114 819 10I4 11/29 1124 3121
8amplingDataa
Figure 28: Grouadwater sample analytical results - SSM-005
.%
WSRC-TR-98-O0428, Rev. O Airlift Recirculation Well Final Report - Southern Sector 38
6,000+6C - Upper
+6B - Lower
5,000
4,000
2QQco.- E%* 3,000a#8wg
2,000
i
1,000
I A +
i1
012/1 1/26 3/23 5/18 7/13 M’ 11/2 12126 2/22 4119 6/14 3/9 10/4 11[29 1/24 3[2
SamplingDates
!1
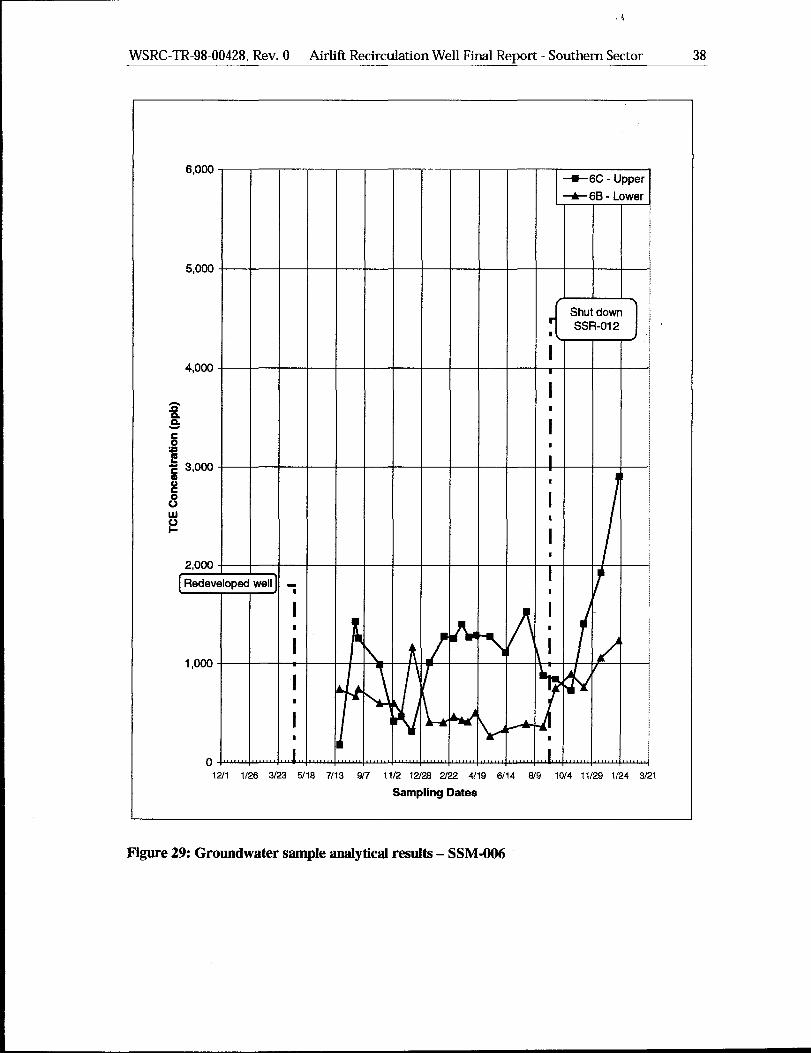
Figure 29: Groundwater sample analytical results - SSM-006

WSRC-TR-98-O0428, Rev. O Airlift Recirculation Well Final Renort - Southern Sector 39
3,000 ——–- —. ..—..-+74C - Upper
+74B - Lower
2,500
~ Shut downSSR-012
i’
/
2,000- I
~ Redeveloped well -I
nas I io.- 1 1ifg 1,500 A ! 1@os$ i iLLlo+
i
I I1,000
kAI
i iI
i ii
— — - — — 1
I I Ii1
012/1 1/26 ?J23 5/18 7[13 917 1112 12/26 2/22 4/19 6/34 8/9 10[4 11/29 1124 3/21
SamplingDates
Figure 30: Grouadwater sample analytical results - MSB-074
3,000 ---- —-.. .+7C - Upper
+76 - Lower
2,500 \
Shut downSSR-012
2,000i
s
s i
co.-? i~ 1,500 -9alo5 / iowo1- i
1
1,000 I
i
i
500-
I
o1211 1126 Y23 EJ18 7113 9/7 11/2 12/28 2/22 4119 6114 0/9 1014 11129 V24 3J21
SamplingDates
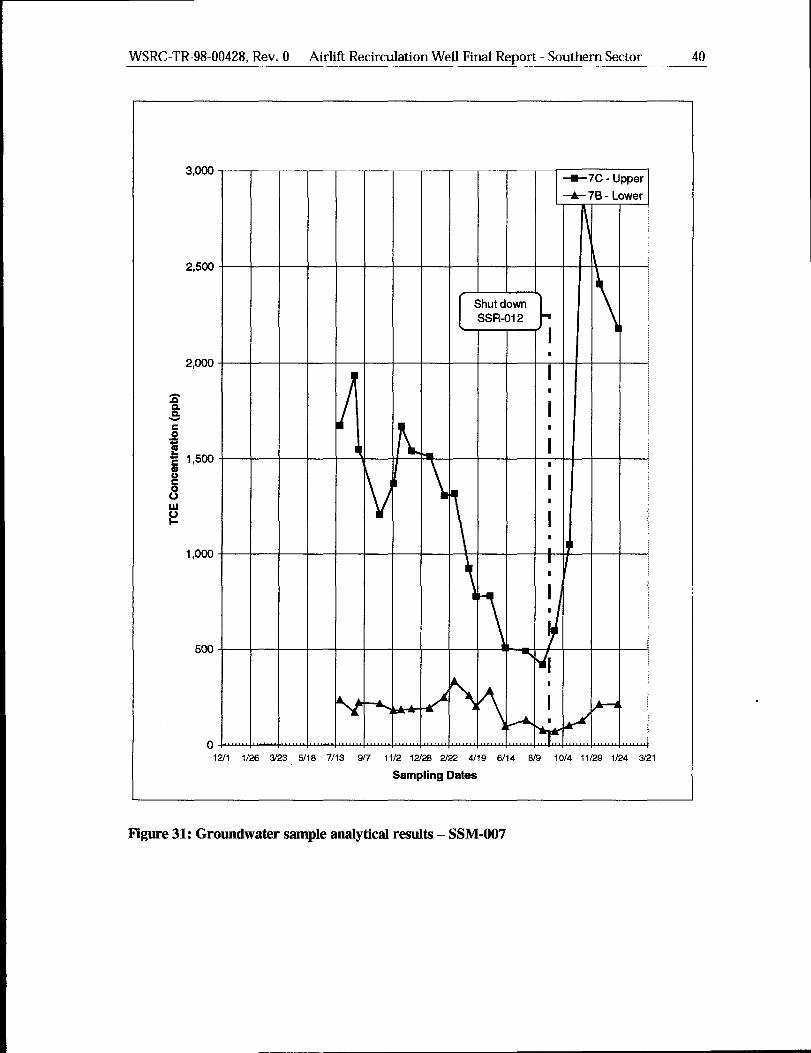
Figure 31: Groundwater sample analytical results - SSM-007

WSRC-TR-98-O0428,Rev. O Airlifl Recirculation Well Final Report - Southern Sector 41
“’OTrTTTnTTr-lTEzzEl14,000
12,000
2,000
012/+ 1128 3123 W18 7113 W 1112 12/28 W22 4/19 8/14 8f9 10/4 11/29 1124 2./21
sampling Dates
Figure 32: Groundwater sample analytical results - SSM-008

WSRC-TR-98-O0428, Rev. O Airlift Recirculation Well Final Report - Southern Sector 42
16,000 —--—*9C - Upper
+ 9B - Lower ~
14,000
12,000
~ 10,000
&g
i
!!!
8,000
i!g
* 6,000
4,000
2,000
I
o12/1 if26 3/23 5f18 7/73 917 1tf2 12/28 ,2&2 ti19 6/14 W9 10{4 $ILXJ 1/24 3’21
sampling Dates
Figure 33: Groundwater sample analytical results - SSM-O09

WSRC-TR-98-O0428, Rev. O Airlift Recirculation Well Final Report - Southern Sector 43
12
10
8
4
2
012/’1 1126 3123 5f18 7/13 9/7 1112 12/28 Z22 419 6/14 8/9 10[4 11129 1[24 3/21
SamplingDataa
Figure 34: Dissolved Oxygen concentration - SSM-001

WSRC-TR-98-O0428, Rev. O Airlift Recirculation Well Final Report - Southern Sector 44
12
10
8
4
2
0
D—.
Shutdownr
+2C - Upper
+ 2B - Lower
Redevelop wellr ‘ I I
t 1 Al , 1 t 1
11111# 1 1 1
II# 1 \ I r 1 u 1
12H 1/26 3/23 5[18 7[13 W 11[2 12/28 2/22 4119 6114 6/8 10/4 11/29 1[24 3/21
SamplingDates
Figure 35: Dissolved Oxygen concentration - SSM-002

WSRC-TR-98-O0428. Rev. O Airlift Recirculation Well Final ReDort - Southern Sector 45
I
10- —
i 4
8k
A
I
sI 1i
& is@ E
j6 I I
1!=o i ia.-:
i iI a
4I I
i i
i i
2
I
i
t
012/1 ~126 3/23 5/18 7173 9/7 1712 12t’23 2/22 4/19 6/14 8/9 1014 11129 lt24 3/21
SamplingDatea
Figure 36: Dissolved Oxygen concentration - SSM-003

Figure 37: Dkwolved Oxygen concentration - SSM-004

WSRC-TR-98-O0428, Rev. O Airlift Recirculation Well Final Report - Southern Sector 47
12 —
Redeveloped SSR-012 ,well
10i
i
i8 I
I
i
I I
6 !
i
i
I 14
I
i
i
2-
1
i1
012/1 1/26 2J23 568 7113 9/7 11/2 12/28 2/22 4/19 W14 8/9 10I4 11129 1124 3121
SamplingDatea
Figure 38: Dissolved Oxygen concentration - SSM-005

WSRC-TR-98-O0428, Rev. O Airlift Recirculation Well Final Report - Southern Sector 48
Figure 39: DIssolved Oxygen concentration- SSM-006
12-+6C - Upper i
+ 6B - Lower i/ \
? Shut downI SSR-012
mIL
10 m
7
/
I,
I
i
8 A 1
I ‘sg ical i
i 6- — — — — — — — — — — 1 — — —ue
~ i
.-;
i
I
4I
i
i
2
1
i
I
012!1 1[26 323 W18 7113 9/7 11/2 12728 222 4/19 6114 8J9 10/4 11K?9 1124 3/21
SamplingDataa

WSRC-TR-98-O0428.Rev, O Airlift Recirculation Well Final ReDort - Southern Sector 49
12 ——+74C - Upper
+ 74B - Lower ;
II I
10-I II
i
8
/1
xI
Y
sg
i is L@ B I
16 ! !
v
;
o i ia.-:
i i
I I
4I I
i i
i i
2
I
i
012/1 1/26 W23 5/19 7113 9/7 i 1[2 12/28 Z22 4/19 6/14 6J’9 10I4 11129 1/24 S&l
8amplingDatea
Figure 40: Dissolved Oxygen concentration - MSB-074

WSRC-TR-98-O0428. Rev. O Airlift Recirculation Well Final ReDort - Southern Sector 50
12
10
8
4
2
0
.+7C - Upper
+ 7B - Lower
t
121~ 1126 W23 5118 7113 9i7 1112 12128 2122 #19 6/14 819 10/4 11129 1124 3/21
SamplingDatea
Figure 41: Dissolved Oxygen concentration - SSM-007

12
10
8
4
2
0
WSRC-TR-98-O0428, Rev. O Airlift Recirculation Well Final Report - Southern Sector 51
Figure 42: Dissolved Oxygen concentration - SSM-008
f211 1126 CV23 5/18 7/13 917 11/2 12J28 2/22 4J19 6114 W9 10I4 11/29 1124 Z#21
SamplingDatas

12 —
10
8
sgg
16
ug~
z
4
2
nII1
012/1 1/26 3/23 5/18 7113 9i7 1112 1%28 2/22 4119 6/14 8/9 10/4 11129 IJ24 3/21
%mpling Dataa
Figure 43: Dissolved Oxygen concentration - SSM-009

WSRC-TR-98-O0428, Rev. O Airlift Recirculation Well Final Report - Southern Sector 53
Table 4: Results of groundwater sampling - Wells SSM-001 and SSM-002I SSM-001 B I SSM-001 C I SSM-002 B I SSM-002 C I
1 I D.O. I TCE I I D.O. 1 TCE I I D.O. 1 TCE I I Dj TCE IDate ppb Date In@ ppb Date Ingn ppb
12/10/96 I2I1OB6 0.6 8 12[10/96 0.7 11/27/96 3
u7f97 4.1 123 V7f97 0.1 26 12/18/96 1.0 12/18/96 1.1 19
1/14/97 5.1 1/14/97 V3197 483 1/3/97 22
li20i97 111 li20t97 29 116/97 475 1/10/97 2.4 45
2114197 135 2/14/97 1.2 34 1/10/97 1.8 439 1/16/97 1.1 27
314197 6.7 114 3J4197 1.1 20 1117197 1.8 313 1/21/97 lWA 29
3/25/97 6.9 125 3/25/97 1.7 38 1/21/97 lWA 200 2118/97 1.1 28
418197 10.4 116 418197 5.6 59 2/18/97 2.4 464 314197 21
515197 7.7 141 512#7 2.0 80 314197 3.0 339 3127197 1.1 50
51t4i97 6.8 200 5115197 2.9 77 3125197 4.0 477 4/8197 5.7
6/18/97 7.4 93 6/18/97 3.4 58 418197 9.2 518 515f97 lWA 60
I 8/11/97I 7.1 I 143 I 8/6/97 I 4.3 I 108 I 5/5/97 I 8.1 I 414 I 5/13/97I 1.3 I 61 I
8J22197 7.5 107 8f2V97 4.3 61 5114197 4.6 531 6118197 0.9 64
8/25/97 7.3 116 8125197 4.4 57 6/18/97 5.2 423 8/11/97 1.8 56
10/7/97 7.6 179 10/7/97 1.0 89 8/19/97 5.9 387 8i22/97 56
11/17/97 6.9 190 11/17/97 4.8 62 8/26197 6.0 400 8/26/97 2.5 48
12/8/97 7.5 196 1218197 4.9 60 10/7/97 6.4 424 lon#7 2.3 631/1 71CM2 71 251 1/12/98 4.8 75 11/17/97 6?. 45’3 11/1 ‘7197 1.x $4
!15 ml$vl 5.2 53 121W97 6
-. ._..- ..- . .- --- -------- ---2/9/98 8.1 2.- , . . . . I 1 . . I ------ 1 6.8 126 12/8/97 1.3 57
3/5/98 7.5 680 I 3/2/98 I 4.0 54 1/12/98I 7.1 397 1/12/98 2.0 69
I 4/’7/98I 7.1 I 524 I 4/7/98 I 4.5 I 80 I 2/9/98 I 8.8 I 472 I 2/9/98 I 2.5 I 40 I
.-< ... ---- ---1
. .I
-, ----1
!82 I 5112/98 I 4.5 103 4/7/98
4J15198 8.0 47Q I 4/1 WOR I <n I Q1 I ‘?)?IORI 8.3 473 3/2/98 3.0 14
5112/98 7.0 2-_ , -.._.. _ 1 i --- 1 . . . 1 8.5 697 4t7i98 2.7 15
6/11/98 6.7 292 I 6/11/98I 5.4 123 [ 4/16/98I 8.9 599 4/15/98 3.4 10
12/21/98 6.9 1<7 7/77/09 AO I I w I 611?lcm I 8.3 614 5[12/98 4.6 13
1/18/99 7.8 206 8/24/98 5.3 96 6/11/98 6.7 540 6/11/98 4.7 19
9/16/98 5.4 161 7122198 8.4 624 7i22f98 3.5 13
10II4I98 6.3 164 8/24/98 8.0 509 8124198 3.8 8
11/10/98 5.5 196 9116198 8.2 422 9/16/98 4.6 16
12/21/98 5.0 194 10/14/98 9.0 459 10/14/98 5.0 6
1/8/99 5.7 221 11/10/98 8.3 445 11/10/98 4.5 5
12/21/98 7.6 351 12/21/98 3.4 40
1/18/99 8.8 412 1/18/99 2.4 113

WSRC-TR-98-O0428, Rev. O Airlift Recirculation Well Final Report - Southern Sector 54
Table 5: Results of groundwater sampling - Wells SSM-003 and SSM-004SSM-003B 8SM-003C SSM-004B S8M-004C
D.O. TCE D.O. TCE D.O. TCE D.O. TCEDate w P@ ~te * ppb Date
12113f96 7.9 12113f96 2.1 12J17196 8.1 12f16#6 2.6
l/lof97 8.4 5,576 lf28i97 3.3 11,882 1211W96 8.8 12/17/96 2.7
lf27197 8.8 5,304 215f97 3.4 8,226 lf3f97 10,364 12/19/% 3.0
2f5f97 8.9 5,148 2L27197 5.1 4,638 u9f97 7.8 10,249 l13f97 3,386
2f26i97 3,792 3112f97 6.6 5,687 1/28/97 7.8 16,370 118197 2.0 3,055
3112f97 10.0 2,630 41V97 6.8 6,437 2f6f97 8.7 14,342 V29f97 2,470
41V97 9.8 4,942 4116197 8.8 5.436 2f27f97 8.9 10.479 2f6197 3.0 2,820
4116f97 9.9 4,998 516f97 5.3 1,574 3/14/97 8.3 14,110 2127f97 2.8 1334;
4f30f97 10.0 5f22t97 8.2 1,861 41H97 8.8 3114f97 3.4 2,042
5/6/97 7.7 4,942 612197 7.0 1,481 4116197 10.6 10,823 412f97 4.4 1,920
5f22f97 I 9.5 I 6,827 6f9f97 I 7.2 I 1,569 I 517f97 I 8.3 I 8,014 I 4/17f97 ] 7.2 1,249
6f2J97 I 8.8 4.597 I 6/16/97I 8.4 I 5f22f97 I 9.5 14.952 I 51V97 I 4.2 1.183 IE
I 1,035 I6/9/97 8.8 5,920 814f97 9.1 889 6J2197 8.8 12,417 515f97 7.2
6/16f97 9.3 8f20f97 9.1 1,531 6f9f97 8.9 11,164 516197 2.5 I 1,063
8/5f97 9.1 6,655 8f26f97 9.0 1,400 6116f97 9.2 5f22f97 5.0 1,708
I 8f20/97 I 9.7 I 7.415 I 10/16f97I 9.1 ! 827 I 8f5/97 I 9.1 I 10.912 ! 6f2f97 I 3.2 I 1.322 t.—8f26f97 9.6 5,836 1tf3f97 7.2 824 8f20f97 9.7 10,756 6f9f97 3.0 1,339
10f6f97 10.0 6,625 llf18i97 9.2 1,167 8L26f97 9.6 9,521 6/16f97 5.0
1lf3f97 9.1 6,242 L2f9f97 10.7 1,459 lof7f97 9.6 7,973 815197 4.5 1,411
I 1lf18f97 t 9.7 i 5.087 I lf12/98 I 9.3 I 1.623 i 1lf3f97 I 9.1 I 9.831 I 8f20f97 ! 7.4 I 1.546 i
12f9f97 10.8 2f9f98 10.2 1,419 1lf19f97 9.6 9,463 8f26f97 7.3 1,393
lf13f98 9.3 6,886 3i2i98 9.4 1,393 12EV97 10.6 9,447 10/6f97 7.0 837
2f9f98 10.1 6,359 3f30f98 8.7 1,189 lf13/98 9.2 12,318 11f3f97 7.0 997
312198 9.5 5,471 4f14f98 9.3 1,234 2f10f98 8.7 11,831 11f18f97 7.8 1,024
3f30f98 8.6 5,264 5f 12f98 9.4 1,424 3f3/98 9.6 9,782 12f9f97 8.1
4114f98 9.2 4,932 5f28f98 10.1 1,286 3130f98 8.5 9,998 lf13f98 8.2 1,675
I 5/12J98t 9.1 I 7.867 I 6f4f98 I 9.7 i 1.289 I 4f14f98 ] 8.7 I 8.947 I 2f10f98 I 8.1 I 1.407 i
6/1lf98 7.6 5;893 6/11/98 8.2 ‘1,248 511X98 8.8 12,234 3f3f98 8.6 1,349
7f2U98 8.6 5,894 6f16f98 8.2 1,082 5f28f98 9.1 8,466 3130198 8.5 1,254
8f24f98 9.6 5,017 6f22f98 9.2 6f4f98 9.3 10,592 4f14f98 8.2 1,186
10f14f98 10.2 7,130 6f29f98 8.8 1,110 6fl lf98 7.1 11,127 5f12f98 8.7 1,517
10f14/98 9.9
llfllf98 9.6
12/15f98 10.5 O“X, , 7,.,,7” , 7,
lf19f99 9.9 1.214 I 10f14f98i 9,
1lf10f98 9.1 6,175 7nf98 9.1 1,270 6f22f98 8.3 9,250 5f28f98 9.1 1,297
12f15f98 9.9 1,866 7f13f98 8.5 1,248 6f29f98 8.8 12,090 6f4f98 9.2 1,303
l/19f99 9.6 4,223 7f21f98 9.2 1,198 7nf98 7.5 11,255 6fl 1/98 7.2 1,231
7f29f98 9.3 1,192 7fl 3f98 8.6 11,420 6f16f98 7.7 1,1190,*mo <,-IL 1,010 7f2U98 8.3 12,376 6f22f98 8.5 1,035
I n,41 71’7n~QQ .5 12,063 6n9f98 8.8 1,287
.,”?T “,J, ,” 7.7 8,834 7nf98 8.9 1,273
1,282 8f13f98 9.3 9,856 7f13198 7.9 1,320
1,372 8f19f98 8.6 9,273 7f2V98 8.3 1,279QQ9 011 TK3Q ~.3 6,396 7f29f98 8.5 1,372
11/11/98 9.(
12/15f98 9.:
lf19f99 9.. 7,””* /,,,,7” “.,
10J14f98 8.5
1lf10f98 8.1
12f15/98 9.0
lf19f99 8.3
-1-ma611
6441 12<

WSRC-TR-98-O0428, Rev. O Airlift Recirculation Well Final Report - Southern Sector 55
- Wells MSB-074 and SSM-005SSM-005 B SSM-005 C
1 D.O. I TCE I I D.O. I TCE
Table 6: Results of groundwater samplingMSB-074B MSB-074 c
D.O. TCE D.O. TCE
Date
212419’7 6.8 1,522 2125197 0.6 64 814197 8.9 5,107 814197 8.2 1,229
3/11/97 7.0 894 3/11/97 0.2 27 8/21/97 8.3 4,565 8/21/97 8.2 1,620
5/1/97 9.3 1,030 5n/97 0.3 77 8127197 10.4 5,501 8127197 10.1 1,276
5nn7 7.1 1,109 5/2o197 0.3 64 10/9/97 8.4 4,407 10/9/97 8.8 1,241
5120i97 7.1 1,101 5/28/97 0.4 62 11/4/97 9.2 4,180 1115197 9.7 1,138
5J28i97 7.3 662 614197 0.7 80 11/20/97 9.1 5,957 11/20/97 9.6 750
615/97 7.2 696 6I1OI97 0.6 76 12/11197 9.7 5,218 12/11197 10.0 840
6I1OD7 7.3 745 6117i97 0.4 55 1/15/98 8.8 5.252 1/14/98 9.6 1.523
6117/97 6.6 583 7/21/97 0.4 58 2/12/98 8.8 4,663 2/12/98 9.6 1,413
712U97 7.1 639 8f19f97 0.8 99 315198 8.9 4,045 315198 9.9 1,290
8/20197 8.3 334 8126197 0.3 99 313V98 9.9 3,690 3/31/98 10.7 1,434
8t27197 j 8.8 I 324 I ion/97 I 0.3 I 127 / 4/15/98 I 8.3 I 3,454 I 4/16/98 I 10.1 1,168
lonB7 I 7.7 405 11/4/97I 0.2 117 I 5/13/98 I 9.4 4.776 I 5/13/98 i 10.3 1.471 I1114#7 7.2 382 11/19/97 0.1 166 6/11/98 6.9 3,741 6/12/98 8.9 1,043
11/19/97 7.5 414 12/10/97 0.3 169 6/17/98 11.2 2,901 7/23/98 9.2 1,289
12/10/97 7.3 395 1/13/98 0.5 149 6/22/98 7.5 4,283 8125L18 10.7 837
I l/13i98 I 7.5 I 300 I 2/10/98I 0.8 I 160 I 6/’29/98I 9.3 I 3.057 I 9/18/98I 10.0 ! 873 I
4J16198 6.7 180 3/3/98 0.4 216 7n198 6.8 3,149 10/19/98 10.1
5113/98 7.9 196 3/19/98 0.7 208 7/1 3198 8.4 11113/98 9.7
6f2i98 6.6 183 3131#8 1.0 168 7123198 7.5 3,662 12/16/98 0.0 +
1,036
1,025
1 1
8124/98 I 8.4 t .-v , .,,.,,,,, , ..~ , ,. i .,,./, /.,
1 6/12/98I 7.3 i 151 I 4/14/98i 0.7 ! 155 I 7129198 7.5 3,683 1/21/99 9.2 1,260
8.7 3,522
, J“ I “,,.,70 , . .. 1 ,J I 0,, J,70 8.1 2,904176 fill 7mQ I 1A 71 Q/l O/OQ 8.8 2.902
9117i98 8.8 103 6/23/98 0.7 103 8/25/98
10/16/98 8.3 133 6129198 1.6 $’Q ‘ ‘n’m”
11/11/98 7.8 196 7mmQ 1-J 1’
L -1
9.5 2,939
00 7/.+1f70 9.1 3,584
,,,,7” , A.-1
,01 10/19/98 9.4
12/15/98 8.6 175 7/13/98I 0.6 94 11/13/98 8.9 7.141
1/19/99 8.3 208
,,A7,70 , “.& I -,, r ,, LZ.J-,-, , 7.G , ,. ,7, , .
8/3/98 I 0.2
7121198 I 0.5 I 92 I 12/16/98I 0.0 I 6,164 I I‘7rlnmQI no It* I ln?lnn I 09 I 7403 I 1
I I I ! 8/13/98! 0.7 I
I I 8/19/98I 0.4 II I 9/1 719fi I 0.3
I I I I 10/16/98I 0.4 I
..- .-- . . . .-1
., _.. I 1 1
90 I I 1, ,88 I 1 I I I%2 I 1
, 1 , , , ,
50 I I<1 I I I I i11/11/98 0.6
12/15/98 0.7
1/19/99 0.8 J.I I I 1 I I J
-. I I I I I I
.47<0 I I i I I I 1

Table 7: Results of groundwater sampling - Wells SSM-006 andSSM-006 B SSM-006 C SSM-007 B
D.O. TCE D.O. TCE D.O. TCE
Date ppb Date mgfL ppb
7/21/97 8.1 740 7/22/97 3.1 179 7/21197 6.2 237
8/22/97 7.7 671 8/21/97 5.5 1,428 8119197 8.2 173
SSM-007SSM-007 C
a
D.O.
Date
7/21/97 4.6
8/19/97 5.8
8/27/97 7.1
TCE
ppb
1,671
1,935
1,550
i 10/8/97I 8.2 I 599 10/8/97] 7.1 I 991 I 10/8/97I 8.9 I 218 I 10/8/97[ 6.5 I 1,209
i 8/27/97I 9.6 I 744 I 8/27/97! 6.3 I 1.259 ! 8/27/97I 9.7 I 224 I
11[5/97 9.0 597 11/5/97 7.3 419 1l14f97 9.0 182 1114/97 6.7 1,371
1u20f97 9.1 495 11/20/97 7.9 462 11/19/97 9.4 185 11/19/97 7.3 1,670
12/11/97 9.4 1,162 12/11/97 7.4 318 12/10/97 9.2 190 12/10/97 7.4 1,541
I 1/14/98I 8.8 I 409 ! 1/14/98! 8.8 I 1.012 I 1/14/98I 9.0 i 195 I 1/14/98i 7.4 I 1.512 I
2[10/98 8.4 406 2/12/98 9.4 1,280 2/12/98 9.1 252 2/12/98 7.3 1,308
3/3/98 9.2 465 3/3/98 10.0 1,256 3/4/98 9.3 335 314/98 7.4 1,318
3/19/98 8.9 428 3/19/98 9.1 1,403 4/2/98 8.9 260 4f2f98 6.6 924
\ 3/31/98I 9.8 I 414 I 4/2/98 i 9.2 I 1.269 I 4/16/98 I I 204 I 4/16/98 i I 777 I\4/15/98 9.3 504 4/16/98 9.8 1.291 5/13/98 9.9 285 5/13/98 7.4 779
5/13/98 10.0 271 5/13/98 10.1 1,276 6/12/98 8.2 100 6/12/98 7.0 509
6/12/98 8.2 340 6/12/98 8.5 1,113 7/23/98 8.3 132 7/22/98 6.9 491
7/23/98 8.6 394 7/23/98 9.6 1,529 8/25/98 9.2 79 8/25/98 7.2 420
I 8/25/98I 9.0 I 363 I 8/25/98 I 9.9 I 877 I 9/18/98I 9.3 I 74 I 9/18/98I 7.1 I 598 I
9/18/98 8.9 748 9/18/98 9.9 843 10/16/98 9.6 103 10/16/98 7.8
10/19/98 9.4 895 10/19/98 9.2 729 11/11/98 9.3 129 11/11/98 8.0
11/13/98 9.1 761 11/13/98 8.6 1.406 12/15/98 9.9 214 12/15/98 8.9 31,050
2,849
2,409
WSRC-TR-98-O0428,Rev. O Airlift Recirculation Well Final Report - Southern Sector 56
12/16/98I 0.0 1,057 I 12/16/98I 0.0 1,926 1/21/99I 9.3 I 215 1/21/99I 8.0 2,179
1/21/99j 9.0 1,233 I 1/21/99j 9.0 I 2,904 I ITable 8: Results of groundwater sampling - Wells SSM-008 and SSM-009
SSM-008 B SSM-008 c SSM-009 B SSM-009 C
D.O. TCE D.O. TCE D,O. TCE D.O. TCE
- w ppb Date Ill@ ppb Date @ ppb Date mgfl ppb
2/13/98 4.1 2/13/98 0.5 1,085 1/15/98 4.8 7,613 1/15/98 3.2 1,259
3/5/98 1.2 7.909 315/98 3.2 1.044 2/13/98 3.1 4.564 2/13/98 3.7 1.187

WSRC-TR-98-O0428, Rev. O Airlift Recirculation Well Final Re~ort - Southern Sector !57
i%hle 9: Resnlts nf exhmwst nir mrnnlinr - WR412.---- . . .-.. —— -- -------- —. ----- -.. ---- ----
Period Inlet Exhaust air Exhaust air Cumulative Cumulative Notesairflow cone. cone. (ppmv lbs. TCE lbs. PCE(Cfrn) (ppmv PCE) removed removed
TCE)
Jan-97 18 1.7 0.007 0.3 0.001Feb-97 22 1.7 0.007 1.0 0.006Mar-97 30 1.2 0.024 1.9 0.020Apr-97 30 1.2 0.024 7.3 0.052May-97 30 55 0.400 46.2 0.265 1Jun-97 30 56 0.400 76.8 0.517Ju1-97 28 75 1.500 122.5 1.276
Aug-97 33 81 0.670 182.7 1.690Sep-97 26 55 0.150 214.6 1.783 2oct-97 38 50 0.450 255.6 2.067Nov-97 38 52 0.540 303.8 2.537Dee-97 36 78 0.950 336.8 2.871 3Jan-98 35 78 0.950 100.9 3.497Feb-98 33 76 1.100 454.0 4.129Mar-98 33 72 0.730 508.0 4.582Apr-98 33 64 0.650 554.2 4.973May-98 33 62 0.054 600.0 5.282Jun-98 33 63 0.930 643.5 5.840Ju1-98 33 54 1.150 679.7 6.551
Aug-98 31 67 2.220 729.2 7.840Sep-98 o NA NA 729.2 7.840 4Ott-98 o NA NA 729.2 7.840Nov-98 o NA NA 729.2 7.840Dee-98 o NA NA 729.2 7.840
Notes: 1) Well was redeveloped 4/24/97. Air injection submergence= 50.6 feet.2) Air injection submergence reduced to 30.6 feet.3) Air injection submergence returned to 50.6 feet.4) Well removed from service for upgrades.