aircraft technology modeling and assessment
TRANSCRIPT

FAA CENTER OF EXCELLENCE FOR ALTERNATIVE JET FUELS & ENVIRONMENT
Project manager: Arthur Orton, FAAGeorgia Tech (Lead University): Dimitri Mavris (PI), Jimmy Tai (Co-PI)
Purdue: Daniel DeLaurentis, William Crossley (PIs)Stanford: Juan J. Alonso (PI)
Aircraft Technology Modeling and AssessmentProject 10
Opinions, findings, conclusions and recommendations expressed in this material are those of the author(s)and do not necessarily reflect the views of ASCENT sponsor organizations.

2
OverviewObjective: Define range of scenarios that bound the demand for future aviation activity and assess the effects of different fleet composition, mission specification changes, and aircraft technology on fuel burn, emissions, and noise from aviation• Evaluate broad set of future scenarios out to 2050, showing potential benefits of
technology/mission spec. changes on fuel burn, emissions, and noise• Provide modeling and assessment mechanism for aircraft technology• Support NextGen Goals Analysis, other analyses
Approach:1. Develop a set of harmonized fleet assumptions for use in future fleet
assessments; – Workshops/consensus building among academia, government, industry
2. Model advanced aircraft technologies and advanced vehicles expected to enter the fleet through 2050; while– Leveraging, heavily, previous modeling work in CLEEN, NASA programs – and filling
gaps as necessary for scenarios developed in (1)
3. Perform vehicle and fleet level assessments based on input from the FAA and the results of (1) and (2).
Studies will be performed by each university team using in-house expertise and tools in complementary areas.
3
Airline Fleet Allocation
Environmental Impact Metrics
Environmental Policy
Environmental Constraints
Fuel Tax
Projected Demand
Total OC
Aircraft Performance
MetricsAvailable Aircraft
Fleet
Biofuels Price
Fuel DOCNon-fuel
DOC + IOC
Fare
Fare Yield
Price-Demand Elasticity
Inherent Demand
GDP GrowthInitial Fleet
Improved Operational
Concepts and Technologies
FLOPS Models
Aircraft Technology Portfolio
Operating Aircraft Fleet
Aircraft Retirement
Aircraft Delivery
EIS Dates
Aircraft Production
Airport Capacity Constraints
Economic FactorsMarket Factors
Aircraft FactorsEnvironmental Factors
Airline Profit
EIA Fuel Price
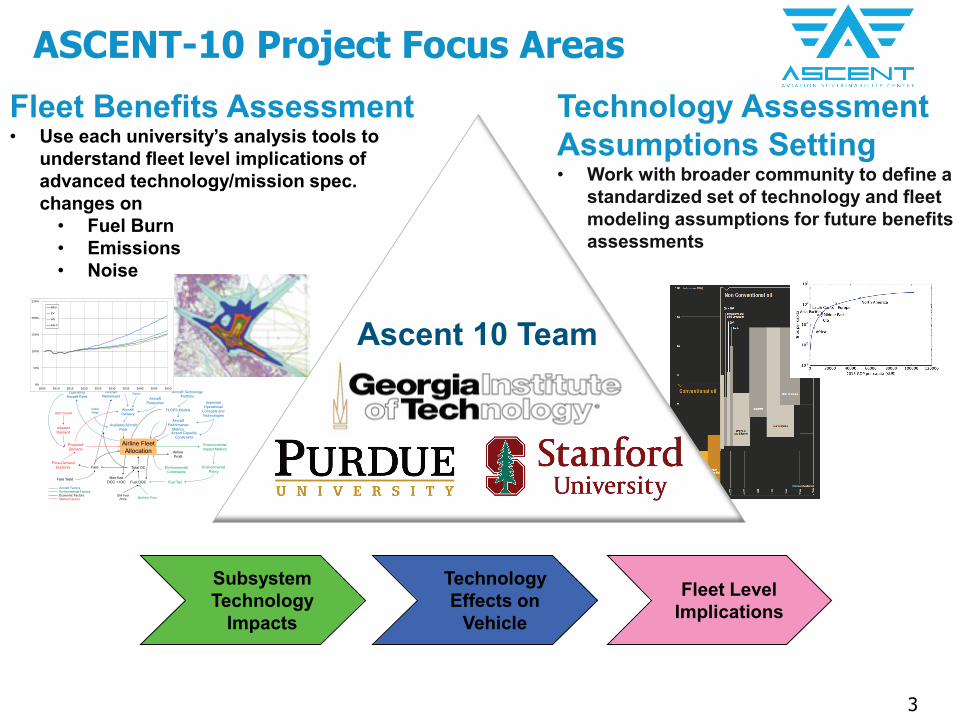
ASCENT-10 Project Focus Areas
Ascent 10 Team
Fleet Benefits Assessment• Use each university’s analysis tools to
understand fleet level implications of advanced technology/mission spec. changes on• Fuel Burn• Emissions• Noise
Technology Assessment Assumptions Setting• Work with broader community to define a
standardized set of technology and fleet modeling assumptions for future benefits assessments
0%
50%
100%
150%
200%
250%
2005 2010 2015 2020 2025 2030 2035 2040 2045 2050
BAU
EV
AG
AG-C
Subsystem Technology
Impacts
Technology Effects on
Vehicle
Fleet Level Implications
4
DEVELOPMENT OF FLEET & TECHNOLOGY MODELING ASSUMPTIONS

5
Vehicle Analysis
Fundamental Assumptions & Approach
FLEET or GREAT
Technologies• Demand Forecast • Aircraft Retirements• Replacements Schedule• New Product / Upgrade Availability
Fleet Impact
OperationsTSFC Weight Aero
T1T2T3T4T5T6T7T8T9T10T11T12
• Benefit• Applicability• Availability
Technology Evolution
Time2015 2020
RJ
STALTA
SA
Scenarios
Scenario 1Scenario 2
…
Vehicle Performance Characteristics
• FB/Operation• Total Ops• Total FB
Fleet Analysis
6
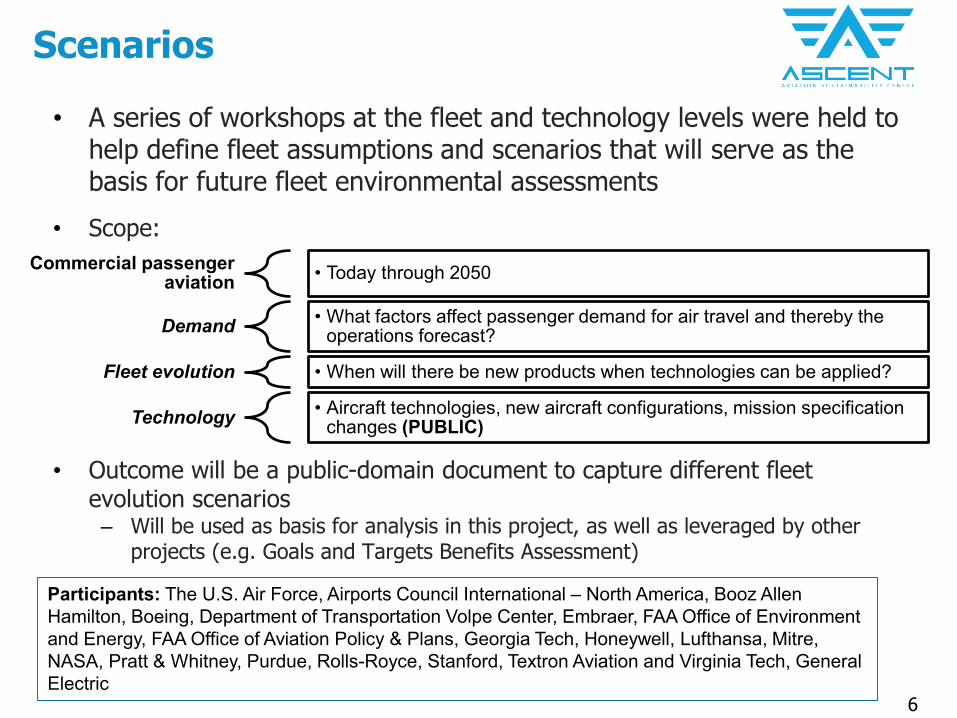
Scenarios
• A series of workshops at the fleet and technology levels were held to help define fleet assumptions and scenarios that will serve as the basis for future fleet environmental assessments
• Scope:
• Outcome will be a public-domain document to capture different fleet evolution scenarios
– Will be used as basis for analysis in this project, as well as leveraged by other projects (e.g. Goals and Targets Benefits Assessment)
Commercial passenger aviation • Today through 2050
Demand • What factors affect passenger demand for air travel and thereby the operations forecast?
Fleet evolution • When will there be new products when technologies can be applied?
Technology • Aircraft technologies, new aircraft configurations, mission specification changes (PUBLIC)
Participants: The U.S. Air Force, Airports Council International – North America, Booz Allen Hamilton, Boeing, Department of Transportation Volpe Center, Embraer, FAA Office of Environment and Energy, FAA Office of Aviation Policy & Plans, Georgia Tech, Honeywell, Lufthansa, Mitre, NASA, Pratt & Whitney, Purdue, Rolls-Royce, Stanford, Textron Aviation and Virginia Tech, General Electric

7
Scenarios
• Workshop feedback has been used to formulate recommended scenarios
• Defined Scenarios with emphasis on technology impacts– Current Trends– Variations
• Environmental “Bounds” – Low/High• Demand – Low/High• Aircraft Technology – Low/High R&D
– Downselected to no more than a dozen interesting scenarios with meaningful descriptor settings and combinations
• Producing final scenario descriptions including specific time series data
• Have completed vehicles, but not yet included in fleet analysis– 50, 100, 150, 210, 300, 400+ passenger types– Technology variants from scenarios– Cruise Speed Reduction (CSR) variants also designed

8
Aircraft Technology Energy PriceEconomic Growth
ScenariosSc
enar
ios
Low
Low Nominal Low Demand +Low R&D
High
Low Environmental Bounds “High”
Nominal High Demand + Low R&D
Nominal Nominal Nominal Current Trends “Best Guess”
High
Low
Nominal Low Demand + High R&D
High Environmental Bounds “Low”
Nominal Nominal Current Trends + High R&D
High Nominal High Demand + High R&D
* ‘Frozen technology’ scenario not shown aboveAlso evaluate with mission spec. changes

9
Mission Specification Changes – Cruise Speed Reduction Impact on Fuel Burn
• Block fuel burn of re-designed aircraft is smaller by 4-15% depending on aircraft class and selected cruise Mach number
• In these re-designs the wing span is constrained to be smaller than the baseline aircraft value
• For each aircraft, the economically-viable CSR is typically around 8-10% of the baseline value (indicated with on the plot)

10
Fleet Level Results GREAT
*Preliminary Results, do not cite or quote
• Scenarios are bounding cases• Technology has effect on fleet
composition, demand, and environmental impact at the same time
• Frozen Tech and High R&D are extremes
11
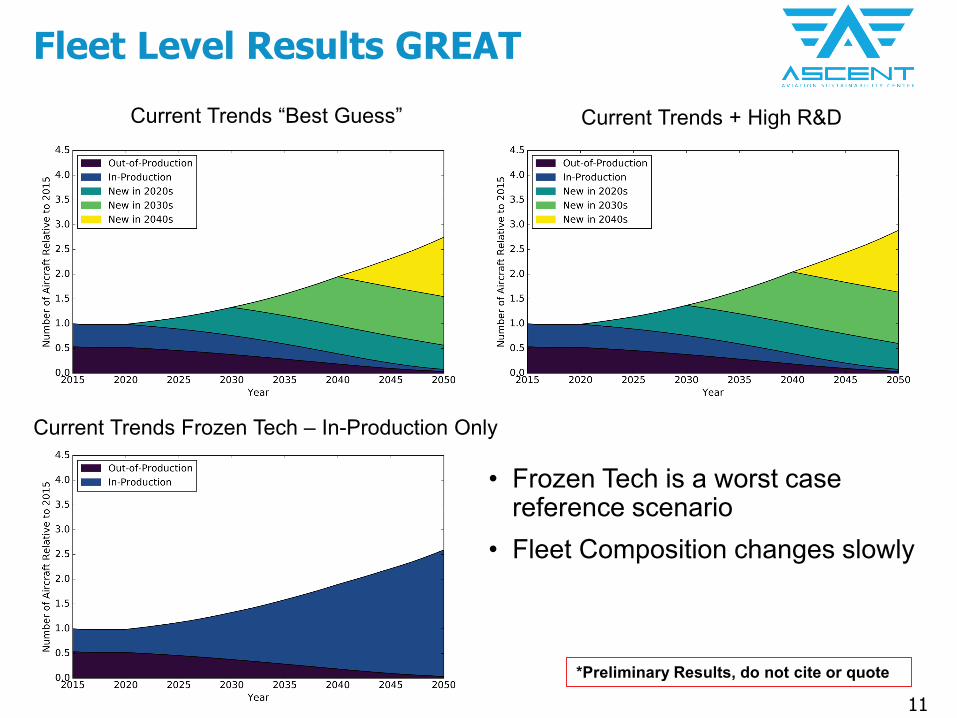
Fleet Level Results GREAT
*Preliminary Results, do not cite or quote
Current Trends + High R&D
Current Trends Frozen Tech – In-Production Only
Current Trends “Best Guess”
• Frozen Tech is a worst case reference scenario
• Fleet Composition changes slowly

12
Fleet-Level Results - FLEET
*Preliminary Results, do not cite or quote

13
Deployed Aircraft by “Technology Age” - FLEET
• In the Best Guess and High R&D scenarios, the airline introduces newer technology aircraft as they become available
• Airline fleet in Best Guess and High R&D scenarios are primarily composed of New and Future-in-class aircraft by 2050
~4.10
~3.90
~1.10 ~1.13
~3.95
*Preliminary Results, do not cite or quote

14
Next Steps
• Summary of Results– Presented workshop results / two tools / different opinions
• Next Steps– Complete quantitative assessment of selected scenarios– Present finalized scenarios and assumptions in report
• Available for use by other projects/analyses

15
QUESTIONS?