aircraft jet plume source noise measurement system · the overall military jet noise problem,1,2 a...
TRANSCRIPT

www.SandV.com14 SOUND & VIBRATION/AUGUST 2010
Jet engine technology is more sophisticated than ever, building on decades of learning and growth in the field. However, even the latest advances in jet engine design and technology have not been able to counter an age-old challenge – noise. Noise issues persist and adversely impact both ground maintenance person-nel and surrounding communities. There is continued research to combat this issue, but for these emerging tools to achieve their full potential, innovative measurement and analysis methods are necessary to characterize the jet noise source region. A near-field acoustic holography system has been developed to meet this need and provide high-quality acoustic data. These data can be used for model refinement and benchmarking, evaluation of noise control devices, and predicting ground maintenance personnel and community noise exposure. The design of the 150-channel measurement array and data acquisition system is presented here. The prototype system was used recently to perform jet source noise measurements of an F-22 at Holloman Air Force Base located near Alamogordo, NM. The measurement approach and sound pressure level measurement maps detailing the near-field levels, spatial extent, and frequency content for four power conditions are featured.
While advanced modeling tools are being developed to address the overall military jet noise problem,1,2 a lack of understanding of the jet noise source persists. Near-field acoustic measurements of the jet plume are critical to providing a better understanding of the jet source region, but these measurements are difficult to conduct because of the extreme nature of the acoustic and temperature environments near the jet plume. To address this challenge, a near-field acoustic holography (NAH) measurement and analysis method has been developed to measure the magnitude, directiv-ity, spectral content and spatial distribution of the noise emitted from a jet. Determining these quantities will help provide insight into physical noise generation mechanisms in the turbulent flow field. This detailed characterization of jet noise may be used in projects to optimize the positioning of military ground maintenance personnel to minimize noise exposure, provide input to empirical models, validate computational aeroacoustics models, and evaluate jet source noise reduction techniques. Moreover, this technology can be applied to commercial aircraft and proposed supersonic business aircraft to help evaluate and assess jet noise reduction methods. (Note that portions of the material presented in this article were also presented in a paper at INTER-NOISE 2009 in Ottawa, Canada,3 and in a presentation at the 2010 Acoustical Society of America meeting in Baltimore, MD.4)
System DesignNAH enables the mapping of a two-dimensional hologram
measurement to reconstruct the sound field in a three-dimensional volume near the measurement region. Applying NAH processing to characterize a full-scale jet plume and developing an appropriate measurement array pose several technical and logistical challenges. Accurate characterization of the near-field of a military jet aircraft requires the ability to record sound pressure levels up to 173 dB and frequencies from 5 Hz to 30 kHz. In addition, measurements must be made along the entire length of the plume, extending up to 80 feet or longer. The measurement system must be semi-portable due to the limited set of locations where military jets can perform static high-power engine run-ups. Finally, the system must integrate the technical requirements for NAH with the environmental conditions and safety constraints involved with jet noise measurements.
With these design constraints in mind, and to measure a surface
large enough to characterize the entire jet noise source with a rea-sonable number of microphones, a scan-based microphone array “patch” with stationary reference microphones was proposed. Our design uses a two-dimensional microphone array with 90 micro-phones. The microphone array can be positioned in a horizontal or a vertical configuration. The horizontal configuration, as shown in Figure 1, is used to minimize the time required to measure the length of the plume, while the vertical profile provides useful data for understanding the effects of the ground plane. The physical center height of the microphone array can also be adjusted be-tween 3 and 7 feet from the ground to account for the differing nozzle heights of various jet aircraft. The microphone array has a nominal spacing of 6 inches between microphones on both the vertical and horizontal planes. However, the array is capable of spacing adjustments down to 2-inch increments. A spacing of 6 inches limits the resolution of the NAH processing to frequencies up to about 1.1 kHz because of a restriction of two measurements per wavelength.
The array design employs three separate microphone panels that break the array up into smaller packages for shipping, assembly, and setup flexibility. The microphone mounts have rubber sleeves and positive positioning with BNC connectors. Eight microphone mounts are then routed through a National Instruments’ (NI) BNC-2144 to an InfiniBand breakout box. Each panel therefore has a 32-channel breakout box, each with four 8-channel InfiniBand connectors, with an extra breakout box reserved for reference microphones. Thirty channels on each panel are dedicated to microphones, and two channels are dedicated to accelerometers and/or meteorological sensors. This modular design allows for the individual array panels to be packed and shipped pre-assembled with the connectors and microphone mounting assemblies intact. This feature minimizes set-up, cable runs, and connections re-quired in the field. The panel only needs to have the microphones plugged in and the InfiniBand cables connected.
In addition to the microphone panels, reference microphones are located at fixed locations along the source length. The number of reference microphones needs to be increased as the desired upper frequency for the NAH increases. Research is ongoing to guide the selection of the quantity and location of reference microphones.5-7
However, as many as 50 reference microphones will be used dur-ing tests with subsets of the data examined to determine the actual number required.
The design includes a significant amount of cabling due to the high channel count and the need to position the data acquisition package as far from the jet as practical. The cabling length helps to minimize the potential of data acquisition system vibration issues and noise exposure of testing personal. To minimize problems with the cables, each breakout box is connected to a wrapped and bundled set of four InfiniBand cables that are then rolled onto a spool. While the spools weigh almost 100 pounds each (and there are a total of four), each is a single unit that is easily deployable and reduces the typical cabling clutter from high-channel-count measurements.
Instrumentation DesignThe heart of the measurement system is a NI PXI data acquisi-
tion system chosen for its flexibility, scalability, and cost effec-tiveness. The flexibility to scale the number of data channels and microphones based on the desired frequency range of the NAH reconstruction, measurement time, and system cost is critical to this application. Increasing the density of the microphones increases the maximum frequency of the NAH reconstruction,
Aircraft Jet Plume SourceNoise Measurement SystemMichael M. James, Blue Ridge Research and Consulting, Asheville, North CarolinaKent L. Gee, Brigham Young University, Provo, Utah
www.SandV.com SOUND & VIBRATION/AUGUST 2010 15
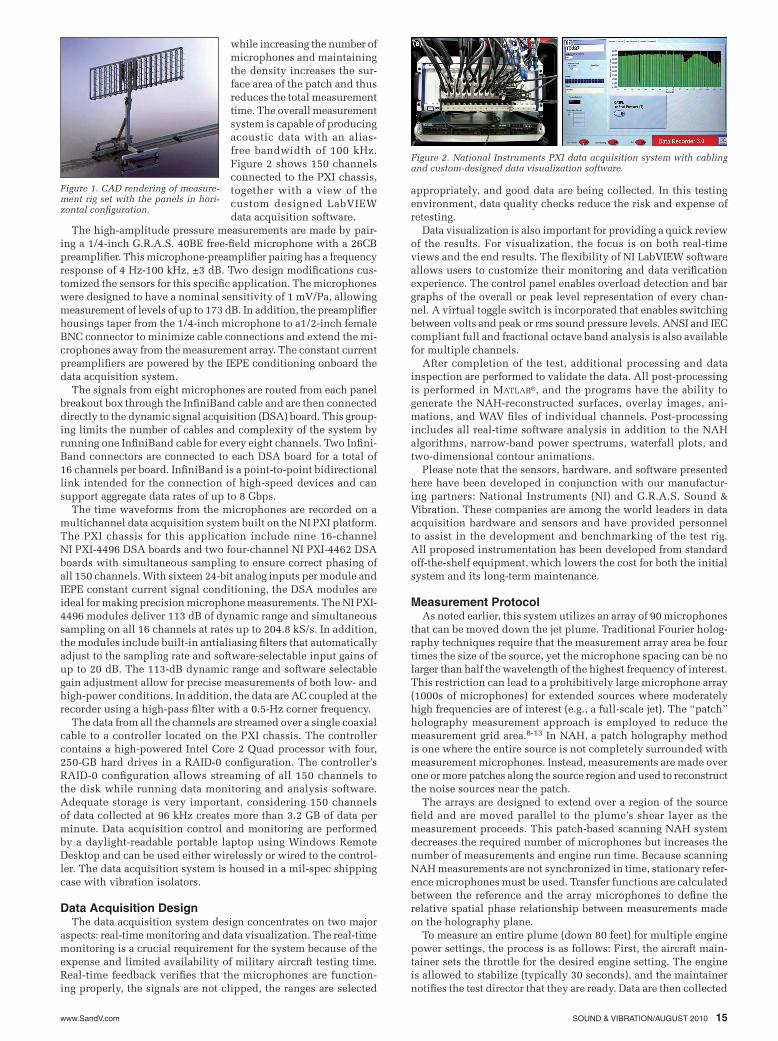
while increasing the number of microphones and maintaining the density increases the sur-face area of the patch and thus reduces the total measurement time. The overall measurement system is capable of producing acoustic data with an alias-free bandwidth of 100 kHz. Figure 2 shows 150 channels connected to the PXI chassis, together with a view of the custom designed LabVIEW data acquisition software.
The high-amplitude pressure measurements are made by pair-ing a 1/4-inch G.R.A.S. 40BE free-field microphone with a 26CB preamplifier. This microphone-preamplifier pairing has a frequency response of 4 Hz-100 kHz, ±3 dB. Two design modifications cus-tomized the sensors for this specific application. The microphones were designed to have a nominal sensitivity of 1 mV/Pa, allowing measurement of levels of up to 173 dB. In addition, the preamplifier housings taper from the 1/4-inch microphone to a1/2-inch female BNC connector to minimize cable connections and extend the mi-crophones away from the measurement array. The constant current preamplifiers are powered by the IEPE conditioning onboard the data acquisition system.
The signals from eight microphones are routed from each panel breakout box through the InfiniBand cable and are then connected directly to the dynamic signal acquisition (DSA) board. This group-ing limits the number of cables and complexity of the system by running one InfiniBand cable for every eight channels. Two Infini-Band connectors are connected to each DSA board for a total of 16 channels per board. InfiniBand is a point-to-point bidirectional link intended for the connection of high-speed devices and can support aggregate data rates of up to 8 Gbps.
The time waveforms from the microphones are recorded on a multichannel data acquisition system built on the NI PXI platform. The PXI chassis for this application include nine 16-channel NI PXI-4496 DSA boards and two four-channel NI PXI-4462 DSA boards with simultaneous sampling to ensure correct phasing of all 150 channels. With sixteen 24-bit analog inputs per module and IEPE constant current signal conditioning, the DSA modules are ideal for making precision microphone measurements. The NI PXI-4496 modules deliver 113 dB of dynamic range and simultaneous sampling on all 16 channels at rates up to 204.8 kS/s. In addition, the modules include built-in antialiasing filters that automatically adjust to the sampling rate and software-selectable input gains of up to 20 dB. The 113-dB dynamic range and software selectable gain adjustment allow for precise measurements of both low- and high-power conditions. In addition, the data are AC coupled at the recorder using a high-pass filter with a 0.5-Hz corner frequency.
The data from all the channels are streamed over a single coaxial cable to a controller located on the PXI chassis. The controller contains a high-powered Intel Core 2 Quad processor with four, 250-GB hard drives in a RAID-0 configuration. The controller’s RAID-0 configuration allows streaming of all 150 channels to the disk while running data monitoring and analysis software. Adequate storage is very important, considering 150 channels of data collected at 96 kHz creates more than 3.2 GB of data per minute. Data acquisition control and monitoring are performed by a daylight-readable portable laptop using Windows Remote Desktop and can be used either wirelessly or wired to the control-ler. The data acquisition system is housed in a mil-spec shipping case with vibration isolators.
Data Acquisition DesignThe data acquisition system design concentrates on two major
aspects: real-time monitoring and data visualization. The real-time monitoring is a crucial requirement for the system because of the expense and limited availability of military aircraft testing time. Real-time feedback verifies that the microphones are function-ing properly, the signals are not clipped, the ranges are selected
appropriately, and good data are being collected. In this testing environment, data quality checks reduce the risk and expense of retesting.
Data visualization is also important for providing a quick review of the results. For visualization, the focus is on both real-time views and the end results. The flexibility of NI LabVIEW software allows users to customize their monitoring and data verification experience. The control panel enables overload detection and bar graphs of the overall or peak level representation of every chan-nel. A virtual toggle switch is incorporated that enables switching between volts and peak or rms sound pressure levels. ANSI and IEC compliant full and fractional octave band analysis is also available for multiple channels.
After completion of the test, additional processing and data inspection are performed to validate the data. All post-processing is performed in MATLAB®, and the programs have the ability to generate the NAH-reconstructed surfaces, overlay images, ani-mations, and WAV files of individual channels. Post-processing includes all real-time software analysis in addition to the NAH algorithms, narrow-band power spectrums, waterfall plots, and two-dimensional contour animations.
Please note that the sensors, hardware, and software presented here have been developed in conjunction with our manufactur-ing partners: National Instruments (NI) and G.R.A.S. Sound & Vibration. These companies are among the world leaders in data acquisition hardware and sensors and have provided personnel to assist in the development and benchmarking of the test rig. All proposed instrumentation has been developed from standard off-the-shelf equipment, which lowers the cost for both the initial system and its long-term maintenance.
Measurement ProtocolAs noted earlier, this system utilizes an array of 90 microphones
that can be moved down the jet plume. Traditional Fourier holog-raphy techniques require that the measurement array area be four times the size of the source, yet the microphone spacing can be no larger than half the wavelength of the highest frequency of interest. This restriction can lead to a prohibitively large microphone array (1000s of microphones) for extended sources where moderately high frequencies are of interest (e.g., a full-scale jet). The “patch” holography measurement approach is employed to reduce the measurement grid area.8-13 In NAH, a patch holography method is one where the entire source is not completely surrounded with measurement microphones. Instead, measurements are made over one or more patches along the source region and used to reconstruct the noise sources near the patch.
The arrays are designed to extend over a region of the source field and are moved parallel to the plume’s shear layer as the measurement proceeds. This patch-based scanning NAH system decreases the required number of microphones but increases the number of measurements and engine run time. Because scanning NAH measurements are not synchronized in time, stationary refer-ence microphones must be used. Transfer functions are calculated between the reference and the array microphones to define the relative spatial phase relationship between measurements made on the holography plane.
To measure an entire plume (down 80 feet) for multiple engine power settings, the process is as follows: First, the aircraft main-tainer sets the throttle for the desired engine setting. The engine is allowed to stabilize (typically 30 seconds), and the maintainer notifies the test director that they are ready. Data are then collected
Figure 1. CAD rendering of measure-ment rig set with the panels in hori-zontal configuration.
Figure 2. National Instruments PXI data acquisition system with cabling and custom-designed data visualization software.

www.SandV.com16 SOUND & VIBRATION/AUGUST 2010
for that position for each engine power condition. Once the data are collected, the test director notifies the aircraft maintainer, nor-mally with hand signals. The maintainer then reduces the engine to idle. Once the engine is safely at idle, the measurement array is moved down the track along a metal guide to another predefined position. The wheels are locked into place, and the maintainer is notified that they are ready for another measurement. While this methodology may seem cumbersome and require repeated cycling of the engine, it actually serves a dual purpose. Ground-based air-craft cannot run their afterburners for very long before they need to cool down. The brief respite between measurement positions dovetails well with the engine cooling requirements. The reference microphones allow the data to be normalized between different runs to account for slight variations in engine setting.
F-22 MeasurementsThe first full system test came with an opportunity to obtain
measurements on an F-22 Raptor in July 2009, as shown in Fig-ure 3 and Figure 4. The microphone array was set up in several configurations, with measurements made either parallel to the
jet plume or parallel to the jet centerline, at three difference dis-tances. Measurements were made from the jet nozzle down to 75 feet along the plume and over 6 feet in height. Figure 5 shows a scaled representation of the vehicle with three of the measurement planes shown as the color pressure maps collected as part of the July 2009 tests.
With this arrangement, microphone measurements were made every 6 inches down the plume, with more than 1800 measure-ments per offset distance. These measurements were repeated for four engine conditions ranging from idle to full afterburner, yield-ing a total of more than 6,000 measurement points and making this the largest near-field acoustic measurement of a high-power military jet ever performed. In addition, over 50 ground-based, fixed-reference microphones were located parallel to the nozzle centerline with a spacing of 2 feet and spanning almost 100 feet.
Along with the acoustical data collected by the system, support-ing data were also acquired for the successful characterization of jet noise. These supporting data include aircraft engine operat-ing conditions, vibration and temperature data on the array, and atmospheric data. The aircraft operators recorded the operating conditions including the effective thrust ratio of the engine for each measurement point. The vibration on the array was monitored and recorded by the PXI system, while stand-alone thermocouples were used to capture the temperature on the array, and ambient data were collected with a surface weather data logging system.
Testing demonstrated proper functioning of the measurement system and instrumentation. However, the measurement was not without its own significant challenges. For example, the vibrational loads generated by the high-amplitude acoustic environment lim-ited the sampling rate of the system because the hard-drives had difficulty writing. Future improvements include using solid-state drives to help mitigate this problem. In addition, sound reflections in the measured data are complicated because of the extended source, creating additional challenges for the NAH analysis. The
Figure 4. NAH measurement array positioned approximately 50 feet down-stream during a nighttime F-22 afterburner engine power run.
Figure 5. Three-dimensional schematic of F-22 jet plume acoustic measure-ments at Holloman Air Force Base with overlays of overall sound pressure levels for three measurement planes.
Figure 6. Overall sound pressure level map of F-22 jet plume for multiple engine power conditions.
Figure 7. Third-octave band pressure maps of F-22 jet plume for multiple engine power conditions.
Figure 3. NAH measurement array and reference microphones deployed during an F-22 afterburner engine power run at Holloman Air Force Base.

www.SandV.com SOUND & VIBRATION/AUGUST 2010 17
have been cleared by the 49th Fighter Wing Public Affairs Office at Holloman Air Force Base.
References 1. “Advanced Acoustic Models for Military Aircraft Noise Propagation
and Impact Assessment,” SERDP SI-1304. 2. “Reduction of Advanced Military Aircraft Noise,” WP-1584 “Mechanical
Chevrons and Fluidics for Advanced Military Aircraft Noise Reduction,” SERDP WP-1583.
3. M. M. James, J. M. Downing, K. L. Gee, “Development of a Near-Field Acoustical Holography System for Aircraft Jet Source Noise Measure-ments,” Inter-Noise 2009, Ottawa, Canada.
4. M. M. James, K. L. Gee, et al., “Aircraft Jet Source Noise Measurements of an F-22 Using a Prototype Near-Field Acoustic Holography Measure-ment System,” ASA 2010, Baltimore, MD.
5. A.T. Wall, K. L. Gee, M. M. James, and M. D. Gardner, “Application of Near-Field Acoustical Holography to High-Performance Jet Aircraft Noise,” J. Acoust. Soc. Am., Vol. 127, No. 3, p. 1879, 2010.
6. M. Gardner, “Scan-Based Near-Field Acoustical Holography on Partially Correlated Sources,” Master’s thesis, Brigham Young University, Provo, UT, 2009.
7. K. L. Gee, S. A. McInerny, M. M. James, J. M. Downing, “A Preliminary Investigation of Near-Field Acoustical Holography in Characterizing Noise from Military Jet Aircraft,” Noise-Con 2008.
8. J. Hald and J. Gomes, “A Comparison of Two Patch NAH Methods,” Proc. Inter-Noise 2006, Honolulu, HI.
9. M. Lee and J. S. Bolton, “Patch Near-Field Acoustical Holography in Cylindrical Geometry,” J. Acoust. Soc. Am., Vol. 118, No. 6, pp. 3721-3732, 2005.
10. E. G. Williams, B. H. Houston, and P. C. Herdic, “Fast Fourier Transform and Singular Value Decomposition Formulations for Patch Nearfield Acoustical Holography,” J. Acoust. Soc. Am., Vol. 114, No. 3, pp. 1322-1333, 2003.
11. M. Lee and J. S. Bolton, “A One-Step Near-Field Acoustical Holography Procedure,” Proc. Inter-Noise 2006, Honolulu, HI.
12. E. G. Williams, “Regularization Methods for Near-Field Acoustical Ho-lography,” J. Acoust. Soc. Am., Vol. 110, No. 4, pp. 1976-1988, 2001.
13. J. H. Thomas and J. C. Pascal, “Wavelet Preprocessing for Lessening Truncation Effects in Near-Field Acoustical Holography,” J. Acoust. Soc. Am., Vol. 118, No. 2, pp. 851-860, 2005.
The author can be reached at: [email protected].
following are some of the preliminary plots and pieces of data reduction we have conducted for this extensive data set, but the analysis of this extensive data set will continue.
The overall sound pressure levels measured in relation to the aircraft location for each engine condition are shown in Figure 6. Please note that the scale has been optimized to show the details of the source for each engine power condition. Figure 7 provides spatial pressure maps detailing the frequency content of the jet along the plume. These maps were made from a single line of microphones, 7.25 feet above the ground at one offset distance. These plots show the position down the plume on the X-axis, the frequency on the Y-axis, and the amplitude identified by the color.
SummaryAlthough jet noise source characterization is a challenging prob-
lem, a better understanding of the noise sources within the plume will aid in developing innovative techniques to reduce the noise exposure to ground maintenance personal and the community at large. Regardless of the choice of NAH method, a single array capable of characterizing the entire jet noise source region with a single measurement run is impractically large and would require thousands of microphones. This impractically drove the selection of a scanned patch NAH measurement approach to minimize the number of sensors and cost to characterize the entire jet plume.
AcknowledgmentsThis research was supported by the Air Force Research Labo-
ratory through the Small Business Innovative Research (SBIR) program. We gratefully acknowledge the hard work of our entire team including: Micah Downing, Bruce Ikelheimer, Kevin Bradley, Brigham Young University, Michael Gardner, Alan Wall, Sally McInerney, Graystone Design Solutions, National Instruments, and G.R.A.S. Sound & Vibration. Special thanks to Dan Santos with the 508 ASW/YF at Hill AFB and Senior Master Sergeant Neil Raben and the 49th Fighter Wing at Holloman Air Force Base. Photographs