airbus innovation days · a320 family 2020 backlog ... • 11% lower fuel burn at powerplant level...
TRANSCRIPT

© AIRBUS all rights reserved. Confidential and proprietary document.
Airbus
Innovation Days Commercial Update
John Leahy Chief Operating Officer - Customers

Sidebar
line up
Text
line up
Content
guides
Logo
zone
-4%
-2%
0%
2%
4%
6%
8%
Q1Q2Q3Q4Q1Q2Q3Q4Q1Q2Q3Q4Q1Q2Q3Q4Q1Q2Q3Q4Q1Q2Q3Q4Q1Q2Q3Q4Q1Q2Q3Q4
End April 2015 to 2016
Source: IHS Global Insight, OAG,
Airbus
World real GDP
World passenger
traffic (ASKs)
2009 2010 2011 2012 2013 2014 2015
World real GDP and passenger traffic
Growth (year-over-year)
2016
Passenger
traffic ----------------------------------------- ---------- ---------- ----------
up 5.9%
outperforming
GDP growth

Sidebar
line up
Text
line up
Content
guides
Logo
zone
-12%
-8%
-4%
0%
4%
8%
12%
16%
J M M J S N J M M J S N J M M J S N J M M J S N J M M J S N J M M J S N J M M J S N
Emerging markets traffic
Western Europe traffic
US traffic
Growth in ASKs (year-over-year)
8.2%
4.9% 3.3%
Source: OAG, Airbus. End April ‘16
Passenger
traffic ----------------------------------------- ---------- ---------- ----------
Dominated by
AA, DL and UA
in the USA
Driven by LCCs
in Europe
Slowing in
Emerging Markets
2009 2010 2011 2012 2013 2014 2015 2016

Sidebar
line up
Text
line up
Meeting
market
demand ----------------------------------------- ---------- ---------- ----------
6,400 new
Airbus orders
in last 5 years*
16,443 Total sales
*End 2010- April 2016
Sidebar
line up
Text
line up
Content
guides
Logo
zone
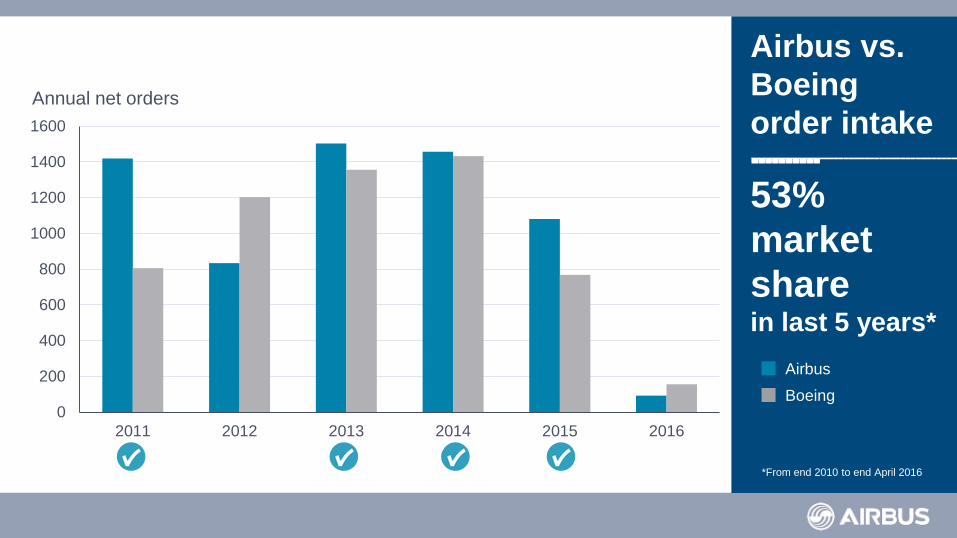
Airbus
Boeing 0
200
400
600
800
1000
1200
1400
1600
2011 2012 2013 2014 2015 2016
Annual net orders
*From end 2010 to end April 2016
Airbus vs.
Boeing
order intake ----------------------------------------- ---------- ---------- ----------
53%
market
share in last 5 years*

Sidebar
line up
Text
line up
Content
guides
Logo
zone
Assuming book-to-bill = 1 from 2016-
2020
0
2,000
4,000
6,000
8,000
10,000
12,000
14,000
16,000
2005 2006 2007 2008 2009 2010 2011 2012 2013 2014 2015 2016 2017 2018 2019 2020
Orders
Deliveries
A320 Family orders and deliveries
A320 Family
2020 backlog ----------------------------------------- ---------- ---------- ----------
5,479
aircraft
8 years of
production
at rate 60
20 34 42 60 Rate

USE
MARKETING
GRAPH
TEMPLATES
Logo
zone
Sidebar
line up
Text
line up
Air travel has overcome external shocks World annual traffic (RPKs - trillions)
0
1
2
3
4
5
6
7
1970 1975 1980 1985 1990 1995 2000 2005 2010 2015
~100%
Oil Crisis Oil Crisis Gulf Crisis AsianCrisis
9/11 SARS Financial Crisis
Air travel
is resilient ----------------------------------------- ---------- ---------- ---------- Air travel has
doubled since
2002
Source: ICAO, Airbus
Preliminary 2015 traffic data

Sidebar
line up
Text
line up
Content
guides
Logo
zone
Source ICAO and 2015 Airbus Global
Market Forecast
Market ----------------------------------------- ---------- ---------- ---------- Air traffic
forecast to
double again
over the next
15 years
0
2
4
6
8
10
12
14
16
1975 1980 1985 1990 1995 2000 2005 2010 2015 2020 2025 2030
World annual RPK* (trillion) Airbus GMF 2015 ICAO total traffic
x2 x2
x2
World air traffic growth

Sidebar
line up
Text
line up
Content
guides
Logo
zone
Market
growth ----------------------------------------- ---------- ---------- ---------- driven by
increasing
middle class
populations

Source: Oxford Economics, Kharas (Brookings 2012) Airbus GMF * Households with yearly income between $20,000 and $150,000 at PPP in constant 2014 prices
** Estimate for 1994 split by region
425 444 471 480 247 259 263 264 512
778 1,081
1,398 608
1,223
1,856
2,579
0
1,000
2,000
3,000
4,000
5,000
2004 2014 2024 2034
History Forecast
Europe
North America
Asia-Pacific
Middle Class*, millions of people
8,600 World Population 8,000 7,200 6,400
55% % of world population 46% 37% 28%
3,671
2,703
4,721
1,792 Other Emerging
Middle class growth will be driven by Asia-Pacific

Sidebar
line up
Text
line up
Content
guides
Logo
zone
Source: Airbus GMF 2015
0 1,000 2,000 3,000 4,000 5,000 6,000
Asia-Pacific
Europe
North America
Middle East
Latin America
CIS
Africa
RPK traffic by airline domicile (billions)
2014 traffic 29%
25%
25%
9%
5%
4%
3%
2014 world
traffic ----------------------------------------- ---------- ---------- ----------
20-year world annual traffic growth
4.6% % of 2014 world RPK

Sidebar
line up
Text
line up
Content
guides
Logo
zone
0 1,000 2,000 3,000 4,000 5,000 6,000
Asia-Pacific
Europe
North America
Middle East
Latin America
CIS
Africa
Source: Airbus GMF 2015
RPK traffic by airline domicile (billions)
2014 traffic 36%
21%
17%
13%
6%
4%
3% % of 2034 world RPK
20-year growth
2034 world
traffic ----------------------------------------- ---------- ---------- ----------
Asia-Pacific
airlines to lead
World traffic by
2034
20-year world annual traffic growth
4.6%

Sidebar
line up
Text
line up
Asia-Pacific ----------------------------------------- ---------- ---------- ----------
33% of the Airbus
in-service fleet
~2,000 aircraft
order backlog
A380: ANA to be 8th Asian operator
A350 XWB: 33% of total order book
A330neo: Garuda is the 3rd Asian airline to order
A320neo: 1st deliveries to India

Sidebar
line up
Text
line up
Excluding undisclosed customers
Europe ----------------------------------------- ---------- ---------- ----------
31% of the Airbus
in-service fleet
1,100+ aircraft
order backlog.
A380: 50 daily flights at Heathrow
A350 XWB “Unreservedly positive” for Finnair
A330neo: TAP Air Portugal to be the first operator
A320neo: 16% fuel savings for Lufthansa

Sidebar
line up
Text
line up
The
Americas ----------------------------------------- ---------- ---------- ----------
23% of the Airbus
in-service fleet
1,000+ aircraft
order backlog
A380: serving 11 cities in the Americas
A350 XWB: TAM first operator in the Americas
A330neo: Orders from Delta, Hawaiian
A320neo:
chosen by American, Frontier, Hawaiian, JetBlue, Spirit & Virgin America

Sidebar
line up
Text
line up
Africa &
Middle East ----------------------------------------- ---------- ---------- ----------
10% of the Airbus
in-service fleet
450+ aircraft
order backlog
A380: Emirates introduce a 615 seat version
Ethiopian 1st to fly A350 XWB in Africa
A330: Rwandair, a new African operator in 2016
A320neo: Air Cote D’Ivoire
place first order in Africa

End April 2016
Orders Deliveries Backlog
12,499 7,020 5,479
A320 Family An A320 takes off or lands every 2 seconds

2016 Innovation Days
Delivery of 7,000th A320 Family - 3rd May 2016

Sidebar
line up
Text
line up
End April 2016
A321 ----------------------------------------- ---------- ---------- ----------
2,800 sales to
over 100
customers
40% of A320
Family deliveries
in 2016
Sidebar
line up
Text
line up
Content
guides
Logo
zone
“We expect the A320neo to achieve around
16-17% lower fuel burn per seat based on
identical aircraft capacity”
Carsten Spohr
Chairman of the Executive Board and
CEO of Deutsche Lufthansa AG
January 2016
A320neo
in operation ----------------------------------------- ---------- ---------- ----------
16.5% less fuel
ISO seats
2-class, 150 pax
800nm

USE
MARKETING
GRAPH
TEMPLATES
Logo
zone
Sidebar
line up
Text
line up
NEO vs. MAX
Single Aisle market shares
4,515
orders
3,090
orders
82
customers
62
customers
737 MAX
NEO leads
MAX ----------------------------------------- ---------- ---------- ----------
More orders
from more
customers
59% overall
market share
(68% in 2015)
End April 2016
Sidebar
line up
Text
line up
Content
guides
Logo
zone
End April 2016
A321neo ----------------------------------------- ---------- ---------- ---------- Undisputed
market leader
with
79% Market share
MAX 9 294 21%
A321neo 1,114 79%

Sidebar
line up
Text
line up
Content
guides
Logo
zone
A321LR ----------------------------------------- ---------- ---------- ----------
4,000nm range
Worldwide
market potential
of 1,000 aircraft
North - South routes
special focus on Brazil
East coast –
Europe
Europe -
Middle East &
Central Asia Europe -
West Africa Australia –
South-east Asia
Eastern Europe –
India

Sidebar
line up
Text
line up
Content
guides
Logo
zone
Firm gross orders for the past five
years
Medium to
long haul
market ----------------------------------------- ---------- ---------- ----------
Airbus is the clear
market leader
A330-200/800
A330-300/900
A320/A320neo
A321/A321neo
787-8
787-9
737-800/MAX 8
737-900/MAX 9
74%
66%
Middle of the Market Last five years

Sidebar
line up
Text
line up
Content
guides
Logo
zone
The Boeing
Gap ----------------------------------------- ---------- ---------- ----------
? A330-300/900
A320/A320neo
787-9
737-800/MAX 8
A330-200/800
A321/A321neo
787-9
Middle of the Market

End April 2016
1,634 Orders
1,276 Deliveries
358 Backlog
An A330 takes off or lands every 20 seconds

A330neo
Aerodynamic improvements
• New A330 sharklets
• Increased span
• Aero improvement
Cabin developments
• Up to 10 more seats
• Airspace
Commonality
• 95% spares commonality with A330
• Same type rating as A330ceo
• Common type rating as A350 XWB
New Generation Engine
• Increased fan size (from 97.5 to 112in)
• 11% Lower fuel burn at Powerplant level
• Latest engine performance improvements

Sidebar
line up
Text
line up
Content
guides
Logo
zone
New sharklets
& aero
optimisation ----------------------------------------- ---------- ---------- ----------
More seats
Superior comfort
Longer range
Better economics
3-class configurations
Optimised upper belly fairing
Optimised Slat1 Optimised wing twist
Composite Sharklet extension
Increased wing span to 64m
(+3.7m)
Stays within Code E category

Sidebar
line up
Text
line up
Content
guides
Logo
zone
A330neo ---------------------------------------- ---------- ---------- ----------
14% fuel efficiency
improvement per
seat
Full commonality
with A330
Same Type Rating
as A350 XWB
186 orders from
10 customers
End April 2016

Airspace
by Airbus ----------------------------------------- ---------- ---------- ----------
Creating attractive
space through
COMFORT
AMBIENCE
SERVICES
DESIGN

Sidebar
line up
Text
line up
Content
guides
Logo
zone
A330-800 787-8
242t MTOW
Seats (3-class) 257 244
Range (nm) 7,480 7,380
Fuel/seat datum +2.5%
COC/seat datum +2.5%
A330-800 ----------------------------------------- ---------- ---------- ----------
More seats
Superior comfort
Longer range
Better economics
3-class configurations

Sidebar
line up
Text
line up
Content
guides
Logo
zone
A330-900 787-9
242t MTOW
Seats (3-class) 287 283
Range (nm) 6,550 7,830
Fuel/seat datum +2%
COC/seat datum +2%
A330-900 ----------------------------------------- ---------- ---------- ----------
More seats
Superior comfort
Better economics
3-class configurations

A350 XWB
804 Orders
24 Deliveries
780 Backlog
At May 31st 2016

Airspace
by Airbus ----------------------------------------- ---------- ---------- ----------
Creating attractive
space through
COMFORT
AMBIENCE
SERVICES
DESIGN

24 aircraft
delivered ----------------------------------------- ---------- ---------- ---------- “Our overall experiences of
the new aircraft type are
unreservedly positive. We
have seen a clear
improvement in customer
satisfaction on the routes we
have operated with the new
aircraft”
Pekka Vauramo CEO Finnair
Deliveries at May 31st 2016
4 aircraft 8 aircraft
5 aircraft
3 aircraft
3 aircraft
1 aircraft

Sidebar
line up
Text
line up
End April 2016
A350-1000
EIS in 2017 ----------------------------------------- ---------- ---------- ----------
Development
on track
181 orders from
10 customers

Sidebar
line up
Text
line up
Content
guides
Logo
zone
A350-1000 --------------------------------------- ---------- ---------- ----------
1,000 aircraft
replacement
market
Vs. 777-300ER
-40t MTOW
-23% cost/seat
+450 nm range
A350-1000 366 seats
777-300ER 371 seats (+5)
Sidebar
line up
Text
line up
Content
guides
Logo
zone
A350-1000 ----------------------------------------- ---------- ---------- ---------- An exceptional
product
vs. 777-9
-35t OWE
-7% cost/seat
+400nm range
A350-1000 366 seats
777-9 398 seats (+32)
Sidebar
line up
Text
line up
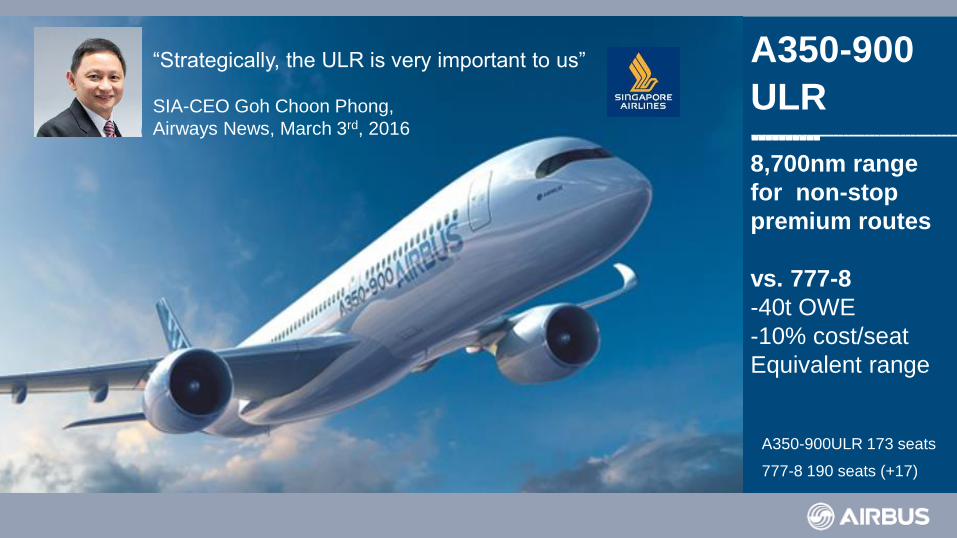
A350-900
ULR ----------------------------------------- ---------- ---------- ---------- 8,700nm range
for non-stop
premium routes
vs. 777-8
-40t OWE
-10% cost/seat
Equivalent range
A350-900ULR 173 seats
777-8 190 seats (+17)
“Strategically, the ULR is very important to us”
SIA-CEO Goh Choon Phong,
Airways News, March 3rd, 2016

Sidebar
line up
Text
line up
Content
guides
Logo
zone
*6000nm sector
** @ max pax
2020
Less fuel*: -2%
More range**: +500nm
More payload*:+5t
A350-900 Developing fast ----------------------------------------- ---------- ---------- ----------
A valuable
improvement
package
Worth
$4 million
additional
Present Value

319 Orders
187 Deliveries Backlog
132
An A380 takes off or lands every 3 minutes
End April 2016
A380 An A380 takes off or lands every 3 minutes

Sidebar
line up
Text
line up
Content
guides
Logo
zone
2024
75
Mega-Cities
>50 000 daily long-haul passengers
>20 000 daily long-haul passengers
>10 000 daily long-haul passengers
2014 Aviation Mega-Cities 2014 ----------------------------------------- ---------- ---------- ----------
47
Mega-Cities
36
served by A380
90%+ of long-haul
traffic

Sidebar
line up
Text
line up
Content
guides
Logo
zone
2024
75
Mega-Cities
>50 000 daily long-haul passengers
>20 000 daily long-haul passengers
>10 000 daily long-haul passengers
2024 Aviation Mega-Cities 2024 ----------------------------------------- ---------- ---------- ----------
75
Mega-Cities 93%+ of long-haul
traffic
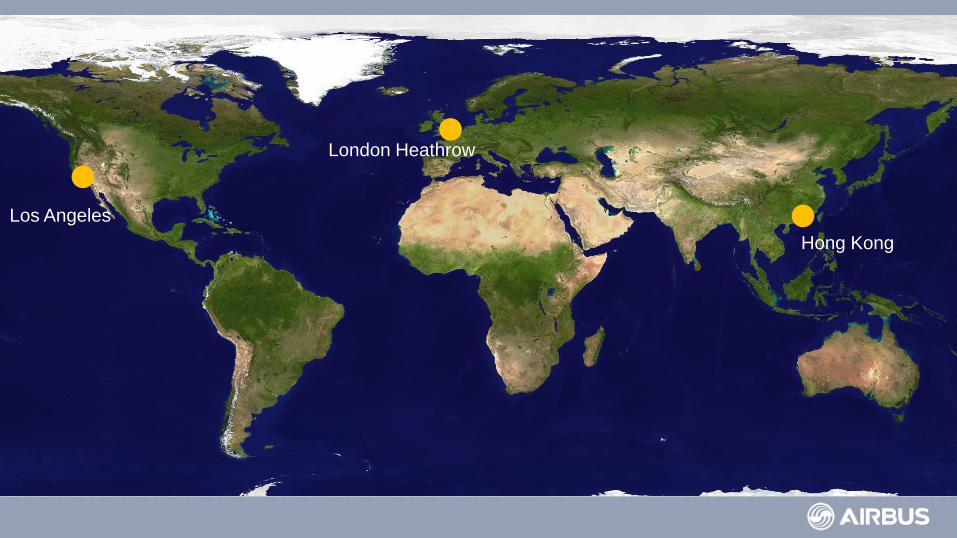
Los Angeles
London Heathrow
Hong Kong

Sidebar
line up
Text
line up
Weekly A380 departures from Hong Kong
OAG May 2016
Flights = take offs+ landings
* Seasonal route
Dubai Singapore
Bangkok
Seoul
London
Hong Kong
Paris
July 2014
July 2009 February 2011
October 2013
May 2014
October 2010*
Frankfurt November 2015
A380 at
Hong Kong ----------------------------------------- ---------- ---------- ----------
14 daily flights

Sidebar
line up
Text
line up
OAG March 2016
Flights = take offs+ landings
Daily A380 departures from Los Angeles
Los Angeles
London
Paris
Dubai
Melbourne
Sydney
Guangzhou
Tokyo
Seoul August 2014
September 2013
July 2011
October 2011
October 2012
October 2008
October 2008
May 2012
December 2013
Seoul
Frankfurt April 2015
A380 at
Los
Angeles ----------------------------------------- ---------- ---------- ----------
24 daily
flights

Sidebar
line up
Text
line up
OAG May 2016
Flights = take offs+ landings
*projected
Daily A380 departures at Heathrow
Dubai January 2013
Dubai
Singapore
Kuala Lumpur
Hong Kong
Los Angeles
Johannesburg
London
Washington
Doha December 2008 October 2014
February 2014
July 2012
October 2013
March 2008
September 2013
October 2014
October 2014 x1
December 2014
Abu Dhabi
San Francisco April 2015
Bangkok July 2015
Vancouver May 2016
Seoul March 2016
A380 at
Heathrow ----------------------------------------- ---------- ---------- ----------
50 daily flights
8% of all passengers
in 2015 flew on an
A380
Rising to 10% in
2016*


Sidebar
line up
Text
line up
Content
guides
Logo
zone
---------------------------------------- ---------- ---------- ----------
60% of passengers are
ready to make a
special effort to fly
A380
20% are willing to
pay more
Independent agency surveying over
2,000 passengers arriving on A380
flights at LHR.

Sidebar
line up
Text
line up
Content
guides
Logo
zone
A380: 1st for customer satisfaction*
6.0 6.5 7.0 7.5 8.0 8.5 9.0
First class
Business class
Premium Economy
Economy class
380
777
Average passenger recommendation, from 1 to 10
Independent agency surveying over
2,000 passengers arriving on A380
flights at LHR. (*) 95% satisfaction
A380
customer
satisfaction ----------------------------------------- ---------- ---------- ----------
A380 is preferred
by passengers in
all cabin classes


Sidebar
line up
Text
line up
Content
guides
Logo
zone
Comfort ----------------------------------------- ---------- ---------- ----------
Airbus products
offer superior
comfort
18”
Sidebar
line up
Text
line up
Content
guides
Logo
zone
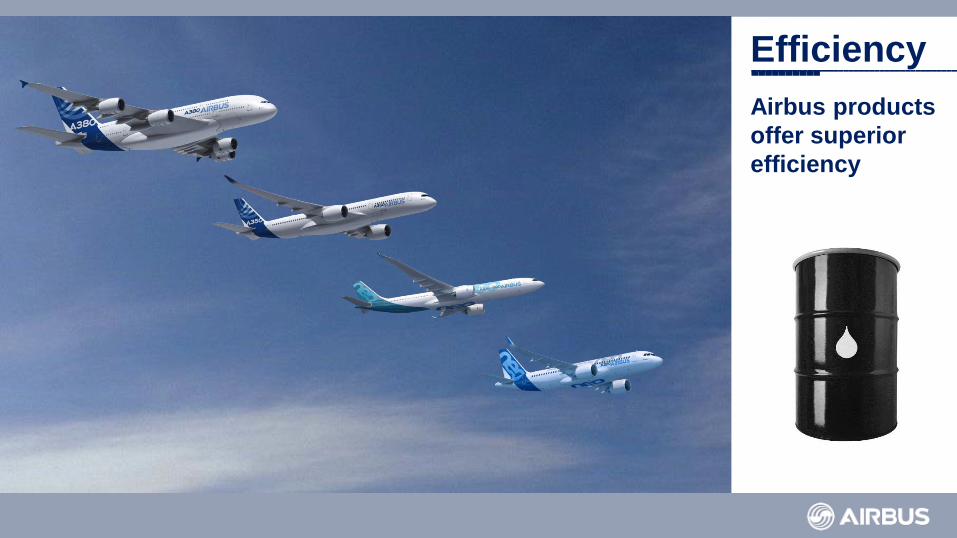
Efficiency ----------------------------------------- ---------- ---------- ----------
Airbus products
offer superior
efficiency

Sidebar
line up
Text
line up
Content
guides
Logo
zone
Profitability ----------------------------------------- ---------- ---------- ----------
Airbus products
offer superior
profitability

Sidebar
line up
Text
line up
Content
guides
Logo
zone
Comfort ----------------------------------------- ---------- ---------- ----------
Efficiency ----------------------------------------- ---------- ---------- ----------
Profitability ----------------------------------------- ---------- ---------- ----------