airborne asian dust: case study of long-range transport ... · volume 18 weather and forecasting...
TRANSCRIPT

VOLUME 18 APRIL 2003W E A T H E R A N D F O R E C A S T I N G
q 2003 American Meteorological Society 121
Airborne Asian Dust: Case Study of Long-Range Transport and Implications for theDetection of Volcanic Ash
J. J. SIMPSON
Digital Image Analysis Laboratory, Scripps Institution of Oceanography, University of California, San Diego, La Jolla, California
G. L. HUFFORD
Aviation Technology Center, University of Alaska, Anchorage, Anchorage, Alaska
R. SERVRANCKX
Canadian Meteorological Centre, Meteorological Service of Canada, Montreal, Quebec, Canada
J. BERG
Digital Image Analysis Laboratory, Scripps Institution of Oceanography, University of California, San Diego, La Jolla, California
D. PIERI
Jet Propulsion Laboratory, California Institute of Technology, Pasadena, California
(Manuscript received 24 April 2002, in final form 19 August 2002)
ABSTRACT
The transport of fine-grained Asian dust from its source (e.g., the Gobi Desert, Mongolia) to North Americais a common springtime phenomenon. Because of its chemical composition (silicon, iron, aluminum, and calcium)and its particle size distribution (mean aerodynamic diameter 2–4 mm), Asian dust produces a negative signalin the split-window T4 2 T5 algorithm, as does airborne volcanic ash. The split-window algorithm is commonlyused by operational volcanic ash advisory centers. Thus, it is important to find ways to differentiate betweenairborne Asian dust and airborne volcanic ash. Use of Total Ozone Mapping Spectrometer aerosol and sulfurdioxide indices, in conjunction with the split-window method, can mitigate the possibility of a false airbornevolcanic ash alarm. Asian dust also is important for other reasons. Thus, meteorological agencies should monitorit because 1) it can be transported thousands of kilometers from its source region and thus is of global interest(e.g., effects on radiative forcing) and 2) fine-grain particles pose a potentially serious public health hazard.
1. Introduction
Dust clouds over the world’s deserts and sand seas(e.g., Gobi, Mongolian, Sahara) form when friction fromsurface winds (.5 m s21) entrains and lifts dust particlesinto the atmosphere (Gillette 1978), especially whenagitated by sand-grain saltation within and through thelocal viscous boundary layer (Bagnold 1941). Globaltransport of desert dust from its source points 1) to theNorth Pacific Ocean atmosphere (Prospero et al. 1989;Husar et al. 2001), 2) over the Mediterranean Sea (Ches-ter et al. 1984; Dulac et al. 1992), and 3) over the trop-ical North Atlantic Ocean (Talbot et al. 1986; Ozloy et
Corresponding author address: J. J. Simpson, Digital Image Anal-ysis Laboratory, Scripps Institution of Oceanography, University ofCalifornia, San Diego, La Jolla, CA 92093-0237.E-mail: [email protected]
al. 2001) is documented well. The resultant atmosphericparticles have been studied within the contexts of ra-diative forcing and climate (e.g., Myhre and Stordal2001), carriers in the biogeochemical cycles of crustalelements (e.g., Chadwick et al. 1999), and public health(Schwartz et al. 1999).
This paper 1) reviews some satellite-based retrievalsof aerosol, 2) presents a case study of two recent Asiandust events-including detection from satellites and mod-eling of the atmospheric transport, 3) examines the po-tential effects of desert dust on the performance of theoperational split-window airborne volcanic-ash detec-tion algorithm, and 4) suggests possible ways of dif-ferentiating dust from volcanic ash using satellite data.Pressure analyses are in the original projection providedby The National Oceanic and Atmospheric Administra-tion (NOAA). Geostationary Operational Environmen-tal Satellite (GOES) data are in satellite projection,

122 VOLUME 18W E A T H E R A N D F O R E C A S T I N G
which is the projection given to most forecasters. More-over, given the size of GOES data, no single standardmap projection (e.g., polar stereographic, Mercator) isappropriate.
2. Satellite-based retrievals
a. Split-window detection of airborne volcanic ash
Because most active volcanoes are in remote and seis-mically uninstrumented sites, operational detection ofairborne volcanic ash by volcanic ash advisory centers(VAACs) has relied heavily on satellite remote sensingusing the split-window method. It evaluates the Ad-vanced Very High Resolution Radiometer or equivalent11-mm (T4) and 12-mm (T5) brightness temperature(BT) difference (DT 5 T4 2 T5). Meteorological cloudsshould have positive DT (Yamanouchi et al. 1987), andvolcanic plumes are expected to have negative DT (e.g.,Prata 1989). Class separation, however, is especially dif-ficult as DT approaches zero (Simpson et al. 2002). Infact, volcanoes with low levels of silicate in their plumes[e.g., Soufriere Hills (Montserrat), Bogoslof (Alaska),or White Island (New Zealand)] are especially difficultto differentiate from meteorological clouds (Simpson etal. 2001). Other factors [atmospheric water vapor, ice,chemical composition and particle size distribution, par-ticle shape (departure from spherical), errors in radio-metric calibration, surface emissivity, groundwater andjuvenile water in the magma, optically active coatings(e.g., sulfuric acid)] also may compromise accurate de-tection using the split-window technique (also see Simp-son et al. 2000, 2001; Pieri et al. 2002, and the refer-ences contained therein).
b. TOMS retrievals of total ozone, sulfur dioxide, andUV absorbing aerosols
The Total Ozone Mapping Spectrometer (TOMS) isan ultraviolet (UV) spectrophotometer (Heath et al.1975). Six fixed wavelength bands in the 312–380-nmspectral region are used to measure the total ozone bydifferential absorption in the near-ultraviolet Hugginsbands of ozone. Total ozone is in atmosphere-centi-meters, multiplied by 100, and is reported as Dobsonunits. The instantaneous field of view of TOMS is 383 38, which yields a 50 km 3 50 km pixel at nadir.
The spectral contrast anomaly method, generallycalled the residue method, is the basis for TOMS totalozone retrieval (McPeters et al. 1996). The retrievaldepends on a theoretical calculation [the Lambert-equiv-alent reflectivity (LER method)] of the backscatteredultraviolet (buv) radiation using the multiple-scatteringradiative transfer model of Dave and Mateer (1967).The buv technique uses a pair of wavelengths (oneozone sensitive; the other ozone insensitive) to computetotal ozone. The retrieval requires accurate separationof the spectral contrast (ratio of radiances at selected
wavelengths) caused by ozone absorption from thatcaused by all other effects (Torres et al. 1998). The LERmethod provides the required separation.
Krueger et al. (1995) developed a TOMS sulfur di-oxide (SO2) index (SOI). This retrieval provides a wayto track SO2 plumes associated with volcanic eruptions(e.g., Krueger 1983; Seftor et al. 1997) and correctsTOMS total ozone when SO2 is present (i.e., SO2 canincorrectly enhance TOMS ozone, if not corrected).Krueger et al. (1995) recognized that the residue methodcan fail because of water clouds underlying a volcanicplume. To mitigate this problem, they adopted the insitu technique of Kerr et al. (1980) to operational pro-cessing of the satellite data.
The TOMS aerosol retrieval for Nimbus-7 combinestwo independent pieces of information, the I340/I380 spec-tral contrast and the change in backscattered 380-nmradiance, to detect the presence of absorbing and non-absorbing particles embedded in the Rayleigh scatteringatmosphere (Herman et al. 1997). Here, Il is either ameasured backscattered radiance at a given wavelengthor the corresponding radiance calculated using Dave’s(1978) modified LER model. Both are used in the re-trieval. The effects of clouds on spectral contrast areremoved using the LER modified model (Herman et al.1997). These wavelengths are not sensitive to totalozone. The spectral contrast for a fixed 380-nm radianceis largest for nonabsorbing aerosols/clouds and decreas-es with increasing absorption. The UV-absorbing aero-sols (e.g., silicaceous aerosols, such as typical desertdust) produce smaller contrast than predicted by theLER technique, thereby producing positive residues.Nonabsorbing aerosols produce greater contrast andhence negative residues. Because clouds produce nearlyzero residue, subpixel clouds do not affect the TOMSretrieval of aerosols. Aerosols detected would be re-duced, however, because of obstruction of the aerosollayer by clouds [see Herman et al. (1997) and Torres etal. (1998) for details]. These residues constitute a di-mensionless aerosol index.
Earth Probe Satellite TOMS algorithms for aerosoland SO2 are based on the Nimbus-7 retrieval describedabove. However, the 360-nm wavelength is used insteadof 380 nm for reflectivity and 322- and 331-nm dataare used instead of 331- and 340-nm data for the ozoneretrieval. Details of the two computational proceduresare given in the Nimbus-7 and Earth Probe TOMS user’sguides, respectively (McPeters et al. 1996, 1998).
3. Analyses of selected Asian dust events
‘‘Yellow sand’’ meteorological conditions (e.g.,known as huangsha in China, whangsa in Korea, andkosa in Japan) occur in springtime throughout east Asia(Husar et al. 2001). The arid deserts of Mongolia andChina are the source of the dust (Zheng et al. 1998).
The Asian dust events of April 2001 and April 1998were selected for analysis because they are represen-

APRIL 2003 123S I M P S O N E T A L .
tative of similar historical events. Special emphasis isgiven to the April 2001 event because little about it hasappeared in the literature to date. Representative resultsfor the April 1998 event demonstrate that it is an analogof the April 2001 event. See the recent Journal of Geo-physical Research special issue (2001, vol. 106, No.D16) for details of the April 1998 event.
a. The April 2001 dust event
1) SATELLITE EVIDENCE AND TIME LINE
A time series of the TOMS aerosol index (Figs. 1a–h) shows the evolution and dispersion of silicate dustfrom its east Asia source, across the Pacific basin, andinto North American airspace from 7 to 14 April 2001.Aerosol index values as high as 2–3 characterize thedust cloud; these values are about 5 times as high asthe background aerosol values observed by TOMS. Se-lected TOMS SO2 retrievals (Figs. 1i,j), contempora-neous with the TOMS aerosol retrievals, show a verylow SO2 background level globally. These data are typ-ical of all TOMS SO2 observations for 7–14 April 2001.Together, the TOMS aerosol and SO2 distributions showthat the airborne dust is not volcanic. In addition, noeruption of significance was reported by the Global Vol-canism Network during this time.
After 13 April 2001, the TOMS aerosol index beginsto show smaller values. Several reasons potentially ac-count for this fact. TOMS is primarily a stratosphericinstrument and may not respond well to aerosols as theymove into the troposphere. Settling and atmospheric dis-persion over time reduce absolute concentration and,hence, the aerosol index.
A temporal composite (Fig. 2a) of the centroid(s) ofthe TOMS aerosol time series (Fig. 1) shows the spatialand temporal evolution of the main component of dustassociated with this event. Atmospheric transport of thedust carried it into many regions of active volcanism(e.g., the Kuril/Kamchatka/Aleutian volcanic chains, theIndonesian archipelago). Major commercial and civilianaviation routes occur over the same regions. The patternof dust over Africa (Fig. 2b) is associated with a separateSaharan dust event.
2) METEOROLOGICAL CONDITIONS
Asian dust is transported over the North Pacific Oceanby midlatitude westerlies and may cover the entire NorthPacific area (Merrill et al. 1989, 1997). Substantial in-terannual variability occurs in peak concentration andin the extent to which individual dust events affect spe-cific areas, that is, the Kuril/Kamchatka/Aleutian region(Prospero et al. 1989).
Large-scale patterns in sea level pressure during theApril 2001 dust event [0000 UTC National Centers forEnvironmental Prediction (NCEP) Pacific surface anal-ysis] show 1) the cyclonic center located along the east-
ern Asian coast, 2) the merging of the east and westPacific anticyclonic centers into one strong high pres-sure center (.1035 hPa) in the central North Pacific,and 3) a deep low pressure center located along thePacific Northwest coast (Figs. 3 and 4). These pressurefields produced a strong cyclonic flow of continental airfrom China that split into two distinct paths. One pathwas northeastward and across the Kamchatka Peninsula,along the Aleutians, and then southeastward into thePacific Northwest. The other path was eastward acrossthe Pacific and over the west and southwest coast of theUnited States. Aloft, the large-scale patterns at the 500-hPa level during the April 2001 dust event (0000 UTCNCEP Northern Hemisphere analysis) show 1) a large-scale north–south-oriented cold trough along the easternAsian coast on 6 April 2001 that slowly drifts eastwardinto the Gulf of Alaska by 14 April 2001 (Fig. 5) and2) a deep low located along the Pacific Northwest coastthat began development on 12 April 2001.
The circulation associated with the cold trough re-sulted in strong anticlockwise flow aloft of continentalair from China, which then flowed eastward across thePacific into the Pacific Northwest. A secondary pathinvolved the entrainment of some of the eastward flowinto the eastern side of the trough moving northeastwardinto Kamchatka, the Aleutians, and mainland Alaska.This split flow is similar to the surface circulation de-scribed above (Figs. 3 and 4). The cold-core surfacehighs were shallow features in which the clockwise cir-culation weakened with altitude and in some areas re-versed with the presence of the trough. This split trans-port system (Figs. 3 and 4) is consistent with the aerosolcentroid movement observed in the TOMS data (Figure2a). Sea-Viewing Wide Field-of-View Sensor (Sea-WiFS) data (Figure 6) show the dust moving east andsoutheast behind a cold front consistent with the flowinto the Pacific Northwest.
The cyclonic system over China for the April 2001event was very deep (center pressure of ;980 hPa) withstrong winds (see Fig. 3e). The dynamic vertical forcingassociated with this storm must have been very strong,lifting the dust well into the atmosphere (.5 km). Tem-peratures in March/April were too cold over China andthe Asian coast for convection to play any significantrole in vertical transport. For the dust to remain in theatmosphere and to be transported across the Pacific, itmust travel in precipitation-free air. Wet depositionwould otherwise remove most of it near its source regionor before it reached North America. Thus, the dust musthave reached nearly maximum height in the early stagesof the storm over the desert. Moreover, the Gobi andMongolian Deserts, source regions of the dust, are about3 km above sea level (Rand McNally 1974). This ele-vation contributes to the ultimate atmospheric heightreached by the dust (Fig. 5). The same conditions oc-curred during the 1998 event (e.g., Husar et al. 2001and other references in the same volume).
An offshore low developed off of the Pacific North-

124 VOLUME 18W E A T H E R A N D F O R E C A S T I N G
FIG. 1. (a)–(h) Sequence of TOMS aerosol index. (i), (j) Representative TOMS SO2 data, which show little atmospheric SO2.Data show the aerosol is nonvolcanic.

APRIL 2003 125S I M P S O N E T A L .
FIG. 2. Composite of TOMS aerosol data (Fig. 1) showing the dispersion of the aerosol centroid from its east Asian source, across thePacific basin, and over North America.
west, starting around 14 April 2001. The resulting cy-clonic offshore flow essentially shut off the northerntransport route of dust into the Pacific Northwest for theApril 2001 event but enhanced the southern path overthe West Coast.
3) NUMERICAL SIMULATIONS
The Canadian Emergency Response Model (CA-NERM) was used in real time to model the long-rangetransport of Asian dust to North America. It is a three-dimensional Eulerian model (Pudykiewicz 1988; CMC2002a) for medium- to long-range atmospheric transportof pollutants (e.g., volcanic ash). It is used when thespace–time structure of the wind is complex or whenthe release of the pollutant occurs over time. The sourceof emission is modeled as a virtual source (Pudykiewicz1989). It accounts for subgrid-scale effects near thepoint of release and is implemented as a 3D Gaussianfunction. Simulations compare well to data from fieldexperiments (D’Amours 1998). The operational versionused at the Canadian Meteorological Centre (CMC) has25 vertical levels and a horizontal grid spacing of 5–150 km.
Meteorological data used by CANERM are providedby the CMC global data assimilation and forecasts sys-tems (CMC 2002b). As is often the case, little quanti-tative data on the dust cloud were available in real timefor the initialization of CANERM. The exact maximumaltitude reached by the dust is unknown. There are in-dications that the dust was present, at least in smallamounts, in the high troposphere and that it may evenhave reached the lower stratosphere (M. Fromm, NavalResearch Laboratory, 2002, personal communication).The bulk of the dust, however, remained in the lowertroposphere. Simulations of the April 2001 Asian dustevent were produced using the following best-guess ini-tial conditions: 1) the location of the northernmost cen-troid at 1200 UTC 8 April 2001 is 458N, 1378E basedon TOMS aerosol data (Fig. 1), 2) the horizontal gridis 150 km, 3) the horizontal distribution at the sourceis Gaussian with a standard deviation of one grid point,4) the vertical distribution at the source is constant fromthe surface to 5 km, 5) the total mass of dust is 1011
kg, and 6) the event duration is 1 h. These simulationparameters define the quasi-instantaneous position anddistribution of the dust cloud at 1200 UTC 8 April 2001.
Trajectories depicting the ‘‘visual aerosol dust cloud’’

126 VOLUME 18W E A T H E R A N D F O R E C A S T I N G
FIG. 3. NCEP North Pacific surface analyses fordates and time indicated.
were computed with CANERM for three flight-levelranges: surface–FL200 (;6.1 km), FL200–FL350(;10.7 km), and FL350–FL600 (;18.2 km). This ap-proach is analogous to what is done for the ‘‘visualvolcanic ash cloud’’ as defined in ICAO (1998). Notethat there is no internationally accepted definition ofvisual aerosol dust cloud. A single value for all situa-tions does not exist. In a specific situation, the value is
likely to change in time and space. This situation isespecially true for a long-lived event in which the at-mospheric transport would disperse the aerosols over alarge domain. The problem is compounded by the un-certainty in the source term. For CANERM, a thresholdvalue defining this quantity (100 mg m23 average layeraerosol dust density) was used based on modeling stud-ies of the visual volcanic ash cloud for the 1992 eruption

APRIL 2003 127S I M P S O N E T A L .
FIG. 4. Continuation of the sequence (Fig. 3) showing the blocking low.
of Mount Spurr in Alaska (USGS 1995). Little aerosoldust cloud appeared above FL350 in the simulations;these results are not shown.
Time series of the CANERM forecast of the aerosoldust cloud for the April 2001 event for surface–FL200and for FL200–FL350 from 8 to 16 April 2001 (Figs.7a,b) show that the areas of highest concentration agreereasonably well with the centroids of the TOMS aerosoldata (Fig. 2a). Both sets of data indicate two paths ofdust transport: one north over the Kuril/Kamchatka/Aleu-tian region into Alaska and then southward over NorthAmerica and the eastern Pacific, and the other over thesouth-central Pacific basin toward North America. TheCANERM results also suggest that the eastward transportof dust over Canada from the more northern stream wasslowed considerably by a large blocking high centerednear 668N, 1188W. Dust, however, quickly continued to-ward North America from the more southerly route. In-dependent evidence (from lidar, satellite, and human ob-servations) indicates that the dust traveled over the uppercontinental United States and lower parts of Canada,eventually reaching the east coast of North America andthe western Atlantic Ocean. [At the time of writing, Asian
dust imagery was available online at http://visibleearth.nasa.gov/Atmosphere/Aerosols/DustpAsh.html and http://toms.gsfc.nasa.gov/aerosols/aerosols.html (TOMS aero-sol search engine for dust events)]. Data from NOAA’spolar-orbiting satellites at 1230 UTC 14 April 2001 showthat the Asian dust was transported around the blockinghigh in western Canada and that it reached the westernshore of Hudson Bay as well as the northern portions ofManitoba and Saskatchewan. The path and location aresuggested by CANERM (Fig. 7). The transport of dustpredicted by CANERM also is consistent with the large-scale pressure system (Figs. 3, 4, and 5).
A second CANERM run used the same initial con-ditions described above but with a constant vertical dis-tribution between the surface and 10 km. The resultsfor FL200–FL350, not shown here, do not match theTOMS data as well as do those of the first model run.Although considerable uncertainty remains, this resultsupports the hypothesis that most of the dust was foundin the lower troposphere. The high desert surface sourceof the dust and the strong dynamical vertical forcingassociated with the very deep low over China duringthe April 2001 event accounted for the initial lifting of

128 VOLUME 18W E A T H E R A N D F O R E C A S T I N G
FIG. 5. Analogous to Fig. 4 but at the 500-hPa level.

APRIL 2003 129S I M P S O N E T A L .
FIG. 6. SeaWiFS image of Asian dust off of the Pacific Northwest coast behind a cold front.
the dust into the atmosphere. However, trajectories (notshown here) indicate that beyond the first 24–36 h, thedust moved away from the influence of the low. Fromthat point in time, the dynamical vertical forcing pro-
duced quasi-horizontal and even, later, subsiding flow.This is consistent with the CANERM simulations thatshow that the majority of the dust remained at relativelow levels (surface–FL200).

130 VOLUME 18W E A T H E R A N D F O R E C A S T I N G
FIG. 7. Sequence of CANERM visual aerosol dust cloud layers from (a) the surface to FL200 and from (b) FL200 to FL350. Dates andtimes indicate time step of simulation.

APRIL 2003 131S I M P S O N E T A L .
FIG. 7. (Continued )

132 VOLUME 18W E A T H E R A N D F O R E C A S T I N G
FIG. 8. Temporal composite of GOES-10 T4 2 T5 signatures showing dust movement; negative values imply dust or volcanic ash. Thewhite box indicates region shown in Fig. 9.
In some instances, the CANERM model densities donot drop off as rapidly as in the TOMS data (Fig. 1).Several factors may contribute to this discrepancy: 1)inadequacies in the dry (and wet) deposition model for-mulation in CANERM, which is a fairly common prob-lem in models; 2) the fact that TOMS is designed tomeasure stratospheric ozone and aerosols, and so TOMSmay not respond as well to aerosols as they move lowerinto the troposphere with time; and 3) a combination ofthe first two factors and other possible factors. The mod-el results are not meant to reproduce features in theaerosol dust cloud quantatively. Uncertainties in thesource term alone preclude this possibility. Rather, weshow that the model provides an operationally usefulqualitative assessment of the motion of the aerosol dustcloud.
4) THE T4 2 T5 SIGNAL
A temporal composite of GOES-10 T4 2 T5 scenesfor the period 8–15 April 2001 (Fig. 8) shows the trans-port of Asian dust in two distinct trajectories. One tra-jectory follows a northeastern path over Kamchatka to-ward the Aleutian Islands and then into Alaska. Theother follows a more southeastern route across the Pa-cific toward the west coast of Canada and the continentalUnited States. The numbers correspond to the date ofa given GOES image used to make the composite. Thewhite box delineates a region examined in detail (Fig.9).
The 11-mm BT for 12 April 2001 (Fig. 9a) was takenat 1200 UTC. This image occurs about midway in thetemporal composite (Fig. 8). Considerable cloud coveroccurs in this scene. Clouds (water or ice) produce pos-itive T4 2 T5 values, whereas both Asian dust and vol-canic ash produce negative values. The numbered whiteregions are reference markers for the remaining panelsof data. The corresponding T4 2 T5 difference image
(Fig. 9b) shows a strong negative signature as wouldairborne volcanic ash over the Aleutian Islands (also seethe appendix). TOMS aerosol index (Fig. 9c) and SOI(Figure 9d) data correspond to the GOES-10 T4 2 T5
data, but at a different time. Correlations between theT4 2 T5 data and the TOMS aerosol and SO2 distri-butions are 0.61 and 0.19, respectively. The value of0.19 for the T4 2 T5–TOMS SO2 is about that for Gauss-ian noise. Sample standard deviations of the observeddifferences between T4 2 T5 values and predicted values(based on linear regression of models of T4 2 T5–TOMSaerosols and T4 2 T5–TOMS SO2) are about 0.4 and0.7, respectively. These analyses support the conclusionthat the T4 2 T5 signal in the GOES-10 data is associatedwith the silicate aerosols of nonvolcanic origin.
The high aerosol values (Fig. 9) are from the Asiandust. The relatively low values of SO2 (Fig. 9) corre-spond to the typical featureless SO2 patterns in TOMSdata for this period (Figs. 1i,j). Low SO2 is inconsistentwith volcanic ash in the stratosphere, especially earlyafter an explosive magmatic eruption, but the spatialseparation of SO2 and airborne volcanic ash plumesfrom the same eruption has occurred [e.g., the El Chi-chon 1982 eruption in Mexico; see Schneider et al.(1999)]. The large-scale low-level patterns in the SOI,however, most likely imply no volcanic activity becausevolcanic ash ejection into the atmosphere can be con-sidered as a point source, at least in the early stages ofan eruption. Moreover, no volcanic alerts were issuedfor the region during this time.
Several issues can affect the correlations between theTOMS aerosol index, the TOMS SOI, and GOES T4 2T5 values. TOMS aerosol retrieval corrects for meteo-rological clouds using the modified LER model. Cloud(water or ice) can interfere with detecting either Asiandust or volcanic ash in GOES data. Clouds produce apositive T4 2 T5 and several of the numbered regions

APRIL 2003 133S I M P S O N E T A L .
FIG. 9. GOES-10 (a) 11-mm image of the Aleutians and (b) corresponding T4 2 T5 signature; TOMS (c) aerosol and (d) SO2. Highaerosol/low SO2 imply a nonvolcanic origin. Boolean comparison between T4 2 T5 and TOMS (e) aerosol and (f ) SO2.
in Fig. 9a are cloud contaminated. GOES data (Fig. 9a)are an ‘‘instantaneous’’ snapshot (here night), whereasthe TOMS data have an equator crossing time of 2010UTC. Thus, there often is a significant time differencebetween the two. This, coupled with rapidly varyingcloud cover, can exacerbate a comparison of the twotypes of data. The TOMS pixel is larger than the GOESpixel. GOES data, corresponding to a given TOMS pix-el, were averaged. The mean T4 2 T5 estimate is com-pared with the single TOMS pixel value.
Histograms of the TOMS global aerosol and SO2 dis-tributions for 12 April 2001 are shown in Figs. 10a and10b, respectively. The inserts are histograms of theTOMS aerosol and SO2 distributions for the region overthe Aleutian Islands (Figs. 9c,d). The high-end tail val-ues in the aerosol distribution indicate very high con-centrations of absorbing silicate aerosol. These valuesare different from the corresponding global distribution.They represent the Asian dust reaching Alaska. TheAlaskan TOMS SO2 data, however, are very consistentwith the global low SO2 values. Again, a nonvolcanicorigin of the silicate aerosol is supported.
b. The April 1998 dust event
1) SATELLITE DATA
Composite TOMS aerosol data (Fig. 11a) for the 16–26 April 1998 Asian dust event, analogous to the April
2001 event (Fig. 2a), show the transport of Asian dustacross the Pacific. As with the April 2001 event, partof the dust moves northeast toward the Aleutian Islandsand Alaska. A separate component of the dust movessoutheast toward the continental United States and Can-ada. The corresponding GOES T4 2 T5 temporal com-posite (Fig. 11b), analogous to that of the April 2001event (Fig. 8), implies the transport of dust toward boththe Aleutians/Alaska and the west coast of the UnitedStates and Canada. Values (central Pacific) are relativelylow because of settling and dispersion processes whilein transit. In situ data, however, confirm the arrival ofdust off of southern California (e.g., Tratt et al. 2001).A separate outbreak of African dust from its Saharansource westward over the Atlantic is also shown.
The area of high aerosol index over the Gulf of Mex-ico (Fig. 11a) is not Asian or Saharan dust. In late Marchand early April of 1998, large fires developed in Mexicoand Guatemala. TOMS also responds to carbonaceousaerosols (Torres et al. 1998).
2) METEOROLOGICAL CONDITIONS
Evolution of the 19–26 April 1998 Asian dust cloudover the Pacific Ocean was derived from a combinationof SeaWiFS, GOES-9 and -10 images, and TOMS aero-sol index data by Husar et al. (2001, their Fig. 3). Themeteorological setting for this event had some similar

134 VOLUME 18W E A T H E R A N D F O R E C A S T I N G
FIG. 10. Histograms of the global distribution of TOMS (a) aerosol and (b) SO2 for 12 Apr2001. Insets are for TOMS data over the Aleutian Islands (Figs. 9c,d).
APRIL 2003 135S I M P S O N E T A L .
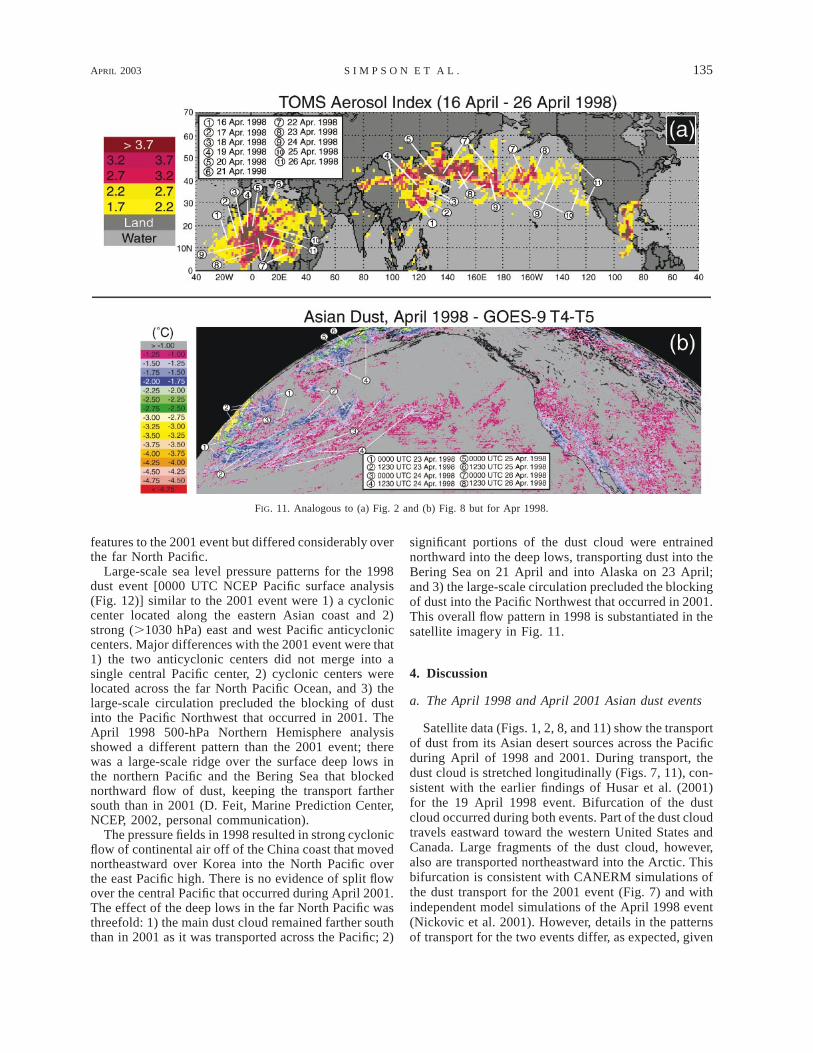
FIG. 11. Analogous to (a) Fig. 2 and (b) Fig. 8 but for Apr 1998.
features to the 2001 event but differed considerably overthe far North Pacific.
Large-scale sea level pressure patterns for the 1998dust event [0000 UTC NCEP Pacific surface analysis(Fig. 12)] similar to the 2001 event were 1) a cycloniccenter located along the eastern Asian coast and 2)strong (.1030 hPa) east and west Pacific anticycloniccenters. Major differences with the 2001 event were that1) the two anticyclonic centers did not merge into asingle central Pacific center, 2) cyclonic centers werelocated across the far North Pacific Ocean, and 3) thelarge-scale circulation precluded the blocking of dustinto the Pacific Northwest that occurred in 2001. TheApril 1998 500-hPa Northern Hemisphere analysisshowed a different pattern than the 2001 event; therewas a large-scale ridge over the surface deep lows inthe northern Pacific and the Bering Sea that blockednorthward flow of dust, keeping the transport farthersouth than in 2001 (D. Feit, Marine Prediction Center,NCEP, 2002, personal communication).
The pressure fields in 1998 resulted in strong cyclonicflow of continental air off of the China coast that movednortheastward over Korea into the North Pacific overthe east Pacific high. There is no evidence of split flowover the central Pacific that occurred during April 2001.The effect of the deep lows in the far North Pacific wasthreefold: 1) the main dust cloud remained farther souththan in 2001 as it was transported across the Pacific; 2)
significant portions of the dust cloud were entrainednorthward into the deep lows, transporting dust into theBering Sea on 21 April and into Alaska on 23 April;and 3) the large-scale circulation precluded the blockingof dust into the Pacific Northwest that occurred in 2001.This overall flow pattern in 1998 is substantiated in thesatellite imagery in Fig. 11.
4. Discussion
a. The April 1998 and April 2001 Asian dust events
Satellite data (Figs. 1, 2, 8, and 11) show the transportof dust from its Asian desert sources across the Pacificduring April of 1998 and 2001. During transport, thedust cloud is stretched longitudinally (Figs. 7, 11), con-sistent with the earlier findings of Husar et al. (2001)for the 19 April 1998 event. Bifurcation of the dustcloud occurred during both events. Part of the dust cloudtravels eastward toward the western United States andCanada. Large fragments of the dust cloud, however,also are transported northeastward into the Arctic. Thisbifurcation is consistent with CANERM simulations ofthe dust transport for the 2001 event (Fig. 7) and withindependent model simulations of the April 1998 event(Nickovic et al. 2001). However, details in the patternsof transport for the two events differ, as expected, given

136 VOLUME 18W E A T H E R A N D F O R E C A S T I N G
FIG. 12. Analogous to Figs. 3 and 4 but for Apr 1998.

APRIL 2003 137S I M P S O N E T A L .
the differences between the large-scale atmospheric cir-culations for the two events (Figs. 3, 4, and 12).
Dust from both events arrived over North Americaquickly. SeaWiFS data (Fig. 6) show dust from the 8April 2001 event off of the west coast of Canada andthe continental United States on 11 April 2001. Dustfrom the 19 April 1998 event was first observed at SaltLake City, Utah, on 24 April 1998 using lidar, and themain dust cloud arrived on 25 April 1998 (Husar et al.2001). The TOMS aerosol data for April 2001 (Fig. 1),the composite GOES T4 2 T5 data (Fig. 8), and theCANERM simulations (Fig. 7) show that the dust cloudpenetrated deep into North American airspace. Addi-tional TOMS and CANERM data (not shown here) in-dicate that the dust eventually reached the east coast ofNorth America and the western Atlantic Ocean. GOESdata (Fig. 11b) support a similar conclusion for the 19April 1998 event.
Gravitational Stokes settling (a dry removal process)usually occurs near the source within the first day oftransport; it is effective at removing large-size (.10mm) particles (Husar et al. 2001). Precipitation (a wetremoval process) occurs sporadically throughout the 5–10-day lifetime of the remaining smaller-size particles.For dust to reach North America, little precipitationmust occur while the dust crosses the Pacific. Data arenot available from either event to establish preciselywhen the atmosphere was cleansed of the dust.
b. Particle size distribution and chemical composition
In situ data for the April 2001 event have not yetappeared in the literature. Therefore, we infer physicalcharacteristics of Asian dust for this event using re-ported in situ observations for the April 1998 event.This method is justified given that the same source con-ditions and similar transport mechanisms/times occurredfor both events.
Tratt et al. (2001) report a coarse-mode diameterrange of 2–4 mm for dust from the 19 April 1998 eventbased on the inversion of sun and sky radiance mea-surements made at San Nicolas Island, California. Be-tween 30% and 50% of the dust mass for this event wasbelow 2.5 mm based on size-segregated dust samplestaken at many isolated locations over the northwesternUnited States and Canada (McKendry et al. 2001).Based on such estimates, the aged Asian dust arrivingat the North American west coast had a mass mediandiameter of 2–3 mm (Husar et al. 2001).
The 19 April 1998 event was preceded by a separate15 April 1998 event. Chun et al. (2001a) analyzed thedust size distribution for this event based on observa-tions made at Anmyon Island, Korea. It took 4 days forthe dust to reach the island. The observed size distri-bution function has a sharp peak between 1 and 5 mm.with a volume-mean diameter of 2 mm and a logarithmicstandard deviation of 1.6 mm. Moreover, there was astrong correlation between particles in the dust peak size
range (2–3 mm), and there was almost no correlationwith particles of less than 0.8 or of greater than 10 mm.The absence of large particles of greater than 10 mm isconsistent with gravitational settling during its transitfrom the Gobi Desert to Anmyon Island.
Chun et al. (2001b) also compared aerosol concen-tration at Anmyon with those observed at Seoul, Korea.For the heavy dust period, the number size distributionsof aerosols observed at both locations were character-ized by decreases in small-size particles (,0.5 mm) andincreases in large-size particles between 1.35 and 10mm. The coarse particles were more affected by localsources.
Analyzed filter samples from the 19 April 1998 eventthat reached western Canada show the elemental sig-natures (silicon, iron, aluminum, and calcium) of a mas-sive injection of lithic aerosols, with abundances of sil-icon approximately 2 times those previously recorded(McKendry et al. 2001). Ratios of these elements toiron are statistically similar to ratios observed in mineralaerosol events in Hawaii and China. Concentrations ofPM10 are expressed in the weight of particulate matter(PM), centered around 10 mm in aerodynamic diameter,found in 1 m3 of air [see Maynard and Walker (1996)for details]. In southern interior British Columbia, thePM10 levels increase dramatically to about 100 mg m23
on 28 April 1998 (Husar et al. 2001). The increasedPM10 levels are consistent with mesoscale modeling ofthe 19 April 1998 Asian dust (McKendry et al. 2001):in fact, they conclude that it accounted for 40%–50%of the peak PM10 levels observed near Vancouver, Brit-ish Columbia, Canada.
Tratt et al. (2001) tracked the three-dimensional struc-ture of the Asian dust off of southern California usingconcurrent lidar data. The dust cloud was a well-de-veloped multilayer structure (up to three layers) dis-tributed throughout the free troposphere. The tropopausetypically was at 10–11 km above mean sea level duringthese observations (see their Fig. 2). On 27 April 1998,for example, the dust layer was observed between 6-and 10-km height using lidar, with the backscatteringmore than 100 times the prevailing background levels.
c. Implications with respect to the detection ofairborne volcanic ash
Asian dust, essentially a nonmafic aerosol of sedi-mentary origin transported by eolian processes, pro-duces a split-window T4 2 T5 signal similar to that ofairborne volcanic ash detected by the algorithm of Prata(1989) and Rose et al. (1995). Moreover, the dust hasthe strong inverted arch- or U-shaped characteristiccurve expected of volcanic ash (see the appendix). Grav-itational settling quickly (;1 day) removes large dustparticles (.10 mm) from the atmosphere. The residualpeak particle size concentration (2–3 mm), combinedwith its high silica content, is the optimal condition forproducing both of these volcanic-ash-like signatures.

138 VOLUME 18W E A T H E R A N D F O R E C A S T I N G
Meteorologists need to recognize that Asian dust aero-sols can also produce large negative T4 2 T5 signals in11- and 12-mm BT data (Figs. 8, 11b) and invertedarches (see the appendix and Fig. A1). Otherwise, dustcould be misinterpreted as ‘‘airborne volcanic ash’’ bya VAAC and could potentially cause the incorrect is-suing of a volcanic ash advisory statement (VAAS) tothe community. Aviation warnings for dust storms orsandstorms are covered by significant meteorologicalinformation (SIGMET) reports issued by meteorologicalwatch offices. There is currently no requirement for theVAACs to issue such advisories. Other factors (e.g.,total precipitable water vapor or ice coating of the par-ticles) may further complicate interpretation of the T4
2 T5 signal (Simpson et al. 2000). Therefore, careshould be exercised by VAACs to consider these prob-lems.
Distinguishing between dust and volcanic ash can behelped by considering the typical area covered by thenegative T4 2 T5 signals, especially near its source re-gion. Dust is lifted into the atmosphere by large-scalestorms (area source); a volcanic ash cloud originates fromwhat is essentially a point source, at least early on. Thus,an Asian dust cloud is likely to cover an area many ordersof magnitude larger that a typical volcanic ash cloud.This criterion is qualitative but it may provide some helpwhen trying to identify what is producing negative sig-nals. Simultaneous use of TOMS aerosol and SO2 indexescould help to mitigate this possibility. Large negative T4
2 T5 values, a large positive TOMS aerosol index (.2),and a relatively low background TOMS SOI would sug-gest a nonvolcanic origin for the negative T4 2 T5 signal.Lack of reported volcanic activity may also help to dis-tinguish between dust and ash.
d. Potential effects on aviation
When turbine-engine aircraft encounter a cloud of solidaerosols, such as volcanic ash or airborne dust, ingestionof such particulates can cause various kinds of damageranging from the scouring of forward-facing flight sur-faces to the abrasion of internal engine parts to the clog-ging of critical cooling air passages deep within the en-gine (Casadevall 1992). The latter is particularly trou-blesome because it can cause surging, compressor-stallfailure, and flameout with complete loss of thrust. Forvolcanic plumes, much of the ingested aerosol materialis mafic volcanic glass. This material typically exhibitsextrusion temperatures of 9008–11008C (Williams andMcBirney 1979), well within the range of turbofan ‘‘tur-bine inlet temperatures,’’ and thus readily melts, pro-ducing the observed clogging. In addition, more refrac-tory mafic crystals are often found embedded within theglass (Predzepelski and Casadevall 1994).
A potentially similar hazard is posed by ingestion ofairborne Asian dust. The provenance of material loftedfrom the Gobi and other Asian deserts represents a widevariety of lithologic environments from predominately
sedimentary to igneous, including granitic and more maf-ic volcanics. Such material consists of polyphase partic-ulates that range from individual refractory crystals (e.g.,quartz and feldspars), which may have solidi well above10008C, as well as mineral and rock assemblages (e.g.,granites and rhyolites) with solidi of less than 10008C(Barker 1983). The glass transformation temperature(above which significant plastic translational mobility oc-curs in crystalline species) also is in the range of 7008–9008C for sodium, potassium, and calcium feldspars (Car-michael et al. 1974). Thus, for the Asian dust case, thefull range of aircraft engine and hull abrasion and meltingdamage experienced in the purely volcanic case cannotbe ruled out and, indeed, should be anticipated. In thefuture, highly efficient engines with exhaust inlet tem-peratures as high as 15008–20008C will increase the prob-ability of grain melting, even for the most refractorycrystalline aerosol components (Silski 2000).
Dust seepage into electronic bays could also have avariety of adverse effects, including increased operatingtemperatures. At the minimum, the dust may representan additional maintenance cost. Moreover, pilots whoencounter the dust at altitude may have difficulty dis-tinguishing it from small-grained airborne volcanic ash.Hence, avoidance of the dust may be beneficial. Dustcan also affect the operation of airports, especially inAsia. Early detection of advancing dust clouds wouldprovide the lead time to develop operational alternativesshould airport shutdowns be deemed necessary. Becausethe intermediate and long-term effects of Asian dust onaviation are largely unknown, additional studies areneeded to clarify these issues.
e. Public health issues
Fine-particle concentrations (i.e., ,2.5 mm in aero-dynamic diameter: PM2.5), unlike coarse particles, havebeen associated with increased mortality in several U.S.cities (Schwartz 1999). The toxicity of fine particles hasbeen associated with their tendency to deposit in thealveolar region of the lung (U.S. Environmental Pro-tection Agency 1995). By the time it reaches the westcoast of North America, about 30%–50% of the dustmass has a diameter of 2.5 mm (McKendry et al. 2001).Thus, aged Asian dust represents a potential publichealth hazard, especially to people with chronic respi-ratory problems. Fine-grained volcanic ash poses sim-ilar risks. Dust can reach North America, however, onlyif little or no precipitation occurs while in transit overthe Pacific.
Many meteorological and environmental agenciesthat operate VAACs also are mandated to provide in-formation related to the issuance of ‘‘air quality alerts.’’Both fine-grained Asian dust and airborne volcanic ashare potential public health hazards. The natures of theirtoxicities, however, are somewhat different, which isanother compelling reason to distinguish nonvolcanicAsian dust from airborne volcanic ash properly.

APRIL 2003 139S I M P S O N E T A L .
5. Conclusions
The following conclusions are proposed.
1) Asian dust events, especially in springtime, occurfrequently. Chinese National Academy recordsshow that during the seventeenth century there were0.3–1.0 sandstorms in Inner Mongolia per year, butby 1990 the annual rate had increased to 3.0–5.0per year (information was found online at http://www.lakepowell.net/asiandust.htm). Multiple dustevents occurred in January–May during 1997–2002(information was found online at http://info.nies.go.jp:8094/kosapub).
2) Satellite and lidar observations clearly show trans-port of dust to the North Pacific atmosphere andover North America. Model results corroborate thisresult.
3) Large particles of dust do not reach North Americabecause of gravitational settling.
4) Asian dust that reaches North America, with typicalaerodynamic diameters of 2–3 mm, is derived large-ly from crustal rocks and minerals dominated bythe elements silicon, iron, aluminum, and calcium.
5) The particle size distribution and chemical com-position of the Asian dust are near optimal for pro-ducing a strong negative signal in the split-windowT4 2 T5 airborne volcanic ash detection algorithmused by most operational VAACs. An inverted archcharacteristic of volcanic ash is also produced (seethe appendix). Unless the VAAC meteorologists aretrained to recognize and to interpret correctly thesecharacteristics of Asian dust, a false VAAS couldbe issued. The misidentification of lofted dust ver-sus volcanic ash has important operational impacts(potential false volcanic ash alert). Moreover, ac-curate and rapid detection of dust may help to warnflight operations in potentially affected airportsabout possible decreased visibility, especially inChina, Korea, and Japan. It also has air safety (po-tential health) implications should dust get into thecabin.
6) Simultaneous use of TOMS aerosol and sulfur di-oxide indexes with the T4 2 T5 split-window re-trieval can help to distinguish Asian dust from vol-canic ash. TOMS data are unfortunately only avail-able during daylight hours and may not be receivedin ‘‘real time’’ by some VAACs. The area coveredby the negative T4 2 T5 signals may also help todistinguish Asian dust from volcanic ash (the areais very large relative to that of a newly eruptedvolcanic ash plume, at least in the early stage).
7) Meteorological and environmental agencies thatshare responsibility for air quality advisories needto monitor the distribution of Asian dust becauseof its potential public health hazard.
8) Analogous dust events occur in other hyperarid re-gions (e.g., the Sahara).
9) The possible short- and long-term impacts of desert
dust on aircraft should be examined and docu-mented. Would these be significant enough to war-rant the issuance of advisory messages by VAACsas is already the case for volcanic ash?
10) Experimental instruments [e.g., the Moderate Res-olution Imaging Spectroradiometer (MODIS)] mayprove useful, especially if TOMS data become un-available.
6. Future plans
This study was presented at the International Oper-ational Implications of Airborne Volcanic Ash: Detec-tion, Avoidance and Mitigation Workshop (Anchorage,Alaska, May of 2002). Based on the response, we planto make materials (e.g., satellite and simulation movieloops) available for incorporation into aviation trainingprograms. Additional workshops at other locations alsoare being planned. Ongoing research efforts will be in-cluded in these future workshops.
Acknowledgments. The Scripps JIMO supported thiswork. JJS was supported by the University of California,San Diego. Jean-Philippe Gauthier and Serge Trudel, ofCMC, developed the software to run, produce, and dis-play the CANERM outputs. TOMS aerosol data wereobtained from NASA (Dr. R. McPeters), sulfur dioxidedata are from NOAA (Mr. G. Stevens) and NASA (Dr.R. McPeters), GOES data were provided by NOAA/NCDC, and TOVS profiles were provided by the Uni-versity of Wisconsin. SeaWiFS data were obtained fromthe Naval Research Laboratory (Monterey, California)Web site (http://www.nrlmry.navy.mil/aerosol/Casepstudies/20010413pepac). Support was also provided bythe NASA Natural Hazards Applications Program at theJet Propulsion Laboratory of the California Institute ofTechnology. Ryan Adams typed the manuscript. Tworeviewers provided helpful comments.
APPENDIX
The Volcanic-Ash-Like Signature of AirborneAsian Dust
Asian dust produces a large negative T4 2 T5 sig-nature (Fig. A1a), and its T4 2 T5 versus T4 signatureis the well-developed inverted arch or U shape (Figs.A1b,c) expected for volcanic ash (Prata 1989). By con-trast, the T4 2 T5 versus T4 signatures of airborne vol-canic ash associated with three known volcanic erup-tions (Figs. A1d–f) are weaker or, in some cases, muchweaker than the signature of Asian dust.
Assumptions of the T4 2 T5 airborne volcanic ashdetection algorithm (Prata 1989: Rose et al. 1995) ex-plain this apparent paradox. The algorithm assumes aplane-parallel semitransparent plume layer with ho-mogeneous physical properties. During the early stagesof an eruption, these conditions generally are not sat-

140 VOLUME 18W E A T H E R A N D F O R E C A S T I N G
FIG. A1. (a) A representative GOES T4 2 T5 Asian dust analysis, (b) T4 2 T5 vs T4 for all pixels in the scene, (c) analogous to (b) butfor the area in the box, and (d)–(f ) analogous to (c) but for the volcanic events indicated.
isfied by an ash plume. Asian dust distributions, how-ever, more closely match these assumptions. The chem-ical composition of Asian dust is relatively simple andstable. By contrast, the chemical composition of a vol-canic plume is complex and time varying. Moreover,eolian processes, over time, produce dust particles thatare more spherical in shape than airborne volcanic ash(also see Pieri et al. 2002). Likewise, the particle sizedistribution of Asian dust has a sharp peak between 1and5 mm, with a volume-mean diameter of 2 mm and alogarithmic standard deviation of 1.6 mm (Chun et al.2001a). This, combined with the high silica content,produces near-optimal conditions for producing a strongnegative signature, but not one of volcanic origin. Bycontrast, the particle size distribution and silica contentof airborne volcanic ash have much more variability(they vary with eruption chemistry, etc.) The atmo-sphere also must be relatively dry for transport of Asiandust across the Pacific and over North America. At-mospheric moisture, juvenile water in magma, andgroundwater entrained in the eruption plume greatlycompromise the T4 2 T5 detection of airborne volcanicash [e.g., Fig. A1e; also see Simpson et al. (2000)].
REFERENCES
Bagnold, R. A., 1941: The Physics of Blown Sand and Desert Dunes.Methuen and Co., 265 pp.
Barker, D. S., 1983: Igneous Rocks. Prentice Hall, 416 pp.Carmichael, I. S., F. J. Turner, and J. Verhoogen, 1974: Igneous Pe-
trology. McGraw-Hill, 739 pp.Casadevall, T. J., 1992: Volcanic hazards and aviation safety—Les-
sons of the past decade. FAA Aviation Safety J., 2 (3), 9–17.Chadwick, O. A., L. A. Derry, P. M. Vitousek, B. J. Huebert, and L.
O. Hedin, 1999: Changing sources of minerals during four mil-lion years of ecosystem development. Nature, 397, 491–497.
Chester, R. E., J. Sharples, G. S. Saunders, and A. C. Saydam, 1984:Saharan dust incursion over the Tyrrhenian Sea. Atmos. Environ.,18, 929–935.
Chun, Y., K. O. Boo, J. Kim, S.-U. Park, and M. Lee, 2001a: Synopsis,transport and physical characteristics of Asian dust in Korea. J.Geophy. Res., 106, 18 461–18 470.
——, J. Kim, J. C. Choi, K. O. Boo, S. N. Oh, and M. Lee, 2001b:Characteristic number size distribution of aerosol during Asiandust episode in Korea. Atmos. Environ., 35, 2715–2721.
CMC, cited 2002a: Atmospheric transport models for environment emer-gencies. Canadian Meteorological Centre. [Available online athttp://gfx.weatheroffice.ec.gc.ca/cmcplibrary/data/PREVISIONS/ep8.pdf.]
——, cited 2002b: Global forecast system. Canadian MeteorologicalCentre. [Available online at http://www.smc-msc.ec.gc.ca/cmc/oppsystems/globalpforecastpe.html.]

APRIL 2003 141S I M P S O N E T A L .
D’Amours, R., 1998: Modeling the ETEX plumed dispersion withthe Canadian Emergency Response Model. Atmos. Environ., 32,4335–4341.
Dave, J. V., 1978: Effects of aerosols on the estimation of total ozonein an atmospheric column from the measurement of its ultravioletobservations. J. Atmos. Sci., 35, 899–911.
——, and C. L. Mateer, 1967: A preliminary study on the possibilityof estimating total atmospheric ozone from satellite measure-ments. J. Atmos. Sci., 24, 414–427.
Dulac, F., D. Tanre, G. Bergametti, P. Buat-Menard, M. Desbois, andD. Sutton, 1992: Assessment of the African airborne dust massover the western Mediterranean Sea using Meteosat data. J. Geo-phys. Res., 97, 2489–2506.
Gillette, D., 1978: A wind tunnel simulation of the erosion of soil:Effects of soil texture, sand-blasting, wind speed and soil con-solidation on the dust production. Atmos. Environ., 12, 1735–1743.
Heath, D. F., A. J. Krueger, H. A. Roeder, and B. D. Henderson, 1975:The solar backscatter ultraviolet and total ozone mapping spec-trometer (SBUV/TOMS) for Nimbus G. Opt. Eng, 14, 323–331.
Herman, J. R., P. K. Bhartia, O. Torres, C. Hsu, C. Seftor, and E.Celarier, 1997: Global distribution of UV-absorbing aerosols fromNimbus7/TOMS data. J. Geophys. Res., 102, 16 911–16 922.
Husar, R. B., and Coauthors, 2001: Asian dust events of April 1998.J. Geophys. Res., 106, 18 317–18 330.
ICAO, 1998: Annex 3 to the Convention on International Civil Avi-ation (July 1998). Meteorological Service for International AirNavigation, International Civil Aviation Organization Interna-tional Standards and Recommended Practices, ICAO, 92 pp.
Kerr, J. B., C. T. McElroy, and R. A. Olafson, 1980: Measurementsof ozone with the Brewer ozone spectrophotometer. Proc. Int.Ozone Symp., Vol. 1, Boulder, CO, NASA–NOAA–WMO, 74–79.
Krueger, A. J., 1983: Sighting of El Chichon sulphur dioxide cloudswith the Nimbus-7 total ozone mapping spectrometer. Science,220, 1377–1379.
——, L. S. Walter, P. K. Bhartia, C. C. Schnetzler, N. A. Krotkov, I.Sprod, and G. J. S. Bluth, 1995: Volcanic sulfur dioxide mea-surements from the total ozone mapping spectrometer instru-ments. J. Geophys. Res., 100, 14 057–14 076.
Maynard, R. L., and R. Walker, 1996: Suspended particulate matterand health: New light on an old problem. Thorox, 51, 1174–1176.
McKendry, I. G., J. P. Hacker, R. Stull, S. Sakiyama, D. Mignacca,and K. Reid, 2001: Long-range transport of Asian dust to theLower Fraser Valley, British Columbia, Canada. J. Geophys.Res., 106, 18 361–18 370.
McPeters, R. D., and Coauthors, 1996: Nimbus-7 Total Ozone Map-ping Spectrometer (TOMS) data products user’s guide. NASARef. Publ. 1384, 73 pp.
——, and Coauthors, 1998: Earth Probe Total Ozone Mapping Spec-trometer (TOMS) data products user’s guide. NASA Tech. Publ.1998-206895, 70 pp.
Merrill, J. T., M. Uematsu, and R. Bleck, 1989: Meteorological anal-ysis of long range transport of mineral aerosol over the NorthPacific. J. Geophys. Res., 94, 8584–8598.
——, R. E. Newell, and A. S. Bachneier, 1997: A meteorologicaloverview of the Pacific Exploratory Mission West Phase B. J.Geophys. Res., 102, 28 241–28 253.
Myhre, G., and F. Stordal, 2001: Global sensitivity experiments ofthe radiative forcing due to mineral aerosols. J. Geophys. Res.,106, 18 193–18 204.
Nickovic, S., G. Kallos, A. Papadopoulus, and O. Kakaligou, 2001:Model for prediction of desert dust cycle in the atmosphere. J.Geophy. Res., 106, 18 113–18 130.
Ozloy, E., N. Kubilay, S. Nickovoc, and C. Moulin, 2001: An at-mospheric dust storm affecting the Atlantic and Mediterraneanin April 1994: Analysis, modeling, ground-based measurementsand satellite observations. J. Geophys. Res., 106, 18 439–18 460.
Pieri, D., C. Ma, J. J. Simpson, G. Hufford, T. Grindle, and C. Grove,
2002: Analyses of in-situ airborne volcanic ash form the Feb-ruary 2000 eruption of Hekla Volcano, Iceland. Geophys. Res.Lett., 29, doi:10.1029/2001GL013688.
Prata, A. J., 1989: Infrared radiative transfer calculations for volcanicash clouds. Geophys. Res. Lett., 16, 1293–1296.
Predzepelski, Z. J., and T. J. Casadevall, 1994: Impact of volcanicash from 15 December 1989 Redoubt Volcano eruption on GECF6-80C2 turbofan engines. Volcanic Ash and Aviation Safety:Proceedings of the First International Symposium on VolcanicAsh and Aviation Safety, T. J. Casadevall, Ed., U.S. GeologicSurvey Bull. 2047, 129–135.
Prospero, J. M., M. Uematsu, and D. Savoic, 1989: Mineral aerosoltransport to the Pacific Ocean. Chemical Oceanography, J. P.Reiley and R. Chester, Eds., Vol. 10, Academic Press, 187–218.
Pudykiewicz, J., 1988: Numerical simulation of the transport of ra-dioactive cloud from the Chernobyl nuclear accident. Tellus,40B, 241–259.
——, 1989: Simulation of the Chernobyl dispersion with a 3-D hemi-spheric tracer model. Tellus, 41B, 391–412.
Rand McNally, 1974: The International Atlas. Rand McNally andCo., 222 pp.
Rose, W. I., and Coauthors, 1995: Ice in the 1994 Rabaul eruptioncloud: Implications for volcano hazard and atmospheric effects.Nature, 375, 477–479.
Schneider, D. J., W. I. Rose, L. R. Coke, G. J. S. Bluth, I. E. Sprod,and A. J. Krueger, 1999: Early evolution of a stratospheric vol-canic eruption cloud as observed with TOMS and AVHRR. J.Geophys. Res., 104, 4037–4050.
Schwartz, J., G. Norris, T. Larson, L. Sheppard, C. Claiborne, and J.Koenig, 1999: Episodes of high coarse particle concentrationsare not associated with increased morality. Environ. Health Per-spec., 107, 339–342.
Seftor, C. J., N. C. Hsu, J. R. Herman, P. K. Bhartia, O. Torres, W.I. Rose, D. J. Schneider, and N. Krotkov, 1997: Detection ofvolcanic ash clouds from Nimbus 7/total ozone mapping spec-trometer. J. Geophys. Res., 102, 16 749–16 759.
Silski, C. L., 2000: Ultra-Efficient Engine (UEE) technology programdue. Commerce Business Daily, PSA No. 2527, 1 February 2000.
Simpson, J. J., G. Hufford, D. Pieri, and J. Berg, 2000: Failures indetecting volcanic ash from a satellite-based technique. RemoteSens. Environ., 72, 191–217.
——, ——, ——, and ——, 2001: Response to ‘‘Comments on ‘Fail-ures in detecting volcanic ash from a satellite-based technique’.’’Remote Sens. Environ., 78, 347–357.
——, ——, ——, R. Servranchx, J. S. Berg, and C. Bauer, 2002:The February 2001 eruption of Mount Cleveland, Alaska: Casestudy of an aviation hazard. Wea. Forecasting, 17, 691–704.
Talbot, R. W., R. C. Harris, E. V. Browell, G. L. Gregory, D. I.Sebacher, and S. M. Beck, 1986: Distribution and geochemistryof aerosols in the tropical North Atlantic troposphere: Relation-ship to Saharan dust. J. Geophys. Res., 91, 5173–5182.
Torres, O., P. K. Bhartia, J. R. Herman, Z. Ahmad, and J. Gleason,1998: Derivation of aerosol properties from satellite measure-ments of backscattered ultraviolet radiation: Theoretical basis.J. Geophys. Res., 103, 17 099–17 110.
Tratt, D. M., R. J. Frouin, and D. L. Westphal, 2001: April 1998Asian dust event: A southern California perspective. J. Geophys.Res., 106, 18 371–18 379.
U.S. Environmental Protection Agency, 1995: On-site meteorologicalprogram guidance for regulatory modeling applications. EPA-450/4-87-013, Research Triangle Park, NC.
USGS, 1995: The 1992 eruptions of Crater Peak Vent, Mount SpurrVolcano, Alaska. USGS Bull. 2139, 220 pp.
Williams, H., and A. R. McBirney, 1979: Volcanology. Freeman,Cooper and Co., 397 pp.
Yamanouchi, T., K. Suzuki, and S. Kawaguchi, 1987: Detection ofclouds in Antarctica from infrared multispectral data of AVHRR.J. Meteor. Soc. Japan, 65, 949–961.
Zheng, X., F. Lu, X. Fang, Y. Fang, and L. Guo, 1998: A study ofdust storms in China using satellite data. Proc. SPIE, 3501, 163–168.