air quality study at toronto pearson international …
TRANSCRIPT

ww.intrinsikscience.com
6605 Hurontario Street, Suite 500, Mississauga, Ontario ▪ L5T 0A3
Tel: 905-364-7800 ▪ Fax: 905-364-7816 ▪ www.intrinsik.com
AIR QUALITY STUDY AT TORONTO PEARSON INTERNATIONAL AIRPORT
HUMAN HEALTH RISK ASSESSMENT (HHRA) REPORT
Final Report Appendices
August 2015
Prepared For: Greater Toronto Airport Authority Environmental Management Toronto Pearson International Airport P.O Box 6031, Toronto AMF Ontario, Canada L5P 1B

APPENDIX A
TOXICITY REFERENCE VALUE IDENTIFICATION AND SELECTION

Air Quality Study At Toronto Pearson International Airport – Human Health Risk Assessment August 2015 Intrinsik Environmental Sciences Inc. – Project #20-21515 Page A-1
APPENDIX A: TOXICITY REFERENCE VALUE IDENTIFICATION AND SELECTION
TABLE OF CONTENTS
Page A-1.0 INTRODUCTION ............................................................................................................ 2 A-2.0 TOXICITY REFERENCE VALUES ................................................................................. 3
A-2.1 Inhalation Toxicity Reference Values ..................................................................... 3 A-2.1.1 Carbon Monoxide (CO) ................................................................................... 3 A-2.1.2 Nitrogen Dioxide (NO2) ................................................................................... 6 A-2.1.3 Particulate Matter (PM10) ................................................................................. 9 A-2.1.4 Particulate Matter (PM2.5) .............................................................................. 11 A-2.1.5 Sulfur dioxide ................................................................................................ 13 A-2.1.6 Acetaldehyde ................................................................................................ 16 A-2.1.7 Acetone ........................................................................................................ 20 A-2.1.8 Acrolein and related, as acrolein ................................................................... 23 A-2.1.9 Aldehydes (other), as propionaldehyde ......................................................... 27 A-2.1.10 Aliphatic alcohols, as methyl alcohol ............................................................. 29 A-2.1.11 Alkanes/alkenes (other C1-C4) ...................................................................... 32 A-2.1.12 Alkanes/alkenes (other C5-C8) ...................................................................... 35 A-2.1.13 Alkanes/alkenes (other C>8-C10).................................................................. 39 A-2.1.14 Alkanes/alkenes (other C>10-C12) ................................................................ 42 A-2.1.15 Alkanes/alkenes (other C>12-C16) ................................................................ 44 A-2.1.16 Benzene ........................................................................................................ 46 A-2.1.17 Butadiene, 1,3- .............................................................................................. 51 A-2.1.18 Cyclohexane ................................................................................................. 55 A-2.1.19 Ethylbenzene ................................................................................................ 57 A-2.1.20 Formaldehyde ............................................................................................... 61 A-2.1.21 n-Hexane ...................................................................................................... 64 A-2.1.22 Naphthalene .................................................................................................. 68 A-2.1.23 Styrene .......................................................................................................... 70 A-2.1.24 Toluene ......................................................................................................... 74 A-2.1.25 Xylenes ......................................................................................................... 77 A-2.1.26 Carcinogenic Polycyclic Aromatic Hydrocarbons (PAHs) ............................... 81

Air Quality Study At Toronto Pearson International Airport – Human Health Risk Assessment August 2015 Intrinsik Environmental Sciences Inc. – Project #20-21515 Page A-2
APPENDIX A: TOXICITY REFERENCE VALUE IDENTIFICATION AND SELECTION A-1.0 INTRODUCTION All chemicals have the potential to cause toxicological effects; however, it is the chemical concentration, the route of exposure, the duration of exposure, and the inherent toxicity of the chemical that determines the level of effect and hence the potential for unacceptable health risks. The methods and approaches used to determine Toxicity Reference Values (TRVs) for use in the HHRA are outlined in this appendix. Toxicity Reference Values were obtained for each chemical of concern (COC), where available. For the purpose of this assessment, TRVs were defined as values used to describe acceptable doses of chemicals that will not result in the development of unacceptable adverse health effects (e.g., RfD, RfC) or are benchmarks that are policy derived and health based (e.g., AAQC). When TRVs for a particular COC were available from multiple regulatory agencies, values were reviewed and the professional judgment of an experienced toxicologist and/or risk assessor was used to select the most appropriate TRV. A number of different considerations went into selecting a TRV for use in the HHRA, including:
Is the TRV derived by a reputable regulatory agency?
Is there sufficient documentation available concerning the derivation of the TRV (e.g., study, endpoint, point of departure, uncertainty factors applied, etc.)?
How current is the derivation and most recent validation of the TRV?
How relevant is the TRV in terms of route of exposure and durations of interest? The TRVs and inhalation benchmarks employed in the current HHRA were obtained from reputable regulatory agencies including, but not limited to:
Ontario Ministry of the Environment (MOE);
Health Canada;
US EPA Integrated Risk Information System (US EPA IRIS);
Agency for Toxic Substances and Disease Registry (ATSDR);
Canadian Council of the Ministers of the Environment (CCME);
World Health Organization (WHO);
California Environmental Protection Agency (Cal EPA); and,
Texas Commission on Environmental Quality (TCEQ).

Air Quality Study At Toronto Pearson International Airport – Human Health Risk Assessment August 2015 Intrinsik Environmental Sciences Inc. – Project #20-21515 Page A-3
A-2.0 TOXICITY REFERENCE VALUES Inhalation TRVs were evaluated and selected for all COCs outlined in Appendix C. In addition to providing a tabulated summary of TRVs for each COC, the following sections also provide a brief rationale as to why each TRV was selected for use in the assessment. A-2.1 Inhalation Toxicity Reference Values A-2.1.1 Carbon Monoxide (CO) Table A-1 presents the inhalation toxicity reference values considered as part of the current assessment. 1-Hour Acute Inhalation The 1-hour acute inhalation exposure limit of 40,000 µg/m³ proposed by US EPA (2011) was selected for the use in this assessment. This value is based on blood COHb concentrations ranging from 2.1 to 2.9%, representing the levels of concern identified by the US EPA from several controlled human studies. Concentrations associated with this range of COHb represent about a 2.5% increase above baseline values. Overall, there is a lack of information regarding adverse effects and COHb concentrations below 2%. While specifics regarding the key studies that this standard is based on are not clear, it is apparent that the US EPA has recently reviewed a substantial amount of information as part of the Integrated Science Assessment (US EPA 2010 that accompanies this Rule). An equation (Coburn Forster Kane) was used by the US EPA to take into account CO uptake and kinetics in the derivation and review of the standards. The US EPA 8-hour NAAQS of 40,000 µg/m³ was selected for use in the assessment as this value is associated with the most recent and thorough review of CO toxicity. 24-Hour Acute Inhalation The 8-hour acute inhalation exposure limit of 6,000 µg/m³ proposed by Health Canada (2006) was selected for the use in this assessment. Health Canada (2006) recommended an 8-hour NAAQO MDL of 6,000 µg/m³ based on a carboxyhaemoglobin (COHb) blood level of less than 1%. This level is the upper end of the range of baseline COHb levels experienced in normal, non-smoking individuals from endogenous production. The PBPK model of Coburn, Forster and Kane was used to produce ambient CO concentrations based on the allowable COHb level. This value, adopted from Canadian Environmental Protection Act and Federal Provincial Advisory Committee (CEPA/FPAC) Working Group on Air Quality Objectives and Guidelines, was recommended as the 8-hour NAAQO MDL by Health Canada (2006) and was selected as the 24-hour acute exposure limit for the current assessment as it was the most conservative TRV available. Chronic Inhalation – Non-Carcinogenic A suitable chronic inhalation TRV was not available for use in the assessment of carbon monoxide. Chronic Inhalation – Carcinogenic Carbon monoxide was not evaluated as a carcinogen via the inhalation route.

Air Quality Study At Toronto Pearson International Airport – Human Health Risk Assessment August 2015 Intrinsik Environmental Sciences Inc. – Project #20-21515 Page A-4
Table A-1 Inhalation Toxicity Reference Values
Type Duration Value a Critical Effect Reference Point of
Departure UF Source
Date Derived
AAQC; 1-hour
Acute 36,200 Health based NA NA NA MOE, 2012
2012
NAAQO MDL; 1-hour
Acute 15,000 Health based NA NA NA CCME, 1999
published 1974;
reviewed 1996
NAAQS; 1-hour
Acute 40,000
Carboxyhaemoglobin blood levels
less than or equal to 2.1% in the cardiovascular
sensitive population
NA NA NA US
EPA, 2011
2011
REL; 1-hour
Acute 23,000
Aggravation of angina and other cardiovascular
diseases
Aronow, 1981
NA 1 Cal
EPA, 2008
2008
AAQG; 1-hour
Acute 30,000 Carboxyhemoglobin blood levels of less than 2.5%
NA NA NA WHO, 2000
2000
NAAQO: 8-hour
Acute 6,000 Carboxyhemoglobi
n blood level of less than 1%
NA NA NA Health Canada, 2006
1994
Shaded exposure limits were selected as toxicological reference values for the current risk assessment. NA Information was not available. a Units of µg/m3 unless otherwise noted.
References Aronow, W.S. 1981. Aggravation of angina pectoris by two percent carboxyhemoglobin. Am
Heart J. 101: 154-157. Cited in: Cal EPA, 2008 Cal EPA. 2008. TSD for Noncancer RELs. Appendix D. Individual acute, 8 hour, and chronic
reference exposure levels. December 2008. California Environmental Protection Agency, Office of Environmental Health Hazard Assessment. Sacramento, CA. Available at: http://www.oehha.ca.gov/air/hot_spots/2008/AppendixD2_final.pdf
CCME 1999. Canadian National Ambient Air Quality Objectives: Process and Status. Canadian
Council of Ministers of the Environment. Available at: ceqg-rcqe.ccme.ca/download/en/133/
Health Canada. 2006. Regulations Related to Health and Air Quality. Available at:
http://www.hc-sc.gc.ca/ewh-semt/air/out-ext/reg-eng.php MOE. 2012. Ontario’s Ambient Air Quality Criteria (AAQCs). Standards Development Branch.
Ontario Ministry of the Environment. Available at: http://www.ene.gov.on.ca/stdprodconsume/groups/lr/@ene/@resources/documents/resource/std01_079182.pdf
US EPA. 2011. Code of the Federal Register. Environmental Protection Agency. Primary
National Ambient Air Quality Standard for Carbon Monoxide: Proposed Rule. United States Environmental Protection Agency

Air Quality Study At Toronto Pearson International Airport – Human Health Risk Assessment August 2015 Intrinsik Environmental Sciences Inc. – Project #20-21515 Page A-5
WHO. 2000. Air Quality Guidelines for Europe, Second Edition. World Health Organization, Regional Office for Europe, Copenhagen. WHO Regional Publications, European Series, No. 91.

Air Quality Study At Toronto Pearson International Airport – Human Health Risk Assessment August 2015 Intrinsik Environmental Sciences Inc. – Project #20-21515 Page A-6
A-2.1.2 Nitrogen Dioxide (NO2) Table A-2 presents the inhalation toxicity reference values considered as part of the current assessment. 1-Hour Acute Inhalation The US EPA (2010) derived a 1-hour NAAQS of 100 ppb (188 µg/m3) based on the average 98th percentile of the annual distribution of daily maximum 1-hour concentrations over a three year span. Although it is derived from NO2 exposure data, it is intended to apply to all NOx compounds. Experimental evidence from human and animal studies indicated that respiratory effects attributable to NO2 can occur after brief exposures (e.g., less than 1-hour, up to 3-hours). The US EPA (2010) concluded that 1-hour exposures of 100 ppb may result in small, significant increases in airway responsiveness. This was based in part on the observations from human clinical studies where airway inflammation and increased airway responsiveness were observed in asthmatics at concentrations less than 2 ppm (Goodman et al., 2009). In contrast, airway inflammation has been observed at much higher concentrations (100 to 200 ppm/minute, or 1 ppm for 2 to 3 hours) in healthy individuals. The 1-hour standard of 100 ppb (188 µg/m3) was intended to be protective of sensitive individuals in the population, including asthmatics and individuals with pre-existing respiratory conditions. As this value represented the most recent regulatory review of the health effects of NO2 and provided the most detailed supporting documentation for its basis, it was selected for use in the assessment.
24-Hour Acute Inhalation The 24-hour acute inhalation exposure limit of 200 µg/m3 proposed by the MOE (2012) was selected for use in this assessment. While no scientific basis is provided for this limit, this value was selected for use in the assessment as it was the only appropriate TRV identified. Chronic Inhalation – Non-Carcinogenic The chronic inhalation exposure limit proposed by WHO (2006) was selected for use in the assessment. The WHO (2006) guideline value of 40 µg/m³ (0.023 ppm) was adopted from an annual value originally recommended by the WHO (1997) International Program on Chemical Safety (IPCS). WHO (1997) indicated that the 40 µg/m³ value was based on consideration of background concentrations and the observation that adverse health impacts may occur when concentrations in addition to background are above 28 µg/m³. In the absence of an identified NOAEL and based on epidemiological studies that observed increased risks of respiratory illness in children, 40 µg/m3 (0.023 ppm) was recommended as an annual average. This value was selected for use in the assessment as it was the most conservative TRV identified. Chronic Inhalation – Carcinogenic Nitrogen dioxide was not evaluated as a carcinogen via the inhalation route.
Table A-2 Inhalation Toxicity Reference Values
Type Duration Value a Critical Effect Reference Point of
Departure UF Source
Date Derived
AAQC; 1-hour
Acute 400b Health based NA NA NA MOE, 2012
NA
NAAQO MAL; 1-hour
Acute 400 Health based NA NA NA CCME, 1999
published 1975;
reviewed 1989
NAAQS; 1-hour
Acute 188 Respiratory
irritation (human) NA NA NA
US EPA, 2010
NA
REL; 1-hour
Acute 470 Increase in
airway reactivity CARB, 1992
NOAEL: 0.25 ppm
(470 1
Cal EPA, 2008
1999

Air Quality Study At Toronto Pearson International Airport – Human Health Risk Assessment August 2015 Intrinsik Environmental Sciences Inc. – Project #20-21515 Page A-7
Table A-2 Inhalation Toxicity Reference Values
Type Duration Value a Critical Effect Reference Point of
Departure UF Source
Date Derived
µg/m3)
AQG; 1-hour
Acute 200
Effects in the pulmonary function of asthmatics
NA NA NA WHO, 2005
2001
AAQC; 24-hour
Acute 200b Respiratory tract irritation
NA NA NA MOE, 2012
NA
NAAQO MAL; 24-hour
Acute 200 Health based NA NA NA CCME, 1999
published 1975;
reviewed 1989
MDL; Annual Average
Chronic 60 Health based NA NA NA CCME, 1999
published 1975;
reviewed 1989
NAAQS; Annual Average
Chronic 100 Respiratory
inflammation (human)
NA NA NA US EPA,
2010 1993
AQG; Annual Average
Chronic 40 Health based NA NA NA WHO, 2006
1997
Shaded exposure limits were selected as toxicological reference values for the current risk assessment. NA Information was not available. a Units of µg/m3 unless otherwise noted. b Exposure limit of NOx (Sum of NO and NO2)
References Cal EPA. 2008. TSD for Noncancer RELs. Appendix D. Individual acute, 8 hour, and chronic
reference exposure levels. December 2008. California Environmental Protection Agency, Office of Environmental Health Hazard Assessment. Sacramento, CA. Available at: http://www.oehha.ca.gov/air/hot_spots/2008/AppendixD2_final.pdf
CARB. 1992. Review of the one-hour ambient air quality standard for nitrogen dioxide technical
support document. State of California Air Resources Board Technical Support Division. Cited in: Cal EPA, 2008
CCME. 1999. Canadian National Ambient Air Quality Objectives: Process and Status. Canadian
Council of Ministers of the Environment Available at: http://ceqg-rcqe.ccme.ca/download/en/133/
Goodman, JE, Chandalia JK, Thakali S, et al. (2009). Meta-analysis of nitrogen dioxide
exposure and airway hyper-responsiveness in asthmatics. Crit. Rev. Toxicol. 39:719-742. Cited in: US EPA, 2010.
MOE. 2012. Ontario’s Ambient Air Quality Criteria (AAQCs). Standards Development Branch. Ontario Ministry of the Environment. Available at: http://www.ene.gov.on.ca/stdprodconsume/groups/lr/@ene/@resources/documents/resource/std01_079182.pdf
US EPA. 2010. Code of the Federal Register. Environmental Protection Agency. 40 CFR Parts
75 (26). Primary National Ambient Air Quality Standard for Nitrogen Dioxide; Final Rule. United States Environmental Protection Agency.

Air Quality Study At Toronto Pearson International Airport – Human Health Risk Assessment August 2015 Intrinsik Environmental Sciences Inc. – Project #20-21515 Page A-8
WHO. 1997. Environmental Health Criteria No. 188 – Oxides of nitrogen. World Health Organization, Geneva. Available at: www.inchem.org/documents/ehc/ehc/ehc188.htm.
WHO. 2006. Air Quality Guidelines: Global Update 2005. Particulate matter, ozone, nitrogen
dioxide and sulphur dioxide. ISBN 92 890 2192 6. World Health Organization

Air Quality Study At Toronto Pearson International Airport – Human Health Risk Assessment August 2015 Intrinsik Environmental Sciences Inc. – Project #20-21515 Page A-9
A-2.1.3 Particulate Matter (PM10) Table A-3 presents the inhalation toxicity reference values considered as part of the current assessment. 1-Hour Acute Inhalation A suitable 1-hour acute inhalation TRV for PM10 was not available for use in the assessment. 24-Hour Acute Inhalation The 24-hour acute inhalation exposure limit recommended by WHO (2006) was selected for use in the assessment. The WHO (2006) derived a 24-hour AQG of 50 µg/m3 that was based on the relationship between the distribution of PM10 24-hour means (and its 99th percentile) and annual averages. Due to insufficient quantitative evidence of PM10, the AQG was based off studies of PM2.5 and a PM2.5:PM10 ratio of 0.5 (i.e., 1 µg/m3 PM2.5 equals to 2 µg/m3 PM10) was used to derive the PM10 guideline values. The ratio of 0.5 is typically observed in urban areas of developing countries and also of the lower range (0.5 -0.8) of developed countries (WHO, 2006). This value was selected for use in the assessment as it was based on the chronic inhalation TRV selected for use. Chronic Inhalation – Non-Carcinogenic The chronic inhalation exposure limit recommended by WHO (2006) was selected for use in the assessment. The WHO (2006) derived a chronic inhalation AQG of 20 µg/m3 that was based on the lowest concentration at which total cardiopulmonary and lung cancer mortality have increased with more than 95% confidence from a response to PM2.5. Due to insufficient quantitative evidence of PM10, the AQG was based off studies of PM2.5 and a PM2.5:PM10 ratio of 0.5 (i.e., 1 µg/m3 PM2.5 equals to 2 µg/m3 PM10) was used to derive the PM10 guideline values. The ratio of 0.5 is typically observed in urban areas of developing countries and also of the lower range of developed countries (WHO, 2006). This value was selected for use in the assessment as it was the only suitable TRV identified. Chronic Inhalation – Carcinogenic PM10 was not evaluated as a carcinogen via the inhalation route.
Table A-3 Inhalation Toxicity Reference Values
Type Duration Value a Critical Effect Reference Point of
Departure UF Source Derived
AAQC (interim); 24-hour
Acute 50 NA NA NA NA MOE, 2012
NA
Reference Level; 24-hour
Acute 25 Health based NA NA NA CCME, 1999
published 1998
NAAQS; 24-hour
Acute 150
Cardiovascular and respiratory
hospital admissions and
respiratory symptoms
NA NA NA US
EPA, 2010
NA
AQG; 24-hour
Acute 50 Respiratory tract
irritation NA NA NA
WHO, 2006
NA

Air Quality Study At Toronto Pearson International Airport – Human Health Risk Assessment August 2015 Intrinsik Environmental Sciences Inc. – Project #20-21515 Page A-10
Table A-3 Inhalation Toxicity Reference Values
Type Duration Value a Critical Effect Reference Point of
Departure UF Source Derived
AQG Chronic 20
Lowest levels at which total,
cardiopulmonary and lung cancer
mortality has been shown to
increase (human)
NA NA NA WHO, 2006
NA
Shaded exposure limits were selected as toxicological reference values for the current risk assessment. NA Information was not available. a Units of µg/m3 unless otherwise noted.
References CCME 1999. Canadian National Ambient Air Quality Objectives: Process and Status. Canadian
Council of Ministers of the Environment. Available at: ceqg-rcqe.ccme.ca/download/en/133/
MOE. 2012. Ontario’s Ambient Air Quality Criteria (AAQCs). Standards Development Branch.
Ontario Ministry of the Environment. Available at: http://www.ene.gov.on.ca/stdprodconsume/groups/lr/@ene/@resources/documents/resource/std01_079182.pdf
US EPA. 2010. Quantitative Health Risk Assessment for Particulate Matter. EPA-452/R-10-
005. Office of Air Quality Planning and Standards, US Environmental Protection Agency. Research Triangle Park, NC
WHO. 2006. Air Quality Guidelines: Global Update 2005. Particulate matter, ozone, nitrogen
dioxide and sulphur dioxide. World Health Organization. ISBN 92 890 2192 6.

Air Quality Study At Toronto Pearson International Airport – Human Health Risk Assessment August 2015 Intrinsik Environmental Sciences Inc. – Project #20-21515 Page A-11
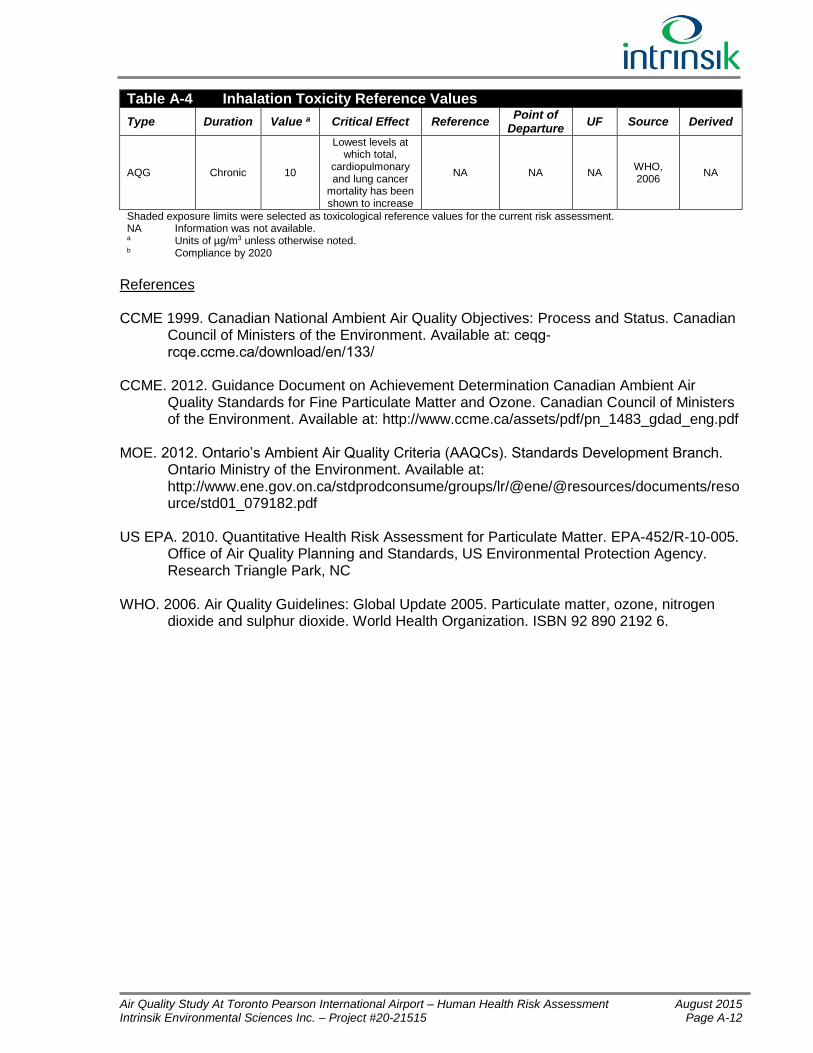
A-2.1.4 Particulate Matter (PM2.5) Table A-4 presents the inhalation toxicity reference values considered as part of the current assessment. 1-Hour Acute Inhalation A suitable 1-hour acute inhalation TRV for PM2.5 was not available for use in the assessment. 24-Hour Acute Inhalation The CCME (2012) derived two 24-hour CAAQS of 28 µg/m3 (for compliance by 2015) and 27 µg/m3 (for compliance by 2020) for PM2.5. These two values are intended to be used with the 3-year average of the 98th percentile of daily 24-hour average concentrations. A supporting document was available (CCME, 2012); however the specific basis of the 24-hour value with respect to health was not provided. The CAAQS derived by the CCME (2012) was to replace the CWS for PM2.5 established in the year 2000. Given the jurisdiction and scope of the Project, the use of the 2020 24-hour CAAQS was deemed most appropriate for use in the assessment. Chronic Inhalation – Non-Carcinogenic The CCME (2012) derived two annual average CAAQS of 10 µg/m3 (for compliance by 2015) and 8.8 µg/m3 (for compliance by 2020) for PM2.5. These two values were intended to be used with the 3-year average of the annual average concentrations. Though a supporting document was available (CCME, 2012), the specific basis of the annual average values with respect to health was not provided. The CAAQS derived by the CCME (2012) were to replace the CWS for PM2.5 established in the year 2000. Given the jurisdiction and scope of the Project, the use of the 2020 annual CAAQS was deemed most appropriate for use in the assessment. Chronic Inhalation – Carcinogenic PM2.5 was not evaluated as a carcinogen via the inhalation route.
Table A-4 Inhalation Toxicity Reference Values
Type Duration Value a Critical Effect Reference Point of
Departure UF Source Derived
AAQC; 24-hour
Acute 30 NA NA NA NA MOE, 2012
NA
Reference Level; 24-hour
Acute 15 Health based NA NA NA CCME, 1999
published 1998
CAAQS; 24-hour
Acute 27 b Respiratory tract irritation
NA NA NA CCME, 2012
2012
NAAQS; 24-hour
Acute 35 Mortality and
morbidity NA NA NA
US EPA, 2010
NA
AQG; 24-hour
Acute 25 NA NA NA NA WHO, 2006
NA
CAAQS Chronic 8.8 b
Cardiopulmonary and lung cancer
mortality increase (human)
NA NA NA CCME, 2012
2012
NAAQS Chronic 12
Various adverse health effects;
Increased risk of mortality,
cardiovascular-related effects,
respiratory morbidity
NA NA NA US EPA,
2010 NA
Air Quality Study At Toronto Pearson International Airport – Human Health Risk Assessment August 2015 Intrinsik Environmental Sciences Inc. – Project #20-21515 Page A-12
Table A-4 Inhalation Toxicity Reference Values
Type Duration Value a Critical Effect Reference Point of
Departure UF Source Derived
AQG Chronic 10
Lowest levels at which total,
cardiopulmonary and lung cancer
mortality has been shown to increase
NA NA NA WHO, 2006
NA
Shaded exposure limits were selected as toxicological reference values for the current risk assessment. NA Information was not available. a Units of µg/m3 unless otherwise noted. b Compliance by 2020
References CCME 1999. Canadian National Ambient Air Quality Objectives: Process and Status. Canadian
Council of Ministers of the Environment. Available at: ceqg-rcqe.ccme.ca/download/en/133/
CCME. 2012. Guidance Document on Achievement Determination Canadian Ambient Air
Quality Standards for Fine Particulate Matter and Ozone. Canadian Council of Ministers of the Environment. Available at: http://www.ccme.ca/assets/pdf/pn_1483_gdad_eng.pdf
MOE. 2012. Ontario’s Ambient Air Quality Criteria (AAQCs). Standards Development Branch.
Ontario Ministry of the Environment. Available at: http://www.ene.gov.on.ca/stdprodconsume/groups/lr/@ene/@resources/documents/resource/std01_079182.pdf
US EPA. 2010. Quantitative Health Risk Assessment for Particulate Matter. EPA-452/R-10-005.
Office of Air Quality Planning and Standards, US Environmental Protection Agency. Research Triangle Park, NC
WHO. 2006. Air Quality Guidelines: Global Update 2005. Particulate matter, ozone, nitrogen
dioxide and sulphur dioxide. World Health Organization. ISBN 92 890 2192 6.

Air Quality Study At Toronto Pearson International Airport – Human Health Risk Assessment August 2015 Intrinsik Environmental Sciences Inc. – Project #20-21515 Page A-13
A-2.1.5 Sulfur dioxide Table A-5 presents the inhalation toxicity reference values considered as part of the current assessment. 1-Hour Acute Inhalation The 1-hour acute inhalation exposure limit of 196 µg/m³ proposed by US EPA (2010) was selected for use in this assessment. The US EPA (2010) has derived a 1-hour NAAQS of 75 ppb (196 µg/m³) for SO2 that is intended to protect against decrements in lung function, respiratory symptoms, and respiratory morbidity as reflected by emergency department visits and hospital admissions. This value is based on findings observed in controlled human exposure studies of 5–10 minutes and animal toxicological studies using exposures of minutes to hours. The value is also based on the 3-year average of the 99th percentile of the yearly distribution of 1-hour daily maximum SO2 concentrations found in epidemiological studies. After considering the weight of evidence, it was concluded that the epidemiologic studies provide strong support for setting a standard that limits the 99th percentile of the distribution of 1-hour daily maximum sulphur dioxide concentrations to 75 ppb. The standard level of 75 ppb is sufficiently below the SO2 levels in the three cities where epidemiologic studies found statistically significant effects in multipollutant models with PM (i.e., 78, 82, and 150 ppb) to provide an adequate margin of safety given the uncertainty as to whether monitors in these study locations reflected the highest 1-hour daily maximum SO2 concentration across the entire study area. This value was selected for use in the assessment as it was the most conservative TRV identified. 24-Hour Acute Inhalation The 24-hour acute inhalation exposure limit of 275 µg/m3 proposed by the MOE (2012) was selected for use in this assessment. While no publically available information was identified describing the derivation of the MOE SO2 24-hour AAQC, it is our understanding the MOE standards for SO2 (i.e., 24-hour and annual) were not developed using individual toxicological endpoints that vary with exposure duration, but rather converted (using meteorological based conversion factors) from the 1-hour AAQC. The MOE 1-hour AAQC is consistent with the Cal EPA (2008) 1-hour SO2 REL of 0.25 ppm (690 µg/m3) that was designed to protect sensitive individuals (i.e., exercising asthmatics) from lower respiratory effects following acute exposure. A NOAEL for sensitive individuals of 0.25 ppm SO2 (from multiple studies) was adopted as the Cal EPA acute REL for SO2 that would not result in discomforting respiratory effects among sensitive individuals after a 1-hour exposure event. Accordingly, the MOE (2012) 24-hour exposure limit was considered appropriate for this assessment. Chronic Inhalation – Non-Carcinogenic Health Canada NAAQO provided an annual MDL of 11 ppb (29 µg/m3) for SO2 (Health Canada, 2006). While no scientific basis is provided for this limit, this value was selected for use in the assessment it was the most conservative TRV identified. Chronic Inhalation – Carcinogenic Sulphur dioxide was not evaluated as a carcinogen via the inhalation route.
Table A-5 Inhalation Toxicity Reference Values
Type Duration Value a Critical Effect Reference Point of
Departure UF Source
Date Derived
NAAQS; 1-hour
Acute 196 Respiratory
morbidity (human) NA NA NA
US EPA, 2010
2010

Air Quality Study At Toronto Pearson International Airport – Human Health Risk Assessment August 2015 Intrinsik Environmental Sciences Inc. – Project #20-21515 Page A-14
Table A-5 Inhalation Toxicity Reference Values
Type Duration Value a Critical Effect Reference Point of
Departure UF Source
Date Derived
REL; 1-hour
Acute 660
Adverse respiratory
effects, broncho-constriction
NA NOAEL: 0.25 ppm
(660 µg/m3) NA
Cal EPA, 2008
NA
AAQC; 1-hour
Acute 690 Health and
vegetation based NA NA NA
MOE, 2012
NA
NAAQO MDL; 1-hour
Acute 450 Health based NA NA NA CCME, 1999
published 1974;
reviewed 1989
AAQC; 24-hour
Acute 275 Respiratory tract
irritation NA NA NA
MOE, 2012
NA
AQG; 24-hour
Acute 20 NA NA NA NA WHO, 2006
NA
NAAQO MDL; 24-hour
Acute 150 Health based NA NA NA CCME, 1999
published 1974;
reviewed 1989
MRL; 14 days or less
Acute 26 Respiratory
irritation Sheppard et
al., 1981
LOAEL: 0.1 ppm
(262 µg/m3) 9
ATSDR, 1998
NA
NAAQO MDL
Chronic 30 Health based NA NA NA CCME, 1999
published 1974;
reviewed 1989
NAAQO MDL
Chronic 29 Respiratory inflammation
(human) NA NA NA
Health Canada,
2006 NA
AAQC Chronic 55 NA NA NA NA MOE, 2012
NA
Shaded exposure limits were selected as toxicological reference values for the current risk assessment. NA Information was not available. a Units of µg/m3 unless otherwise noted.
References ATSDR. 1998. Toxicological Profile for Sulfur Dioxide. US Public Health Service, Department of
Health and Human Services, Atlanta, GA. Agency for Toxic Substances and Disease Registry. Available at: http://www.atsdr.cdc.gov/toxprofiles/tp116.pdf
Cal EPA. 2008. TSD for Noncancer RELs. Appendix D. Individual acute, 8 hour, and chronic
reference exposure levels. December 2008. California Environmental Protection Agency, Office of Environmental Health Hazard Assessment. Sacramento, CA. Available at: http://www.oehha.ca.gov/air/hot_spots/2008/AppendixD2_final.pdf
CCME.1999. Canadian National Ambient Air Quality Objectives: Process and Status. Canadian
Council of Ministers of the Environment. Available at: ceqg-rcqe.ccme.ca/download/en/133/
Health Canada. 2006. Regulations Related to Health and Air Quality. Available at:
http://www.hc-sc.gc.ca/ewh-semt/air/out-ext/reg-eng.php MOE. 2012. Ontario’s Ambient Air Quality Criteria (AAQCs). Standards Development Branch.
Ontario Ministry of the Environment. Available at: http://www.ene.gov.on.ca/stdprodconsume/groups/lr/@ene/@resources/documents/resource/std01_079182.pdf

Air Quality Study At Toronto Pearson International Airport – Human Health Risk Assessment August 2015 Intrinsik Environmental Sciences Inc. – Project #20-21515 Page A-15
Sheppard, D., Saisho, A., Nadel, J.A., et al. 1981. Exercise increases sulfur dioxide-induced bronchoconstriction in asthmatic subjects. Am Rev Respir. 123: 486-491.Cited in: ATSDR, 1998
US EPA. 2010. Code of the Federal Register. Environmental Protection Agency. 40 CFR Parts
50, 53 and 58. Primary National Ambient Air Quality Standard for Sulfur Dioxide: Final Rule.
WHO. 2006. Air Quality Guidelines: Global Update 2005. Particulate matter, ozone, nitrogen
dioxide and sulphur dioxide. World Health Organization. ISBN 92 890 2192 6.

Air Quality Study At Toronto Pearson International Airport – Human Health Risk Assessment August 2015 Intrinsik Environmental Sciences Inc. – Project #20-21515 Page A-16
A-2.1.6 Acetaldehyde Table A-6 presents the inhalation toxicity reference values considered as part of the current assessment. 1-Hour Acute Inhalation The 1-hour acute inhalation exposure limit of 470 µg/m³ proposed by Cal EPA (2008) was selected for the use in this assessment. Cal EPA (2008) derived an acute 1-hour REL of 470 µg/m3 based on a study conducted by Prieto et al. (2000). The purpose of this investigation was to establish the concentration at which a 20% decrease in forced expiratory volume (FEV1) was observed following 2 to 4 minutes of exposure. Subjects were exposed via mouth inhalation to air concentrations ranging from 1.5 x 10⁵ to 1.2 x 10⁶ µg/m³, with a geometric mean of 5.27 x 10⁵
µg/m3, and a lower 95% confidence interval of 1.42 x 10⁵ µg/m3. This concentration was selected as the LOAEL for effects on expiratory volume in asthmatics, and this value was used as the basis of the acute REL. Two follow-up studies (Prieto et al., 2002a,b) were conducted and considered in the development of the REL. Prieto et al. (2002a) compared the respiratory response to acetaldehyde with known bronchoconstricting compounds (methacholine and adenosine-5’-monophosphate), and the repeatability of the respiratory response to acetaldehyde. Prieto et al. (2002b) also incorporated a healthy subject group, and subjects with allergic rhinitis or asthma. Subjects with allergic rhinitis and asthma both demonstrated significant differences from the healthy subject group with respect to the occurrence of the 20% decrease in FEV1. A cumulative uncertainty factor of 300 was applied to the selected LOAEL of 1.42 x 10⁵ µg/m3. An uncertainty factor of 10 was applied for the use of a LOAEL and an uncertainty factor of 30 representative of intra-species variability accounted for the potential for exacerbation of asthma in children (as the subjects examined were all adults) and the potential for hyper-responsiveness to methacholine (Cal EPA, 2008). The result was an REL of 470 µg/m3. This value was selected for use in the assessment as it was the only suitable 1-hour TRV. 24-Hour Acute Inhalation The 24-hour acute inhalation exposure limit of 500 µg/m3 proposed by the MOE (2012) was selected for the use in this assessment. The MOE (2012) derived a 24-hour AAQC of 500 µg/m3 for acetaldehyde based on tissue damage observed during a rat inhalation study (Appleman et al., 1986). An adjusted NOAEL of 49,000 µg/m3 was calculated by adjusting the study NOAEL of 2.7x10⁵ µg/m3 for continuous exposure (6/24 hours, 5/7 days). An uncertainty factor of 100 (10 to account for human variability and 10 for interspecies variability) was applied to the NOAEL. This value was selected for use in the assessment as it was the most conservative value. Chronic Inhalation – Non-Carcinogenic The chronic inhalation exposure limit of 9 µg/m3 proposed by the US EPA IRIS (1991a) was recommended for use by MOE (2011). This RfC was based on the degeneration of the olfactory epithelium following short-term inhalation exposure in rats (Appleman et al., 1982; 1986). In this study, Wistar rats were exposed to acetaldehyde in concentrations of 0, 150, 400, 500, 1,000, 2,200, or 5,000 ppm (0, 2.73 x 10⁵, 7.28 x 10⁵, 9.10 x 10⁵, 1.82 x 10⁶, 4.004 x 10⁶, and 9.10 x 10⁶ µg/m3) for a period of four weeks for 6 hours/day, 5 days/week. A LOAEL of 7.20 x 10⁵ µg/m3 was calculated based on degeneration of the nasal olfactory epithelium and a NOAEL of 2.73 x 10⁵ µg/m3 was identified and adjusted for continuous exposure (6/24 hours, 5/7 days). Following this, a NOAEL (HEC) of 8,700 µg/m3 was calculated for a gas:respiratory effect in the extra thoracic region (ET = 0.18). A cumulative uncertainty factor of 1,000 (10 to account for intra-species variability, 10 for sub-chronic to chronic extrapolation, and 10 for inter-species

Air Quality Study At Toronto Pearson International Airport – Human Health Risk Assessment August 2015 Intrinsik Environmental Sciences Inc. – Project #20-21515 Page A-17
extrapolation, using dosimetric adjustments and to account for the incompleteness of the database) was applied to the NOAEL (HEC) to determine the RfC (US EPA IRIS, 1991a). Cal EPA (2008) also derived a chronic REL of 140 μg/m3 using the same short-term inhalation studies as the US EPA IRIS (1991a) described above (Appelman et al., 1982; 1986). The REL of 140 μg/m3 was calculated using the benchmark concentration modeling approach (24 ppm or 4.32 x 10⁴ µg/m3), which used the continuous polynomial and Hill models of analysis. The exposures were adjusted to reflect continuous exposure. The degeneration of the olfactory epithelium was determined to be the critical effect and the NOAEL of 2.73 x 10⁵ µg/m3 was used. An uncertainty factor of 300 (10 to account for no interspecies toxicodynamic data, 10 for intra-species variation, and 3 for sub-chronic exposure) was applied to determine the REL. Though the US EPA IRIS (1991a) value is more conservative (i.e., 9 versus 140 µg/m3), the Cal EPA TRV provides for the most recent analysis using up-to-date science. As a result, the Cal EPA (2008) chronic REL was used within the assessment. The Cal EPA (2008) TRV was recently endorsed for use by Toronto Public Health. Chronic Inhalation – Carcinogenic Cal EPA (2011) derived an IUR of 2.7 x 10⁻⁶ (µg/m³)-1 for acetaldehyde, which was recommended for use by MOE (2011). This value was based on the increased incidence of nasal adenocarcinomas and squamous cell carcinomas in male Wistar rats exposed to acetaldehyde for up to 28 months (Woutersen et al., 1986). Cal EPA (2011) adjusted exposure estimates for intermittent exposure. Linearized multistage modelling was conducted, and the 95% upper confidence limit was determined. Exposures were then scaled based on body weight. The IUR of 2.7 x 10⁻⁶ (µg/m3)-1 derived by Cal EPA (2011) was selected as it was the most conservative of the recently derived values.
Table A-6 Inhalation Toxicity Reference Values
Type Duration Valuea Critical Effect Reference Point of
Departure UF Source
Year Derived
REL; 1-hour
Acute 470
Broncho-constriction,
PC20>20% drop in FEV1
Prieto et al., 2000
LOAEL: 79 ppm
(1.42 x 10⁵
µg/m3)
300 Cal EPA,
2008 NA
AAQC; 24-hour
Acute 500 Tissue damage Appelman et al., 1986
NOAEL (ADJ): 4.9 x 10⁴ µg/m3
100 MOE, 2012
NA
TC; 24-hour
Acute 2,000 Irritancy in humans
Silverman et al., 1946
NOAEL: 45 mg/m3
(4.5 x 10⁴ µg/m3)
20 WHO, 1995
1995
RfC Chronic 9 Degeneration of
olfactory epithelium
Appelman et al., 1982;
1986
NOAEL (HEC): 8.7
mg/m3 (8.7 x 10³
µg/m3)
1,000 US EPA
IRIS, 1991a
1991
REL Chronic 140 Degeneration of
olfactory epithelium
Appelman et al., 1982;
1986
NOAEL (ADJ): 24
ppm (4.32 x 10⁴
µg/m3)
300 Cal EPA,
2008 NA
ESL; Annual Average
Chronic 45 Health based NA NA NA TCEQ, 2013
2012

Air Quality Study At Toronto Pearson International Airport – Human Health Risk Assessment August 2015 Intrinsik Environmental Sciences Inc. – Project #20-21515 Page A-18
Table A-6 Inhalation Toxicity Reference Values
Type Duration Valuea Critical Effect Reference Point of
Departure UF Source
Year Derived
UR Chronic 5.8 x 10⁻⁷
per µg/m3
Increased incidence of
nasal adenocarcinomas and squamous cell carcinomas
(combined)
Woutersen et al., 1986
NA NA
Environment
Canada and
Health Canada,
2000
2000
UR Chronic 2.2 x 10⁻⁶ per µg/m3
Nasal squamous cell carcinoma or adenocarcinoma
Woutersen and
Appelman, 1984
NA NA US EPA
IRIS, 1991b
1991
UR Chronic 2.7 x 10⁻⁶ per µg/m3
Nasal tumour incidence data
Woutersen et al., 1986
NA NA Cal EPA,
2011 2002
Shaded exposure limits were selected as toxicological reference values for the current risk assessment. NA Information was not available. a Units are µg/m3 unless otherwise noted.
References Appleman, L.M., Woutersen, R.A., and Feron, V.J. 1982. Inhalation toxicity of acetaldehyde in
rats. I. Acute and subacute studies. Toxicology 23: 293-297. Cited in: US EPA IRIS, 1991a and Cal EPA, 2008.
Appleman, L.M., Woutersen, R.A., Feron, V.J., Hooftman, R.N., and Notten, W.R.F. 1986. Effect
of variable versus fixed exposure levels on the toxicity of acetaldehyde in rats. J. Appl. Toxicol. 6(5): 331-336. Cited in: Cal EPA, 2008, MOE, 2012, and US EPA IRIS, 1991a.
Cal EPA. 2008. TSD for Noncancer RELs. Appendix D. Individual acute, 8 hour, and chronic
reference exposure levels. December 2008. California Environmental Protection Agency, Office of Environmental Health Hazard Assessment. Sacramento, CA. Available at: http://www.oehha.ca.gov/air/hot_spots/2008/AppendixD1_final.pdf
Cal EPA. 2011. Appendix B. Chemical-specific summaries of the information to derive unit risk
and cancer potency values. California Environmental Protection Agency. June 2009, revised 2011. Available at: http://www.oehha.ca.gov/air/hot_spots/2009/AppendixB.pdf
Environment Canada and Health Canada. 2000. Canadian Environmental Protection Act.
Priority Substances List Assessment Report: Acetaldehyde. Environment Canada, Health Canada. Available on-line at: http://www.hc-sc.gc.ca/ewh-semt/alt_formats/hecs-sesc/pdf/pubs/contaminants/psl2-lsp2/acetaldehyde/acetaldehyde_fin-eng.pdf.
MOE. 2012. Ontario’s Ambient Air Quality Criteria (AAQCs). Standards Development Branch.
Ontario Ministry of the Environment. Available at: http://www.ene.gov.on.ca/stdprodconsume/groups/lr/@ene/@resources/documents/resource/std01_079182.pdf
Prieto, L., Sanchez-Toril, F., Broton, B., Soriano, S., Casan, R., Belenguer, J.L. 2000. Airway
responsiveness to acetaldehyde in patients with asthma: Relationship to methacholine responsiveness and peak expiratory flow variation. Clin Exp Allergy 30(1):71-78. Cited in: Cal EPA, 2008.

Air Quality Study At Toronto Pearson International Airport – Human Health Risk Assessment August 2015 Intrinsik Environmental Sciences Inc. – Project #20-21515 Page A-19
Prieto, L., Gutierrez, V., Cervera, A. and Linana, J. 2002a. Airway obstruction induced by inhaled acetaldehyde in asthma: repeatability and relationship to adenosine 5’-monophosphate responsiveness. J Invest Allergol Clin Innunol. 12(2):91-98. Cited in: Cal EPA, 2008
Prieto, L., Sanchez-Toril, F., Gutierrez, V. and Marin, M.J. 2002b. Airway responsiveness to
inhaled acetaldehyde in subjects with allergic rhinitis: Relationship to methacholine responsiveness. Respiration 69(2): 129-135. Cal EPA, 2008
Silverman, L., Schulte, H.F., and First, M.W. 1946. Further studies on sensory response to
certain industrial solvent vapors. J Ind Hyg Toxicol 28: 262-266. Cited in: WHO, 1995. TCEQ. 2013. TCEQ Interoffice Memorandum Effects Screening Levels. Texas Commission on
Environmental Quality. Toxicology Division, Office of Executive Director. February, 2013. US EPA IRIS. 1991a. Acetaldehyde (CASRN 75-07-0). Chronic Health Hazard Assessments for
Noncarcinogenic Effects. US Environmental Protection Agency Integrated Risk Information System. Available at: http://www.epa.gov/iris/subst/0290.htm#refinhal
US EPA IRIS. 1991b. Acetaldehyde (CASRN 75-07-0). Carcinogenicity Assessment for Lifetime
Exposure. US Environmental Protection Agency Integrated Risk Information System. Available at: http://www.epa.gov/iris/subst/0290.htm#carc
WHO. 1995. Environmental Health Criteria 167: Acetaldehyde. World Health Organization,
Geneva. Available at: http://www.inchem.org/documents/ehc/ehc/ehc167.htm Woutersen, R.A. and Appelman, L.M. 1984. Lifespan inhalation carcinogenicity study of
acetaldehyde in rats. III. Recovery after 52 weeks of exposure. Report No. V84.288/190172. CIVO-Institutes TNO, The Netherlands. Cited in: US EPA IRIS, 1991b.
Woutersen, R.A., Appleman, L.M., Van Garderen-Hoetmer, A. and Feron, V.J. 1986. Inhalation
toxicity of acetaldehyde in rats. III. Carcinogenicity study. Toxicology 41: 213-232. Cited in: Cal EPA, 2011 and Environment Canada and Health Canada, 2000.

Air Quality Study At Toronto Pearson International Airport – Human Health Risk Assessment August 2015 Intrinsik Environmental Sciences Inc. – Project #20-21515 Page A-20
A-2.1.7 Acetone Table A-7 presents the inhalation toxicity reference values considered as part of the current assessment. 1-Hour Acute Inhalation The 1-hour acute inhalation limit of 26,000 µg/m³ proposed by TCEQ (2013) was selected for the use in this assessment. TCEQ (2013) derived an acute 1-hour ReV based on a study conducted by Dick et al. (1989). During this study, a total of 137 volunteers were tested for neurobehavioral performance before, during, and after a 4-hour exposure to acetone at 237 ppm, methyl ethyl ketone at 186 ppm, acetone at 115 ppm with MEK at 88 ppm, or a placebo. The exposure day was divided into four test periods lasting 2 hours each. The average exposure of 227 ppm for the first 2 hours of exposure was conservatively considered to be the LOAEL for mild neurobehavioral effects. An uncertainty factor of 10 was applied to account for potential intra-species human variability in the absence of human data in potentially sensitive sub-populations or animal data particularly relevant to potential age-dependent sensitivity. An uncertainty factor of 2 was applied for the adjustment from a LOAEL to a NOAEL because the neurobehavioral key study LOAEL (227 ppm) is relatively close to the neurobehavioral NOAEL (100 ppm) from a supporting study (Matsushita et al., 1969). An uncertainty factor of 1 was applied to account for the conversion of animal data to human data because the overall acute toxicological database for acetone is high based on data from numerous controlled human and laboratory animal studies which provide a robust database for the evaluation of many relevant endpoints and the identification of critical effects Dick et al (1989). The result was a ReV of 26,000 µg/m3. This value was selected for use in the assessment as it was the most scientifically defensible TRV for the 1-hour exposure duration. 24-Hour Acute Inhalation The MOE (2012) has developed a 24-hour AAQC of 11,880 µg/m³ for acetone based on health considerations. While no scientific basis is provided for this limit, this value was selected for use in the assessment it was the only appropriate TRV identified. Chronic Inhalation – Non-Carcinogenic The chronic inhalation exposure limit of 16,000 µg/m3 proposed by TCEQ (2013) was selected for use in the assessment. TCEQ (2013) derived a chronic inhalation exposure limit based on a study by Satoh et al (1996). The purpose of this study was to examine neurotoxic effects of acetone in male workers at three acetate fiber plants with an average exposure duration of 14.9 years. Exposed workers were classified into three categories based on breathing zone air concentrations: highly exposed (> 500 ppm), moderately exposed (250-500 ppm), and less exposed (< 250 ppm). The study showed that those workers moderately-exposed (250-500 ppm) to acetone had twice the prevalence of “heavy feeling in the head” when compared to the control group. This symptom was also three times as prevalent in workers who were highly exposed to acetone compared to the controls group. As a result, the midpoint of the moderately-exposed group (375 ppm) was considered an appropriate LOAEL for neurological effects (e.g., heavy feelings in the head, faint feelings, nausea). Since the LOAEL of 375 ppm was based on an occupational study, the LOAEL was converted by TCEQ (2013) into an environmental exposure level suitable protective of the general population. In order to do so, 375 ppm adjusted to account for differences in occupational and non-occupational ventilation rates and occupational weekly exposure frequencies (Satoh et al, 1996). This resulted in an environmental exposure level of 133.9 ppm.

Air Quality Study At Toronto Pearson International Airport – Human Health Risk Assessment August 2015 Intrinsik Environmental Sciences Inc. – Project #20-21515 Page A-21
An uncertainty factor of 10 was applied to the environmental exposure level to account for potential intra-species human variability in the absence of human data in potentially sensitive sub-populations or animal data particularly relevant to potential age-dependent sensitivity. An uncertainty factor of 2 was applied for the adjustment from a LOAEL to a NOAEL since the application of this uncertainty factor to the LOAEL of 375 ppm to estimate a NOAEL would result in a concentration within the range of the moderately exposed (250-500 ppm) workers who did not show neurological symptoms (Satoh et al, 1996). This resulted in a final ReV of 16,000 µg/m3. This value was selected for use in the assessment as it was the most conservative TRV. Chronic Inhalation – Carcinogenic Acetone was not evaluated as a carcinogen via the inhalation route.
Table A-7 Inhalation Toxicity Reference Values
Type Duration Valuea Critical Effect Reference Point of
Departure UF Source Derived
ReV; 1-hour Acute 26,000
Primarily neurobehavioral
effects, secondarily
sensory irritation (humans)
Dick et al.
1989
LOAEL (ADJ):
227 ppm 20
TCEQ, 2013
NA
MRL; 4-hour Acute 62,000 Neurobehavioral effects (human)
Dick et al.
1989 LOAEL of 237 ppm
9 ATSDR,
1994 1994
AAQO; 1-hour
Acute 5,900 - - - - ESRD, 2013
-
AAQC; 24-hour
Acute 11,880
Eye, throat and nasal irritation
and neurological effects (human)
- - - MOE, 2012
-
ReV Chronic 16,000 Neurotoxic
effects (human) Satoh et al. 1996
LOAEL (HEC):
133.9 ppm 20
TCEQ, 2013
NA
MRL Chronic 31,000 Neurological
effects
Stewart et al. 1975
LOAEL of 1,250 ppm
100 ATSDR,
1994 1994
Shaded exposure limits were selected as toxicological reference values for the current risk assessment. a Units of µg/m3 unless otherwise noted.
References ATSDR. 1994. Toxicological Profile for Acetone. US Department of Health and Human
Services, Public Health Service, Agency for Toxic Substances and Disease Registry. May 1994. http://www.atsdr.cdc.gov/toxprofiles/tp21.pdf
Dick, R.B., Setzer, J.V., Taylor, B.J. and Shukla, R, et al. 1989. Neurobehavioral effects of short
duration exposures to acetone and methyl ethyl ketone. Br J Ind Med 46: 1 1 l111-1 121. Cited in: ATSDR, 1994 and TCEQ, 2013.
ESRD. 2013. Alberta Ambient Air Quality Objectives and Guidelines. Air Policy Branch.
Environment and Sustainable Resource Development. ISBN: 978-1-4601-0758-4. Issued February 2013. Available at: http://environment.gov.ab.ca/info/library/5726.pdf

Air Quality Study At Toronto Pearson International Airport – Human Health Risk Assessment August 2015 Intrinsik Environmental Sciences Inc. – Project #20-21515 Page A-22
Matsushita T., Yoshimune, A., Inoue, T., Yamaka, S., and Suzuki, H. 1969. Experimental studies for determining the MAC value of acetone. II. Biological reactions in the "six-day exposure" to acetone. (translated English version). Sangyo Igaku 11, 507-511. Cited in: TCEQ, 2013.
MOE. 2011. Rationale for the Development of Soil and Ground Water Standards for use at
Contaminated Sites in Ontario. Standards Development Branch, Ontario Ministry of the Environment. PIBS 7386e01.
MOE. 2012. Summary of Standards and Guidelines to Support Ontario Regulation 419/05 - Air
Pollution – Local Air Quality (including Schedule 6 of O. Reg. 419/05 on Upper Risk Thresholds) (sorted by Chemical Name). Standards Development Branch, Ontario Ministry of the Environment. PIBS # 6569e01. April 2012.
Satoh, T., Omae, K., Nakashima, H., Takebayashi, T., Matsumura, H., Kawai, T., et al. 1996.
Relationship between acetone exposure concentration and health effects in acetate fiber plant workers. [Comparative Study Research Support, Non-U.S. Gov't]. Int Arch Occup Environ Health, 68(3), 147-153. Cited in: TCEQ, 2013.
Stewart, R.D., Hake, C.L., Wu, A., et al. 1975. Acetone: Development of a biologic standard for
the industrial worker by breath analysis. Cincinnati, OH: National Institute for Occupational Safety and Health. NTIS PB82-172917. Cited in: ATSDR, 1994.
TCEQ. 2013. Acetone, Development Support Document. Texas Commission on Environmental
Quality. December 18, 2013. Available at: http://www.tceq.com/assets/public/implementation/tox/dsd/final/dec13/acetone.pdf

Air Quality Study At Toronto Pearson International Airport – Human Health Risk Assessment August 2015 Intrinsik Environmental Sciences Inc. – Project #20-21515 Page A-23
A-2.1.8 Acrolein and related, as acrolein Table A-8 presents the inhalation toxicity reference values considered as part of the current assessment. 1-Hour Acute Inhalation The 1-hour acute inhalation exposure limit of 2.5 µg/m³ proposed by Cal EPA (2008) was selected for use in this assessment. Cal EPA (2008) has derived a 1-hour acute REL of 2.5 µg/m³ based on the geometric mean of two acute REL values developed from two acute exposure studies employing human subjects: Darley et al. (1960) and Weber-Tschopp et al. (1977). Darley et al. (1960) exposed 36 healthy people to 0, 0.06, 1.3 to 1.6, or 2.0 to 2.3 ppm acrolein for 5 minutes. Acrolein was dissolved in water and administered via face masks equipped with respirators such that only the eyes were exposed to acrolein. Subjects rated the degree of eye irritation every 30 seconds during exposure. A LOAEL of 0.06 ppm (~0.14 mg/m³) was identified. A cumulative uncertainty factor of 60 was applied to the LOAEL (6 for the use of a LOAEL instead of a NOAEL for a relatively mild adverse effect and 10 to account for intraspecies variability to protect against the exacerbation of asthma in children). The result was an acute 1-hour REL of 2.3 µg/m³. In addition to Darley et al (1960), Weber-Tschopp et al. (1977) was also considered in the selection of the 1-hour inhalation exposure limit. In this study, healthy human volunteers were exposed to increasing concentrations of acrolein. 31 men and 22 women were exposed to increasing acrolein levels ranging from 0 to 0.60 ppm for 40 min, while 21 men and 25 women were exposed to a constant acrolein level of 0.3 ppm for 60 min. Significant ocular irritation was first reported at 0.07 ppm, which was considered the LOAEL. Similar uncertainty and adjustment factors as Darley et al (1960) were applied to produce an acute REL of 2.7 µg/m³. Both Darley et al (1960) and Weber-Tschopp et al. (1977) found similar effect levels for sensory irritation resulting in similar estimates for the acute REL. Therefore, Cal EPA (2008) took the geometric mean of the REL values from these two studies to derive an acute REL of 2.5 µg/m³. MOE (2012) produced a 1-hour AAQC of 4.5 µg/m³ based on the study by Darley et al (1960) described above. MOE (2012) determined that irritation occurred at an acrolein concentration of 137 μg/m3, which was used as the LOAEL. A cumulative uncertainty factor of 30 was applied to the selected LOAEL of 137 µg/m3. An uncertainty factor of 10 for intra-species variability was applied to protect the potential sensitive individuals within the population. An uncertainty factor of 3 was also applied to account for extrapolating from a LOAEL to a NOAEL, which was considered sufficient since the irritation effects observed were mild in nature. The result was a 1-hour acute AAQC of 4.5 µg/m3. The Cal EPA (2008) value was selected for use in the current assessment as it was the most conservative TRV available. 24-Hour Acute Inhalation MOE (2012) produced a 24-hour AAQC of 0.4 µg/m³ for acrolein based on a study by Dorman et al. (2008). In this study, F344 rats were exposed by inhalation to 0, 46, 137, 458, 1,374 and 4,122 µg/m3 of acrolein for 6 hours per day, 5 days per week, for up to 65 exposure days. Respiratory tract histopathology was evaluated after 4, 14, 30 and 65 days of exposure. Acrolein exposure was also associated with inflammation, hyperplasia, and squamous cell metaplasia of the respiratory epithelium. For histological changes to the respiratory epithelium, a

Air Quality Study At Toronto Pearson International Airport – Human Health Risk Assessment August 2015 Intrinsik Environmental Sciences Inc. – Project #20-21515 Page A-24
NOAEL of 0.2 ppm was established. The NOAEL of 0.2 ppm was converted to account for continuous exposure from an exposure period of 6 hours/day, 5 days/week, and multiplied by the regional gas:dose ratio of 0.14 to adjust the NOAEL to a human equivalent concentration (HEC) of 11 µg/m3. A cumulative uncertainty factor of 30 was applied to the selected NOAELHEC of 11 µg/m3. An uncertainty factor of 10 for inter-species variability was applied to protect sensitive individuals within the population. An uncertainty factor of 3 to account for interspecies extrapolation was applied to account for uncertainty between species in regards to pharmacodynamics. The result was an 24-hour acute AAQC of 0.4 µg/m3. The MOE (2012) value was selected for use in the current assessment as it was the only TRV available. Chronic Inhalation – Non-Carcinogenic The chronic inhalation exposure limit of 0.02 µg/m3 proposed by the US EPA IRIS (2003) was selected for use in the current assessment. The US EPA (2003) derived an inhalation RfC of 0.02 µg/m³ based on nasal lesions observed in a subchronic rat inhalation study conducted by Feron et al. (1978). US EPA IRIS (2003) identified a LOAEL of 0.4 ppm (0.9 mg/m³) and adjusted the LOAEL for continuous exposure (i.e., 6/24 hours × 5/7 days), resulting in a LOAELADJ of 0.16 mg/m³. In addition, the US EPA (2003) calculated the LOAELHEC using the RGDR approach, where the duration-adjusted LOAEL for the rat was then multiplied by the RGDRET to yield a LOAELHEC of 0.02 mg/m³. The US EPA IRIS (2003) applied an uncertainty factor of 1,000 to the LOAELHEC to account for extrapolation from rats to humans (3), intraspecies variability (10), adjustment from a subchronic to chronic study (10), and use of a minimal LOAEL (3). An uncertainty factor of 3 was used for interspecies variability because dosimetric adjustments were already made through the use of the RGDR methodology. Chronic Inhalation – Carcinogenic Acrolein was not evaluated as a carcinogen via the inhalation route.
Table A-8 Inhalation Toxicity Reference Values
Type Duration Valuea Critical Effect Reference Point of
Departure UF Source
Date Derived
ReV; 1-hour
Acute 11
Nasal/throat irritation, reduced
respiratory rate
Weber-Tschopp et
al. 1977
LOAEL: 0.3 ppm
(690 µg/m3) 63
TCEQ, 2014
2010
MRL; 1-hour
Acute 6.9
Nasal/throat irritation, reduced
respiratory rate
Weber-Tschopp et
al. 1977
LOAEL: 0.3 ppm
(690 µg/m3) 100
ATSDR, 2007
2007
REL; 1-hour
Acute 2.5 Eye irritation
Darley et al. 1960; Weber-
Tschopp et al. 1977
LOAEL: 0.06 ppm (~0.14
mg/m³) 60
Cal EPA, 2008
NA
AAQC; 1-hour
Acute 4.5 Eye irritation Darley et al. 1960
LOAEL: 137 μg/m3
30 MOE, 2012
2009
AAQC; 24-hour
Acute 0.4 Development of
lesions in the upper airways
Dorman et al. 2008
NOAEL: 0.2 ppm
(~458 μg/m3) 30
MOE, 2012
2009
ReV Chronic 2.7
Nasal epithelial hyperplasia and
squamous metaplasia
Dorman et al. 2008
NOAELHEC: 0.0357 ppm (~81 µg/m³)
30 TCEQ, 2014
2010

Air Quality Study At Toronto Pearson International Airport – Human Health Risk Assessment August 2015 Intrinsik Environmental Sciences Inc. – Project #20-21515 Page A-25
Table A-8 Inhalation Toxicity Reference Values
Type Duration Valuea Critical Effect Reference Point of
Departure UF Source
Date Derived
TC Chronic 0.4
5% increase in non-neoplastic lesions in the
nasal respiratory epithelium of
rats
Cassee et al., 1996
35 µg/m³ 100 Health
Canada, 2004
2004
REL Chronic 0.35 Nasal lesions Dorman et
al. 2008
NOAELHEC: 0.03 ppm (70 µg/m³)
200 Cal
EPA, 2008
NA
RfC Chronic 0.02 Nasal lesions Feron et al.
1978 LOAELHEC: 20 µg/m³
1,000 US EPA
IRIS, 2003
2003
Shaded exposure limits were selected as toxicological reference values for the current risk assessment. a Units of µg/m3 unless otherwise noted.
References ATSDR. 2007. Toxicological Profile for Acrolein. US Department of Health and Human Services,
Public Health Service, Agency for Toxic Substances and Disease Registry. August 2007. Available at: http://www.atsdr.cdc.gov/toxprofiles/tp124.pdf
Cal EPA. 2008. TSD for Noncancer RELs. Appendix D. Individual acute, 8 hour, and chronic
reference exposure levels. December 2008. California Environmental Protection Agency, Office of Environmental Health Hazard Assessment. Available at: http://www.oehha.ca.gov/air/hot_spots/2008/AppendixD2_final.pdf
Cassee, F., Groten, J. and Feron, V. 1996. Changes in the nasal epithelium of rats exposed by
inhalation to mixtures of formaldehyde, acetaldehyde and acrolein. Fundamentals of Applied Toxicology 29: 208-218. Cited in: Health Canada, 2004
Darley, E., Middleton, J. and Garber, M. 1960. Plant damage and eye irritation from
ozone-hydrocarbon reactions. Journal of Agriculture and Food Chemistry 8(6): 483-484. Cited in: Cal EPA, 2008 and MOE, 2012.
Dorman, D.C., Struve, M.F., Wong, B.A., Marshall, M.W., Gross, E.A. and Wilson, G.A. 2008.
Respiratory tract response in male rats following subchronic acrolein inhalation. Inhalation Toxicology 20:205-216. Cited in: TCEQ, 2014,Cal EPA, 2008 and MOE, 2012.
Feron, V.J., Kryusse, A., Till, H.P. and Immel, H.R. 1978. Repeated exposure to acrolein
vapour: subacute studies in hamsters, rats and rabbits. Toxicology 9: 47-57. Cited in: US EPA IRIS, 2003
Health Canada. 2004. Health-based Guidance Values for Substances on the Second Priority
Substances List. ISBN 0-662-37275-1. MOE. 2012. Ontario’s Ambient Air Quality Criteria (AAQCs). Standards Development Branch.
Ontario Ministry of the Environment. Available at: http://www.ene.gov.on.ca/stdprodconsume/groups/lr/@ene/@resources/documents/resource/std01_079182.pdf

Air Quality Study At Toronto Pearson International Airport – Human Health Risk Assessment August 2015 Intrinsik Environmental Sciences Inc. – Project #20-21515 Page A-26
TCEQ. 2014. Acrolein, Development Support Document Office of Executive Director. Texas Commission on Environmental Quality. March 2014. Available at: http://www.tceq.com/assets/public/implementation/tox/dsd/final/mar2014/acrolein_107-02-8_revised.pdf
US EPA IRIS. 2003. Acrolein (CASRN 107-02-8). Chronic Health Hazard Assessments for
Noncarcinogenic Effects. United States Environmental Protection Agency Integrated Risk Information System. Available at: http://www.epa.gov/iris/subst/0364.htm#refinhal
Weber-Tschopp. A., Fischer, T., Gierer, R. and Grandjean, E. 1977. Experimentally induced
irritating effects of acrolein on men. Int. Arch Occup Environ Health 40(2):117-130. Cited in: TCEQ, 2014, Cal EPA, 2008, and ATSDR, 2007

Air Quality Study At Toronto Pearson International Airport – Human Health Risk Assessment August 2015 Intrinsik Environmental Sciences Inc. – Project #20-21515 Page A-27
A-2.1.9 Aldehydes (other), as propionaldehyde Table A-9 presents the inhalation toxicity reference values considered as part of the current assessment. 1-Hour Acute Inhalation The draft 1-hour acute inhalation exposure limit of 1,800 µg/m³ derived by TCEQ (2014) was selected for the use in this assessment. TCEQ derived the draft acute ReV based on a study by Sim and Pattle (1957). In this study, 12 healthy males between the ages of 18 and 45 were exposed once to 134 ppm propionaldehyde for 30 minutes. The study showed that the single exposure caused mild irritation to mucosal surfaces and occasional comments regarding the odor of the substance. Subjects were allowed to smoke throughout the exposure and propionaldehyde is found in cigarette smoke. As a result, the results of the study are somewhat uncertain. The concentration of 134 ppm (318,920 µg/m3) was considered a free-standing LOAEL. A cumulative uncertainty factor of 180 was applied to the LOAEL of 134 ppm for irritation. An uncertainty factor of 10 was applied to account for human variation because the key study did not include sensitive subpopulations. An uncertainty factor of 3 was applied to account for the use of a LOAEL in the absence of an available NOAEL. An uncertainty factor 6 was applied because the quality of the key study is considered moderate to low and the confidence in the database is moderate. This resulted in a draft acute ReV of 1,800 µg/m³ (0.744 ppm). 24-Hour Acute Inhalation A suitable 24-hour acute inhalation TRV for propionaldehyde was not available for use in the assessment. Chronic Inhalation – Non-Carcinogenic US EPA (2012) has derived an RfC of 8 µg/m³ for propionaldehyde that was selected for use in the assessment. In the key study by Union Carbide (1993), male and female CD rats were exposed to 0, 150, 750 or 1,500 ppm (0, 356, 1,785, or 3,750 mg/m³) propionaldehyde via inhalation for 6 hours/day, 7 days/week during a 2-week pre-mating period and during a 14-day mating phase. Mated females were exposed daily from gestational days 1 to 20, for a minimum of 35 days to a maximum of 48 days. Offspring were not exposed to propionaldehyde. Males were exposed for a total of 52 times and were sacrificed in week 7. No biologically and statistically significant effects on any reproductive or development endpoints were observed. At the 150, 750, and 1,500 ppm exposure concentrations vacuolization and atrophy of the olfactory epithelium was observed, primarily in the dorsal anterior two sections of both male and female rats. One male in the 750 ppm group and two males in the 1,500 ppm group presented squamous metaplasia of the respiratory epithelium. Mild to moderate rhinitis was observed in rats exposed to 750 and 1,500 ppm. The study LOAEL was determined to be 150 ppm for atrophy of the olfactory epithelium. Benchmark-dose modelling was completed on the observed data for vacuolization and atrophy of the olfactory epithelium, as it was determined that these effects were the most biologically relevant (US EPA IRIS, 2012). As a result, US EPA IRIS (2012) identified a BMC10 of 150 ppm (366 mg/m³) and a BMCL10 of 54 ppm (128 mg/m³). The BMCL10 was selected based on the minimal degree of atrophy observed at the lowest exposure concentration. The BMCL10 was adjusted for continuous exposure and using the RGDR approach (US EPA 1994) to derive at a BMCLHEC of 3.4 ppm (8 mg/m³). A cumulative uncertainty factor of 1,000 was applied to the BMCLHEC of 3.4 ppm (8 mg/m³). An uncertainty factor of 3 (101/2) for interspecies variation was applied to account for animal to

Air Quality Study At Toronto Pearson International Airport – Human Health Risk Assessment August 2015 Intrinsik Environmental Sciences Inc. – Project #20-21515 Page A-28
human extrapolation. An uncertainty factor of 10 was applied for intraspecies uncertainty to account for human variability and sensitive subpopulations. An uncertainty factor of 10 was applied to account for adjustment from subchronic to chronic duration. An uncertainty factor of 3 (101/2) was applied to account for database deficiencies. The resulting value was an RfC of 8 µg/m3. This value was selected for use in the assessment as it was the only suitable TRV available. Chronic Inhalation – Carcinogenic Propionaldehyde was not evaluated as a carcinogen via the inhalation route.
Table A-9 Inhalation Toxicity Reference Values
Type Duration Value a Critical Effect
Reference Point of
Departure UF Source
Date Derived
ReV: 1-hour
Acute 1,800
Irritation of mucosal surfaces (human)
Sim and Pattle, 1957
LOAEL: 134 ppm
(318,920 µg/m3) 180
TCEQ, 2014
(Draft) 2014
RfC Chronic 8
Atrophy of olfactory
epithelium (rat)
Union Carbide,
1993
BMCL10 (HEC): (8 mg/m3)
8,000 µg/m3 1,000
US EPA, 2012
2008
Shaded exposure limits were selected as toxicological reference values for the current risk assessment. a Units of µg/m3 unless otherwise noted.
References Sim, V.M. and Pattle, R.W. 1957. Effect of possible smog irritants on human subjects. JAMA 165(15):
1908-13. Cited in: TCEQ, 2014 TCEQ. 2012. Final Development Support Documents (DSDs). Texas Commission on Environmental
Quality. Available at: http://www.tceq.state.tx.us/implementation/tox/dsd/final.html Union Carbide. 1993 Propionaldehyde: combined repeated-exposure and reproductive/developmental
toxicity study in rats with cover letter dated 041493. Submitted under TSCA Section 8D; EPA Document No. 86-930000198; NTIS No. OTS0538178. (available by email from the IRIS Hotline at [email protected]). Cited in: US EPA IRIS, 2012.
US EPA. 1994. Methods for derivation of inhalation reference concentrations and application of inhalation
dosimetry. Environmental Criteria and Assessment Office, Office of Health and Environmental Assessment, Cincinnati, OH; EPA/600/8-90/066F. Cited in: US EPA IRIS, 2012.
US EPA IRIS. 2012. Propionaldehyde (CASRN 123-38-6): Chronic Health Hazard Assessments for
Noncarcinogenic Effects. US Environmental Protection Agency Integrated Risk Information System.Available at: http://cfpub.epa.gov/ncea/iris/index.cfm?fuseaction=iris.showSubstanceList&list_type=alpha&view

Air Quality Study At Toronto Pearson International Airport – Human Health Risk Assessment August 2015 Intrinsik Environmental Sciences Inc. – Project #20-21515 Page A-29
A-2.1.10 Aliphatic alcohols, as methyl alcohol Table A-10 presents the inhalation toxicity reference values considered as part of the current assessment. 1-Hour Acute Inhalation The 1-hour acute inhalation exposure limit of 13,000 µg/m³ proposed by TCEQ (2014) was selected for the use in this assessment. TCEQ (2014) derived an acute 1-hour ReV of 13,000 µg/m3 based on a study conducted by Mann et al. (2002). In this study, 12 healthy non-smoking male volunteers were exposed to both 20 ppm (control) and 200 ppm of methanol for 4 hours. Proinflammatory mediators, such as interleukin and prostaglandin, as well as mucociliary clearance parameters such as the saccharin transport time (STT) and the ciliary beat frequency (CBF) were measured in nasal secretions. The median concentrations of cytokines involved in nasal epithelial inflammatory reactions were significantly higher after the 200 ppm exposure versus the 20 ppm exposure. TCEQ (2014) derived a LOEL of 203.5 ppm for subclinical nasal inflammatory reactions from this study. Since the subclinical nasal effects were minimal, the level of 203.5 ppm was more appropriately considered a free-standing NOAEL. TCEQ (2014) applied a cumulative uncertainty factor of 20 to the NOAEL of 203.5 ppm. An uncertainty factor of 10 was applied to account for intraspecies variability. An uncertainty factor of 2 for database sufficiency was applied because the quality of the Mann et al. (2002) study is considered medium; however, the confidence in the acute database is medium to high. The resulting acute 1-hr ReV was 10 ppm or 13,000 µg/m3. This value was selected for use in the assessment as it was the most conservative TRV available. 24-Hour Acute Inhalation The 24-hour acute inhalation exposure limit of 4,000 µg/m³ proposed by MOE (2012) was selected for the use in this assessment. MOE (2012) has proposed a 24-hour AAQC of 4,000 µg/m3 that was originally derived by Cal EPA (2000) based on a study conducted by Rogers et al. (1993). In this study, pregnant mice were exposed to methanol vapors at concentrations ranging from 1,000 ppm to 15,000 ppm (1,310 mg/m3 to 19,650 mg/m3) for 7 hours per day, on days 6-15 of gestation. Significant increases in the incidence of exencephaly and cleft palate were observed at 6,550 mg/m3 and higher. A dose-related increase in the number of fetuses per litter with cervical ribs was observed at 2,620 mg/m3 and above. A NOAEL of 1,310 mg/m3 was determined for the pregnant mice. Cal EPA (2000) converted the discontinuous daily exposure of 7 hours to a continuous (24-hour) daily exposure. A conversion factor was then applied to the NOAEL for a human equivalency concentration as well as a cumulative uncertainty factor of 30. An uncertainty factor of 3 was applied to account for interspecies variability and 10 was applied to account for intraspecies variability. This resulted in a chronic inhalation REL of 4,000 µg/m3. MOE (2012) did not adjust the chronic inhalation REL derived by Cal EPA (2000) for the purposes of deriving a 24-hour AAQC. This value was selected for use in the assessment as it was the only suitable TRV identified. Chronic Inhalation – Non-Carcinogenic The chronic inhalation exposure limit of 4,000 µg/m3 proposed by Cal EPA (2000) was selected for use in this assessment. Cal EPA proposed a chronic REL of 4,000 µg/m3 based on the previously described study conducted by Rogers et al. (1993). This value was selected for use in the assessment as it was the most conservative TRV identified.

Air Quality Study At Toronto Pearson International Airport – Human Health Risk Assessment August 2015 Intrinsik Environmental Sciences Inc. – Project #20-21515 Page A-30
Chronic Inhalation – Carcinogenic Methyl alcohol was not evaluated as a carcinogen via the inhalation route.
Table A-10 Inhalation Toxicity Reference Values
Type Duration Valuea Critical Effect Reference Point of
Departure UF Source
Date Derived
ReV: 1-hour
Acute 13,000
No clinical signs of irritation (human)
Mann et al.
(2002)
Free standing NOAEL:
203.5 ppm (~270,000
µg/m3)
20 TCEQ, 2014
NA
REL: 1-hour
Acute 28,000
subtle impairment in
the performance of
complicated tasks (human)
Cook et al., 1991
Extrapolated 1-hour
concentration:
214 ppm (~280,000
µg/m3)
10 Cal
EPA, 2000
2000
REL: 24-hour
Acute 4,000 Developmental abnormalities
(mouse)
Rogers et al. 1993
BMC05: 89 ppm
(~120,000 µg/m3)
30 MOE, 2012
2000
REL Chronic 4,000 Developmental abnormalities
(mouse)
Rogers et al. 1993
BMC05: 89 ppm
(~120,000 µg/m3)
30 Cal
EPA, 2000
2000
RfC Chronic 20,000
Reduced brain weight in pups at 6 weeks of
age (rat)
NEDO, 1987
PODInternal: 858 mg-hr/L
100 US
EPA, 2013
NA
Shaded exposure limits were selected as toxicological reference values for the current risk assessment. NA Information was not available. a Units of µg/m3 unless otherwise noted.
References Cal EPA. 2000. Determination of Noncancer Chronic Reference Exposure Levels. Chronic
Toxicity Summary. Methanol. California Environmental Protection Agency. April, 2000. Available at: http://oehha.ca.gov/air/hot_spots/2008/AppendixD3_final.pdf#page=354
Cook MR, Bergman FJ, Cohen HD, Gerkovich MM, Graham C, Harris RK. Effects of methanol
vapor on human neurobehavioral measures. Health Effects Institute (HEI) Research Report No. 42. Cambridge (MA): HEI; 1991. Cited in: Cal EPA, 2000.
Mann WJ, A Muttray, D Schaefer et al. 2002. Exposure to 200 ppm of methanol increases the
concentrations of interleukin-1beta and interleukin-8 in nasal secretions of healthy volunteers. Ann Otol Rhinol Laryngol, 111, 633-638. Cited in: TCEQ, 2014.
MOE. 2012. Ontario’s Ambient Air Quality Criteria (AAQCs). Standards Development Branch.
Ontario Ministry of the Environment. Available at: http://www.ene.gov.on.ca/stdprodconsume/groups/lr/@ene/@resources/documents/resource/std01_079182.pdf
NEDO. 1987. Toxicological research of methanol as a fuel for power station: summary report on
tests with monkeys, rats and mice. New Energy Development Organization. Tokyo, Japan. Cited in: US EPA IRIS, 2013

Air Quality Study At Toronto Pearson International Airport – Human Health Risk Assessment August 2015 Intrinsik Environmental Sciences Inc. – Project #20-21515 Page A-31
Rogers JM, Mole ML, Chernoff N, Barbee BD, Turner CI, Logsdon TR, and Kavlock JV. 1993.
The developmental toxicity of inhaled methanol in the CD-1 mouse, with quantitative dose response modeling for estimation of benchmark doses. Teratology 47:175-188.Cited in: MOE, 2012 and Cal EPA, 2000.
TCEQ. 2014. Methanol. (CASRN: 67-56-1), Development Support Document. Texas
Commission on Environmental Quality. March, 2014. Available at: https://www.tceq.texas.gov/assets/public/implementation/tox/dsd/final/mar2014/methanol_67-56-1.pdf
US EPA IRIS. 2013. Methanol (CASRN: 67-56-1). Reference Concentration (Rfc) For Chronic
Inhalation Exposure. US Environmental Protection Agency Integrated Risk Information System. Available at: http://www.epa.gov/iris/subst/0305.htm#refinhal

Air Quality Study At Toronto Pearson International Airport – Human Health Risk Assessment August 2015 Intrinsik Environmental Sciences Inc. – Project #20-21515 Page A-32
A-2.1.11 Alkanes/alkenes (other C1-C4) Table A-11 presents the inhalation toxicity reference value considered as part of the current assessment. 1-Hour Acute Inhalation The 1-hour acute inhalation exposure limit for 2-butene proposed by TCEQ (2014) was selected for the use in the assessment as a surrogate for the aliphatic C1-C4 group. TCEQ (2014) derived an acute 1-hour ReV of 34,000 µg/m3 based on a study conducted by Waalkens-Brendsen and Arts (1992). In this study, male and female Wistar rats, 12 rats per group, were exposed to concentrations of 0, 2,500, and 5,000 ppm 2-butene for 6 h/day; 7 days/week for 39 to 46 days. Animals were exposed 2 weeks premating, during mating, and during the gestation period up to and including day 19 for females. Pregnant females were allowed to litter normally and to rear pups to day 4 of lactation, when both dams and pups were sacrificed. No mortality or treatment-related clinical signs were observed in F0 animals. Mean male body weight change was statistically significantly lower in the 1st and 4th week of exposure for the 2,500 ppm group and in the 1st week of exposure for the 5,000 ppm group. Female rats showed statistically significantly decreased mean body weight compared to controls at 7 and 14 days of exposure in the 5,000 ppm group and at 14 days from start of exposure in the 2,500 ppm group. The NOAEL was determined to be 2,476 ppm based on the decrease in body weight of female rats at 7 and 14 days of exposure in the 5,000 ppm group. The NOAEL was adjusted from a 6-hour exposure duration to a 1-hour duration using Haber’s Rule (as modified by Ten Berge et al. (1986)). This conversion resulted in a NOAELADJ of 4,499 ppm. A NOAEL (HEC) of 4,499 ppm was then calculated by multiplying the NOAELADJ by a RGDR of 1 (default). A cumulative uncertainty factor of 300 was applied to the NOAEL(HEC) of 4,499 ppm (~10,000,000 µg/m3). A cumulative uncertainty factor of 300 was applied to the NOAEL(HEC). An uncertainty factor of 10 was applied to account for variation in sensitivity among members of the human population. An uncertainty factor of 3 was applied because a default dosimetric adjustment from animal-to-human exposure was conducted, which accounts for toxicokinetic differences but not toxicodynamic differences. An uncertainty factor of 10 for database quality was applied because the quality of the rat study is high and the confidence in the acute database is medium but toxicity data is available for only one species. This resulted in a final 1-hour ReV of 34,000 µg/m3. 24-Hour Acute Inhalation The 24-hour AAQC for propylene of 4,000 µg/m³ derived by MOE (2012) was selected for the use in this assessment as a surrogate for the aliphatic C1-C4 group. MOE (2012) derived the 24-hour AAQC based on a study by Quest et al. (1984). In this study F344/N rats and B6C3F1 mice were exposed to propylene at exposure levels of 8,600 or 17,200 mg/m3 for six hours per day, five days per week for 103 weeks. Squamous metaplasia was observed in female rats; this effect was observed only at the low dose in male rats. Epithelial hyperplasia was also reported in the high exposure group of female rats, and inflammatory changes, characterized by an influx of lymphocytes, macrophages, and granulocytes into the submucosa and granulocytes into the lumen, were seen in males of both dose groups and high concentration females. A LOAEL of 8,605 mg/m3 based on squamous metaplasia, epithelial hyperplasia and nasal inflammation was established from this study. MOE (2012) adjusted the LOAEL for continuous exposure (i.e., 6/24 hours × 5/7 days), resulting in a LOAELADJ of 1,536 mg/m3. In addition, MOE (2012) calculated a LOAELHEC using the RGDR

Air Quality Study At Toronto Pearson International Airport – Human Health Risk Assessment August 2015 Intrinsik Environmental Sciences Inc. – Project #20-21515 Page A-33
approach, where the duration-adjusted LOAEL for the rat was then multiplied by the RGDRET to yield a LOAELHEC of 410 mg/m³. MOE (2012) applied an uncertainty factor of 100 to the LOAELHEC of 410 mg/m³. An uncertainty factor of 3 (101/2) was applied to account for the extrapolation from rats to humans. An uncertainty factor of 10 was applied to account for the intraspecies variability. An uncertainty factor of 3 (101/2) was applied to account for the extrapolation from a LOAEL to a NOAEL. This resulted in a final 24-hour AAQC of 4,000 µg/m³. This value was selected for use in the assessment as it was the only suitable TRV identified. Chronic Inhalation – Non-Carcinogenic The chronic inhalation REL for propylene of 3,000 µg/m3 proposed by the Cal EPA (2008) was selected for the use in this assessment as a surrogate for the aliphatic C1-C4 group. The REL was derived based on the key study by Quest et al. (1984) (as described above). Cal EPA (2008) selected 4,985 ppm (measured concentration, equivalent to 8,570 mg/m³) as a LOAEL, based upon the nasal irritation effects observed in rats. This concentration was adjusted for continuous exposure (6/24 hours × 5/7 days per week) to a LOAELADJ of 890 ppm (approximately 1530 mg/m³). A LOAELHEC was calculated using an RGDR of 0.21 to account for differences in body weight and surface area between rats and humans, resulting in a value of 190 ppm. A cumulative uncertainty factor of 100 was applied to account for interspecies differences (3), intraspecies variability (10) and the use of a minimal LOAEL (3). This resulted in a final chronic REL of 2 ppm or 3,000 µg/m³. This value was selected for use in the assessment as it was the only suitable TRV identified. Chronic Inhalation – Carcinogenic The aliphatic C1-C4 group was not considered a carcinogen via the inhalation route.
Table A-11 Inhalation Toxicity Reference Values
COC Type Duration Valuea Critical Effect
Reference Point of
Departure UF Source
Date Derived
Butene, 2- ReV: 1-hour
Acute 34,000
Decrease body weight in females
(rat)
Waalkens-Brendsen and Arts
1992
NOAEL (HEC):
4,499 ppm (~10,000,000 µg/m3)
300 TCEQ, 2014
2008
Propylene AAQC; 24-hour
Acute 4,000
Changes and
inflammation of nasal mucosa
(mouse and rat)
Quest et al., 1984
LOAELHEC: 410 mg/m³ (410,000 µg/m3)
100 MOE, 2012
2007
Propylene REL Chronic 3,000
Changes and
inflammation of nasal
cavity (rat)
Quest et al., 1984
LOAELHEC: 190 ppm (326,800 µg/m3)
100 Cal
EPA, 2000
2000
Shaded exposure limits were selected as toxicological reference values for the current risk assessment. a Units are µg/m3 unless otherwise noted.
References – Butene, 2- Arts, JHE.1992. TNO Central Institute for Nutrition and Food Research Report-Netherlands
Organization for Applied Scientific Research, Division for Nutrition and Food Research. Cited in: TCEQ, 2014.

Air Quality Study At Toronto Pearson International Airport – Human Health Risk Assessment August 2015 Intrinsik Environmental Sciences Inc. – Project #20-21515 Page A-34
TCEQ. 2014. 2-Butene (Cis and Trans) CASRN: 107-01-7 Cis-2-Butene CASRN: 590-18-1 Trans-2-Butene CASRN: 624-64-6, Development Support Document, Final, March 2014. Texas Commission on Environmental Quality. Toxicology Section, Chief Engineer’s Office, Texas Commission on Environmental Quality. Available at: https://www.tceq.texas.gov/assets/public/implementation/tox/dsd/final/mar2014/butene2_107-01-7_revised.pdf
Ten Berge, WF, A Zwart, LM Appelman. 1986. Concentration-time mortality response
relationship of irritant and systemically acting vapours and gases. J Hazard Mater 13: 301-09. Cited in: TCEQ, 2014.
Waalkens Berendsen, D. and JHE Arts. 1992. TNO Central Institute for Nutrition and Food
Research Report-Netherlands Organization for Applied Scientific Research, Division for Nutrition and Food Research: Cited in: TCEQ, 2014.
References - Propylene
MOE. 2012. Ontario’s Ambient Air Quality Criteria (AAQCs). Standards Development Branch. Ontario Ministry of the Environment. Available at: http://www.ene.gov.on.ca/stdprodconsume/groups/lr/@ene/@resources/documents/resource/std01_079182.pdf
Quest, J.A., Tomaszewski, J.E., Haseman, J.K., Boorman, G.A., Douglas, J.F. and Clarke, W.J. 1984. Two-year inhalation toxicity study of propylene in F344/N rats and B6C3F1 mice. Toxicol Appl Pharmacol 76:288-295. Cited in: MOE, 2012 and Cal EPA, 2008
Cal EPA. 2000. Determination of Noncancer Chronic Reference Exposure Levels. Chronic
Toxicity Summary. Propylene. California Office of Environmental Health Hazard Assessment. Available at: http://www.oehha.ca.gov/air/hot_spots/2008/AppendixD3_final.pdf

Air Quality Study At Toronto Pearson International Airport – Human Health Risk Assessment August 2015 Intrinsik Environmental Sciences Inc. – Project #20-21515 Page A-35
A-2.1.12 Alkanes/alkenes (other C5-C8) Table A-12 presents the inhalation toxicity reference value considered as part of the current assessment. 1-Hour Acute Inhalation Due to their structural similarities, n-pentane was selected as a chemical surrogate in the evaluation of the aliphatic C5-C8 group in the assessment. Therefore, the 1-hour ReV of 200,000 µg/m³ for n-pentane from TCEQ (2011) was selected for use in the assessment of the aliphatic C5-C8 group. In the key study by Lammers et al. (2011), two acute experiments were conducted. In the first experiment, male WAG/RijCHBR rats (8 per group) were exposed to 0, 2,000, 6,500, or 20,000 mg/m³ of n-pentane for 8-hours per day for 3 consecutive days. An assessment of motor activity and neurobehavioural functions was conducted using a standardized functional observational battery of tests. No significant adverse neurological effects were observed in any of the exposure groups. In the second experiment, male WAG/RijCHBR rats (8 per group) were exposed to 0, 2,000, 6,500, or 20,000 mg/m³ n-pentane for 8-hours per day for 3 consecutive days, with tests for cognitive performance being conducted after exposure. Mild, reversible changes in learning performance speed were observed in the two lowest exposure groups, but not in the high exposure group. The TCEQ (2011) identified 20,000 mg/m³ (19,872 mg/m³ average measured concentration) as a free-standing NOAEL. The free-standing NOAEL of 19,872 mg/m3 (6,756 ppm) was identified from both studies and was used as point of departure (PODHEC). A total cumulative uncertainty factor of 90 was applied to the PODHEC of 19,872 mg/m3 (6,756 ppm). An uncertainty factor of 3 was applied for interspecies variability because a default dosimetric adjustment was conducted to account for toxicokinetic differences between animals and humans but not toxicodynamic differences. An uncertainty factor of 10 was applied to account for interspecies variability and an uncertainty factor of 3 was applied to account for an incomplete database. This resulted in a 1-hour ReV of 200,000 µg/m³. 24-Hour Acute Inhalation n-Hexane was used as a surrogate for the assessment of 24-hour acute inhalation exposures to the aliphatic C5-C8 group. A 24-hour acute inhalation exposure limit of 2,500 µg/m³ proposed by MOE (2012) for n-hexane (mixture) was selected for the use in this assessment. MOE (2012) derived an acute 24-hour AAQC of 2,500 µg/m³ based on an epidemiological study by Sanagi et al. (1980). This study examined workers who were exposed to concentrations of n-hexane in a tungsten carbide alloys facility for an average of 6.2 years. Fourteen workers under 50 years of age who were exposed to n-hexane were studied as well as a control group which consisted of 14 workers who were not exposed to n-hexane. The mean concentration of n-hexane, for the 8-hour time-weighted-average exposure period over 2-years, was 204 mg/m3 (58 ppm). Clinical and electro-physiological examinations were performed in this study. In the exposed group, headache, hyperaesthesia in the limbs, muscle weakness, paraesthesia and significant effects on muscle strength and vibration sensation were noted. The mean maximal motor conduction velocities in the posterior tibial nerve were significantly reduced as compared with those in the control group. The mean distal latency of the posterior tibial nerve was significantly increased in the exposed group. These observations were consistent with the n-hexane-induced peripheral neuropathy observed in animals. Based on these observations, a LOAEL of 58 ppm (204 mg/m3) for neurological effects was identified. This LOAEL was based on an 8-hour time-weighted-average for occupational exposure. The LOAEL was then

Air Quality Study At Toronto Pearson International Airport – Human Health Risk Assessment August 2015 Intrinsik Environmental Sciences Inc. – Project #20-21515 Page A-36
converted to continuous exposure in the general population (assuming an occupational minute ventilatory volume of 10 m3/day and a daily minute ventilatory volume of 20 m3/day), which resulted in an adjusted LOAEL of 73 mg/m3. A cumulative uncertainty factor of 30 was applied to the adjusted LOAEL of 73 mg/m3 derived from the Sanagi et al. (1980) study. An uncertainty factor of 10 was applied to account for individual variability within the workers sampled. An uncertainty factor of 3 was applied to account for the potential interaction with other hydrocarbon solvents in commercial n-hexane. This resulted in a final AAQC for n-hexane (mixture) of 2,500 µg/m3. This value was selected for use in the assessment as it was the only appropriate TRV available. A final AAQC for n-hexane of 7,500 ug/m3 was also available for use. MOE (2012) indicated that this AAQC for n-hexane is only appropriate for evaluating n-hexane and hexane isomers, whereas the n-hexane (mixture) AAQC value accounts for the potential interaction of n-hexane with other hydrocarbon solvents. Due to the complex composition of the emissions anticipated, it was determined that the n-hexane (mixture) AAQC was more appropriate for use in the assessment. Chronic Inhalation – Non-Carcinogenic The chronic inhalation exposure limit proposed by CCME (2008) for aliphatic C6-C8 group was selected for use in the assessment. CCME (2008) provides an RfC of 18,400 µg/m³ for the C6-C8 aliphatic group based on the neurotoxic endpoint of commercial hexane. While the selected exposure limit was not intended to include C5 compounds, it was anticipated that the endpoints and concentrations of concern were sufficiently similar for use. The exposure limit recommended by CCME (2008) was adopted from the TPHCWG (1997), which was developed from a NOAEL of 10,307 mg/m³ for two (rat and mice) chronic bioassays involving lifetime exposure. The NOAEL was adjusted for continuous exposure (6/24 hours × 5/7 days) to a concentration of 1,840 mg/m³. The TPHCWG (1997) applied an uncertainty factor of 100 to the NOAEL (ADJ) to account for interspecies variability (10) and intraspecies variability (10). The TPHCWG (1997) recommended using an RfC derived for commercial hexane over an RfC specific to n-hexane as it is more representative of the aliphatic fraction. According to the TPHCWG (1997), using n-hexane alone for the basis of the C6-C8 fraction results in an overestimation of the toxicity of the fraction because n-hexane is the most toxic of the group’s constituents, it is uniquely toxic, and its interaction with other petroleum compounds influences its toxicity. As a result RfC of 18,400 µg/m³ for commercial hexane was used to evaluate the risks associated with the aliphatic C6-C8 group. This value was selected for use in the assessment as it was the only suitable TRV identified for evaluation of the aliphatic C5-C8 group. This value was recommended for use by MOE (2011) for the aliphatic C6-C8 group. Chronic Inhalation – Carcinogenic The aliphatic C5-C8 group was not evaluated as a carcinogen via the inhalation route.

Air Quality Study At Toronto Pearson International Airport – Human Health Risk Assessment August 2015 Intrinsik Environmental Sciences Inc. – Project #20-21515 Page A-37
Table A-12 Inhalation Toxicity Reference Values
COC Type Duration Valuea Critical Effect
Reference Point of
Departure UF Source
Date Derived
Pentane ReV; 1-hour
Acute 200,000
No clinical signs of toxicity
(rat)
Lammers et al., 2011
NOAEL: 19,872 mg/m³
(19,872,000 µg/m3)
90 TCEQ, 2011
2011
n-hexane (mixture)
AAQC: 24-hour
Acute 2,500 Neurological effects (human)
Sanagi et al. 1980
NOAEL (HEC): 73,000 µg/m³
30 MOE 2012
2005
Aliphatic C6-C8 group
RfC Chronic 18,400 Neurological effects
TPHCWG, 1997
NOAELADJ: 1,840 mg/m³
100
MOE, 2011;
CCME, 2008
NA
Shaded exposure limits were selected as toxicological reference values for the current risk assessment. a Units are µg/m3 unless otherwise noted.
References - Pentane Lammers, J.H.C.M., Muijser, H. and Owen, D.E. 2011. Neurobehavioral effects of acute
exposure to normal (n-) paraffins. International Journal of Toxicology 30(1):47-58. Cited in: TCEQ, 2011.
TCEQ. 2011. Pentane, All Isomers (CASRN: n-Pentane: 109-66-0, Isopentane: 78-78-4, Neopentane: 463-82-1. Developmental Support Document, Final, July 29, 2011. Prepared by: Jong-Song Lee, Ph.D. Toxicology Division, Chief Engineer’s Office, Texas Commission on Environmental Quality. Available at: https://www.tceq.texas.gov/assets/public/implementation/tox/dsd/final/july11/pentane.pdf
References – n-Hexane Sanagi, S., Seki, Y., Sugimoto, K. and Hirata, M. 1980. Peripheral nervous system functions of
workers exposed to n-hexane at a low level. Int Arch Occup Environ Health 47:69-79. Cited in: MOE, 2012 and ATSDR, 1999.
MOE. 2012. Ontario’s Ambient Air Quality Criteria (AAQCs). Standards Development Branch.
Ontario Ministry of the Environment. Available at: http://www.ene.gov.on.ca/stdprodconsume/groups/lr/@ene/@resources/documents/resource/std01_079182.pdf
References – Aliphatic C6-C8 Group CCME. 2008. Canada-Wide Standards for Petroleum Hydrocarbons (PHC) in Soil: Scientific
Rationale - Supporting Technical Document. Canadian Council of Ministers of the Environment. January, 2008. ISBN 978-1-896997-77-3.
MOE. 2011. Rationale for the Development of Generic Soil and Groundwater Standards for use
at Contaminated Sites in Ontario. Standards Development Branch, Ontario Ministry of the Environment
TPHCWG. 1997. Vol. 4. Development of Fraction Specific Reference Doses (RfDs) and
Reference Specific Concentrations (RfCs) for Total Petroleum Hydrocarbons (TPH).

Air Quality Study At Toronto Pearson International Airport – Human Health Risk Assessment August 2015 Intrinsik Environmental Sciences Inc. – Project #20-21515 Page A-38
Total Petroleum Hydrocarbon Criteria Working Group. Amherst Scientific Publishers. Amherst, Massachusetts. Cited in: CCME, 2008.

Air Quality Study At Toronto Pearson International Airport – Human Health Risk Assessment August 2015 Intrinsik Environmental Sciences Inc. – Project #20-21515 Page A-39
A-2.1.13 Alkanes/alkenes (other C>8-C10) Table A-13 presents the inhalation toxicity reference value considered as part of the current assessment. 1-Hour Acute Inhalation Decane was used as a surrogate for the assessment of 1-hour acute inhalation exposures to the aliphatic C>8-C10 group. The 1-hour acute inhalation exposure limit proposed by MOE (2012) was selected for the use in the assessment as a surrogate for the aliphatic C>8-C10 group. The MOE (2012) has developed a 1-hour AAQC of 60,000 µg/m³ for decane based on health considerations. While no scientific basis is provided for this limit, this value was selected for use in the assessment it was the only appropriate TRV identified. 24-Hour Acute Inhalation 1-Decene was used as a surrogate for the assessment of 24-hour acute inhalation exposures to the aliphatic C>8-C10 group. The 24-hour acute inhalation exposure limit proposed by MOE (2012) was selected for the use in the assessment as a surrogate for the aliphatic C>8-C10 group. The MOE (2012) has developed a 24-hour AAQC of 60,000 µg/m³ for 1-decene based on health considerations. While no scientific basis is provided for this limit, this value was selected for use in the assessment as it was the only appropriate TRV identified. Chronic Inhalation – Non-Carcinogenic The CCME (2008) recommended an RfC of 1,000 µg/m³ for the aliphatic C>8-C10, which was adopted from the TPHCWG (1997) for the aliphatic C9-C16 group. The RfC is based on the hepatic and hematological effects of de-aromatized petroleum streams and JP-8 Jet Fuel, which together cover the entire range of the fraction. Two separate studies were examined by the TPHCWG (1997). In the study used to derive the RfC (Phillips and Egan 1984), Sprague-Dawley rats were exposed to 0, 300 or 900 ppm (0, 1,742 or 5,226 mg/m³) of C10-C11 isoparaffinic solvent for 6 hours/day, 5 days/week for 12 weeks, with questionable body weight effects occurring at both exposure levels. Mild renal toxicity was observed in males at both exposure concentrations, with some evidence of the effect being dose- and duration-related. Sporadic incidences of hepatic abnormalities also were observed. None of the observed effects were considered significant. As such, the highest concentration (900 ppm or 5,226 mg/m³) was identified as a NOAEL. The NOAEL was adjusted for intermittent exposure (6/24 hours × 5/7 days) to a concentration of 933 mg/m³. An uncertainty factor of 1,000 was applied to the duration-adjusted NOAEL to account for interspecies variability (10), intraspecies variability (10) and use of a subchronic study (10). The result is an RfC of 0.9 mg/m³. A separate experiment was conducted as part of the same study where Sprague-Dawley rats were exposed to 0, 300 or 900 ppm of DAWS vapours for 6 hours/day, 5 days/week for 12 weeks. The study NOAEL of 900 ppm 5,485 mg/m³ was adjusted for intermittent exposure (6/24 hours × 5/7 days) to a concentration of 979 mg/m³. An uncertainty factor of 1,000 was applied to the adjusted NOAEL to account for interspecies variability (10), intraspecies variability (10) and use of a subchronic study (10). From this second experiment, an RfC of 1.0 mg/m³ was calculated. In both the solvent and DAWS exposure studies, renal and hepatic abnormalities were observed. Both Phillips and Egan (1984) and the TPHCWG (1997) debate the biological relevance of the renal and hepatic changes, and declare 900 ppm as the NOAEL rather than a LOAEL. In the second study (Mattie et al. 1991), male and female mice and rats were exposed to JP-8 vapours of 0, 500 or 1,000 mg/m³ continuously for 90 days. This exposure period was followed

Air Quality Study At Toronto Pearson International Airport – Human Health Risk Assessment August 2015 Intrinsik Environmental Sciences Inc. – Project #20-21515 Page A-40
by a 24-month recovery period. A statistically significant increase in basophilic foci was observed in male rats. In female rats, increased splenic haematopoiesis was observed, although not deemed exposure-related. The highest dose level (1,000 mg/m³) was identified by the TPHWCG as the NOAEL. An uncertainty factor of 1,000 was applied to the NOAEL account for interspecies variability (10), intraspecies variability (10) and use of a subchronic study (10) to derive an RfC of 1 mg/m3. TPHCWG (1997) derived an RfC of 1 mg/m3 (1,000 µg/m³), which was adopted by CCME (2008) and subsequently recommended by MOE (2011). This value was selected for use in the assessment as it was the only suitable TRV identified for evaluation of the aliphatic C>8-C10 group. Chronic Inhalation – Carcinogenic The aliphatic C>8-C10 group was not evaluated as a carcinogen via the inhalation route.
Table A-13 Inhalation Toxicity Reference Values
COC Type Duration Valuea Critical Effect
Reference Point of
Departure UF Source
Date Derived
Decane AAQC: 1-hour
Acute 60,000 Health based
- - - MOE, 2012
-
Decene AAQC: 24-hour
Acute 60,000 Health based
- - - MOE, 2012
-
Aliphatic C>8-C10
RfC Chronic 1,000
Hepatic and
hematological
changes
Phillips and Egan 1984 and Mattie et al. 1991
NOAELadj: 1,840 mg/m³
1,000
MOE, 2011;
CCME, 2008
NA
Shaded exposure limits were selected as toxicological reference values for the current risk assessment. NA Information was not available. a Units are µg/m3 unless otherwise noted.
References - Decane MOE. 2012. Summary of Standards and Guidelines to Support Ontario Regulation 419/05 - Air
Pollution – Local Air Quality (including Schedule 6 of O. Reg. 419/05 on Upper Risk Thresholds) (sorted by Chemical Name). Standards Development Branch, Ontario Ministry of the Environment. PIBS # 6569e01. April 2012.
References – 1-Decene MOE. 2012. Summary of Standards and Guidelines to Support Ontario Regulation 419/05 - Air
Pollution – Local Air Quality (including Schedule 6 of O. Reg. 419/05 on Upper Risk Thresholds) (sorted by Chemical Name). Standards Development Branch, Ontario Ministry of the Environment. PIBS # 6569e01. April 2012.
References - aliphatic C>8-C10 group CCME. 2008. Canada-Wide Standards for Petroleum Hydrocarbons (PHC) in Soil: Scientific
Rationale - Supporting Technical Document. Canadian Council of Ministers of the Environment. January, 2008. ISBN 978-1-896997-77-3.

Air Quality Study At Toronto Pearson International Airport – Human Health Risk Assessment August 2015 Intrinsik Environmental Sciences Inc. – Project #20-21515 Page A-41
MOE. 2011. Rationale for the Development of Generic Soil and Groundwater Standards for use at Contaminated Sites in Ontario. Standards Development Branch, Ontario Ministry of the Environment.
TPHCWG. 1997. Vol. 4. Development of Fraction Specific Reference Doses (RfDs) and
Reference Specific Concentrations (RfCs) for Total Petroleum Hydrocarbons (TPH). Total Petroleum Hydrocarbon Criteria Working Group. Amherst Scientific Publishers. Amherst, Massachusetts.
Phillips, R.D. and Egan, G.F. 1984. Subchronic inhalation exposure of dearomatized white spirit
and C10-C11 isoparaffinic hydrocarbon in Sprague-Dawley rats. Fund Appl Toxicol 4:808-818. Cited in: TPHCWG, 1997.
Mattie, D.R., Alden, C.L., Newell, T.K., Gaworski, C.L. and Flemming, C.D. 1991. A 90-day
continuous vapor inhalation toxicity study of JP-8 jet fuel followed by 20 or 21 months of recovery in Fischer 344 rats and C57BL/6 mice. Toxicol Pathol 19(2):77-87. Cited in: TPHCWG, 1997.

Air Quality Study At Toronto Pearson International Airport – Human Health Risk Assessment August 2015 Intrinsik Environmental Sciences Inc. – Project #20-21515 Page A-42
A-2.1.14 Alkanes/alkenes (other C>10-C12) Table A-14 presents the inhalation toxicity reference value considered as part of the current assessment. 1-Hour Acute Inhalation A suitable 1-hour acute inhalation TRV was not available for use in the assessment of the aliphatic C>10-C12 group. 24-Hour Acute Inhalation A suitable 24-hour acute inhalation TRV was not available for use in the assessment of the aliphatic C>10-C12 group. Chronic Inhalation – Non-Carcinogenic The CCME (2008) recommended an RfC of 1,000 µg/m³ for the aliphatic C>10-C12, which was adopted from the TPHCWG (1997) for the aliphatic C9-C16 group. The RfC is based on the hepatic and hematological effects of de-aromatized petroleum streams and JP-8 Jet Fuel, which together cover the entire range of the fraction. Two separate studies were examined by the TPHCWG (1997). In the study used to derive the RfC (Phillips and Egan 1984), Sprague-Dawley rats were exposed to 0, 300 or 900 ppm (0, 1,742 or 5,226 mg/m³) of C10-C11 isoparaffinic solvent for 6 hours/day, 5 days/week for 12 weeks, with questionable body weight effects occurring at both exposure levels. Mild renal toxicity was observed in males at both exposure concentrations, with some evidence of the effect being dose- and duration-related. Sporadic incidences of hepatic abnormalities also were observed. None of the observed effects were considered significant. As such, the highest concentration (900 ppm or 5,226 mg/m³) was identified as a NOAEL. The NOAEL was adjusted for intermittent exposure (6/24 hours × 5/7 days) to a concentration of 933 mg/m³. An uncertainty factor of 1,000 was applied to the duration-adjusted NOAEL to account for interspecies variability (10), intraspecies variability (10) and use of a subchronic study (10). The result is an RfC of 0.9 mg/m³. A separate experiment was conducted as part of the same study where Sprague-Dawley rats were exposed to 0, 300 or 900 ppm of DAWS vapours for 6 hours/day, 5 days/week for 12 weeks. The study NOAEL of 900 ppm 5,485 mg/m³ was adjusted for intermittent exposure (6/24 hours × 5/7 days) to a concentration of 979 mg/m³. An uncertainty factor of 1,000 was applied to the adjusted NOAEL to account for interspecies variability (10), intraspecies variability (10) and use of a subchronic study (10). From this second experiment, an RfC of 1.0 mg/m³ was calculated. In both the solvent and DAWS exposure studies, renal and hepatic abnormalities were observed. Both Phillips and Egan (1984) and the TPHCWG (1997) debate the biological relevance of the renal and hepatic changes, and declare 900 ppm as the NOAEL rather than a LOAEL. In the second study (Mattie et al. 1991), male and female mice and rats were exposed to JP-8 vapours of 0, 500 or 1,000 mg/m³ continuously for 90 days. This exposure period was followed by a 24-month recovery period. A statistically significant increase in basophilic foci was observed in male rats. In female rats, increased splenic haematopoiesis was observed, although not deemed exposure-related. The highest dose level (1,000 mg/m³) was identified by the TPHWCG as the NOAEL. An uncertainty factor of 1,000 was applied to the NOAEL account for interspecies variability (10), intraspecies variability (10) and use of a subchronic study (10) to derive an RfC of 1 mg/m3. TPHCWG (1997) derived an RfC of 1 mg/m3 (1,000 µg/m³), which was adopted by CCME (2008) and subsequently recommended by MOE (2011). This value was selected for use in the

Air Quality Study At Toronto Pearson International Airport – Human Health Risk Assessment August 2015 Intrinsik Environmental Sciences Inc. – Project #20-21515 Page A-43
assessment as it was the only suitable TRV identified for evaluation of the aliphatic C>10-C12 group. Chronic Inhalation – Carcinogenic The aliphatic C>10-C12 group was not evaluated as a carcinogen via the inhalation route.
Table A-14 Inhalation Toxicity Reference Values
Type Duration Valuea Critical Effect Reference Point of
Departure UF Source
Date Derived
RfC Chronic 1,000 Hepatic and
hematological changes
Phillips and Egan 1984 and Mattie et al. 1991
NOAELadj: 1,840 mg/m³
1,000 CCME, 2008
NA
Shaded exposure limits were selected as toxicological reference values for the current risk assessment.
NA Information was not available. a Units are µg/m3 unless otherwise noted.
References CCME. 2008. Canada-Wide Standards for Petroleum Hydrocarbons (PHC) in Soil: Scientific
Rationale - Supporting Technical Document. Canadian Council of Ministers of the Environment. January, 2008. ISBN 978-1-896997-77-3.
MOE. 2011. Rationale for the Development of Generic Soil and Groundwater Standards for use
at Contaminated Sites in Ontario. Standards Development Branch, Ontario Ministry of the Environment.
TPHCWG. 1997. Vol. 4. Development of Fraction Specific Reference Doses (RfDs) and
Reference Specific Concentrations (RfCs) for Total Petroleum Hydrocarbons (TPH). Total Petroleum Hydrocarbon Criteria Working Group. Amherst Scientific Publishers. Amherst, Massachusetts.
Phillips, R.D. and Egan, G.F. 1984. Subchronic inhalation exposure of dearomatized white spirit
and C10-C11 isoparaffinic hydrocarbon in Sprague-Dawley rats. Fund Appl Toxicol 4:808-818. Cited in: TPHCWG, 1997.
Mattie, D.R., Alden, C.L., Newell, T.K., Gaworski, C.L. and Flemming, C.D. 1991. A 90-day
continuous vapor inhalation toxicity study of JP-8 jet fuel followed by 20 or 21 months of recovery in Fischer 344 rats and C57BL/6 mice. Toxicol Pathol 19(2):77-87. Cited in: TPHCWG, 1997.

Air Quality Study At Toronto Pearson International Airport – Human Health Risk Assessment August 2015 Intrinsik Environmental Sciences Inc. – Project #20-21515 Page A-44
A-2.1.15 Alkanes/alkenes (other C>12-C16) Table A-15 presents the inhalation toxicity reference value considered as part of the current assessment. 1-Hour Acute Inhalation A suitable 1-hour acute inhalation TRV was not available for use in the assessment of the aliphatic C>12-C16 group. 24-Hour Acute Inhalation A suitable 24-hour acute inhalation TRV was not available for use in the assessment of the aliphatic C>12-C16 group. Chronic Inhalation – Non-Carcinogenic The CCME (2008) recommended an RfC of 1,000 µg/m³ for the aliphatic C>12-C16, which was adopted from the TPHCWG (1997) for the aliphatic C9-C16 group. The RfC is based on the hepatic and hematological effects of de-aromatized petroleum streams and JP-8 Jet Fuel, which together cover the entire range of the fraction. Two separate studies were examined by the TPHCWG (1997). In the study used to derive the RfC (Phillips and Egan 1984), Sprague-Dawley rats were exposed to 0, 300 or 900 ppm (0, 1,742 or 5,226 mg/m³) of C10-C11 isoparaffinic solvent for 6 hours/day, 5 days/week for 12 weeks, with questionable body weight effects occurring at both exposure levels. Mild renal toxicity was observed in males at both exposure concentrations, with some evidence of the effect being dose- and duration-related. Sporadic incidences of hepatic abnormalities also were observed. None of the observed effects were considered significant. As such, the highest concentration (900 ppm or 5,226 mg/m³) was identified as a NOAEL. The NOAEL was adjusted for intermittent exposure (6/24 hours × 5/7 days) to a concentration of 933 mg/m³. An uncertainty factor of 1,000 was applied to the duration-adjusted NOAEL to account for interspecies variability (10), intraspecies variability (10) and use of a subchronic study (10). The result is an RfC of 0.9 mg/m³. A separate experiment was conducted as part of the same study where Sprague-Dawley rats were exposed to 0, 300 or 900 ppm of DAWS vapours for 6 hours/day, 5 days/week for 12 weeks. The study NOAEL of 900 ppm 5,485 mg/m³ was adjusted for intermittent exposure (6/24 hours × 5/7 days) to a concentration of 979 mg/m³. An uncertainty factor of 1,000 was applied to the adjusted NOAEL to account for interspecies variability (10), intraspecies variability (10) and use of a subchronic study (10). From this second experiment, an RfC of 1.0 mg/m³ was calculated. In both the solvent and DAWS exposure studies, renal and hepatic abnormalities were observed. Both Phillips and Egan (1984) and the TPHCWG (1997) debate the biological relevance of the renal and hepatic changes, and declare 900 ppm as the NOAEL rather than a LOAEL. In the second study (Mattie et al. 1991), male and female mice and rats were exposed to JP-8 vapours of 0, 500 or 1,000 mg/m³ continuously for 90 days. This exposure period was followed by a 24-month recovery period. A statistically significant increase in basophilic foci was observed in male rats. In female rats, increased splenic haematopoiesis was observed, although not deemed exposure-related. The highest dose level (1,000 mg/m³) was identified by the TPHWCG as the NOAEL. An uncertainty factor of 1,000 was applied to the NOAEL account for interspecies variability (10), intraspecies variability (10) and use of a subchronic study (10) to derive an RfC of 1 mg/m3. TPHCWG (1997) derived an RfC of 1 mg/m3 (1,000 µg/m³), which was adopted by CCME (2008) and subsequently recommended by MOE (2011). This value was selected for use in the

Air Quality Study At Toronto Pearson International Airport – Human Health Risk Assessment August 2015 Intrinsik Environmental Sciences Inc. – Project #20-21515 Page A-45
assessment as it was the only suitable TRV identified for evaluation of the aliphatic C>12-C16 group. Chronic Inhalation – Carcinogenic The aliphatic C>12-C16 group was not evaluated as a carcinogen via the inhalation route.
Table A-15 Inhalation Toxicity Reference Values
Type Duration Valuea Critical Effect Reference Point of
Departure UF Source
Date Derived
RfC Chronic 1,000 Hepatic and
hematological changes
Phillips and Egan 1984 and Mattie et al. 1991
NOAELADJ: 1,840 mg/m³
1,000 CCME, 2008
NA
Shaded exposure limits were selected as toxicological reference values for the current risk assessment. NA Information was not available. a Units are µg/m3 unless otherwise noted.
References CCME. 2008. Canada-Wide Standards for Petroleum Hydrocarbons (PHC) in Soil: Scientific
Rationale - Supporting Technical Document. Canadian Council of Ministers of the Environment. January, 2008. ISBN 978-1-896997-77-3.
MOE. 2011. Rationale for the Development of Generic Soil and Groundwater Standards for use
at Contaminated Sites in Ontario. Standards Development Branch, Ontario Ministry of the Environment.
TPHCWG. 1997. Vol. 4. Development of Fraction Specific Reference Doses (RfDs) and
Reference Specific Concentrations (RfCs) for Total Petroleum Hydrocarbons (TPH). Total Petroleum Hydrocarbon Criteria Working Group. Amherst Scientific Publishers. Amherst, Massachusetts.
Phillips, R.D. and Egan, G.F. 1984. Subchronic inhalation exposure of dearomatized white spirit
and C10-C11 isoparaffinic hydrocarbon in Sprague-Dawley rats. Fund Appl Toxicol 4:808-818. Cited in: TPHCWG, 1997.
Mattie, D.R., Alden, C.L., Newell, T.K., Gaworski, C.L. and Flemming, C.D. 1991. A 90-day
continuous vapor inhalation toxicity study of JP-8 jet fuel followed by 20 or 21 months of recovery in Fischer 344 rats and C57BL/6 mice. Toxicol Pathol 19(2):77-87. Cited in: TPHCWG, 1997.

Air Quality Study At Toronto Pearson International Airport – Human Health Risk Assessment August 2015 Intrinsik Environmental Sciences Inc. – Project #20-21515 Page A-46
A-2.1.16 Benzene Table A-16 presents the inhalation toxicity reference values considered as part of the current assessment. 1-Hour Acute Inhalation The 1-hour acute inhalation REL of 27 µg/m³ derived by the Cal EPA (2014) was selected for use in the assessment. The 1-hour acute inhalation value is based on a study by Keller and Snyder (1988), who exposed mice in utero for 6 hour/day to 5, 10 and 20 ppm benzene on days 6-15 of gestation. The study found suppression of erythropoietic precursor cells and persistent, enhanced granulopoiesis in peripheral blood cells of 2-day neonates and increased granulocytes in the livers of 2-day neonates and the spleens of adults at 6 weeks. The LOAEL was 5 ppm. A NOAEL was not detected. A cumulative uncertainty factor of 600 was applied to the LOAEL of 5 ppm. The default interspecies toxicokinetic uncertainty factor of 2 was applied to account for residual pharmacokinetic differences. The default intraspecies toxicokinetic uncertainty factor of 10 coupled with a toxicodynamic uncertainty factor of √10 for a total UF of 30 was applied to account for intraspecies variability. The default intraspecies toxicodynamics uncertainty factor of √10 was applied to account for pharmacodynamic variability among pregnant women and their fetuses. This resulted in a final acute REL of 8 ppb (27 µg/m³). 24-Hour Acute Inhalation The 24-hour acute inhalation MRL of 29 µg/m³ derived by ATSDR (2007) was selected for use in the assessment. ATSDR (2007) derived an acute MRL of 0.009 ppm (29 µg/m3) that was based on reduced lymphocyte proliferation following mitogen stimulation in mice in the study by Rozen et al. (1984). The key study by Rozen et al. (1984) exposed mice to benzene via inhalation for 6 hours per day for 6 days and reported a LOAEL of 10.2 ppm. The LOAEL of 10.2 ppm was adjusted for intermittent exposure to an adjusted LOAEL of 2.55 ppm. A cumulative uncertainty factor of 300 (10 for the use of LOAEL, 3 for extrapolation from animals to humans, and 10 for human variability) was applied to the adjusted LOAEL of 2.55 ppm (8,100 µg/m3) (ATSDR, 2007) to provide the MRL of 0.009 ppm (29 µg/m3). Chronic Inhalation – Non-Carcinogenic The chronic inhalation exposure limit of 3 µg/m3 proposed by the Cal EPA (2014) was used for the assessment of benzene. Cal EPA (2011) derived a chronic inhalation REL of 3 µg/m3 based on a study by Lan et al. (2004) examining occupationally exposed workers. In this study, 250 male and female Chinese shoe workers ranging from 21 to 38 years of age were exposed to benzene for 8 hour/day (10 m3 per 20 m3 day) for 6 days/week. This study showed a statistically significantly inverse association of cell count with benzene exposure for total white blood cells, granulocytes, lymphocytes, B cells, and platelets. The point of departure for the REL was derived using the changes in B cell levels, which were considered the most sensitive endpoint. The BMCL0.5SD was determined to be 0.476 ppm, which was then adjusted for average continuous exposure to derive a human equivalency concentration of 0.204 ppm. A cumulative uncertainty factor of 200 was applied to the human equivalent concentration of 0.204 ppm. An intraspecies uncertainty factor of 60 was used as well as a subchronic uncertainty factor of √10 (since the exposure duration was 8-≤12% expected lifetime). This resulted a final chronic REL of 1 ppb (3 µg/m3). Chronic Inhalation – Carcinogenic The chronic inhalation unit risk factor proposed by the Cal EPA (2011) was used for the assessment of benzene. Cal EPA (2011) derived an URF of 2.9 x10⁻⁵ (µg/m3)-1 based on

Air Quality Study At Toronto Pearson International Airport – Human Health Risk Assessment August 2015 Intrinsik Environmental Sciences Inc. – Project #20-21515 Page A-47
epidemiological studies of human occupational exposure to benzene and its correlation with incidence of leukemia. The URF was also based on excess risk calculated using a weighted cumulative exposure/relative risk procedure (CDHS, 1984). The derivation of the URF was partly based on 23 major epidemiological studies of occupational workers exposed to benzene and the prevalence of leukemia. The epidemiological studies performed supported the causal nature of the benzene-leukemia association. The URF was also based on two animal bioassay studies by Maltoni et al. (1983) and NTP (1983). In Maltoni et al. (1983), male and female Sprague-Dawley rats were administered benzene at 0, 50 or 250 mg/kg benzene 4 to 5 times per week, for 52 weeks. Increases in Zymbal gland carcinoma in the female rats were observed. In Sprague-Dawley rats administered 0 and 500 mg/kg benzene 4 to 5 times per week for 104 weeks significant increases in Zymbal gland carcinoma and oral cavity carcinoma were observed. Maltoni et al. (1983) also chronically exposed pregnant Sprague-Dawley rats and their offspring to 200 to 300 ppm of benzene. Among offspring, significant increased incidences in Zymbal gland tumors and non-significant increases in cancers of oral and nasal cavity, mammary gland and liver were reported. In NTP (1983), Female rats and mice were administered benzene at doses of 0, 25, 50, and 100 mg/kg, 5 days/week, for 103 weeks and male rats and mice were administered benzene at doses of 0, 50, 100, and 200 mg/kg, 5 days/week for 103 weeks. The study reported a statistically significant dose-related increase in the incidences of neoplasms for the oral cavity (males and females), Zymbal gland (males and females), uterus (females) and skin (males) in the F344 rats. In B6C3F1 mice, the report found a statistically significant dose-related increase in the incidences of tumors were reported for the Zymbal gland (males and females), ovary (females), mammary gland (females), Harderian gland (males and females), lung (males and females), preputial gland (males) and for lymphoma/leukemia combined (males and females). CDHS (1984) used the results from the two animal bioassay studies by Maltoni et al. (1983) and NTP (1983) as well as the epidemiological studies to derive their unit risk factor of 2.9 x10⁻⁵ (µg/m3)-1. CDHS (1984) recommended that cancer potency values in the range of 24 to 170 × 10-6 per ppb be used in estimating risks from low level exposure to benzene. Assuming a breathing rate of 20 m3 per day and weight of 70 kg, the CDHS range of potency values is equivalent to 0.03 to 0.2 (mg/kg-day)-1. In 1988, CDHS recommended that a unit risk of 2.9 × 10⁻⁵ (µg/m3)-1 be used to estimate risk specific intake levels from exposure to benzene. CDHS (1988) considered this value appropriate because it fell within the range of estimates derived by CDHS (1984) and is the upper 95% confidence bound estimate from the analysis of human data considered most credible by Cal EPA (2011) and was adopted. The inhalation URF recommended by Cal EPA (2011) was used in the assessment as it was the most conservative value available. The US EPA IRIS (2000) presented a range of potential IURs of benzene. The key data sets employed in the US EPA IRIS cancer assessment were those by Rinsky et al. (1981, 1987), which were also critically analyzed by Paustenbach et al. (1993), Crump and Allen (1984), Crump (1992, 1994), and the US EPA (1998). The Rinsky et al. (1981, 1987) studies examined the incidence of leukemia in exposed white male workers in the rubber hydrochloride department of a Pliofilm plant. The more comprehensive follow up study (Rinsky et al. 1987) involved the evaluation of 1,165 workers who were exposed for at least 1 day between 1965 and 1981. Individual assessments of cumulative exposure were calculated for each worker based on air sampling data. Inhalation unit risks of 2.2 x 10⁻⁶ to 7.8 x 10⁻⁶ per µg/m3 were extrapolated based on a low dose linear model using maximum likelihood estimates for leukemia in humans (US EPA IRIS, 2000). MOE (2011) recommended an IUR of 2.2x10⁻⁶

Air Quality Study At Toronto Pearson International Airport – Human Health Risk Assessment August 2015 Intrinsik Environmental Sciences Inc. – Project #20-21515 Page A-48
(µg/m3)-1 that was based on US EPA IRIS (2000). However, this value was not selected for use in the assessment as the URF recommended Cal EPA (2011) was more conservative.
Table A-16 Inhalation Toxicity Reference Values
Type Duration Value a Critical Effect Reference Point of
Departure UF Source
Date Derived
ReV; 1-hour
Acute 580
Depressed peripheral
lymphocytes and depressed
mitogen-induced
blastogenesis of femoral B-
lymphocytes in C57BL/6J male
mice
Rozen et al., 1984
POD (HEC): 18.5 ppm
(59,100 µg/m3)
100 TCEQ, 2007
2007
1/2-hour Standard
Acute 7 Incidence of
cancer Crump, 1994 NA NA
MOE, 2011
2011
REL Acute 27
Decreased early nucleated red
cell counts (mouse)
Keller and Snyder, 1988
LOAEL: 5 ppm
600 Cal EPA,
2014 NA
AAQC; 24-hour
Acute 2.3 Incidence of
cancer Crump, 1994 NA NA
MOE, 2011
2011
MRL: 24-hour
Acute
0.009 ppm (29
µg/m3)
Reduced lymphocyte proliferation
following mitogen
stimulation
Rozen et al., 1984
LOAEL: 2.55 ppm
(8,200 µg/m3) 300
ATSDR, 2007
2007
RfC Chronic 30 Decreased lymphocyte
count
Rothman et al., 1996
BMCL: 8,200 µg/m3 300
US EPA IRIS, 2003
2003
MRL Chronic
0.003 ppm (9.58
µg/m3)
Statistically significant decreased
counts of B- lymphocytes
Lan et al., 2004
BMCLADJ (0.25sd): 0.03
ppm
(95.8 µg/m3)
10 ATSDR,
2007 2007
ReV Chronic 280
Decreased absolute
lymphocyte count
Rothman et al., 1984
POD (HEC): 2.6 ppm
(8,300 µg/m3) 30
TCEQ, 2007
2007
REL Chronic 3
Statistically significant decreased
counts of B- lymphocytes
(human)
Lan et al. 2004
BMCLHEC: 0.204 ppm
200 Cal EPA,
2014 NA
AAQC; Annual Average
Chronic 0.45 Incidence of
cancer Crump, 1994 NA NA
MOE, 2011
2011
UR Chronic 2.2 x 10⁻⁶ (µg/m3)-1 Leukemia
Rinsky et al., 1987
NA NA US EPA
IRIS, 2000
2000
UR Chronic 2.2x10⁻⁶
(µg/m3)-1 NA
US EPA IRIS, 2000
NA NA MOE, 2011
2011
UR Chronic 2.9 x 10⁻⁵
(µg/m3)-1
Leukemia incidence
(occupational exposure)
CDHS, 1984 and Rinsky et al., 1981
NA NA Cal EPA,
2011 NA
UR Chronic 3.3 x 10⁻⁶ (µg/m3)-1
Acute myelogenous
leukemia
Rinsky et al., 1987
NA NA Health
Canada, 2010
2010
UR Chronic 6.0 x 10⁻⁶ (µg/m3)-1 Leukemia
Crump and Allen, 1984;
Paustenbach et al., 1992
NA NA WHO, 2000
2000
UR Chronic 2.2 x 10⁻⁶ (µg/m3)-1 Leukemia
Crump and Allen, 1984
NA NA TCEQ, 2007
2007

Air Quality Study At Toronto Pearson International Airport – Human Health Risk Assessment August 2015 Intrinsik Environmental Sciences Inc. – Project #20-21515 Page A-49
Table A-16 Inhalation Toxicity Reference Values
Type Duration Value a Critical Effect Reference Point of
Departure UF Source
Date Derived
Shaded exposure limits were selected as toxicological reference values for the current risk assessment. a Units of µg/m3 unless otherwise noted. b Value taken as 24-hour exposure limit.
References
ATSDR. 2007. Toxicological Profile for Toluene. US Department of Health and Human Services,
Public Health Service. Agency for Toxic Substances and Disease Registry. August, 2007. Available at: http://www.atsdr.cdc.gov/toxprofiles/tp3.pdf
Cal EPA, 2014. Appendix D. Individual Acute, 8-Hour, and Chronic Reference Exposure Level
Summaries. December 2008 (Updated July 2014). Benzene Reference Exposure Levels. (CASRN: 71-43-2) Available at: http://oehha.ca.gov/air/hot_spots/2008/AppendixD1_final.pdf#page=139
Cal EPA. 2011. Appendix B. Chemical-specific summaries of the information to derive unit risk
and cancer potency values. California Environmental Protection Agency. June 2009, revised 2011. Available at: http://www.oehha.ca.gov/air/hot_spots/2009/AppendixB.pdf
CDHS 1988. Risk Specific Intake Level for Benzene. California Department of Health Services.
Reproductive and Cancer Hazard Assessment Section, Berkeley, CA. Cited in: Cal EPA, 2011
CDHS. 1984. Report to the Scientific Review Panel on Benzene. Part B. Health Effects of
Benzene. California Department of Health Services. Epidemiological Studies Section, Berkeley, CA. Cited in: Cal EPA, 2011
Crump, K.S. 1992. Exposure response analyses of Pliofilm cohort. Unpublished. Cited in: US
EPA IRIS, 2000. Crump, K.S. 1994. Risk of benzene-induced leukemia: a sensitivity analysis of the Pliofilm
cohort with additional follow-up and new exposure estimates. J. Toxicol. Environ. Health 42: 219-242. Cited in: US EPA IRIS, 2000 and MOE, 2011.
Crump, K.S. and Allen, B.C. 1984. Quantitative estimates of risk of leukemia from occupational
exposure to benzene. Prepared for the Occupational Safety and Health Administration by Science Research Systems, Inc., Ruston, LA. Unpublished. Cited in: WHO, 2000 and TCEQ, 2007.
Keller, K.A. and Snyder, C.A., 1988. Mice exposed in utero to 20 ppm benzene exhibit altered
numbers of recognizable hematopoietic cells up to seven weeks after exposure. Fundam Appl Toxicol 10(2): 224-32. Cited in: Cal EPA, 2014.
Lan, Q., Vermeulen, R., Zhang, L., Li, G., Rosenberg, P.S., Alter, B.P., Shen, M., Rappaport,
S.M., Weinberg, R.S., Chanock, S., Waidyanatha, S., Rabkin, C., Hayes, R.B., Linet, M., Kim, S., Yin, S., Rothman, N. and Smith, M.T. 2006. Response (to Benzene exposure and toxicity). Science 312: 998-9.Cited in: Cal EPA, 2014 and ATSDR, 2007.
Maltoni C, Conti B and Cotti G. 1983. Benzene: a multipotential carcinogen. Results of long-
term bioassays performed at the Bologna Institute of oncology. Am J Ind Med 4:589-630. and NTP (1983). Cited in: Cal EPA, 2011

Air Quality Study At Toronto Pearson International Airport – Human Health Risk Assessment August 2015 Intrinsik Environmental Sciences Inc. – Project #20-21515 Page A-50
MOE. 2011. Rationale for the development of soil and ground water standards for use at
contaminated sites in Ontario. Standards Development Branch. PIBS: 7386e01. MOE. 2012. Ontario’s Ambient Air Quality Criteria (AAQCs). Standards Development Branch.
Ontario Ministry of the Environment. Available at: http://www.ene.gov.on.ca/stdprodconsume/groups/lr/@ene/@resources/documents/resource/std01_079182.pdf
NTP. 1984. NTP technical report on the toxicology and carcinogenicity studies of benzene (CAS
No. 71-43-2) in F344/N rats and B6C3F1 mice (gavage studies). NIH publication No. 84-2545. National Toxicology Program. US Department of Health and Human Services, Research Triangle Park, NC. Cited in: Cal EPA, 2011
Paustenbach, D.J., Bass, R.D. and Price, P. 1993. Benzene toxicity and risk assessment, 1972
1992: implications for future regulation. Environ Health Perspect 101 (Suppl 6):177 200. Cited in: US EPA IRIS, 2000.
Rinsky RA, Smith AB, Hornung R, Filloon TG, Young RJ, Okun AH and Landrigan PJ. 1987.
Benzene and leukemia. An epidemiologic risk assessment. N Engl J Med 316(17): 1044-50. Cited in: US EPA IRIS, 2000 and Health Canada, 2010
Rinsky RA, Young RJ and Smith AB. 1981. Leukemia in benzene workers. Am J Ind Med 2:217-
245. Cited in: Cal EPA, 2011 Rothman, N., Li, G.-L., Dosemeci, M., et al. 1996. Hematotoxocity among Chinese workers
heavily exposed to benzene. American Journal of Industrial Medicine 29:236-246. Cited in: US EPA IRIS, 2003 and TCEQ, 2007
Rozen MG, Snyder CA, Albert RE. 1984. Depression in B- and T-lymphocyte mitogen-induced
blastogenesis in mice exposed to low concentrations of benzene. Toxicol Lett 20:343-349. Cited in: ATSDR, 2007, and TCEQ, 2007
US EPA. 1998. Carcinogenic effects of benzene: an update. Prepared by the National Center
for Environmental Health, Office of Research and Development, United States Environmental Protection Agency, Washington, DC. EPA/600/P 97/001F. Cited in: US EPA IRIS, 2000.
US EPA IRIS. 2000. Benzene (CASRN 71-43-2). Carcinogenicity Assessment for Lifetime
Exposure. United States Environmental Protection Agency Integrated Risk Information System. Available at: http://www.epa.gov/iris/subst/0276.htm#carc. Cited in: MOE, 2012
US EPA IRIS. 2003. Benzene (CASRN 71-43-2). Chronic Health Hazard Assessments for
Noncarcinogenic Effects. United States Environmental Protection Agency Integrated Risk Information System. Available at: http://www.epa.gov/iris/subst/0276.htm#refinhal
WHO. 2000. Air Quality Guidelines for Europe (2nd Edition) Regional Office for Europe,
Copenhagen. World Health Organization Regional Publications, European Series, No. 91. Available at: http://www.euro.who.int/document/e71922.pdf

Air Quality Study At Toronto Pearson International Airport – Human Health Risk Assessment August 2015 Intrinsik Environmental Sciences Inc. – Project #20-21515 Page A-51
A-2.1.17 Butadiene, 1,3- Table A-17 presents the inhalation toxicity reference values considered as part of the current assessment. 1-Hour Acute Inhalation The 1-hour acute inhalation exposure limit of 660 µg/m³ proposed by Cal EPA (2013) was selected for the use in this assessment. Cal EPA (2013) derived an acute 1-hour REL of 660 µg/m3 based on a study conducted by Hackett et al. (1987). In this study, 78 pregnant female CD-1 mice received whole-body exposure to 0, 40, 200, or 1,000 ppm butadiene for 6 hr/day from gestation days 6 to 15, with necropsy on gestation day 18. The incidences of fetal variations were significantly elevated in litters from mice exposed to 200 and 1,000 ppm. Significant dose-dependent reduction of fetal body and placental weights at the two higher doses for female fetuses, and at all doses in males was also observed. The observation that males fetuses appeared to be susceptible to butadiene at levels that were not maternally toxic is the basis of the acute REL. Hackett et al. (1987) determined the LOAEL to be 200 ppm. Green (2003) reanalyzed the data of Hackett et al. (1987) and found inconsistencies associated with the presentation and calculation of mean values for maternal and fetal body weights, sex ratio, and reproductive data. When the data were analyzed, no statistically significant difference was found between fetal weights at the 40 ppm exposure level and the controls. Based on the reanalysis by Green (2003), the NOAEL was determined to be 40 ppm. A BMCL was then calculated by Cal EPA (2013) using the reanalyzed data from Green (2003) and the Hill model. A BMCL of 17.7 ppm was chosen as it was the lowest BMCL value giving the best model fit. Cal EPA (2013) then derived a human equivalent concentration (HEC) of 29.7 ppm by multiplying the BMCL of 17.7 ppm by the dosimetric adjustment factor (DAF) of 1.68. A cumulative uncertainty factor of 100 was applied to the BMCL(HEC). Uncertainty factors of 10 each were applied to account for interspecies uncertainty and intraspecies uncertainty. This resulted in a final acute inhalation REL of 297 ppb (660 µg/m³). This value was selected for use in the assessment as it was the most conservative TRV available. 24-Hour Acute Inhalation The 24-hour acute inhalation exposure limit of 15 µg/m³ proposed by US EPA (2002) was selected for the use in this assessment. US EPA (2002) derived an acute 24-hour RfC of 15 µg/m³ based on a study conducted by Hackett et al. (1987), a LOAEL of 40 ppm was identified for fetal effects (decreased body weight in males). The US EPA (2002) selected this endpoint for further investigation, and conducted several iterations of benchmark dose modelling (generating effect concentrations) and various approaches for evaluating and transforming data. Of the approaches used by the US EPA (2002), the most conservative estimate for the POD was the LEC05 of 2.9 ppm. A cumulative uncertainty factor of 400 was applied to the LEC05 of 2.9 ppm. An uncertainty factor of 3 was applied to account for interspecies differences. An uncertainty factor of 10 was applied to account for intraspecies differences. An uncertainty factor of 4 was applied to account for the use of an effect-level, and an uncertainty factor of 3 was applied to account for database limitations. The result is an acute RfC of 7 ppb or 15 µg/m³. This value was selected for use in the assessment as it was the most conservative TRV available. Chronic Inhalation – Non-Carcinogenic

Air Quality Study At Toronto Pearson International Airport – Human Health Risk Assessment August 2015 Intrinsik Environmental Sciences Inc. – Project #20-21515 Page A-52
The chronic inhalation exposure limit proposed by US EPA (2002) was selected for the use in this assessment. US EPA (2002) derived a chronic RfC of 2 µg/m³ based on a study by NTP (1993). In this study, male and female B6C3F1 mice (70 per group per sex) exposed to 0, 6.25, 20, 62.5, or 200 ppm 1,3-butadiene, 6 hours per day, 5 days per week for up to 103 weeks. Two additional groups of mice (90 male, 90 female) were also exposed to 625 ppm on the same exposure schedule. Up to 10 animals from each group were examined after 9 and 15 months of exposure. Survival was significantly decreased in both sexes above 20 ppm, primarily due to tumours. After 9 months of exposure, adverse effects on blood clinical chemical parameters was evident in the two higher exposure groups in males and females (625 ppm and 200 ppm in females, 625 and 62.5 ppm in males). NTP (1993) determined that the effects were the result of a macrocytic anemia in the bone marrow of these mice. Testicular atrophy was observed on at 625 ppm. In females, ovarian atrophy was observed at 625 and 200 ppm after 9 months. By 15 months of exposure, mice exposed to 20 ppm and above had ovarian atrophy. After 2 years of exposure, ovarian atrophy was evident at all exposure concentrations. US EPA (2002) conducted benchmark dose modelling on the ovarian atrophy data, discarding the high-dose group due to a high rate of early mortality (625 ppm). A BMCL10 was identified and was adjusted for continuous exposure (6/24 hour, 5/7 days per week) resulting in a BMCL10 (HEC) of 0.88 ppm (1,980 µg/m³). US EPA (2002) applied a cumulative uncertainty factor of 1,000 to the BMCL10 (HEC) accounting for interspecies extrapolation (3), intraspecies variability (10), database deficiencies (3), and for use of 10% effect level (10). This resulted in a final chronic RfC of 0.9 ppb or 2 µg/m³. Chronic Inhalation – Carcinogenic The URF proposed by TCEQ (2008) was selected for the use in the assessment. TCEQ (2008) derived the URF of 5.0x10⁻⁷ per µg/m3 based on epidemiological data on leukemia risk from occupational exposures to 1,3-butadiene reported in a retrospective cohort study by Delzell et al. (1995; 1996). A thorough review of the findings of Delzell et al. (1995; 1996) by the Health Review Committee (HEI, 2006) confirmed the exposure response relation between increasing cumulative exposures to butadiene and the linear increase in the relative rate of leukemia mortality. Sathiakumar and Delzell (2007) conducted an exposure estimate validation study using updated butadiene exposure estimates, then dose response modeling was conducted based on the updated studies (Cheng et al. 2007; Sielken et al. 2007). TCEQ (2008) used a LEC001 as the POD, a linear extrapolation to zero, and adjusted the LEC001 for the increased susceptibility of children using a life-table approach and applied age-dependant adjustment factors. The resulting URF was 0.0011 per ppm or 5.0x10⁻⁷ per µg/m3 1,3-butadiene. While less conservative than the US EPA IRIS value, the TCEQ (2008) TRV was selected for use in the assessment as it makes use of the most recent toxicological evidence for cancer related to 1,3-butadiene exposures.
Table A-17 Inhalation Toxicity Reference Values
Type Duration Valuea Critical Effect
Reference Point of
Departure UF Source
Year Derived
REL: 1-hour
Acute 660 Lowered fetal
weight (mouse)
Hackett et al.
1987. HEC: 29.7
ppm 100
Cal EPA, 2013
NA
ReV: 1-hour
Acute 3,700 Lowered fetal
weight (mouse)
Hackett et al. 1987 and
Green, 2003
BMCL1 SD: 51.3 ppm
30 TCEQ, 2008
2008

Air Quality Study At Toronto Pearson International Airport – Human Health Risk Assessment August 2015 Intrinsik Environmental Sciences Inc. – Project #20-21515 Page A-53
Table A-17 Inhalation Toxicity Reference Values
Type Duration Valuea Critical Effect
Reference Point of
Departure UF Source
Year Derived
MRL: 24-hour
Acute 220 Lowered fetal
weight (mouse)
Hackett et al. 1987.
LOAELADJ: 10 ppm
90 ATSDR
2012 NA
RfC: 24-hour
Acute 15 Decreased fetal weight
(mouse)
Hackett et al. 1987.
LEC05: 2.9 ppm
400 US EPA
IRIS, 2002
2002
RsC Chronic 2
Increased incidence of
ovarian atrophy
NTP, 1993 and Doerr et al.1996
HEC: 302 ppb
300 Cal
EPA, 2013
NA
ReV Chronic 33 Ovarian atrophy (mice)
NTP 1993
Not available.
BMD modeling
was conducted
on data already adjusted
from discontinuo
us to continuous exposure
30 TCEQ, 2008
NA
RfC Chronic 2 Ovarian
atrophy (rat) NTP 1993
BMCL10: 0.88 ppm
(1,980 µg/m³)
1,000 US EPA
IRIS, 2002
2002
URF Chronic 5.0x10⁻⁷
per µg/m3
Leukemia incidence
data (human)
Delzell et al.,
1995, 1996; HEI, 2006;
Cheng et al., 2007; Sielken et al., 2007; Sathiakumar and Delzell,
2007
LEC001: 0.011 ppm (1x10⁻⁵ risk
level)
- TCEQ, 2008
2008
IUR Chronic 3.0x10⁻⁶
per µg/m3
Leukemia incidence
data (human)
Delzell et al. 1995
LEC01: 0.254 ppm
- US EPA
IRIS, 2002
2002
Shaded exposure limits were selected as toxicological reference values for the current risk assessment NA Information was not available. a Units are µg/m3 unless otherwise noted References ATSDR. 2012. Minimal Risk Levels (MRLs) for Hazardous Substances. US Department of
Health and Human Services, Public Health Service. Agency for Toxic Substances and Disease Registry. Atlanta, GA. February 2013. Available at: http://www.atsdr.cdc.gov/toxprofiles/tp28.pdf
Cal EPA. 2013. 1,3-Butadiene Reference Exposure Levels. CASRN: 106-99-0. California Office
of Environmental Health Hazard Assessment. Available at: http://oehha.ca.gov/air/chronic_rels/pdf/072613bentCREL.pdf

Air Quality Study At Toronto Pearson International Airport – Human Health Risk Assessment August 2015 Intrinsik Environmental Sciences Inc. – Project #20-21515 Page A-54
Cheng, H, N Sathiakumar, J Graff, et al. 2007. 1,3-Butadiene and leukemia among synthetic rubber industry workers: Exposure–response relationships. Chem Biol Inter 166:15-24. Cited in: TCEQ, 2008.
Delzell, E, Sathiakumar, N. and Hovinga, M. 1996. A follow up study of synthetic rubber
workers. Toxicology 113:182 189.Cited in: US EPA, 2002 and TCEQ, 2008. Delzell, E, N Sathiakumar, and M Hovinga. 1996. A follow-up study of synthetic rubber workers.
Toxicology 113: 182-189. Cited in: TCEQ, 2008. Doerr, J. K., E. A. Hollis and I. G. Sipes. 1996. Species difference in the ovarian toxicity of 1,3-
butadiene epoxides in B5C3F1 mice and Sprague-Dawley rats. Toxicology 113(1- 3): 128-136. Cited in: Cal EPA 2013.
Green, J.W. 2003. Statistical analysis of butadiene mouse data from Hackett et al. (1987). Study
completed for American Chemistry Council. Laboratory Project ID: Dont-13474. Sponsor Contract ID: OLF-114.0-BD-stat-DHL. Cited in: TCEQ, 2008
Hackett, P.L. Sikov, M.R., Mast, T.J., et. al. 1987. Inhalation developmental toxicology studies:
Teratology study of 1,3 butadiene in mice. Final report No. NIH 401 ES 40131. PNL 6412, UC 48. Prepared for: National Institute of Environmental Health Sciences, National Toxicology Program. Cited in: Cal EPA, 2013, TCEQ, 2008, ATSDR, 2012 and US EPA, 2002.
Health Effects Institute (HEI). 2006. An updated study of mortality among North American
synthetic rubber industry workers. Health Effects Institute Research Report Number 132. Cited in: TCEQ, 2006.
NTP. 1993. NTP technical report on the toxicology and carcinogenesis studies of 1,3-butadiene
(CASRN: 106-99-0) in B6C3F1 mice (inhalational studies), NTP TR434, NIH Publication No. 93-3165, US Department of Health and Human Services Public Health Service. National Institute of Health, Research Triangle Park, NC. Cited in: Cal EPA, 2013, TCEQ, 2013 and US EPA IRIS, 2002.
Sathiakumar, N, E Delzell, H Cheng, et al. 2007. Validation of 1,3-butadiene exposure estimates
for workers at a synthetic rubber plant. Chem Biol Inter 166: 29-43. Cited in: TCEQ, 2008.
Sielken, RL, C Valdez-Flores, ML Gargas, et al. 2007. Cancer risk assessment for 1,3-
butadiene: Dose-response modeling from an epidemiological perspective. Chem Biol Inter 166: 140- 49. Cited in: TCEQ, 2008.
TCEQ. 2008. 1,3 Butadiene (CASRN: 106 99 0). Development Support Document, Final,
August 2008. Texas Commission on Environmental Quality. Toxicology Section, Chief Engineer’s Office, Texas Commission on Environmental Quality. Available at: http://www.tceq.state.tx.us/assets/public/implementation/tox/dsd/final/butadiene,_1-3-_106-99-0_final.pdf
US EPA IRIS. 2002. Health Assessment of 1,3-butadiene. National Center for Environmental
Assessment-Washington Office. Integrated Risk Information System (IRIS). Office of Research and Development. Washington, DC. October 2002. EPA/600/P-98/001F. Available at: http://www.epa.gov/iris/subst/0139.htm

Air Quality Study At Toronto Pearson International Airport – Human Health Risk Assessment August 2015 Intrinsik Environmental Sciences Inc. – Project #20-21515 Page A-55
A-2.1.18 Cyclohexane Table A-18 presents the inhalation toxicity reference values considered as part of the current assessment. 1-Hour Acute Inhalation A suitable 1-hour acute inhalation TRV for cyclohexane was not available for use in the assessment. 24-Hour Acute Inhalation The 1-hour acute inhalation exposure limit of 6,100 µg/m³ proposed by MOE (2012) was selected for the use in this assessment. This value utilized the derivation information for a chronic-duration RfC from US EPA IRIS (2003), which is based on a study by Kreckmann et al. (2000). In this study, male and female Sprague-Dawley strain rats were exposed by whole body inhalation to cyclohexane vapor at 0, 1,721, 6,886, or 24,101 mg/m3. Subjects were exposed for 6 hours/day, 5 days/week for 10 weeks. The animals were then bred within their respective treatment groups and allowed to deliver their offspring. At weaning, F1 rats were randomly selected to produce the next generation and were treated to the same exposure schedule as the P1 generation. At least 11 weeks after weaning, the F1 rats were bred to produce the F2 litters. Rats were evaluated for their response to an auditory altering stimulus prior to cyclohexane exposure, during cyclohexane exposure, and during the time required to clear the exposure chamber. Clinical observations during exposure showed a diminished response or absent response to a sound stimulus beginning at exposure 15 in animals exposed to 6,886 or 24,101 mg/m3. The study concluded that inhalation exposure of rats to 24,101 mg/m3 cyclohexane vapors produced significant reductions in body weights in P1 and F1 females and F1 males, and significant reductions in pup weights from lactation days 7 to 25 for F1 and F2 litters. At the 6,886 or 24,101 mg/m3 level, diminished response to a sound stimulus or absent sound stimulus was observed during exposure. Based on maternal toxicity (reduced body weights, altered response to stimuli) and reduced pup weights, a NOAEL was determined to be 6,886 mg/m3. The NOAEL was duration-adjusted from an intermittent exposure to a continuous exposure (6/24-hours), resulting in a NOAELADJ of 1,720 mg/m³ for developmental effects. Benchmark dose modelling was conducted by the US EPA, and a BMC1sd of 1,822 mg/m3 was calculated from the dose-response data. The BMC1sd was converted to a HEC for a category 3 gas causing respiratory effects. The average ratio of the animal-blood:air partition coefficient would be marginally greater than 1; thus, a default value of 1 was used in calculating the BMCHEC of 1,822 mg/m³. A cumulative uncertainty factor of 300 was applied to the BMCHEC to account for interspecies variability (3), intraspecies variability (10), and database deficiencies (10). A factor of 3 was applied for the extrapolation of laboratory animal data to humans since the calculation of a HEC addressed the pharmacokinetic aspects of the interspecies uncertainty factor. Accordingly, only the pharmacodynamic aspects of uncertainty remain as a partial factor for interspecies uncertainty (US EPA IRIS, 2003). The resulting value of 6,100 µg/m3 was utilized by MOE (2012) for use as the 24-hour acute inhalation AAQC. This value was selected for use in the assessment as it was the only appropriate TRV available. Chronic Inhalation – Non-Carcinogenic US EPA IRIS (2003) has derived a chronic RfC of 6,000 µg/m³ based on the previously described study by Kreckmann et al. (2000). While the derivation methodology reported by MOE (2012) and US EPA IRIS (2003) were described to be the same, the 24-hour AAQC (MOE, 2012) differed from the US EPA IRIS (2003) RfC. It is likely that the RfC of 6,000 µg/m3

Air Quality Study At Toronto Pearson International Airport – Human Health Risk Assessment August 2015 Intrinsik Environmental Sciences Inc. – Project #20-21515 Page A-56
was simply rounded to one significant figure compared to two. The US EPA IRIS (2003) value was selected for use in the assessment as it was the only appropriate TRV available. Chronic Inhalation – Carcinogenic Cyclohexane was not evaluated as a carcinogen via the inhalation route.
Table A-18 Inhalation Toxicity Reference Values
Type Duration Value a Critical Effect Reference Point of
Departure UF Source
Date Derived
MOE AAQC; 24-hour
Acute 6,100 Reduced pup weights (rat)
Kreckmann et al., 2000
BMC1sd (HEC) 1,822 mg/m³ (1,822,000
µg/m3)
300 MOE, 2012
NA
RfC Chronic 6,000
Reduced pup weights in F1 and
F2 generations (rat)
Kreckmann et al., 2000
BMC1sd (HEC) 1,822 mg/m³ (1,822,000
µg/m3)
300 US EPA
IRIS, 2003
2003
Shaded exposure limits were selected as toxicological reference values for the current risk assessment. a Units of µg/m3 unless otherwise noted.
References Kreckmann, K.H., Baldwin, J.K., Roberts, L.G., Staab, R.J., Kelly, D.P. and Saik, J.E. 2000.
Inhalation developmental toxicity and reproduction studies with cyclohexane. Drug Chem. Toxicol. 23(4):555-573. Cited in: MOE, 2012 and US EPA, 2003.
MOE. 2012. Ontario’s Ambient Air Quality Criteria (AAQCs). Standards Development Branch.
Ontario Ministry of the Environment. Available at: http://www.ontario.ca/environment-and-energy/ontarios-ambient-air-quality-criteria-sorted-chemical-abstracts-service
US EPA IRIS. 2003. Cyclohexane (CASRN: 110-82-7). Chronic Inhalation Reference
Concentration. United States Environmental Protection Agency. United States Environmental Protection Agency Integrated Risk Information System. Available at: http://www.epa.gov/ncea/iris/subst/1005.htm

Air Quality Study At Toronto Pearson International Airport – Human Health Risk Assessment August 2015 Intrinsik Environmental Sciences Inc. – Project #20-21515 Page A-57
A-2.1.19 Ethylbenzene Table A-19 presents the inhalation toxicity reference values considered as part of the current assessment. 1-Hour Acute Inhalation The TCEQ (2010) developed an acute ReV of 86,000 µg/m3 based on the results of a study conducted by Cappaert et al. (2000). This value was selected for use in the current assessment. TCEQ was unable to obtain the individual animal data directly from Cappaert et al. (2000) and used the NOAEL/LOAEL approach (over the BMD model approach) to determine the POD. A NOAEL of 300 ppm (1,302 mg/m³) and a LOAEL of 400 ppm (1,736 mg/m3) were identified for significant deterioration in CAP auditory thresholds and significant outer hair cell losses. The 8-hour NOAEL was adjusted to a 1-hour NOAEL using modified Haber’s law. The HEC was calculated from the NOAEL (ADJ) of 600 ppm (2,604 mg/m3) using the recommended Regional gas dosimetry ratio (RGDR) equation for category 3 gases. The TCEQ noted, however, that ethylbenzene is classified as a category 2 gas since it is relatively soluble in water and produces both local and systemic effects, but category 2 gases were still under review by the US EPA. The TCEQ (2010) assumed a ratio of blood:gas partition coefficient for rats of 42.7 and a mean ratio of blood:gas partition coefficient for humans of 28.0. When the quotient between animal and human ratio of blood:gas partition coefficient is greater than 1, a default value of 1 is used for the RGDR. The RGDR was then multiplied by the NOAEL (ADJ), resulting in a NOAEL (HEC) of 600 ppm (2,604 mg/m3). The TCEQ (2010) applied a cumulative uncertainty factor of 30 (3 to account for inter-species variability and 10 for intra-species variability) to the NOAEL (HEC). The result is an acute ReV of 86,000 µg/m3 for ethylbenzene. This exposure limit was selected for use as it was the only TRV available. 24-Hour Acute Inhalation MOE (2012) has developed a 24-hour AAQC of 1,000 µg/m³ for ethylbenzene based on health considerations. While no scientific basis is provided for this limit, this value was selected for use in the assessment it was the only appropriate TRV identified. Chronic Inhalation – Non-Carcinogenic The US EPA IRIS (1991) developed an RfC of 1,000 µg/m3 that was based on a NOAEL of 100 ppm (434,000 µg/m3) for developmental toxicity in rats and rabbits. This value was recommended for use by MOE (2011). Wistar rats and New Zealand white rabbits were exposed to 0, 100 or 1,000 ppm (0, 434 or 4,342 mg/m3) ethylbenzene for 6 to 7 hours/day, 7 days/week during days 1 to 19 and 1 to 24 of gestation, respectively (Andrew et al., 1981). According to the US EPA IRIS (1991), a NOAEL based on developmental effects should not be adjusted for intermittent exposure. A NOAEL (HEC) was calculated assuming a default value of 1.0 (gas:extrarespiratory effect between experimental animal species and human was assumed to be equal) (US EPA IRIS, 1991). A cumulative uncertainty factor of 300 (3 to account for inter-species variability, 10 for inter-species variability, and 10 for database deficiencies of multigenerational reproductive and chronic studies) was applied to the study NOAEL (HEC). An uncertainty factor of 3 for interspecies variability was considered appropriate by the US EPA IRIS (1991) since the HEC adjustment addresses the pharmacokinetic component of the extrapolation factor, leaving only the pharmacodynamic area of uncertainty. This study only involved two dose levels (100 and 1,000 ppm). Adverse effects were observed at 1,000 ppm, but due to the lack of dose levels between 100 and 1,000 ppm, the threshold of these effects is unknown. The TCEQ (2010) and Cal EPA (2008) discussed the US EPA IRIS (1991) RfC and its basis relative to the scientific weight of evidence for subchronic and chronic ethylbenzene exposure. The US EPA IRIS

Air Quality Study At Toronto Pearson International Airport – Human Health Risk Assessment August 2015 Intrinsik Environmental Sciences Inc. – Project #20-21515 Page A-58
evaluation incorporated an uncertainty factor of 10 for the lack of multigenerational reproductive and chronic studies; however, both of these study types have since become available. For these reasons, the US EPA RfC was not used in the chronic inhalation assessment of ethylbenzene. The ATSDR (2010) developed a chronic-duration MRL based on a study conducted by the NTP (1999). In the NTP (1999) study, male and female F344/N rats and B6C3F1 mice were exposed to 0, 75, 250 or 750 ppm ethylbenzene via inhalation 6 hours/day, 5 days/week for 103 to 104 weeks. Increased severity of nephropathy was statistically significant for the 750 ppm male exposure group and for all female exposure groups (i.e., 75, 250 and 750 ppm). The ATSDR (2010) selected 75 ppm as the LOAEL for increased severity of nephropathy. This value was selected for use in the current assessment. The human PBPK model was used to estimate the internal dose metrics and predict the HEC of 17.45 ppm (75,730 µg/m3). The ATSDR (2010) applied a cumulative uncertainty factor of 300 (10 to account for use of a LOAEL, 3 for extrapolation from animals to humans with dosimetric adjustment differences, and 10 for intra-species variability). The resulting MRL of 0.06 ppm (260 µg/m3) was based on the more conservative (i.e., lower) effect level of 75 ppm for increased severity of kidney effects instead of a no effect level of 75 ppm, and incorporates dosimetry modelling data instead of the RGDR approach to partially account for the uncertainty associated with extrapolation from rats to humans. The chronic inhalation exposure limit of 260 µg/m³ derived by ATSDR (2010) was selected in the assessment as it was a more scientifically defensible and conservative value. Chronic Inhalation – Carcinogenic Ethylbenzene was not evaluated as a carcinogen via the inhalation route.
Table A-19 Inhalation Toxicity Reference Values
Type Duration Value a Critical Effect
Reference Point of
Departure UF Source Derived
MRL; 14 days or less
Acute 21,700 Neurological
effects Cappaert
et al., 2000
BMDL (HEC): 154.26 ppm
(669,490 µg/m3) 30
ATSDR, 2010
2010
ReV; 1-hour
Acute 86,000 Ototoxicity
(rats) Cappaert
et al., 2000
NOAEL (HEC): 600 ppm
(2,604,000 µg/m3)
30 TCEQ, 2010
2010
AAQC; 24-hour
Acute 1,000 Health-based NA NA NA MOE, 2012
2011
MRL Chronic 260 Increased severity of
nephropathy NTP, 1999
LOAEL (HEC): 17.45 ppm
(75,730 µg/m3) 300
ATSDR, 2010
2010
REL Chronic 2,000 Increased severity of
nephropathy NTP, 1999
NOAEL (ADJ): 13 ppm
(58,000 µg/m3) 300
Cal EPA, 2008
2000
ReV Chronic 1,900 Increased severity of
nephropathy NTP, 1999
NOAEL (ADJ): 13 ppm
(58,000 µg/m3) 300
TCEQ, 2010
2010

Air Quality Study At Toronto Pearson International Airport – Human Health Risk Assessment August 2015 Intrinsik Environmental Sciences Inc. – Project #20-21515 Page A-59
Table A-19 Inhalation Toxicity Reference Values
Type Duration Value a Critical Effect
Reference Point of
Departure UF Source Derived
RfC Chronic 1,000 Development
al toxicity
Andrew et al., 1981; Hardin et al., 1981
NOAEL: 100 ppm
(434,000 µg/m3) 300
US EPA IRIS, 1991
1991
TC Chronic 1,000
Reduced litter size; increased
relative liver, kidney, and
spleen weights of
dams; skeletal
variations
Adopted from US EPA IRIS
(1991)
NOAEL: 434 mg/m3
(434,000 µg/m3) 300
Health Canada,
2010 2010
TCA Chronic 770 Kidney and liver effects
NTP, 1996 NOAEL: 77
mg/m3
(77,000 µg/m3) 100
RIVM, 2001
2001
Shaded exposure limits were selected as toxicological reference values for the current risk assessment. NA Information was not available. a Units of µg/m3 unless otherwise noted.
References Andrew, F.D., Buschbom, R.L., Cannon, W.C., Miller, R.A., Montgomery, L.F., Phelps, D.W., et
al. 1981. Teratologic assessment of ethylbenzene and 2-ethoxyethanol. Battelle Pacific Northwest Laboratory, Richland, WA. PB 83- 208074., 108. Cited in: US EPA IRIS, 1991.
ATSDR. 2010. Toxicological Profile for Ethylbenzene. Atlanta, GA: US Department of Health
and Human Services, Public Health Service. Agency for Toxic Substances and Disease Registry. Available at: http://www.atsdr.cdc.gov/toxprofiles/tp110.pdf
Cal EPA. 2008. Ethylbenzene. Determination of Noncancer Chronic Reference Exposure
Levels. Chronic Toxicity Summary. California Environmental Protection Agency, Office of Environmental Health Hazard Assessment. Sacramento, CA. Available at: http://oehha.ca.gov/air/hot_spots/2008/AppendixD3_final.pdf#page=208
Cappaert, N.L.M., Klis, S.F.L., Baretta, A.B., Muijser, H. and Smoorenburg, G.F. 2000. Ethyl
benzene-induced ototoxicity in rats: A dose-dependent mid-frequency hearing loss. J Assoc Res Otolaryngol 1(4):292-299. Cited in: ATSDR, 2010 and TCEQ, 2010
Hardin, B.D., Bond, G.P., Sikov, M.R., Andrew, F.D., Beliles, R.P., and Niemeier, R.W. 1981.
Testing of selected workplace chemicals for teratogenic potential. Scand. J. Work Environ. Health. 7 (suppl 4): 66-75. Cited in: US EPA IRIS, 1991.
Health Canada. 2010. Federal Contaminated Site Risk Assessment in Canada. Part II: Health
Canada Toxicological Reference Values (TRVs) and Chemical Specific Factors Version 2.0. Contaminated Sites Division. Safe Environments Programme. September 2010.
MOE. 2011. Rationale for the Development of Soil and Ground Water Standards for use at
Contaminated Sites in Ontario. Standards Development Branch. Ontario Ministry of Environment. PIBS 7386e01. Available at:

Air Quality Study At Toronto Pearson International Airport – Human Health Risk Assessment August 2015 Intrinsik Environmental Sciences Inc. – Project #20-21515 Page A-60
https://dr6j45jk9xcmk.cloudfront.net/documents/999/3-6-4-rationale-for-the-development-of-soil-and.pdf
MOE. 2012. Ontario’s Ambient Air Quality Criteria (AAQCs). Standards Development Branch. Ontario Ministry of the Environment. Available at: http://www.ene.gov.on.ca/stdprodconsume/groups/lr/@ene/@resources/documents/resource/std01_079182.pdf
NTP. 1999. Toxicology and Carcinogenesis Studies of Ethylbenzene (CASRN: 100-41-4) in F344/N Rats and B6C3F1 Mice (inhalation studies). NTP TR 466 NIH Publication No. 99-3956. U.S. Department of Health and Human Services National Toxicology Program. Cited in: ATSDR, 2010
NTP. 1996. Toxicology and Carcinogenesis studies of ethylbenzene in F344/N rats and B6CF1
mice (inhalation studies). National Toxicology Program. Technical Report Series no 466. Cited in: RIVM, 2001.
RIVM. 2001. Re-evaluation of human toxicological maximum permissible risk levels. National Institute of
Public Health and the Environment (RIVM). Report 711701 025. March 2001. TCEQ. 2010. Ethylbenzene, Development Support Document, Final. Texas Commission on
Environmental Quality. Available at: http://www.tceq.texas.gov/assets/public/implementation/tox/dsd/final/nov10/ethylbenzene.pdf
US EPA IRIS. 1991. IRIS Summary of Ethylbenzene (CASRN 100-41-4). Reference Concentration for
Chronic Inhalation Exposure (RfC). United States Environmental Protection Agency. Available at: http://www.epa.gov/iris/subst/0051.htm#refinhal

Air Quality Study At Toronto Pearson International Airport – Human Health Risk Assessment August 2015 Intrinsik Environmental Sciences Inc. – Project #20-21515 Page A-61
A-2.1.20 Formaldehyde Table A-20 presents the inhalation toxicity reference values considered as part of the current assessment. 1-Hour Acute Inhalation The 1-hour acute inhalation exposure limit of 50 µg/m³ derived by TCEQ (2008) was selected for the use in this assessment. TCEQ (2008) derived the acute ReV based on a study by Pazdrak et al. (1993) and Krakowiak et al. (1998). In Pazdrak et al. (1993), 20 volunteers, nine of whom had skin hypersensitivity to formaldehyde, were exposed to 0.5 mg/m3 (0.4 ppm) of formaldehyde for 2 hours. Symptoms of rhinitis such as number of sneezes, degree of mucosal edema, rhinorrhea, itching were measured and scored. The study showed transient burning sensation of the eyes and nasal passages, transient symptoms of rhinitis and nasal washing changes at 0.4 ppm. Individuals exposed to 0.4 ppm of formaldehyde showed a significant increase in average symptom scores compared with the average placebo scores. The LOAEL from Pazdrak et al. (1993) is 0.5 mg/m3 (0.4 ppm) based on transient burning sensation of the eyes and nasal passages and transient symptoms of rhinitis. In the study conducted by Krakowiak et al. (1998), 20 volunteers were exposed to 0.4 ppm of formaldehyde for 2 hours. Nasal symptoms such as number of sneezes, degree of mucosal edema, rhinorrhea, itching were measured and scored and compared to a control group who were exposed to clean air. The 0.4 ppm exposure in Krakowiak et al. (1998) produced symptoms of rhinitis such as increased sneezing, itching, and congestion in all subjects. The LOAEL from Krakowiak et al. (1998) is 0.5 mg/m3 (0.4 ppm) based on transient symptoms of rhinitis. The LOAEL of 0.5 mg/m3 was used as the human equivalent concentration point-of-departure (PODHEC) by TCEQ (2008). A cumulative uncertainty factor of 10 was applied to the PODHEC of 0.5 mg/m3. An uncertainty factor of 3 was applied to account for the extrapolation from a LOAEL to a NOAEL. An uncertainty factor of 3 was applied to account for intra-human variability since the irritant effects were observed in studies that included potentially sensitive subpopulations. An uncertainty factor of 1 was applied to account for database uncertainty since the overall toxicological database for formaldehyde is extensive. This resulted in an acute ReV of 50 µg/m3. This value was selected for use in the assessment as it was the most conservative TRV available with the least amount of uncertainty factors applied. 24-Hour Acute Inhalation The 24-hour acute inhalation exposure limit of 65 µg/m3 proposed by the MOE (2012) was selected for use in this assessment. While no scientific basis is provided for this limit, this value was selected for use in the assessment as it was the only appropriate TRV identified. Chronic Inhalation – Non-Carcinogenic Cal EPA (2014) has derived a chronic REL of 9 µg/m3 that was selected for use in this assessment. In the key study by Wilhelmsson and Holmstrom (1992), workers were exposed to a mean formaldehyde concentration of 0.21 ppm (0.26 mg/m³) for an average duration of 10 years. Exposed workers were compared with a control group of non-occupationally exposed workers who on average, were exposed to 0.07 ppm (0.09 mg/m³). Both groups of workers included atopic individuals with Type I hypersensitivity that were responsive to formaldehyde in cutaneous tests. Eye irritation and immune-mediated discomfort and irritation of the nasal passages and respiratory tract were observed in the exposed group but not in the reference group. The study LOAEL was identified as 0.26 mg/m³ and the NOAEL as 0.09 mg/m³.

Air Quality Study At Toronto Pearson International Airport – Human Health Risk Assessment August 2015 Intrinsik Environmental Sciences Inc. – Project #20-21515 Page A-62
An uncertainty factor of 10 for toxicodynamic variability and developmental susceptibility was applied to the NOAEL for intra-species variability since the key study included only adults. This resulted in the REL of 9 µg/m³. This value was selected for use in the assessment as it was the most conservative TRV available. Chronic Inhalation – Carcinogenic Cal EPA (2011) derived an IUR of 6.0 x 10⁻⁶ (µg/m3)-1 that was based on an inhalation study by Kerns et al. (1983) that examined the incidence of nasal squamous cell carcinomas in rats exposed to formaldehyde. In this study, Fischer 344 rats and B6C3F1 mice were exposed to 0, 2, 5.6 or 14.3 ppm (equivalent to 0, 2.5, 7 or 17.6 mg/m³) for 6 hours/day, 5 days/week for a duration of 24 months. Five animals were sacrificed in each exposure group at 6 and 12 months, while 20 were sacrificed in each exposure group at 18 months (Kerns et al. 1983). Squamous cell carcinomas and polyploidy adenomas were seen in the nasal cavities male and female rats exposed to 14.3 ppm, and in male animals (polyploidy adenoma only) at 5.6 ppm. In the 5.6 ppm group, only one rat of each sex presented nasal carcinomas. In exposed mice, squamous cell carcinomas were seen in two males at 14.3 ppm. No significant lesions were observed. The IUR was derived using the linearized multistage procedure, which takes into account the proliferation of premalignant cells due to the formaldehyde exposure. Upper confidence limits were calculated and Cal EPA selected 7 x 10⁻³ ppm-1 (6.0 x 10⁻⁶ (µg/m3)-1, based on molecular dosimetry data in a three stage model and using the standard surface-area scaling factor of 1.2, as the most appropriate value. This value was selected as it was the most conservative TRV available.
Table A-20 Inhalation Toxicity Reference Values
Type Duration Valuea Critical Effect Reference Point of
Departure UF Source
Date Derived
ReV; 1-hour
Acute 50 Eye and nose
irritation (human)
Pazdrak et al., 1993; Krakowiak et al., 1998
LOAEL: 0.4 ppm
(500 µg/m3) 10
TCEQ, 2008
2008
MRL; 2-hour
Acute 50 Nasal and eye
irritation (human) Pazdrak et al., 1993
LOAEL: 0.4 ppm
(500 µg/m3) 10
ATSDR, 1999
1999
REL; 1-hour
Acute 55 Mild and
moderate eye irritation
Kulle et al.,
1987
BMCL05: 0.44 ppm
(540 µg/m3) 10
Cal EPA, 2014
2008
AAQC; 24-hour
Acute 65 Respiratory and
eye irritation (human)
NA NA NA MOE, 2012
2012
ReV Chronic 11
Incidence of eye, nasal, and respiratory
irritation
Wilhelmsson and
Holmstrom, 1992
NOAEL (HEC):
0.032 mg/m3 (32 µg/m3)
3 TCEQ, 2008
2008
REL Chronic 9
Nasal obstruction and
discomfort, lower airway
discomfort, eye irritation (human)
Wilhelmsson and
Holmstrom, 1992
NOAEL: 0.09 mg/m3
(90 µg/m3)
10 Cal EPA,
2014 2008

Air Quality Study At Toronto Pearson International Airport – Human Health Risk Assessment August 2015 Intrinsik Environmental Sciences Inc. – Project #20-21515 Page A-63
Table A-20 Inhalation Toxicity Reference Values
Type Duration Valuea Critical Effect Reference Point of
Departure UF Source
Date Derived
MRL Chronic 10
(0.008 ppm)
Clinical symptoms of
mild irritation of eyes and upper respiratory tract. Mild damage to nasal epithelium
Holmstrom et al., 1989
LOAEL: 0.24 ppm
(294 µg/m3) 30
ATSDR, 1999
1999
UR Chronic 1.3 x 10⁻⁵ (µg/m3)-1
Incidence of nasal squamous cell carcinoma
Kerns et al.,
1983 NA NA
US EPA IRIS, 1991
1991
UR Chronic 6.0 x 10⁻⁶ (µg/m3)-1
Nasal squamous carcinoma
incidence (rat)
Kerns et al., 1983
NA NA Cal EPA,
2011 2009
UR Chronic 5.3 x 10⁻⁶ (µg/m3)-1
Incidence of nasal squamous
tumours
Monticello et al., 1996
NA NA
Environment
Canada and
Health Canada (2001)
2001
UR Chronic 5.6 x 10⁻⁸ (µg/m3)-1
Cell proliferation and cytotoxicity
(rat)
Schlosser et al., 2003
NA NA TCEQ, 2008
2008
Shaded exposure limits were selected as toxicological reference values for the current risk assessment. NA Information was not available. a Units of µg/m3 unless otherwise noted.
References ATSDR. 1999. Toxicological Profile for Formaldehyde. US Department of Health and Human
Services. Agency for Toxic Substances and Disease Registry. Public Health Service Atlanta, GA. July, 1999. Available at: http://www.atsdr.cdc.gov/toxprofiles/tp111.pdf
Cal EPA. 2011. Technical Support Document for Cancer Potency Factors: Methodologies for derivation, listing of available values, and adjustments to allow for early life stage exposures. California Environmental Protection Agency, Office of Environmental Health Hazard Assessment, Air Toxicology and Epidemiology Branch. May 2009. Available at: http://www.oehha.ca.gov/air/hot_spots
Cal EPA. 2014. TSD for Noncancer RELs. Appendix D. Individual acute, 8 hour, and chronic
reference exposure levels. December 2008. California Environmental Protection Agency, Office of Environmental Health Hazard Assessment. Sacramento, CA. Available at: http://oehha.ca.gov/air/hot_spots/2008/AppendixD1_final.pdf#page=384
Environment Canada and Health Canada. 2001. Canadian Environmental Protection Act.
Priority Substances List Assessment Report: Formaldehyde. Environment Canada, Health Canada. Available at: http://www.hc-sc.gc.ca/ewh-semt/pubs/contaminants/psl2-lsp2/formaldehyde/index_e.html
Health Canada. 2010. Federal Contaminated Site Risk Assessment in Canada. Part II: Health Canada Toxicological Reference Values (TRVs) and Chemical Specific Factors Version

Air Quality Study At Toronto Pearson International Airport – Human Health Risk Assessment August 2015 Intrinsik Environmental Sciences Inc. – Project #20-21515 Page A-64
2.0. Contaminated Sites Division. Safe Environments Programme.
Holmstrom, M., Wilhelmsson, B., Hellquist, H., et al. 1989. Histological changes in the nasal mucosa in persons occupationally exposed to formaldehyde alone and in combination with wood dust. Acta Otolaryngol (Stockh) 107:120-129. Cited in: ATSDR 1999.
Kerns, W.D., Pavkokv, K.L., Donofrio, D.J., Gralla, E.J., and Swenberg, J.A. 1983. Carcinogenicity of formaldehyde in rats and mice after long-term inhalation exposure. Cancer Res. 43: 4382-4392. Cited in: Cal EPA, 2011; US EPA IRIS, 1991.
Krakowiak, A., Gorski, P., Pazdrak, K., et al. 1998. Airway response to formaldehyde inhalation in asthmatic subjects with suspected respiratory formaldehyde sensitization. American Journal of Industrial Medicine 33: 274-281. Cited in: TCEQ, 2008.
Kulle, T.J., Sauder, L.R., Hebel, J.R., Green, D.J., and Chatham, M.D. 1987. Formaldehyde dose-response in healthy nonsmokers. Japca 37(8): 919-924. Cited in: Cal EPA, 2014
MOE. 2012. Ontario’s Ambient Air Quality Criteria (AAQCs). Standards Development Branch. Ontario Ministry of the Environment. Available at: http://www.ene.gov.on.ca/stdprodconsume/groups/lr/@ene/@resources/documents/resource/std01_079182.pdf
Monticello, T.M., Swenberg, J.A., Gross, E.A., Leininger, J.R., Kimbell, J.S., Seilkop, S., Starr,
T.B., Gibson, J.E., and Morgan, K.T. 1996. Correlation of regional and nonlinear formaldehyde-induced nasal cancer with proliferating populations of cells. Cancer Res. 56:1012-1022. Cited in: Environment Canada and Health Canada, 2001
Pazdrak, K., Gorski, P., Krakowiak, A. and Ruta, U. 1993. Changes in nasal lavage fluid due to formaldehyde inhalation. Int Arch Occup Environ Health 64:515-519. Cited in: TCEQ, 2008 and ATSDR, 1999.
Schlosser, P.M., Lily, P.D., Conolly, R.B., et al. 2003. Benchmark dose risk assessment for
formaldehyde using airflow modeling and a single-compartment, DNA-protein cross-link dosimetry model to estimate human equivalent doses. Risk Anal. 23: 473-487. Cited in: TCEQ, 2008.
TCEQ. 2008. Formaldehyde (CASRN: 50-00-0). Developmental Support Document, Final, August 2008. Toxicology Section, Chief Engineer’s Office, Texas Commission on Environmental Quality. Available at: https://www.tceq.texas.gov/assets/public/implementation/tox/dsd/final/formaldehyde_50-00-0_final.pdf
US EPA IRIS. 1991. Formaldehyde (CASRN 50-00-0) Carcinogenicity Assessment for Lifetime
Exposure. United States Environmental Protection Agency Integrated Risk Information System. Available at: http://www.epa.gov/iris/subst/0419.htm#carc
Wilhelmsson, B. and Holmstrom, M. 1992. Possible mechanisms of formaldehyde-induced discomfort in the upper airways. Scandinavian Journal of Work & Environmental Health 18 403-407. Cited in: Cal EPA, 2008.
A-2.1.21 n-Hexane

Air Quality Study At Toronto Pearson International Airport – Human Health Risk Assessment August 2015 Intrinsik Environmental Sciences Inc. – Project #20-21515 Page A-65
Table A-21 presents the inhalation toxicity reference values considered as part of the current assessment. 1-Hour Acute Inhalation A suitable 1-hour acute inhalation TRV for n-hexane was not available for use in the assessment. 24-Hour Acute Inhalation A 24-hour acute inhalation exposure limit of 2,500 µg/m³ proposed by MOE (2012) for n-hexane (mixture) was selected for the use in this assessment. MOE (2012) derived an acute 24-hour AAQC of 2,500 µg/m³ based on an epidemiological study by Sanagi et al. (1980). This study examined workers who were exposed to concentrations of n-hexane in a tungsten carbide alloys facility for an average of 6.2 years. Fourteen workers under 50 years of age who were exposed to n-hexane were studied as well as a control group which consisted of 14 workers who were not exposed to n-hexane. The mean concentration of n-hexane, for the 8-hour time-weighted-average exposure period over 2-years, was 204 mg/m3 (58 ppm). Clinical and electro-physiological examinations were performed in this study. In the exposed group, headache, hyperaesthesia in the limbs, muscle weakness, paraesthesia and significant effects on muscle strength and vibration sensation were noted. The mean maximal motor conduction velocities in the posterior tibial nerve were significantly reduced as compared with those in the control group. The mean distal latency of the posterior tibial nerve was significantly increased in the exposed group. These observations were consistent with the n-hexane-induced peripheral neuropathy observed in animals. Based on these observations, a LOAEL of 58 ppm (204 mg/m3) for neurological effects was identified. This LOAEL was based on an 8-hour time-weighted-average for occupational exposure. The LOAEL was then converted to continuous exposure in the general population (assuming an occupational minute ventilatory volume of 10 m3/day and a daily minute ventilatory volume of 20 m3/day), which resulted in an adjusted LOAEL of 73 mg/m3. A cumulative uncertainty factor of 30 was applied to the adjusted LOAEL of 73 mg/m3 derived from the Sanagi et al. (1980) study. An uncertainty factor of 10 was applied to account for individual variability within the workers sampled. An uncertainty factor of 3 was applied to account for the potential interaction with other hydrocarbon solvents in commercial n-hexane. This resulted in a final AAQC for n-hexane (mixture) of 2,500 µg/m3. This value was selected for use in the assessment as it was the only appropriate TRV available. A final AAQC for n-hexane of 7,500 ug/m3 was also available for use. MOE (2012) indicated that this AAQC for n-hexane is only appropriate for evaluating n-hexane and hexane isomers, whereas the n-hexane (mixture) AAQC value accounts for the potential interaction of n-hexane with other hydrocarbon solvents. Due to the complex composition of the emissions anticipated, it was determined that the n-hexane (mixture) AAQC was more appropriate for use in the assessment. Chronic Inhalation – Non-Carcinogenic The chronic inhalation exposure limit of 670 µg/m³ proposed by TCEQ (2007) was selected for the use in the assessment. TCEQ (2007) derived a chronic inhalation exposure limit based on human occupational data from Chang et al. (1993). In this study, a 56 workers in a printing factory were evaluated for potential neurological effects. Workers were exposed to hexane concentrations ranging from 80 to 210 ppm, with an average exposure concentration of 132 ppm. Workers were exposed for 12 hours/day, 6 days/week for a mean duration of 2.6 years. Based on the study by Chang et al. (1993), symptomatic peripheral neuropathy was reported in 20 of 56 workers in an offset printing factory and another 26 workers had evidence

Air Quality Study At Toronto Pearson International Airport – Human Health Risk Assessment August 2015 Intrinsik Environmental Sciences Inc. – Project #20-21515 Page A-66
of subclinical neuropathy. Other reported effects included reductions in both sensory and action potentials, decreases in motor nerve conduction velocity and increased distal latency. The average concentration of 132 ppm was identified as a LOAEL by TCEQ (2007). The occupational POD (132 ppm) from the Chang et al. (1993) study was adjusted to a POD that is representative of a human equivalent concentration applicable to the general population (PODHEC). The PODHEC accounts for a non-occupational ventilation rate for a 24-hour day (20 m3/day) and a residential weekly exposure frequency (7 days/week). This resulted in a LOAELHEC of 57 ppm. A cumulative uncertainty factor of 300 was applied to the LOAELHEC of 57 ppm. An uncertainty factor of 10 was applied to account for the uncertainty of extrapolating from a LOAEL to a NOAEL. An uncertainty factor of 10 for intraspecies variation was applied to account for variation in sensitivity among the members of the human population. An uncertainty factor of 3 for database quality was applied to account for deficiencies in the available database (e.g. lack of two-generation reproductive/developmental studies). The resulting ReV of 670 µg/m³ based on neurological effects was selected for use in the assessment as it was the most conservative TRV available. MOE (2011) recommended the use of MOE 24-hour AAQC for use in the chronic inhalation assessment. However, the use of this acute-duration TRV for a chronic-duration assessment was not considered appropriate. Chronic Inhalation – Carcinogenic n-Hexane was not evaluated as a carcinogen via the inhalation route.
Table A-21 Inhalation Toxicity Reference Values
Type Duration Valuea Critical Effect Reference Point of
Departure UF Source
Date Derived
AAQC: 24-hour
Acute 2,500 Neurological
effects (human)
Sanagi et al. 1980
NOAEL (HEC): 73,000 µg/m³
30 MOE 2012
2005
MRL Chronic 2,100 Incidence of neurological
effects (human)
Sanagi et al. 1980
LOAEL: 58 ppm (204,000 µg/m3)
100 ATSDR,
1999 NA
TC Chronic 700 Peripheral neuropathy
(rat)
Huang et al. 1989
NOAEL: 50 ppm (1,762,000 µg/m³)
300 Health
Canada, 2010
NA
REL Chronic 7,000
Neurotoxicity; electrophysiological alterations
(human)
Miyagaki, 1967
LOAEL (HEC): 57.9 ppm
(204,000 µg/m3) 30
Cal EPA, 2000
NA
ReV Chronic 670 Neurological
effects (human) Chang et al. 1993
LOAEL (HEC): 57 ppm
(201,000 µg/m3) 300
TCEQ, 2007
2007
RfC Chronic 700 Peripheral neuropathy
(rat)
Huang et al., 1989
BMCL (HEC): 215 mg/m3 (215,000
µg/m3) 300
US EPA IRIS, 2005
2005
Shaded exposure limits were selected as toxicological reference values for the current risk assessment. NA Information was not available. a Units of µg/m3 unless otherwise noted.

Air Quality Study At Toronto Pearson International Airport – Human Health Risk Assessment August 2015 Intrinsik Environmental Sciences Inc. – Project #20-21515 Page A-67
References ATSDR. 1999. Toxicological Profile for n-Hexane. July 1999. Atlanta, GA: US Department of
Health and Human Services, Public Health Service. Agency for Toxic Substances and Disease Registry. Available at: http://www.atsdr.cdc.gov/toxprofiles/tp113.pdf
Chang, C.M., Yu, C.W., Fong, K.Y., Leung, S.Y., Tsin, T.W., Yu, Y.L., Cheung, T.F. and Chan,
S.Y. 1993. N-hexane neuropathy in offset printers. J Neurol Neurosurg Psychiatry 56(5): 538-542. Cited in: TCEQ, 2007.
Health Canada. 2010. Federal Contaminated Site Risk Assessment in Canada. Part II: Health
Canada Toxicological Reference Values (TRVs) and Chemical Specific Factors Version 2.0. Contaminated Sites Division. Safe Environments Programme. September 2010.
Huang, J; Kato, K., Shibata, E., Sugimura, K., Hisanaga, N. Ono, Y. and Takeuchi, Y. 1989.
Effects of chronic n-hexane exposure on nervous system-specific and muscle-specific proteins. Arch Toxicol 63:381-385. Cited in: Health Canada 2010 and US EPA IRIS, 2005.
Miyagaki H. 1967. Electrophysiological studies on the peripheral neurotoxicity of n-hexane. Jap.
J. Ind. Health 9(12-23): 660-671: Cited in: Cal EPA, 2000. MOE. 2012. Ontario’s Ambient Air Quality Criteria (AAQCs). Standards Development Branch.
Ontario Ministry of the Environment. Available at: http://www.ene.gov.on.ca/stdprodconsume/groups/lr/@ene/@resources/documents/resource/std01_079182.pdf
Cal EPA. 2000. Determination of Noncancer Chronic Reference Exposure Levels. Chronic
Toxicity Summary n-Hexane. California Office of Environmental Health Hazard Assessment. April 2000. Available at: http://www.oehha.ca.gov/air/hot_spots/2008/AppendixD3_final.pdf#page=292
Sanagi, S., Seki, Y., Sugimoto, K. and Hirata, M. 1980. Peripheral nervous system functions of
workers exposed to n-hexane at a low level. Int Arch Occup Environ Health 47:69-79. Cited in: MOE, 2012 and ATSDR, 1999.
TCEQ. 2007. n-Hexane (CASRN: 100-54-3). Developmental Support Document, Final, October
2007. Prepared by: Kadlubar, Bernard J. Toxicology Section, Chief Engineer’s Office, Texas Commission on Environmental Quality: Austin Texas. Available at: http://www.tceq.state.tx.us/assets/public/implementation/tox/dsd/hexane,n-_100-54-3_proposed.pdf
US EPA IRIS. 2005. n Hexane (CAS No. 110 54 3) Reference Concentration for Chronic
Inhalation Exposure. US Environmental Protection Agency Integrated Risk Information System. July 2005. US EPA Washington DC. Available at: http://www.epa.gov/ncea/iris/toxreviews/0486tr.pdf

Air Quality Study At Toronto Pearson International Airport – Human Health Risk Assessment August 2015 Intrinsik Environmental Sciences Inc. – Project #20-21515 Page A-68
A-2.1.22 Naphthalene Table A-22 presents the inhalation toxicity reference values considered as part of the current assessment. 1-Hour Acute Inhalation A suitable 1-hour acute inhalation TRV for naphthalene was not available for use in the assessment. 24-Hour Acute Inhalation The 24-hour AAQC of 22.5 µg/m3 proposed by MOE (2012) was selected for use in the assessment. While the 24-hour AAQC is based on health considerations, the specific basis of its derivation remains unknown as no supporting documentation is available. Despite this, the acute exposure limit was chosen as it was the only suitable TRV identified. Chronic Inhalation – Non-Carcinogenic The chronic inhalation MRL of 3.7 µg/m3 proposed by the ATSDR (2005) was selected for use in the assessment. The MRL was derived from two chronic inhalation toxicity and carcinogenicity studies with mice by NTP (1992; 2000). In the NTP (1992) study, groups of 75 B6C3F1 mice of each sex were exposed by inhalation at concentrations of 0, 10, or 30 ppm, 6 hours/day, 5 days/week for 104 weeks. In the NTP (2000) study, male and female F344 rats were exposed to 0, 10, 30 or 60 ppm for 6 hours/day, 5 days/week for a duration of 105 weeks. In both studies, subjects showed signs of non-neoplastic lesions in nasal olfactory epithelium and respiratory epithelium. Exposed rats also showed increased incidences of nasal tumors and exposed mice showed increase in lung tumors. A LOAEL for both studies of 10 ppm was identified for the incidence of non-cancerous lesions in olfactory epithelium. The LOAEL was adjusted for continuous exposure (6/24 hours × 5/7 days) to 1.8 ppm (or 9,400 µg/m³). This value was further adjusted to a LOAELHEC of 0.2 ppm (1,000 µg/m³) by multiplying the LOAELADJ by an RGDR of 0.132 (calculated by ATSDR). A cumulative uncertainty factor of 300 (to account for the use of a LOAEL (10), interspecies differences (3, due to the calculation of a HEC), and intraspecies variability (10)) was applied to LOAELHEC. This resulted in a final chronic MRL of 0.0007 ppm or 3.7 µg/m3. This value was selected for use in the assessment based on its current derivation and use of relatively low uncertainty factors. The chronic inhalation MRL of 3.7 µg/m3 proposed by the ATSDR (2005) was also recommended for use by MOE (2011). Chronic Inhalation – Carcinogenic Naphthalene was not evaluated as a carcinogen via the inhalation route.
Table A-22 Inhalation Toxicity Reference Values
Type Duration Valuea Critical Effect Reference Point of
Departure UF Source
Date Derived
AAQC; 24-hour
Acute 22.5 Health-based NA NA NA MOE, 2012
NA
RfC Chronic 3
Nasal effects, hyperplasia, and
metaplasia in respiratory and
olfactory epithelium (mouse)
NTP, 1992 LOAEL (HEC):
9.3 mg/m3 3,000
US EPA IRIS, 1998
1998

Air Quality Study At Toronto Pearson International Airport – Human Health Risk Assessment August 2015 Intrinsik Environmental Sciences Inc. – Project #20-21515 Page A-69
Table A-22 Inhalation Toxicity Reference Values
Type Duration Valuea Critical Effect Reference Point of
Departure UF Source
Date Derived
MRL Chronic 3.7
(0.0007 ppm)
Non-neoplastic lesions in nasal
olfactory epithelium and respiratory epithelium (rat)
NTP, 1992; 2000
LOAEL (HEC): 0.2
ppm (~1,048 µg/m3)
300 ATSDR,
2005 NA
REL Chronic 9
(0.002 ppm)
Respiratory effects (nasal inflammation, olfactory epithelial
metaplasia, respiratory epithelial
hyperplasia) (mouse)
NTP, 1992
LOAEL (ADJ):
1.8 ppm (~9,400 µg/m3)
1,000 Cal
EPA, 2000
NA
ESL Chronic 50 Health based NA NA NA TCEQ, 2013
2012
Shaded exposure limits were selected as toxicological reference values for the current risk assessment. NA Information was not available. a Units of µg/m3 unless otherwise noted.
References ATSDR. 2005. Toxicological Profile for Naphthalene, 1-Methylnaphthalene, and 2-
Methylnaphthalene. Agency for Toxic Substances and Disease Registry. US Public Health Service, Department of Health and Human Services, Atlanta, GA. August 2005.
Cal EPA. 2000. Chronic Toxicity Summary – Naphthalene. Air Toxics Hot Spots Program Risk
Assessment Guidelines, Part III: The Determination of Chronic Reference Exposure Levels. California Environmental Protection Agency, Office of Environmental Health Hazard Assessment, Air Toxicology and Epidemiology Section. April, 2000.
MOE. 2011. Rationale for the development of soil and ground water standards for use at
contaminated sites in Ontario. Ontario Ministry of the Environment. Standards Development Branch. PIBS: 7386e01.
MOE. 2012. Ontario’s Ambient Air Quality Criteria (AAQCs). Standards Development Branch.
Ontario Ministry of the Environment. Available at: http://www.ene.gov.on.ca/stdprodconsume/groups/lr/@ene/@resources/documents/resource/std01_079182.pdf
NTP. 1992. Toxicology and carcinogenesis studies of naphthalene in B6C3F1 mice (inhalation
studies). National Toxicology Program Technical Report Series No. 410. NIH Publication No. 92-3141.Cited in US EPA IRIS, 1998 and Cal EPA, 2000
NTP. 2000. Toxicology and carcinogenesis studies of naphthalene (CAS No. 91-20-3) in F344/N
rats (inhalation studies). National Toxicology Program. NTP TR 500, NIH Publ. No. 01-4434.Cited in ATSDR, 2005 and MOE, 2011
TCEQ. 2013. TCEQ Interoffice Memorandum Effects Screening Levels. Texas Commission on
Environmental Quality. Toxicology Division, Office of Executive Director. February, 2013. US EPA IRIS. 1998. Naphthalene (CASRN 91-20-3). Chronic Health Hazard Assessments for
Noncarcinogenic Effects. United States Environmental Protection Agency Integrated Risk Information System. Available at: http://www.epa.gov/iris/subst/0436.htm#refinhal

Air Quality Study At Toronto Pearson International Airport – Human Health Risk Assessment August 2015 Intrinsik Environmental Sciences Inc. – Project #20-21515 Page A-70
A-2.1.23 Styrene Table A-23 presents the inhalation toxicity reference values considered as part of the current assessment. 1-Hour Acute Inhalation The 1-hour acute inhalation REL of 21,000 µg/m³ derived by Cal EPA (2008) was selected for use in this assessment. In the key study by Stewart et al. (1968), a total of nine male volunteers were exposed to 51 ppm for 1 hour, 99 ppm for 7 hours, 117 ppm for 2 hours, 216 ppm for 1 hour or 376 ppm for 1 hour. During the exposure to 376 ppm of styrene, all 5 volunteers exhibited nasal irritation, nausea, significant discomfort, and an abnormal Romberg test after 25 minutes. Eye and throat irritation was observed in 3 out of 6 volunteers exposed to 99 ppm for 20 min. Nasal irritation was first noted in one subject after 20 min of exposure to 216 ppm. No symptoms were reported in any of the 3 subjects after exposure to 51 ppm for 1 hour. Therefore, Cal EPA (2008) determined the study NOAEL to be 51 ppm (~210,000 µg/m³) protective of eye and throat irritation effects. A cumulative uncertainty factor of 10 was applied to the selected NOAEL. An uncertainty factor of 10 for intra-species variability was applied to account for human variability and an uncertainty factor of 1 was applied for database uncertainty, as the overall quality and number of the studies are high. The result was an REL of 21,000 µg/m3. The approach taken by Cal EPA (2008) in deriving this TRV was identical to that of TCEQ (2008); however, likely due to rounding, the final TRV values were slightly different. The value derived by Cal EPA (2008) was selected for use in the assessment as it was the most conservative TRV available. 24-Hour Acute Inhalation The 24-hour acute inhalation exposure limit of 400 µg/m3 proposed by the MOE (2012) was selected for use in this assessment. While no scientific basis is provided for this limit, this value was selected for use in the assessment as it was the only appropriate TRV identified. Chronic Inhalation – Non-Carcinogenic The TCEQ (2008) has established a chronic ReV of 470 µg/m³ that was selected for use in the assessment. TCEQ (2008) derived this value based on a benchmark dose analysis by Rabovsky et al. (2001) using occupational exposure data from Mutti et al. (1984). The study population evaluated by Mutti et al. (1984) consisted of 50 male workers exposed to styrene for an average duration of 8.6 years and a control group of 50 manual labour workers. The mean exposure concentrations of styrene were determined to be 15, 44, 74 and 115 ppm. Benchmark dose analysis was completed on the data (Rabovsky et al., 2001), and a BMCL05 of 0.3 ppm was calculated based on abnormal memory, sensory and motor functions, and responses to neuropsychological tests. This concentration was adjusted to account for continuous exposure to a concentration of 0.11 ppm (470 µg/m³) (10/20 m³/day, 5/7 days). No uncertainty factors were applied to the BMCL (HEC) to account for intraspecies variability due to the conservative value derived (TCEQ, 2008). This value was selected for use in the current assessment as it was the most scientifically defensible human-based TRV identified. Insufficient information was provided for the TRV recommended by MOE (2011). Chronic Inhalation – Carcinogenic Styrene was not evaluated as a carcinogen via the inhalation route.
Table A-23 Inhalation Toxicity Reference Values
Type Duratio
n Valuea Critical Effect Reference
Point of Departure
UF Sourc
e Date
Derived

Air Quality Study At Toronto Pearson International Airport – Human Health Risk Assessment August 2015 Intrinsik Environmental Sciences Inc. – Project #20-21515 Page A-71
Table A-23 Inhalation Toxicity Reference Values
Type Duratio
n Valuea Critical Effect Reference
Point of Departure
UF Sourc
e Date
Derived
ReV; 1-hour
Acute 22,000 Eye and nasal
irritation (human)
Stewart et al., 1968
NOAEL (HEC): 51 ppm
(~220,000 µg/m3) 10
TCEQ, 2008
2008
REL; 1-hour
Acute 21,000 Eye and nasal
irritation (human)
Stewart et al., 1968
NOAEL (HEC): 51 ppm
(~210,000 µg/m3) 10
Cal EPA, 2008
2008
MRL; 1-hour
Acute 5 ppm
(~21,650 µg/m3)
No adverse symptoms or
observed adverse
effects on vision,
olfactory threshold
perception, or neurological
function were reported (human)
Ska et al., 2003
NOAEL: 49 ppm 10 ATSD
R, 2010
2010
AAQC; 24-hour
Acute 400 Health-based - - - MOE, 2012
NA
ReV Chronic 470 Neurological
effects (human)
Mutti et al.,
1984; Rabovsky et al., 2001
BMCL05 (HEC): 0.11 ppm
(470 µg/m3) 1
TCEQ, 2008
2008
RfC Chronic 1,000 Neurological
effects (human)
Mutti et al., 1984
NOAEL (HEC): 34 mg/m3
(34,000 µg/m3) 30
US EPA IRIS, 1993
1993
TC Chronic 92
Decreased pup body weight,
decreased neuroamines
and neurological/ behavioural
changes (rat)
Kishi et al., 1992
LOAEL (HEC) 46 mg/m3
(46,000 µg/m3) 500
Health Canada, 2010
1993
AQG Weekly average
260
Subtle reductions in visuomotor
accuracy and verbal learning
skills and subclinical effects on
colour vision (human)
NA LOAEL (ADJ) (25.5 mg/m3)
(25,500 µg/m3) 100
WHO, 2000
NA
MRL Chronic 0.2 ppm (~870 µg/m3)
Reversible clinical colour vision change
(human)
Meta-analysis of
multiple studies
LOAEL (ADJ): 4.8 ppm
(~21,000 µg/m3) 30
ATSDR,
2010 2010
REL Chronic 900 Neuropyscholo
gical deficit (human)
Mutti et al., 1984
BMC05 (HEC): 0.61 ppm
(~2,600 µg/m3) 3
Cal EPA, 2000
2000
TCA Chronic 900 Neurological
effects (human)
Mutti et al., 1984
NOAEC (ADJ): 6 ppm
(~26,000 µg/m3) 30
RIVM, 2001
2001

Air Quality Study At Toronto Pearson International Airport – Human Health Risk Assessment August 2015 Intrinsik Environmental Sciences Inc. – Project #20-21515 Page A-72
Table A-23 Inhalation Toxicity Reference Values
Type Duratio
n Valuea Critical Effect Reference
Point of Departure
UF Sourc
e Date
Derived
Shaded exposure limits were selected as toxicological reference values for the current risk assessment NA Information was not available. a Units of µg/m3 unless otherwise noted.
References ATSDR. 2010. Toxicological Profile for Styrene. Agency for Toxic Substances and Disease
Control, Public Health Service, US Department of Health and Human Services. Cal EPA. 2000. Chronic Toxicity Summary – Styrene. Air Toxics Hot Spots Program Risk
Assessment Guidelines, Part III: The Determination of Chronic Reference Exposure Levels. California Environmental Protection Agency, Office of Environmental Health Hazard Assessment, Air Toxicology and Epidemiology Section. April, 2000.
Cal EPA. 2008. TSD for Noncancer RELs. Appendix D. Individual acute, 8 hour, and chronic
reference exposure levels. December 2008. California Environmental Protection Agency, Office of Environmental Health Hazard Assessment. Sacramento, CA. Available at: http://www.oehha.ca.gov/air/hot_spots/2008/AppendixD2_final.pdf
Health Canada. 2010. Federal Contaminated Site Risk Assessment in Canada. Part II, Health
Canada Toxicological Reference Values. Prepared by the Contaminated Sites Division. Health Canada, Ottawa, Ontario.
Kishi, R., Katakura, Y., Ikeda, T., Chen, B.Q. and Miyake, H. 1992. Neurochemical effects in
rats following gestational exposure to styrene. Toxicol Lett 63:141–146. Cited In: Health Canada, 2010.
MOE. 2011. Rationale for the Development of Generic Soil and Groundwater Standards for use
at Contaminated Sites in Ontario. Standards Development Branch, Ontario Ministry of the Environment.
MOE. 2012. Ontario’s Ambient Air Quality Criteria (AAQCs). Standards Development Branch.
Ontario Ministry of the Environment. Available at: http://www.ontario.ca/environment-and-energy/ontarios-ambient-air-quality-criteria-sorted-chemical-abstracts-service
Mutti, A., Mazzucchi, A., Rusticelli, P., Frigeri, G., Arfini, G. and Franchini, I. 1984. Exposure
effect and exposure-response relationships between occupational exposure to styrene and neuropsychological functions. Am J Ind Med 5:275-286. Cited in: TCEQ, 2008, Cal EPA, 2000, US EPA IRIS, 1993, and RIVM, 2001.
Rabovsky, J, J Fowles, DH Martin, and DC Lewis. 2001. A health risk benchmark for the
neurologic effects of styrene: Comparison with NOAEL/LOAEL approach. Risk Anyalysis 21(1): 117-126. Cited in: TCEQ, 2008.
RIVM. 2001. Re-evaluation of human toxicological maximum permissible risk levels. National Institute of Public Health and the Environment (RIVM). RIVM Report 711701 025. March 2001.

Air Quality Study At Toronto Pearson International Airport – Human Health Risk Assessment August 2015 Intrinsik Environmental Sciences Inc. – Project #20-21515 Page A-73
Ska, B., Vyskocil, A., Tardif, R., et al. 2003. Effects of peak concentrations on the neurotoxicity of styrene in volunteers. Hum Exp Toxicol 22:407-415. Cited in: ATSDR, 2010.
Stewart, R.D., Dodd, H.C., Baretta, E.D., and Schaffer, A.W. 1968. Human exposure to styrene
vapor. Arch Environ Health. 16:656-662. Cited in: TCEQ, 2008 and Cal EPA, 2008.
TCEQ. 2008. Styrene (CASRN: 100-42-5). Development Support Document, Final, August 2008. Chief Engineer’s Office, Texas Commission on Environmental Quality. Available at: http://www.oehha.ca.gov/air/hot_spots/2008/AppendixD2_final.pdf#page=256
US EPA IRIS. 1993. Styrene (CASRN 100-42-5). Chronic Health Hazard Assessments for
Noncarcinogenic Effects – Inhalation RfC Summary. Integrated Risk Information System. US Environmental Protection Agency. Available at http://www.epa.gov/ncea/iris/subst/0104.htm.
WHO. 2000. Air Quality Guidelines for Europe.2nd Edition. World Health Organization. Regional
Office for Europe. WHO Regional Publications, European Series, No. 91. ISBN 92 890 1358 3.

Air Quality Study At Toronto Pearson International Airport – Human Health Risk Assessment August 2015 Intrinsik Environmental Sciences Inc. – Project #20-21515 Page A-74
A-2.1.24 Toluene Table A-24 presents the inhalation toxicity reference values considered as part of the current assessment. 1-Hour Acute Inhalation The 1-hour acute inhalation ReV of 15,000 µg/m³ derived by the TCEQ (2014) was selected for use in the assessment. The 1-hour acute inhalation value is based on a study by Andersen et al. (1983), who exposed 16 healthy subjects with no previous exposure to organic solvents to toluene for 6 hours/day over 4 consecutive days. A statistically significant increase in the occurrence of headaches, dizziness, and feeling of intoxication was observed and a NOAEL of 40 ppm (150,000 µg/m3) was identified. TCEQ (2014) applied an uncertainty factor of 10 to the NOAEL for intra-species variability to account for sensitive subpopulations. An uncertainty factor of only 1 was applied to account for the conversion of animal data to human data since the toxicological database for toluene is extensive. The 1-hour ReV was calculated to be 15,000 µg/m³. This value was selected for use in the assessment as it was the most conservative value TRV available. 24-Hour Acute Inhalation The acute (14 days or less) inhalation MRL of 3,800 µg/ m3 derived by ATSDR (2000) was selected for use in the assessment (24-hour acute inhalation). ATSDR (2000) adjusted the NOAEL of 40 ppm found in the Andersen et al. (1983) study (as described above) to account for intermittent exposure (8/24 hours x 5/7 days). An uncertainty factor for 10 was applied to the adjusted NOAEL to account for intra-species variability, resulting in an MRL of 0.95 ppm, which was rounded to 1 ppm (3,800 µg/ m3). This value was selected for use in the assessment as it was the only TRV available. Chronic Inhalation – Non-Carcinogenic The chronic inhalation exposure limit of 5,000 µg/m3 proposed by the US EPA IRIS (2005) was used for the assessment of toluene. The US EPA IRIS (2005) derived a chronic inhalation RfC of 5,000 µg/ m3 that was based on neurological effects in occupationally-exposed workers. The US EPA IRIS (2005) examined multiple human studies (10) and the weight of evidence indicated that neurological effects were the most sensitive endpoint. An average NOAEL of 34 ppm (128,000 µg/m3) was identified by US EPA IRIS from the meta-analysis. This NOAEL was adjusted for the differences in breathing rates between workers and members of the public and the reduced weekly exposure time, resulting in a NOAEL (ADJ) of 46 mg/m3 (46,000 µg/m3) (US EPA IRIS, 2005). An uncertainty factor of 10 to account for intra-species variability was applied to the NOAEL (ADJ) resulting in an RfC of 5 mg/m3 (5,000 µg/m3). This value was selected for use in the assessment as it represents the most recent analysis of the available scientific literature. This value was also recommended for use by MOE (2011). Chronic Inhalation – Carcinogenic Toluene was not evaluated as a carcinogen via the inhalation route.
Table A-24 Inhalation Toxicity Reference Values
Type Duration Valuea Critical Effect Reference Point of
Departure UF Source
Date Derived
ReV; 1-hour
Acute 15,000
Eye and nose irritation; increased occurrence of
headache, dizziness, and intoxication
(humans)
Andersen et al., 1983
NOAEL: 40 ppm
(150,000 µg/m3)
10 TCEQ, 2014
2008

Air Quality Study At Toronto Pearson International Airport – Human Health Risk Assessment August 2015 Intrinsik Environmental Sciences Inc. – Project #20-21515 Page A-75
Table A-24 Inhalation Toxicity Reference Values
Type Duration Valuea Critical Effect Reference Point of
Departure UF Source
Date Derived
REL; 1-hour
Acute 37,000 Headache, dizziness, slight eye and nose
irritation
Andersen et al., 1983
NOAEL (ADJ): 98 ppm
(370,000 µg/m3)
10 Cal
EPA, 2008
2008
MRL; 14 days or lessb
Acute 3,800 Neurological effects
(humans) Andersen
et al., 1983
NOAEL (ADJ): 1 ppm
(38,000 µg/m3) 10
ATSDR, 2000
2000
RfC Chronic 5,000 Neurological effects
(humans)
Multiple human studies
NOAEL (ADJ): 46,000 µg/m3
10 US EPA
IRIS, 2005
2005
MRL Chronic 300 Alcohol- and age-
adjusted colour vision impairment (humans)
Zavalic et al., 1998
LOAEL (ADJ): 8 ppm
(30,000 µg/m3) 100
ATSDR, 2000
2000
TC Chronic 3,750
Increased relative liver and kidney weight
neurotoxic, irritation of the respiratory tract
Andersen et al., 1983
NOAEL (ADJ): 37.5 mg/m3
(37,500 µg/m3) 10
Health Canada,
2010 2010
REL Chronic 300
Decreased brain (subcortical limbic area)
weight, altered dopamine receptor (caudate-putamen)
binding
Hillefors-Berglund et al., 1995; Foo et al.,
1990
NOAEL (ADJ): 7 ppm
(26,000 µg/m3) 100
Cal EPA, 2008
2000
ReV Chronic 4,100 Colour vision impairment
Zavalic et al., 1998
NOAEL: 11 ppm
(41,000 µg/m3) 10
TCEQ, 2014
2008
TCA Chronic 400 Neurological effects NA NA NA RIVM, 2001
2000
Shaded exposure limits were selected as toxicological reference values for the current risk assessment. NA Information was not available. a Units of µg/m3 unless otherwise noted. b Value taken as 24-hour TRV.
References
Andersen, I., Lundqvist, G.R., Molhave, L., et al. 1983. Human response to controlled levels of
toluene in six-hour exposures. Scand J Work Environ Health 9: 405-418. Cited in TCEQ, 2014, Cal EPA, 2008, ATSDR, 2000 and Health Canada, 2010.
ATSDR. 2000. Toxicological Profile for Toluene. US Department of Health and Human Services,
Public Health Service. Agency for Toxic Substances and Disease Registry. September, 2000. Available at: http://www.atsdr.cdc.gov/toxprofiles/tp56.pdf
Cal EPA. 2008. TSD for Noncancer RELs. Appendix D. Individual acute, 8 hour, and chronic
reference exposure levels. December 2008. California Environmental Protection Agency, Office of Environmental Health Hazard Assessment. Sacramento, CA. Available at: http://www.oehha.ca.gov/air/hot_spots/2008/AppendixD2_final.pdf
Foo, S.C., Jeyaratnam, J. and Koh, D. 1990. Chronic neurobehavioral effects of toluene. Br. J.
Ind. Med. 47(7):480-484. Cited in: Cal EPA, 2008. Health Canada. 2010. Federal Contaminated Site Risk Assessment in Canada. Part II: Health
Canada Toxicological Reference Values (TRVs) and Chemical Specific Factors Version 2.0. Contaminated Sites Division. Safe Environments Programme.

Air Quality Study At Toronto Pearson International Airport – Human Health Risk Assessment August 2015 Intrinsik Environmental Sciences Inc. – Project #20-21515 Page A-76
Hillefors-Berglund, M., Liu, Y., and von Euler, G. 1995. Persistent, specific and dose-dependent effects of toluene exposure on dopamine D2 agonist binding in the rat caudate-putamen. Toxicology 100:185-94. Cited in: Cal EPA, 2008.
MOE. 2011. Rationale for the development of soil and ground water standards for use at
contaminated sites in Ontario. Ontario Ministry of the Environment. Standards Development Branch. PIBS: 7386e01.
RIVM. 2001. Re-evaluation of human toxicological maximum permissible risk levels. National
Institute of Public Health and the Environment (RIVM). RIVM Report 711701 025. March 2001.
TCEQ. 2014. Toluene (CASRN: 108-88-3). Development Support Document, Final. Prepared by
Manual Reyna Toxicology Section. Chief Engineer’s Office. Texas Commission on Environmental Quality. April 2008. Available at: https://www.tceq.texas.gov/assets/public/implementation/tox/dsd/final/mar2014/toluene_108-88-3_revised_odor.pdf
US EPA IRIS. 2005. Toluene (CASRN 108-88-3). Chronic Health Hazard Assessments for
Noncarcinogenic Effects. United States Environmental Protection Agency Integrated Risk Information System. Available at: http://www.epa.gov/iris/subst/0118.htm#refinhal
Zavalic, M., Mandic, Z., Turk, R., et al. 1998. Quantitative assessment of colour vision
impairment in workers exposed to toluene. Am J Med 32: 297-304. Cited in: ATSDR, 2000 and TCEQ, 2014.

Air Quality Study At Toronto Pearson International Airport – Human Health Risk Assessment August 2015 Intrinsik Environmental Sciences Inc. – Project #20-21515 Page A-77
A-2.1.25 Xylenes Table A-25 presents the inhalation toxicity reference values considered as part of the current assessment. 1-Hour Acute Inhalation The acute 1-hour ReV of 1.7 ppm (7,400 µg/m3) derived by TCEQ (2014) for xylenes based on mild respiratory effects and subjective symptoms of neurotoxicity was selected for the use in this assessment. Ernstgard et al. (2002) was selected as the key study for the derivation of the acute ReV. In this study, 56 human volunteers (28 male and 28 female) were exposed to 50 ppm m-xylene, clean air, or 150 ppm 2-propanol for 2-hours in an inhalation chamber (TCEQ 2009). The TCEQ (2014) identified a LOAEL of 50 ppm (200 mg/m3) based on breathing difficulty in both sexes and discomfort in the throat and airways of females. A cumulative uncertainty factor of 30 (10 to account for intra-species variability and 3 for the use of a LOAEL) was applied to the LOAEL resulting in a 1-hour ReV of 1.7 ppm (7,400 µg/m3). This value was selected for use in the assessment as it was the most conservative TRV identified. 24-Hour Acute Inhalation The 24-hour acute inhalation exposure limit of 730 µg/m3 proposed by the MOE (2012) was selected for the use in this assessment. While no scientific basis is provided for this limit, this value was selected for use in the assessment as it was the only appropriate TRV identified. Chronic Inhalation – Non-Carcinogenic Cal EPA (2008a) developed a chronic REL of 700 µg/m3 based on the incidence of eye irritation, sore throat and mild neurological effects in a population of 175 workers who were exposed to xylene for an average of 7 years in a study conducted by Uchida et al. (1993). Cal EPA (2008a) identified a LOAEL of 14.2 ppm. This value was adjusted to account for continuous exposure, differences in breathing air volumes/day between workers and the general public, and the number of days in a work week (5 days/week). A cumulative uncertainty factor of 30 (3 for the use of a LOAEL and 10 for intra-species variability) was applied to the adjusted LOAEL to derive an REL of 0.02 ppm (700 µg/m3). This value was recommended for use by MOE (2011). The US EPA IRIS (2003) derived an RfC of 100 µg/m3 from a NOAEL of 50 ppm (217 mg/m3) based on impaired motor coordination from a subchronic inhalation study in male rats (Korsak et al., 1994). In this study, male rats were exposed to 0, 50, or 100 ppm of m-xylene, n-butyl alcohol, or a 1:1 mixture of toluene and xylene for 6 hours/day, 5 days/week for 3 months. A LOAEL of 100 ppm and a NOAEL of 50 ppm were identified based on neurological effects (decreased rotarod performance and response to heat). The NOAEL of 50 ppm (217 mg/m3) was adjusted for continuous exposure (6/24 hours, 5/7 days) to provide a NOAEL (HEC) of 39 mg/m3. A cumulative uncertainty factor of 300 (3 to account for inter-species variability, 10 for intra-species variability, 3 for extrapolation from subchronic to chronic duration, and 3 for database deficiencies) was applied to the NOAEL (HEC) to derive the RfC of 100 µg/m3. This value was selected for use in the assessment as it was the most conservative TRV available. Chronic Inhalation – Carcinogenic Xylenes (total) were not evaluated as carcinogens via the inhalation route.

Air Quality Study At Toronto Pearson International Airport – Human Health Risk Assessment August 2015 Intrinsik Environmental Sciences Inc. – Project #20-21515 Page A-78
Table A-25 Inhalation Toxicity Reference Values
Type Duration Valuea Critical Effect Reference Point of
Departure UF Source
Year Derived
ReV; 1-hour
Acute 7,400
Mild respiratory effects and subjective
symptoms of neurotoxicity in
human volunteers
Ernstgard et al., 2002
LOAEL: 220,000 µg/m3
30 TCEQ, 2014
2009
REL; 1-hour
Acute 22,000 Eye, nose, and throat irritation
Carpenter et al., 1975; Hastings et al., 1984; Nelson et al., 1943
NOAEL: 220,000 µg/m3
10 Cal
EPA, 2008b
2008
AAQC; 24-hour
Acute 730 Health-based NA NA NA MOE, 2012
2012
ReV Chronic 610
Mild respiratory and subjective neurological
effects in factor workers
Uchida et al., 1993
LOAEL: 14 ppm
(61,000 µg/m3)
100 TCEQ, 2014
2009
MRL Chronic 220
Subjective symptoms of
neurotoxicity and respiratory
toxicity
Uchida et al., 1993
LOAEL: 14 ppm
(61,000 µg/m3)
300 ATSDR, 2007
2007
REL Chronic 700
CNS effects in humans; irritation
of the eyes, nose, and throat
Uchida et al., 1993
LOAEL (ADJ): 5.1
ppm (22,000 µg/m3)
30 Cal
EPA, 2008a
2000
RfC Chronic 100
Impaired motor coordination (decreased
rotarod performance)
Korsak et al., 1994
NOAEL (HEC): 39
mg/m3
(39,000 µg/m3)
300
US EPA IRIS, 2003
2003
pTC Chronic 180
Maternal effects, fetal retardation,
increased proportion of fetal
mortality and resorbed fetuses
Condie et al., 1988
LOAEL (HEC):
180,000 µg/m3
1,000 Health
Canada, 2010
2010
TCA Chronic 870 Developmental neurotoxicity
Hass and Jakobsen, 1993; Hass et al., 1995
LOAEL: 870 mg/m3
(870,000 µg/m3)
1,000 RIVM, 2001
2001
Shaded exposure limits were selected as toxicological reference values for the current risk assessment. a Units of µg/m3 unless otherwise noted.
References ATSDR. 2007. Toxicological Profile for Xylene. US Department of Health and Human Services,
Public Health Service. Agency for Toxic Substances and Disease Registry. Atlanta, Georgia. Available at: http://www.atsdr.cdc.gov/toxprofiles/tp71-c1.pdf
Cal EPA. 2008a. Determination of Noncancer Reference Exposure Levels. Chronic Toxicity
Summary. Xylenes. April 2000. California Environmental Protection Agency. Available at: http://oehha.ca.gov/air/chronic_rels/pdf/xylensREL.pdf

Air Quality Study At Toronto Pearson International Airport – Human Health Risk Assessment August 2015 Intrinsik Environmental Sciences Inc. – Project #20-21515 Page A-79
Cal EPA. 2008b. Determination of Noncancer Reference Exposure Levels. Acute Toxicity Summary. Xylenes. June 2008. California Environmental Protection Agency. Available at: http://www.oehha.ca.gov/air/acute_rels/pdf/xylenesa.pdf
Carpenter, C.P., Kinkead, E.R., Geary, D.L. Jr., Sullivan, L.J., and King, J.M. 1975. Petroleum
hydrocarbon toxicity studies. V. Animal and human response to vapors of mixed xylenes. Toxicol Appl Pharmacol. 33:543-558. Cited in: Cal EPA, 2008b.
Condie, L.W., Hill, J.R., and Borzelleca, J.F. 1988. Oral toxicology studies with xylene isomers
and mixed xylenes. Drug Chem toxicol. 11(4): 329-354. Cited in: Health Canada, 2010. Ernstgard, L., Gullstrand, E., Lof, A. and Johanson, G. 2002. Are women more sensitive than
men to 2 propanol and m xylene vapours? Occup Environ Med. 59:759 767. Cited in: TCEQ, 2014.
Hass, U., and Jakobsen, B.M. 1993. Prenatal toxicity of xylene inhalation in the rat: a
teratogenicity and postnatal study. Pharmacol Toxicol 73:20 23. Cited in: RIVM, 2001. Hass, U., Lund, S.P., Simonsen, L. and Fries, A.S. 1995. Effects of prenatal exposure to xylene
on postnatal development and behavior in rats. Neurotoxicol Teratol 17(3):341 349. Cited in: RIVM, 2001.
Hastings, L., Cooper, G.P. and Burg, W. 1984. Human sensory response to selected petroleum
hydrocarbons. In: Advances in Modern Environmental Toxicology. Volume VI. Applied Toxicology of Petroleum Hydrocarbons. 1984. MacFarland, H.N., Holdsworth, C.E., MacGregor, J.A., Call, R.W. and Lane, M.L, eds. Princeton Scientific Publishers, Inc., Princeton, New Jersey. p. 255 270. Cited in: Cal EPA, 2008b.
Health Canada. 2010. Federal Contaminated Site Risk Assessment in Canada. Part II: Health
Canada Toxicological Reference Values (TRVs) and Chemical Specific Factors Version 2.0. Contaminated Sites Division. Safe Environments Programme. September 2010.
Korsak, Z., Wisniewska Knypl, J. and Swiercz, R. 1994. Toxic effects of subchronic combined
exposure to n butyl alcohol and m xylene in rats. International Journal of Occupational Medicine and Environmental Health 7:155 166. Cited in: US EPA IRIS, 2003.
MOE. 2011. Rationale for the Development of Soil and Ground Water Standards for use at
Contaminated Sites in Ontario. Standards Development Branch, Ontario Ministry of the Environment. PIBS 7386e01.
MOE. 2012. Ontario’s Ambient Air Quality Criteria (AAQCs) (Sorted by Chemical Abstracts
Service Registry Number CASRN). Standards Development Branch. Ontario Ministry of the Environment.
Nelson, K.W., Ege, J.F., Ross, M., Woodman, L.E., and Silverman, L. 1943. Sensory response
to certain industrial solvent vapors. J Ind Hyg Toxicol. 25(7):282-285. Cited in: Cal EPA, 2008b.
RIVM. 2001. Re-evaluation of human toxicological maximum permissible risk levels. National Institute of
Public Health and the Environment (RIVM). RIVM Report 711701 025. March 2001.
TCEQ. 2014. Xylenes. (CASRN: Xylenes mixture: 1330-20-7; m-xylene: 108-38-3; o-Xylene:
95-47-6; p-Xylene: 106-42-3). Development Support Document, Revised Odor: March

Air Quality Study At Toronto Pearson International Airport – Human Health Risk Assessment August 2015 Intrinsik Environmental Sciences Inc. – Project #20-21515 Page A-80
21, 2014. Chief Engineer’s Office, Texas Commission on Environmental Quality. Available at: https://www.tceq.texas.gov/assets/public/implementation/tox/dsd/final/mar2014/xylenes_all%20isomers_revised_odor.pdf
Uchida, Y., Nakatsuka, H., Ukai, H., Watanabe, T., Liu, Y T., Huang, M Y., Want, Y L., Zhu, F
Z., Yin, H. and Ikeda, M. 1993. Symptoms and signs in workers exposed predominately to xylenes. Int Arch Occup Environ Health 64:597 605. Cited in: ATSDR, 2007, Cal EPA, 2008a, and TCEQ, 2014.
US EPA IRIS. 2003. Summary of Xylenes (1330 20 7). Reference Concentration for Chronic
Inhalation Exposure (RfC). US Environmental Protection Agency Integrated Risk Information System. Available at: http://www.epa.gov/ncea/iris/subst/0270.htm#refinhal

Air Quality Study At Toronto Pearson International Airport – Human Health Risk Assessment August 2015 Intrinsik Environmental Sciences Inc. – Project #20-21515 Page A-81
A-2.1.26 Carcinogenic Polycyclic Aromatic Hydrocarbons (PAHs) Table A-26 presents the inhalation toxicity reference values considered as part of the current assessment. 1-Hour Acute Inhalation A suitable 1-hour acute inhalation TRV for benzo(a)pyrene was not available for use in the assessment. 24-Hour Acute Inhalation A suitable 24-hour acute inhalation TRV for benzo(a)pyrene was not available for use in the assessment. Chronic Inhalation – Non-Carcinogenic A suitable chronic non-cancer inhalation TRV for benzo(a)pyrene was not available for use in the assessment. Chronic Inhalation – Carcinogenic The inhalation URF proposed by Cal EP (2009) was selected for the use in the assessment. Cal EPA (2009) presents an inhalation unit risk estimate of 1.1E-03 per µg/m³ based on a study by Thyssen et al. (1981), which evaluated exposures to benzo(a)pyrene via multi-stage modelling of respiratory tract tumours in Syrian golden hamsters. In the key study, groups of 24 male Syrian golden hamsters were exposed by inhalation to 0, 2.2, 9.5, or 46.5 mg/m³ benzo(a)pyrene for 4.5 hours/day, 7 days/week for the first 10 weeks of the study, and for 3 hours/day for the rest of the exposure period (up to 96 weeks). A decrease in body weight gain in exposed animals was observed during the first 10 weeks of the study; however, with the exception of the high exposure group, the body weights of all surviving exposed animals were similar to those of the controls from the 10th to the 60th week. Mean survival decreased only in the highest exposure group.
Cancer risk associated with exposure to ambient levels of benzo(a)pyrene was estimated by extrapolating from the experimental data from Thyssen et al. (1981) to ambient levels by means of the best fitting linearized multistage procedure GLOBAL86 (Howe et al., 1986). The linearized multistage model was fit to the respiratory tract tumor data from Thyssen et al. (1981) resulting from inhalation exposure of hamsters to benzo(a)pyrene. By considering the conditions of exposure given in the report and using an inhalation rate of 0.063 m3/day and a body weight of 0.12 kg for hamsters, a dose of benzo(a)pyrene in mg/kg-day was estimated. A q1* (animal) equal to 0.43 (mg/kg-day)-1 was obtained. Multiplying by the interspecies surface area correction factor of (70/0.1)1/3 yielded a human equivalent q1* of 1.1×10⁻³ (µg/m3)-1 for inhalation. This final inhalation URF of 1.1×10⁻³ (µg/m3)-1 was also endorsed by MOE (2011).
Table A-26 Inhalation Toxicity Reference Values
Type Duration Valuea Critical Effect Reference Point of
Departure UF Source
Date Derived
AAQC; Annual average
Chronic 1.0 x 10⁻⁵ Health based NA NA NA MOE, 2012
2012
UR Chronic 0.087
(µg/m3)-1 Incidence of lung cancer
WHO, 1998 NA NA WHO, 2000
2000
UR Chronic 3.1 x 10⁻⁵ (µg/m3)-1
Respiratory tract tumour (hamster)
Thyssen et al., 1981
NA NA Health
Canada, 2010
2010
UR Chronic 1.1 x 10⁻³ (µg/m3)-1
Respiratory tract tumour (hamster)
Thyssen et al., 1981
NA NA Cal EPA,
2009 2009
Shaded exposure limits were selected as toxicological reference values for the current risk assessment.

Air Quality Study At Toronto Pearson International Airport – Human Health Risk Assessment August 2015 Intrinsik Environmental Sciences Inc. – Project #20-21515 Page A-82
Table A-26 Inhalation Toxicity Reference Values
Type Duration Valuea Critical Effect Reference Point of
Departure UF Source
Date Derived
NA Information was not available. a Units of µg/m3 unless otherwise noted.
References Cal EPA. 2009. Appendix B. Chemical-specific summaries of the information to derive unit risk
and cancer potency values. California Environmental Protection Agency. Cited in: MOE 2011. Available at: http://www.oehha.ca.gov/air/hot_spots/2009/AppendixB.pdf
Health Canada. 2010. Federal Contaminated Site Risk Assessment in Canada. Part II: Health
Canada Toxicological Reference Values (TRVs) and Chemical Specific Factors Version 2.0. Contaminated Sites Division. Safe Environments Programme.
Howe RB, Crump KS and Van Landingham C 1986. GLOBAL86: a computer program to
extrapolate quantal animal toxicity data to low doses. KS Crump and Company, Ruston, LA. Cited in: Cal EPA, 2009.
MOE. 2012. Ontario’s Ambient Air Quality Criteria (AAQCs). Standards Development Branch.
Ontario Ministry of the Environment. Available at: http://www.ene.gov.on.ca/stdprodconsume/groups/lr/@ene/@resources/documents/resource/std01_079182.pdf
MOE. 2011. Rationale for the development of soil and ground water standards for use at
contaminated sites in Ontario. Standards Development Branch. PIBS: 7386e01. Thyssen, J., Althoff, J., Kimerle, G., and Mohr, U. 1981. Inhalation studies with benzo[a]pyrene
in Syrian golden hamsters. J Natl. Cancer Inst. 66: 575-577. Cited in: Health Canada, 2010 and Cal EPA, 2009.
WHO. 2000. Air Quality Guidelines for Europe (2nd Edition) Regional Office for Europe,
Copenhagen. World Health Organization Regional Publications, European Series, No. 91. Available at: http://www.euro.who.int/document/e71922.pdf
WHO. 1998. Environmental Health Criteria 202: Selected Non-heterocyclic Polycyclic Aromatic
Hydrocarbons. World Health Organization, Geneva. Cited in: WHO, 2000.

APPENDIX B
RATIONALE FOR THE SELECTION OF CHEMICALS OF CONCERN

Air Quality Study at Toronto Pearson International Airport – Human Health Risk Assessment August 2015 Intrinsik Environmental Sciences Inc. – Project #20-21515 Page B-1
APPENDIX B: RATIONALE FOR THE SELECTION OF CHEMICALS OF CONCERN B-1.0 INTRODUCTION The human health risk assessment (HHRA) focused on both direct and indirect health risks associated with air emissions from Toronto Pearson. Due to the complex chemical nature of the emissions from the airport, it was not possible to evaluate potential risks from all chemicals emitted. To address this, the standard risk assessment approach is to conduct a detailed screening whereby the list of chemicals is reduced to those chemicals that are the most significant contributors to the predicted human health risk. This appendix outlines the approach taken to identify the COCs evaluated in the HHRA. B-2.0 EMISSIONS MODELLING AND SPECIATION Current airport and aircraft emissions were estimated based on the aircraft schedule at Toronto Pearson during 2011. Emissions sources included aircraft landing, takeoff, and on-ground taxiing as well as emissions from ground support equipment, passenger vehicles used on the airside and on-site roads were estimated with the aid of the EDMS model. For future scenarios (2022 and 2032), projected aircraft movements, types and passenger numbers were provided by GTAA and inputted into EDMS to estimate future emissions. Predicted impacts of emissions from off-site, non-GTAA related sources and activities were also considered for the Baseline Case. Regional emissions for 2006 within the 7.5 km radius of the airport were quantified using Environment Canada’s 2006 SMOKE emissions inventory (Environment Canada, 2006) as well as transportation related emissions provided by Ontario Ministry of the Environment and Climate Change (MOECC). Dispersion modelling was carried out using the emissions values from Toronto Pearson as well as the local regional emissions from the surrounding 7.5 km radius. Dispersion modelling was carried out using EDMS as well as the AERMOD dispersion model. These dispersion models predicted the overall air quality in the area within 7.5 km of the airport property boundary. B-2.1 Emissions Speciation Based on the modelling performed by Golder (2015), a list of volatile organic compounds (VOCs) were determined to be of concern in the Study Domain and initially considered in the HHRA (Table B-1). All CACs presented by Golder (2015), including CO, NO2 PM2.5, PM10, and SO2 were also retained for evaluation in the HHRA.
Table B-1 Speciated Volatile Organic Compounds Associated with Airport Operations
Chemical Parameters Percent Composition of Total VOCsa
Formaldehyde 9.64%
Methyl alcohol 1.32%
Benzene 2.24%
Acetaldehyde 3.32%
Naphthalene 0.39%
O-xylene 0.30%
Isopropylbenzene (cumene) 0.00205%
Ethylbenzene 0.26%
Styrene 0.23%
1,3-butadiene 1.29%
Acrolein 1.79%

Air Quality Study at Toronto Pearson International Airport – Human Health Risk Assessment August 2015 Intrinsik Environmental Sciences Inc. – Project #20-21515 Page B-2
Table B-1 Speciated Volatile Organic Compounds Associated with Airport Operations
Chemical Parameters Percent Composition of Total VOCsa
M-xylene 0.36%
Toluene 1.11%
Phenol (carbolic acid) 0.53%
N-hexane 0.30%
2,2,4-trimethylpentane 0.29%
M & P-xylene 0.21%
Propionaldehyde 0.59%
Acetone 0.27%
2-methylnaphthalene 0.15%
Benzaldehyde 0.36%
Cyclohexane 0.03%
N-heptane 0.19%
Hexaldehyde 0.0026%
Methane 3.53%
Ethane 0.56%
Ethylene 12.28%
Acetylene 3.39%
Propane 0.18%
1-propyne 0.05%
Isobutane 0.67%
2,2-dimethylbutane 0.04%
Isopentane 2.15%
Isoprene 0.02%
2-methyl-2-propenal (methacrolein) 0.31%
Methylglyoxal 1.10%
2,3-dimethylbutane 0.19%
1-Methylnaphthalene 0.18%
1,2,4-trimethylbenzene (1,3,4-trimethylbenzene)
0.54%
3-methylpentane 0.30%
Methylcyclopentane 0.22%
N-propylbenzene 0.10%
N-butylbenzene 0.04%
p-Tolualdehyde 0.03%
N-butane 4.64%
1-butene 1.50%
Glyoxal 1.33%
2,4,4-trimethyl-1-pentene 0.34%
2-methylpentane 0.84%
2,4-dimethylpentane 0.12%
1,3,5-trimethylbenzene 0.27%
Methylcyclohexane 0.05%
N-pentane 1.27%
1-pentene 0.65%
Valeraldehyde 0.18%
Cyclohexene 0.31%
N-octane 0.09%
1-octene 0.20%
N-nonane 0.07%
N-dodecane 0.34%
Propylene 3.62%
Butyraldehyde 0.09%
1-nonene 0.18%
N-decane 0.26%
1,2-diethylbenzene (ortho) 0.06%
(1-Methylpropyl)benzene 0.01%
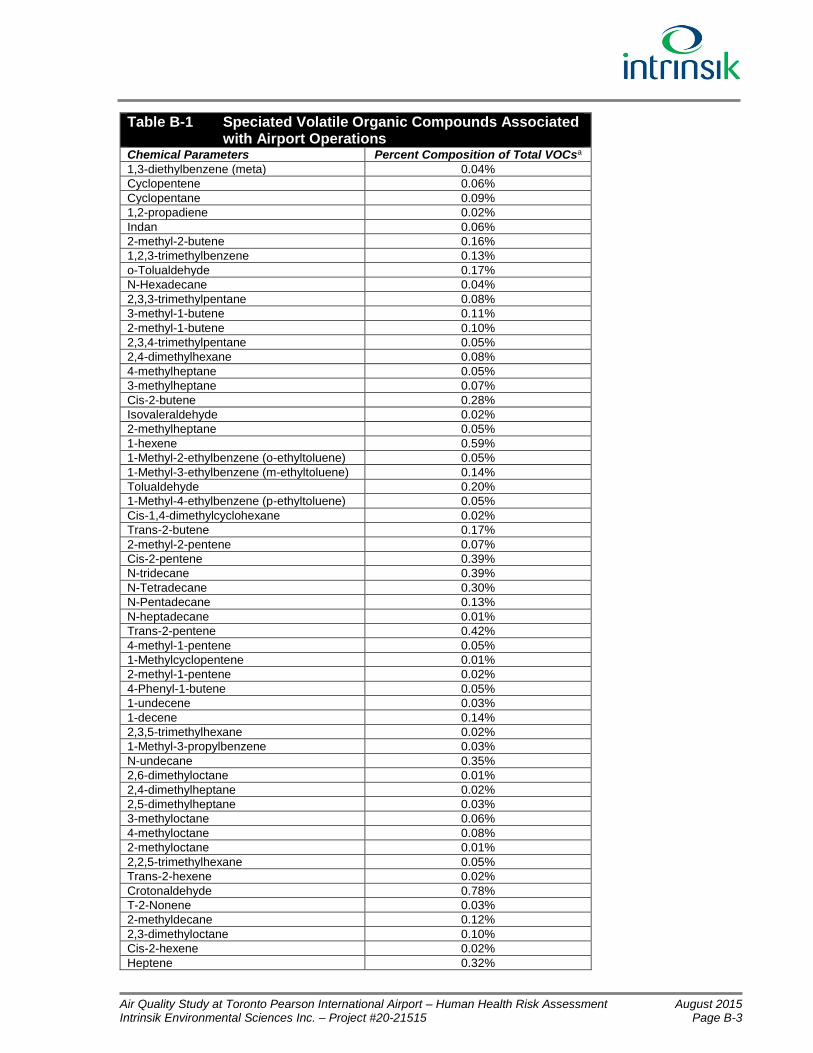
Air Quality Study at Toronto Pearson International Airport – Human Health Risk Assessment August 2015 Intrinsik Environmental Sciences Inc. – Project #20-21515 Page B-3
Table B-1 Speciated Volatile Organic Compounds Associated with Airport Operations
Chemical Parameters Percent Composition of Total VOCsa
1,3-diethylbenzene (meta) 0.04%
Cyclopentene 0.06%
Cyclopentane 0.09%
1,2-propadiene 0.02%
Indan 0.06%
2-methyl-2-butene 0.16%
1,2,3-trimethylbenzene 0.13%
o-Tolualdehyde 0.17%
N-Hexadecane 0.04%
2,3,3-trimethylpentane 0.08%
3-methyl-1-butene 0.11%
2-methyl-1-butene 0.10%
2,3,4-trimethylpentane 0.05%
2,4-dimethylhexane 0.08%
4-methylheptane 0.05%
3-methylheptane 0.07%
Cis-2-butene 0.28%
Isovaleraldehyde 0.02%
2-methylheptane 0.05%
1-hexene 0.59%
1-Methyl-2-ethylbenzene (o-ethyltoluene) 0.05%
1-Methyl-3-ethylbenzene (m-ethyltoluene) 0.14%
Tolualdehyde 0.20%
1-Methyl-4-ethylbenzene (p-ethyltoluene) 0.05%
Cis-1,4-dimethylcyclohexane 0.02%
Trans-2-butene 0.17%
2-methyl-2-pentene 0.07%
Cis-2-pentene 0.39%
N-tridecane 0.39%
N-Tetradecane 0.30%
N-Pentadecane 0.13%
N-heptadecane 0.01%
Trans-2-pentene 0.42%
4-methyl-1-pentene 0.05%
1-Methylcyclopentene 0.01%
2-methyl-1-pentene 0.02%
4-Phenyl-1-butene 0.05%
1-undecene 0.03%
1-decene 0.14%
2,3,5-trimethylhexane 0.02%
1-Methyl-3-propylbenzene 0.03%
N-undecane 0.35%
2,6-dimethyloctane 0.01%
2,4-dimethylheptane 0.02%
2,5-dimethylheptane 0.03%
3-methyloctane 0.06%
4-methyloctane 0.08%
2-methyloctane 0.01%
2,2,5-trimethylhexane 0.05%
Trans-2-hexene 0.02%
Crotonaldehyde 0.78%
T-2-Nonene 0.03%
2-methyldecane 0.12%
2,3-dimethyloctane 0.10%
Cis-2-hexene 0.02%
Heptene 0.32%

Air Quality Study at Toronto Pearson International Airport – Human Health Risk Assessment August 2015 Intrinsik Environmental Sciences Inc. – Project #20-21515 Page B-4
Table B-1 Speciated Volatile Organic Compounds Associated with Airport Operations
Chemical Parameters Percent Composition of Total VOCsa
Dimethyl napthalene 0.07%
C-1 Compounds 0.18%
C-10 Compounds 0.11%
C-10 Olefins 4.27%
C-10 Paraffins 10.66%
C-11 Compounds 0.11%
C-12 Compounds 0.07%
C-13 Compounds 0.11%
C-14 Alkane 0.14%
C-14 Compounds 0.14%
C-15 Alkane 0.13%
C-15 Compounds 0.13%
C-16 Alkane 0.11%
C-16 Compounds 0.11%
C-17 Compounds 0.09%
C-18 Alkane 0.00%
C-18 Compounds 0.06%
C-19 Compounds 0.05%
C-2 Compounds 0.61%
C-20 Compounds 0.03%
C-21 Compounds 0.02%
C-22 Compounds 0.02%
C-23 Compounds 0.01%
C-24 Compounds 0.01%
C-25 Compounds 0.02%
C-26 Compounds 0.01%
C-27 Compounds 0.01%
C-28 Compounds 0.01%
C-29 Compounds 0.00%
C-3 Compounds 0.16%
C-30 Compounds 0.01%
C-31 Compounds 0.01%
C-32 Compounds 0.01%
C-33 Compounds 0.01%
C-34 Compounds 0.01%
C-35 Compounds 0.01%
C-36 Compounds 0.01%
C-37 Compounds 0.0026%
C-38 Compounds 0.0015%
C-39 Compounds 0.0036%
C-4 Compounds 0.13%
C-40 Compounds 0.0005%
C-41 Compounds 0.0015%
C-42 Compounds 0.0005%
C-43 compounds 0.0005%
C-4 Benzene + C-3 Aromatic aldehydes 0.48%
C-5 Compounds 0.07%
C-5 Benzene + C-4 Aromatic aldehydes 0.24%
C-6 Compounds 0.13%
C-7 Compounds 0.09%
C-8 Compounds 0.03%
C-9 Compounds 0.02%
Cyclopentylcyclopentane 0.09%
Hexyne 0.0041%%
Isomers of hexane 0.03%
Isomers of nonane 0.00%

Air Quality Study at Toronto Pearson International Airport – Human Health Risk Assessment August 2015 Intrinsik Environmental Sciences Inc. – Project #20-21515 Page B-5
Table B-1 Speciated Volatile Organic Compounds Associated with Airport Operations
Chemical Parameters Percent Composition of Total VOCsa
Isomers of pentadecane 0.00%
Isomers of pentane 0.28%
Methylcyclooctane 0.06%
Pentyne 0.04%
T-1-Phenylbutene 0.04%
MTBE 0.00%
Decanol 4.27%
Dodecanol 2.13% a Percent composition of predicted 1-hour concentrations at the MPOI (2011).

Air Quality Study at Toronto Pearson International Airport – Human Health Risk Assessment August 2015 Intrinsik Environmental Sciences Inc. – Project #20-21515 Page B-6
B-3.0 CHEMICAL SCREENING AND SELECTION OF COCS Based on the modelling performed by Golder (2015), a list of VOCs (Table B-1) and CACs (i.e., CO, NO2 PM2.5, PM10, and SO2) were determined to be of concern in the Study Domain. It is important to note that while these chemicals are part of a typical airport’s existing routine operations, many of these are emitted at negligible concentrations or are of low potential health concern based on their toxicological nature. To address this, the standard risk assessment approach is to conduct a detailed screening whereby the list of chemicals is reduced to those chemicals that are the most significant contributors to the predicted human health risk. Based on the percent composition of the VOCs in the list provided by Golder (2015), VOCs that were determined to be emitted at negligible concentrations were removed from further evaluation in the assessment. A total of 88 of the 186 VOCs identified by Golder (2015) were removed based on the negligible percent composition of their predicted concentrations (Table B-2). The 98 remaining COCs characterize approximately 97% of the total emissions from the Study Domain.
Table B-2 Speciated Volatile Organic Compounds Retained for Assessment in the HHRA
Chemical Parameters Percent Composition of
Total VOCsa
Retained for Assessment in the
HHRA
Formaldehyde 9.64% ● Methyl alcohol 1.32% ●
Benzene 2.24% ●
Acetaldehyde 3.32% ●
Naphthalene 0.39% ●
O-xylene 0.30% ●
Isopropylbenzene (cumene) 0.00205%
Ethylbenzene 0.26% ●
Styrene 0.23% ●
1,3-butadiene 1.29% ●
Acrolein 1.79% ●
M-xylene 0.36% ●
Toluene 1.11% ●
Phenol (carbolic acid) 0.53%
N-hexane 0.30% ●
2,2,4-trimethylpentane 0.29% ●
M & P-xylene 0.21% ●
Propionaldehyde 0.59% ●
Acetone 0.27% ●
2-methylnaphthalene 0.15% ●
Benzaldehyde 0.36% ●
Cyclohexane 0.03%
N-heptane 0.19% ●
Hexaldehyde 0.0026%
Methane 3.53% ●
Ethane 0.56% ●
Ethylene 12.28% ●
Acetylene 3.39% ●
Propane 0.18% ●
1-propyne 0.05%
Isobutane 0.67% ●
2,2-dimethylbutane 0.04%
Isopentane 2.15% ●
Isoprene 0.02%

Air Quality Study at Toronto Pearson International Airport – Human Health Risk Assessment August 2015 Intrinsik Environmental Sciences Inc. – Project #20-21515 Page B-7
Table B-2 Speciated Volatile Organic Compounds Retained for Assessment in the HHRA
Chemical Parameters Percent Composition of
Total VOCsa
Retained for Assessment in the
HHRA
2-methyl-2-propenal (methacrolein) 0.31% ●
Methylglyoxal 1.10% ●
2,3-dimethylbutane 0.19% ●
1-Methylnaphthalene 0.18% ●
1,2,4-trimethylbenzene (1,3,4-trimethylbenzene)
0.54% ●
3-methylpentane 0.30%
Methylcyclopentane 0.22% ●
N-propylbenzene 0.10% ●
N-butylbenzene 0.04%
p-Tolualdehyde 0.03%
N-butane 4.64% ●
1-butene 1.50% ●
Glyoxal 1.33% ●
2,4,4-trimethyl-1-pentene 0.34% ●
2-methylpentane 0.84% ●
2,4-dimethylpentane 0.12% ●
1,3,5-trimethylbenzene 0.27% ●
Methylcyclohexane 0.05% ●
N-pentane 1.27% ●
1-pentene 0.65% ●
Valeraldehyde 0.18% ●
Cyclohexene 0.31% ●
N-octane 0.09% ●
1-octene 0.20% ●
N-nonane 0.07% ●
N-dodecane 0.34% ●
Propylene 3.62% ●
Butyraldehyde 0.09% ●
1-nonene 0.18% ●
N-decane 0.26%
1,2-diethylbenzene (ortho) 0.06% ●
(1-Methylpropyl)benzene 0.01%
1,3-diethylbenzene (meta) 0.04%
Cyclopentene 0.06% ●
Cyclopentane 0.09% ●
1,2-propadiene 0.02%
Indan 0.06% ●
2-methyl-2-butene 0.16% ●
1,2,3-trimethylbenzene 0.13% ●
o-Tolualdehyde 0.17%
N-Hexadecane 0.04%
2,3,3-trimethylpentane 0.08% ●
3-methyl-1-butene 0.11% ●
2-methyl-1-butene 0.10% ●
2,3,4-trimethylpentane 0.05% ●
2,4-dimethylhexane 0.08% ●
4-methylheptane 0.05%
3-methylheptane 0.07% ●
Cis-2-butene 0.28% ●
Isovaleraldehyde 0.02%
2-methylheptane 0.05% ●
1-hexene 0.59% ●
1-Methyl-2-ethylbenzene (o-ethyltoluene) 0.05%
1-Methyl-3-ethylbenzene (m-ethyltoluene) 0.14% ●

Air Quality Study at Toronto Pearson International Airport – Human Health Risk Assessment August 2015 Intrinsik Environmental Sciences Inc. – Project #20-21515 Page B-8
Table B-2 Speciated Volatile Organic Compounds Retained for Assessment in the HHRA
Chemical Parameters Percent Composition of
Total VOCsa
Retained for Assessment in the
HHRA
Tolualdehyde 0.20% ●
1-Methyl-4-ethylbenzene (p-ethyltoluene) 0.05%
Cis-1,4-dimethylcyclohexane 0.02%
Trans-2-butene 0.17% ●
2-methyl-2-pentene 0.07% ●
Cis-2-pentene 0.39% ●
N-tridecane 0.39% ●
N-Tetradecane 0.30% ●
N-Pentadecane 0.13% ●
N-heptadecane 0.01%
Trans-2-pentene 0.42% ●
4-methyl-1-pentene 0.05% ●
1-Methylcyclopentene 0.01%
2-methyl-1-pentene 0.02%
4-Phenyl-1-butene 0.05% ●
1-undecene 0.03%
1-decene 0.14% ●
2,3,5-trimethylhexane 0.02%
1-Methyl-3-propylbenzene 0.03%
N-undecane 0.35% ●
2,6-dimethyloctane 0.01%
2,4-dimethylheptane 0.02%
2,5-dimethylheptane 0.03%
3-methyloctane 0.06% ●
4-methyloctane 0.08% ●
2-methyloctane 0.01%
2,2,5-trimethylhexane 0.05%
Trans-2-hexene 0.02%
Crotonaldehyde 0.78% ●
T-2-Nonene 0.03%
2-methyldecane 0.12% ●
2,3-dimethyloctane 0.10%
Cis-2-hexene 0.02%
Heptene 0.32% ●
Dimethyl napthalene 0.07% ●
C-1 Compounds 0.18%
C-10 Compounds 0.11%
C-10 Olefins 4.27% ●
C-10 Paraffins 10.66% ●
C-11 Compounds 0.11%
C-12 Compounds 0.07%
C-13 Compounds 0.11%
C-14 Alkane 0.14% ●
C-14 Compounds 0.14%
C-15 Alkane 0.13% ●
C-15 Compounds 0.13%
C-16 Alkane 0.11% ●
C-16 Compounds 0.11%
C-17 Compounds 0.09%
C-18 Alkane 0.00%
C-18 Compounds 0.06%
C-19 Compounds 0.05%
C-2 Compounds 0.61%
C-20 Compounds 0.03%

Air Quality Study at Toronto Pearson International Airport – Human Health Risk Assessment August 2015 Intrinsik Environmental Sciences Inc. – Project #20-21515 Page B-9
Table B-2 Speciated Volatile Organic Compounds Retained for Assessment in the HHRA
Chemical Parameters Percent Composition of
Total VOCsa
Retained for Assessment in the
HHRA
C-21 Compounds 0.02%
C-22 Compounds 0.02%
C-23 Compounds 0.01%
C-24 Compounds 0.01%
C-25 Compounds 0.02%
C-26 Compounds 0.01%
C-27 Compounds 0.01%
C-28 Compounds 0.01%
C-29 Compounds 0.00%
C-3 Compounds 0.16%
C-30 Compounds 0.01%
C-31 Compounds 0.01%
C-32 Compounds 0.01%
C-33 Compounds 0.01%
C-34 Compounds 0.01%
C-35 Compounds 0.01%
C-36 Compounds 0.01%
C-37 Compounds 0.0026%
C-38 Compounds 0.0015%
C-39 Compounds 0.0036%
C-4 Compounds 0.13%
C-40 Compounds 0.0005%
C-41 Compounds 0.0015%
C-42 Compounds 0.0005%
C-43 compounds 0.0005%
C-4 Benzene + C-3 Aromatic aldehydes 0.48% ●
C-5 Compounds 0.07%
C-5 Benzene + C-4 Aromatic aldehydes 0.24% ●
C-6 Compounds 0.13%
C-7 Compounds 0.09%
C-8 Compounds 0.03%
C-9 Compounds 0.02%
Cyclopentylcyclopentane 0.09% ●
Hexyne 0.0041%
Isomers of hexane 0.03%
Isomers of nonane 0.00%
Isomers of pentadecane 0.00%
Isomers of pentane 0.28% ●
Methylcyclooctane 0.06% ●
Pentyne 0.04%
T-1-Phenylbutene 0.04%
MTBE 0.00%
Decanol 4.27% ●
Dodecanol 2.13% ●
● Indicate that this chemical parameter was retained for further evaluation a Percent composition of predicted 1-hour concentrations at the MPOI
As shown in Table B-2, those chemicals that were retained based on their predicted presence at non-negligible concentrations or based on toxicological considerations were carried forward for further evaluation in the HHRA.

Air Quality Study at Toronto Pearson International Airport – Human Health Risk Assessment August 2015 Intrinsik Environmental Sciences Inc. – Project #20-21515 Page B-10
B-3.1 Selection of Keystone Chemicals Due to the scarcity of toxicological information of some of the remaining COCs carried forward in the assessment, the 98 remaining COCs (Table B-2) were grouped together based on toxicological similarities in order to account for all potential risk. “Keystone chemicals” were then chosen for each of the groupings. The keystone chemicals were used to act as a surrogate for the entire chemical group for evaluation within the HHRA. The names, chemical properties (such as persistence), and exposure limits of these keystone chemicals were used throughout the HHRA to represent the COC groupings. Table B-3 presents the grouping of the 98 remaining chemicals that were retained for further evaluation grouped together under the keystone chemical headings. The keystone chemicals were retained as COCs for quantitative evaluation within the HHRA.
Table B-3 Final VOC List Considered in the HHRA Keystone Chemical Grouping (Retained as Chemical of Concern)
Specific Chemicals Comprising the Keystone Chemical Grouping
Percent Composition of Total VOCsa
Acetaldehyde Acetaldehyde 3.32%
Acetone Acetone 0.27%
Acrolein Acrolein 1.79%
2-methyl-2-propenal (methacrolein) 0.31%
Aliphatic alcohols
Methyl alcohol 1.32%
Decanol 4.27%
Dodecanol 2.13%
Benzene and related
Benzene 2.24%
N-propylbenzene 0.0021%
Indan 0.06%
4-Phenyl-1-butene 0.05%
1,3-butadiene 1,3-butadiene 1.29%
Ethylbenzene and related
Ethylbenzene 0.26%
1,2,4-trimethylbenzene (1,3,4-trimethylbenzene)
0.54%
1,3,5-trimethylbenzene 0.27%
1,2-diethylbenzene (ortho) 0.06%
1,2,3-trimethylbenzene 0.13%
C-4 Benzene + C-3 Aromatic aldehydes 0.48%
C-5 Benzene + C-4 Aromatic aldehydes 0.24%
Formaldehyde and related
Formaldehyde 9.64%
Glyoxal 1.33%
Methylglyoxal 1.10%
N-hexane N-hexane 0.30%
Naphthalene and related
Naphthalene 0.39%
2-methylnaphthalene 0.39%
1-Methylnaphthalene 0.18%
Dimethyl napthalene 0.16%
Aldehydes, other
Propionaldehyde 0.59%
Benzaldehyde 0.36%
Valeraldehyde 0.18%
Butyraldehyde 0.09%
Crotonaldehyde 0.78%
Tolualdehyde 0.20%

Air Quality Study at Toronto Pearson International Airport – Human Health Risk Assessment August 2015 Intrinsik Environmental Sciences Inc. – Project #20-21515 Page B-11
Table B-3 Final VOC List Considered in the HHRA Keystone Chemical Grouping (Retained as Chemical of Concern)
Specific Chemicals Comprising the Keystone Chemical Grouping
Percent Composition of Total VOCsa
Cycloalkanes and cycloalkenes
Methylcyclopentane 0.22%
Methylcyclohexane 0.05%
Cyclopentene 0.06%
Cyclopentane 0.09%
Cyclohexene 0.31%
Methylcyclooctane 0.06%
Cyclopentylcyclopentane 0.09%
Alkanes/alkenes, other C1-4
Methane 3.53%
Ethane 3.53%
Ethylene 12.28%
Acetylene 3.39%
Propane 0.18%
Propylene 3.62%
N-butane 4.64%
1-butene 1.50%
Cis-2-butene 0.04%
Trans-2-butene 0.17%
Isobutane 0.67%
Alkanes/alkenes, other C>5-8
2-methyl-2-butene 0.16%
3-methyl-1-butene 0.11%
2-methyl-1-butene 0.10%
Isopentane 2.15%
2,3-dimethylbutane 0.19%
N-octane 0.09%
N-pentane 1.27%
Isomers of pentane 0.28%
2-methylpentane 0.84%
2,4-dimethylpentane 0.12%
2-methyl-2-pentene 0.07%
Cis-2-pentene 0.39%
1-pentene 0.65%
Trans-2-pentene 0.42%
4-methyl-1-pentene 0.05%
N-heptane 0.19%
Heptene 0.32%
2,4-dimethylhexane 0.08%
3-methylheptane 0.07%
2-methylheptane 0.05%
1-hexene 0.59%
2,2,4-trimethylpentane 0.29%
2,3,3-trimethylpentane 0.08%
2,4,4-trimethyl-1-pentene 0.34%
2,3,4-trimethylpentane 0.05%
1-octene 0.20%
Alkanes/alkenes, other C>8-10
3-methyloctane 0.06%
4-methyloctane 0.08%
N-nonane 0.07%
1-nonene 0.18%
C-10 Paraffins 10.66%
C-10 Olefins 4.27%
Alkanes/alkenes, other C>10-12
2-methyldecane 0.12%
N-undecane 0.35%
N-dodecane 0.34%
Alkanes/alkenes, other C>12-16
N-tridecane 0.39%
N-Tetradecane 0.30%
C-14 Alkane 0.14%
N-Pentadecane 0.13%

Air Quality Study at Toronto Pearson International Airport – Human Health Risk Assessment August 2015 Intrinsik Environmental Sciences Inc. – Project #20-21515 Page B-12
Table B-3 Final VOC List Considered in the HHRA Keystone Chemical Grouping (Retained as Chemical of Concern)
Specific Chemicals Comprising the Keystone Chemical Grouping
Percent Composition of Total VOCsa
C-15 Alkane 0.13%
C-16 Alkane 0.11%
Styrene Styrene 0.23%
Toluene Toluene 1.11%
1-Methyl-3-ethylbenzene (m-ethyltoluene) 0.14%
Xylenes
O-xylene 0.30%
M-xylene 0.36%
M & P-xylene 0.36% a Percent composition of predicted 1-hour concentrations at the MPOI.

APPENDIX C
ESTIMATION OF POLYCYCLIC AROMATIC HYDROCARBONS IN AIRCRAFT EMISSIONS

Air Quality Study At Toronto Pearson International Airport – Human Health Risk Assessment August 2015 Intrinsik Environmental Sciences Inc. – Project #20-21515 Page C-1
APPENDIX C: ESTIMATION OF POLYCYCLIC AROMATIC HYDROCARBONS IN AIRCRAFT EMISSIONS
C-1.0 INTRODUCTION The primary source of polycyclic aromatic hydrocarbons (PAHs) at Toronto Pearson is from jet engine emissions. However, the air dispersion modelling conducted by Golder (2015) using EDMS did not predict emissions for specific PAH compounds. In order to estimate risks from this group of compounds within the human health risk assessment, it was necessary to estimate ambient air concentration of specific PAHs. This was accomplished using adjustment factors representative of the relationship between fine particulate matter (PM2.5) and PAH compound concentrations. The current appendix outlines how this estimation was completed. C-1.1 Polycyclic Aromatic Hydrocarbons in the Ambient Environment The simplest polycyclic aromatic hydrocarbons (PAHs) are phenanthrene and anthracene, which both contain three fused aromatic rings. Smaller molecules, such as benzene, are not PAHs. PAHs may contain four-, five-, six- or seven-member rings, but those with five or six are most common. Polycyclic aromatic hydrocarbons constitute a wide class of compounds composed of fused benzenoid rings (alternant PAHs), but they may also be composed of unsaturated four-, five-, and six-membered rings (nonalternant PAHs). Within the group, the compounds range from semivolatile molecules to molecules with high boiling points. The compounds may exist with a great number of structures and, depending on the complexity of the PAHs, in a large number of isomers. The compounds are generally lipophilic, a property that increases with increasing complexity of the compounds (Harvey, 1998). The main source of PAHs in the atmosphere is the incomplete combustion of fossil fuels. Other important sources other than fossil fuels include emissions from burning domestic and garden waste in largely uncontrolled situations (referred to as biomass combustion) from forest fires or agricultural processes. Despite improved emission control systems on mobile and other sources, atmospheric deposition in urban areas continues due to the intensive use of fossil fuels. This has been demonstrated by studies involving the presence of these compounds in air, their effects on human health (Froehner et al., 2011).
Table C-1 Grouping of PAH Species to Estimate Exposure
PAH Species CASRN Molecular Formula
Number of Rings
Molecular Weight
Groupinga
Acenaphthylene 208-96-8 C12H8 3 152.2 Light
Acenaphthene 83-32-9 C12H10 3 154.2 Light
Fluorene 86-73-7 C13H10 3 166.2 Light
Phenanthrene 85-01-8 C14H10 3 178.2 Light
Anthracene 120-12-7 C14H10 3 178.2 Light
Fluoranthene 206-44-0 C16H10 4 202.3 Light
Pyrene 129-00-0 C16H10 4 202.3 Light
Benz(a)anthracene 56-55-3 C18H12 4 228.3 Heavy
Chrysene 218-01-9 C18H12 4 228.3 Heavy
Benzo(b)fluoranthene 205-99-2 C20H12 5 252.3 Heavy
Benzo(k)fluoranthene 209-08-9 C20H12 5 252.3 Heavy
Benzo(a)pyrene 50-32-8 C20H12 5 252.3 Heavy
Indeno(1,2,3-cd)pyrene 193-39-5 C22H12 6 276.3 Heavy
Benzo(ghi)perylene 191-24-2 C22H12 6 276.3 Heavy
Dibenz(ah)anthracene 53-70-3 C22H14 5 278.4 Heavy
a Adapted from Anastasopoulos et al. (2012)

Air Quality Study At Toronto Pearson International Airport – Human Health Risk Assessment August 2015 Intrinsik Environmental Sciences Inc. – Project #20-21515 Page C-2
C-2.0 TOXICOCOLOGICAL CONSIDERATIONS C-2.1 Toxic Equivalency Factors for Particle-Bound PAHs Toxic equivalency factors (TEFs) can be used as a practical tool for regulatory purposes for large groups of compounds with a common mechanism of action (e.g., dioxin-like compounds and PAHs) when there are limited data except for one reference compound, 2,3,7,8-tetrachlorodibenzo-p-dioxin and benzo(a)pyrene (B(a)P), respectively. The TEF concept is based on the following assumptions:
There is a reasonably well-characterized reference compound;
These are qualitatively similar toxic effects for all members of the class;
TEFs for different toxic end points are similar; and,
The toxic effects of different compounds in a mixture are additive. Early efforts to characterize the toxic potency of PAHs in terms of B(a)P were published by Nisbet and LaGoy (1992). Since that time, potency of PAHs has been variously referred to as toxicity or potency equivalency factors (TEF, PEFs), B(a)P toxicity equivalents (B(a)P TEQ), and relative potency factors (RPF). The RPF approach for PAH mixtures is a convenient and defensible approach for assessing cancer risk from exposure to PAH mixtures (US EPA, 2010). The cancer risk estimate for PAH mixtures can be predicted by summing doses of component PAHs after scaling the doses (with RPFs, TEFs, B(a)P TEQ, etc. ) relative to the potency of an index PAH (i.e., benzo(a)pyrene). The cancer risk is then estimated using the dose-response curve for the index PAH (US EPA, 2010). PAH-containing mixtures tend to be very complex; the composition of these mixtures appears to vary across sources releasing these mixtures to the environment and in various environmental media in which they occur. For these reasons, a whole mixtures approach may not always be practicable for risk assessment purposes (US EPA, 2010) Table C-2 provides the TEF values recommended by Health Canada (2012), which were selected when available. TEFs recommended by RIVM (2001) and WHO (1998) were considered in the absence of equivalence factors from Health Canada.
Table C-2 PAH Benzo(a)pyrene Toxicity Equivalency Factors Carcinogenic PAHs B(a)P-TEF Source
Acenaphthene 0.001 RIVM, 2001
Acenaphthylene 0.01 RIVM, 2001
Anthracene 0a -
Benzo(a)anthracene 0.1 Health Canada, 2010
Benzo(a)pyrene 1 Health Canada, 2010
Benzo(b+j+k)fluoranthene 0.1 Health Canada, 2010
Benzo(e)pyrene 0.01 WHO, 1998
Benzo(ghi)perylene 0.01 Health Canada, 2010
Biphenyl 0a -
Chrysene 0.01 Health Canada, 2010
Dibenz(ah)anthracene Health Canada, 2010
Dimethylnaphthalene, 2,6- 0a -
Fluoranthene 0.001 Health Canada, 2010
Fluorene 0a -
Indeno(1,2,3-cd)pyrene 0.1 Health Canada, 2010
Methylnaphthalene, 1- 0a -
Methylnaphthalene, 2- 0a -
Methylphenanthrene, 1- 0a -
Naphthalene 0a -

Air Quality Study At Toronto Pearson International Airport – Human Health Risk Assessment August 2015 Intrinsik Environmental Sciences Inc. – Project #20-21515 Page C-3
Table C-2 PAH Benzo(a)pyrene Toxicity Equivalency Factors Perylene 0.001 WHO, 1998
Phenanthrene 0.001 Health Canada, 2010
Pyrene 0.001 RIVM, 2001
Trimethylnaphthalene, 2,3,5- 0a - a A PAH with a TEF of 0 was not considered to be a carcinogenic PAH, given the absence of
B(a)P TEFs from Health Canada (2010), RIVM (2001), and WHO (1998)
C-2.2 Toxicity Reference Value for Benzo(a)pyrene The inhalation unit risk factor (URF) proposed by Cal EPA (2009) was selected for the use in the assessment. Cal EPA (2009) presents an inhalation unit risk estimate of 1.1x10⁻³ per µg/m³ based on a study by Thyssen et al. (1981), which evaluated exposures to benzo(a)pyrene via multi-stage modelling of respiratory tract tumours in Syrian golden hamsters. In the key study, groups of 24 male Syrian golden hamsters were exposed by inhalation to 0, 2.2, 9.5, or 46.5 mg/m³ benzo(a)pyrene for 4.5 hours/day, 7 days/week for the first 10 weeks of the study, and for 3 hours/day for the rest of the exposure period (up to 96 weeks). A decrease in body weight gain in exposed animals was observed during the first 10 weeks of the study; however, with the exception of the high exposure group, the body weights of all surviving exposed animals were similar to those of the controls from the 10th to the 60th week. Mean survival decreased only in the highest exposure group.
Cancer risk associated with exposure to ambient levels of benzo(a)pyrene was estimated by extrapolating from the experimental data from Thyssen et al. (1981) to ambient levels by means of the best fitting linearized multistage procedure GLOBAL86 (Howe et al., 1986). The linearized multistage model was fit to the respiratory tract tumor data from Thyssen et al. (1981) resulting from inhalation exposure of hamsters to benzo(a)pyrene. By considering the conditions of exposure given in the report and using an inhalation rate of 0.063 m3/day and a body weight of 0.12 kg for hamsters, a dose of benzo(a)pyrene in mg/kg-day was estimated. A q1* (animal) equal to 0.43 (mg/kg-day)-1 was obtained. Multiplying by the interspecies surface area correction factor of (70/0.1)1/3 yielded a human equivalent q1* of 1.1×10⁻³ (µg/m3)-1 for inhalation. This final inhalation URF of 1.1×10⁻³ (µg/m3)-1 was also endorsed by MOE (2011). C-3.0 AIRPORT EMISSIONS OF POLYCYCLIC AROMATIC HYDROCARBONS Airport emissions have received increasing attention in recent years because of the rapid growth of air transport volumes and the expected expansion to meet capacity needs for future years (Kinsey et al., 2011; Masiol and Harrison, 2014). Emission standards for new types of aircraft engines have been implemented since the late 1970s by the International Civil Aviation Organization (ICAO) through the Committee on Aircraft Engine Emissions (CAEE) and the subsequent Committee on Aviation Environmental Protection (CAEP). One of the key actions of the ICAO committees was the provision on engine emissions in Volume II of Annex 16 to the Convention on International Civil Aviation, the so-called “Chicago Convention”, which recommended protocols for the measurement of carbon monoxide (CO), nitrogen oxides (NOx), unburned hydrocarbons (UHC) and smoke number (SN) for new engines (ICAO, 2008; Masiol and Harrison, 2014). Current information on detailed speciation of hydrocarbons, physicochemical characteristics of particles, volatile and semi-volatile emissions and especially the secondary transformations from the aging of aircraft exhausts and other airport-related emissions is sparse. This subject has been recently reviewed by Masiol and Harrison (2014), including: the landing and take-off cycles

Air Quality Study At Toronto Pearson International Airport – Human Health Risk Assessment August 2015 Intrinsik Environmental Sciences Inc. – Project #20-21515 Page C-4
(LTO) commonly used to assess aircraft emissions during the operational conditions within an airport and within the atmospheric surface boundary layer. A LTO cycle refers to all the operations the aircraft carry out below 914 meters (3000 ft above field elevation) over a specific range of certifiable operating conditions and includes four stages in terms of both engine thrust settings (expressed as a percentage of maximum rated thrust, or F00) and typical time in each specific mode of operation (time-in-mode, TIM). The 3000 ft height roughly corresponds to the atmospheric mixing height, i.e. the lower part of the troposphere within which pollutants emitted at ground-level mix rapidly (Masiol and Harrison, 2014). In the first LTO phase the aircraft descends from cruising altitude toward the runway and lands at the airport. This phase is named “approach” and is estimated as lasting for 4 min with engines at 30% F00. After landing, the aircraft enters in the “idle” phase which includes all the ground-based operations: it proceeds at a low speed to the gate (taxi-in), remains on stand-by for the loading and unloading operations and again prepares for take-off proceeding towards the runway (taxi-out). Idle lasts 26 min and the engines are required to be at 7% F00. The subsequent operating modes include the “take-off” with engines stressed to the full thrust (100% F00) for 0.7 min, and the “climb” (85% F00 for 2.2 min) up to 3,000 feet height. A standardized LTO cycle is shown below (Figure C-1; ICAO, 2013).
Figure C-1 LTO Cycle from ICAO Environmental Report (2013)
A number of studies that have speciated PAH in direct emissions of jet engine exhausts are available. These represent single or a few engine types tested under non-standard conditions, under various environmental conditions, without a standardised thrust and/or often using different measurement techniques and instrumental set-up (see Masiol and Harrison, 2014; Table 4). Emission indexes for various engines in aircraft have been reported. Such studies generally report information about tested aircraft, engine models, selected thrust, type of fuel, sampling methodologies and analytical techniques. Emission Indexes for PAHs linked to specific aircraft do not provide a ready means to convert emissions into possible health impacts and local pollutant concentration. However, PAH

Air Quality Study At Toronto Pearson International Airport – Human Health Risk Assessment August 2015 Intrinsik Environmental Sciences Inc. – Project #20-21515 Page C-5
emissions from aircraft can be both gaseous and particulate-bound. Therefore, it may be possible to predict possible health effects based on fine particulate matter. Local concentrations of fine particulate matter (PM2.5) are predicted by EDMS. Isopleths of particulate matter emitted as a consequence of airport operations allow investigators to attribute concentrations of particulate, and therefore, permit prediction of exposure to chemicals associated with particulate matter. It should be noted that actual exposure to particulate at a local receptor location will be the product of a combination of weather and sources that include the airport, local traffic, residential and industrial sources, and to long range pollution carried over greater distances. C-3.1 Results of Direct Measurements of Jet Engine Emissions Cavallo et al. (2006) have characterized civil airport occupational exposure by environmental monitoring of 23 PAHs, including the 16 priority PAHs (US EPA), in three working areas of an airport for the purpose of evaluating exposures to airport personnel. The PAHs exposure assessment was carried out based upon data accumulated from air samples collected during 24 hour periods over 5 working days at the airport apron, airport building and terminal/ office area of Leonardo DaVinci airport of Rome (Cavallo et al., 2006). The concentrations of 23 PAHs (i.e., naphthalene, 2-methylnaphthalene, 1-methylnaphthalene, biphenyl, 2,6-dimethylnaphthalene, acenaphthylene, acenaphthene, 2,3,5-trimethylnaphthalene, fluorene, phenanthrene, anthracene, 1-methylphenanthrene, fluoranthene, pyrene, benzo(a)anthracene, chrysene, benzo(b+j+k) fluoranthene, benzo(e)pyrene, benzo(a)pyrene, perylene, indeno(1,2,3- cd)pyrene, dibenzo(ah)anthracene, benzo(ghi)perylene) were measured. The limit of detection (LOD) was 0.0001 µg/m3. Total air exposure to each PAH was calculated, on each sampling day, by adding particulate (found on quartz filter) and vapour (found on PUF and XAD-2) measurements, which were reported as mean concentration (µg/m3). Total air exposure estimate for occupational exposure was reported as mean concentration (µg/m3) of 5 working days (Cavallo et al., 2006) (Table C-3).
Table C-3 Mean Concentrations of PAH at Airport Apron from Cavallo et al. (2006) PAH Species Mean Concentration per µg/m³ PM2.5 (µg/m³)
Acenaphthene 3.1024
Acenaphthylene 0.0097
Anthracene 0.0015
Benzo(a)anthracene 0.0015
Benzo(a)pyrene 0.0004
Benzo(b+j+k) fluoranthene 0.0031
Benzo(e)pyrene 0.0005
Benzo(ghi)perylene 0.0019
Biphenyl 0.581
Chrysene 0.0011
Dibenz(ah)anthracene 0.0000
Dimethylnaphthalene, 2,6- 2.098
Fluoranthene 0.0029
Fluorene 0.0104
Indeno(1,2,3-cd)pyrene 0.0017
Methylnaphthalene, 1- 10.6700
Methylnaphthalene, 2- 9.382
Methylphenanthrene. 1- 0.0058
Naphthalene 1.8120
Perylene 0.0000
Phenanthrene 0.0104
Pyrene 0.0024

Air Quality Study At Toronto Pearson International Airport – Human Health Risk Assessment August 2015 Intrinsik Environmental Sciences Inc. – Project #20-21515 Page C-6
Table C-3 Mean Concentrations of PAH at Airport Apron from Cavallo et al. (2006) PAH Species Mean Concentration per µg/m³ PM2.5 (µg/m³)
Trimethylnaphthalene, 2,3,5- 0.0022
Total PAHs 27.7a a Sum of mean concentrations for the listed PAHs.
C-3.2 Calculation of B(a)P equivalents for PAHs bound to PM2.5 Emissions The information from Cavallo et al. (2006) was used to calculate the contribution of each of the individual PAHs emitted for both vapour and particulate phase aspects. The proportions of the 23 speciated PAHs and PM2.5 were assumed to be consistent between Toronto Pearson and Leonardo DaVinci (Cavallo et al., 2006). By adjusting the relative percentage of each of the individual PAHs by its benzo(a)pyrene-TEF, one can calculate a specific TEQ adjustment factor for that specific PAH. The B(a)P TEFs presented in Table C-2 were used to calculate the overall TEQ adjustment factor based on the PAH emission profile provided by Cavallo et al. (2006). TEF Potency values recommended by Health Canada (2010; 2012) were selected when available. TEFs recommended by RIVM (2001) and WHO (1998) were considered in the absence of equivalence factors from Health Canada. By summing all of the individual TEQ adjustment factors, one can calculate a TEQ adjustment factor for the overall Total PAH group based on the jet engine PAH emission fingerprint (Table C-4). If one then multiplies the PM2.5 estimated air concentration for a given receptor by this TEQ group adjustment factor (i.e., 0.004280), this will result in an overall estimate PAH concentration that has been adjusted for benzo(a)pyrene potency.
Table C-4 Speciated B(a)P Equivalents per µg PM2.5/m³
PAH Species B(a)P TEF Mean Concentration (µg/m³)a B(a)P Equivalents per
µg PM2.5/m³
Acenaphthene 0.001 3.1024 0.0031
Acenaphthylene 0.01 0.0097 0.000097
Anthracene 0 0.0015 0
Benzo(a)anthracene 0.1 0.0015 0.00015
Benzo(a)pyrene 1 0.0004 0.00040
Benzo(b+j+k) fluoranthene 0.1 0.0031 0.00031
Benzo(e)pyrene 0.01 0.0005 0.0000050
Benzo(ghi)perylene 0.01 0.0019 0.000019
Biphenyl 0 0.581 0
Chrysene 0.01 0.0011 0.000011
Dibenz(ah)anthracene 1 0.0000 0
Dimethylnaphthalene, 2,6- 0 2.098 0
Fluoranthene 0.001 0.0029 0.0000029
Fluorene 0a 0.0104 0
Indeno(1,2,3-cd)pyrene 0.1 0.0017 0.00017
Methylnaphthalene, 1- 0 10.6700 0
Methylnaphthalene, 2- 0 9.382 0
Methylphenanthrene. 1- 0 0.0058 0
Naphthalene 0 1.8120 0
Perylene 0.001 0.0000 0
Phenanthrene 0.001 0.0104 0.0000104
Pyrene 0.001 0.0024 0.0000024
Trimethylnaphthalene, 2,3,5- 0 0.0022 0
Total PAHsb - 27.7 0.004280

Air Quality Study At Toronto Pearson International Airport – Human Health Risk Assessment August 2015 Intrinsik Environmental Sciences Inc. – Project #20-21515 Page C-7
Table C-4 Speciated B(a)P Equivalents per µg PM2.5/m³
PAH Species B(a)P TEF Mean Concentration (µg/m³)a B(a)P Equivalents per
µg PM2.5/m³ a Data from Cavallo et al. (2006) b Sum of mean concentrations and B(a)P equivalents for the listed PAHs.
While concentrations of PAHs were not available for quantification within the Air Quality Study conducted by Golder (2015), using this approach allowed for the estimation of PAH concentrations, which were adjusted for benzo(a)pyrene potency.

Air Quality Study At Toronto Pearson International Airport – Human Health Risk Assessment August 2015 Intrinsik Environmental Sciences Inc. – Project #20-21515 Page C-8
C-4.0 REFERENCES Anastasopoulos, A. T., Wheeler, A. J., Karman, D., and Kulka, R. H. 2012. Intraurban
concentrations, spatial variability and correlation of ambient polycyclic aromatic hydrocarbons (PAH) and PM2.5. Atmospheric Environment 59 (0): 272-283.
Cal EPA. 2011. Benzo(a)pyrene. Appendix B: Chemical-specific summaries of the information
to derive unit risk and cancer potency values. California Environmental Protection Agency. June 2009, revised 2011. Available at: http://www.oehha.ca.gov/air/hot_spots/2009/AppendixB.pdf
Cavallo, D., Ursiini, C.L., Carelli, G., et al. 2006. Occupational exposure in airport personnel:
characterization and evaluation of genotoxic and oxidative effects. Toxicology 223: 26-35. Froehner, S., Maceno, M., Machado, K., and Grube, M. 2011. Health risk assessment of
inhabitants exposed to PAHs particulate matter in air. Journal of Environmental Science and Health Part A-Toxic/Hazardous Substances & Environmental Engineering 46(8), 817-823.
Golder. 2015. Phase 1 to 3 Toronto Pearson International Airport Emissions Inventory. Air
Quality Study at Toronto Pearson International Airport. January, 2015 Harvey, R. G. 1998. Environmental Chemistry of PAHs. In 'PAHs and Related Compounds'. (Ed
A. H. Neilson) pp. 1-54. Springer Berlin Heidelberg. Health Canada. 2010. Federal Contaminated Site Risk Assessment in Canada. Part II: Health
Canada Toxicological Reference Values (TRVs) and Chemical Specific Factors Version 2.0. Contaminated Sites Division. Safe Environments Programme.
Health Canada. 2012. Federal Contaminated Risk Assessment in Canada Part I: Guidance on
Human Health Preliminary Quantitative Risk Assessment (PQRA). Health Canada, Environmental Health Assessment Services, Safe Environments Programme.
Howe RB, Crump KS and Van Landingham C 1986. GLOBAL86: a computer program to
extrapolate quantal animal toxicity data to low doses. KS Crump and Company, Ruston, LA. Cited in: Cal EPA, 2009.
ICAO. 2008. Environmental Protection (Annex 16). In: Aircraft Engine Emission, International
Standards and Recommended Practices, vol. 2, ISBN 978-92-9231-123-0. International Civil Aviation Organization.
ICAO. 2013. Local Air Quality. In: ICAO 2013 Environmental Report. International Civil Aviation
Organization. Available at: http://cfapp.icao.int/Environmental-Report-2013/files/assets/basic-html/page92.html.
Kinsey, J.S., Hays, M.D. Dong, Y., Williams, D.C., and Logan, R. 2011. Chemical
Characterization of Fine Particle Emissions from Commercial Aircraft Engines during the Aircraft Particle Emissions eXperiment (APEX) 1 to 3. Environmental Science and Technology 45: 3415-3421.

Air Quality Study At Toronto Pearson International Airport – Human Health Risk Assessment August 2015 Intrinsik Environmental Sciences Inc. – Project #20-21515 Page C-9
Masiol, M., and Harrison, R. M. 2014. Aircraft engine exhaust emissions and other airport-related contributions to ambient air pollution: A review. Atmospheric Environment 95 (0): 409-455.
MOE. 2011. Rationale for the Development of Generic Soil and Groundwater Standards for use
at Contaminated Sites in Ontario. Standards Development Branch, Ontario Ministry of the Environment. April 15, 2011.
Nisbet, I. C. T., and LaGoy, P. K. 1992. Toxic equivalency factors (TEFs) for polycyclic aromatic
hydrocarbons (PAHs). Regulatory Toxicology and Pharmacology 16 (3): 290-300. RIVM. 2001. Re-evaluation of human-toxicology maximum permissible risk levels. RIVM Report
711701 025. Rijksinsitituut Voor Volksgezondheid en Milieu, National Institute of Public Health and the Environment. Published as: Baars et al., 2001.
Thyssen, J., Althoff, J., Kimerle, G., and Mohr, U. 1981. Inhalation studies with benzo(a)pyrene
in Syrian golden hamsters. J Natl. Cancer Inst. 66: 575-577. Cited in: Health Canada, 2010 and Cal EPA, 2009.
US EPA. 2010. Development of a Relative Potency Factor (RPF) Approach for Polycyclic
Aromatic Hydrocarbon (PAH) Mixtures. US Environmental Protection Agency, Washington, D.C.
WHO. 1998. Environmental Health Criteria 202: Selected Non-heterocyclic Polycyclic Aromatic
Hydrocarbons. World Health Organization, Geneva. Cited in: WHO, 2000. WHO. 2000. Air Quality Guidelines for Europe (2nd Edition) Regional Office for Europe,
Copenhagen. World Health Organization Regional Publications, European Series, No. 91. Available at: http://www.euro.who.int/document/e71922.pdf

APPENDIX D
WORKED EXAMPLE FOR THE HUMAN HEALTH MULTIPLE PATHWAY EXPOSURE MODEL

Air Quality Study at Toronto Pearson International Airport – Human Health Risk Assessment August 2015 Intrinsik Environmental Sciences Inc. – Project #20-21515 Page D-1
APPENDIX D: WORKED EXAMPLE FOR THE HUMAN HEALTH MULTIPLE PATHWAY EXPOSURE MODEL
D-1.0 INTRODUCTION The human health risk assessment (HHRA) focused on both direct and indirect health risks associated with air emissions from the Toronto Pearson International Airport (hereafter referred to as “Toronto Pearson”). Toronto Pearson operations will emit chemicals of concern (COCs) directly into air from various sources, thus people residing near Toronto Pearson, as well as people visiting the area could be directly exposed to the COCs via inhalation. The primary pathway of exposure is inhalation; however, people that reside in the area might be exposed to the COCs via secondary exposure pathways. Some COCs emitted to the atmosphere via air emissions may be deposited onto the soils and plants surrounding Toronto Pearson. Depending on the fate, transport, and persistence of the COCs in the environment, chemical deposition could affect the chemical concentrations in local soils and foods (i.e., locally grown produce). Health risks from air emissions were characterized by comparing modelled long-term air concentrations of COCs with regulatory criteria considered protective of human health and these air concentrations were incorporated into the multimedia exposure model. Health risks associated with indirect exposure pathways such as consumption of locally grown produce and fruits were characterized through a detailed multimedia or multiple pathway exposure model used to predict long term exposures from persistent and/or bioaccumulative COCs. Estimated long-term exposures were also compared with oral COC exposure limits considered protective of human health. This appendix provides summaries of the calculations used to estimate media concentrations and human exposures to the COCs from long-term (chronic) multiple pathway exposures from Toronto Pearson operations, along with example calculations. Many of the methods, equations and assumptions used to predict concentrations in various environmental media were obtained from the United States Environmental Protection Agency Office of Solid Waste (US EPA, 2005), Health Canada (2012), and the Ontario Ministry of the Environment and Climate Change (MOE, 2011). Potential multiple pathway exposures to the COCs were predicted for residents using the highest annual average concentrations and the highest incremental increase in concentrations.

Air Quality Study at Toronto Pearson International Airport – Human Health Risk Assessment August 2015 Intrinsik Environmental Sciences Inc. – Project #20-21515 Page D-2
D-2.0 ENVIRONMENTAL MEDIA CONCENTRATIONS In order to quantify potential human exposures (and associated health impacts) through the oral and dermal pathways as a result of Toronto Pearson operations, predicted chemical concentrations in various environmental media were required to estimate exposures and characterize risks. Chemical concentrations in the following media were estimated for the multiple pathway exposure model:
Soil;
Dust; and,
Garden vegetables (above and below ground plants). The worked example is presented for a resident toddler exposed to Benzo(a)pyrene TEQ, as toddlers typically represent the most sensitive lifestage due to their body weight and behavioural characteristics. D-2.1 Chemical Concentrations in Air
Table D-1 presents the Benzo(a)pyrene TEQ air concentration that was used to estimate media concentrations for the human health risk assessment (HHRA) model for the 2011 Airport Alone Assessment Scenario at the maximum point of impingement (MPOI).
Table D-1 Air Concentration used in the Worked Example Chemical of Concern Concentration [µg/m3]
Benzo(a)pyrene TEQ 1.98E-03
D-2.2 Chemical Deposition
Atmospheric deposition is based on two forms of deposition (i.e., dry and wet) and two chemical phases (i.e., vapour and particulate). The atmospheric deposition rates at the MPOI location were used in the multiple pathway exposure model to predict COC concentrations in various media. Deposition rates were modelled by Golder Associates Ltd. (Golder). Table D-2 presents the dry, wet, and total deposition rates for Benzo(a)pyrene TEQ that were used in the HHRA model for the 2011 Airport Alone Assessment Scenario at MPOI.
Table D-2 Deposition Rates used in the Worked Example [mg/m²/year] Chemical of Concern Dry Deposition Rate Wet Deposition Rate Total Deposition Rate
Benzo(a)pyrene TEQ 4.00E-02 2.00E-05 4.00E-02
D-2.3 Chemical Concentration in Soil (Cs) This section presents the equations used for the calculation of cumulative COC concentrations in soil. D-2.3.1 Cumulative COC Concentration in Soil
US EPA (2005) recommended three (3) equations for the calculation of cumulative soil concentrations. Two (2) of these equations are recommended for the calculation of carcinogens:
Equation 1 – For T2 ≤ tD:

Air Quality Study at Toronto Pearson International Airport – Human Health Risk Assessment August 2015 Intrinsik Environmental Sciences Inc. – Project #20-21515 Page D-3
ks
TksT
ks
tDkstD
TtDks
DC s
s
)exp()exp(
)(
11
1
Equation 2 – For T1 < tD < T2:
)(
exp1
12
2
TT
tDTksks
Cs
ks
CstDD
C
tDtDs
s
Where:
Cs = Average soil concentration over exposure duration (mg/kg) Ds = Deposition term (mg/kg/yr) ks = COC soil loss constant due to all processes (yr-1) tD = Time period over which deposition occurs (yr) T1 = Time period at the beginning of combustion (yr) CstD = Soil concentration at time tD (mg/kg) T2 = Length of exposure duration (yr)
US EPA (2005) recommended the following equation for calculating cumulative soil concentrations for noncarcinogenic COCs: Equation 3:
ks
tDksDC s
s
exp1
Where:
Cs = Average soil concentration over exposure duration (mg/kg) Ds = Deposition term (mg/kg/yr) ks = COC soil loss constant due to all processes (yr-1) tD = Time period over which deposition occurs (yr)
For the purposes of the multi-media assessment, the operating lifetime of Toronto Pearson was assumed to be 30 years, which is the US EPA (2005) default value. While there is the potential that Toronto Pearson, in some form, will be operating for longer than 30 years, this study duration was selected based on the information available and possibility that the predicted deposition rates associated with the airport may change. Golder provided air deposition rates for years 2011, 2022, and 2032. However, due to a lack of available forecasting information, the rates for 2022 and 2032 were assumed to be the same. Given the potential for changes in air traffic patterns and aircraft technology in the future, there was significant uncertainty as to whether the deposition rates used in the current assessment will be appropriate for more than 30 years. As a result, 30 years was considered an appropriate modelling duration based on the current information available. Equation 1 is recommended when the exposure duration being modelled is less than or equal to the operating lifetime of Toronto Pearson. Equation 2 is recommended when the exposure duration being modelled is greater than the operating lifetime of Toronto Pearson. Equation 3 is

Air Quality Study at Toronto Pearson International Airport – Human Health Risk Assessment August 2015 Intrinsik Environmental Sciences Inc. – Project #20-21515 Page D-4
used to predict the COC concentration in soil over the operating lifetime of Toronto Pearson (i.e., 30 years). For the purposes of calculating cumulative COC soil concentrations, the US EPA (2005) recommended equation for noncarcinogenic COCs (i.e., Equation 3) was selected for the current assessment given that it results in the most conservative prediction of COC concentrations in soil. The calculation of the deposition term (Ds) and the soil loss constant (ks) are presented in the sections below. As part of the Ds calculation, the soil mixing zone depth is considered. The soil mixing zone depth is an important variable when calculating an appropriate soil concentration. Tilled soil will generally have lower COC concentrations than untilled soil given that tilling activities allow deposited COCs to mix with a greater volume of soil. US EPA (2005) recommended soil mixing zone depths of 0.2 m for tilled soil and 0.02 m for untilled soil. Soil concentrations in the HHRA model were modelled using both mixing zones.
Example 1 Benzo(a)pyrene TEQ Concentration in Soil for tilled soil under 2011 Airport Alone Assessment Scenario
480.0
30480.0exp10433.1
ECs
0478.2 ECs
The Benzo(a)pyrene TEQ concentration in soil for tilled soil under 2011 Airport Alone Assessment Scenario was 2.78E-04 mg/kg.
Example 2 Benzo(a)pyrene TEQ Concentration in Soil for untilled soil under 2011
Airport Alone Assessment Scenario
480.0
30480.0exp10333.1
ECs
0378.2 ECs
The Benzo(a)pyrene TEQ concentration in soil for untilled soil under 2011 Airport Alone Assessment Scenario was 2.78E-03 mg/kg.
D-2.3.2 Deposition Term (Ds) US EPA (2005) recommended the following equation to calculate Ds:
)]1()()([100
vv
s
SoilAFs FDywpDydpDywvDydvFBDZ
QHgD

Air Quality Study at Toronto Pearson International Airport – Human Health Risk Assessment August 2015 Intrinsik Environmental Sciences Inc. – Project #20-21515 Page D-5
Where:
Ds = Deposition term (mg/kg/yr) HgAF-Soil = Mercury adjustment factor (unitless) – Inorganic mercury: 0.48 x
0.98; All other COCs: 1 100 = Unit conversion factor (mg-cm²/kg-cm²) Q = COC-specific emission rate (g/s) Zs = Soil mixing zone depth (cm) BD = Bulk density (1.5 g/cm³) Fv = Fraction of COC air concentration in vapour phase (unitless) Dydv = Unitized yearly average dry deposition from vapour phase (s/m²-yr) Dywv = Unitized yearly average wet deposition from vapour phase (s/m²-yr) Dydp = Unitized yearly average dry deposition from particle phase (s/m²-yr) Dywp = Unitized yearly average wet deposition from particle phase (s/m²-yr)
US EPA (2005) considered 48% of total mercury emitted was deposited in soil and it was assumed that the mercury speciation in soil was 98% divalent mercury. This is considered in the HgAF-Soil term. Deposition rates were provided by Golder. Therefore, Ds was calculated using the following equation:
BDZ
DepHGD
s
SoilAFs
Where:
Ds = Deposition term (mg/kg/yr) HgAF-Soil = Mercury adjustment factor (unitless) – Inorganic mercury: 0.48 x
0.98; All other COCs: 1 Dep = Total deposition rate (mg/m²/yr) Zs = Soil mixing zone depth (m) BD = Bulk density (1500 kg/m³)
US EPA (2005) provided default values for BD. As previously discussed, US EPA (2005) recommended soil mixing zone depths of 0.2 m for tilled soil and 0.02 m for untilled soil. The deposition term for both mixing zones were used.
Example 3 Deposition term for Benzo(a)pyrene TEQ for tilled soil (0.2 m mixing zone) under 2011 Airport Alone Assessment Scenario
15002.0
0200.41
EDs
yrkgmgEDs //0433.1

Air Quality Study at Toronto Pearson International Airport – Human Health Risk Assessment August 2015 Intrinsik Environmental Sciences Inc. – Project #20-21515 Page D-6
The deposition term for Benzo(a)pyrene TEQ for tilled soil under 2011 Airport Alone Assessment Scenario is 1.33E-04 mg/kg/year.
Example 4 Deposition term for Benzo(a)pyrene TEQ for untilled soil (0.02 m mixing
zone) under 2011 Airport Alone Assessment Scenario
150002.0
0200.41
EDs
yrkgmgEDs //0333.1
The deposition term for Benzo(a)pyrene TEQ for untilled soil under 2011 Airport Alone Assessment Scenario is 1.33E-03 mg/kg/year.
D-2.3.3 Soil Loss Constant (ks) Chemicals may be lost from soil by leaching, runoff, erosion, biotic and abiotic degradation, and volatilization. The COC soil loss constant (ks) accounts for these processes using the following equation (US EPA 2005):
KsvKslKsrKseKsgKs
Where:
Ks = Soil loss constant due to all processes (yr-1) Ksg = Soil loss constant due to biotic and abiotic degradation (yr-1) Kse = Soil loss constant due to soil erosion (yr-1) Ksr = Soil loss constant due to surface runoff (yr-1) Ksl = Soil loss constant due to leaching (yr-1) Ksv = Soil loss constant due to volatilization (yr-1)
The calculation of each COC loss constant is described in the sections below.
Example 5 Soil Loss Constant due to All Processes for Benzo(a)pyrene TEQ
0755.1000480.0 EKs
480.0Ks
The Ks for Benzo(a)pyrene TEQ was calculated to be 0.480 yr-1.
D-2.3.3.1 Soil Loss Constant due to Biotic and Abiotic Degradation (Ksg) The US EPA (2005) Companion Database provides Ksg values for many of the COCs assessed in the HHRA. For those COCs not presented in the Companion Database, Ksg values were calculated using the US EPA (2005) recommended equation presented below. The COC soil half-life values used in the HHRA were provided by US EPA (2012) EPI Suite database.

Air Quality Study at Toronto Pearson International Airport – Human Health Risk Assessment August 2015 Intrinsik Environmental Sciences Inc. – Project #20-21515 Page D-7
For metals, the calculation of Ksg was required given that Kse, Ksr, Ksl, and Ksv for metals are equal to zero (0) for this assessment (discussed in sections below). In general, five (5) half-lives are sufficient to reach 99.9% of equilibrium with first order kinetics. Therefore, the Ksg of metals were calculated using 5 half lives of 80 years.
21
693.0
tKsg
Where:
Ksg = Soil loss constant due to biotic and abiotic degradation (yr-1) t1/2 = COC half life in soil (yr)
The US EPA (2005) Companion Database provided a Ksg value of 0.480 yr-1 for Benzo(a)pyrene TEQ.
D-2.3.3.2 Soil Loss Constant due to Soil Erosion (Kse) US EPA (2005) recommended that Kse should be equal to zero (0). This is because contaminated soil erodes both onto and off the site. Therefore, the Kse for Benzo(a)pyrene TEQ was set to zero (0). D-2.3.3.3 Soil Loss Constant Due to Surface Runoff (Ksr) US EPA (2005) recommended the following equation for the calculating Ksr:
swsssw BDKdZ
ROKsr
/1
1
Where:
Ksr = Soil loss constant due to surface runoff (yr-1) RO = Average annual surface runoff from pervious areas (cm/yr) ϴsw = Soil volumetric water content (0.2 ml/cm³) Zs = Soil mixing zone depth (cm) Kds = Soil/water partition coefficient (ml/g) BD = Soil bulk density (1.5 g/cm³)
US EPA (2005) provided default values for ϴsw and BD. For this assessment, Ksr was conservatively assumed to be zero (0) for all COCs. D-2.3.3.4 Soil Loss Constant Due to Leaching (Ksl) US EPA (2005) recommended the following equation for the calculating Ksl:
swsssw
v
KdBDZ
EROIPKsl
/0.1

Air Quality Study at Toronto Pearson International Airport – Human Health Risk Assessment August 2015 Intrinsik Environmental Sciences Inc. – Project #20-21515 Page D-8
Where:
Ksl = Soil loss constant due to leaching (yr-1) P = Average annual precipitation (cm/yr) I = Average annual irrigation (cm/yr) RO = Average annual surface runoff from pervious areas (cm/yr) EV = Average annual evapotranspiration (cm/yr) ϴsw = Soil volumetric water content (0.2 ml/cm³) Zs = Soil mixing zone depth (cm) BD = Soil bulk density (1.5 g/cm³) Kds = Soil/water partition coefficient (cm³/g)
US EPA (2005) provided default values for ϴsw and BD. For this assessment, Ksl was conservatively assumed to be zero (0) for all COCs.
D-2.3.3.5 Soil Loss Constant Due to Volatilization (Ksv) US EPA (2005) recommended the following equation for the calculating Ksv:
sw
soils
a
ass
BD
Z
D
BDTRKdZ
HCFKsv
1
Where:
Ksv = Soil loss constant due to volatilization (yr-1) CF = Unit conversion factor (3.1536E+07 s/yr) H = Henry’s Law constant (atm-m³/mol) Zs = Soil mixing zone depth (20 cm) Kds = Soil/water partition coefficient (ml/g) R = Universal gas constant (8.205 E-05 atm-m³/mol-K) Ta = Ambient air temperature (298.1 K) BD = Soil bulk density (1.5 g/cm³) Da = Diffusivity of COC in air (cm²/s) ρsoil = Solids particle density (2.7 g/cm³) ϴsw = Soil volumetric water content (0.2 ml/cm³)
US EPA (2005) provided default values for Ta, BD, ρsoil and, ϴsw. This soil loss constant was calculated using the more conservative mixing zone depth of 20cm.
Example 6 Soil Loss Constant due to Volatilization for Benzo(a)pyrene TEQ
2.0
7.2
5.11
20
043.0
5.11.29805205.80560.120
0610.1071536.3
EE
EEKsv
0755.1 EKsv
The Ksv for Benzo(a)pyrene TEQ was calculated to be 1.55E-07 yr-1.

Air Quality Study at Toronto Pearson International Airport – Human Health Risk Assessment August 2015 Intrinsik Environmental Sciences Inc. – Project #20-21515 Page D-9
D-2.4 Chemical Concentration in Dust Concentrations of COCs in fugitive dust were calculated based on the following equation:
CFDLCC sd
Where:
Cd = COC Concentration in dust (µg/m³) Cs = Average soil concentration over exposure duration (mg/kg) DL = Airborne respirable particulate matter concentration (µg/m³) CF = Unit conversion factor (0.000001 kg/mg)
Health Canada (2012) provided an average airborne respirable particulate matter concentration of 0.76 µg/m³. This value was selected for use as DL in the above equation.
Example 7 Benzo(a)pyrene TEQ Concentration in Dust
000001.076.00378.2 ECd
0911.2 ECd
The Benzo(a)pyrene TEQ concentration in dust was calculated to be 2.11E-09
µg/m³.
D-2.5 Chemical Concentrations in Plants
The methodology used to estimate the contribution from each route of the chemical uptake in plants are described in the following sections. Four (4) plant groups were modelled for the HHRA: exposed aboveground produce, protected aboveground produce, belowground produce, and fruit. Table D-3 provides a summary of the mechanisms that were included when estimating the uptake of COCs into the tissue of each plant group.
Table D-3 Summary of Mechanisms Included in the Estimation of COC Uptake into Plants
Plant Group Direct Deposition Vapour Uptake Root Uptake
Exposed Aboveground Produce
x x x
Protected Aboveground Produce
x
Belowground Produce x
Fruit x x x
The worked example is provided for exposed aboveground produce; however, Table D-4 presents the input parameters that were used for the remaining plant groups included in the HHRA model. The current assessment did not adjust concentrations in plants for human consumption with a washing and peeling factor to account for potential reduction in exposures where washing or peeling occurs. The predicted COC concentration in plants are on a wet weight (WW) basis for produce and fruits.

Air Quality Study at Toronto Pearson International Airport – Human Health Risk Assessment August 2015 Intrinsik Environmental Sciences Inc. – Project #20-21515 Page D-10
Table D-4 Input Parameters for Predicting COC Concentrations in Plantsa
Plant Group Intercept fraction (Rp)
[unitless]
Plant surface loss coefficient (kp) [yr-1]
Length of plant
exposure (Tp) [yr]
Yield or productivity
(Yp) [kg DW/m²]
Water content of plant (WC) [unitless]
Exposed Aboveground Produce 0.982 18 0.164 5.66 0.85
Protected Aboveground Produce N/A N/A N/A N/A 0.85
Belowground Produce N/A N/A N/A N/A 0.87
Fruits 0.053 18 0.164 0.25 0.85 a Input parameters provided by US EPA (2005). N/A Not applicable.
D-2.5.1 Plant Concentrations as a Result of Direct Deposition
US EPA (2005) recommended the following equation to calculate COC concentrations in plants as a result of direct deposition:
WC
kpYp
TpkpRpDywpFwDydpFQCFHgPd vPlantAG
1
exp0.11
Where:
Pd = COC concentration in plants as a result of direct (wet and dry) deposition (mg/kg)
HgAF-Plant = Mercury adjustment factor (unitless) – Inorganic mercury: 0.48 x 0.78; All other COCs: 1
CF = Unit conversion factor (1000 mg/g) Q = COC emission rate (g/s) Fv = Fraction of COC air concentration in vapour phase (unitless) Dydp = Unitized yearly average dry deposition from particle phase (s/m²/yr) Fw = 0.2 for anions, 0.6 for cations & most organics (unitless) Dywp = Unitized yearly wet deposition from particle phase (s/m²/yr) Rp = Interception fraction of edible portion of plant (unitless) kp = Plant surface loss coefficient (yr-1) Tp = Length of plant exposure to deposition per harvest of the edible
portion of the plant group (yr) Yp = Yield or standing crop biomass of the edible portion of the plant
(productivity) (kg DW/m²) WC = Water content of plant (unitless)
US EPA (2005) considered 48% of total mercury emitted was deposited in soil and it was assumed that the mercury speciation in plants was 78% divalent mercury. This is considered in the HgAF-Plant term.
Since deposition rates were provided by Golder, the deposition term was calculated using the following equation:
WC
kpYp
TpkpRpFwDDHgPd wdPlantAF
1
exp0.1
Where:

Air Quality Study at Toronto Pearson International Airport – Human Health Risk Assessment August 2015 Intrinsik Environmental Sciences Inc. – Project #20-21515 Page D-11
Pd = COC concentration in plants as a result of direct (wet and dry) deposition (mg/kg)
HgAF-Plant = Mercury adjustment factor (unitless) - Inorganic mercury: 0.48 x 0.78; All other COCs: 1
Dd = Dry deposition rate (mg/m²/yr) Dw = Wet deposition rate (mg/m²/yr) Fw = 0.2 for anions, 0.6 for cations & most organics (unitless) Rp = Interception fraction of edible portion of plant (unitless) kp = Plant surface loss coefficient (yr-1) Tp = Length of plant exposure to deposition per harvest of the edible
portion of the plant group (yr) Yp = Yield or standing crop biomass of the edible portion of the plant
(productivity) (kg DW/m²) WC = Water content of plant (unitless)
Example 8 Benzo(a)pyrene TEQ Concentration in Exposed Aboveground Produce as a Result of Direct Deposition
)85.01(
1866.5
164.018exp0.1982.06.00500.20200.41
EEPd
0548.5 EPd
The Benzo(a)pyrene TEQ concentration in exposed aboveground produce as a result of direct deposition under 2011 Airport Alone Assessment Scenario is 5.48E-05 mg/kg WW.
D-2.5.2 Plant Concentrations as a Result of Vapour Uptake US EPA (2005) recommended the following equation to calculate COC concentrations in plants as a result of vapour uptake:
WCVGBvCyv
FQHgPvair
agag
vPlantAF
1
Where:
Pv = COC concentration in plants as a result of vapour uptake (mg/kg) HgAF-Plant = Mercury adjustment factor (unitless) - Inorganic mercury: 0.48 x 0.78;
All other COCs: 1 Q = COC emission rate (g/s) Fv = Fraction of COC in vapour phase (unitless) Cyv = Unitized yearly average air concentration from vapour phase (μg-s/g-
m³)

Air Quality Study at Toronto Pearson International Airport – Human Health Risk Assessment August 2015 Intrinsik Environmental Sciences Inc. – Project #20-21515 Page D-12
Bvag = COC mass-based air-to-plant biotransfer factor (µg/g DW plant / µg/g air)
VGag = Empirical correction factor for aboveground plants (unitless) ρair = Density of air (1,200 g/m³; Weast 1981) WC = Water content of plant (unitless)
US EPA (2005) considered 48% of total mercury emitted was deposited in soil and it was assumed that the mercury speciation in plants was 78% divalent mercury. This is considered in the HgAF-Plant term. Since air concentrations were provided by Golder, Pv was calculated using the following equation:
WC
VGRF
BFC
HgPvair
agv
vair
PlantAF
1
Where:
Pv = COC concentration in plants as a result of vapour uptake (mg/kg) HgAF-Plant = Mercury adjustment factor (unitless) - Inorganic mercury: 0.48 x 0.78;
All other COCs: 1 Cair = COC concentration in air (µg/m³) Fv = Fraction of COC in vapour phase (unitless) Bv = COC mass-based air-to-plant biotransfer factor (µg/g DW plant / µg/g
air) RF = Reduction factor (unitless) VGag = Empirical correction factor for aboveground plants (unitless) ρair = Density of air (1,200 g/m³; Weast 1981) WC = Water content of plant (unitless)
As recommended by the US EPA (2005), the biotransfer factor for organics (except dioxin and furan) should be reduced by a factor of 100. Additionally, US EPA (2005) recommended an empirical correction factor (i.e., VGag) of 0.01 for COCs with a log Kow greater than 4 and an empirical correction factor of 1 for COCs with a log Kow less than 4.
The concentration of COCs in plants from direct vapour uptake was calculated using a mass-based air-to-plant biotransfer factor (Bv), which was derived from the volumetric air-to-plant biotransfer factor (Bvol) (US EPA, 2005). The equations used to calculate Bv and Bvol are presented below.
Example 9 Benzo(a)pyrene TEQ Concentration in Exposed Aboveground Produce as a Result of Vapour Uptake
85.011200
01.0100
07+1.25E294.00398.1
1
E
Pv

Air Quality Study at Toronto Pearson International Airport – Human Health Risk Assessment August 2015 Intrinsik Environmental Sciences Inc. – Project #20-21515 Page D-13
0508.9 EPv
The Benzo(a)pyrene TEQ concentration in exposed aboveground produce as a result of vapour uptake under 2011 Airport Alone Assessment Scenario is 9.08E-05 mg/kg WW.
D-2.5.2.1 Volumetric Air-to-Plant Biotransfer Factor (Bvol) US EPA (2005) recommended the following equation to calculate chemical-specific Bvol on a wet weight basis:
654.1loglog065.1log
TR
HKB owvol
Where:
Bvol = Volumetric air-to-plant biotransfer factor (unitless; WW basis) log Kow = Log of the octanol-water partition coefficient (unitless) H = Henry’s Law constant (atm-m³/mol) R = Universal gas constant (8.205 E-05 atm-m³/mol-K) T = Ambient temperature (298.1 K)
US EPA (2005) provided a default value for R and T.
Example 10 Volumetric Air-to-Plant Biotransfer Factor for Benzo(a)pyrene TEQ
654.11.29805205.8
0610.1log0000.6065.1log
E
EEBvol
0921.1 EBvol
The Bvol for Benzo(a)pyrene TEQ is 1.21E+09.
D-2.5.2.2 Mass-Based Air-to-Plant Biotransfer Factor (Bv) US EPA (2005) recommended the following equation to calculate chemical-specific Bv on a wet weight basis:
forage
volairv
WC
BB
1
Where:
Bv = mass-based air-to-plant biotransfer factor (µg/g DW plant / µg/g air)

Air Quality Study at Toronto Pearson International Airport – Human Health Risk Assessment August 2015 Intrinsik Environmental Sciences Inc. – Project #20-21515 Page D-14
ρair = density of air (1.19 g/L; Weast 1981) Bvol = volumetric air-to-plant biotransfer factor (unitless; WW basis) WC = water or moisture content of plant (0.85) ρforage = density of forage (770 g/L; McCrady and Maggard 1993)
Example 11 Mass-Based Air-to-Plant Biotransfer Factor for Benzo(a)pyrene TEQ
77085.01
0921.119.1
EBv
0725.1 EBv
The Bv for Benzo(a)pyrene TEQ is 1.25E+07.
D-2.5.3 Plant Concentrations as a Result of Root Uptake US EPA (2005) recommended the following two (2) equations to calculate COC concentrations in plants as a result of vapour uptake: For exposed and protected aboveground produce:
WCBCFCs 1Pr
Where:
Pr = COC concentration in plant as a result of root uptake (mg/kg) Cs = Cumulative COC concentration in soil (mg/kg) BCF = Plant-soil bioconcentration factor (kg soil/kg plant DW) WC = Water content of plant (unitless)
For belowground produce:
)1(Pr WCVGBCFCs rootvegroot
Where:
Pr = COC concentration in plant as a result of root uptake (mg/kg WW) Cs = Cumulative COC concentration in soil (mg/kg) BCFroot = Root-soil concentration factor (kg soil/kg plant DW) VGrootveg = Empirical correction factor for belowground produce (unitless) WC = Water content of plant (unitless)
US EPA (2005) recommended an empirical correction factor for belowground produce (i.e., VGrootveg) of 0.01 for COCs with a log Kow greater than 4 and an empirical correction factor of 1 for COCs with a log Kow less than 4.

Air Quality Study at Toronto Pearson International Airport – Human Health Risk Assessment August 2015 Intrinsik Environmental Sciences Inc. – Project #20-21515 Page D-15
Example 12 Benzo(a)pyrene TEQ Concentration in Exposed Aboveground Produce as a Result of Root Uptake
85.010132.00478.2Pr E
0750.5Pr E
The Benzo(a)pyrene TEQ concentration in exposed aboveground produce as a result of root uptake under 2011 Airport Alone Assessment Scenario is 5.50E-07 mg/kg WW.
D-2.5.3.1 Plant-Soil Bioconcentration Factor (BCF) The US EPA (2005) Companion Database has provided COC-specific bioconcentration factors (BCFs) for each aboveground plant group and root concentration factors (RCF) for belowground produce assessed in the HHRA. For metal COCs not presented in the Companion Database, BCF values were obtained from Baes et al. (1984). For other COCs, BCF values were calculated using the following US EPA (2005) recommended equation:
)(log578.0588.1log owKBCF
Where: BCF = Plant-soil bioconcentration factor (kg soil/kg plant DW) log Kow = Log of the octanol-water partition coefficient (unitless)
The above equation was derived from experiments conducted on compounds with log Kow values ranging from 1.15 to 9.35. Thus, BCF values for compounds with a log Kow value less than 1.15 should be calculated using a log Kow value of 1.15 and BCF values for compounds with a log Kow greater than 9.35 should be calculated using a log Kow value of 9.35 (US EPA 2005). An example calculation of BCF for Benzo(a)pyrene TEQ has not been presented given that it has been provided by the US EPA (2005) Companion Database.
D-2.5.3.2 Root-Soil Concentration Factor (BCFroot) For metal COCs not presented in the Companion Database, RCF values were obtained from Baes et al. (1984). For other COCs, RCF values were calculated using the following US EPA (2005) recommended equations: For COCs with log Kow of 2.0 and greater:
52.1log77.0log owKRCF

Air Quality Study at Toronto Pearson International Airport – Human Health Risk Assessment August 2015 Intrinsik Environmental Sciences Inc. – Project #20-21515 Page D-16
)1( WCCFKd
RCFBCF
s
root
Where: RCF = Root concentration factor (kg soil/kg plant WW) log Kow = Log of the octanol-water partition coefficient (unitless) BCFroot = Root -soil concentration factor (kg soil/kg plant DW) Kds = Soil/water partition coefficient (L/kg) CF = Unit conversion factor (1 kg/L) WC = Water or moisture content of plant (0.87)
For COCs with log Kow less than 2.0:
52.1log77.0)82.0log( owKRCF
)1(1 WCCFKd
RCFBCF
sroot
Where: RCF = Root concentration factor (kg soil/kg plant WW) log Kow = Log of the octanol-water partition coefficient (unitless) BCFroot = Root -soil concentration factor (kg soil/kg plant DW) Kds = Soil/water partition coefficient (L/kg) CF1 = Unit conversion factor (1 kg/L) WC = Water or moisture content of plant (0.87)
As recommended by US EPA (2005), the RCF values calculated in the above equations were converted from fresh weight to dry weight using a moisture content of 87% in root vegetables. An example calculation of BCFroot for Benzo(a)pyrene TEQ has not been presented given that it has been provided by the US EPA (2005) Companion Database.
D-2.5.4 Total COC Concentrations in Plants The total COC concentration in plants was calculated by summing the contribution from direct deposition (if applicable), vapour uptake (if applicable), and root uptake:
Pr PvPdCplant
Where:
Cplant = Total COC concentration in plants (mg/kg) Pd = COC concentration in plants as a result of direct (wet and dry)
deposition (mg/kg)

Air Quality Study at Toronto Pearson International Airport – Human Health Risk Assessment August 2015 Intrinsik Environmental Sciences Inc. – Project #20-21515 Page D-17
Pv = COC concentration in plants as a result of vapour uptake (mg/kg) Pr = COC concentration in plants as a result of root uptake (mg/kg)
Example 13 Total Benzo(a)pyrene TEQ Concentration in Exposed Aboveground
Produce
0750.50508.90548.5 EEEC forage
0446.1 EC forage
The total Benzo(a)pyrene TEQ concentration in exposed aboveground produce under 2011 Airport Alone Assessment Scenario is 1.46E-04 mg/kg WW.

Air Quality Study at Toronto Pearson International Airport – Human Health Risk Assessment August 2015 Intrinsik Environmental Sciences Inc. – Project #20-21515 Page D-18
D-3.0 HUMAN EXPOSURE ESTIMATES As discussed in the main report, the following human receptors were assessed in the HHRA:
Local residents The following section presents the methodologies used to estimate COC exposures by human receptors. This worked example is presented for a resident toddler exposed to Benzo(a)pyrene TEQ as toddlers typically represent the most sensitive life stage due to their body weight and behavioural characteristics. D-3.1 Human Receptor Characteristics Human receptor characteristics are required for the purposes of predicting COC exposure. While certain receptor characteristics may vary between receptor groups, some receptor characteristics were assumed to be consistent amongst all human receptors groups. Table D-5 presents the general characteristics for all human receptors used in the HHRA.

Air Quality Study at Toronto Pearson International Airport – Human Health Risk Assessment August 2015 Intrinsik Environmental Sciences Inc. – Project #20-21515 Page D-19
Table D-5 Summary of General Characteristics for Human Receptor Receptor Lifestage
Body weight
(kg)
Soil Ingestion
Rate (g/day)
Air Inhalation
Rate (m³/day)
Surface Area –Hands (cm²)
Surface Area-Other (cm²)
Soil Loading –Hands
(g/cm²/event)
Soil Loading –Other
(g/cm²/event)
Lifestage Duration (years)
Reference
Adult 7.07E+01 2.00E-02 1.66E+01 8.90E+02 8.22E+03 1.00E-04 1.00E-05 60 Health Canada,
2012
Teen 5.97E+01 2.00E-02 1.56E+01 8.00E+02 7.20E+03 1.00E-04 1.00E-05 8 Health Canada,
2012
Child 3.29E+01 2.00E-02 1.45E+01 5.90E+02 4.55E+03 1.00E-04 1.00E-05 7 Health Canada,
2012
Toddler 1.65E+01 8.00E-02 8.30E+00 4.30E+02 2.58E+03 1.00E-04 1.00E-05 4.5 Health Canada,
2012
Infant 8.20E+00 2.00E-02 2.20E+00 3.20E+02 1.46E+03 1.00E-04 1.00E-05 0.5 Health Canada,
2012

Air Quality Study at Toronto Pearson International Airport – Human Health Risk Assessment August 2015 Intrinsik Environmental Sciences Inc. – Project #20-21515 Page D-20
The calculated estimated daily intakes were also adjusted to account for amount of time each receptor group was anticipated to spend in the receptor locations. The exposure frequency, exposure duration, and averaging time for each receptor life stage is presented in Table D-6.
Table D-6 Exposure Adjustments Adopted in the Current Assessmenta
Receptor Exposure
Frequency (EF; days/year)
Exposure Frequency – Direct Soil/Dust Contact (EFs; days/year)b
Exposure Duration (ED; years)
Averaging Time (AT; days)
Adult 365 274 60 21,900
Teen 365 274 8 2,920
Child 365 274 7 2,555
Toddler 365 274 4.5 1642.5
Infant 365 274 0.5 182.5 a Exposure adjustments recommended by Health Canada (2012), unless indicated otherwise. b Number of non-snow covered days (MOE, 2011).
D-3.2 Dietary Ingestion Rates Ingestion rates are important for the calculation of estimated daily intakes (EDIs). A number of recognized regulatory agencies have recommended ingestion rates for various media, including Health Canada (2012), US EPA (2005), and the US EPA (2011) Exposure Factors Handbook. A review of the available ingestion rates was conducted to determine the most appropriate values for this Project. In accordance with US EPA (2005), the multiple pathway exposure model has predicted COC concentrations in soil, exposed above ground plants, protected above ground plants, belowground plants, and fruit. Ingestion rates are required for each of these food items. Breast milk ingestion rates are also required. Health Canada (2012) recommended ingestion rates for soil, root vegetables, and other vegetables for all five life stages (i.e., infant, toddler, child, teen, and adult). The soil ingestion rate recommended by Health Canada (2012) was adopted for the current assessment. The root vegetable and other vegetable ingestion rates were based on a Canadian 24-hour recall survey conducted in 1970 to 1972. While this data was collected in Canada, food consumption patterns are anticipated to change over time. Since this data was collected approximately 40 years ago, it was not considered to be representative of present day food ingestion rates. US EPA (2005) recommended ingestion rates for soil, exposed aboveground produce, protected aboveground produce, and belowground produce. The breast milk ingestion rate was based on US EPA (2002) Child-Specific Exposure Factors Handbook, and the ingestion rate for all other media were based on the US EPA (1997) Exposure Factors Handbook. The US EPA (1997) ingestion rates are based on the 1987-1988 USDA National Food Consumption Survey. The US EPA (2005) recommended food ingestion rates were adjusted for cooking and preparation losses. US EPA (2011) recommended age-specific per capita and consumer-only ingestion rates on a wet weight basis for home-produced vegetables, fruits, and breast milk. Similar to US EPA (1997), the consumer-only ingestion rates were based on 1987-1988 USDA National Food Consumption Survey. The per capita ingestion rates were estimated by Phillips and Moya (2012) using the 1987-1988 USDA National Food Consumption Survey data and adjusted to account for preparation losses and post-cooking losses. While this data is also over 20 years old, the ingestion rates are considered more appropriate given that they are age-specific and on

Air Quality Study at Toronto Pearson International Airport – Human Health Risk Assessment August 2015 Intrinsik Environmental Sciences Inc. – Project #20-21515 Page D-21
a per capita basis. Therefore, the US EPA (2011) home-produced vegetable, fruit, and breast milk ingestion rates were adopted for the current assessment. Unlike US EPA (2005), US EPA (2011) recommended a single home-produced vegetable ingestion rate, rather than ingestion rates for individual vegetable groups (i.e., exposed aboveground produce, protected aboveground produce, and belowground produce). In order to use the US EPA (2011) recommended home-produced vegetable ingestion rate, it was divided between the three vegetable groups based on the ratio of the US EPA (2005) recommended ingestion rates. For the resident receptor scenario, the home-produced vegetable ingestion rate was assumed to consist of 29.9% as exposed aboveground produce, 57.0% as protected aboveground produce, and 13.1% as belowground produce. Additionally, the ingestion rates were provided for age groups that do not match the life stages of the Health Canada (2012) guidance. In order to appropriately use these values, the US EPA (2011) were weighted based on the Health Canada (2012) age groups. The home-produced exposed aboveground produce, protected aboveground produce, belowground produce, fruit, and breast milk ingestion rates adopted in the current assessment are provided in Table D-7.
Table D-7 Daily Ingestion Rates Adopted for the Current Assessment
Receptor
Home-Produced Exposed
Aboveground Produce a
Home-Produced Protected
Aboveground Produce a
Home-Produced Belowground
Produce a
Home-Produced Fruit a
Breast Milk b
Adult 1.74E-04 3.31E-04 7.60E-05 1.95E-04 0
Teen 1.67E-04 3.19E-04 7.34E-05 1.30E-04 0
Child 2.42E-04 4.61E-04 1.06E-04 4.16E-04 0
Toddler 3.59E-04 6.84E-04 1.57E-04 8.90E-04 0
Infant 0 0 0 0 6.89E-01 a Daily ingestion rate is in units of kg WW/kg BW/day b Daily ingestion rate is in units of kg/day
D-3.3 Calculating Estimated Daily Intake of COCs The following sections provide the equations used to predict estimated daily intake of COCs in the HHRA. D-3.3.1 Incidental Ingestion of Soil
The following equation was used to estimate human exposure via incidental ingestion of soil. Soil ingestion rates, body weights, and equations used to predict exposures were based on recommendations from Health Canada (2012). The COC concentration in untilled soil is generally higher than tilled soil. As a conservative measure, the estimated daily intake of COCs via soil ingestion was based on chemical concentrations in untilled soil.
ATBW
EDEFsCFSIRCEDI s
soil
Where:
EDIsoil = Estimated daily intake of COC via ingestion of soil (mg/kg/day) Cs = COC concentration in untilled soil (mg/kg)

Air Quality Study at Toronto Pearson International Airport – Human Health Risk Assessment August 2015 Intrinsik Environmental Sciences Inc. – Project #20-21515 Page D-22
SIR = Incidental soil ingestion rate (g/d) CF = Unit conversion factor (0.001 kg/g) EFs = Exposure frequency for direct soil/dust contact (d/yr) ED = Exposure duration (yr) BW = Receptor body weight (kg) AT = Averaging time (d)
Example 14 Estimated Daily Intake of Benzo(a)pyrene TEQ via Ingestion of Soil by the Resident Toddler Under 2011 Airport Alone Assessment Scenario
5.16425.16
5.4274001.008.00378.2
EEDI soil
0801.1 EEDIsoil
The estimated daily intake of Benzo(a)pyrene TEQ via ingestion of soil by the resident toddler under 2011 Airport Alone Assessment Scenario was 1.01E-08 mg/kg/day.
D-3.3.2 Inhalation and Subsequent Ingestion of Dust
The following equation was used to estimate human exposure via incidental inhalation and ingestion of dust. Soil ingestion rates, body weights, and equations used to predict exposures were based on recommendations from Health Canada (2012).
ATBW
EDEFsCFAIRCEDI dust
dust
Where:
EDIdust = Estimated daily intake of COC via ingestion of dust (mg/kg/day) Cdust = COC concentration in dust (µg/m³) AIR = Inhalation rate (m³/day) CF = Unit conversion factor (0.001 mg/µg) EFs = Exposure frequency for direct soil/dust contact (d/yr) ED = Exposure duration (yr) BW = Receptor body weight (kg) AT = Averaging time (d)
Example 15 Estimated Daily Intake of Benzo(a)pyrene TEQ via Inhalation and Subsequent Ingestion of Dust by the Resident Toddler Under 2011 Airport Alone Assessment Scenario
5.16425.16
5.4274001.03.80911.2
EEDIdust
1397.7 EEDIdust

Air Quality Study at Toronto Pearson International Airport – Human Health Risk Assessment August 2015 Intrinsik Environmental Sciences Inc. – Project #20-21515 Page D-23
The estimated daily intake of Benzo(a)pyrene TEQ via inhalation and subsequent ingestion of dust by the resident toddler under 2011 Airport Alone Assessment Scenario was 7.97E-13 mg/kg/day.
D-3.3.3 Dermal Exposure Potential dermal exposure was estimated by applying soil loading rates to exposed skin, skin surface areas, and dermal absorption factors to cumulative COC concentrations in soil. Dermal exposures were estimated separately for hands only and for surfaces other than hands (e.g., arms and legs). The Health Canada (2012) recommended skin soil loading rates and surface area values were adopted for the current assessment. The selected dermal absorption factors were based on recommendations from Health Canada (2010), US EPA (2004), and Risk Assessment Information System (RAIS, 2013). D-3.3.3.1 Dermal Exposure to Hands The following equation was used to estimate dermal exposure for hands only:
ATBW
EDEFsCFRAFDESLHSAHCEDI dermals
hDermal
_
Where:
EDIDermal_h = Estimated daily intake of COC from dermal contact of hands with untilled soil (mg/kg/day)
Cs = COC concentration in untilled soil (mg/kg) SAH = Skin surface area of hands (cm²) SLH = Soil loading rate to exposed skin on hands (g/cm²/event) DE = Dermal events per day (1 event/d; Health Canada, 2012) RAFdermal = Relative dermal absorption factor (%) CF = Unit conversion factor (0.001 kg/g) EFs = Exposure frequency for direct soil/dust contact (d/yr) ED = Exposure duration (yr) BW = Receptor body weight (kg) AT = Averaging time (d)
Example 16 Estimated Daily Intake of Benzo(a)pyrene TEQ via Dermal Contact of Hands by the Resident Toddler under 2011 Airport Alone Assessment Scenario
5.16425.16
5.4274001.013.010400.14300378.2_
EEEDI
hDermal
1006.7_
EEDIhDermal
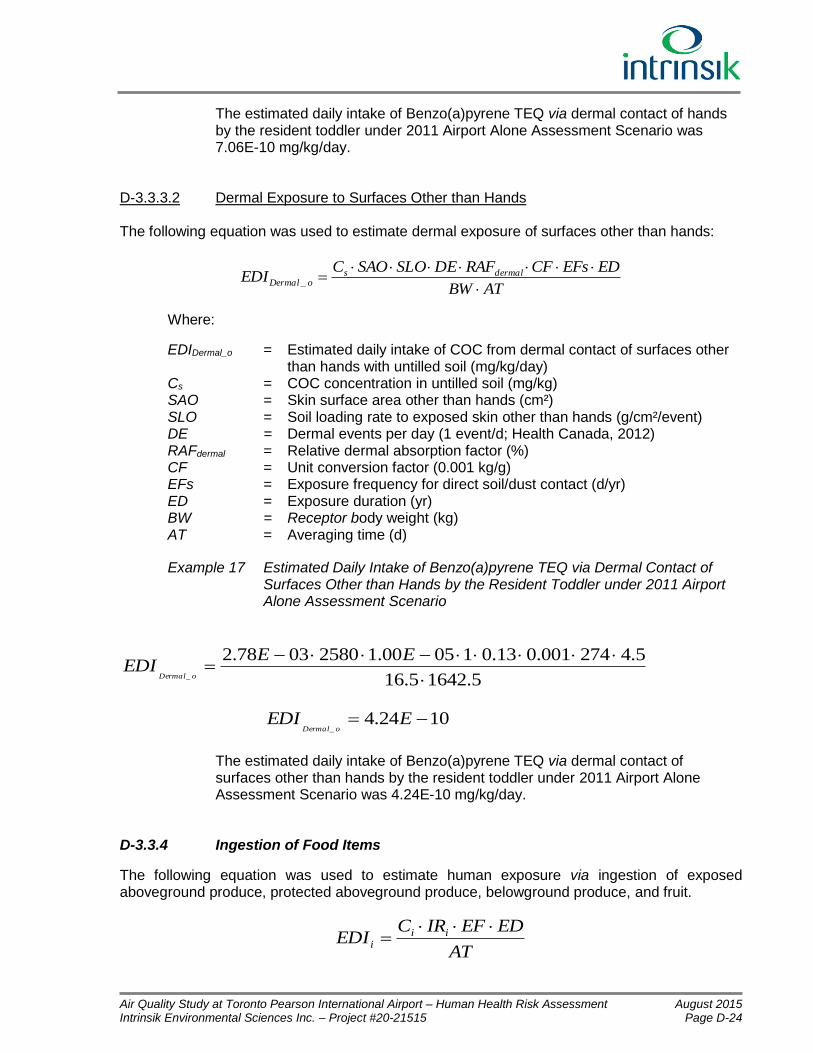
Air Quality Study at Toronto Pearson International Airport – Human Health Risk Assessment August 2015 Intrinsik Environmental Sciences Inc. – Project #20-21515 Page D-24
The estimated daily intake of Benzo(a)pyrene TEQ via dermal contact of hands by the resident toddler under 2011 Airport Alone Assessment Scenario was 7.06E-10 mg/kg/day.
D-3.3.3.2 Dermal Exposure to Surfaces Other than Hands The following equation was used to estimate dermal exposure of surfaces other than hands:
ATBW
EDEFsCFRAFDESLOSAOCEDI dermals
oDermal
_
Where:
EDIDermal_o = Estimated daily intake of COC from dermal contact of surfaces other than hands with untilled soil (mg/kg/day)
Cs = COC concentration in untilled soil (mg/kg) SAO = Skin surface area other than hands (cm²) SLO = Soil loading rate to exposed skin other than hands (g/cm²/event) DE = Dermal events per day (1 event/d; Health Canada, 2012) RAFdermal = Relative dermal absorption factor (%) CF = Unit conversion factor (0.001 kg/g) EFs = Exposure frequency for direct soil/dust contact (d/yr) ED = Exposure duration (yr) BW = Receptor body weight (kg) AT = Averaging time (d)
Example 17 Estimated Daily Intake of Benzo(a)pyrene TEQ via Dermal Contact of Surfaces Other than Hands by the Resident Toddler under 2011 Airport Alone Assessment Scenario
5.16425.16
5.4274001.013.010500.125800378.2_
EEEDI
oDermal
1024.4_
EEDIoDermal
The estimated daily intake of Benzo(a)pyrene TEQ via dermal contact of surfaces other than hands by the resident toddler under 2011 Airport Alone Assessment Scenario was 4.24E-10 mg/kg/day.
D-3.3.4 Ingestion of Food Items
The following equation was used to estimate human exposure via ingestion of exposed aboveground produce, protected aboveground produce, belowground produce, and fruit.
AT
EDEFIRCEDI ii
i

Air Quality Study at Toronto Pearson International Airport – Human Health Risk Assessment August 2015 Intrinsik Environmental Sciences Inc. – Project #20-21515 Page D-25
Where:
EDIi = Estimated daily intake of COC via ingestion of food item i (mg/kg/day) Ci = COC concentration in food item i (mg/kg) IRi = Ingestion rate of food item i (kg/kg BW/day) EF = Exposure frequency (d/yr) ED = Exposure duration (yr) AT = Averaging time (d)
As discussed in Section D-3.3, the US EPA (2011) recommended ingestion rates were adopted and modified for this assessment. The food ingestion rates adopted for the current assessment are provided in Table D-6.
Example 18 Estimated Daily Intake of Benzo(a)pyrene TEQ via Ingestion of Exposed Aboveground Produce by the Resident Toddler under 2011 Airport Alone Assessment Scenario
5.1642
5.43650459.30446.1
EEEDI
EAG
0825.5 EEDIEAG
The estimated daily intake of Benzo(a)pyrene TEQ via ingestion of exposed aboveground produce by the resident toddler under 2011 Airport Alone Assessment Scenario was 5.25E-08 mg/kg/day.
D-3.4 Ingestion of Breast Milk by Infants The potential health effects associated with the ingestion of the chemical-affected breast milk by nursing infants was considered in the current assessment. The estimated exposure from consumption of breast milk was calculated as the product of the breast milk consumption rate and predicted chemical concentration in breast milk. The equations used to predict the chemical concentration in breast milk are described in the following sections. The multiple pathway exposure model assumed that infants (i.e., 0 to 6 months of age) obtained their nutrients entirely from breast milk. D-3.4.1.1 Breast Milk Biotransfer Factor The biotransfer factor (BTF) for breast milk was used to convert the adult mother’s total predicted COC exposure to a concentration in her breast milk. Breast milk concentrations and exposures to the infant were based on methods recommended by the US EPA (2005). For organic chemicals, the maximum fraction of the chemical expected to bioaccumulate was calculated using the following approach (McKone, 1992):
owBM KEBTF 070.2
Where:
BTFBM = Breast milk biotransfer factor ([µg/kg milk] / [µg/d intake]) Kow = Octanol-water partition coefficient (unitless)

Air Quality Study at Toronto Pearson International Airport – Human Health Risk Assessment August 2015 Intrinsik Environmental Sciences Inc. – Project #20-21515 Page D-26
Example 19 Breast Milk Biotransfer Factor for Benzo(a)pyrene TEQ
060.1070.2 EEBTFBM
10.2 EBTFBM
The breast milk biotransfer factor for Benzo(a)pyrene TEQ was 2.0E-01 [µg/kg milk] / [µg/d intake].
D-3.4.1.2 Chemical Concentration in Breast Milk
The predicted breast milk concentration was calculated as follows (McKone, 1992):
BMmothermotherBM BTFBWEDIC
Where:
CBM = COC concentration in breast milk (mg/kg) EDImother = Mother’s total estimated daily intake of COC via all routes (mg/kg/day) BWmother = Body weight of mother (kg) BTFBM = Breast milk biotransfer factor ([µg/kg milk] / [µg/d intake]) Example 20 Benzo(a)pyrene TEQ Concentration in Breast Milk of Resident Adult
under 2011 Airport Alone Assessment Scenario
010.27.700884.5 EECBM
0725.8 ECBM
The Benzo(a)pyrene TEQ concentration in breast milk of resident adult under 2011 Airport Alone Assessment Scenario was 8.25E-07 mg/kg.
D-3.4.1.3 Breast Milk Consumption
The estimated exposure from consumption of breast milk for infants was calculated as follows (Health Canada, 2012):
BW
IRCEDI BMBM
BM
Where:
EDIBM = Estimated daily intake of COC from consumption of breast milk (mg/kg/day)
CBM = COC concentration in breast milk (mg/kg) IRBM = Breast milk ingestion rate (kg/day) BW = Body weight of infant (kg)

Air Quality Study at Toronto Pearson International Airport – Human Health Risk Assessment August 2015 Intrinsik Environmental Sciences Inc. – Project #20-21515 Page D-27
As discussed in Section C-3.1, the infant breast milk consumption rate of 0.689 kg/day was adopted for the current assessment.
Example 21 Estimated Daily Intake of Benzo(a)pyrene TEQ via Ingestion of Breast Milk by the Resident Infant under 2011 Airport Alone Assessment Scenario
2.8
689.00725.8
EEDI BM
0894.6 EEDIBM
The estimated daily intake of Benzo(a)pyrene TEQ via ingestion of breast milk by the resident infant under 2011 Airport Alone Assessment Scenario was 6.94E-08 mg/kg/day.
D-3.5 Total Estimated Daily Intake
The following equations were used to calculate the total estimated daily intake of COCs via incidental ingestion of soil and ingestion of food items.
BMEDIfruitEDIBGEDIPAGEDIEAGEDIoDermal
EDIhDermal
EDIdustEDIsoilEDItotalEDI __
Where:
EDItotal = Total estimated daily intake of COC (mg/kg/day) EDIsoil = Estimated daily intake of soil (mg/kg/day) EDIdust = Estimated daily intake of dust (mg/kg/day) EDIdermal_h = Estimated daily intake from dermal exposure to hands (mg/kg/day) EDIdermal_o = Estimated daily intake from dermal exposure from surfaces other than
hands (mg/kg/day) EDIEAG = Estimated daily intake of exposed aboveground produce (mg/kg/day) EDIPAG = Estimated daily intake of protected aboveground produce (mg/kg/day) EDIBG = Estimated daily intake of belowground produce (mg/kg/day) EDIfruit = Estimated daily intake of fruit (mg/kg/day)
EDIBM = Estimated daily intake of breast milk (mg/kg/day)
Example 22 Total Estimated Daily Intake of Benzo(a)pyrene TEQ for the Resident Toddler under the 2011 Airport Alone Assessment Scenario
00741.11243.30972.10825.51024.41006.71397.70801.1 EEEEEEEEtotalEDI
0706.2 EEDItotal
The total estimated daily intake of Benzo(a)pyrene TEQ via all exposure routes for the resident toddler under the 2011 Airport Alone Assessment Scenario was 2.06E-07 mg/kg/day.

Air Quality Study at Toronto Pearson International Airport – Human Health Risk Assessment August 2015 Intrinsik Environmental Sciences Inc. – Project #20-21515 Page D-28
D-4.0 RISK CHARACTERIZATION The risk characterization step in an HHRA integrates the exposure and hazard assessments to provide a conservative estimate of human health risk for the receptors assessed in the various exposure scenarios. Potential risk was characterized through a comparison of the total estimated daily intake from all exposure pathways with the identified exposure limits. For chemicals considered to be carcinogenic, exposures over a lifetime were evaluated since development of cancer is a long term process that may take many years to manifest. A special type of receptor called a “lifetime” or “composite” receptor was selected for the evaluation of potential carcinogenic risks for the local resident. This receptor is a “composite” of all relevant life stages for which exposure will be evaluated. Health risks associated with exposure to carcinogenic compounds will be expressed as an estimate of excess or incremental lifetime cancer risk (ILCR) resulting from exposures to chemicals released by Toronto Pearson operations. Thus, risks associated with carcinogenic compounds will be predicted using the average daily dose over a human receptor’s entire life span. To allow a comprehensive assessment of carcinogenic COCs, all five lifestages were grouped as a composite receptor and evaluated (as per Health Canada, 2012):
Infant (0 to 6 months);
Preschool child or toddler (7 months to 4 years);
Child (5 years to 11 years);
Adolescent (12 to 19 years); and
Adult (20 years and over). To assess risks from exposure to non-carcinogenic COCs, the toddler life stage was selected since this life stage is generally regarded as being the most sensitive due to the elevated soil ingestion rate assumed for this age group (i.e., 6 months to 5 years of age). For the residential receptor group, non-carcinogenic risks were also assessed for the infant life stage.
The calculation of hazard quotient (HQ) values for non–carcinogenic COCs and ILCRs for carcinogenic COCs were estimated using the calculated exposure estimates and the equations presented below.
D-4.1 Non-Carcinogens
The following equation was used to calculate the hazard quotients for non–carcinogens (Health Canada, 2012):
RfD
EDIHQ total
i
Where:
HQ = Hazard quotient of COC for the ‘i’ lifestage of the residents (unitless) EDItotal = Total estimated daily intake of COC via all exposure routes for the ‘i’
lifestage (mg/kg/day)

Air Quality Study at Toronto Pearson International Airport – Human Health Risk Assessment August 2015 Intrinsik Environmental Sciences Inc. – Project #20-21515 Page D-29
RfD = COC oral reference dose (mg/kg/day)
An HQ was not calculated for Benzo(a)pyrene TEQ given that an appropriate oral reference dose was not identified. D-4.2 Carcinogens
The following equation was used to calculate incremental lifetime cancer risk (ILCR) for carcinogens (Health Canada, 2012):
SFLAF ixitotal
EDIILCR
Where:
ILCR = Incremental lifetime cancer risk (unitless) EDItotal-i = Total estimated daily intake of COCs via all exposure routes for the ‘i’
lifestage (mg/kg bw/d) SF = COC oral slope factor (mg/kg/day)-1
LAF-i = Lifetime adjustment factor for the ‘i’ lifestage for general population (yr-life stage/yr-total)
For the resident receptor scenario, ILCR values are calculated for a composite receptor. A composite receptor is representative of total estimated daily intake of COCs by each lifestage (i.e., infant, toddler, child, teen, and adult), weighted according to the duration of each life stage.
Example 23 Incremental Lifetime Cancer Risk of Benzo(a)pyrene TEQ for the Resident Toddler under the 2011 Airport Alone Assessment Scenario
0030.7)80
600884.5
80
80872.4
80
70705.1
80
5.40706.2
80
5.00860.7( EEEEEEILCR
The estimated incremental lifetime cancer risk for exposure to Benzo(a)pyrene TEQ by the resident toddler under the 2011 Airport Alone Assessment Scenario was 5.1E-07.

Air Quality Study at Toronto Pearson International Airport – Human Health Risk Assessment August 2015 Intrinsik Environmental Sciences Inc. – Project #20-21515 Page D-30
D-5.0 REFERENCES Baes, C.F., R.D. Sharp, A.L. Sjoreen, and R.W. Shor. 1984. A review and analysis of
parameters for assessing transport of environmentally released radionuclides through agriculture. Oak Ridge National Laboratory. Oak Ridge, Tennessee.
Health Canada 2010. Federal Contaminated Site Risk Assessment in Canada. PART II: Health
Canada Toxicological Reference Values (TRVs) and Chemical-specific Factors, Version 2.0. Prepared by Contaminated Sites Division Safe Environments Directorate. September 2010.
Health Canada. 2012. Federal Contaminated Site Risk Assessment in Canada, Part I: Guidance
on Human Health Preliminary Quantitative Risk Assessment (PQRA), Version 2.0. Prepared by; Contaminated Sites Division, Safe Environments Directorate, Ottawa, ON. September 2010, revised 2012.
McCrady, J.K. and S.P. Maggard. 1993. Uptake and photodegradation of 2,3,7,8-
tetrachlorodibenzo-p-dioxin sorbed to grass foliage. Environ. Sci. Technol. 27(2):343-350. Cited in: US EPA, 2005.
McKone, T.E. 1992. CalTOX, a Multimedia Total-exposure Model for Hazardous-waste Sites.
Part III: The Multiple-pathway Exposure Model. Sacramento, CA: Office of the Science Advisor, Department of Toxic Substances Control, California Environmental Protection Agency.
MOE. 2011. Rationale for the Development of Generic Soil and Groundwater Standards for
Use at Contaminated Sites in Ontario. Standards Development Branch. Ontario Ministry of the Environment. April 15, 2011.
Phillips, L; Moya, J. 2012. Estimation of age-specific per capita home-produced food intake
among populations that garden, farm, or raise animals. J Expo Sci Environ Epidemiol 22: 101-108. Cited In: US EPA, 2011.
Risk Assessment Information System (RAIS). 2013. Chemical Specific Parameters. (Online).
http://rais.ornl.gov/cgi-bin/tools/TOX_search?select=chem_spef US EPA. 1997. Exposure Factors Handbook. Final Report. National Center for Environmental
Assessment, Office of Research and Development. United States Environmental Protection Agency, Washington, DC. EPA/600/P-95/002F a-c, 1997.
U.S. EPA. 2002. Child-Specific Exposure Factors Handbook. EPA-600-P-00-002B. National
Center for Environmental Assessment (Washington Office) and U.S. EPA ORD. September 2002. Cited In: US EPA, 2005.
US EPA. 2004. Risk Assessment Guidance for Superfund Volume I: Human Health Evaluation
Manual (Part E, Supplemental Guidance for Dermal Risk Assessment). Final. United States Environmental Protection Agency, Washington, DC. EPA/540/R/99/005. OSWER 9286.7-02RP. PN99-963312. July 2004.
US EPA. 2005. Human Health Risk Assessment Protocol for Hazardous Waste Combustion
Facilities, Final. US EPA Region VI. Multimedia Planning and Permitting Division. Center

Air Quality Study at Toronto Pearson International Airport – Human Health Risk Assessment August 2015 Intrinsik Environmental Sciences Inc. – Project #20-21515 Page D-31
for Combustion Science and Engineering. Office of Solid Waste. United States Environmental Protection Agency, Washington, DC.
US EPA. 2011. Exposure Factors Handbook: 2011 Edition. National Center for Environmental
Assessment, Office of Research and Development. United States Environmental Protection Agency, Washington, DC. EPA/600/R-090/052F, September 2011.
US EPA. 2012. Estimation Programs Interface Suite™ for Microsoft® Windows, v 4.11. United
States Environmental Protection Agency, Washington, DC, USA. Weast, R.C. 1981. Handbook of Environmental Data on Organic Chemicals. Second Edition.
Van Nostrand Reinhold Company. New York, NY. Cited in: US EPA, 2005.

APPENDIX E
PREDICTED HUMAN HEALTH EXPOSURES AND RISK ESTIMATES

Air Quality Study at Toronto Pearson International Airport – Human Health Risk Assessment Report August 2015 Intrinsik Environmental Sciences Inc. – Project 20-21515 Page B-1
APPENDIX E: PREDICTED HUMAN HEALTH EXPOSURES AND RISK ESTIMATES E-1.0 INTRODUCTION The current appendix provides the predicted human health exposures and risk estimates for the three cases evaluated in the HHRA: Baseline, Airport Alone, and Cumulative Effects. For each of these cases, described below, separate time periods were considered as part of the assessment, including current conditions (Year 2011) and two likely future conditions (Year 2022 and Year 2032). E-1.1 Baseline Case Regional background VOC data from the National Air Pollution Surveillance Program (NAPS) of Environment Canada were used to support the Background Case assessments. The data were largely collected from a local ambient air quality station (Centennial Park, NAPS 60413), which is located near receptor locations R4 and R9. The station provided speciated ambient air quality data for those VOCs that were identified as COCs based on EDMS modelling described in Section 3.3.1. The data used in the HHRA were collected from the station in 2011. However, ambient air data from the Centennial Park NAPS station were not available for all COCs, namely acetone, aliphatic alcohols, alkanes/alkenes with C>12-16, and the aldehydes, which encompasses a total of seven (7) COC groupings evaluated in the HHRA (i.e., acetaldehyde, acetone, acrolein, aliphatic alcohols, alkanes/alkenes (other C>12-16), formaldehyde, and other aldehydes) (Section 3.3.1). An air quality station from another large urban area, Windsor, Ontario (60211) was identified to have ambient air quality data representative of five (5) COC groups missing from the Centennial Park dataset (i.e., acetaldehyde, acetone, acrolein, formaldehyde, and other aldehydes) (Section 3.3.1). These data, collected in 2010 were used in the Background Case and Cumulative Effects Case assessments. Suitable speciated ambient air quality data representative of the aliphatic alcohols and the alkanes/alkenes (other C>12-16) were not identified. As a result, Background Case and Cumulative Effects case estimated exposure point concentrations and risk estimates could not be calculated. Ambient air concentrations collected from 2010 (Windsor) and 2011 (Centennial Park) were not adjusted to predict for the future scenarios evaluated within the assessment (i.e., 2022 and 2032). Therefore, the ambient air concentrations for the VOCs evaluated for the Background Case assessment are identical for years 2011, 2022, and 2032. The maximum concentration of VOCs from the Centennial Park NAPS station and the Windsor NAPS station (i.e., acetaldehyde, acetone, acrolein, formaldehyde, and other aldehydes) were used for the Baselines Case and Cumulative Effects Case.

Air Quality Study at Toronto Pearson International Airport – Human Health Risk Assessment Report August 2015 Intrinsik Environmental Sciences Inc. – Project 20-21515 Page B-2
E-1.2 Airport Alone Case Airport alone Case included an assessment of emissions from Toronto Pearson alone (i.e., product of Phase 1 of the Study) during 2011, 2022 and 2032. A current air emission inventory for the airport was developed by Golder (2015) using the US Federal Aviation Authority (FAA) Emissions and Dispersion Modelling System (EDMS). This emissions inventory included modelled emissions from the airport property related to aircraft, vehicular traffic, and other ancillary equipment for years 2011, 2022 and 2032. Emissions for the 2011 scenario were calculated based on the actual aircraft arrival and departure schedule for that year and emissions from roadways and parking facilities were calculated based on traffic counts and varied using EDMS default schedules (Golder, 2015). EDMS calculated total annual 2011 emissions for carbon monoxide (CO), total hydrocarbons, non-methane hydrocarbons, total volatile organic compounds (VOCs), total organic gases, nitrogen oxides (NOx), sulphur dioxides (SOx), particulate matter (as PM10 and PM2.5), non-volatile particulate matter, volatile sulphates particulate matter, and volatile organic particulate matter. Emissions for 2022 and 2032 were also calculated using EDMS based on the internal database for each aircraft type and operational mode. The 2011 Toronto Pearson schedule was used to determine peak and off-peak aircraft movement times by developing operational profiles for month of year, day of week and quarter hour of day. Anticipated 2022 and 2032 aircraft movements and types were then distributed throughout the calendar year based on the 2011 schedule. Aircraft movements were scaled up for the future year scenarios (2022 and 2032) using estimated future passenger counts, which are expected to increase versus 2011 (Golder, 2015). Based on the emissions from Toronto Pearson, a total VOC list consisting of 186 VOCs for the 2011, 2022 and 2032 scenarios was developed by Golder. While these chemicals are associated with normal airport operations, many of these are emitted at negligible concentrations or are of low potential health concern based on their toxicological nature. To address this, a chemical screening approach was conducted such that the list of chemicals was reduced to those chemicals that are the most significant contributors to the predicted human health risk. Based on the percent composition of the VOCs in the list provided by Golder, VOCs that were determined to be emitted at negligible concentrations were removed from further evaluation in the assessment. A total of 88 VOCs were removed based on percent-composition, which represented less than three percent (3%) of the total VOC composition. The remaining 98 VOCs were grouped together into 22 VOC groups based on the chemical and toxicological similarities of the VOCs. A “keystone” VOC was chosen to represent the VOC groupings. The maximum concentrations of the COCs within each group were added together to represent the concentration of the group as a whole. The group maximum concentration along with the reference concentrations and the toxicological characteristics of the keystone chemical were used to determine the risk estimate in the airport only scenario and the mixture assessment.

Air Quality Study at Toronto Pearson International Airport – Human Health Risk Assessment Report August 2015 Intrinsik Environmental Sciences Inc. – Project 20-21515 Page B-3
E-1.3 Cumulative Case The Cumulative Effects Case included a quantitative evaluation of the cumulative effects of the Baseline Case plus the Project Alone Case (i.e.¸ product of Phase 3 of the Study) during years 2011, 2022, and 2032. The cumulative effects assessment evaluates the potential health impact related to the predicted ground-level air concentrations of each of the COCs contributed by the airport plus the existing background ambient concentrations of the COC based on the modelling of regional air quality within the Study Area. The completion of dispersion modelling for both on- and off-site sources to determine the combined impact (or cumulative effects) of all sources at selected receptor sites and compare results from two nearby Federal and Provincial ambient air monitoring stations. Cumulative effects from on- and off-site sources were determined at selected receptors and were compared to ambient air quality data (CACs and VOCs) from the Toronto Pearson air quality station and two local ambient air quality stations (Centennial Park 60413 and Brampton 60428). This phase was completed by Golder (2015). The maximum ground-level air concentrations predicted under the cumulative assessment may not necessarily represent realistic cumulative contributions, as the worst-case regional background contribution rarely occurs at the same time as the worst-case project scenario contribution given regional traffic and meteorological conditions. The maximum ground-level air concentrations predicted were used to determine the risk estimates for the Cumulative Effects Case.

Air Quality Study at Toronto Pearson International Airport – Human Health Risk Assessment Report August 2015 Intrinsik Environmental Sciences Inc. – Project 20-21515 Page B-4
E-2.0 EXPOSURES ASSESSMENT TABLES This section presents the predicted time-weighted air concentrations for the COCs for each receptor location and year for the Baseline, Airport Alone, and Cumulative Effects cases (Tables 1 through 9).

COC MPOI R1 R2 R3 R4 R5 R6 R7 R8 R9 R10 R111-HOUR EXPOSURESCritieria Air Contaminants (CACs)Carbon monoxide (CO) 1.35E+04 3.74E+03 4.07E+03 7.10E+03 4.81E+03 3.26E+03 4.38E+03 3.72E+03 2.78E+03 3.35E+03 3.13E+03 4.63E+03Nitrogen dioxide (NO2) 2.94E+02 1.70E+02 1.76E+02 1.71E+02 1.63E+02 1.39E+02 1.68E+02 2.24E+02 1.63E+02 1.60E+02 1.53E+02 1.68E+02Coarse Particulate Matter (PM10) NA NA NA NA NA NA NA NA NA NA NA NAFine Particulate Matter (PM2.5) NA NA NA NA NA NA NA NA NA NA NA NASulphur Dioxide (SO2) 1.74E+03 2.57E+02 2.46E+02 3.07E+02 2.94E+02 3.66E+02 2.10E+02 4.17E+02 4.73E+02 4.71E+02 2.08E+02 1.30E+02Volatile Organic Chemicals (VOCs)Acetaldehyde 6.59E+00 6.59E+00 6.59E+00 6.59E+00 6.59E+00 6.59E+00 6.59E+00 6.59E+00 6.59E+00 6.59E+00 6.59E+00 6.59E+00Acetone 1.29E+01 1.29E+01 1.29E+01 1.29E+01 1.29E+01 1.29E+01 1.29E+01 1.29E+01 1.29E+01 1.29E+01 1.29E+01 1.29E+01Acrolein and related 3.16E-01 3.16E-01 3.16E-01 3.16E-01 3.16E-01 3.16E-01 3.16E-01 3.16E-01 3.16E-01 3.16E-01 3.16E-01 3.16E-01Aldehydes, other 7.11E+00 7.11E+00 7.11E+00 7.11E+00 7.11E+00 7.11E+00 7.11E+00 7.11E+00 7.11E+00 7.11E+00 7.11E+00 7.11E+00Aliphatic alcohols NV NV NV NV NV NV NV NV NV NV NV NVAlkanes/alkenes, other C1-4 6.07E+01 6.07E+01 6.07E+01 6.07E+01 6.07E+01 6.07E+01 6.07E+01 6.07E+01 6.07E+01 6.07E+01 6.07E+01 6.07E+01Alkanes/alkenes, other C5-8 1.06E+01 1.06E+01 1.06E+01 1.06E+01 1.06E+01 1.06E+01 1.06E+01 1.06E+01 1.06E+01 1.06E+01 1.06E+01 1.06E+01Alkanes/alkenes, other C>8-10 9.81E-01 9.81E-01 9.81E-01 9.81E-01 9.81E-01 9.81E-01 9.81E-01 9.81E-01 9.81E-01 9.81E-01 9.81E-01 9.81E-01Alkanes/alkenes, other C>10-12 6.12E-01 6.12E-01 6.12E-01 6.12E-01 6.12E-01 6.12E-01 6.12E-01 6.12E-01 6.12E-01 6.12E-01 6.12E-01 6.12E-01Alkanes/alkenes, other C>12-16 NV NV NV NV NV NV NV NV NV NV NV NVBenzene and related 2.06E+00 2.06E+00 2.06E+00 2.06E+00 2.06E+00 2.06E+00 2.06E+00 2.06E+00 2.06E+00 2.06E+00 2.06E+00 2.06E+00Butadiene, 1,3- 2.11E-01 2.11E-01 2.11E-01 2.11E-01 2.11E-01 2.11E-01 2.11E-01 2.11E-01 2.11E-01 2.11E-01 2.11E-01 2.11E-01Cycloalkanes and cycloalkenes 9.55E-01 9.55E-01 9.55E-01 9.55E-01 9.55E-01 9.55E-01 9.55E-01 9.55E-01 9.55E-01 9.55E-01 9.55E-01 9.55E-01Ethylbenzene and related 2.66E+00 2.66E+00 2.66E+00 2.66E+00 2.66E+00 2.66E+00 2.66E+00 2.66E+00 2.66E+00 2.66E+00 2.66E+00 2.66E+00Formaldehyde and related 8.92E+00 8.92E+00 8.92E+00 8.92E+00 8.92E+00 8.92E+00 8.92E+00 8.92E+00 8.92E+00 8.92E+00 8.92E+00 8.92E+00Hexane, n- 8.53E-01 8.53E-01 8.53E-01 8.53E-01 8.53E-01 8.53E-01 8.53E-01 8.53E-01 8.53E-01 8.53E-01 8.53E-01 8.53E-01Naphthalene and related 2.15E-01 2.15E-01 2.15E-01 2.15E-01 2.15E-01 2.15E-01 2.15E-01 2.15E-01 2.15E-01 2.15E-01 2.15E-01 2.15E-01Styrene 2.92E-01 2.92E-01 2.92E-01 2.92E-01 2.92E-01 2.92E-01 2.92E-01 2.92E-01 2.92E-01 2.92E-01 2.92E-01 2.92E-01Toluene and related 6.24E+00 6.24E+00 6.24E+00 6.24E+00 6.24E+00 6.24E+00 6.24E+00 6.24E+00 6.24E+00 6.24E+00 6.24E+00 6.24E+00Xylenes 2.54E+00 2.54E+00 2.54E+00 2.54E+00 2.54E+00 2.54E+00 2.54E+00 2.54E+00 2.54E+00 2.54E+00 2.54E+00 2.54E+00Polycyclic Aromatic Hydrocarbons (PAHs)Benzo(a)pyrene TEQ-Equivalents NA NA NA NA NA NA NA NA NA NA NA NA
NV No value. Exposures to this chemical could not be predicted due to an absence of appropriate air quality dataNA Not applicable. Exposures to this chemical are not relevant for this exposure assessment scenario.
Table 1: 2011 Assessment Scenario TWA - Background Case
Page 1 of 3

COC MPOI R1 R2 R3 R4 R5 R6 R7 R8 R9 R10 R11
Table 1: 2011 Assessment Scenario TWA - Background Case
8-HOUR EXPOSURESCritieria Air Contaminants (CACs)Carbon monoxide (CO) 6.48E+03 1.75E+03 2.05E+03 3.92E+03 2.82E+03 1.93E+03 2.78E+03 1.38E+03 1.36E+03 2.59E+03 2.11E+03 2.66E+03
24-HOUR EXPOSURESCritieria Air Contaminants (CACs)Carbon monoxide (CO) NA NA NA NA NA NA NA NA NA NA NA NANitrogen dioxide (NO2) 1.01E+02 4.00E+01 4.20E+01 5.30E+01 4.10E+01 3.50E+01 5.20E+01 5.50E+01 4.60E+01 3.90E+01 4.50E+01 4.70E+01Coarse Particulate Matter (PM10) 1.93E+02 1.35E+02 1.50E+02 1.51E+02 1.24E+02 9.10E+01 7.10E+01 1.05E+02 1.01E+02 1.10E+02 1.01E+02 7.00E+01Fine Particulate Matter (PM2.5) 1.43E+02 4.10E+01 4.50E+01 4.80E+01 3.70E+01 3.40E+01 3.50E+01 4.40E+01 5.00E+01 3.60E+01 3.60E+01 2.70E+01Sulphur Dioxide (SO2) 5.79E+02 2.90E+01 2.80E+01 2.60E+01 2.70E+01 4.40E+01 2.70E+01 4.20E+01 6.70E+01 4.40E+01 1.60E+01 1.70E+01Volatile Organic Chemicals (VOCs)Acetaldehyde 2.71E+00 2.71E+00 2.71E+00 2.71E+00 2.71E+00 2.71E+00 2.71E+00 2.71E+00 2.71E+00 2.71E+00 2.71E+00 2.71E+00Acetone 5.30E+00 5.30E+00 5.30E+00 5.30E+00 5.30E+00 5.30E+00 5.30E+00 5.30E+00 5.30E+00 5.30E+00 5.30E+00 5.30E+00Acrolein and related 1.30E-01 1.30E-01 1.30E-01 1.30E-01 1.30E-01 1.30E-01 1.30E-01 1.30E-01 1.30E-01 1.30E-01 1.30E-01 1.30E-01Aldehydes, other 2.92E+00 2.92E+00 2.92E+00 2.92E+00 2.92E+00 2.92E+00 2.92E+00 2.92E+00 2.92E+00 2.92E+00 2.92E+00 2.92E+00Aliphatic alcohols NV NV NV NV NV NV NV NV NV NV NV NVAlkanes/alkenes, other C1-4 2.49E+01 2.49E+01 2.49E+01 2.49E+01 2.49E+01 2.49E+01 2.49E+01 2.49E+01 2.49E+01 2.49E+01 2.49E+01 2.49E+01Alkanes/alkenes, other C5-8 4.34E+00 4.34E+00 4.34E+00 4.34E+00 4.34E+00 4.34E+00 4.34E+00 4.34E+00 4.34E+00 4.34E+00 4.34E+00 4.34E+00Alkanes/alkenes, other C>8-10 4.03E-01 4.03E-01 4.03E-01 4.03E-01 4.03E-01 4.03E-01 4.03E-01 4.03E-01 4.03E-01 4.03E-01 4.03E-01 4.03E-01Alkanes/alkenes, other C>10-12 2.51E-01 2.51E-01 2.51E-01 2.51E-01 2.51E-01 2.51E-01 2.51E-01 2.51E-01 2.51E-01 2.51E-01 2.51E-01 2.51E-01Alkanes/alkenes, other C>12-16 NV NV NV NV NV NV NV NV NV NV NV NVBenzene and related 8.45E-01 8.45E-01 8.45E-01 8.45E-01 8.45E-01 8.45E-01 8.45E-01 8.45E-01 8.45E-01 8.45E-01 8.45E-01 8.45E-01Butadiene, 1,3- 8.65E-02 8.65E-02 8.65E-02 8.65E-02 8.65E-02 8.65E-02 8.65E-02 8.65E-02 8.65E-02 8.65E-02 8.65E-02 8.65E-02Cycloalkanes and cycloalkenes 3.92E-01 3.92E-01 3.92E-01 3.92E-01 3.92E-01 3.92E-01 3.92E-01 3.92E-01 3.92E-01 3.92E-01 3.92E-01 3.92E-01Ethylbenzene and related 1.09E+00 1.09E+00 1.09E+00 1.09E+00 1.09E+00 1.09E+00 1.09E+00 1.09E+00 1.09E+00 1.09E+00 1.09E+00 1.09E+00Formaldehyde and related 3.67E+00 3.67E+00 3.67E+00 3.67E+00 3.67E+00 3.67E+00 3.67E+00 3.67E+00 3.67E+00 3.67E+00 3.67E+00 3.67E+00Hexane, n- 3.50E-01 3.50E-01 3.50E-01 3.50E-01 3.50E-01 3.50E-01 3.50E-01 3.50E-01 3.50E-01 3.50E-01 3.50E-01 3.50E-01Naphthalene and related 8.81E-02 8.81E-02 8.81E-02 8.81E-02 8.81E-02 8.81E-02 8.81E-02 8.81E-02 8.81E-02 8.81E-02 8.81E-02 8.81E-02Styrene 1.20E-01 1.20E-01 1.20E-01 1.20E-01 1.20E-01 1.20E-01 1.20E-01 1.20E-01 1.20E-01 1.20E-01 1.20E-01 1.20E-01Toluene and related 2.56E+00 2.56E+00 2.56E+00 2.56E+00 2.56E+00 2.56E+00 2.56E+00 2.56E+00 2.56E+00 2.56E+00 2.56E+00 2.56E+00Xylenes 1.04E+00 1.04E+00 1.04E+00 1.04E+00 1.04E+00 1.04E+00 1.04E+00 1.04E+00 1.04E+00 1.04E+00 1.04E+00 1.04E+00Polycyclic Aromatic Hydrocarbons (PAHs)Benzo(a)pyrene TEQ-Equivalents NA NA NA NA NA NA NA NA NA NA NA NANA Not applicable. Exposures to this chemical are not relevant for this exposure assessment scenario. NV No value. Exposures to this chemical could not be predicted due to an absence of appropriate air quality data
Page 2 of 3

COC MPOI R1 R2 R3 R4 R5 R6 R7 R8 R9 R10 R11
Table 1: 2011 Assessment Scenario TWA - Background Case
ANNUAL AVERAGE EXPOSURESCritieria Air Contaminants (CACs)Carbon monoxide (CO) 2.22E+02 4.36E+01 4.81E+01 4.03E+02 2.28E+02 1.89E+02 3.08E+02 1.44E+02 1.54E+02 2.12E+02 2.42E+02 2.91E+02Nitrogen dioxide (NO2) 1.39E+01 3.81E+00 3.81E+00 2.30E+01 1.50E+01 1.40E+01 1.80E+01 1.80E+01 1.50E+01 1.40E+01 1.50E+01 1.80E+01Coarse Particulate Matter (PM10) 1.50E+01 9.52E+00 1.02E+01 3.80E+01 3.00E+01 2.40E+01 1.90E+01 2.50E+01 2.40E+01 2.80E+01 2.60E+01 1.70E+01Fine Particulate Matter (PM2.5) 9.81E+00 2.62E+00 2.86E+00 1.30E+01 1.00E+01 8.80E+00 8.20E+00 1.10E+01 1.00E+01 1.00E+01 9.30E+00 6.50E+00Sulphur Dioxide (SO2) 3.72E+01 7.62E-01 7.62E-01 3.70E+00 3.60E+00 4.40E+00 3.00E+00 5.20E+00 6.50E+00 5.30E+00 2.40E+00 1.80E+00Volatile Organic Chemicals (VOCs)Acetaldehyde 2.53E-01 2.20E-01 2.20E-01 9.2E-01 9.2E-01 9.2E-01 9.2E-01 9.2E-01 9.2E-01 9.2E-01 9.2E-01 9.2E-01Acetone 6.94E-01 6.02E-01 6.02E-01 2.5E+00 2.5E+00 2.5E+00 2.5E+00 2.5E+00 2.5E+00 2.5E+00 2.5E+00 2.5E+00Acrolein and related 9.24E-03 8.01E-03 8.01E-03 3.4E-02 3.4E-02 3.4E-02 3.4E-02 3.4E-02 3.4E-02 3.4E-02 3.4E-02 3.4E-02Aldehydes, other 2.27E-01 1.96E-01 1.96E-01 8.3E-01 8.3E-01 8.3E-01 8.3E-01 8.3E-01 8.3E-01 8.3E-01 8.3E-01 8.3E-01Aliphatic alcohols - - - NV NV NV NV NV NV NV NV NVAlkanes/alkenes, other C1-4 3.83E+00 3.32E+00 3.32E+00 1.4E+01 1.4E+01 1.4E+01 1.4E+01 1.4E+01 1.4E+01 1.4E+01 1.4E+01 1.4E+01Alkanes/alkenes, other C5-8 7.21E-01 6.25E-01 6.25E-01 2.6E+00 2.6E+00 2.6E+00 2.6E+00 2.6E+00 2.6E+00 2.6E+00 2.6E+00 2.6E+00Alkanes/alkenes, other C>8-10 4.03E-02 3.49E-02 3.49E-02 1.5E-01 1.5E-01 1.5E-01 1.5E-01 1.5E-01 1.5E-01 1.5E-01 1.5E-01 1.5E-01Alkanes/alkenes, other C>10-12 3.20E-02 2.78E-02 2.78E-02 1.2E-01 1.2E-01 1.2E-01 1.2E-01 1.2E-01 1.2E-01 1.2E-01 1.2E-01 1.2E-01Alkanes/alkenes, other C>12-16 - - - NV NV NV NV NV NV NV NV NVBenzene and related 1.65E-01 1.43E-01 1.43E-01 6.0E-01 6.0E-01 6.0E-01 6.0E-01 6.0E-01 6.0E-01 6.0E-01 6.0E-01 6.0E-01Butadiene, 1,3- 1.18E-02 1.02E-02 1.02E-02 4.3E-02 4.3E-02 4.3E-02 4.3E-02 4.3E-02 4.3E-02 4.3E-02 4.3E-02 4.3E-02Cycloalkanes and cycloalkenes 6.69E-02 5.80E-02 5.80E-02 2.4E-01 2.4E-01 2.4E-01 2.4E-01 2.4E-01 2.4E-01 2.4E-01 2.4E-01 2.4E-01Ethylbenzene and related 1.27E-01 1.10E-01 1.10E-01 4.6E-01 4.6E-01 4.6E-01 4.6E-01 4.6E-01 4.6E-01 4.6E-01 4.6E-01 4.6E-01Formaldehyde and related 4.07E-01 3.53E-01 3.53E-01 1.5E+00 1.5E+00 1.5E+00 1.5E+00 1.5E+00 1.5E+00 1.5E+00 1.5E+00 1.5E+00Hexane, n- 6.30E-02 5.46E-02 5.46E-02 2.3E-01 2.3E-01 2.3E-01 2.3E-01 2.3E-01 2.3E-01 2.3E-01 2.3E-01 2.3E-01Naphthalene and related 1.05E-02 9.08E-03 9.08E-03 3.8E-02 3.8E-02 3.8E-02 3.8E-02 3.8E-02 3.8E-02 3.8E-02 3.8E-02 3.8E-02Styrene 7.15E-03 6.20E-03 6.20E-03 2.6E-02 2.6E-02 2.6E-02 2.6E-02 2.6E-02 2.6E-02 2.6E-02 2.6E-02 2.6E-02Toluene and related 2.91E-01 2.52E-01 2.52E-01 1.1E+00 1.1E+00 1.1E+00 1.1E+00 1.1E+00 1.1E+00 1.1E+00 1.1E+00 1.1E+00Xylenes 1.44E-01 1.25E-01 1.25E-01 5.2E-01 5.2E-01 5.2E-01 5.2E-01 5.2E-01 5.2E-01 5.2E-01 5.2E-01 5.2E-01Polycyclic Aromatic Hydrocarbons (PAHs)Benzo(a)pyrene TEQ-Equivalents - - - NA NA NA NA NA NA NA NA NANA Not applicable. Exposures to this chemical are not relevant for this exposure assessment scenario. NV No value. Exposures to this chemical could not be predicted due to an absence of appropriate air quality data
Page 3 of 3

COC MPOI R1 R2 R3 R4 R5 R6 R7 R8 R9 R10 R111-HOUR EXPOSURESCritieria Air Contaminants (CACs)Carbon monoxide (CO) 5.08E+03 3.45E+03 3.56E+03 2.01E+03 1.09E+03 6.39E+02 7.26E+02 1.55E+03 8.39E+02 7.90E+02 3.04E+02 4.80E+02Nitrogen dioxide (NO2) 3.78E+02 1.75E+02 2.43E+02 1.37E+02 1.08E+02 9.01E+01 8.10E+01 1.90E+02 9.45E+01 9.24E+01 9.37E+01 1.04E+02Coarse Particulate Matter (PM10) NA NA NA NA NA NA NA NA NA NA NA NAFine Particulate Matter (PM2.5) NA NA NA NA NA NA NA NA NA NA NA NASulphur Dioxide (SO2) 1.68E+02 7.42E+01 9.20E+01 9.08E+01 3.23E+01 3.33E+01 1.45E+01 6.66E+01 1.71E+01 2.99E+01 1.61E+01 1.65E+01Volatile Organic Chemicals (VOCs)Acetaldehyde 1.10E+01 6.74E+00 6.90E+00 5.54E+00 2.79E+00 2.12E+00 1.52E+00 5.22E+00 1.55E+00 2.10E+00 1.05E+00 1.01E+00Acetone 8.96E-01 5.47E-01 5.60E-01 4.50E-01 2.27E-01 1.72E-01 1.24E-01 4.24E-01 1.26E-01 1.71E-01 8.50E-02 8.25E-02Acrolein and related 7.00E+00 4.28E+00 4.38E+00 3.52E+00 1.78E+00 1.35E+00 9.66E-01 3.31E+00 9.87E-01 1.34E+00 6.65E-01 6.45E-01Aldehydes, other 7.31E+00 4.46E+00 4.57E+00 3.67E+00 1.85E+00 1.41E+00 1.01E+00 3.46E+00 1.03E+00 1.39E+00 6.94E-01 6.73E-01Aliphatic alcohols 2.56E+01 1.57E+01 1.60E+01 1.29E+01 6.50E+00 4.94E+00 3.54E+00 1.21E+01 3.61E+00 4.89E+00 2.43E+00 2.36E+00Alkanes/alkenes, other C1-4 1.02E+02 6.26E+01 6.41E+01 5.15E+01 2.60E+01 1.97E+01 1.41E+01 4.85E+01 1.44E+01 1.96E+01 9.72E+00 9.43E+00Alkanes/alkenes, other C5-8 3.07E+01 1.88E+01 1.92E+01 1.54E+01 7.79E+00 5.91E+00 4.24E+00 1.45E+01 4.33E+00 5.86E+00 2.92E+00 2.83E+00Alkanes/alkenes, other C>8-10 5.09E+01 3.11E+01 3.18E+01 2.56E+01 1.29E+01 9.80E+00 7.02E+00 2.41E+01 7.17E+00 9.71E+00 4.83E+00 4.68E+00Alkanes/alkenes, other C>10-12 2.70E+00 1.65E+00 1.69E+00 1.36E+00 6.83E-01 5.19E-01 3.72E-01 1.28E+00 3.80E-01 5.15E-01 2.56E-01 2.48E-01Alkanes/alkenes, other C>12-16 3.96E+00 2.42E+00 2.48E+00 1.99E+00 1.00E+00 7.63E-01 5.47E-01 1.88E+00 5.58E-01 7.56E-01 3.76E-01 3.65E-01Benzene and related 8.15E+00 4.98E+00 5.10E+00 4.10E+00 2.07E+00 1.57E+00 1.12E+00 3.86E+00 1.15E+00 1.56E+00 7.73E-01 7.50E-01Butadiene, 1,3- 4.29E+00 2.62E+00 2.68E+00 2.16E+00 1.09E+00 8.26E-01 5.92E-01 2.03E+00 6.04E-01 8.19E-01 4.07E-01 3.95E-01Cycloalkanes and cycloalkenes 2.91E+00 1.78E+00 1.82E+00 1.46E+00 7.39E-01 5.61E-01 4.02E-01 1.38E+00 4.11E-01 5.56E-01 2.77E-01 2.68E-01Ethylbenzene and related 6.55E+00 4.00E+00 4.10E+00 3.29E+00 1.66E+00 1.26E+00 9.03E-01 3.10E+00 9.22E-01 1.25E+00 6.21E-01 6.03E-01Formaldehyde and related 4.01E+01 2.45E+01 2.51E+01 2.02E+01 1.02E+01 7.72E+00 5.53E+00 1.90E+01 5.65E+00 7.66E+00 3.81E+00 3.69E+00Hexane, n- 9.90E-01 6.05E-01 6.19E-01 4.97E-01 2.51E-01 1.91E-01 1.37E-01 4.68E-01 1.39E-01 1.89E-01 9.39E-02 9.11E-02Naphthalene and related 2.63E+00 1.61E+00 1.65E+00 1.32E+00 6.66E-01 5.06E-01 3.63E-01 1.24E+00 3.71E-01 5.02E-01 2.50E-01 2.42E-01Styrene 7.49E-01 4.58E-01 4.69E-01 3.77E-01 1.90E-01 1.44E-01 1.03E-01 3.54E-01 1.06E-01 1.43E-01 7.11E-02 6.90E-02Toluene and related 4.16E+00 2.54E+00 2.61E+00 2.09E+00 1.06E+00 8.02E-01 5.75E-01 1.97E+00 5.87E-01 7.95E-01 3.95E-01 3.83E-01Xylenes 2.88E+00 1.76E+00 1.80E+00 1.45E+00 7.30E-01 5.54E-01 3.97E-01 1.36E+00 4.06E-01 5.50E-01 2.73E-01 2.65E-01Polycyclic Aromatic Hydrocarbons (PAHs)Benzo(a)pyrene TEQ-Equivalents NA NA NA NA NA NA NA NA NA NA NA NA
NV No value. Exposures to this chemical could not be predicted due to an absence of appropriate air quality NA Not applicable. Exposures to this chemical are not relevant for this exposure assessment scenario.
Table 2: 2011 Assessment Scenario TWA - Airport Case
Page 1 of 3

COC MPOI R1 R2 R3 R4 R5 R6 R7 R8 R9 R10 R11
Table 2: 2011 Assessment Scenario TWA - Airport Case
8-HOUR EXPOSURESCritieria Air Contaminants (CACs)Carbon monoxide (CO) 1.85E+03 1.16E+03 9.22E+02 3.14E+02 1.71E+02 1.61E+02 9.13E+01 2.11E+02 1.57E+02 1.77E+02 6.45E+01 6.00E+01
24-HOUR EXPOSURESCritieria Air Contaminants (CACs)Carbon monoxide (CO) NA NA NA NA NA NA NA NA NA NA NA NANitrogen dioxide (NO2) 3.66E+01 3.66E+01 2.97E+01 1.26E+01 9.51E+00 6.40E+00 8.04E+00 2.22E+01 9.39E+00 7.42E+00 4.38E+00 5.32E+00Coarse Particulate Matter (PM10) 5.03E+00 2.37E+00 1.88E+00 7.23E-01 5.74E-01 3.10E-01 2.29E-01 5.17E-01 3.36E-01 3.59E-01 1.21E-01 2.32E-01Fine Particulate Matter (PM2.5) 4.67E+00 2.09E+00 1.79E+00 6.93E-01 5.57E-01 2.84E-01 2.20E-01 4.70E-01 3.25E-01 3.42E-01 1.11E-01 2.17E-01Sulphur Dioxide (SO2) 1.64E+01 9.46E+00 1.20E+01 4.21E+00 3.16E+00 2.04E+00 7.80E-01 4.49E+00 1.10E+00 1.73E+00 1.01E+00 7.43E-01Volatile Organic Chemicals (VOCs)Acetaldehyde 1.29E+00 9.32E-01 8.81E-01 2.94E-01 2.52E-01 1.56E-01 6.40E-02 2.25E-01 1.17E-01 1.28E-01 7.40E-02 8.44E-02Acetone 1.04E-01 7.57E-02 7.16E-02 2.39E-02 2.05E-02 1.27E-02 5.20E-03 1.83E-02 9.51E-03 1.04E-02 6.01E-03 6.85E-03Acrolein and related 8.17E-01 5.92E-01 5.60E-01 1.87E-01 1.60E-01 9.91E-02 4.06E-02 1.43E-01 7.43E-02 8.11E-02 4.70E-02 5.36E-02Aldehydes, other 8.52E-01 6.18E-01 5.84E-01 1.95E-01 1.67E-01 1.03E-01 4.24E-02 1.49E-01 7.76E-02 8.46E-02 4.90E-02 5.59E-02Aliphatic alcohols 2.99E+00 2.17E+00 2.05E+00 6.85E-01 5.85E-01 3.63E-01 1.49E-01 5.22E-01 2.72E-01 2.97E-01 1.72E-01 1.96E-01Alkanes/alkenes, other C1-4 1.19E+01 8.66E+00 8.19E+00 2.74E+00 2.34E+00 1.45E+00 5.94E-01 2.09E+00 1.09E+00 1.19E+00 6.87E-01 7.84E-01Alkanes/alkenes, other C5-8 3.58E+00 2.60E+00 2.46E+00 8.21E-01 7.01E-01 4.34E-01 1.78E-01 6.26E-01 3.26E-01 3.56E-01 2.06E-01 2.35E-01Alkanes/alkenes, other C>8-10 5.93E+00 4.30E+00 4.07E+00 1.36E+00 1.16E+00 7.20E-01 2.95E-01 1.04E+00 5.40E-01 5.89E-01 3.41E-01 3.89E-01Alkanes/alkenes, other C>10-12 3.14E-01 2.28E-01 2.16E-01 7.20E-02 6.16E-02 3.81E-02 1.56E-02 5.49E-02 2.86E-02 3.12E-02 1.81E-02 2.06E-02Alkanes/alkenes, other C>12-16 4.62E-01 3.35E-01 3.17E-01 1.06E-01 9.05E-02 5.60E-02 2.30E-02 8.07E-02 4.21E-02 4.59E-02 2.66E-02 3.03E-02Benzene and related 9.50E-01 6.89E-01 6.51E-01 2.18E-01 1.86E-01 1.15E-01 4.73E-02 1.66E-01 8.65E-02 9.43E-02 5.47E-02 6.23E-02Butadiene, 1,3- 5.00E-01 3.63E-01 3.43E-01 1.15E-01 9.79E-02 6.07E-02 2.49E-02 8.74E-02 4.55E-02 4.97E-02 2.88E-02 3.28E-02Cycloalkanes and cycloalkenes 3.40E-01 2.46E-01 2.33E-01 7.78E-02 6.65E-02 4.12E-02 1.69E-02 5.94E-02 3.09E-02 3.37E-02 1.96E-02 2.23E-02Ethylbenzene and related 7.63E-01 5.53E-01 5.23E-01 1.75E-01 1.49E-01 9.26E-02 3.80E-02 1.33E-01 6.95E-02 7.58E-02 4.39E-02 5.01E-02Formaldehyde and related 4.67E+00 3.39E+00 3.21E+00 1.07E+00 9.16E-01 5.67E-01 2.33E-01 8.17E-01 4.26E-01 4.64E-01 2.69E-01 3.07E-01Hexane, n- 1.15E-01 8.37E-02 7.91E-02 2.64E-02 2.26E-02 1.40E-02 5.74E-03 2.02E-02 1.05E-02 1.15E-02 6.64E-03 7.57E-03Naphthalene and related 3.07E-01 2.22E-01 2.10E-01 7.02E-02 6.00E-02 3.72E-02 1.53E-02 5.36E-02 2.79E-02 3.04E-02 1.76E-02 2.01E-02Styrene 8.73E-02 6.33E-02 5.99E-02 2.00E-02 1.71E-02 1.06E-02 4.35E-03 1.53E-02 7.95E-03 8.67E-03 5.03E-03 5.73E-03Toluene and related 4.86E-01 3.52E-01 3.33E-01 1.11E-01 9.51E-02 5.89E-02 2.42E-02 8.49E-02 4.42E-02 4.82E-02 2.80E-02 3.19E-02Xylenes 3.36E-01 2.43E-01 2.30E-01 7.69E-02 6.57E-02 4.07E-02 1.67E-02 5.86E-02 3.06E-02 3.33E-02 1.93E-02 2.20E-02Polycyclic Aromatic Hydrocarbons (PAHs)Benzo(a)pyrene TEQ-Equivalents NA NA NA NA NA NA NA NA NA NA NA NANA Not applicable. Exposures to this chemical are not relevant for this exposure assessment scenario. NV No value. Exposures to this chemical could not be predicted due to an absence of appropriate air quality
Page 2 of 3

COC MPOI R1 R2 R3 R4 R5 R6 R7 R8 R9 R10 R11
Table 2: 2011 Assessment Scenario TWA - Airport Case
ANNUAL AVERAGE EXPOSURESCritieria Air Contaminants (CACs)Carbon monoxide (CO) 2.40E+01 2.08E+01 1.41E+01 1.30E+01 6.37E+00 3.49E+00 1.13E+00 9.13E+00 1.99E+00 3.85E+00 1.93E+00 1.23E+00Nitrogen dioxide (NO2) 2.17E+00 1.89E+00 1.49E+00 1.93E+00 1.18E+00 8.25E-01 3.57E-01 2.66E+00 5.01E-01 7.74E-01 4.79E-01 3.02E-01Coarse Particulate Matter (PM10) 1.41E-01 1.11E-01 7.95E-02 8.55E-02 4.48E-02 2.57E-02 8.02E-03 6.33E-02 1.35E-02 2.77E-02 1.43E-02 8.67E-03Fine Particulate Matter (PM2.5) 1.27E-01 9.08E-02 6.86E-02 7.91E-02 4.14E-02 2.37E-02 7.34E-03 5.93E-02 1.24E-02 2.56E-02 1.32E-02 7.97E-03Sulphur Dioxide (SO2) 3.79E-01 2.62E-01 2.35E-01 3.18E-01 1.45E-01 9.47E-02 3.98E-02 3.67E-01 5.57E-02 9.33E-02 5.91E-02 3.82E-02Volatile Organic Chemicals (VOCs)Acetaldehyde 4.67E-02 4.05E-02 2.82E-02 2.9E-02 1.3E-02 7.7E-03 3.1E-03 2.4E-02 4.8E-03 8.2E-03 4.7E-03 3.0E-03Acetone 3.80E-03 3.29E-03 2.29E-03 2.3E-03 1.1E-03 6.2E-04 2.5E-04 1.9E-03 3.9E-04 6.7E-04 3.8E-04 2.4E-04Acrolein and related 2.97E-02 2.57E-02 1.79E-02 1.8E-02 8.5E-03 4.9E-03 2.0E-03 1.5E-02 3.0E-03 5.2E-03 3.0E-03 1.9E-03Aldehydes, other 3.10E-02 2.68E-02 1.87E-02 1.9E-02 8.8E-03 5.1E-03 2.1E-03 1.6E-02 3.2E-03 5.5E-03 3.1E-03 2.0E-03Aliphatic alcohols 1.09E-01 9.42E-02 6.56E-02 6.7E-02 3.1E-02 1.8E-02 7.2E-03 5.6E-02 1.1E-02 1.9E-02 1.1E-02 7.0E-03Alkanes/alkenes, other C1-4 4.34E-01 3.76E-01 2.62E-01 2.7E-01 1.2E-01 7.1E-02 2.9E-02 2.2E-01 4.4E-02 7.6E-02 4.3E-02 2.8E-02Alkanes/alkenes, other C5-8 1.30E-01 1.13E-01 7.86E-02 8.0E-02 3.7E-02 2.1E-02 8.6E-03 6.7E-02 1.3E-02 2.3E-02 1.3E-02 8.4E-03Alkanes/alkenes, other C>8-10 2.16E-01 1.87E-01 1.30E-01 1.3E-01 6.1E-02 3.5E-02 1.4E-02 1.1E-01 2.2E-02 3.8E-02 2.1E-02 1.4E-02Alkanes/alkenes, other C>10-12 1.14E-02 9.90E-03 6.90E-03 7.0E-03 3.3E-03 1.9E-03 7.6E-04 5.9E-03 1.2E-03 2.0E-03 1.1E-03 7.4E-04Alkanes/alkenes, other C>12-16 1.68E-02 1.46E-02 1.01E-02 1.0E-02 4.8E-03 2.8E-03 1.1E-03 8.6E-03 1.7E-03 3.0E-03 1.7E-03 1.1E-03Benzene and related 3.45E-02 2.99E-02 2.09E-02 2.1E-02 9.8E-03 5.7E-03 2.3E-03 1.8E-02 3.5E-03 6.1E-03 3.4E-03 2.2E-03Butadiene, 1,3- 1.82E-02 1.58E-02 1.10E-02 1.1E-02 5.2E-03 3.0E-03 1.2E-03 9.3E-03 1.9E-03 3.2E-03 1.8E-03 1.2E-03Cycloalkanes and cycloalkenes 1.24E-02 1.07E-02 7.46E-03 7.6E-03 3.5E-03 2.0E-03 8.2E-04 6.3E-03 1.3E-03 2.2E-03 1.2E-03 8.0E-04Ethylbenzene and related 2.77E-02 2.40E-02 1.68E-02 1.7E-02 7.9E-03 4.6E-03 1.8E-03 1.4E-02 2.8E-03 4.9E-03 2.8E-03 1.8E-03Formaldehyde and related 1.70E-01 1.47E-01 1.03E-01 1.0E-01 4.8E-02 2.8E-02 1.1E-02 8.7E-02 1.7E-02 3.0E-02 1.7E-02 1.1E-02Hexane, n- 4.19E-03 3.63E-03 2.53E-03 2.6E-03 1.2E-03 6.9E-04 2.8E-04 2.1E-03 4.3E-04 7.4E-04 4.2E-04 2.7E-04Naphthalene and related 1.11E-02 9.66E-03 6.73E-03 6.8E-03 3.2E-03 1.8E-03 7.4E-04 5.7E-03 1.1E-03 2.0E-03 1.1E-03 7.2E-04Styrene 3.17E-03 2.75E-03 1.92E-03 1.9E-03 9.1E-04 5.2E-04 2.1E-04 1.6E-03 3.2E-04 5.6E-04 3.2E-04 2.0E-04Toluene and related 1.77E-02 1.53E-02 1.07E-02 1.1E-02 5.0E-03 2.9E-03 1.2E-03 9.0E-03 1.8E-03 3.1E-03 1.8E-03 1.1E-03Xylenes 1.22E-02 1.06E-02 7.37E-03 7.5E-03 3.5E-03 2.0E-03 8.1E-04 6.2E-03 1.2E-03 2.1E-03 1.2E-03 7.9E-04Polycyclic Aromatic Hydrocarbons (PAHs)Benzo(a)pyrene TEQ-Equivalents 5.44E-04 3.89E-04 2.93E-04 3.4E-04 1.8E-04 1.0E-04 3.1E-05 2.5E-04 5.3E-05 1.1E-04 5.6E-05 3.4E-05NA Not applicable. Exposures to this chemical are not relevant for this exposure assessment scenario. NV No value. Exposures to this chemical could not be predicted due to an absence of appropriate air quality
Page 3 of 3

COC MPOI R1 R2 R3 R4 R5 R6 R7 R8 R9 R10 R111-HOUR EXPOSURESCritieria Air Contaminants (CACs)Carbon monoxide (CO) 1.35E+04 5.17E+03 5.63E+03 7.10E+03 4.81E+03 3.37E+03 4.38E+03 3.72E+03 2.78E+03 3.35E+03 3.13E+03 4.63E+03Nitrogen dioxide (NO2) 4.24E+02 1.76E+02 2.44E+02 1.71E+02 1.63E+02 1.39E+02 1.68E+02 2.24E+02 1.63E+02 1.60E+02 1.53E+02 1.68E+02Coarse Particulate Matter (PM10) NA NA NA NA NA NA NA NA NA NA NA NAFine Particulate Matter (PM2.5) NA NA NA NA NA NA NA NA NA NA NA NASulphur Dioxide (SO2) 1.74E+03 2.71E+02 2.62E+02 3.07E+02 2.94E+02 3.67E+02 2.10E+02 4.17E+02 4.73E+02 4.71E+02 2.08E+02 1.30E+02Volatile Organic Chemicals (VOCs)Acetaldehyde 1.76E+01 1.33E+01 1.35E+01 1.21E+01 9.39E+00 8.71E+00 8.11E+00 1.18E+01 8.15E+00 8.70E+00 7.64E+00 7.61E+00Acetone 1.38E+01 1.34E+01 1.35E+01 1.34E+01 1.31E+01 1.31E+01 1.30E+01 1.33E+01 1.30E+01 1.31E+01 1.30E+01 1.30E+01Acrolein and related 7.32E+00 4.60E+00 4.70E+00 3.84E+00 2.09E+00 1.66E+00 1.28E+00 3.63E+00 1.30E+00 1.65E+00 9.81E-01 9.61E-01Aldehydes, other 1.44E+01 1.16E+01 1.17E+01 1.08E+01 8.96E+00 8.51E+00 8.11E+00 1.06E+01 8.13E+00 8.50E+00 7.80E+00 7.78E+00Aliphatic alcohols 2.56E+01 1.57E+01 1.60E+01 1.29E+01 6.50E+00 4.94E+00 3.54E+00 1.21E+01 3.61E+00 4.89E+00 2.43E+00 2.36E+00Alkanes/alkenes, other C1-4 1.63E+02 1.23E+02 1.25E+02 1.12E+02 8.66E+01 8.04E+01 7.48E+01 1.09E+02 7.51E+01 8.02E+01 7.04E+01 7.01E+01Alkanes/alkenes, other C5-8 4.13E+01 2.93E+01 2.98E+01 2.60E+01 1.84E+01 1.65E+01 1.48E+01 2.51E+01 1.49E+01 1.64E+01 1.35E+01 1.34E+01Alkanes/alkenes, other C>8-10 5.19E+01 3.21E+01 3.28E+01 2.66E+01 1.39E+01 1.08E+01 8.00E+00 2.51E+01 8.15E+00 1.07E+01 5.81E+00 5.66E+00Alkanes/alkenes, other C>10-12 3.31E+00 2.26E+00 2.30E+00 1.97E+00 1.29E+00 1.13E+00 9.84E-01 1.89E+00 9.91E-01 1.13E+00 8.68E-01 8.60E-01Alkanes/alkenes, other C>12-16 3.96E+00 2.42E+00 2.48E+00 1.99E+00 1.00E+00 7.63E-01 5.47E-01 1.88E+00 5.58E-01 7.56E-01 3.76E-01 3.65E-01Benzene and related 1.02E+01 7.03E+00 7.15E+00 6.15E+00 4.12E+00 3.63E+00 3.18E+00 5.91E+00 3.20E+00 3.61E+00 2.83E+00 2.81E+00Butadiene, 1,3- 4.50E+00 2.83E+00 2.89E+00 2.37E+00 1.30E+00 1.04E+00 8.02E-01 2.24E+00 8.15E-01 1.03E+00 6.18E-01 6.05E-01Cycloalkanes and cycloalkenes 3.87E+00 2.74E+00 2.78E+00 2.42E+00 1.69E+00 1.52E+00 1.36E+00 2.33E+00 1.37E+00 1.51E+00 1.23E+00 1.22E+00Ethylbenzene and related 9.20E+00 6.66E+00 6.75E+00 5.95E+00 4.32E+00 3.92E+00 3.56E+00 5.75E+00 3.58E+00 3.91E+00 3.28E+00 3.26E+00Formaldehyde and related 4.90E+01 3.34E+01 3.40E+01 2.91E+01 1.91E+01 1.66E+01 1.45E+01 2.79E+01 1.46E+01 1.66E+01 1.27E+01 1.26E+01Hexane, n- 1.84E+00 1.46E+00 1.47E+00 1.35E+00 1.10E+00 1.04E+00 9.90E-01 1.32E+00 9.93E-01 1.04E+00 9.47E-01 9.44E-01Naphthalene and related 2.84E+00 1.82E+00 1.86E+00 1.54E+00 8.81E-01 7.21E-01 5.77E-01 1.46E+00 5.85E-01 7.16E-01 4.64E-01 4.57E-01Styrene 1.04E+00 7.49E-01 7.60E-01 6.68E-01 4.82E-01 4.36E-01 3.95E-01 6.46E-01 3.97E-01 4.35E-01 3.63E-01 3.61E-01Toluene and related 1.04E+01 8.78E+00 8.84E+00 8.33E+00 7.29E+00 7.04E+00 6.81E+00 8.21E+00 6.82E+00 7.03E+00 6.63E+00 6.62E+00Xylenes 5.42E+00 4.30E+00 4.34E+00 3.98E+00 3.27E+00 3.09E+00 2.93E+00 3.90E+00 2.94E+00 3.09E+00 2.81E+00 2.80E+00Polycyclic Aromatic Hydrocarbons (PAHs)Benzo(a)pyrene TEQ-Equivalents NA NA NA NA NA NA NA NA NA NA NA NA
NV No value. Exposures to this chemical could not be predicted due to an absence of appropriate air quality NA Not applicable. Exposures to this chemical are not relevant for this exposure assessment scenario.
Table 3: 2011 Assessment Scenario TWA - Cumulative Case
Page 1 of 3

COC MPOI R1 R2 R3 R4 R5 R6 R7 R8 R9 R10 R11
Table 3: 2011 Assessment Scenario TWA - Cumulative Case
8-HOUR EXPOSURESCritieria Air Contaminants (CACs)Carbon monoxide (CO) 6.48E+03 2.08E+03 2.05E+03 3.95E+03 2.84E+03 1.94E+03 2.78E+03 1.38E+03 1.36E+03 2.60E+03 2.11E+03 2.66E+03
24-HOUR EXPOSURESCritieria Air Contaminants (CACs)Carbon monoxide (CO) NA NA NA NA NA NA NA NA NA NA NA NANitrogen dioxide (NO2) 1.04E+02 5.26E+01 5.37E+01 5.33E+01 4.09E+01 3.56E+01 5.24E+01 5.54E+01 4.64E+01 3.94E+01 4.50E+01 4.67E+01Coarse Particulate Matter (PM10) 1.93E+02 1.37E+02 1.51E+02 1.51E+02 1.24E+02 9.07E+01 7.11E+01 1.05E+02 1.01E+02 1.10E+02 1.01E+02 6.99E+01Fine Particulate Matter (PM2.5) 1.43E+02 4.14E+01 4.55E+01 4.86E+01 3.73E+01 3.37E+01 3.48E+01 4.36E+01 4.96E+01 3.57E+01 3.57E+01 2.73E+01Sulphur Dioxide (SO2) 5.80E+02 3.50E+01 3.17E+01 2.70E+01 2.67E+01 4.43E+01 2.72E+01 4.17E+01 6.73E+01 4.44E+01 1.65E+01 1.66E+01Volatile Organic Chemicals (VOCs)Acetaldehyde 3.99E+00 3.64E+00 3.59E+00 3.00E+00 2.96E+00 2.86E+00 2.77E+00 2.93E+00 2.82E+00 2.83E+00 2.78E+00 2.79E+00Acetone 5.40E+00 5.37E+00 5.37E+00 5.32E+00 5.32E+00 5.31E+00 5.30E+00 5.32E+00 5.31E+00 5.31E+00 5.31E+00 5.31E+00Acrolein and related 9.46E-01 7.22E-01 6.90E-01 3.17E-01 2.90E-01 2.29E-01 1.70E-01 2.72E-01 2.04E-01 2.11E-01 1.77E-01 1.83E-01Aldehydes, other 3.77E+00 3.54E+00 3.50E+00 3.11E+00 3.09E+00 3.02E+00 2.96E+00 3.07E+00 3.00E+00 3.00E+00 2.97E+00 2.97E+00Aliphatic alcohols 2.99E+00 2.17E+00 2.05E+00 6.85E-01 5.85E-01 3.63E-01 1.49E-01 5.22E-01 2.72E-01 2.97E-01 1.72E-01 1.96E-01Alkanes/alkenes, other C1-4 3.69E+01 3.36E+01 3.31E+01 2.77E+01 2.73E+01 2.64E+01 2.55E+01 2.70E+01 2.60E+01 2.61E+01 2.56E+01 2.57E+01Alkanes/alkenes, other C5-8 7.92E+00 6.94E+00 6.80E+00 5.16E+00 5.04E+00 4.78E+00 4.52E+00 4.97E+00 4.67E+00 4.70E+00 4.55E+00 4.58E+00Alkanes/alkenes, other C>8-10 6.33E+00 4.70E+00 4.47E+00 1.76E+00 1.56E+00 1.12E+00 6.98E-01 1.44E+00 9.43E-01 9.92E-01 7.44E-01 7.92E-01Alkanes/alkenes, other C>10-12 5.65E-01 4.79E-01 4.67E-01 3.23E-01 3.13E-01 2.89E-01 2.67E-01 3.06E-01 2.80E-01 2.82E-01 2.69E-01 2.72E-01Alkanes/alkenes, other C>12-16 4.62E-01 3.35E-01 3.17E-01 1.06E-01 9.05E-02 5.60E-02 2.30E-02 8.07E-02 4.21E-02 4.59E-02 2.66E-02 3.03E-02Benzene and related 1.79E+00 1.53E+00 1.50E+00 1.06E+00 1.03E+00 9.60E-01 8.92E-01 1.01E+00 9.31E-01 9.39E-01 8.99E-01 9.07E-01Butadiene, 1,3- 5.87E-01 4.49E-01 4.29E-01 2.01E-01 1.84E-01 1.47E-01 1.11E-01 1.74E-01 1.32E-01 1.36E-01 1.15E-01 1.19E-01Cycloalkanes and cycloalkenes 7.32E-01 6.39E-01 6.25E-01 4.70E-01 4.59E-01 4.34E-01 4.09E-01 4.52E-01 4.23E-01 4.26E-01 4.12E-01 4.15E-01Ethylbenzene and related 1.85E+00 1.64E+00 1.61E+00 1.27E+00 1.24E+00 1.18E+00 1.13E+00 1.22E+00 1.16E+00 1.17E+00 1.14E+00 1.14E+00Formaldehyde and related 8.34E+00 7.06E+00 6.87E+00 4.74E+00 4.58E+00 4.23E+00 3.90E+00 4.48E+00 4.09E+00 4.13E+00 3.93E+00 3.97E+00Hexane, n- 4.66E-01 4.34E-01 4.30E-01 3.77E-01 3.73E-01 3.64E-01 3.56E-01 3.71E-01 3.61E-01 3.62E-01 3.57E-01 3.58E-01Naphthalene and related 3.95E-01 3.10E-01 2.98E-01 1.58E-01 1.48E-01 1.25E-01 1.03E-01 1.42E-01 1.16E-01 1.19E-01 1.06E-01 1.08E-01Styrene 2.07E-01 1.83E-01 1.80E-01 1.40E-01 1.37E-01 1.30E-01 1.24E-01 1.35E-01 1.28E-01 1.28E-01 1.25E-01 1.26E-01Toluene and related 3.05E+00 2.91E+00 2.89E+00 2.67E+00 2.66E+00 2.62E+00 2.59E+00 2.65E+00 2.61E+00 2.61E+00 2.59E+00 2.59E+00Xylenes 1.38E+00 1.29E+00 1.27E+00 1.12E+00 1.11E+00 1.08E+00 1.06E+00 1.10E+00 1.07E+00 1.08E+00 1.06E+00 1.06E+00Polycyclic Aromatic Hydrocarbons (PAHs)Benzo(a)pyrene TEQ-Equivalents NA NA NA NA NA NA NA NA NA NA NA NANA Not applicable. Exposures to this chemical are not relevant for this exposure assessment scenario. NV No value. Exposures to this chemical could not be predicted due to an absence of appropriate air quality
Page 2 of 3

COC MPOI R1 R2 R3 R4 R5 R6 R7 R8 R9 R10 R11
Table 3: 2011 Assessment Scenario TWA - Cumulative Case
ANNUAL AVERAGE EXPOSURESCritieria Air Contaminants (CACs)Carbon monoxide (CO) 2.22E+02 6.43E+01 6.22E+01 4.16E+02 2.35E+02 1.93E+02 3.09E+02 1.53E+02 1.56E+02 2.16E+02 2.44E+02 2.92E+02Nitrogen dioxide (NO2) 1.43E+01 4.97E+00 4.87E+00 2.40E+01 1.60E+01 1.41E+01 1.85E+01 1.93E+01 1.50E+01 1.47E+01 1.55E+01 1.81E+01Coarse Particulate Matter (PM10) 1.50E+01 9.65E+00 1.04E+01 3.85E+01 3.04E+01 2.40E+01 1.86E+01 2.52E+01 2.41E+01 2.78E+01 2.59E+01 1.66E+01Fine Particulate Matter (PM2.5) 9.81E+00 2.82E+00 2.99E+00 1.27E+01 9.66E+00 8.84E+00 8.22E+00 1.08E+01 1.01E+01 9.83E+00 9.33E+00 6.50E+00Sulphur Dioxide (SO2) 3.72E+01 1.03E+00 1.01E+00 4.02E+00 3.76E+00 4.47E+00 3.02E+00 5.53E+00 6.52E+00 5.42E+00 2.42E+00 1.85E+00Volatile Organic Chemicals (VOCs)Acetaldehyde 3.00E-01 2.60E-01 2.48E-01 9.5E-01 9.4E-01 9.3E-01 9.3E-01 9.5E-01 9.3E-01 9.3E-01 9.3E-01 9.3E-01Acetone 6.98E-01 6.05E-01 6.04E-01 2.5E+00 2.5E+00 2.5E+00 2.5E+00 2.5E+00 2.5E+00 2.5E+00 2.5E+00 2.5E+00Acrolein and related 3.89E-02 3.37E-02 2.59E-02 5.2E-02 4.2E-02 3.8E-02 3.6E-02 4.9E-02 3.7E-02 3.9E-02 3.7E-02 3.6E-02Aldehydes, other 2.58E-01 2.23E-01 2.15E-01 8.4E-01 8.3E-01 8.3E-01 8.3E-01 8.4E-01 8.3E-01 8.3E-01 8.3E-01 8.3E-01Aliphatic alcohols 1.09E-01 9.42E-02 6.56E-02 6.7E-02 3.1E-02 1.8E-02 7.2E-03 5.6E-02 1.1E-02 1.9E-02 1.1E-02 7.0E-03Alkanes/alkenes, other C1-4 4.27E+00 3.70E+00 3.58E+00 1.4E+01 1.4E+01 1.4E+01 1.4E+01 1.4E+01 1.4E+01 1.4E+01 1.4E+01 1.4E+01Alkanes/alkenes, other C5-8 8.51E-01 7.38E-01 7.03E-01 2.7E+00 2.7E+00 2.6E+00 2.6E+00 2.7E+00 2.6E+00 2.6E+00 2.6E+00 2.6E+00Alkanes/alkenes, other C>8-10 2.56E-01 2.22E-01 1.65E-01 2.8E-01 2.1E-01 1.8E-01 1.6E-01 2.6E-01 1.7E-01 1.8E-01 1.7E-01 1.6E-01Alkanes/alkenes, other C>10-12 4.34E-02 3.77E-02 3.47E-02 1.2E-01 1.2E-01 1.2E-01 1.2E-01 1.2E-01 1.2E-01 1.2E-01 1.2E-01 1.2E-01Alkanes/alkenes, other C>12-16 1.68E-02 1.46E-02 1.01E-02 1.0E-02 4.8E-03 2.8E-03 1.1E-03 8.6E-03 1.7E-03 3.0E-03 1.7E-03 1.1E-03Benzene and related 2.00E-01 1.73E-01 1.64E-01 6.2E-01 6.1E-01 6.1E-01 6.0E-01 6.2E-01 6.0E-01 6.1E-01 6.0E-01 6.0E-01Butadiene, 1,3- 3.00E-02 2.60E-02 2.12E-02 5.4E-02 4.8E-02 4.6E-02 4.4E-02 5.2E-02 4.5E-02 4.6E-02 4.5E-02 4.4E-02Cycloalkanes and cycloalkenes 7.92E-02 6.87E-02 6.54E-02 2.5E-01 2.5E-01 2.5E-01 2.4E-01 2.5E-01 2.4E-01 2.5E-01 2.4E-01 2.4E-01Ethylbenzene and related 1.54E-01 1.34E-01 1.27E-01 4.8E-01 4.7E-01 4.7E-01 4.6E-01 4.8E-01 4.6E-01 4.7E-01 4.6E-01 4.6E-01Formaldehyde and related 5.77E-01 5.00E-01 4.56E-01 1.6E+00 1.5E+00 1.5E+00 1.5E+00 1.6E+00 1.5E+00 1.5E+00 1.5E+00 1.5E+00Hexane, n- 6.72E-02 5.83E-02 5.72E-02 2.3E-01 2.3E-01 2.3E-01 2.3E-01 2.3E-01 2.3E-01 2.3E-01 2.3E-01 2.3E-01Naphthalene and related 2.16E-02 1.87E-02 1.58E-02 4.5E-02 4.1E-02 4.0E-02 3.9E-02 4.4E-02 3.9E-02 4.0E-02 3.9E-02 3.9E-02Styrene 1.03E-02 8.95E-03 8.11E-03 2.8E-02 2.7E-02 2.7E-02 2.6E-02 2.8E-02 2.6E-02 2.7E-02 2.6E-02 2.6E-02Toluene and related 3.08E-01 2.67E-01 2.63E-01 1.1E+00 1.1E+00 1.1E+00 1.1E+00 1.1E+00 1.1E+00 1.1E+00 1.1E+00 1.1E+00Xylenes 1.56E-01 1.36E-01 1.32E-01 5.3E-01 5.3E-01 5.3E-01 5.3E-01 5.3E-01 5.3E-01 5.3E-01 5.3E-01 5.3E-01Polycyclic Aromatic Hydrocarbons (PAHs)Benzo(a)pyrene TEQ-Equivalents NA NA NA NA NA NA NA NA NA NA NA NANA Not applicable. Exposures to this chemical are not relevant for this exposure assessment scenario. NV No value. Exposures to this chemical could not be predicted due to an absence of appropriate air quality
Page 3 of 3

Table 4: 2022 Assessment Scenario - TWA - Background Case
MPOI R1 R2 R3 R4 R5 R6 R7 R8 R9 R10 R111-HOUR EXPOSURESCritieria Air Contaminants (CACs)Carbon monoxide (CO) 1.36E+04 3.82E+03 4.07E+03 7.25E+03 4.90E+03 3.36E+03 4.64E+03 3.77E+03 2.89E+03 3.36E+03 3.42E+03 4.63E+03Nitrogen dioxide (NO2) 3.44E+02 1.90E+02 1.94E+02 2.12E+02 1.77E+02 1.80E+02 1.87E+02 2.58E+02 1.82E+02 1.78E+02 1.78E+02 1.86E+02Coarse Particulate Matter (PM10) NA NA NA NA NA NA NA NA NA NA NA NAFine Particulate Matter (PM2.5) NA NA NA NA NA NA NA NA NA NA NA NASulphur Dioxide (SO2) 1.74E+03 2.84E+02 2.70E+02 3.07E+02 3.03E+02 3.81E+02 2.11E+02 4.36E+02 4.79E+02 4.71E+02 2.19E+02 1.30E+02Volatile Organic Chemicals (VOCs)Acetaldehyde 6.59E+00 6.59E+00 6.59E+00 6.59E+00 6.59E+00 6.59E+00 6.59E+00 6.59E+00 6.59E+00 6.59E+00 6.59E+00 6.59E+00Acetone 1.29E+01 1.29E+01 1.29E+01 1.29E+01 1.29E+01 1.29E+01 1.29E+01 1.29E+01 1.29E+01 1.29E+01 1.29E+01 1.29E+01Acrolein and related 3.16E-01 3.16E-01 3.16E-01 3.16E-01 3.16E-01 3.16E-01 3.16E-01 3.16E-01 3.16E-01 3.16E-01 3.16E-01 3.16E-01Aldehydes, other 7.11E+00 7.11E+00 7.11E+00 7.11E+00 7.11E+00 7.11E+00 7.11E+00 7.11E+00 7.11E+00 7.11E+00 7.11E+00 7.11E+00Aliphatic alcohols NV NV NV NV NV NV NV NV NV NV NV NVAlkanes/alkenes, other C1-4 6.07E+01 6.07E+01 6.07E+01 6.07E+01 6.07E+01 6.07E+01 6.07E+01 6.07E+01 6.07E+01 6.07E+01 6.07E+01 6.07E+01Alkanes/alkenes, other C5-8 1.06E+01 1.06E+01 1.06E+01 1.06E+01 1.06E+01 1.06E+01 1.06E+01 1.06E+01 1.06E+01 1.06E+01 1.06E+01 1.06E+01Alkanes/alkenes, other C>8-10 9.81E-01 9.81E-01 9.81E-01 9.81E-01 9.81E-01 9.81E-01 9.81E-01 9.81E-01 9.81E-01 9.81E-01 9.81E-01 9.81E-01Alkanes/alkenes, other C>10-12 6.12E-01 6.12E-01 6.12E-01 6.12E-01 6.12E-01 6.12E-01 6.12E-01 6.12E-01 6.12E-01 6.12E-01 6.12E-01 6.12E-01Alkanes/alkenes, other C>12-16 NV NV NV NV NV NV NV NV NV NV NV NVBenzene and related 2.06E+00 2.06E+00 2.06E+00 2.06E+00 2.06E+00 2.06E+00 2.06E+00 2.06E+00 2.06E+00 2.06E+00 2.06E+00 2.06E+00Butadiene, 1,3- 2.11E-01 2.11E-01 2.11E-01 2.11E-01 2.11E-01 2.11E-01 2.11E-01 2.11E-01 2.11E-01 2.11E-01 2.11E-01 2.11E-01Cycloalkanes and cycloalkenes 9.55E-01 9.55E-01 9.55E-01 9.55E-01 9.55E-01 9.55E-01 9.55E-01 9.55E-01 9.55E-01 9.55E-01 9.55E-01 9.55E-01Ethylbenzene and related 2.66E+00 2.66E+00 2.66E+00 2.66E+00 2.66E+00 2.66E+00 2.66E+00 2.66E+00 2.66E+00 2.66E+00 2.66E+00 2.66E+00Formaldehyde and related 8.92E+00 8.92E+00 8.92E+00 8.92E+00 8.92E+00 8.92E+00 8.92E+00 8.92E+00 8.92E+00 8.92E+00 8.92E+00 8.92E+00Hexane, n- 8.53E-01 8.53E-01 8.53E-01 8.53E-01 8.53E-01 8.53E-01 8.53E-01 8.53E-01 8.53E-01 8.53E-01 8.53E-01 8.53E-01Naphthalene and related 2.15E-01 2.15E-01 2.15E-01 2.15E-01 2.15E-01 2.15E-01 2.15E-01 2.15E-01 2.15E-01 2.15E-01 2.15E-01 2.15E-01Styrene 2.92E-01 2.92E-01 2.92E-01 2.92E-01 2.92E-01 2.92E-01 2.92E-01 2.92E-01 2.92E-01 2.92E-01 2.92E-01 2.92E-01Toluene and related 6.24E+00 6.24E+00 6.24E+00 6.24E+00 6.24E+00 6.24E+00 6.24E+00 6.24E+00 6.24E+00 6.24E+00 6.24E+00 6.24E+00Xylenes 2.54E+00 2.54E+00 2.54E+00 2.54E+00 2.54E+00 2.54E+00 2.54E+00 2.54E+00 2.54E+00 2.54E+00 2.54E+00 2.54E+00Polycyclic Aromatic Hydrocarbons (PAHs)Benzo(a)pyrene TEQ-Equivalents NA NA NA NA NA NA NA NA NA NA NA NANA Not applicable. Exposures to this chemical are not relevant for this exposure assessment scenario. NV No value. Exposures to this chemical could not be predicted due to an absence of appropriate air quality data
COC
Page 1 of 6

Table 4: 2022 Assessment Scenario - TWA - Background Case
MPOI R1 R2 R3 R4 R5 R6 R7 R8 R9 R10 R11COC8-HOUR EXPOSURESCritieria Air Contaminants (CACs)Carbon monoxide (CO) 7.61E+03 2.23E+03 2.54E+03 3.93E+03 2.82E+03 1.93E+03 3.06E+03 1.38E+03 1.53E+03 2.59E+03 2.11E+03 3.13E+03
24-HOUR EXPOSURESCritieria Air Contaminants (CACs)Carbon monoxide (CO) NA NA NA NA NA NA NA NA NA NA NA NANitrogen dioxide (NO2) 1.22E+02 4.80E+01 5.00E+01 5.60E+01 4.30E+01 4.20E+01 5.80E+01 7.60E+01 5.00E+01 4.50E+01 4.70E+01 5.80E+01Coarse Particulate Matter (PM10) 2.07E+02 1.45E+02 1.64E+02 1.39E+02 1.12E+02 9.30E+01 7.20E+01 1.12E+02 1.13E+02 9.80E+01 1.01E+02 7.50E+01Fine Particulate Matter (PM2.5) 1.24E+02 4.30E+01 4.80E+01 4.60E+01 3.60E+01 3.60E+01 3.20E+01 5.20E+01 4.40E+01 3.70E+01 3.90E+01 2.80E+01Sulphur Dioxide (SO2) 6.07E+02 2.90E+01 2.80E+01 3.60E+01 3.50E+01 5.70E+01 2.80E+01 6.70E+01 6.70E+01 5.60E+01 2.40E+01 1.90E+01Volatile Organic Chemicals (VOCs)Acetaldehyde 2.71E+00 2.71E+00 2.71E+00 2.71E+00 2.71E+00 2.71E+00 2.71E+00 2.71E+00 2.71E+00 2.71E+00 2.71E+00 2.71E+00Acetone 5.30E+00 5.30E+00 5.30E+00 5.30E+00 5.30E+00 5.30E+00 5.30E+00 5.30E+00 5.30E+00 5.30E+00 5.30E+00 5.30E+00Acrolein and related 1.30E-01 1.30E-01 1.30E-01 1.30E-01 1.30E-01 1.30E-01 1.30E-01 1.30E-01 1.30E-01 1.30E-01 1.30E-01 1.30E-01Aldehydes, other 2.92E+00 2.92E+00 2.92E+00 2.92E+00 2.92E+00 2.92E+00 2.92E+00 2.92E+00 2.92E+00 2.92E+00 2.92E+00 2.92E+00Aliphatic alcohols NV NV NV NV NV NV NV NV NV NV NV NVAlkanes/alkenes, other C1-4 2.49E+01 2.49E+01 2.49E+01 2.49E+01 2.49E+01 2.49E+01 2.49E+01 2.49E+01 2.49E+01 2.49E+01 2.49E+01 2.49E+01Alkanes/alkenes, other C5-8 4.34E+00 4.34E+00 4.34E+00 4.34E+00 4.34E+00 4.34E+00 4.34E+00 4.34E+00 4.34E+00 4.34E+00 4.34E+00 4.34E+00Alkanes/alkenes, other C>8-10 4.03E-01 4.03E-01 4.03E-01 4.03E-01 4.03E-01 4.03E-01 4.03E-01 4.03E-01 4.03E-01 4.03E-01 4.03E-01 4.03E-01Alkanes/alkenes, other C>10-12 2.51E-01 2.51E-01 2.51E-01 2.51E-01 2.51E-01 2.51E-01 2.51E-01 2.51E-01 2.51E-01 2.51E-01 2.51E-01 2.51E-01Alkanes/alkenes, other C>12-16 NV NV NV NV NV NV NV NV NV NV NV NVBenzene and related 8.45E-01 8.45E-01 8.45E-01 8.45E-01 8.45E-01 8.45E-01 8.45E-01 8.45E-01 8.45E-01 8.45E-01 8.45E-01 8.45E-01Butadiene, 1,3- 8.65E-02 8.65E-02 8.65E-02 8.65E-02 8.65E-02 8.65E-02 8.65E-02 8.65E-02 8.65E-02 8.65E-02 8.65E-02 8.65E-02Cycloalkanes and cycloalkenes 3.92E-01 3.92E-01 3.92E-01 3.92E-01 3.92E-01 3.92E-01 3.92E-01 3.92E-01 3.92E-01 3.92E-01 3.92E-01 3.92E-01Ethylbenzene and related 1.09E+00 1.09E+00 1.09E+00 1.09E+00 1.09E+00 1.09E+00 1.09E+00 1.09E+00 1.09E+00 1.09E+00 1.09E+00 1.09E+00Formaldehyde and related 3.67E+00 3.67E+00 3.67E+00 3.67E+00 3.67E+00 3.67E+00 3.67E+00 3.67E+00 3.67E+00 3.67E+00 3.67E+00 3.67E+00Hexane, n- 3.50E-01 3.50E-01 3.50E-01 3.50E-01 3.50E-01 3.50E-01 3.50E-01 3.50E-01 3.50E-01 3.50E-01 3.50E-01 3.50E-01Naphthalene and related 8.81E-02 8.81E-02 8.81E-02 8.81E-02 8.81E-02 8.81E-02 8.81E-02 8.81E-02 8.81E-02 8.81E-02 8.81E-02 8.81E-02Styrene 1.20E-01 1.20E-01 1.20E-01 1.20E-01 1.20E-01 1.20E-01 1.20E-01 1.20E-01 1.20E-01 1.20E-01 1.20E-01 1.20E-01Toluene and related 2.56E+00 2.56E+00 2.56E+00 2.56E+00 2.56E+00 2.56E+00 2.56E+00 2.56E+00 2.56E+00 2.56E+00 2.56E+00 2.56E+00Xylenes 1.04E+00 1.04E+00 1.04E+00 1.04E+00 1.04E+00 1.04E+00 1.04E+00 1.04E+00 1.04E+00 1.04E+00 1.04E+00 1.04E+00Polycyclic Aromatic Hydrocarbons (PAHs)Benzo(a)pyrene TEQ-Equivalents NA NA NA NA NA NA NA NA NA NA NA NANA Not applicable. Exposures to this chemical are not relevant for this exposure assessment scenario. NV No value. Exposures to this chemical could not be predicted due to an absence of appropriate air quality data
Page 2 of 6

Table 4: 2022 Assessment Scenario - TWA - Background Case
MPOI R1 R2 R3 R4 R5 R6 R7 R8 R9 R10 R11COCANNUAL AVERAGE EXPOSURESCritieria Air Contaminants (CACs)Carbon monoxide (CO) 2.62E+02 5.43E+01 6.00E+01 4.65E+02 2.81E+02 2.31E+02 3.76E+02 1.78E+02 1.86E+02 2.63E+02 2.95E+02 3.60E+02Nitrogen dioxide (NO2) 1.36E+01 3.57E+00 3.57E+00 2.20E+01 1.40E+01 1.30E+01 1.70E+01 1.70E+01 1.40E+01 1.30E+01 1.40E+01 1.70E+01Coarse Particulate Matter (PM10) 1.35E+01 8.81E+00 9.52E+00 3.50E+01 2.80E+01 2.20E+01 1.70E+01 2.40E+01 2.30E+01 2.60E+01 2.40E+01 1.50E+01Fine Particulate Matter (PM2.5) 8.71E+00 2.62E+00 2.62E+00 1.20E+01 9.00E+00 8.00E+00 8.00E+00 1.00E+01 1.00E+01 9.00E+00 9.00E+00 6.00E+00Sulphur Dioxide (SO2) 4.25E+01 8.81E-01 8.57E-01 4.20E+00 4.30E+00 5.60E+00 3.20E+00 6.60E+00 9.00E+00 6.20E+00 2.80E+00 2.00E+00Volatile Organic Chemicals (VOCs)Acetaldehyde 2.53E-01 2.20E-01 2.20E-01 9.2E-01 9.2E-01 9.2E-01 9.2E-01 9.2E-01 9.2E-01 9.2E-01 9.2E-01 9.2E-01Acetone 6.94E-01 6.02E-01 6.02E-01 2.5E+00 2.5E+00 2.5E+00 2.5E+00 2.5E+00 2.5E+00 2.5E+00 2.5E+00 2.5E+00Acrolein and related 9.24E-03 8.01E-03 8.01E-03 3.4E-02 3.4E-02 3.4E-02 3.4E-02 3.4E-02 3.4E-02 3.4E-02 3.4E-02 3.4E-02Aldehydes, other 2.27E-01 1.96E-01 1.96E-01 8.3E-01 8.3E-01 8.3E-01 8.3E-01 8.3E-01 8.3E-01 8.3E-01 8.3E-01 8.3E-01Aliphatic alcohols NV NV NV NV NV NV NV NV NV NV NV NVAlkanes/alkenes, other C1-4 3.83E+00 3.32E+00 3.32E+00 1.4E+01 1.4E+01 1.4E+01 1.4E+01 1.4E+01 1.4E+01 1.4E+01 1.4E+01 1.4E+01Alkanes/alkenes, other C5-8 7.21E-01 6.25E-01 6.25E-01 2.6E+00 2.6E+00 2.6E+00 2.6E+00 2.6E+00 2.6E+00 2.6E+00 2.6E+00 2.6E+00Alkanes/alkenes, other C>8-10 4.03E-02 3.49E-02 3.49E-02 1.5E-01 1.5E-01 1.5E-01 1.5E-01 1.5E-01 1.5E-01 1.5E-01 1.5E-01 1.5E-01Alkanes/alkenes, other C>10-12 3.20E-02 2.78E-02 2.78E-02 1.2E-01 1.2E-01 1.2E-01 1.2E-01 1.2E-01 1.2E-01 1.2E-01 1.2E-01 1.2E-01Alkanes/alkenes, other C>12-16 NV NV NV NV NV NV NV NV NV NV NV NVBenzene and related 1.65E-01 1.43E-01 1.43E-01 6.0E-01 6.0E-01 6.0E-01 6.0E-01 6.0E-01 6.0E-01 6.0E-01 6.0E-01 6.0E-01Butadiene, 1,3- 1.18E-02 1.02E-02 1.02E-02 4.3E-02 4.3E-02 4.3E-02 4.3E-02 4.3E-02 4.3E-02 4.3E-02 4.3E-02 4.3E-02Cycloalkanes and cycloalkenes 6.69E-02 5.80E-02 5.80E-02 2.4E-01 2.4E-01 2.4E-01 2.4E-01 2.4E-01 2.4E-01 2.4E-01 2.4E-01 2.4E-01Ethylbenzene and related 1.27E-01 1.10E-01 1.10E-01 4.6E-01 4.6E-01 4.6E-01 4.6E-01 4.6E-01 4.6E-01 4.6E-01 4.6E-01 4.6E-01Formaldehyde and related 4.07E-01 3.53E-01 3.53E-01 1.5E+00 1.5E+00 1.5E+00 1.5E+00 1.5E+00 1.5E+00 1.5E+00 1.5E+00 1.5E+00Hexane, n- 6.30E-02 5.46E-02 5.46E-02 2.3E-01 2.3E-01 2.3E-01 2.3E-01 2.3E-01 2.3E-01 2.3E-01 2.3E-01 2.3E-01Naphthalene and related 1.05E-02 9.08E-03 9.08E-03 3.8E-02 3.8E-02 3.8E-02 3.8E-02 3.8E-02 3.8E-02 3.8E-02 3.8E-02 3.8E-02Styrene 7.15E-03 6.20E-03 6.20E-03 2.6E-02 2.6E-02 2.6E-02 2.6E-02 2.6E-02 2.6E-02 2.6E-02 2.6E-02 2.6E-02Toluene and related 2.91E-01 2.52E-01 2.52E-01 1.1E+00 1.1E+00 1.1E+00 1.1E+00 1.1E+00 1.1E+00 1.1E+00 1.1E+00 1.1E+00Xylenes 1.44E-01 1.25E-01 1.25E-01 5.2E-01 5.2E-01 5.2E-01 5.2E-01 5.2E-01 5.2E-01 5.2E-01 5.2E-01 5.2E-01Polycyclic Aromatic Hydrocarbons (PAHs)Benzo(a)pyrene TEQ-Equivalents NA NA NA NA NA NA NA NA NA NA NA NANA Not applicable. Exposures to this chemical are not relevant for this exposure assessment scenario. NV No value. Exposures to this chemical could not be predicted due to an absence of appropriate air quality data
Page 3 of 6

Table 5: 2022 Assessment Scenario - TWA - Airport Case
MPOI R1 R2 R3 R4 R5 R6 R7 R8 R9 R10 R111-HOUR EXPOSURESCritieria Air Contaminants (CACs)Carbon monoxide (CO) 8.75E+03 4.64E+03 6.42E+03 2.09E+03 1.21E+03 1.11E+03 8.07E+02 2.38E+03 1.12E+03 9.23E+02 6.22E+02 5.92E+02Nitrogen dioxide (NO2) 3.04E+02 1.65E+02 1.86E+02 1.33E+02 1.49E+02 1.07E+02 1.10E+02 2.15E+02 1.38E+02 8.99E+01 1.02E+02 9.30E+01Coarse Particulate Matter (PM10) NA NA NA NA NA NA NA NA NA NA NA NAFine Particulate Matter (PM2.5) NA NA NA NA NA NA NA NA NA NA NA NASulphur Dioxide (SO2) 4.23E+02 1.63E+02 2.00E+02 1.04E+02 6.74E+01 5.94E+01 2.73E+01 1.38E+02 6.63E+01 4.99E+01 2.93E+01 2.14E+01Volatile Organic Chemicals (VOCs)Acetaldehyde 2.99E+01 1.86E+01 2.06E+01 8.95E+00 6.13E+00 6.20E+00 2.70E+00 1.11E+01 5.27E+00 4.57E+00 3.46E+00 2.25E+00Acetone 2.51E+00 1.56E+00 1.73E+00 7.51E-01 5.14E-01 5.20E-01 2.27E-01 9.31E-01 4.42E-01 3.83E-01 2.90E-01 1.89E-01Acrolein and related 1.96E+01 1.22E+01 1.35E+01 5.86E+00 4.01E+00 4.06E+00 1.77E+00 7.27E+00 3.45E+00 2.99E+00 2.26E+00 1.47E+00Aldehydes, other 2.00E+01 1.24E+01 1.38E+01 5.97E+00 4.08E+00 4.13E+00 1.80E+00 7.40E+00 3.52E+00 3.04E+00 2.30E+00 1.50E+00Aliphatic alcohols 7.19E+01 4.46E+01 4.96E+01 2.15E+01 1.47E+01 1.49E+01 6.49E+00 2.67E+01 1.27E+01 1.10E+01 8.30E+00 5.40E+00Alkanes/alkenes, other C1-4 2.18E+02 1.35E+02 1.51E+02 6.53E+01 4.47E+01 4.52E+01 1.97E+01 8.10E+01 3.84E+01 3.33E+01 2.52E+01 1.64E+01Alkanes/alkenes, other C5-8 4.09E+01 2.53E+01 2.82E+01 1.22E+01 8.37E+00 8.47E+00 3.69E+00 1.52E+01 7.20E+00 6.24E+00 4.72E+00 3.07E+00Alkanes/alkenes, other C>8-10 1.41E+02 8.77E+01 9.75E+01 4.23E+01 2.89E+01 2.93E+01 1.28E+01 5.25E+01 2.49E+01 2.16E+01 1.63E+01 1.06E+01Alkanes/alkenes, other C>10-12 6.39E+00 3.96E+00 4.41E+00 1.91E+00 1.31E+00 1.32E+00 5.77E-01 2.37E+00 1.13E+00 9.75E-01 7.38E-01 4.80E-01Alkanes/alkenes, other C>12-16 1.11E+01 6.89E+00 7.66E+00 3.32E+00 2.27E+00 2.30E+00 1.00E+00 4.12E+00 1.96E+00 1.69E+00 1.28E+00 8.35E-01Benzene and related 1.63E+01 1.01E+01 1.13E+01 4.88E+00 3.34E+00 3.38E+00 1.47E+00 6.05E+00 2.87E+00 2.49E+00 1.88E+00 1.23E+00Butadiene, 1,3- 1.17E+01 7.28E+00 8.10E+00 3.51E+00 2.40E+00 2.43E+00 1.06E+00 4.36E+00 2.07E+00 1.79E+00 1.36E+00 8.82E-01Cycloalkanes and cycloalkenes 1.31E+00 8.12E-01 9.03E-01 3.91E-01 2.68E-01 2.71E-01 1.18E-01 4.86E-01 2.31E-01 2.00E-01 1.51E-01 9.84E-02Ethylbenzene and related 1.24E+01 7.72E+00 8.58E+00 3.72E+00 2.55E+00 2.58E+00 1.12E+00 4.62E+00 2.19E+00 1.90E+00 1.44E+00 9.35E-01Formaldehyde and related 1.10E+02 6.81E+01 7.58E+01 3.29E+01 2.25E+01 2.28E+01 9.92E+00 4.08E+01 1.94E+01 1.68E+01 1.27E+01 8.26E+00Hexane, n- 4.44E-01 2.75E-01 3.06E-01 1.33E-01 9.09E-02 9.20E-02 4.01E-02 1.65E-01 7.82E-02 6.77E-02 5.13E-02 3.34E-02Naphthalene and related 7.38E+00 4.57E+00 5.09E+00 2.21E+00 1.51E+00 1.53E+00 6.66E-01 2.74E+00 1.30E+00 1.13E+00 8.52E-01 5.54E-01Styrene 2.10E+00 1.30E+00 1.45E+00 6.28E-01 4.30E-01 4.35E-01 1.90E-01 7.79E-01 3.70E-01 3.21E-01 2.43E-01 1.58E-01Toluene and related 6.76E+00 4.19E+00 4.67E+00 2.02E+00 1.38E+00 1.40E+00 6.11E-01 2.51E+00 1.19E+00 1.03E+00 7.81E-01 5.08E-01Xylenes 3.85E+00 2.39E+00 2.65E+00 1.15E+00 7.88E-01 7.97E-01 3.47E-01 1.43E+00 6.78E-01 5.87E-01 4.44E-01 2.89E-01Polycyclic Aromatic Hydrocarbons (PAHs)Benzo(a)pyrene TEQ-Equivalents NA NA NA NA NA NA NA NA NA NA NA NANA Not applicable. Exposures to this chemical are not relevant for this exposure assessment scenario. NV No value. Exposures to this chemical could not be predicted due to an absence of appropriate air quality
COC
Page 1 of 6

Table 5: 2022 Assessment Scenario - TWA - Airport Case
MPOI R1 R2 R3 R4 R5 R6 R7 R8 R9 R10 R11COC8-HOUR EXPOSURESCritieria Air Contaminants (CACs)Carbon monoxide (CO) 2.25E+03 1.24E+03 1.34E+03 4.80E+02 2.17E+02 2.13E+02 1.24E+02 4.85E+02 1.69E+02 2.23E+02 8.85E+01 8.03E+01
24-HOUR EXPOSURESCritieria Air Contaminants (CACs)Carbon monoxide (CO) NA NA NA NA NA NA NA NA NA NA NA NANitrogen dioxide (NO2) 4.40E+01 3.33E+01 2.87E+01 1.69E+01 1.13E+01 9.72E+00 1.12E+01 2.98E+01 1.25E+01 9.14E+00 5.95E+00 9.54E+00Coarse Particulate Matter (PM10) 8.63E+00 3.86E+00 4.15E+00 1.42E+00 7.17E-01 4.04E-01 4.40E-01 1.16E+00 6.50E-01 5.68E-01 2.57E-01 3.30E-01Fine Particulate Matter (PM2.5) 8.37E+00 3.32E+00 3.90E+00 1.37E+00 6.98E-01 3.88E-01 4.18E-01 1.10E+00 6.38E-01 5.24E-01 2.43E-01 3.12E-01Sulphur Dioxide (SO2) 3.43E+01 1.73E+01 1.41E+01 1.06E+01 6.30E+00 4.08E+00 1.74E+00 1.10E+01 2.99E+00 3.41E+00 1.92E+00 1.62E+00Volatile Organic Chemicals (VOCs)Acetaldehyde 2.95E+00 1.98E+00 1.51E+00 8.24E-01 5.16E-01 3.75E-01 1.49E-01 8.28E-01 2.34E-01 3.21E-01 1.83E-01 1.64E-01Acetone 2.48E-01 1.66E-01 1.27E-01 6.91E-02 4.33E-02 3.15E-02 1.25E-02 6.95E-02 1.97E-02 2.69E-02 1.54E-02 1.38E-02Acrolein and related 1.93E+00 1.30E+00 9.90E-01 5.40E-01 3.38E-01 2.46E-01 9.78E-02 5.42E-01 1.53E-01 2.10E-01 1.20E-01 1.08E-01Aldehydes, other 1.97E+00 1.32E+00 1.01E+00 5.50E-01 3.44E-01 2.50E-01 9.95E-02 5.52E-01 1.56E-01 2.14E-01 1.22E-01 1.10E-01Aliphatic alcohols 7.09E+00 4.76E+00 3.63E+00 1.98E+00 1.24E+00 9.01E-01 3.59E-01 1.99E+00 5.63E-01 7.71E-01 4.41E-01 3.95E-01Alkanes/alkenes, other C1-4 2.15E+01 1.44E+01 1.10E+01 6.01E+00 3.76E+00 2.73E+00 1.09E+00 6.04E+00 1.71E+00 2.34E+00 1.34E+00 1.20E+00Alkanes/alkenes, other C5-8 4.03E+00 2.70E+00 2.06E+00 1.13E+00 7.05E-01 5.12E-01 2.04E-01 1.13E+00 3.20E-01 4.39E-01 2.51E-01 2.25E-01Alkanes/alkenes, other C>8-10 1.39E+01 9.36E+00 7.14E+00 3.89E+00 2.44E+00 1.77E+00 7.05E-01 3.91E+00 1.11E+00 1.52E+00 8.67E-01 7.77E-01Alkanes/alkenes, other C>10-12 6.30E-01 4.23E-01 3.22E-01 1.76E-01 1.10E-01 8.00E-02 3.18E-02 1.77E-01 5.00E-02 6.85E-02 3.91E-02 3.51E-02Alkanes/alkenes, other C>12-16 1.10E+00 7.35E-01 5.61E-01 3.06E-01 1.92E-01 1.39E-01 5.54E-02 3.07E-01 8.70E-02 1.19E-01 6.81E-02 6.10E-02Benzene and related 1.61E+00 1.08E+00 8.24E-01 4.49E-01 2.81E-01 2.04E-01 8.14E-02 4.51E-01 1.28E-01 1.75E-01 1.00E-01 8.96E-02Butadiene, 1,3- 1.16E+00 7.77E-01 5.93E-01 3.23E-01 2.02E-01 1.47E-01 5.86E-02 3.25E-01 9.19E-02 1.26E-01 7.20E-02 6.45E-02Cycloalkanes and cycloalkenes 1.29E-01 8.66E-02 6.61E-02 3.60E-02 2.26E-02 1.64E-02 6.53E-03 3.62E-02 1.02E-02 1.40E-02 8.02E-03 7.19E-03Ethylbenzene and related 1.23E+00 8.23E-01 6.28E-01 3.43E-01 2.15E-01 1.56E-01 6.21E-02 3.44E-01 9.74E-02 1.34E-01 7.63E-02 6.84E-02Formaldehyde and related 1.08E+01 7.27E+00 5.55E+00 3.03E+00 1.89E+00 1.38E+00 5.48E-01 3.04E+00 8.60E-01 1.18E+00 6.73E-01 6.04E-01Hexane, n- 4.38E-02 2.94E-02 2.24E-02 1.22E-02 7.65E-03 5.56E-03 2.21E-03 1.23E-02 3.47E-03 4.76E-03 2.72E-03 2.44E-03Naphthalene and related 7.27E-01 4.88E-01 3.72E-01 2.03E-01 1.27E-01 9.24E-02 3.68E-02 2.04E-01 5.77E-02 7.92E-02 4.52E-02 4.05E-02Styrene 2.07E-01 1.39E-01 1.06E-01 5.79E-02 3.62E-02 2.63E-02 1.05E-02 5.81E-02 1.64E-02 2.25E-02 1.29E-02 1.15E-02Toluene and related 6.67E-01 4.48E-01 3.42E-01 1.86E-01 1.17E-01 8.48E-02 3.37E-02 1.87E-01 5.30E-02 7.26E-02 4.15E-02 3.72E-02Xylenes 3.79E-01 2.55E-01 1.94E-01 1.06E-01 6.63E-02 4.82E-02 1.92E-02 1.06E-01 3.01E-02 4.13E-02 2.36E-02 2.11E-02Polycyclic Aromatic Hydrocarbons (PAHs)Benzo(a)pyrene TEQ-Equivalents NA NA NA NA NA NA NA NA NA NA NA NANA Not applicable. Exposures to this chemical are not relevant for this exposure assessment scenario. NV No value. Exposures to this chemical could not be predicted due to an absence of appropriate air quality
Page 2 of 6

Table 5: 2022 Assessment Scenario - TWA - Airport Case
MPOI R1 R2 R3 R4 R5 R6 R7 R8 R9 R10 R11COCANNUAL AVERAGE EXPOSURESCritieria Air Contaminants (CACs)Carbon monoxide (CO) 2.43E+01 2.11E+01 1.37E+01 1.48E+01 6.86E+00 3.98E+00 1.23E+00 1.50E+01 3.15E+00 4.02E+00 1.89E+00 1.14E+00Nitrogen dioxide (NO2) 2.26E+00 1.88E+00 1.51E+00 2.45E+00 1.74E+00 1.05E+00 4.30E-01 3.67E+00 8.88E-01 1.02E+00 5.88E-01 3.59E-01Coarse Particulate Matter (PM10) 2.02E-01 1.37E-01 1.02E-01 1.16E-01 5.95E-02 3.48E-02 1.11E-02 1.02E-01 2.55E-02 3.56E-02 1.77E-02 1.03E-02Fine Particulate Matter (PM2.5) 1.82E-01 1.08E-01 8.55E-02 1.07E-01 5.45E-02 3.22E-02 1.04E-02 9.52E-02 2.36E-02 3.26E-02 1.63E-02 9.39E-03Sulphur Dioxide (SO2) 7.69E-01 4.17E-01 3.60E-01 6.18E-01 3.05E-01 1.79E-01 6.22E-02 8.05E-01 1.49E-01 1.72E-01 8.93E-02 5.45E-02Volatile Organic Chemicals (VOCs)Acetaldehyde 6.93E-02 5.61E-02 4.07E-02 5.7E-02 2.6E-02 1.6E-02 5.1E-03 6.6E-02 1.3E-02 1.5E-02 7.5E-03 4.5E-03Acetone 5.81E-03 4.70E-03 3.41E-03 4.8E-03 2.2E-03 1.3E-03 4.3E-04 5.5E-03 1.1E-03 1.3E-03 6.3E-04 3.8E-04Acrolein and related 4.54E-02 3.67E-02 2.66E-02 3.7E-02 1.7E-02 1.0E-02 3.4E-03 4.3E-02 8.5E-03 1.0E-02 4.9E-03 2.9E-03Aldehydes, other 4.62E-02 3.74E-02 2.71E-02 3.8E-02 1.7E-02 1.0E-02 3.4E-03 4.4E-02 8.7E-03 1.0E-02 5.0E-03 3.0E-03Aliphatic alcohols 6.1E-01 5.7E-01 9.77E-02 1.4E-01 6.3E-02 3.7E-02 1.2E-02 1.6E-01 3.1E-02 3.7E-02 1.8E-02 1.1E-02Alkanes/alkenes, other C1-4 5.05E-01 4.09E-01 2.97E-01 4.2E-01 1.9E-01 1.1E-01 3.7E-02 4.8E-01 9.5E-02 1.1E-01 5.5E-02 3.3E-02Alkanes/alkenes, other C5-8 9.46E-02 7.66E-02 5.55E-02 7.8E-02 3.6E-02 2.1E-02 7.0E-03 9.0E-02 1.8E-02 2.1E-02 1.0E-02 6.1E-03Alkanes/alkenes, other C>8-10 3.27E-01 2.65E-01 1.92E-01 2.7E-01 1.2E-01 7.4E-02 2.4E-02 3.1E-01 6.1E-02 7.3E-02 3.5E-02 2.1E-02Alkanes/alkenes, other C>10-12 1.48E-02 1.20E-02 8.68E-03 1.2E-02 5.6E-03 3.3E-03 1.1E-03 1.4E-02 2.8E-03 3.3E-03 1.6E-03 9.6E-04Alkanes/alkenes, other C>12-16 9.4E-02 8.7E-02 1.51E-02 2.1E-02 9.7E-03 5.8E-03 1.9E-03 2.5E-02 4.8E-03 5.7E-03 2.8E-03 1.7E-03Benzene and related 3.77E-02 3.06E-02 2.22E-02 3.1E-02 1.4E-02 8.5E-03 2.8E-03 3.6E-02 7.1E-03 8.4E-03 4.1E-03 2.4E-03Butadiene, 1,3- 2.72E-02 2.20E-02 1.60E-02 2.2E-02 1.0E-02 6.1E-03 2.0E-03 2.6E-02 5.1E-03 6.0E-03 2.9E-03 1.8E-03Cycloalkanes and cycloalkenes 3.03E-03 2.45E-03 1.78E-03 2.5E-03 1.1E-03 6.8E-04 2.2E-04 2.9E-03 5.7E-04 6.7E-04 3.3E-04 2.0E-04Ethylbenzene and related 2.88E-02 2.33E-02 1.69E-02 2.4E-02 1.1E-02 6.5E-03 2.1E-03 2.7E-02 5.4E-03 6.4E-03 3.1E-03 1.9E-03Formaldehyde and related 2.54E-01 2.06E-01 1.49E-01 2.1E-01 9.6E-02 5.7E-02 1.9E-02 2.4E-01 4.8E-02 5.7E-02 2.8E-02 1.6E-02Hexane, n- 1.03E-03 8.32E-04 6.03E-04 8.5E-04 3.9E-04 2.3E-04 7.6E-05 9.8E-04 1.9E-04 2.3E-04 1.1E-04 6.7E-05Naphthalene and related 1.71E-02 1.38E-02 1.00E-02 1.4E-02 6.5E-03 3.8E-03 1.3E-03 1.6E-02 3.2E-03 3.8E-03 1.8E-03 1.1E-03Styrene 4.86E-03 3.94E-03 2.85E-03 4.0E-03 1.8E-03 1.1E-03 3.6E-04 4.6E-03 9.1E-04 1.1E-03 5.3E-04 3.1E-04Toluene and related 1.57E-02 1.27E-02 9.19E-03 1.3E-02 5.9E-03 3.5E-03 1.2E-03 1.5E-02 2.9E-03 3.5E-03 1.7E-03 1.0E-03Xylenes 8.90E-03 7.21E-03 5.23E-03 7.4E-03 3.4E-03 2.0E-03 6.6E-04 8.5E-03 1.7E-03 2.0E-03 9.6E-04 5.8E-04Polycyclic Aromatic Hydrocarbons (PAHs)Benzo(a)pyrene TEQ-Equivalents 2.8E-03 1.9E-03 3.66E-04 4.6E-04 2.3E-04 1.4E-04 4.5E-05 4.1E-04 1.0E-04 1.4E-04 7.0E-05 4.0E-05NA Not applicable. Exposures to this chemical are not relevant for this exposure assessment scenario. NV No value. Exposures to this chemical could not be predicted due to an absence of appropriate air quality
Page 3 of 6

Table 6: 2022 Assessment Scenario - TWA - Cumulative Case
MPOI R1 R2 R3 R4 R5 R6 R7 R8 R9 R111-HOUR EXPOSURESCritieria Air Contaminants (CACs)Carbon monoxide (CO) 1.37E+04 5.94E+03 8.30E+03 7.25E+03 4.91E+03 3.37E+03 4.64E+03 4.17E+03 2.89E+03 3.37E+03 4.63E+03Nitrogen dioxide (NO2) 3.29E+02 1.95E+02 2.14E+02 2.12E+02 1.77E+02 1.81E+02 1.87E+02 2.58E+02 1.83E+02 1.79E+02 1.86E+02Coarse Particulate Matter (PM10) NA NA NA NA NA NA NA NA NA NA NAFine Particulate Matter (PM2.5) NA NA NA NA NA NA NA NA NA NA NASulphur Dioxide (SO2) 1.74E+03 3.11E+02 2.94E+02 3.08E+02 3.04E+02 3.81E+02 2.11E+02 4.36E+02 4.79E+02 4.71E+02 1.30E+02Volatile Organic Chemicals (VOCs)Acetaldehyde 3.65E+01 2.52E+01 2.72E+01 1.55E+01 1.27E+01 1.28E+01 9.30E+00 1.77E+01 1.19E+01 1.12E+01 8.84E+00Acetone 1.54E+01 1.45E+01 1.46E+01 1.37E+01 1.34E+01 1.34E+01 1.31E+01 1.38E+01 1.33E+01 1.33E+01 1.31E+01Acrolein and related 1.99E+01 1.25E+01 1.38E+01 6.18E+00 4.33E+00 4.38E+00 2.09E+00 7.59E+00 3.77E+00 3.31E+00 1.79E+00Aldehydes, other 2.71E+01 1.95E+01 2.09E+01 1.31E+01 1.12E+01 1.12E+01 8.91E+00 1.45E+01 1.06E+01 1.02E+01 8.60E+00Aliphatic alcohols 7.19E+01 4.46E+01 4.96E+01 2.15E+01 1.47E+01 1.49E+01 6.49E+00 2.67E+01 1.27E+01 1.10E+01 5.40E+00Alkanes/alkenes, other C1-4 2.79E+02 1.96E+02 2.11E+02 1.26E+02 1.05E+02 1.06E+02 8.04E+01 1.42E+02 9.91E+01 9.40E+01 7.71E+01Alkanes/alkenes, other C5-8 5.14E+01 3.59E+01 3.88E+01 2.28E+01 1.89E+01 1.90E+01 1.43E+01 2.57E+01 1.78E+01 1.68E+01 1.36E+01Alkanes/alkenes, other C>8-10 1.42E+02 8.87E+01 9.85E+01 4.33E+01 2.99E+01 3.03E+01 1.38E+01 5.34E+01 2.59E+01 2.26E+01 1.16E+01Alkanes/alkenes, other C>10-12 7.00E+00 4.57E+00 5.02E+00 2.52E+00 1.92E+00 1.93E+00 1.19E+00 2.98E+00 1.74E+00 1.59E+00 1.09E+00Alkanes/alkenes, other C>12-16 1.11E+01 6.89E+00 7.66E+00 3.32E+00 2.27E+00 2.30E+00 1.00E+00 4.12E+00 1.96E+00 1.69E+00 8.35E-01Benzene and related 1.84E+01 1.22E+01 1.33E+01 6.93E+00 5.40E+00 5.44E+00 3.53E+00 8.11E+00 4.93E+00 4.55E+00 3.28E+00Butadiene, 1,3- 1.20E+01 7.49E+00 8.31E+00 3.72E+00 2.61E+00 2.64E+00 1.27E+00 4.57E+00 2.28E+00 2.00E+00 1.09E+00Cycloalkanes and cycloalkenes 2.26E+00 1.77E+00 1.86E+00 1.35E+00 1.22E+00 1.23E+00 1.07E+00 1.44E+00 1.19E+00 1.16E+00 1.05E+00Ethylbenzene and related 1.51E+01 1.04E+01 1.12E+01 6.38E+00 5.20E+00 5.23E+00 3.78E+00 7.27E+00 4.85E+00 4.56E+00 3.59E+00Formaldehyde and related 1.19E+02 7.71E+01 8.47E+01 4.18E+01 3.14E+01 3.17E+01 1.88E+01 4.97E+01 2.83E+01 2.57E+01 1.72E+01Hexane, n- 1.30E+00 1.13E+00 1.16E+00 9.86E-01 9.44E-01 9.45E-01 8.93E-01 1.02E+00 9.31E-01 9.21E-01 8.87E-01Naphthalene and related 7.59E+00 4.79E+00 5.30E+00 2.42E+00 1.72E+00 1.74E+00 8.81E-01 2.95E+00 1.51E+00 1.34E+00 7.69E-01Styrene 2.39E+00 1.59E+00 1.74E+00 9.20E-01 7.22E-01 7.27E-01 4.81E-01 1.07E+00 6.62E-01 6.12E-01 4.50E-01Toluene and related 1.30E+01 1.04E+01 1.09E+01 8.26E+00 7.62E+00 7.64E+00 6.85E+00 8.75E+00 7.43E+00 7.27E+00 6.75E+00Xylenes 6.38E+00 4.92E+00 5.19E+00 3.69E+00 3.33E+00 3.33E+00 2.89E+00 3.96E+00 3.22E+00 3.12E+00 2.83E+00Polycyclic Aromatic Hydrocarbons (PAHs)Benzo(a)pyrene TEQ-Equivalents NA NA NA NA NA NA NA NA NA NA NA
COC
NA Not applicable. Exposures to this chemical are not relevant for this exposure assessment scenario. NV No value. Exposures to this chemical could not be predicted due to an absence of appropriate air quality
Page 1 of 6

Table 6: 2022 Assessment Scenario - TWA - Cumulative Case
MPOI R1 R2 R3 R4 R5 R6 R7 R8 R9 R11COC8-HOUR EXPOSURESCritieria Air Contaminants (CACs)Carbon monoxide (CO) 7.61E+03 2.44E+03 2.92E+03 3.94E+03 2.82E+03 1.93E+03 2.98E+03 1.47E+03 1.53E+03 2.59E+03 2.69E+03
24-HOUR EXPOSURESCritieria Air Contaminants (CACs)Carbon monoxide (CO) NA NA NA NA NA NA NA NA NA NA NANitrogen dioxide (NO2) 1.45E+02 5.27E+01 5.28E+01 5.61E+01 4.31E+01 4.18E+01 5.95E+01 7.97E+01 5.10E+01 4.54E+01 5.77E+01Coarse Particulate Matter (PM10) 2.07E+02 1.48E+02 1.67E+02 1.39E+02 1.13E+02 9.31E+01 7.23E+01 1.12E+02 1.14E+02 9.86E+01 7.48E+01Fine Particulate Matter (PM2.5) 1.26E+02 4.49E+01 5.05E+01 4.63E+01 3.59E+01 3.59E+01 3.23E+01 5.28E+01 4.46E+01 3.70E+01 2.86E+01Sulphur Dioxide (SO2) 6.08E+02 3.56E+01 3.54E+01 3.65E+01 3.55E+01 5.72E+01 2.88E+01 6.85E+01 6.73E+01 5.71E+01 1.91E+01Volatile Organic Chemicals (VOCs)Acetaldehyde 5.66E+00 4.69E+00 4.22E+00 3.53E+00 3.22E+00 3.08E+00 2.86E+00 3.54E+00 2.94E+00 3.03E+00 2.87E+00Acetone 5.55E+00 5.47E+00 5.43E+00 5.37E+00 5.34E+00 5.33E+00 5.31E+00 5.37E+00 5.32E+00 5.33E+00 5.31E+00Acrolein and related 2.06E+00 1.43E+00 1.12E+00 6.70E-01 4.68E-01 3.75E-01 2.28E-01 6.72E-01 2.83E-01 3.40E-01 2.37E-01Aldehydes, other 4.89E+00 4.24E+00 3.93E+00 3.47E+00 3.26E+00 3.17E+00 3.02E+00 3.47E+00 3.07E+00 3.13E+00 3.03E+00Aliphatic alcohols 7.09E+00 4.76E+00 3.63E+00 1.98E+00 1.24E+00 9.01E-01 3.59E-01 1.99E+00 5.63E-01 7.71E-01 3.95E-01Alkanes/alkenes, other C1-4 4.64E+01 3.94E+01 3.59E+01 3.09E+01 2.87E+01 2.77E+01 2.60E+01 3.10E+01 2.66E+01 2.73E+01 2.61E+01Alkanes/alkenes, other C5-8 8.37E+00 7.05E+00 6.41E+00 5.47E+00 5.05E+00 4.85E+00 4.55E+00 5.47E+00 4.66E+00 4.78E+00 4.57E+00Alkanes/alkenes, other C>8-10 1.44E+01 9.76E+00 7.54E+00 4.30E+00 2.84E+00 2.17E+00 1.11E+00 4.32E+00 1.51E+00 1.92E+00 1.18E+00Alkanes/alkenes, other C>10-12 8.81E-01 6.74E-01 5.74E-01 4.27E-01 3.61E-01 3.31E-01 2.83E-01 4.28E-01 3.01E-01 3.20E-01 2.86E-01Alkanes/alkenes, other C>12-16 1.10E+00 7.35E-01 5.61E-01 3.06E-01 1.92E-01 1.39E-01 5.54E-02 3.07E-01 8.70E-02 1.19E-01 6.10E-02Benzene and related 2.45E+00 1.92E+00 1.67E+00 1.29E+00 1.13E+00 1.05E+00 9.26E-01 1.30E+00 9.72E-01 1.02E+00 9.34E-01Butadiene, 1,3- 1.24E+00 8.63E-01 6.79E-01 4.10E-01 2.89E-01 2.34E-01 1.45E-01 4.11E-01 1.78E-01 2.12E-01 1.51E-01Cycloalkanes and cycloalkenes 5.21E-01 4.79E-01 4.58E-01 4.28E-01 4.15E-01 4.09E-01 3.99E-01 4.29E-01 4.03E-01 4.06E-01 4.00E-01Ethylbenzene and related 2.32E+00 1.91E+00 1.72E+00 1.43E+00 1.31E+00 1.25E+00 1.15E+00 1.44E+00 1.19E+00 1.22E+00 1.16E+00Formaldehyde and related 1.45E+01 1.09E+01 9.21E+00 6.69E+00 5.56E+00 5.04E+00 4.21E+00 6.71E+00 4.53E+00 4.84E+00 4.27E+00Hexane, n- 3.94E-01 3.80E-01 3.73E-01 3.63E-01 3.58E-01 3.56E-01 3.53E-01 3.63E-01 3.54E-01 3.55E-01 3.53E-01Naphthalene and related 8.16E-01 5.76E-01 4.61E-01 2.91E-01 2.15E-01 1.81E-01 1.25E-01 2.92E-01 1.46E-01 1.67E-01 1.29E-01Styrene 3.27E-01 2.59E-01 2.26E-01 1.78E-01 1.56E-01 1.46E-01 1.30E-01 1.78E-01 1.36E-01 1.42E-01 1.31E-01Toluene and related 3.23E+00 3.01E+00 2.90E+00 2.75E+00 2.68E+00 2.65E+00 2.60E+00 2.75E+00 2.61E+00 2.63E+00 2.60E+00Xylenes 1.42E+00 1.30E+00 1.24E+00 1.15E+00 1.11E+00 1.09E+00 1.06E+00 1.15E+00 1.07E+00 1.08E+00 1.06E+00Polycyclic Aromatic Hydrocarbons (PAHs)Benzo(a)pyrene TEQ-Equivalents NA NA NA NA NA NA NA NA NA NA NANA Not applicable. Exposures to this chemical are not relevant for this exposure assessment scenario. NV No value. Exposures to this chemical could not be predicted due to an absence of appropriate air quality
Page 2 of 6

Table 6: 2022 Assessment Scenario - TWA - Cumulative Case
MPOI R1 R2 R3 R4 R5 R6 R7 R8 R9 R11COCANNUAL AVERAGE EXPOSURESCritieria Air Contaminants (CACs)Carbon monoxide (CO) 2.63E+02 7.53E+01 7.37E+01 4.80E+02 2.87E+02 2.34E+02 3.77E+02 1.93E+02 1.89E+02 2.67E+02 3.61E+02Nitrogen dioxide (NO2) 1.47E+01 4.60E+00 4.54E+00 2.27E+01 1.54E+01 1.34E+01 1.75E+01 1.84E+01 1.43E+01 1.40E+01 1.71E+01Coarse Particulate Matter (PM10) 1.35E+01 8.87E+00 9.53E+00 3.48E+01 2.78E+01 2.21E+01 1.71E+01 2.38E+01 2.29E+01 2.56E+01 1.54E+01Fine Particulate Matter (PM2.5) 8.85E+00 2.66E+00 2.81E+00 1.17E+01 9.02E+00 8.26E+00 7.60E+00 1.04E+01 9.81E+00 9.21E+00 6.19E+00Sulphur Dioxide (SO2) 4.25E+01 1.28E+00 1.22E+00 4.74E+00 4.53E+00 5.76E+00 3.27E+00 7.40E+00 9.18E+00 6.31E+00 2.04E+00Volatile Organic Chemicals (VOCs)Acetaldehyde 3.23E-01 2.76E-01 2.60E-01 9.8E-01 9.5E-01 9.4E-01 9.3E-01 9.9E-01 9.4E-01 9.4E-01 9.3E-01Acetone 7.00E-01 6.07E-01 6.05E-01 2.5E+00 2.5E+00 2.5E+00 2.5E+00 2.5E+00 2.5E+00 2.5E+00 2.5E+00Acrolein and related 5.46E-02 4.47E-02 3.46E-02 7.1E-02 5.1E-02 4.4E-02 3.7E-02 7.7E-02 4.2E-02 4.4E-02 3.7E-02Aldehydes, other 2.73E-01 2.34E-01 2.24E-01 8.6E-01 8.4E-01 8.4E-01 8.3E-01 8.7E-01 8.3E-01 8.4E-01 8.3E-01Aliphatic alcohols 6.1E-01 5.7E-01 9.77E-02 1.4E-01 6.3E-02 3.7E-02 1.2E-02 1.6E-01 3.1E-02 3.7E-02 1.1E-02Alkanes/alkenes, other C1-4 4.34E+00 3.73E+00 3.62E+00 1.4E+01 1.4E+01 1.4E+01 1.4E+01 1.4E+01 1.4E+01 1.4E+01 1.4E+01Alkanes/alkenes, other C5-8 8.16E-01 7.01E-01 6.80E-01 2.7E+00 2.7E+00 2.6E+00 2.6E+00 2.7E+00 2.6E+00 2.6E+00 2.6E+00Alkanes/alkenes, other C>8-10 3.68E-01 3.00E-01 2.27E-01 4.2E-01 2.7E-01 2.2E-01 1.7E-01 4.6E-01 2.1E-01 2.2E-01 1.7E-01Alkanes/alkenes, other C>10-12 4.68E-02 3.97E-02 3.64E-02 1.3E-01 1.2E-01 1.2E-01 1.2E-01 1.3E-01 1.2E-01 1.2E-01 1.2E-01Alkanes/alkenes, other C>12-16 9.4E-02 8.7E-02 1.51E-02 2.1E-02 9.7E-03 5.8E-03 1.9E-03 2.5E-02 4.8E-03 5.7E-03 1.7E-03Benzene and related 2.03E-01 1.74E-01 1.65E-01 6.3E-01 6.2E-01 6.1E-01 6.0E-01 6.4E-01 6.1E-01 6.1E-01 6.0E-01Butadiene, 1,3- 3.89E-02 3.22E-02 2.62E-02 6.5E-02 5.3E-02 4.9E-02 4.5E-02 6.9E-02 4.8E-02 4.9E-02 4.5E-02Cycloalkanes and cycloalkenes 6.99E-02 6.04E-02 5.98E-02 2.5E-01 2.4E-01 2.4E-01 2.4E-01 2.5E-01 2.4E-01 2.4E-01 2.4E-01Ethylbenzene and related 1.55E-01 1.33E-01 1.27E-01 4.8E-01 4.7E-01 4.7E-01 4.6E-01 4.9E-01 4.7E-01 4.7E-01 4.6E-01Formaldehyde and related 6.62E-01 5.59E-01 5.02E-01 1.7E+00 1.6E+00 1.5E+00 1.5E+00 1.7E+00 1.5E+00 1.5E+00 1.5E+00Hexane, n- 6.41E-02 5.55E-02 5.52E-02 2.3E-01 2.3E-01 2.3E-01 2.3E-01 2.3E-01 2.3E-01 2.3E-01 2.3E-01Naphthalene and related 2.75E-02 2.29E-02 1.91E-02 5.2E-02 4.5E-02 4.2E-02 3.9E-02 5.4E-02 4.1E-02 4.2E-02 3.9E-02Styrene 1.20E-02 1.01E-02 9.05E-03 3.0E-02 2.8E-02 2.7E-02 2.6E-02 3.1E-02 2.7E-02 2.7E-02 2.6E-02Toluene and related 3.06E-01 2.65E-01 2.61E-01 1.1E+00 1.1E+00 1.1E+00 1.1E+00 1.1E+00 1.1E+00 1.1E+00 1.1E+00Xylenes 1.53E-01 1.32E-01 1.30E-01 5.3E-01 5.3E-01 5.3E-01 5.3E-01 5.3E-01 5.3E-01 5.3E-01 5.3E-01Polycyclic Aromatic Hydrocarbons (PAHs)Benzo(a)pyrene TEQ-Equivalents NA NA NA NA NA NA NA NA NA NA NANA Not applicable. Exposures to this chemical are not relevant for this exposure assessment scenario. NV No value. Exposures to this chemical could not be predicted due to an absence of appropriate air quality
Page 3 of 6

Table 7: 2032 Assessment Scenario TWA - Background Case
MPOI R1 R2 R3 R4 R5 R6 R7 R8 R9 R10 R111-HOUR EXPOSURESCritieria Air Contaminants (CACs)Carbon monoxide (CO) 1.36E+04 3.82E+03 4.07E+03 7.25E+03 4.90E+03 3.36E+03 4.64E+03 3.77E+03 2.89E+03 3.36E+03 3.42E+03 4.63E+03Nitrogen dioxide (NO2) 3.44E+02 1.90E+02 1.94E+02 2.12E+02 1.77E+02 1.80E+02 1.87E+02 2.58E+02 1.82E+02 1.78E+02 1.78E+02 1.86E+02Coarse Particulate Matter (PM10) NA NA NA NA NA NA NA NA NA NA NA NAFine Particulate Matter (PM2.5) NA NA NA NA NA NA NA NA NA NA NA NASulphur Dioxide (SO2) 1.74E+03 2.84E+02 2.70E+02 3.07E+02 3.03E+02 3.81E+02 2.11E+02 4.36E+02 4.79E+02 4.71E+02 2.19E+02 1.30E+02Volatile Organic Chemicals (VOCs)Acetaldehyde 6.59E+00 6.59E+00 6.59E+00 6.59E+00 6.59E+00 6.59E+00 6.59E+00 6.59E+00 6.59E+00 6.59E+00 6.59E+00 6.59E+00Acetone 1.29E+01 1.29E+01 1.29E+01 1.29E+01 1.29E+01 1.29E+01 1.29E+01 1.29E+01 1.29E+01 1.29E+01 1.29E+01 1.29E+01Acrolein and related 3.16E-01 3.16E-01 3.16E-01 3.16E-01 3.16E-01 3.16E-01 3.16E-01 3.16E-01 3.16E-01 3.16E-01 3.16E-01 3.16E-01Aldehydes, other 7.11E+00 7.11E+00 7.11E+00 7.11E+00 7.11E+00 7.11E+00 7.11E+00 7.11E+00 7.11E+00 7.11E+00 7.11E+00 7.11E+00Aliphatic alcohols NV NV NV NV NV NV NV NV NV NV NV NVAlkanes/alkenes, other C1-4 6.07E+01 6.07E+01 6.07E+01 6.07E+01 6.07E+01 6.07E+01 6.07E+01 6.07E+01 6.07E+01 6.07E+01 6.07E+01 6.07E+01Alkanes/alkenes, other C5-8 1.06E+01 1.06E+01 1.06E+01 1.06E+01 1.06E+01 1.06E+01 1.06E+01 1.06E+01 1.06E+01 1.06E+01 1.06E+01 1.06E+01Alkanes/alkenes, other C>8-10 9.81E-01 9.81E-01 9.81E-01 9.81E-01 9.81E-01 9.81E-01 9.81E-01 9.81E-01 9.81E-01 9.81E-01 9.81E-01 9.81E-01Alkanes/alkenes, other C>10-12 6.12E-01 6.12E-01 6.12E-01 6.12E-01 6.12E-01 6.12E-01 6.12E-01 6.12E-01 6.12E-01 6.12E-01 6.12E-01 6.12E-01Alkanes/alkenes, other C>12-16 NV NV NV NV NV NV NV NV NV NV NV NVBenzene and related 2.06E+00 2.06E+00 2.06E+00 2.06E+00 2.06E+00 2.06E+00 2.06E+00 2.06E+00 2.06E+00 2.06E+00 2.06E+00 2.06E+00Butadiene, 1,3- 2.11E-01 2.11E-01 2.11E-01 2.11E-01 2.11E-01 2.11E-01 2.11E-01 2.11E-01 2.11E-01 2.11E-01 2.11E-01 2.11E-01Cycloalkanes and cycloalkenes 9.55E-01 9.55E-01 9.55E-01 9.55E-01 9.55E-01 9.55E-01 9.55E-01 9.55E-01 9.55E-01 9.55E-01 9.55E-01 9.55E-01Ethylbenzene and related 2.66E+00 2.66E+00 2.66E+00 2.66E+00 2.66E+00 2.66E+00 2.66E+00 2.66E+00 2.66E+00 2.66E+00 2.66E+00 2.66E+00Formaldehyde and related 8.92E+00 8.92E+00 8.92E+00 8.92E+00 8.92E+00 8.92E+00 8.92E+00 8.92E+00 8.92E+00 8.92E+00 8.92E+00 8.92E+00Hexane, n- 8.53E-01 8.53E-01 8.53E-01 8.53E-01 8.53E-01 8.53E-01 8.53E-01 8.53E-01 8.53E-01 8.53E-01 8.53E-01 8.53E-01Naphthalene and related 2.15E-01 2.15E-01 2.15E-01 2.15E-01 2.15E-01 2.15E-01 2.15E-01 2.15E-01 2.15E-01 2.15E-01 2.15E-01 2.15E-01Styrene 2.92E-01 2.92E-01 2.92E-01 2.92E-01 2.92E-01 2.92E-01 2.92E-01 2.92E-01 2.92E-01 2.92E-01 2.92E-01 2.92E-01Toluene and related 6.24E+00 6.24E+00 6.24E+00 6.24E+00 6.24E+00 6.24E+00 6.24E+00 6.24E+00 6.24E+00 6.24E+00 6.24E+00 6.24E+00Xylenes 2.54E+00 2.54E+00 2.54E+00 2.54E+00 2.54E+00 2.54E+00 2.54E+00 2.54E+00 2.54E+00 2.54E+00 2.54E+00 2.54E+00Polycyclic Aromatic Hydrocarbons (PAHs)Benzo(a)pyrene TEQ-Equivalents NA NA NA NA NA NA NA NA NA NA NA NANA Not applicable. Exposures to this chemical are not relevant for this exposure assessment scenario. NV No value. Exposures to this chemical could not be predicted due to an absence of appropriate air quality
COC
Page 1 of 6

Table 7: 2032 Assessment Scenario TWA - Background Case
MPOI R1 R2 R3 R4 R5 R6 R7 R8 R9 R10 R11COC8-HOUR EXPOSURESCritieria Air Contaminants (CACs)Carbon monoxide (CO) 7.61E+03 2.23E+03 2.54E+03 3.93E+03 2.82E+03 1.93E+03 3.06E+03 1.38E+03 1.53E+03 2.59E+03 2.11E+03 3.13E+03
24-HOUR EXPOSURESCritieria Air Contaminants (CACs)Carbon monoxide (CO) NA NA NA NA NA NA NA NA NA NA NA NANitrogen dioxide (NO2) 1.22E+02 4.80E+01 5.00E+01 5.60E+01 4.30E+01 4.20E+01 5.80E+01 7.60E+01 5.00E+01 4.50E+01 4.70E+01 5.80E+01Coarse Particulate Matter (PM10) 2.07E+02 1.45E+02 1.64E+02 1.39E+02 1.12E+02 9.30E+01 7.20E+01 1.12E+02 1.13E+02 9.80E+01 1.01E+02 7.50E+01Fine Particulate Matter (PM2.5) 1.24E+02 4.30E+01 4.80E+01 4.60E+01 3.60E+01 3.60E+01 3.20E+01 5.20E+01 4.40E+01 3.70E+01 3.90E+01 2.80E+01Sulphur Dioxide (SO2) 6.07E+02 2.90E+01 2.80E+01 3.60E+01 3.50E+01 5.70E+01 2.80E+01 6.70E+01 6.70E+01 5.60E+01 2.40E+01 1.90E+01Volatile Organic Chemicals (VOCs)Acetaldehyde 9.22E-01 2.71E+00 2.71E+00 2.71E+00 2.71E+00 2.71E+00 2.71E+00 2.71E+00 2.71E+00 2.71E+00 2.71E+00 2.71E+00Acetone 5.30E+00 5.30E+00 5.30E+00 5.30E+00 5.30E+00 5.30E+00 5.30E+00 5.30E+00 5.30E+00 5.30E+00 5.30E+00 5.30E+00Acrolein and related 1.30E-01 1.30E-01 1.30E-01 1.30E-01 1.30E-01 1.30E-01 1.30E-01 1.30E-01 1.30E-01 1.30E-01 1.30E-01 1.30E-01Aldehydes, other 2.92E+00 2.92E+00 2.92E+00 2.92E+00 2.92E+00 2.92E+00 2.92E+00 2.92E+00 2.92E+00 2.92E+00 2.92E+00 2.92E+00Aliphatic alcohols NV NV NV NV NV NV NV NV NV NV NV NVAlkanes/alkenes, other C1-4 2.49E+01 2.49E+01 2.49E+01 2.49E+01 2.49E+01 2.49E+01 2.49E+01 2.49E+01 2.49E+01 2.49E+01 2.49E+01 2.49E+01Alkanes/alkenes, other C5-8 4.34E+00 4.34E+00 4.34E+00 4.34E+00 4.34E+00 4.34E+00 4.34E+00 4.34E+00 4.34E+00 4.34E+00 4.34E+00 4.34E+00Alkanes/alkenes, other C>8-10 4.03E-01 4.03E-01 4.03E-01 4.03E-01 4.03E-01 4.03E-01 4.03E-01 4.03E-01 4.03E-01 4.03E-01 4.03E-01 4.03E-01Alkanes/alkenes, other C>10-12 2.51E-01 2.51E-01 2.51E-01 2.51E-01 2.51E-01 2.51E-01 2.51E-01 2.51E-01 2.51E-01 2.51E-01 2.51E-01 2.51E-01Alkanes/alkenes, other C>12-16 NV NV NV NV NV NV NV NV NV NV NV NVBenzene and related 8.45E-01 8.45E-01 8.45E-01 8.45E-01 8.45E-01 8.45E-01 8.45E-01 8.45E-01 8.45E-01 8.45E-01 8.45E-01 8.45E-01Butadiene, 1,3- 8.65E-02 8.65E-02 8.65E-02 8.65E-02 8.65E-02 8.65E-02 8.65E-02 8.65E-02 8.65E-02 8.65E-02 8.65E-02 8.65E-02Cycloalkanes and cycloalkenes 3.92E-01 3.92E-01 3.92E-01 3.92E-01 3.92E-01 3.92E-01 3.92E-01 3.92E-01 3.92E-01 3.92E-01 3.92E-01 3.92E-01Ethylbenzene and related 1.09E+00 1.09E+00 1.09E+00 1.09E+00 1.09E+00 1.09E+00 1.09E+00 1.09E+00 1.09E+00 1.09E+00 1.09E+00 1.09E+00Formaldehyde and related 3.67E+00 3.67E+00 3.67E+00 3.67E+00 3.67E+00 3.67E+00 3.67E+00 3.67E+00 3.67E+00 3.67E+00 3.67E+00 3.67E+00Hexane, n- 3.50E-01 3.50E-01 3.50E-01 3.50E-01 3.50E-01 3.50E-01 3.50E-01 3.50E-01 3.50E-01 3.50E-01 3.50E-01 3.50E-01Naphthalene and related 8.81E-02 8.81E-02 8.81E-02 8.81E-02 8.81E-02 8.81E-02 8.81E-02 8.81E-02 8.81E-02 8.81E-02 8.81E-02 8.81E-02Styrene 1.20E-01 1.20E-01 1.20E-01 1.20E-01 1.20E-01 1.20E-01 1.20E-01 1.20E-01 1.20E-01 1.20E-01 1.20E-01 1.20E-01Toluene and related 2.56E+00 2.56E+00 2.56E+00 2.56E+00 2.56E+00 2.56E+00 2.56E+00 2.56E+00 2.56E+00 2.56E+00 2.56E+00 2.56E+00Xylenes 1.04E+00 1.04E+00 1.04E+00 1.04E+00 1.04E+00 1.04E+00 1.04E+00 1.04E+00 1.04E+00 1.04E+00 1.04E+00 1.04E+00Polycyclic Aromatic Hydrocarbons (PAHs)Benzo(a)pyrene TEQ-Equivalents NA NA NA NA NA NA NA NA NA NA NA NANA Not applicable. Exposures to this chemical are not relevant for this exposure assessment scenario. NV No value. Exposures to this chemical could not be predicted due to an absence of appropriate air quality
Page 2 of 6

Table 7: 2032 Assessment Scenario TWA - Background Case
MPOI R1 R2 R3 R4 R5 R6 R7 R8 R9 R10 R11COCANNUAL AVERAGE EXPOSURESCritieria Air Contaminants (CACs)Carbon monoxide (CO) 2.62E+02 5.43E+01 6.00E+01 4.65E+02 2.81E+02 2.31E+02 3.76E+02 1.78E+02 1.86E+02 2.63E+02 2.95E+02 3.60E+02Nitrogen dioxide (NO2) 1.36E+01 3.57E+00 3.57E+00 2.20E+01 1.40E+01 1.30E+01 1.70E+01 1.70E+01 1.40E+01 1.30E+01 1.40E+01 1.70E+01Coarse Particulate Matter (PM10) 1.35E+01 8.81E+00 9.52E+00 3.50E+01 2.80E+01 2.20E+01 1.70E+01 2.40E+01 2.30E+01 2.60E+01 2.40E+01 1.50E+01Fine Particulate Matter (PM2.5) 8.71E+00 2.62E+00 2.62E+00 1.20E+01 9.00E+00 8.00E+00 8.00E+00 1.00E+01 1.00E+01 9.00E+00 9.00E+00 6.00E+00Sulphur Dioxide (SO2) 4.25E+01 8.81E-01 8.57E-01 4.20E+00 4.30E+00 5.60E+00 3.20E+00 6.60E+00 9.00E+00 6.20E+00 2.80E+00 2.00E+00Volatile Organic Chemicals (VOCs)Acetaldehyde 2.53E-01 2.20E-01 2.20E-01 9.2E-01 9.2E-01 9.2E-01 9.2E-01 9.2E-01 9.2E-01 9.2E-01 9.2E-01 9.2E-01Acetone 6.94E-01 6.02E-01 6.02E-01 2.5E+00 2.5E+00 2.5E+00 2.5E+00 2.5E+00 2.5E+00 2.5E+00 2.5E+00 2.5E+00Acrolein and related 9.24E-03 8.01E-03 8.01E-03 3.4E-02 3.4E-02 3.4E-02 3.4E-02 3.4E-02 3.4E-02 3.4E-02 3.4E-02 3.4E-02Aldehydes, other 2.27E-01 1.96E-01 1.96E-01 8.3E-01 8.3E-01 8.3E-01 8.3E-01 8.3E-01 8.3E-01 8.3E-01 8.3E-01 8.3E-01Aliphatic alcohols NV NV NV NV NV NV NV NV NV NV NV NVAlkanes/alkenes, other C1-4 3.83E+00 3.32E+00 3.32E+00 1.4E+01 1.4E+01 1.4E+01 1.4E+01 1.4E+01 1.4E+01 1.4E+01 1.4E+01 1.4E+01Alkanes/alkenes, other C5-8 7.21E-01 6.25E-01 6.25E-01 2.6E+00 2.6E+00 2.6E+00 2.6E+00 2.6E+00 2.6E+00 2.6E+00 2.6E+00 2.6E+00Alkanes/alkenes, other C>8-10 4.03E-02 3.49E-02 3.49E-02 1.5E-01 1.5E-01 1.5E-01 1.5E-01 1.5E-01 1.5E-01 1.5E-01 1.5E-01 1.5E-01Alkanes/alkenes, other C>10-12 3.20E-02 2.78E-02 2.78E-02 1.2E-01 1.2E-01 1.2E-01 1.2E-01 1.2E-01 1.2E-01 1.2E-01 1.2E-01 1.2E-01Alkanes/alkenes, other C>12-16 NV NV NV NV NV NV NV NV NV NV NV NVBenzene and related 1.65E-01 1.43E-01 1.43E-01 6.0E-01 6.0E-01 6.0E-01 6.0E-01 6.0E-01 6.0E-01 6.0E-01 6.0E-01 6.0E-01Butadiene, 1,3- 1.18E-02 1.02E-02 1.02E-02 4.3E-02 4.3E-02 4.3E-02 4.3E-02 4.3E-02 4.3E-02 4.3E-02 4.3E-02 4.3E-02Cycloalkanes and cycloalkenes 6.69E-02 5.80E-02 5.80E-02 2.4E-01 2.4E-01 2.4E-01 2.4E-01 2.4E-01 2.4E-01 2.4E-01 2.4E-01 2.4E-01Ethylbenzene and related 1.27E-01 1.10E-01 1.10E-01 4.6E-01 4.6E-01 4.6E-01 4.6E-01 4.6E-01 4.6E-01 4.6E-01 4.6E-01 4.6E-01Formaldehyde and related 4.07E-01 3.53E-01 3.53E-01 1.5E+00 1.5E+00 1.5E+00 1.5E+00 1.5E+00 1.5E+00 1.5E+00 1.5E+00 1.5E+00Hexane, n- 6.30E-02 5.46E-02 5.46E-02 2.3E-01 2.3E-01 2.3E-01 2.3E-01 2.3E-01 2.3E-01 2.3E-01 2.3E-01 2.3E-01Naphthalene and related 1.05E-02 9.08E-03 9.08E-03 3.8E-02 3.8E-02 3.8E-02 3.8E-02 3.8E-02 3.8E-02 3.8E-02 3.8E-02 3.8E-02Styrene 7.15E-03 6.20E-03 6.20E-03 2.6E-02 2.6E-02 2.6E-02 2.6E-02 2.6E-02 2.6E-02 2.6E-02 2.6E-02 2.6E-02Toluene and related 2.91E-01 2.52E-01 2.52E-01 1.1E+00 1.1E+00 1.1E+00 1.1E+00 1.1E+00 1.1E+00 1.1E+00 1.1E+00 1.1E+00Xylenes 1.44E-01 1.25E-01 1.25E-01 5.2E-01 5.2E-01 5.2E-01 5.2E-01 5.2E-01 5.2E-01 5.2E-01 5.2E-01 5.2E-01Polycyclic Aromatic Hydrocarbons (PAHs)Benzo(a)pyrene TEQ-Equivalents NA NA NA NA NA NA NA NA NA NA NA NANA Not applicable. Exposures to this chemical are not relevant for this exposure assessment scenario. NV No value. Exposures to this chemical could not be predicted due to an absence of appropriate air quality
Page 3 of 6

Table 8: 2032 Assessment Scenario TWA - Airport Case
MPOI R1 R2 R3 R4 R5 R6 R7 R8 R9 R10 R111-HOUR EXPOSURESCritieria Air Contaminants (CACs)Carbon monoxide (CO) 9.44E+03 5.21E+03 7.06E+03 2.82E+03 1.69E+03 1.36E+03 8.40E+02 2.62E+03 1.28E+03 1.41E+03 7.27E+02 7.81E+02Nitrogen dioxide (NO2) 3.42E+02 1.84E+02 1.92E+02 1.42E+02 1.58E+02 9.84E+01 1.21E+02 1.96E+02 1.42E+02 8.65E+01 1.15E+02 1.21E+02Coarse Particulate Matter (PM10) NA NA NA NA NA NA NA NA NA NA NA NAFine Particulate Matter (PM2.5) NA NA NA NA NA NA NA NA NA NA NA NASulphur Dioxide (SO2) 3.95E+02 1.89E+02 2.29E+02 1.47E+02 8.71E+01 7.31E+01 2.99E+01 1.26E+02 7.20E+01 8.94E+01 3.55E+01 2.97E+01Volatile Organic Chemicals (VOCs)Acetaldehyde 3.59E+01 2.06E+01 2.38E+01 1.23E+01 8.21E+00 6.68E+00 2.93E+00 1.35E+01 6.19E+00 7.69E+00 3.18E+00 2.83E+00Acetone 3.02E+00 1.73E+00 2.00E+00 1.03E+00 6.90E-01 5.61E-01 2.46E-01 1.13E+00 5.20E-01 6.46E-01 2.68E-01 2.38E-01Acrolein and related 2.36E+01 1.35E+01 1.56E+01 8.08E+00 5.39E+00 4.38E+00 1.93E+00 8.86E+00 4.06E+00 5.05E+00 2.09E+00 1.86E+00Aldehydes, other 2.40E+01 1.38E+01 1.59E+01 8.21E+00 5.48E+00 4.46E+00 1.96E+00 9.01E+00 4.13E+00 5.13E+00 2.13E+00 1.89E+00Aliphatic alcohols 8.64E+01 4.96E+01 5.73E+01 2.96E+01 1.98E+01 1.61E+01 7.06E+00 3.25E+01 1.49E+01 1.85E+01 7.67E+00 6.82E+00Alkanes/alkenes, other C1-4 2.60E+02 1.49E+02 1.72E+02 8.91E+01 5.95E+01 4.84E+01 2.12E+01 9.78E+01 4.48E+01 5.57E+01 2.31E+01 2.05E+01Alkanes/alkenes, other C5-8 4.74E+01 2.72E+01 3.14E+01 1.63E+01 1.09E+01 8.82E+00 3.87E+00 1.78E+01 8.18E+00 1.02E+01 4.21E+00 3.74E+00Alkanes/alkenes, other C>8-10 1.70E+02 9.76E+01 1.13E+02 5.83E+01 3.89E+01 3.16E+01 1.39E+01 6.39E+01 2.93E+01 3.64E+01 1.51E+01 1.34E+01Alkanes/alkenes, other C>10-12 7.63E+00 4.38E+00 5.05E+00 2.61E+00 1.75E+00 1.42E+00 6.23E-01 2.87E+00 1.32E+00 1.63E+00 6.77E-01 6.02E-01Alkanes/alkenes, other C>12-16 1.33E+01 7.67E+00 8.84E+00 4.58E+00 3.05E+00 2.48E+00 1.09E+00 5.02E+00 2.30E+00 2.86E+00 1.18E+00 1.05E+00Benzene and related 1.92E+01 1.10E+01 1.27E+01 6.58E+00 4.39E+00 3.57E+00 1.57E+00 7.22E+00 3.31E+00 4.11E+00 1.70E+00 1.51E+00Butadiene, 1,3- 1.41E+01 8.08E+00 9.33E+00 4.82E+00 3.22E+00 2.62E+00 1.15E+00 5.30E+00 2.43E+00 3.02E+00 1.25E+00 1.11E+00Cycloalkanes and cycloalkenes 1.30E+00 7.49E-01 8.64E-01 4.47E-01 2.99E-01 2.43E-01 1.07E-01 4.91E-01 2.25E-01 2.79E-01 1.16E-01 1.03E-01Ethylbenzene and related 1.47E+01 8.46E+00 9.76E+00 5.05E+00 3.37E+00 2.74E+00 1.20E+00 5.54E+00 2.54E+00 3.15E+00 1.31E+00 1.16E+00Formaldehyde and related 1.32E+02 7.58E+01 8.74E+01 4.52E+01 3.02E+01 2.45E+01 1.08E+01 4.96E+01 2.27E+01 2.83E+01 1.17E+01 1.04E+01Hexane, n- 4.43E-01 2.54E-01 2.94E-01 1.52E-01 1.01E-01 8.24E-02 3.62E-02 1.67E-01 7.64E-02 9.49E-02 3.93E-02 3.50E-02Naphthalene and related 8.86E+00 5.09E+00 5.87E+00 3.04E+00 2.03E+00 1.65E+00 7.24E-01 3.33E+00 1.53E+00 1.90E+00 7.86E-01 7.00E-01Styrene 2.53E+00 1.45E+00 1.67E+00 8.66E-01 5.78E-01 4.70E-01 2.06E-01 9.50E-01 4.35E-01 5.41E-01 2.24E-01 1.99E-01Toluene and related 7.95E+00 4.56E+00 5.26E+00 2.72E+00 1.82E+00 1.48E+00 6.49E-01 2.99E+00 1.37E+00 1.70E+00 7.05E-01 6.27E-01Xylenes 4.46E+00 2.56E+00 2.95E+00 1.53E+00 1.02E+00 8.30E-01 3.64E-01 1.68E+00 7.69E-01 9.55E-01 3.96E-01 3.52E-01Polycyclic Aromatic Hydrocarbons (PAHs)Benzo(a)pyrene TEQ-Equivalents NA NA NA NA NA NA NA NA NA NA NA NANA Not applicable. Exposures to this chemical are not relevant for this exposure assessment scenario. NV No value. Exposures to this chemical could not be predicted due to an absence of appropriate
COC
Page 1 of 6

Table 8: 2032 Assessment Scenario TWA - Airport Case
MPOI R1 R2 R3 R4 R5 R6 R7 R8 R9 R10 R11COC8-HOUR EXPOSURESCritieria Air Contaminants (CACs)Carbon monoxide (CO) 2.87E+03 1.42E+03 1.81E+03 5.95E+02 2.54E+02 2.26E+02 1.15E+02 6.48E+02 2.09E+02 2.46E+02 1.05E+02 1.08E+02
24-HOUR EXPOSURESCritieria Air Contaminants (CACs)Carbon monoxide (CO) NA NA NA NA NA NA NA NA NA NA NA NANitrogen dioxide (NO2) 4.57E+01 3.10E+01 3.08E+01 1.75E+01 1.43E+01 1.13E+01 9.85E+00 2.96E+01 1.49E+01 9.60E+00 6.70E+00 1.00E+01Coarse Particulate Matter (PM10) 1.13E+01 4.50E+00 6.03E+00 1.91E+00 9.34E-01 4.58E-01 4.43E-01 1.48E+00 8.91E-01 6.54E-01 2.79E-01 3.61E-01Fine Particulate Matter (PM2.5) 1.09E+01 3.75E+00 5.61E+00 1.86E+00 9.12E-01 4.36E-01 4.29E-01 1.40E+00 8.76E-01 6.01E-01 2.62E-01 3.43E-01Sulphur Dioxide (SO2) 4.97E+01 2.00E+01 1.79E+01 1.08E+01 8.39E+00 5.08E+00 1.43E+00 1.33E+01 3.56E+00 4.25E+00 2.01E+00 1.75E+00Volatile Organic Chemicals (VOCs)Acetaldehyde 3.44E+00 2.24E+00 1.88E+00 9.90E-01 7.61E-01 4.54E-01 1.39E-01 1.06E+00 2.93E-01 3.79E-01 1.92E-01 1.56E-01Acetone 2.89E-01 1.88E-01 1.58E-01 8.32E-02 6.40E-02 3.81E-02 1.17E-02 8.89E-02 2.46E-02 3.18E-02 1.61E-02 1.31E-02Acrolein and related 2.26E+00 1.47E+00 1.24E+00 6.50E-01 5.00E-01 2.98E-01 9.11E-02 6.94E-01 1.92E-01 2.49E-01 1.26E-01 1.03E-01Aldehydes, other 2.30E+00 1.50E+00 1.26E+00 6.61E-01 5.08E-01 3.03E-01 9.26E-02 7.06E-01 1.96E-01 2.53E-01 1.28E-01 1.04E-01Aliphatic alcohols 8.28E+00 5.40E+00 4.53E+00 2.38E+00 1.83E+00 1.09E+00 3.34E-01 2.55E+00 7.05E-01 9.12E-01 4.61E-01 3.77E-01Alkanes/alkenes, other C1-4 2.49E+01 1.62E+01 1.36E+01 7.17E+00 5.52E+00 3.29E+00 1.01E+00 7.66E+00 2.12E+00 2.74E+00 1.39E+00 1.13E+00Alkanes/alkenes, other C5-8 4.54E+00 2.96E+00 2.49E+00 1.31E+00 1.01E+00 6.00E-01 1.83E-01 1.40E+00 3.87E-01 5.00E-01 2.53E-01 2.07E-01Alkanes/alkenes, other C>8-10 1.63E+01 1.06E+01 8.92E+00 4.69E+00 3.61E+00 2.15E+00 6.57E-01 5.01E+00 1.39E+00 1.79E+00 9.08E-01 7.41E-01Alkanes/alkenes, other C>10-12 7.31E-01 4.76E-01 4.00E-01 2.10E-01 1.62E-01 9.65E-02 2.95E-02 2.25E-01 6.23E-02 8.05E-02 4.07E-02 3.33E-02Alkanes/alkenes, other C>12-16 1.28E+00 8.33E-01 7.00E-01 3.68E-01 2.83E-01 1.69E-01 5.16E-02 3.93E-01 1.09E-01 1.41E-01 7.13E-02 5.82E-02Benzene and related 1.84E+00 1.20E+00 1.01E+00 5.29E-01 4.07E-01 2.43E-01 7.42E-02 5.66E-01 1.57E-01 2.03E-01 1.02E-01 8.37E-02Butadiene, 1,3- 1.35E+00 8.79E-01 7.38E-01 3.88E-01 2.99E-01 1.78E-01 5.44E-02 4.15E-01 1.15E-01 1.49E-01 7.52E-02 6.14E-02Cycloalkanes and cycloalkenes 1.25E-01 8.15E-02 6.84E-02 3.60E-02 2.77E-02 1.65E-02 5.04E-03 3.84E-02 1.06E-02 1.38E-02 6.97E-03 5.69E-03Ethylbenzene and related 1.41E+00 9.19E-01 7.72E-01 4.06E-01 3.12E-01 1.86E-01 5.69E-02 4.34E-01 1.20E-01 1.55E-01 7.86E-02 6.42E-02Formaldehyde and related 1.26E+01 8.24E+00 6.92E+00 3.64E+00 2.80E+00 1.67E+00 5.10E-01 3.89E+00 1.08E+00 1.39E+00 7.05E-01 5.75E-01Hexane, n- 4.25E-02 2.77E-02 2.32E-02 1.22E-02 9.40E-03 5.60E-03 1.71E-03 1.31E-02 3.62E-03 4.68E-03 2.37E-03 1.93E-03Naphthalene and related 8.49E-01 5.53E-01 4.65E-01 2.45E-01 1.88E-01 1.12E-01 3.43E-02 2.61E-01 7.23E-02 9.36E-02 4.73E-02 3.86E-02Styrene 2.42E-01 1.58E-01 1.32E-01 6.97E-02 5.36E-02 3.19E-02 9.76E-03 7.44E-02 2.06E-02 2.67E-02 1.35E-02 1.10E-02Toluene and related 7.62E-01 4.96E-01 4.17E-01 2.19E-01 1.69E-01 1.00E-01 3.07E-02 2.34E-01 6.49E-02 8.39E-02 4.24E-02 3.46E-02Xylenes 4.27E-01 2.78E-01 2.34E-01 1.23E-01 9.46E-02 5.64E-02 1.72E-02 1.31E-01 3.64E-02 4.71E-02 2.38E-02 1.94E-02Polycyclic Aromatic Hydrocarbons (PAHs)Benzo(a)pyrene TEQ-Equivalents NA NA NA NA NA NA NA NA NA NA NA NANA Not applicable. Exposures to this chemical are not relevant for this exposure assessment scenario. NV No value. Exposures to this chemical could not be predicted due to an absence of appropriate
Page 2 of 6

Table 8: 2032 Assessment Scenario TWA - Airport Case
MPOI R1 R2 R3 R4 R5 R6 R7 R8 R9 R10 R11COCANNUAL AVERAGE EXPOSURESCritieria Air Contaminants (CACs)Carbon monoxide (CO) 2.83E+01 2.46E+01 1.60E+01 1.76E+01 8.07E+00 4.62E+00 1.46E+00 1.81E+01 3.69E+00 4.73E+00 2.24E+00 1.35E+00Nitrogen dioxide (NO2) 2.52E+00 2.08E+00 1.71E+00 2.82E+00 2.01E+00 1.23E+00 4.95E-01 4.15E+00 8.26E-01 1.18E+00 6.78E-01 4.17E-01Coarse Particulate Matter (PM10) 2.37E-01 1.61E-01 1.20E-01 1.38E-01 7.12E-02 4.11E-02 1.35E-02 1.24E-01 3.03E-02 4.23E-02 2.12E-02 1.20E-02Fine Particulate Matter (PM2.5) 1.92E-01 1.26E-01 1.00E-01 1.27E-01 6.51E-02 3.79E-02 1.26E-02 1.15E-01 2.79E-02 3.88E-02 1.95E-02 1.10E-02Sulphur Dioxide (SO2) 9.31E-01 5.06E-01 4.36E-01 7.54E-01 3.70E-01 2.15E-01 7.65E-02 9.85E-01 1.80E-01 2.13E-01 1.09E-01 6.50E-02Volatile Organic Chemicals (VOCs)Acetaldehyde 8.45E-02 6.59E-02 4.81E-02 7.0E-02 3.2E-02 1.8E-02 6.2E-03 8.2E-02 1.6E-02 1.9E-02 9.3E-03 5.4E-03Acetone 7.10E-03 5.53E-03 4.04E-03 5.9E-03 2.7E-03 1.6E-03 5.2E-04 6.9E-03 1.3E-03 1.6E-03 7.8E-04 4.6E-04Acrolein and related 5.55E-02 4.32E-02 3.16E-02 4.6E-02 2.1E-02 1.2E-02 4.1E-03 5.4E-02 1.0E-02 1.2E-02 6.1E-03 3.6E-03Aldehydes, other 5.64E-02 4.40E-02 3.21E-02 4.7E-02 2.1E-02 1.2E-02 4.2E-03 5.5E-02 1.0E-02 1.2E-02 6.2E-03 3.6E-03Aliphatic alcohols 2.03E-01 1.59E-01 1.16E-01 1.7E-01 7.6E-02 4.4E-02 1.5E-02 2.0E-01 3.7E-02 4.5E-02 2.2E-02 1.3E-02Alkanes/alkenes, other C1-4 6.12E-01 4.77E-01 3.49E-01 5.1E-01 2.3E-01 1.3E-01 4.5E-02 5.9E-01 1.1E-01 1.3E-01 6.7E-02 3.9E-02Alkanes/alkenes, other C5-8 1.12E-01 8.70E-02 6.36E-02 9.2E-02 4.2E-02 2.4E-02 8.2E-03 1.1E-01 2.1E-02 2.5E-02 1.2E-02 7.2E-03Alkanes/alkenes, other C>8-10 4.00E-01 3.12E-01 2.28E-01 3.3E-01 1.5E-01 8.7E-02 2.9E-02 3.9E-01 7.4E-02 8.8E-02 4.4E-02 2.6E-02Alkanes/alkenes, other C>10-12 1.80E-02 1.40E-02 1.02E-02 1.5E-02 6.7E-03 3.9E-03 1.3E-03 1.7E-02 3.3E-03 3.9E-03 2.0E-03 1.2E-03Alkanes/alkenes, other C>12-16 3.14E-02 2.45E-02 1.79E-02 2.6E-02 1.2E-02 6.9E-03 2.3E-03 3.0E-02 5.8E-03 6.9E-03 3.5E-03 2.0E-03Benzene and related 4.52E-02 3.52E-02 2.57E-02 3.7E-02 1.7E-02 9.9E-03 3.3E-03 4.4E-02 8.3E-03 9.9E-03 5.0E-03 2.9E-03Butadiene, 1,3- 3.31E-02 2.58E-02 1.89E-02 2.7E-02 1.2E-02 7.2E-03 2.4E-03 3.2E-02 6.1E-03 7.3E-03 3.6E-03 2.1E-03Cycloalkanes and cycloalkenes 3.07E-03 2.39E-03 1.75E-03 2.5E-03 1.2E-03 6.7E-04 2.3E-04 3.0E-03 5.6E-04 6.7E-04 3.4E-04 2.0E-04Ethylbenzene and related 3.47E-02 2.70E-02 1.97E-02 2.9E-02 1.3E-02 7.6E-03 2.6E-03 3.4E-02 6.4E-03 7.6E-03 3.8E-03 2.2E-03Formaldehyde and related 3.11E-01 2.42E-01 1.77E-01 2.6E-01 1.2E-01 6.8E-02 2.3E-02 3.0E-01 5.7E-02 6.8E-02 3.4E-02 2.0E-02Hexane, n- 1.04E-03 8.13E-04 5.94E-04 8.6E-04 3.9E-04 2.3E-04 7.7E-05 1.0E-03 1.9E-04 2.3E-04 1.1E-04 6.7E-05Naphthalene and related 2.09E-02 1.63E-02 1.19E-02 1.7E-02 7.8E-03 4.6E-03 1.5E-03 2.0E-02 3.8E-03 4.6E-03 2.3E-03 1.3E-03Styrene 5.94E-03 4.63E-03 3.39E-03 4.9E-03 2.2E-03 1.3E-03 4.4E-04 5.8E-03 1.1E-03 1.3E-03 6.5E-04 3.8E-04Toluene and related 1.87E-02 1.46E-02 1.07E-02 1.5E-02 7.0E-03 4.1E-03 1.4E-03 1.8E-02 3.4E-03 4.1E-03 2.1E-03 1.2E-03Xylenes 1.05E-02 8.18E-03 5.98E-03 8.7E-03 3.9E-03 2.3E-03 7.7E-04 1.0E-02 1.9E-03 2.3E-03 1.2E-03 6.8E-04Polycyclic Aromatic Hydrocarbons (PAHs)Benzo(a)pyrene TEQ-Equivalents 8.21E-04 5.40E-04 4.30E-04 5.4E-04 2.8E-04 1.6E-04 5.4E-05 4.9E-04 1.2E-04 1.7E-04 8.3E-05 4.7E-05NA Not applicable. Exposures to this chemical are not relevant for this exposure assessment scenario. NV No value. Exposures to this chemical could not be predicted due to an absence of appropriate
Page 3 of 6

Table 9: 2032 Assessment Scenario TWA - Cumulative Case
MPOI R1 R2 R3 R4 R5 R6 R7 R8 R9 R10 R111-HOUR EXPOSURESCritieria Air Contaminants (CACs)Carbon monoxide (CO) 1.37E+04 6.65E+03 8.95E+03 7.25E+03 4.91E+03 3.37E+03 4.64E+03 3.99E+03 2.89E+03 3.37E+03 3.43E+03 4.63E+03Nitrogen dioxide (NO2) 3.65E+02 1.99E+02 2.19E+02 2.12E+02 1.77E+02 1.81E+02 1.87E+02 2.58E+02 1.83E+02 1.79E+02 1.78E+02 1.86E+02Coarse Particulate Matter (PM10) NA NA NA NA NA NA NA NA NA NA NA NAFine Particulate Matter (PM2.5) NA NA NA NA NA NA NA NA NA NA NA NASulphur Dioxide (SO2) 1.74E+03 3.28E+02 3.11E+02 3.08E+02 3.04E+02 3.81E+02 2.11E+02 4.36E+02 4.79E+02 4.71E+02 2.19E+02 1.30E+02Volatile Organic Chemicals (VOCs)Acetaldehyde 4.25E+01 2.72E+01 3.04E+01 1.89E+01 1.48E+01 1.33E+01 9.52E+00 2.01E+01 1.28E+01 1.43E+01 9.78E+00 9.43E+00Acetone 1.59E+01 1.46E+01 1.49E+01 1.39E+01 1.36E+01 1.35E+01 1.31E+01 1.40E+01 1.34E+01 1.35E+01 1.32E+01 1.31E+01Acrolein and related 2.39E+01 1.38E+01 1.59E+01 8.39E+00 5.71E+00 4.70E+00 2.24E+00 9.18E+00 4.38E+00 5.36E+00 2.41E+00 2.18E+00Aldehydes, other 3.11E+01 2.09E+01 2.30E+01 1.53E+01 1.26E+01 1.16E+01 9.06E+00 1.61E+01 1.12E+01 1.22E+01 9.23E+00 9.00E+00Aliphatic alcohols 8.64E+01 4.96E+01 5.73E+01 2.96E+01 1.98E+01 1.61E+01 7.06E+00 3.25E+01 1.49E+01 1.85E+01 7.67E+00 6.82E+00Alkanes/alkenes, other C1-4 3.21E+02 2.10E+02 2.33E+02 1.50E+02 1.20E+02 1.09E+02 8.19E+01 1.58E+02 1.05E+02 1.16E+02 8.37E+01 8.12E+01Alkanes/alkenes, other C5-8 5.80E+01 3.78E+01 4.20E+01 2.68E+01 2.14E+01 1.94E+01 1.44E+01 2.84E+01 1.87E+01 2.07E+01 1.48E+01 1.43E+01Alkanes/alkenes, other C>8-10 1.71E+02 9.86E+01 1.14E+02 5.92E+01 3.99E+01 3.26E+01 1.49E+01 6.49E+01 3.03E+01 3.74E+01 1.61E+01 1.44E+01Alkanes/alkenes, other C>10-12 8.24E+00 4.99E+00 5.67E+00 3.23E+00 2.36E+00 2.03E+00 1.24E+00 3.48E+00 1.93E+00 2.25E+00 1.29E+00 1.21E+00Alkanes/alkenes, other C>12-16 1.33E+01 7.67E+00 8.84E+00 4.58E+00 3.05E+00 2.48E+00 1.09E+00 5.02E+00 2.30E+00 2.86E+00 1.18E+00 1.05E+00Benzene and related 2.12E+01 1.31E+01 1.48E+01 8.63E+00 6.45E+00 5.63E+00 3.62E+00 9.28E+00 5.37E+00 6.17E+00 3.76E+00 3.57E+00Butadiene, 1,3- 1.43E+01 8.29E+00 9.54E+00 5.04E+00 3.43E+00 2.83E+00 1.36E+00 5.51E+00 2.64E+00 3.23E+00 1.46E+00 1.32E+00Cycloalkanes and cycloalkenes 2.26E+00 1.70E+00 1.82E+00 1.40E+00 1.25E+00 1.20E+00 1.06E+00 1.45E+00 1.18E+00 1.23E+00 1.07E+00 1.06E+00Ethylbenzene and related 1.74E+01 1.11E+01 1.24E+01 7.70E+00 6.03E+00 5.40E+00 3.86E+00 8.20E+00 5.20E+00 5.81E+00 3.96E+00 3.82E+00Formaldehyde and related 1.41E+02 8.47E+01 9.63E+01 5.41E+01 3.91E+01 3.35E+01 1.97E+01 5.86E+01 3.17E+01 3.72E+01 2.06E+01 1.93E+01Hexane, n- 1.30E+00 1.11E+00 1.15E+00 1.01E+00 9.55E-01 9.36E-01 8.89E-01 1.02E+00 9.30E-01 9.48E-01 8.92E-01 8.88E-01Naphthalene and related 9.08E+00 5.30E+00 6.09E+00 3.25E+00 2.24E+00 1.86E+00 9.39E-01 3.55E+00 1.74E+00 2.11E+00 1.00E+00 9.14E-01Styrene 2.82E+00 1.74E+00 1.96E+00 1.16E+00 8.70E-01 7.61E-01 4.98E-01 1.24E+00 7.27E-01 8.33E-01 5.16E-01 4.91E-01Toluene and related 1.42E+01 1.08E+01 1.15E+01 8.96E+00 8.06E+00 7.72E+00 6.89E+00 9.23E+00 7.61E+00 7.94E+00 6.94E+00 6.87E+00Xylenes 7.00E+00 5.10E+00 5.49E+00 4.07E+00 3.56E+00 3.37E+00 2.90E+00 4.22E+00 3.31E+00 3.49E+00 2.93E+00 2.89E+00Polycyclic Aromatic Hydrocarbons (PAHs)Benzo(a)pyrene TEQ-Equivalents NA NA NA NA NA NA NA NA NA NA NA NANA Not applicable. Exposures to this chemical are not relevant for this exposure assessment scenario. NV No value. Exposures to this chemical could not be predicted due to an absence of appropriate
COC
Page 1 of 6

Table 9: 2032 Assessment Scenario TWA - Cumulative Case
MPOI R1 R2 R3 R4 R5 R6 R7 R8 R9 R10 R11COC8-HOUR EXPOSURESCritieria Air Contaminants (CACs)Carbon monoxide (CO) 7.61E+03 2.83E+03 3.39E+03 3.94E+03 2.82E+03 1.93E+03 2.98E+03 1.59E+03 1.53E+03 2.59E+03 2.12E+03 2.70E+03
24-HOUR EXPOSURESCritieria Air Contaminants (CACs)Carbon monoxide (CO) NA NA NA NA NA NA NA NA NA NA NA NANitrogen dioxide (NO2) 1.22E+02 5.48E+01 5.37E+01 5.61E+01 4.31E+01 4.18E+01 5.95E+01 8.01E+01 5.12E+01 4.54E+01 4.72E+01 5.77E+01Coarse Particulate Matter (PM10) 2.07E+02 1.49E+02 1.68E+02 1.39E+02 1.13E+02 9.31E+01 7.22E+01 1.12E+02 1.14E+02 9.86E+01 1.01E+02 7.48E+01Fine Particulate Matter (PM2.5) 1.26E+02 4.53E+01 5.06E+01 4.64E+01 3.59E+01 3.59E+01 3.23E+01 5.29E+01 4.46E+01 3.70E+01 3.94E+01 2.86E+01Sulphur Dioxide (SO2) 6.08E+02 3.66E+01 3.56E+01 3.65E+01 3.56E+01 5.72E+01 2.87E+01 6.85E+01 6.73E+01 5.77E+01 2.39E+01 1.91E+01Volatile Organic Chemicals (VOCs)Acetaldehyde 6.15E+00 4.95E+00 4.59E+00 3.70E+00 3.47E+00 3.16E+00 2.85E+00 3.77E+00 3.00E+00 3.09E+00 2.90E+00 2.86E+00Acetone 5.59E+00 5.49E+00 5.46E+00 5.38E+00 5.36E+00 5.34E+00 5.31E+00 5.39E+00 5.32E+00 5.33E+00 5.32E+00 5.31E+00Acrolein and related 2.39E+00 1.60E+00 1.37E+00 7.80E-01 6.30E-01 4.28E-01 2.21E-01 8.24E-01 3.22E-01 3.79E-01 2.56E-01 2.33E-01Aldehydes, other 5.21E+00 4.41E+00 4.18E+00 3.58E+00 3.43E+00 3.22E+00 3.01E+00 3.62E+00 3.11E+00 3.17E+00 3.05E+00 3.02E+00Aliphatic alcohols 8.28E+00 5.40E+00 4.53E+00 2.38E+00 1.83E+00 1.09E+00 3.34E-01 2.55E+00 7.05E-01 9.12E-01 4.61E-01 3.77E-01Alkanes/alkenes, other C1-4 4.98E+01 4.12E+01 3.86E+01 3.21E+01 3.04E+01 2.82E+01 2.59E+01 3.26E+01 2.70E+01 2.77E+01 2.63E+01 2.61E+01Alkanes/alkenes, other C5-8 8.88E+00 7.30E+00 6.83E+00 5.65E+00 5.35E+00 4.94E+00 4.52E+00 5.74E+00 4.73E+00 4.84E+00 4.59E+00 4.55E+00Alkanes/alkenes, other C>8-10 1.67E+01 1.10E+01 9.32E+00 5.09E+00 4.01E+00 2.55E+00 1.06E+00 5.41E+00 1.79E+00 2.20E+00 1.31E+00 1.14E+00Alkanes/alkenes, other C>10-12 9.82E-01 7.28E-01 6.51E-01 4.62E-01 4.13E-01 3.48E-01 2.81E-01 4.76E-01 3.13E-01 3.32E-01 2.92E-01 2.84E-01Alkanes/alkenes, other C>12-16 1.28E+00 8.33E-01 7.00E-01 3.68E-01 2.83E-01 1.69E-01 5.16E-02 3.93E-01 1.09E-01 1.41E-01 7.13E-02 5.82E-02Benzene and related 2.68E+00 2.04E+00 1.85E+00 1.37E+00 1.25E+00 1.09E+00 9.19E-01 1.41E+00 1.00E+00 1.05E+00 9.47E-01 9.28E-01Butadiene, 1,3- 1.44E+00 9.65E-01 8.25E-01 4.75E-01 3.85E-01 2.64E-01 1.41E-01 5.01E-01 2.01E-01 2.35E-01 1.62E-01 1.48E-01Cycloalkanes and cycloalkenes 5.17E-01 4.74E-01 4.61E-01 4.28E-01 4.20E-01 4.09E-01 3.97E-01 4.31E-01 4.03E-01 4.06E-01 3.99E-01 3.98E-01Ethylbenzene and related 2.50E+00 2.01E+00 1.86E+00 1.50E+00 1.40E+00 1.28E+00 1.15E+00 1.53E+00 1.21E+00 1.25E+00 1.17E+00 1.16E+00Formaldehyde and related 1.63E+01 1.19E+01 1.06E+01 7.31E+00 6.46E+00 5.33E+00 4.18E+00 7.55E+00 4.74E+00 5.06E+00 4.37E+00 4.24E+00Hexane, n- 3.93E-01 3.78E-01 3.74E-01 3.63E-01 3.60E-01 3.56E-01 3.52E-01 3.63E-01 3.54E-01 3.55E-01 3.53E-01 3.52E-01Naphthalene and related 9.37E-01 6.42E-01 5.53E-01 3.33E-01 2.76E-01 2.00E-01 1.22E-01 3.49E-01 1.60E-01 1.82E-01 1.35E-01 1.27E-01Styrene 3.62E-01 2.77E-01 2.52E-01 1.89E-01 1.73E-01 1.52E-01 1.30E-01 1.94E-01 1.40E-01 1.46E-01 1.33E-01 1.31E-01Toluene and related 3.32E+00 3.06E+00 2.98E+00 2.78E+00 2.73E+00 2.66E+00 2.59E+00 2.80E+00 2.63E+00 2.65E+00 2.60E+00 2.60E+00Xylenes 1.47E+00 1.32E+00 1.28E+00 1.17E+00 1.14E+00 1.10E+00 1.06E+00 1.17E+00 1.08E+00 1.09E+00 1.07E+00 1.06E+00Polycyclic Aromatic Hydrocarbons (PAHs)Benzo(a)pyrene TEQ-Equivalents NA NA NA NA NA NA NA NA NA NA NA NANA Not applicable. Exposures to this chemical are not relevant for this exposure assessment scenario. NV No value. Exposures to this chemical could not be predicted due to an absence of appropriate
Page 2 of 6

Table 9: 2032 Assessment Scenario TWA - Cumulative Case
MPOI R1 R2 R3 R4 R5 R6 R7 R8 R9 R10 R11COCANNUAL AVERAGE EXPOSURESCritieria Air Contaminants (CACs)Carbon monoxide (CO) 2.63E+02 7.88E+01 7.59E+01 4.82E+02 2.89E+02 2.35E+02 3.78E+02 1.96E+02 1.89E+02 2.67E+02 2.97E+02 3.61E+02Nitrogen dioxide (NO2) 1.46E+01 4.76E+00 4.69E+00 2.29E+01 1.56E+01 1.35E+01 1.75E+01 1.88E+01 1.44E+01 1.41E+01 1.47E+01 1.71E+01Coarse Particulate Matter (PM10) 1.36E+01 8.90E+00 9.55E+00 3.48E+01 2.78E+01 2.21E+01 1.71E+01 2.38E+01 2.29E+01 2.56E+01 2.36E+01 1.54E+01Fine Particulate Matter (PM2.5) 8.85E+00 2.66E+00 2.81E+00 1.17E+01 9.02E+00 8.26E+00 7.60E+00 1.04E+01 9.81E+00 9.21E+00 8.68E+00 6.19E+00Sulphur Dioxide (SO2) 4.25E+01 1.37E+00 1.30E+00 4.86E+00 4.59E+00 5.79E+00 3.28E+00 7.58E+00 9.21E+00 6.34E+00 2.92E+00 2.05E+00Volatile Organic Chemicals (VOCs)Acetaldehyde 3.38E-01 2.85E-01 2.68E-01 9.9E-01 9.5E-01 9.4E-01 9.3E-01 1.0E+00 9.4E-01 9.4E-01 9.3E-01 9.3E-01Acetone 7.02E-01 6.07E-01 6.06E-01 2.5E+00 2.5E+00 2.5E+00 2.5E+00 2.5E+00 2.5E+00 2.5E+00 2.5E+00 2.5E+00Acrolein and related 6.47E-02 5.12E-02 3.96E-02 7.9E-02 5.4E-02 4.6E-02 3.8E-02 8.7E-02 4.4E-02 4.6E-02 4.0E-02 3.7E-02Aldehydes, other 2.83E-01 2.40E-01 2.29E-01 8.7E-01 8.5E-01 8.4E-01 8.3E-01 8.8E-01 8.4E-01 8.4E-01 8.3E-01 8.3E-01Aliphatic alcohols 2.03E-01 1.59E-01 1.16E-01 1.7E-01 7.6E-02 4.4E-02 1.5E-02 2.0E-01 3.7E-02 4.5E-02 2.2E-02 1.3E-02Alkanes/alkenes, other C1-4 4.44E+00 3.80E+00 3.67E+00 1.4E+01 1.4E+01 1.4E+01 1.4E+01 1.5E+01 1.4E+01 1.4E+01 1.4E+01 1.4E+01Alkanes/alkenes, other C5-8 8.33E-01 7.12E-01 6.88E-01 2.7E+00 2.7E+00 2.6E+00 2.6E+00 2.7E+00 2.6E+00 2.6E+00 2.6E+00 2.6E+00Alkanes/alkenes, other C>8-10 4.40E-01 3.47E-01 2.63E-01 4.8E-01 3.0E-01 2.3E-01 1.8E-01 5.3E-01 2.2E-01 2.3E-01 1.9E-01 1.7E-01Alkanes/alkenes, other C>10-12 5.00E-02 4.18E-02 3.80E-02 1.3E-01 1.2E-01 1.2E-01 1.2E-01 1.3E-01 1.2E-01 1.2E-01 1.2E-01 1.2E-01Alkanes/alkenes, other C>12-16 3.14E-02 2.45E-02 1.79E-02 2.6E-02 1.2E-02 6.9E-03 2.3E-03 3.0E-02 5.8E-03 6.9E-03 3.5E-03 2.0E-03Benzene and related 2.10E-01 1.78E-01 1.69E-01 6.4E-01 6.2E-01 6.1E-01 6.0E-01 6.4E-01 6.1E-01 6.1E-01 6.1E-01 6.0E-01Butadiene, 1,3- 4.49E-02 3.60E-02 2.91E-02 7.0E-02 5.5E-02 5.0E-02 4.5E-02 7.5E-02 4.9E-02 5.0E-02 4.7E-02 4.5E-02Cycloalkanes and cycloalkenes 7.00E-02 6.04E-02 5.97E-02 2.5E-01 2.4E-01 2.4E-01 2.4E-01 2.5E-01 2.4E-01 2.4E-01 2.4E-01 2.4E-01Ethylbenzene and related 1.61E-01 1.37E-01 1.30E-01 4.9E-01 4.7E-01 4.7E-01 4.6E-01 4.9E-01 4.7E-01 4.7E-01 4.6E-01 4.6E-01Formaldehyde and related 7.18E-01 5.95E-01 5.30E-01 1.7E+00 1.6E+00 1.6E+00 1.5E+00 1.8E+00 1.5E+00 1.6E+00 1.5E+00 1.5E+00Hexane, n- 6.41E-02 5.54E-02 5.52E-02 2.3E-01 2.3E-01 2.3E-01 2.3E-01 2.3E-01 2.3E-01 2.3E-01 2.3E-01 2.3E-01Naphthalene and related 3.13E-02 2.53E-02 2.10E-02 5.5E-02 4.6E-02 4.3E-02 4.0E-02 5.8E-02 4.2E-02 4.3E-02 4.0E-02 3.9E-02Styrene 1.31E-02 1.08E-02 9.58E-03 3.1E-02 2.8E-02 2.7E-02 2.6E-02 3.2E-02 2.7E-02 2.7E-02 2.7E-02 2.6E-02Toluene and related 3.09E-01 2.67E-01 2.63E-01 1.1E+00 1.1E+00 1.1E+00 1.1E+00 1.1E+00 1.1E+00 1.1E+00 1.1E+00 1.1E+00Xylenes 1.55E-01 1.33E-01 1.31E-01 5.3E-01 5.3E-01 5.3E-01 5.3E-01 5.3E-01 5.3E-01 5.3E-01 5.3E-01 5.3E-01Polycyclic Aromatic Hydrocarbons (PAHs)Benzo(a)pyrene TEQ-Equivalents NA NA NA NA NA NA NA NA NA NA NA NANA Not applicable. Exposures to this chemical are not relevant for this exposure assessment scenario. NV No value. Exposures to this chemical could not be predicted due to an absence of appropriate
Page 3 of 6

Air Quality Study at Toronto Pearson International Airport – Human Health Risk Assessment Report August 2015 Intrinsik Environmental Sciences Inc. – Project 20-21515 Page B-33
E-3.0 RISK CHARACTERIZATION TABLES This section presents the non-cancer risk and carcinogenic risk estimates for each receptor location and year for the Baseline, Airport Alone, and Cumulative Effects cases (Tables 10 through 27).

Table 10: 2011 Assessment Scenario - Non-cancer risk estimates - Background Case
MPOI R1 R2 R3 R4 R5 R6 R7 R8 R9 R10 R111-HOUR EXPOSURESCritieria Air Contaminants (CACs)Carbon monoxide (CO) 3.4E-01 9.3E-02 1.0E-01 1.8E-01 1.2E-01 8.2E-02 1.1E-01 9.3E-02 7.0E-02 8.4E-02 7.8E-02 1.2E-01Nitrogen dioxide (NO2) 1.6E+00 9.0E-01 9.4E-01 9.1E-01 8.7E-01 7.4E-01 8.9E-01 1.2E+00 8.7E-01 8.5E-01 8.1E-01 8.9E-01Coarse Particulate Matter (PM10) - - - - - - - - - - - -Fine Particulate Matter (PM2.5) - - - - - - - - - - - -Sulphur Dioxide (SO2) 8.9E+00 1.3E+00 1.3E+00 1.6E+00 1.5E+00 1.9E+00 1.1E+00 2.1E+00 2.4E+00 2.4E+00 1.1E+00 6.6E-01Volatile Organic Chemicals (VOCs)Acetaldehyde 1.4E-02 1.4E-02 1.4E-02 1.4E-02 1.4E-02 1.4E-02 1.4E-02 1.4E-02 1.4E-02 1.4E-02 1.4E-02 1.4E-02Acetone 5.0E-04 5.0E-04 5.0E-04 5.0E-04 5.0E-04 5.0E-04 5.0E-04 5.0E-04 5.0E-04 5.0E-04 5.0E-04 5.0E-04Acrolein and related 1.3E-01 1.3E-01 1.3E-01 1.3E-01 1.3E-01 1.3E-01 1.3E-01 1.3E-01 1.3E-01 1.3E-01 1.3E-01 1.3E-01Aldehydes, other 3.9E-03 3.9E-03 3.9E-03 3.9E-03 3.9E-03 3.9E-03 3.9E-03 3.9E-03 3.9E-03 3.9E-03 3.9E-03 3.9E-03Aliphatic alcohols - - - - - - - - - - - -Alkanes/alkenes, other C1-4 1.8E-03 1.8E-03 1.8E-03 1.8E-03 1.8E-03 1.8E-03 1.8E-03 1.8E-03 1.8E-03 1.8E-03 1.8E-03 1.8E-03Alkanes/alkenes, other C5-8 5.3E-05 5.3E-05 5.3E-05 5.3E-05 5.3E-05 5.3E-05 5.3E-05 5.3E-05 5.3E-05 5.3E-05 5.3E-05 5.3E-05Alkanes/alkenes, other C>8-10 1.6E-05 1.6E-05 1.6E-05 1.6E-05 1.6E-05 1.6E-05 1.6E-05 1.6E-05 1.6E-05 1.6E-05 1.6E-05 1.6E-05Alkanes/alkenes, other C>10-12 - - - - - - - - - - - -Alkanes/alkenes, other C>12-16 - - - - - - - - - - - -Benzene and related 7.6E-02 7.6E-02 7.6E-02 7.6E-02 7.6E-02 7.6E-02 7.6E-02 7.6E-02 7.6E-02 7.6E-02 7.6E-02 7.6E-02Butadiene, 1,3- 3.2E-04 3.2E-04 3.2E-04 3.2E-04 3.2E-04 3.2E-04 3.2E-04 3.2E-04 3.2E-04 3.2E-04 3.2E-04 3.2E-04Cycloalkanes and cycloalkenes - - - - - - - - - - - -Ethylbenzene and related 3.1E-05 3.1E-05 3.1E-05 3.1E-05 3.1E-05 3.1E-05 3.1E-05 3.1E-05 3.1E-05 3.1E-05 3.1E-05 3.1E-05Formaldehyde and related 1.8E-01 1.8E-01 1.8E-01 1.8E-01 1.8E-01 1.8E-01 1.8E-01 1.8E-01 1.8E-01 1.8E-01 1.8E-01 1.8E-01Hexane, n- - - - - - - - - - - - -Naphthalene and related - - - - - - - - - - - -Styrene 1.4E-05 1.4E-05 1.4E-05 1.4E-05 1.4E-05 1.4E-05 1.4E-05 1.4E-05 1.4E-05 1.4E-05 1.4E-05 1.4E-05Toluene and related 4.2E-04 4.2E-04 4.2E-04 4.2E-04 4.2E-04 4.2E-04 4.2E-04 4.2E-04 4.2E-04 4.2E-04 4.2E-04 4.2E-04Xylenes 3.4E-04 3.4E-04 3.4E-04 3.4E-04 3.4E-04 3.4E-04 3.4E-04 3.4E-04 3.4E-04 3.4E-04 3.4E-04 3.4E-04Polycyclic Aromatic Hydrocarbons (PAHs)Benzo(a)pyrene TEQ-Equivalents - - - - - - - - - - - -
COC
Values highlighted in orange are in excess of the acceptable CR of 1.0.- Indicates that an appropriate exposure limit (TRV) was not available for this chemical.
Page 1 of 3

Table 10: 2011 Assessment Scenario - Non-cancer risk estimates - Background Case
MPOI R1 R2 R3 R4 R5 R6 R7 R8 R9 R10 R11COC8-HOUR EXPOSURESCritieria Air Contaminants (CACs)Carbon monoxide (CO) 1.1E+00 2.9E-01 3.4E-01 6.5E-01 4.7E-01 3.2E-01 4.6E-01 2.3E-01 2.3E-01 4.3E-01 3.5E-01 4.4E-01
24-HOUR EXPOSURESCritieria Air Contaminants (CACs)Carbon monoxide (CO) - - - - - - - - - - - -Nitrogen dioxide (NO2) 5.1E-01 2.0E-01 2.1E-01 2.7E-01 2.1E-01 1.8E-01 2.6E-01 2.8E-01 2.3E-01 2.0E-01 2.3E-01 2.4E-01Coarse Particulate Matter (PM10) 3.9E+00 2.7E+00 3.0E+00 3.0E+00 2.5E+00 1.8E+00 1.4E+00 2.1E+00 2.0E+00 2.2E+00 2.0E+00 1.4E+00Fine Particulate Matter (PM2.5) 5.3E+00 1.5E+00 1.7E+00 1.8E+00 1.4E+00 1.3E+00 1.3E+00 1.6E+00 1.9E+00 1.3E+00 1.3E+00 1.0E+00Sulphur Dioxide (SO2) 2.1E+00 1.1E-01 1.0E-01 9.5E-02 9.8E-02 1.6E-01 9.8E-02 1.5E-01 2.4E-01 1.6E-01 5.8E-02 6.2E-02Volatile Organic Chemicals (VOCs)Acetaldehyde 5.4E-03 5.4E-03 5.4E-03 5.4E-03 5.4E-03 5.4E-03 5.4E-03 5.4E-03 5.4E-03 5.4E-03 5.4E-03 5.4E-03Acetone 4.5E-04 4.5E-04 4.5E-04 4.5E-04 4.5E-04 4.5E-04 4.5E-04 4.5E-04 4.5E-04 4.5E-04 4.5E-04 4.5E-04Acrolein and related 3.2E-01 3.2E-01 3.2E-01 3.2E-01 3.2E-01 3.2E-01 3.2E-01 3.2E-01 3.2E-01 3.2E-01 3.2E-01 3.2E-01Aldehydes, other - - - - - - - - - - - -Aliphatic alcohols - - - - - - - - - - - -Alkanes/alkenes, other C1-4 6.2E-03 6.2E-03 6.2E-03 6.2E-03 6.2E-03 6.2E-03 6.2E-03 6.2E-03 6.2E-03 6.2E-03 6.2E-03 6.2E-03Alkanes/alkenes, other C5-8 1.7E-03 1.7E-03 1.7E-03 1.7E-03 1.7E-03 1.7E-03 1.7E-03 1.7E-03 1.7E-03 1.7E-03 1.7E-03 1.7E-03Alkanes/alkenes, other C>8-10 6.7E-06 6.7E-06 6.7E-06 6.7E-06 6.7E-06 6.7E-06 6.7E-06 6.7E-06 6.7E-06 6.7E-06 6.7E-06 6.7E-06Alkanes/alkenes, other C>10-12 - - - - - - - - - - - -Alkanes/alkenes, other C>12-16 - - - - - - - - - - - -Benzene and related 2.9E-02 2.9E-02 2.9E-02 2.9E-02 2.9E-02 2.9E-02 2.9E-02 2.9E-02 2.9E-02 2.9E-02 2.9E-02 2.9E-02Butadiene, 1,3- 5.8E-03 5.8E-03 5.8E-03 5.8E-03 5.8E-03 5.8E-03 5.8E-03 5.8E-03 5.8E-03 5.8E-03 5.8E-03 5.8E-03Cycloalkanes and cycloalkenes 6.4E-05 6.4E-05 6.4E-05 6.4E-05 6.4E-05 6.4E-05 6.4E-05 6.4E-05 6.4E-05 6.4E-05 6.4E-05 6.4E-05Ethylbenzene and related 1.1E-03 1.1E-03 1.1E-03 1.1E-03 1.1E-03 1.1E-03 1.1E-03 1.1E-03 1.1E-03 1.1E-03 1.1E-03 1.1E-03Formaldehyde and related 5.6E-02 5.6E-02 5.6E-02 5.6E-02 5.6E-02 5.6E-02 5.6E-02 5.6E-02 5.6E-02 5.6E-02 5.6E-02 5.6E-02Hexane, n- 1.4E-04 1.4E-04 1.4E-04 1.4E-04 1.4E-04 1.4E-04 1.4E-04 1.4E-04 1.4E-04 1.4E-04 1.4E-04 1.4E-04Naphthalene and related 3.9E-03 3.9E-03 3.9E-03 3.9E-03 3.9E-03 3.9E-03 3.9E-03 3.9E-03 3.9E-03 3.9E-03 3.9E-03 3.9E-03Styrene 3.0E-04 3.0E-04 3.0E-04 3.0E-04 3.0E-04 3.0E-04 3.0E-04 3.0E-04 3.0E-04 3.0E-04 3.0E-04 3.0E-04Toluene and related 6.7E-04 6.7E-04 6.7E-04 6.7E-04 6.7E-04 6.7E-04 6.7E-04 6.7E-04 6.7E-04 6.7E-04 6.7E-04 6.7E-04Xylenes 1.4E-03 1.4E-03 1.4E-03 1.4E-03 1.4E-03 1.4E-03 1.4E-03 1.4E-03 1.4E-03 1.4E-03 1.4E-03 1.4E-03Polycyclic Aromatic Hydrocarbons (PAHs)Benzo(a)pyrene TEQ-Equivalents - - - - - - - - - - - -Values highlighted in orange are in excess of the acceptable CR of 1.0.- Indicates that an appropriate exposure limit (TRV) was not available for this chemical.
Page 2 of 3

Table 10: 2011 Assessment Scenario - Non-cancer risk estimates - Background Case
MPOI R1 R2 R3 R4 R5 R6 R7 R8 R9 R10 R11COCANNUAL AVERAGE EXPOSURESCritieria Air Contaminants (CACs)Carbon monoxide (CO) - - - - - - - - - - - -Nitrogen dioxide (NO2) 3.5E-01 9.5E-02 9.5E-02 5.8E-01 3.8E-01 3.5E-01 4.5E-01 4.5E-01 3.8E-01 3.5E-01 3.8E-01 4.5E-01Coarse Particulate Matter (PM10) 7.5E-01 4.8E-01 5.1E-01 1.9E+00 1.5E+00 1.2E+00 9.5E-01 1.3E+00 1.2E+00 1.4E+00 1.3E+00 8.5E-01Fine Particulate Matter (PM2.5) 1.1E+00 3.0E-01 3.2E-01 1.5E+00 1.1E+00 1.0E+00 9.3E-01 1.3E+00 1.1E+00 1.1E+00 1.1E+00 7.4E-01Sulphur Dioxide (SO2) 1.3E+00 2.6E-02 2.6E-02 1.3E-01 1.2E-01 1.5E-01 1.0E-01 1.8E-01 2.2E-01 1.8E-01 8.3E-02 6.2E-02Volatile Organic Chemicals (VOCs)Acetaldehyde 1.8E-03 1.6E-03 1.6E-03 6.6E-03 6.6E-03 6.6E-03 6.6E-03 6.6E-03 6.6E-03 6.6E-03 6.6E-03 6.6E-03Acetone 4.3E-05 3.8E-05 3.8E-05 1.6E-04 1.6E-04 1.6E-04 1.6E-04 1.6E-04 1.6E-04 1.6E-04 1.6E-04 1.6E-04Acrolein and related 4.6E-01 4.0E-01 4.0E-01 1.7E+00 1.7E+00 1.7E+00 1.7E+00 1.7E+00 1.7E+00 1.7E+00 1.7E+00 1.7E+00Aldehydes, other 2.8E-02 2.5E-02 2.5E-02 1.0E-01 1.0E-01 1.0E-01 1.0E-01 1.0E-01 1.0E-01 1.0E-01 1.0E-01 1.0E-01Aliphatic alcohols - - - - - - - - - - - -Alkanes/alkenes, other C1-4 1.3E-03 1.1E-03 1.1E-03 4.7E-03 4.7E-03 4.7E-03 4.7E-03 4.7E-03 4.7E-03 4.7E-03 4.7E-03 4.7E-03Alkanes/alkenes, other C5-8 3.9E-05 3.4E-05 3.4E-05 1.4E-04 1.4E-04 1.4E-04 1.4E-04 1.4E-04 1.4E-04 1.4E-04 1.4E-04 1.4E-04Alkanes/alkenes, other C>8-10 4.0E-05 3.5E-05 3.5E-05 1.5E-04 1.5E-04 1.5E-04 1.5E-04 1.5E-04 1.5E-04 1.5E-04 1.5E-04 1.5E-04Alkanes/alkenes, other C>10-12 3.2E-05 2.8E-05 2.8E-05 1.2E-04 1.2E-04 1.2E-04 1.2E-04 1.2E-04 1.2E-04 1.2E-04 1.2E-04 1.2E-04Alkanes/alkenes, other C>12-16 - - - - - - - - - - - -Benzene and related 5.5E-02 4.8E-02 4.8E-02 2.0E-01 2.0E-01 2.0E-01 2.0E-01 2.0E-01 2.0E-01 2.0E-01 2.0E-01 2.0E-01Butadiene, 1,3- 5.9E-03 5.1E-03 5.1E-03 2.1E-02 2.1E-02 2.1E-02 2.1E-02 2.1E-02 2.1E-02 2.1E-02 2.1E-02 2.1E-02Cycloalkanes and cycloalkenes 1.1E-05 9.7E-06 9.7E-06 4.1E-05 4.1E-05 4.1E-05 4.1E-05 4.1E-05 4.1E-05 4.1E-05 4.1E-05 4.1E-05Ethylbenzene and related 4.9E-04 4.2E-04 4.2E-04 1.8E-03 1.8E-03 1.8E-03 1.8E-03 1.8E-03 1.8E-03 1.8E-03 1.8E-03 1.8E-03Formaldehyde and related 4.5E-02 3.9E-02 3.9E-02 1.6E-01 1.6E-01 1.6E-01 1.6E-01 1.6E-01 1.6E-01 1.6E-01 1.6E-01 1.6E-01Hexane, n- 9.4E-05 8.2E-05 8.2E-05 3.4E-04 3.4E-04 3.4E-04 3.4E-04 3.4E-04 3.4E-04 3.4E-04 3.4E-04 3.4E-04Naphthalene and related 2.8E-03 2.5E-03 2.5E-03 1.0E-02 1.0E-02 1.0E-02 1.0E-02 1.0E-02 1.0E-02 1.0E-02 1.0E-02 1.0E-02Styrene 1.5E-05 1.3E-05 1.3E-05 5.5E-05 5.5E-05 5.5E-05 5.5E-05 5.5E-05 5.5E-05 5.5E-05 5.5E-05 5.5E-05Toluene and related 5.8E-05 5.0E-05 5.0E-05 2.1E-04 2.1E-04 2.1E-04 2.1E-04 2.1E-04 2.1E-04 2.1E-04 2.1E-04 2.1E-04Xylenes 1.4E-03 1.2E-03 1.2E-03 5.2E-03 5.2E-03 5.2E-03 5.2E-03 5.2E-03 5.2E-03 5.2E-03 5.2E-03 5.2E-03Polycyclic Aromatic Hydrocarbons (PAHs)Benzo(a)pyrene TEQ-Equivalents - - - - - - - - - - - -Values highlighted in orange are in excess of the acceptable CR of 1.0.- Indicates that an appropriate exposure limit (TRV) was not available for this chemical.
Page 3 of 3

Table 11: 2011 Assessment Scenario - Non-cancer risk estimates - Airport Case
MPOI R1 R2 R3 R4 R5 R6 R7 R8 R9 R10 R111-HOUR EXPOSURESCritieria Air Contaminants (CACs)Carbon monoxide (CO) 1.3E-01 8.6E-02 8.9E-02 5.0E-02 2.7E-02 1.6E-02 1.8E-02 3.9E-02 2.1E-02 2.0E-02 7.6E-03 1.2E-02Nitrogen dioxide (NO2) 2.0E+00 9.3E-01 1.3E+00 7.3E-01 5.7E-01 4.8E-01 4.3E-01 1.0E+00 5.0E-01 4.9E-01 5.0E-01 5.5E-01Coarse Particulate Matter (PM10) - - - - - - - - - - - -Fine Particulate Matter (PM2.5) - - - - - - - - - - - -Sulphur Dioxide (SO2) 8.6E-01 3.8E-01 4.7E-01 4.6E-01 1.6E-01 1.7E-01 7.4E-02 3.4E-01 8.7E-02 1.5E-01 8.2E-02 8.4E-02Volatile Organic Chemicals (VOCs)Acetaldehyde 2.3E-02 1.4E-02 1.5E-02 1.2E-02 5.9E-03 4.5E-03 3.2E-03 1.1E-02 3.3E-03 4.5E-03 2.2E-03 2.2E-03Acetone 3.4E-05 2.1E-05 2.2E-05 1.7E-05 8.7E-06 6.6E-06 4.8E-06 1.6E-05 4.9E-06 6.6E-06 3.3E-06 3.2E-06Acrolein and related 2.8E+00 1.7E+00 1.8E+00 1.4E+00 7.1E-01 5.4E-01 3.9E-01 1.3E+00 3.9E-01 5.3E-01 2.7E-01 2.6E-01Aldehydes, other 4.1E-03 2.5E-03 2.5E-03 2.0E-03 1.0E-03 7.8E-04 5.6E-04 1.9E-03 5.7E-04 7.7E-04 3.9E-04 3.7E-04Aliphatic alcohols 2.0E-03 1.2E-03 1.2E-03 9.9E-04 5.0E-04 3.8E-04 2.7E-04 9.3E-04 2.8E-04 3.8E-04 1.9E-04 1.8E-04Alkanes/alkenes, other C1-4 3.0E-03 1.8E-03 1.9E-03 1.5E-03 7.6E-04 5.8E-04 4.2E-04 1.4E-03 4.2E-04 5.8E-04 2.9E-04 2.8E-04Alkanes/alkenes, other C5-8 1.5E-04 9.4E-05 9.6E-05 7.7E-05 3.9E-05 3.0E-05 2.1E-05 7.3E-05 2.2E-05 2.9E-05 1.5E-05 1.4E-05Alkanes/alkenes, other C>8-10 8.5E-04 5.2E-04 5.3E-04 4.3E-04 2.1E-04 1.6E-04 1.2E-04 4.0E-04 1.2E-04 1.6E-04 8.0E-05 7.8E-05Alkanes/alkenes, other C>10-12 - - - - - - - - - - - -Alkanes/alkenes, other C>12-16 - - - - - - - - - - - -Benzene and related 3.0E-01 1.8E-01 1.9E-01 1.5E-01 7.6E-02 5.8E-02 4.2E-02 1.4E-01 4.3E-02 5.8E-02 2.9E-02 2.8E-02Butadiene, 1,3- 6.5E-03 4.0E-03 4.1E-03 3.3E-03 1.6E-03 1.3E-03 9.0E-04 3.1E-03 9.2E-04 1.2E-03 6.2E-04 6.0E-04Cycloalkanes and cycloalkenes - - - - - - - - - - - -Ethylbenzene and related 7.6E-05 4.6E-05 4.8E-05 3.8E-05 1.9E-05 1.5E-05 1.1E-05 3.6E-05 1.1E-05 1.5E-05 7.2E-06 7.0E-06Formaldehyde and related 8.0E-01 4.9E-01 5.0E-01 4.0E-01 2.0E-01 1.5E-01 1.1E-01 3.8E-01 1.1E-01 1.5E-01 7.6E-02 7.4E-02Hexane, n- - - - - - - - - - - - -Naphthalene and related - - - - - - - - - - - -Styrene 3.6E-05 2.2E-05 2.2E-05 1.8E-05 9.0E-06 6.9E-06 4.9E-06 1.7E-05 5.0E-06 6.8E-06 3.4E-06 3.3E-06Toluene and related 2.8E-04 1.7E-04 1.7E-04 1.4E-04 7.0E-05 5.3E-05 3.8E-05 1.3E-04 3.9E-05 5.3E-05 2.6E-05 2.6E-05Xylenes 3.9E-04 2.4E-04 2.4E-04 2.0E-04 9.9E-05 7.5E-05 5.4E-05 1.8E-04 5.5E-05 7.4E-05 3.7E-05 3.6E-05Polycyclic Aromatic Hydrocarbons (PAHs)Benzo(a)pyrene TEQ-Equivalents - - - - - - - - - - - -
COC
Values highlighted in orange are in excess of the acceptable CR of 1.0.- Indicates that an appropriate exposure limit (TRV) was not available for this chemical.
Page 1 of 3

Table 11: 2011 Assessment Scenario - Non-cancer risk estimates - Airport Case
MPOI R1 R2 R3 R4 R5 R6 R7 R8 R9 R10 R11COC8-HOUR EXPOSURESCritieria Air Contaminants (CACs)Carbon monoxide (CO) 3.1E-01 1.9E-01 1.5E-01 5.2E-02 2.9E-02 2.7E-02 1.5E-02 3.5E-02 2.6E-02 3.0E-02 1.1E-02 1.0E-02
24-HOUR EXPOSURESCritieria Air Contaminants (CACs)Carbon monoxide (CO) - - - - - - - - - - - -Nitrogen dioxide (NO2) 1.8E-01 1.8E-01 1.5E-01 6.3E-02 4.8E-02 3.2E-02 4.0E-02 1.1E-01 4.7E-02 3.7E-02 2.2E-02 2.7E-02Coarse Particulate Matter (PM10) 1.0E-01 4.7E-02 3.8E-02 1.4E-02 1.1E-02 6.2E-03 4.6E-03 1.0E-02 6.7E-03 7.2E-03 2.4E-03 4.6E-03Fine Particulate Matter (PM2.5) 1.7E-01 7.8E-02 6.6E-02 2.6E-02 2.1E-02 1.1E-02 8.1E-03 1.7E-02 1.2E-02 1.3E-02 4.1E-03 8.0E-03Sulphur Dioxide (SO2) 6.0E-02 3.4E-02 4.4E-02 1.5E-02 1.1E-02 7.4E-03 2.8E-03 1.6E-02 4.0E-03 6.3E-03 3.7E-03 2.7E-03Volatile Organic Chemicals (VOCs)Acetaldehyde 2.6E-03 1.9E-03 1.8E-03 5.9E-04 5.0E-04 3.1E-04 1.3E-04 4.5E-04 2.3E-04 2.6E-04 1.5E-04 1.7E-04Acetone 8.8E-06 6.4E-06 6.0E-06 2.0E-06 1.7E-06 1.1E-06 4.4E-07 1.5E-06 8.0E-07 8.7E-07 5.1E-07 5.8E-07Acrolein and related 2.0E+00 1.5E+00 1.4E+00 4.7E-01 4.0E-01 2.5E-01 1.0E-01 3.6E-01 1.9E-01 2.0E-01 1.2E-01 1.3E-01Aldehydes, other - - - - - - - - - - - -Aliphatic alcohols 7.5E-04 5.4E-04 5.1E-04 1.7E-04 1.5E-04 9.1E-05 3.7E-05 1.3E-04 6.8E-05 7.4E-05 4.3E-05 4.9E-05Alkanes/alkenes, other C1-4 3.0E-03 2.2E-03 2.0E-03 6.8E-04 5.8E-04 3.6E-04 1.5E-04 5.2E-04 2.7E-04 3.0E-04 1.7E-04 2.0E-04Alkanes/alkenes, other C5-8 1.4E-03 1.0E-03 9.8E-04 3.3E-04 2.8E-04 1.7E-04 7.1E-05 2.5E-04 1.3E-04 1.4E-04 8.2E-05 9.4E-05Alkanes/alkenes, other C>8-10 9.9E-05 7.2E-05 6.8E-05 2.3E-05 1.9E-05 1.2E-05 4.9E-06 1.7E-05 9.0E-06 9.8E-06 5.7E-06 6.5E-06Alkanes/alkenes, other C>10-12 - - - - - - - - - - - -Alkanes/alkenes, other C>12-16 - - - - - - - - - - - -Benzene and related 3.3E-02 2.4E-02 2.2E-02 7.5E-03 6.4E-03 4.0E-03 1.6E-03 5.7E-03 3.0E-03 3.3E-03 1.9E-03 2.1E-03Butadiene, 1,3- 3.3E-02 2.4E-02 2.3E-02 7.6E-03 6.5E-03 4.0E-03 1.7E-03 5.8E-03 3.0E-03 3.3E-03 1.9E-03 2.2E-03Cycloalkanes and cycloalkenes 5.6E-05 4.0E-05 3.8E-05 1.3E-05 1.1E-05 6.8E-06 2.8E-06 9.7E-06 5.1E-06 5.5E-06 3.2E-06 3.7E-06Ethylbenzene and related 7.6E-04 5.5E-04 5.2E-04 1.7E-04 1.5E-04 9.3E-05 3.8E-05 1.3E-04 6.9E-05 7.6E-05 4.4E-05 5.0E-05Formaldehyde and related 7.2E-02 5.2E-02 4.9E-02 1.6E-02 1.4E-02 8.7E-03 3.6E-03 1.3E-02 6.5E-03 7.1E-03 4.1E-03 4.7E-03Hexane, n- 4.6E-05 3.3E-05 3.2E-05 1.1E-05 9.0E-06 5.6E-06 2.3E-06 8.1E-06 4.2E-06 4.6E-06 2.7E-06 3.0E-06Naphthalene and related 1.4E-02 9.9E-03 9.3E-03 3.1E-03 2.7E-03 1.7E-03 6.8E-04 2.4E-03 1.2E-03 1.4E-03 7.8E-04 8.9E-04Styrene 2.2E-04 1.6E-04 1.5E-04 5.0E-05 4.3E-05 2.6E-05 1.1E-05 3.8E-05 2.0E-05 2.2E-05 1.3E-05 1.4E-05Toluene and related 1.3E-04 9.3E-05 8.8E-05 2.9E-05 2.5E-05 1.6E-05 6.4E-06 2.2E-05 1.2E-05 1.3E-05 7.4E-06 8.4E-06Xylenes 4.6E-04 3.3E-04 3.2E-04 1.1E-04 9.0E-05 5.6E-05 2.3E-05 8.0E-05 4.2E-05 4.6E-05 2.6E-05 3.0E-05Polycyclic Aromatic Hydrocarbons (PAHs)Benzo(a)pyrene TEQ-Equivalents - - - - - - - - - - - -Values highlighted in orange are in excess of the acceptable CR of 1.0.- Indicates that an appropriate exposure limit (TRV) was not available for this chemical.
Page 2 of 3

Table 11: 2011 Assessment Scenario - Non-cancer risk estimates - Airport Case
MPOI R1 R2 R3 R4 R5 R6 R7 R8 R9 R10 R11COCANNUAL AVERAGE EXPOSURESCritieria Air Contaminants (CACs)Carbon monoxide (CO) - - - - - - - - - - - -Nitrogen dioxide (NO2) 5.4E-02 4.7E-02 3.7E-02 4.8E-02 3.0E-02 2.1E-02 8.9E-03 6.7E-02 1.3E-02 1.9E-02 1.2E-02 7.5E-03Coarse Particulate Matter (PM10) 7.1E-03 5.5E-03 4.0E-03 4.3E-03 2.2E-03 1.3E-03 4.0E-04 3.2E-03 6.8E-04 1.4E-03 7.2E-04 4.3E-04Fine Particulate Matter (PM2.5) 1.4E-02 1.0E-02 7.8E-03 9.0E-03 4.7E-03 2.7E-03 8.3E-04 6.7E-03 1.4E-03 2.9E-03 1.5E-03 9.1E-04Sulphur Dioxide (SO2) 1.3E-02 9.0E-03 8.1E-03 1.1E-02 5.0E-03 3.3E-03 1.4E-03 1.3E-02 1.9E-03 3.2E-03 2.0E-03 1.3E-03Volatile Organic Chemicals (VOCs)Acetaldehyde 3.3E-04 2.9E-04 2.0E-04 2.0E-04 9.5E-05 5.5E-05 2.2E-05 1.7E-04 3.4E-05 5.9E-05 3.3E-05 2.1E-05Acetone 2.4E-07 2.1E-07 1.4E-07 1.5E-07 6.8E-08 3.9E-08 1.6E-08 1.2E-07 2.4E-08 4.2E-08 2.4E-08 1.5E-08Acrolein and related 1.5E+00 1.3E+00 9.0E-01 9.1E-01 4.2E-01 2.4E-01 9.8E-02 7.6E-01 1.5E-01 2.6E-01 1.5E-01 9.6E-02Aldehydes, other 3.9E-03 3.4E-03 2.3E-03 2.4E-03 1.1E-03 6.3E-04 2.6E-04 2.0E-03 4.0E-04 6.8E-04 3.9E-04 2.5E-04Aliphatic alcohols 2.7E-05 2.4E-05 1.6E-05 1.7E-05 7.7E-06 4.5E-06 1.8E-06 1.4E-05 2.8E-06 4.8E-06 2.7E-06 1.7E-06Alkanes/alkenes, other C1-4 1.4E-04 1.3E-04 8.7E-05 8.9E-05 4.1E-05 2.4E-05 9.6E-06 7.4E-05 1.5E-05 2.5E-05 1.4E-05 9.3E-06Alkanes/alkenes, other C5-8 7.1E-06 6.1E-06 4.3E-06 4.3E-06 2.0E-06 1.2E-06 4.7E-07 3.6E-06 7.2E-07 1.2E-06 7.1E-07 4.6E-07Alkanes/alkenes, other C>8-10 2.2E-04 1.9E-04 1.3E-04 1.3E-04 6.1E-05 3.5E-05 1.4E-05 1.1E-04 2.2E-05 3.8E-05 2.1E-05 1.4E-05Alkanes/alkenes, other C>10-12 1.1E-05 9.9E-06 6.9E-06 7.0E-06 3.3E-06 1.9E-06 7.6E-07 5.9E-06 1.2E-06 2.0E-06 1.1E-06 7.4E-07Alkanes/alkenes, other C>12-16 1.7E-05 1.5E-05 1.0E-05 1.0E-05 4.8E-06 2.8E-06 1.1E-06 8.6E-06 1.7E-06 3.0E-06 1.7E-06 1.1E-06Benzene and related 1.2E-02 1.0E-02 7.0E-03 7.1E-03 3.3E-03 1.9E-03 7.6E-04 5.9E-03 1.2E-03 2.0E-03 1.1E-03 7.4E-04Butadiene, 1,3- 9.1E-03 7.9E-03 5.5E-03 5.6E-03 2.6E-03 1.5E-03 6.0E-04 4.7E-03 9.3E-04 1.6E-03 9.1E-04 5.9E-04Cycloalkanes and cycloalkenes 2.1E-06 1.8E-06 1.2E-06 1.3E-06 5.9E-07 3.4E-07 1.4E-07 1.1E-06 2.1E-07 3.6E-07 2.1E-07 1.3E-07Ethylbenzene and related 1.1E-04 9.2E-05 6.4E-05 6.5E-05 3.0E-05 1.8E-05 7.1E-06 5.5E-05 1.1E-05 1.9E-05 1.1E-05 6.9E-06Formaldehyde and related 1.9E-02 1.6E-02 1.1E-02 1.2E-02 5.4E-03 3.1E-03 1.3E-03 9.7E-03 1.9E-03 3.3E-03 1.9E-03 1.2E-03Hexane, n- 6.3E-06 5.4E-06 3.8E-06 3.8E-06 1.8E-06 1.0E-06 4.1E-07 3.2E-06 6.4E-07 1.1E-06 6.2E-07 4.0E-07Naphthalene and related 3.0E-03 2.6E-03 1.8E-03 1.8E-03 8.6E-04 4.9E-04 2.0E-04 1.5E-03 3.1E-04 5.3E-04 3.0E-04 1.9E-04Styrene 6.8E-06 5.9E-06 4.1E-06 4.1E-06 1.9E-06 1.1E-06 4.5E-07 3.5E-06 6.9E-07 1.2E-06 6.7E-07 4.4E-07Toluene and related 3.5E-06 3.1E-06 2.1E-06 2.2E-06 1.0E-06 5.8E-07 2.3E-07 1.8E-06 3.6E-07 6.2E-07 3.5E-07 2.3E-07Xylenes 1.2E-04 1.1E-04 7.4E-05 7.5E-05 3.5E-05 2.0E-05 8.1E-06 6.2E-05 1.2E-05 2.1E-05 1.2E-05 7.9E-06Polycyclic Aromatic Hydrocarbons (PAHs)Benzo(a)pyrene TEQ-Equivalents - - - - - - - - - - - -Values highlighted in orange are in excess of the acceptable CR of 1.0.- Indicates that an appropriate exposure limit (TRV) was not available for this chemical.
Page 3 of 3

Table 12: 2011 Assessment Scenario - Non-cancer risk estimates - Cumulative Case
MPOI R1 R2 R3 R4 R5 R6 R7 R8 R9 R10 R11
Carbon monoxide (CO) 3.4E-01 1.3E-01 1.4E-01 1.8E-01 1.2E-01 8.4E-02 1.1E-01 9.3E-02 7.0E-02 8.4E-02 7.8E-02 1.2E-01Nitrogen dioxide (NO2) 2.3E+00 9.4E-01 1.3E+00 9.1E-01 8.7E-01 7.4E-01 8.9E-01 1.2E+00 8.7E-01 8.5E-01 8.2E-01 9.0E-01Coarse Particulate Matter (PM10) - - - - - - - - - - - -Fine Particulate Matter (PM2.5) - - - - - - - - - - - -Sulphur Dioxide (SO2) 8.9E+00 1.4E+00 1.3E+00 1.6E+00 1.5E+00 1.9E+00 1.1E+00 2.1E+00 2.4E+00 2.4E+00 1.1E+00 6.6E-01Volatile Organic Chemicals (VOCs)Acetaldehyde 3.7E-02 2.8E-02 2.9E-02 2.6E-02 2.0E-02 1.9E-02 1.7E-02 2.5E-02 1.7E-02 1.9E-02 1.6E-02 1.6E-02Acetone 5.3E-04 5.2E-04 5.2E-04 5.1E-04 5.0E-04 5.0E-04 5.0E-04 5.1E-04 5.0E-04 5.0E-04 5.0E-04 5.0E-04Acrolein and related 2.9E+00 1.8E+00 1.9E+00 1.5E+00 8.4E-01 6.7E-01 5.1E-01 1.5E+00 5.2E-01 6.6E-01 3.9E-01 3.8E-01Aldehydes, other 8.0E-03 6.4E-03 6.5E-03 6.0E-03 5.0E-03 4.7E-03 4.5E-03 5.9E-03 4.5E-03 4.7E-03 4.3E-03 4.3E-03Aliphatic alcohols 2.0E-03 1.2E-03 1.2E-03 9.9E-04 5.0E-04 3.8E-04 2.7E-04 9.3E-04 2.8E-04 3.8E-04 1.9E-04 1.8E-04Alkanes/alkenes, other C1-4 4.8E-03 3.6E-03 3.7E-03 3.3E-03 2.5E-03 2.4E-03 2.2E-03 3.2E-03 2.2E-03 2.4E-03 2.1E-03 2.1E-03Alkanes/alkenes, other C5-8 2.1E-04 1.5E-04 1.5E-04 1.3E-04 9.2E-05 8.2E-05 7.4E-05 1.3E-04 7.4E-05 8.2E-05 6.7E-05 6.7E-05Alkanes/alkenes, other C>8-10 8.6E-04 5.3E-04 5.5E-04 4.4E-04 2.3E-04 1.8E-04 1.3E-04 4.2E-04 1.4E-04 1.8E-04 9.7E-05 9.4E-05Alkanes/alkenes, other C>10-12 - - - - - - - - - - - -Alkanes/alkenes, other C>12-16 - - - - - - - - - - - -Benzene and related 3.8E-01 2.6E-01 2.6E-01 2.3E-01 1.5E-01 1.3E-01 1.2E-01 2.2E-01 1.2E-01 1.3E-01 1.0E-01 1.0E-01Butadiene, 1,3- 6.8E-03 4.3E-03 4.4E-03 3.6E-03 2.0E-03 1.6E-03 1.2E-03 3.4E-03 1.2E-03 1.6E-03 9.4E-04 9.2E-04Cycloalkanes and cycloalkenes - - - - - - - - - - - -Ethylbenzene and related 1.1E-04 7.7E-05 7.9E-05 6.9E-05 5.0E-05 4.6E-05 4.1E-05 6.7E-05 4.2E-05 4.5E-05 3.8E-05 3.8E-05Formaldehyde and related 9.8E-01 6.7E-01 6.8E-01 5.8E-01 3.8E-01 3.3E-01 2.9E-01 5.6E-01 2.9E-01 3.3E-01 2.5E-01 2.5E-01Hexane, n- - - - - - - - - - - - -Naphthalene and related - - - - - - - - - - - -Styrene 5.0E-05 3.6E-05 3.6E-05 3.2E-05 2.3E-05 2.1E-05 1.9E-05 3.1E-05 1.9E-05 2.1E-05 1.7E-05 1.7E-05Toluene and related 6.9E-04 5.9E-04 5.9E-04 5.6E-04 4.9E-04 4.7E-04 4.5E-04 5.5E-04 4.5E-04 4.7E-04 4.4E-04 4.4E-04Xylenes 7.3E-04 5.8E-04 5.9E-04 5.4E-04 4.4E-04 4.2E-04 4.0E-04 5.3E-04 4.0E-04 4.2E-04 3.8E-04 3.8E-04
Benzo(a)pyrene TEQ-Equivalents - - - - - - - - - - - -
COC
Polycyclic Aromatic Hydrocarbons (PAHs)
Critieria Air Contaminants (CACs)1-HOUR EXPOSURES
Values highlighted in orange are in excess of the acceptable CR of 1.0.- Indicates that an appropriate exposure limit (TRV) was not available for this chemical.
Page 1 of 3

Table 12: 2011 Assessment Scenario - Non-cancer risk estimates - Cumulative Case
MPOI R1 R2 R3 R4 R5 R6 R7 R8 R9 R10 R11COC
Carbon monoxide (CO) 1.1E+00 3.5E-01 3.4E-01 6.6E-01 4.7E-01 3.2E-01 4.6E-01 2.3E-01 2.3E-01 4.3E-01 3.5E-01 4.4E-01
Carbon monoxide (CO) - - - - - - - - - - - -Nitrogen dioxide (NO2) 5.2E-01 2.6E-01 2.7E-01 2.7E-01 2.0E-01 1.8E-01 2.6E-01 2.8E-01 2.3E-01 2.0E-01 2.2E-01 2.3E-01Coarse Particulate Matter (PM10) 3.9E+00 2.7E+00 3.0E+00 3.0E+00 2.5E+00 1.8E+00 1.4E+00 2.1E+00 2.0E+00 2.2E+00 2.0E+00 1.4E+00Fine Particulate Matter (PM2.5) 5.3E+00 1.5E+00 1.7E+00 1.8E+00 1.4E+00 1.2E+00 1.3E+00 1.6E+00 1.8E+00 1.3E+00 1.3E+00 1.0E+00Sulphur Dioxide (SO2) 2.1E+00 1.3E-01 1.2E-01 9.8E-02 9.7E-02 1.6E-01 9.9E-02 1.5E-01 2.4E-01 1.6E-01 6.0E-02 6.0E-02
Acetaldehyde 8.0E-03 7.3E-03 7.2E-03 6.0E-03 5.9E-03 5.7E-03 5.5E-03 5.9E-03 5.6E-03 5.7E-03 5.6E-03 5.6E-03Acetone 4.5E-04 4.5E-04 4.5E-04 4.5E-04 4.5E-04 4.5E-04 4.5E-04 4.5E-04 4.5E-04 4.5E-04 4.5E-04 4.5E-04Acrolein and related 2.4E+00 1.8E+00 1.7E+00 7.9E-01 7.2E-01 5.7E-01 4.3E-01 6.8E-01 5.1E-01 5.3E-01 4.4E-01 4.6E-01Aldehydes, other - - - - - - - - - - - -Aliphatic alcohols 7.5E-04 5.4E-04 5.1E-04 1.7E-04 1.5E-04 9.1E-05 3.7E-05 1.3E-04 6.8E-05 7.4E-05 4.3E-05 4.9E-05Alkanes/alkenes, other C1-4 9.2E-03 8.4E-03 8.3E-03 6.9E-03 6.8E-03 6.6E-03 6.4E-03 6.8E-03 6.5E-03 6.5E-03 6.4E-03 6.4E-03Alkanes/alkenes, other C5-8 3.2E-03 2.8E-03 2.7E-03 2.1E-03 2.0E-03 1.9E-03 1.8E-03 2.0E-03 1.9E-03 1.9E-03 1.8E-03 1.8E-03Alkanes/alkenes, other C>8-10 1.1E-04 7.8E-05 7.5E-05 2.9E-05 2.6E-05 1.9E-05 1.2E-05 2.4E-05 1.6E-05 1.7E-05 1.2E-05 1.3E-05Alkanes/alkenes, other C>10-12 - - - - - - - - - - - -Alkanes/alkenes, other C>12-16 - - - - - - - - - - - -Benzene and related 6.2E-02 5.3E-02 5.2E-02 3.7E-02 3.6E-02 3.3E-02 3.1E-02 3.5E-02 3.2E-02 3.2E-02 3.1E-02 3.1E-02Butadiene, 1,3- 3.9E-02 3.0E-02 2.9E-02 1.3E-02 1.2E-02 9.8E-03 7.4E-03 1.2E-02 8.8E-03 9.1E-03 7.7E-03 8.0E-03Cycloalkanes and cycloalkenes 1.2E-04 1.0E-04 1.0E-04 7.7E-05 7.5E-05 7.1E-05 6.7E-05 7.4E-05 6.9E-05 7.0E-05 6.8E-05 6.8E-05Ethylbenzene and related 1.9E-03 1.6E-03 1.6E-03 1.3E-03 1.2E-03 1.2E-03 1.1E-03 1.2E-03 1.2E-03 1.2E-03 1.1E-03 1.1E-03Formaldehyde and related 1.3E-01 1.1E-01 1.1E-01 7.3E-02 7.0E-02 6.5E-02 6.0E-02 6.9E-02 6.3E-02 6.4E-02 6.1E-02 6.1E-02Hexane, n- 1.9E-04 1.7E-04 1.7E-04 1.5E-04 1.5E-04 1.5E-04 1.4E-04 1.5E-04 1.4E-04 1.4E-04 1.4E-04 1.4E-04Naphthalene and related 1.8E-02 1.4E-02 1.3E-02 7.0E-03 6.6E-03 5.6E-03 4.6E-03 6.3E-03 5.2E-03 5.3E-03 4.7E-03 4.8E-03Styrene 5.2E-04 4.6E-04 4.5E-04 3.5E-04 3.4E-04 3.3E-04 3.1E-04 3.4E-04 3.2E-04 3.2E-04 3.1E-04 3.1E-04Toluene and related 8.0E-04 7.7E-04 7.6E-04 7.0E-04 7.0E-04 6.9E-04 6.8E-04 7.0E-04 6.9E-04 6.9E-04 6.8E-04 6.8E-04Xylenes 1.9E-03 1.8E-03 1.7E-03 1.5E-03 1.5E-03 1.5E-03 1.5E-03 1.5E-03 1.5E-03 1.5E-03 1.5E-03 1.5E-03
Benzo(a)pyrene TEQ-Equivalents - - - - - - - - - - - -
Critieria Air Contaminants (CACs)
Volatile Organic Chemicals (VOCs)
Polycyclic Aromatic Hydrocarbons (PAHs)
24-HOUR EXPOSURES
Critieria Air Contaminants (CACs)8-HOUR EXPOSURES
Values highlighted in orange are in excess of the acceptable CR of 1.0.- Indicates that an appropriate exposure limit (TRV) was not available for this chemical.
Page 2 of 3

Table 12: 2011 Assessment Scenario - Non-cancer risk estimates - Cumulative Case
MPOI R1 R2 R3 R4 R5 R6 R7 R8 R9 R10 R11COC
Carbon monoxide (CO) - - - - - - - - - - - -Nitrogen dioxide (NO2) 3.6E-01 1.2E-01 1.2E-01 6.0E-01 4.0E-01 3.5E-01 4.6E-01 4.8E-01 3.7E-01 3.7E-01 3.9E-01 1.2E-01Coarse Particulate Matter (PM10) 7.5E-01 4.8E-01 5.2E-01 1.9E+00 1.5E+00 1.2E+00 9.3E-01 1.3E+00 1.2E+00 1.4E+00 1.3E+00 2.3E-01Fine Particulate Matter (PM2.5) 1.1E+00 3.2E-01 3.4E-01 1.4E+00 1.1E+00 1.0E+00 9.3E-01 1.2E+00 1.1E+00 1.1E+00 1.1E+00 2.0E-01Sulphur Dioxide (SO2) 1.3E+00 3.5E-02 3.5E-02 1.4E-01 1.3E-01 1.5E-01 1.0E-01 1.9E-01 2.2E-01 1.9E-01 8.3E-02 1.8E-02
Acetaldehyde 2.1E-03 1.9E-03 1.8E-03 6.8E-03 6.7E-03 6.6E-03 6.6E-03 6.8E-03 6.6E-03 6.6E-03 6.6E-03 1.8E-03Acetone 4.4E-05 3.8E-05 3.8E-05 1.6E-04 1.6E-04 1.6E-04 1.6E-04 1.6E-04 1.6E-04 1.6E-04 1.6E-04 4.3E-05Acrolein and related 1.9E+00 1.7E+00 1.3E+00 2.6E+00 2.1E+00 1.9E+00 1.8E+00 2.4E+00 1.8E+00 1.9E+00 1.8E+00 4.9E-01Aldehydes, other 3.2E-02 2.8E-02 2.7E-02 1.1E-01 1.0E-01 1.0E-01 1.0E-01 1.1E-01 1.0E-01 1.0E-01 1.0E-01 2.8E-02Aliphatic alcohols 2.7E-05 2.4E-05 1.6E-05 1.7E-05 7.7E-06 4.5E-06 1.8E-06 1.4E-05 2.8E-06 4.8E-06 2.7E-06 4.8E-07Alkanes/alkenes, other C1-4 1.4E-03 1.2E-03 1.2E-03 4.7E-03 4.7E-03 4.7E-03 4.7E-03 4.7E-03 4.7E-03 4.7E-03 4.7E-03 1.3E-03Alkanes/alkenes, other C5-8 4.6E-05 4.0E-05 3.8E-05 1.5E-04 1.4E-04 1.4E-04 1.4E-04 1.5E-04 1.4E-04 1.4E-04 1.4E-04 3.9E-05Alkanes/alkenes, other C>8-10 2.6E-04 2.2E-04 1.7E-04 2.8E-04 2.1E-04 1.8E-04 1.6E-04 2.6E-04 1.7E-04 1.8E-04 1.7E-04 4.4E-05Alkanes/alkenes, other C>10-12 4.3E-05 3.8E-05 3.5E-05 1.2E-04 1.2E-04 1.2E-04 1.2E-04 1.2E-04 1.2E-04 1.2E-04 1.2E-04 3.2E-05Alkanes/alkenes, other C>12-16 1.7E-05 1.5E-05 1.0E-05 1.0E-05 4.8E-06 2.8E-06 1.1E-06 8.6E-06 1.7E-06 3.0E-06 1.7E-06 3.0E-07Benzene and related 6.7E-02 5.8E-02 5.5E-02 2.1E-01 2.0E-01 2.0E-01 2.0E-01 2.1E-01 2.0E-01 2.0E-01 2.0E-01 5.5E-02Butadiene, 1,3- 1.5E-02 1.3E-02 1.1E-02 2.7E-02 2.4E-02 2.3E-02 2.2E-02 2.6E-02 2.2E-02 2.3E-02 2.2E-02 6.0E-03Cycloalkanes and cycloalkenes 1.3E-05 1.1E-05 1.1E-05 4.2E-05 4.1E-05 4.1E-05 4.1E-05 4.2E-05 4.1E-05 4.1E-05 4.1E-05 1.1E-05Ethylbenzene and related 5.9E-04 5.1E-04 4.9E-04 1.8E-03 1.8E-03 1.8E-03 1.8E-03 1.8E-03 1.8E-03 1.8E-03 1.8E-03 4.9E-04Formaldehyde and related 6.4E-02 5.6E-02 5.1E-02 1.8E-01 1.7E-01 1.7E-01 1.7E-01 1.7E-01 1.7E-01 1.7E-01 1.7E-01 4.6E-02Hexane, n- 1.0E-04 8.7E-05 8.5E-05 3.5E-04 3.4E-04 3.4E-04 3.4E-04 3.5E-04 3.4E-04 3.4E-04 3.4E-04 9.4E-05Naphthalene and related 5.8E-03 5.1E-03 4.3E-03 1.2E-02 1.1E-02 1.1E-02 1.1E-02 1.2E-02 1.1E-02 1.1E-02 1.1E-02 2.9E-03Styrene 2.2E-05 1.9E-05 1.7E-05 6.0E-05 5.7E-05 5.6E-05 5.6E-05 5.9E-05 5.6E-05 5.7E-05 5.6E-05 1.5E-05Toluene and related 6.2E-05 5.3E-05 5.3E-05 2.1E-04 2.1E-04 2.1E-04 2.1E-04 2.1E-04 2.1E-04 2.1E-04 2.1E-04 5.8E-05Xylenes 1.6E-03 1.4E-03 1.3E-03 5.3E-03 5.3E-03 5.3E-03 5.3E-03 5.3E-03 5.3E-03 5.3E-03 5.3E-03 1.4E-03
Benzo(a)pyrene TEQ-Equivalents - - - - - - - - - - - -
ANNUAL AVERAGE EXPOSURES
Values highlighted in orange are in excess of the acceptable CR of 1.0.- Indicates that an appropriate exposure limit (TRV) was not available for this chemical.
Critieria Air Contaminants (CACs)
Volatile Organic Chemicals (VOCs)
Polycyclic Aromatic Hydrocarbons (PAHs)
Page 3 of 3

Table 13: 2011 Assessment Scenario - Cancer risk estimates - Background Case
MPOI R1 R2 R3 R4 R5 R6 R7 R8 R9 R10 R111-HOUR EXPOSURESCritieria Air Contaminants (CACs)Carbon monoxide (CO) - - - - - - - - - - - -Nitrogen dioxide (NO2) - - - - - - - - - - - -Coarse Particulate Matter (PM10) - - - - - - - - - - - -Fine Particulate Matter (PM2.5) - - - - - - - - - - - -Sulphur Dioxide (SO2) - - - - - - - - - - - -Volatile Organic Chemicals (VOCs)Acetaldehyde - - - - - - - - - - - -Acetone - - - - - - - - - - - -Acrolein and related - - - - - - - - - - - -Aldehydes, other - - - - - - - - - - - -Aliphatic alcohols - - - - - - - - - - - -Alkanes/alkenes, other C1-4 - - - - - - - - - - - -Alkanes/alkenes, other C5-8 - - - - - - - - - - - -Alkanes/alkenes, other C>8-10 - - - - - - - - - - - -Alkanes/alkenes, other C>10-12 - - - - - - - - - - - -Alkanes/alkenes, other C>12-16 - - - - - - - - - - - -Benzene and related - - - - - - - - - - - -Butadiene, 1,3- - - - - - - - - - - - -Cycloalkanes and cycloalkenes - - - - - - - - - - - -Ethylbenzene and related - - - - - - - - - - - -Formaldehyde and related - - - - - - - - - - - -Hexane, n- - - - - - - - - - - - -Naphthalene and related - - - - - - - - - - - -Styrene - - - - - - - - - - - -Toluene and related - - - - - - - - - - - -Xylenes - - - - - - - - - - - -Polycyclic Aromatic Hydrocarbons (PAHs)Benzo(a)pyrene TEQ-Equivalents - - - - - - - - - - - -
COC
Values highlighted in orange are in excess of the acceptable CR of 1.0.- Indicates that an appropriate exposure limit (TRV) was not available for this chemical.
Page 1 of 3

Table 13: 2011 Assessment Scenario - Cancer risk estimates - Background Case
MPOI R1 R2 R3 R4 R5 R6 R7 R8 R9 R10 R11COC8-HOUR EXPOSURESCritieria Air Contaminants (CACs)Carbon monoxide (CO) - - - - - - - - - - - -
24-HOUR EXPOSURESCritieria Air Contaminants (CACs)Carbon monoxide (CO) - - - - - - - - - - - -Nitrogen dioxide (NO2) - - - - - - - - - - - -Coarse Particulate Matter (PM10) - - - - - - - - - - - -Fine Particulate Matter (PM2.5) - - - - - - - - - - - -Sulphur Dioxide (SO2) - - - - - - - - - - - -Volatile Organic Chemicals (VOCs)Acetaldehyde - - - - - - - - - - - -Acetone - - - - - - - - - - - -Acrolein and related - - - - - - - - - - - -Aldehydes, other - - - - - - - - - - - -Aliphatic alcohols - - - - - - - - - - - -Alkanes/alkenes, other C1-4 - - - - - - - - - - - -Alkanes/alkenes, other C5-8 - - - - - - - - - - - -Alkanes/alkenes, other C>8-10 - - - - - - - - - - - -Alkanes/alkenes, other C>10-12 - - - - - - - - - - - -Alkanes/alkenes, other C>12-16 - - - - - - - - - - - -Benzene and related - - - - - - - - - - - -Butadiene, 1,3- - - - - - - - - - - - -Cycloalkanes and cycloalkenes - - - - - - - - - - - -Ethylbenzene and related - - - - - - - - - - - -Formaldehyde and related - - - - - - - - - - - -Hexane, n- - - - - - - - - - - - -Naphthalene and related - - - - - - - - - - - -Styrene - - - - - - - - - - - -Toluene and related - - - - - - - - - - - -Xylenes - - - - - - - - - - - -Polycyclic Aromatic Hydrocarbons (PAHs)Benzo(a)pyrene TEQ-Equivalents - - - - - - - - - - - -Values highlighted in orange are in excess of the acceptable CR of 1.0.- Indicates that an appropriate exposure limit (TRV) was not available for this chemical.
Page 2 of 3

Table 13: 2011 Assessment Scenario - Cancer risk estimates - Background Case
MPOI R1 R2 R3 R4 R5 R6 R7 R8 R9 R10 R11COCANNUAL AVERAGE EXPOSURESCritieria Air Contaminants (CACs)Carbon monoxide (CO) - - - - - - - - - - - -Nitrogen dioxide (NO2) - - - - - - - - - - - -Coarse Particulate Matter (PM10) - - - - - - - - - - - -Fine Particulate Matter (PM2.5) - - - - - - - - - - - -Sulphur Dioxide (SO2) - - - - - - - - - - - -Volatile Organic Chemicals (VOCs)Acetaldehyde 3.0E-07 2.6E-07 2.6E-07 2.5E-06 2.5E-06 2.5E-06 2.5E-06 2.5E-06 2.5E-06 2.5E-06 2.5E-06 2.5E-06Acetone - - - - - - - - - - - -Acrolein and related - - - - - - - - - - - -Aldehydes, other - - - - - - - - - - - -Aliphatic alcohols - - - - - - - - - - - -Alkanes/alkenes, other C1-4 - - - - - - - - - - - -Alkanes/alkenes, other C5-8 - - - - - - - - - - - -Alkanes/alkenes, other C>8-10 - - - - - - - - - - - -Alkanes/alkenes, other C>10-12 - - - - - - - - - - - -Alkanes/alkenes, other C>12-16 - - - - - - - - - - - -Benzene and related 2.1E-06 1.8E-06 1.8E-06 1.7E-05 1.7E-05 1.7E-05 1.7E-05 1.7E-05 1.7E-05 1.7E-05 1.7E-05 1.7E-05Butadiene, 1,3- 2.6E-09 2.2E-09 2.2E-09 2.1E-08 2.1E-08 2.1E-08 2.1E-08 2.1E-08 2.1E-08 2.1E-08 2.1E-08 2.1E-08Cycloalkanes and cycloalkenes - - - - - - - - - - - -Ethylbenzene and related - - - - - - - - - - - -Formaldehyde and related 1.1E-06 9.3E-07 9.3E-07 8.9E-06 8.9E-06 8.9E-06 8.9E-06 8.9E-06 8.9E-06 8.9E-06 8.9E-06 8.9E-06Hexane, n- - - - - - - - - - - - -Naphthalene and related - - - - - - - - - - - -Styrene - - - - - - - - - - - -Toluene and related - - - - - - - - - - - -Xylenes - - - - - - - - - - - -Polycyclic Aromatic Hydrocarbons (PAHs)Benzo(a)pyrene TEQ-Equivalents - - - - - - - - - - - -Values highlighted in orange are in excess of the acceptable CR of 1.0.- Indicates that an appropriate exposure limit (TRV) was not available for this chemical.
Page 3 of 3

Table 14: 2011 Assessment Scenario - Cancer risk estimates - Airport Case
MPOI R1 R2 R3 R4 R5 R6 R7 R8 R9 R10 R111-HOUR EXPOSURESCritieria Air Contaminants (CACs)Carbon monoxide (CO) - - - - - - - - - - - -Nitrogen dioxide (NO2) - - - - - - - - - - - -Coarse Particulate Matter (PM10) - - - - - - - - - - - -Fine Particulate Matter (PM2.5) - - - - - - - - - - - -Sulphur Dioxide (SO2) - - - - - - - - - - - -Volatile Organic Chemicals (VOCs)Acetaldehyde - - - - - - - - - - - -Acetone - - - - - - - - - - - -Acrolein and related - - - - - - - - - - - -Aldehydes, other - - - - - - - - - - - -Aliphatic alcohols - - - - - - - - - - - -Alkanes/alkenes, other C1-4 - - - - - - - - - - - -Alkanes/alkenes, other C5-8 - - - - - - - - - - - -Alkanes/alkenes, other C>8-10 - - - - - - - - - - - -Alkanes/alkenes, other C>10-12 - - - - - - - - - - - -Alkanes/alkenes, other C>12-16 - - - - - - - - - - - -Benzene and related - - - - - - - - - - - -Butadiene, 1,3- - - - - - - - - - - - -Cycloalkanes and cycloalkenes - - - - - - - - - - - -Ethylbenzene and related - - - - - - - - - - - -Formaldehyde and related - - - - - - - - - - - -Hexane, n- - - - - - - - - - - - -Naphthalene and related - - - - - - - - - - - -Styrene - - - - - - - - - - - -Toluene and related - - - - - - - - - - - -Xylenes - - - - - - - - - - - -Polycyclic Aromatic Hydrocarbons (PAHs)Benzo(a)pyrene TEQ-Equivalents - - - - - - - - - - - -
COC
Values highlighted in orange are in excess of the acceptable CR of 1.0.- Indicates that an appropriate exposure limit (TRV) was not available for this chemical.
Page 1 of 3

Table 14: 2011 Assessment Scenario - Cancer risk estimates - Airport Case
MPOI R1 R2 R3 R4 R5 R6 R7 R8 R9 R10 R11COC8-HOUR EXPOSURESCritieria Air Contaminants (CACs)Carbon monoxide (CO) - - - - - - - - - - - -
24-HOUR EXPOSURESCritieria Air Contaminants (CACs)Carbon monoxide (CO) - - - - - - - - - - - -Nitrogen dioxide (NO2) - - - - - - - - - - - -Coarse Particulate Matter (PM10) - - - - - - - - - - - -Fine Particulate Matter (PM2.5) - - - - - - - - - - - -Sulphur Dioxide (SO2) - - - - - - - - - - - -Volatile Organic Chemicals (VOCs)Acetaldehyde - - - - - - - - - - - -Acetone - - - - - - - - - - - -Acrolein and related - - - - - - - - - - - -Aldehydes, other - - - - - - - - - - - -Aliphatic alcohols - - - - - - - - - - - -Alkanes/alkenes, other C1-4 - - - - - - - - - - - -Alkanes/alkenes, other C5-8 - - - - - - - - - - - -Alkanes/alkenes, other C>8-10 - - - - - - - - - - - -Alkanes/alkenes, other C>10-12 - - - - - - - - - - - -Alkanes/alkenes, other C>12-16 - - - - - - - - - - - -Benzene and related - - - - - - - - - - - -Butadiene, 1,3- - - - - - - - - - - - -Cycloalkanes and cycloalkenes - - - - - - - - - - - -Ethylbenzene and related - - - - - - - - - - - -Formaldehyde and related - - - - - - - - - - - -Hexane, n- - - - - - - - - - - - -Naphthalene and related - - - - - - - - - - - -Styrene - - - - - - - - - - - -Toluene and related - - - - - - - - - - - -Xylenes - - - - - - - - - - - -Polycyclic Aromatic Hydrocarbons (PAHs)Benzo(a)pyrene TEQ-Equivalents - - - - - - - - - - - -Values highlighted in orange are in excess of the acceptable CR of 1.0.- Indicates that an appropriate exposure limit (TRV) was not available for this chemical.
Page 2 of 3

Table 14: 2011 Assessment Scenario - Cancer risk estimates - Airport Case
MPOI R1 R2 R3 R4 R5 R6 R7 R8 R9 R10 R11COCANNUAL AVERAGE EXPOSURESCritieria Air Contaminants (CACs)Carbon monoxide (CO) - - - - - - - - - - - -Nitrogen dioxide (NO2) - - - - - - - - - - - -Coarse Particulate Matter (PM10) - - - - - - - - - - - -Fine Particulate Matter (PM2.5) - - - - - - - - - - - -Sulphur Dioxide (SO2) - - - - - - - - - - - -Volatile Organic Chemicals (VOCs)Acetaldehyde 5.5E-08 4.8E-08 3.3E-08 7.7E-08 3.6E-08 2.1E-08 8.4E-09 6.5E-08 1.3E-08 2.2E-08 1.3E-08 8.1E-09Acetone - - - - - - - - - - - -Acrolein and related - - - - - - - - - - - -Aldehydes, other - - - - - - - - - - - -Aliphatic alcohols - - - - - - - - - - - -Alkanes/alkenes, other C1-4 - - - - - - - - - - - -Alkanes/alkenes, other C5-8 - - - - - - - - - - - -Alkanes/alkenes, other C>8-10 - - - - - - - - - - - -Alkanes/alkenes, other C>10-12 - - - - - - - - - - - -Alkanes/alkenes, other C>12-16 - - - - - - - - - - - -Benzene and related 4.4E-07 3.8E-07 2.6E-07 6.1E-07 2.9E-07 1.6E-07 6.6E-08 5.1E-07 1.0E-07 1.8E-07 1.0E-07 6.5E-08Butadiene, 1,3- 4.0E-09 3.4E-09 2.4E-09 5.6E-09 2.6E-09 1.5E-09 6.0E-10 4.7E-09 9.3E-10 1.6E-09 9.1E-10 5.9E-10Cycloalkanes and cycloalkenes - - - - - - - - - - - -Ethylbenzene and related - - - - - - - - - - - -Formaldehyde and related 4.5E-07 3.9E-07 2.7E-07 6.3E-07 2.9E-07 1.7E-07 6.8E-08 5.2E-07 1.0E-07 1.8E-07 1.0E-07 6.6E-08Hexane, n- - - - - - - - - - - - -Naphthalene and related - - - - - - - - - - - -Styrene - - - - - - - - - - - -Toluene and related - - - - - - - - - - - -Xylenes - - - - - - - - - - - -Polycyclic Aromatic Hydrocarbons (PAHs)Benzo(a)pyrene TEQ-Equivalents 2.6E-07 1.9E-07 1.4E-07 3.7E-07 1.9E-07 1.1E-07 3.5E-08 2.8E-07 5.8E-08 1.2E-07 6.2E-08 3.8E-08Values highlighted in orange are in excess of the acceptable CR of 1.0.- Indicates that an appropriate exposure limit (TRV) was not available for this chemical.
Page 3 of 3

Table 15: 2011 Assessment Scenario - Cancer risk estimates - Cumulative Case
MPOI R1 R2 R3 R4 R5 R6 R7 R8 R9 R10 R111-HOUR EXPOSURESCritieria Air Contaminants (CACs)Carbon monoxide (CO) - - - - - - - - - - - -Nitrogen dioxide (NO2) - - - - - - - - - - - -Coarse Particulate Matter (PM10) - - - - - - - - - - - -Fine Particulate Matter (PM2.5) - - - - - - - - - - - -Sulphur Dioxide (SO2) - - - - - - - - - - - -Volatile Organic Chemicals (VOCs)Acetaldehyde - - - - - - - - - - - -Acetone - - - - - - - - - - - -Acrolein and related - - - - - - - - - - - -Aldehydes, other - - - - - - - - - - - -Aliphatic alcohols - - - - - - - - - - - -Alkanes/alkenes, other C1-4 - - - - - - - - - - - -Alkanes/alkenes, other C5-8 - - - - - - - - - - - -Alkanes/alkenes, other C>8-10 - - - - - - - - - - - -Alkanes/alkenes, other C>10-12 - - - - - - - - - - - -Alkanes/alkenes, other C>12-16 - - - - - - - - - - - -Benzene and related - - - - - - - - - - - -Butadiene, 1,3- - - - - - - - - - - - -Cycloalkanes and cycloalkenes - - - - - - - - - - - -Ethylbenzene and related - - - - - - - - - - - -Formaldehyde and related - - - - - - - - - - - -Hexane, n- - - - - - - - - - - - -Naphthalene and related - - - - - - - - - - - -Styrene - - - - - - - - - - - -Toluene and related - - - - - - - - - - - -Xylenes - - - - - - - - - - - -Polycyclic Aromatic Hydrocarbons (PAHs)Benzo(a)pyrene TEQ-Equivalents - - - - - - - - - - - -
COC
Values highlighted in orange are in excess of the acceptable CR of 1.0.- Indicates that an appropriate exposure limit (TRV) was not available for this chemical.
Page 1 of 3

Table 15: 2011 Assessment Scenario - Cancer risk estimates - Cumulative Case
MPOI R1 R2 R3 R4 R5 R6 R7 R8 R9 R10 R11COC8-HOUR EXPOSURESCritieria Air Contaminants (CACs)Carbon monoxide (CO) - - - - - - - - - - - -
24-HOUR EXPOSURESCritieria Air Contaminants (CACs)Carbon monoxide (CO) - - - - - - - - - - - -Nitrogen dioxide (NO2) - - - - - - - - - - - -Coarse Particulate Matter (PM10) - - - - - - - - - - - -Fine Particulate Matter (PM2.5) - - - - - - - - - - - -Sulphur Dioxide (SO2) - - - - - - - - - - - -Volatile Organic Chemicals (VOCs)Acetaldehyde - - - - - - - - - - - -Acetone - - - - - - - - - - - -Acrolein and related - - - - - - - - - - - -Aldehydes, other - - - - - - - - - - - -Aliphatic alcohols - - - - - - - - - - - -Alkanes/alkenes, other C1-4 - - - - - - - - - - - -Alkanes/alkenes, other C5-8 - - - - - - - - - - - -Alkanes/alkenes, other C>8-10 - - - - - - - - - - - -Alkanes/alkenes, other C>10-12 - - - - - - - - - - - -Alkanes/alkenes, other C>12-16 - - - - - - - - - - - -Benzene and related - - - - - - - - - - - -Butadiene, 1,3- - - - - - - - - - - - -Cycloalkanes and cycloalkenes - - - - - - - - - - - -Ethylbenzene and related - - - - - - - - - - - -Formaldehyde and related - - - - - - - - - - - -Hexane, n- - - - - - - - - - - - -Naphthalene and related - - - - - - - - - - - -Styrene - - - - - - - - - - - -Toluene and related - - - - - - - - - - - -Xylenes - - - - - - - - - - - -Polycyclic Aromatic Hydrocarbons (PAHs)Benzo(a)pyrene TEQ-Equivalents - - - - - - - - - - - -Values highlighted in orange are in excess of the acceptable CR of 1.0.- Indicates that an appropriate exposure limit (TRV) was not available for this chemical.
Page 2 of 3

Table 15: 2011 Assessment Scenario - Cancer risk estimates - Cumulative Case
MPOI R1 R2 R3 R4 R5 R6 R7 R8 R9 R10 R11COCANNUAL AVERAGE EXPOSURESCritieria Air Contaminants (CACs)Carbon monoxide (CO) - - - - - - - - - - - -Nitrogen dioxide (NO2) - - - - - - - - - - - -Coarse Particulate Matter (PM10) - - - - - - - - - - - -Fine Particulate Matter (PM2.5) - - - - - - - - - - - -Sulphur Dioxide (SO2) - - - - - - - - - - - -Volatile Organic Chemicals (VOCs)Acetaldehyde 3.5E-07 3.1E-07 2.9E-07 2.6E-06 2.5E-06 2.5E-06 2.5E-06 2.6E-06 2.5E-06 2.5E-06 2.5E-06 2.5E-06Acetone - - - - - - - - - - - -Acrolein and related - - - - - - - - - - - -Aldehydes, other - - - - - - - - - - - -Aliphatic alcohols - - - - - - - - - - - -Alkanes/alkenes, other C1-4 - - - - - - - - - - - -Alkanes/alkenes, other C5-8 - - - - - - - - - - - -Alkanes/alkenes, other C>8-10 - - - - - - - - - - - -Alkanes/alkenes, other C>10-12 - - - - - - - - - - - -Alkanes/alkenes, other C>12-16 - - - - - - - - - - - -Benzene and related 2.5E-06 2.2E-06 2.1E-06 1.8E-05 1.8E-05 1.8E-05 1.8E-05 1.8E-05 1.8E-05 1.8E-05 1.8E-05 1.7E-05Butadiene, 1,3- 6.6E-09 5.7E-09 4.6E-09 2.7E-08 2.4E-08 2.3E-08 2.2E-08 2.6E-08 2.2E-08 2.3E-08 2.2E-08 2.2E-08Cycloalkanes and cycloalkenes - - - - - - - - - - - -Ethylbenzene and related - - - - - - - - - - - -Formaldehyde and related 1.5E-06 1.3E-06 1.2E-06 9.5E-06 9.2E-06 9.1E-06 9.0E-06 9.4E-06 9.0E-06 9.1E-06 9.0E-06 9.0E-06Hexane, n- - - - - - - - - - - - -Naphthalene and related - - - - - - - - - - - -Styrene - - - - - - - - - - - -Toluene and related - - - - - - - - - - - -Xylenes - - - - - - - - - - - -Polycyclic Aromatic Hydrocarbons (PAHs)Benzo(a)pyrene TEQ-Equivalents - - - - - - - - - - - -Values highlighted in orange are in excess of the acceptable CR of 1.0.- Indicates that an appropriate exposure limit (TRV) was not available for this chemical.
Page 3 of 3

Table 16: 2022 Assessment Scenario - Non-cancer risk estimates - Background Case
MPOI R1 R2 R3 R4 R5 R6 R7 R8 R9 R10 R111-HOUR EXPOSURES
Carbon monoxide (CO) 3.4E-01 9.6E-02 1.0E-01 1.8E-01 1.2E-01 8.4E-02 1.2E-01 9.4E-02 7.2E-02 8.4E-02 8.6E-02 1.2E-01Nitrogen dioxide (NO2) 1.8E+00 1.0E+00 1.0E+00 1.1E+00 9.4E-01 9.6E-01 9.9E-01 1.4E+00 9.7E-01 9.5E-01 9.5E-01 9.9E-01Coarse Particulate Matter (PM10) - - - - - - - - - - - -Fine Particulate Matter (PM2.5) - - - - - - - - - - - -Sulphur Dioxide (SO2) 8.9E+00 1.4E+00 1.4E+00 1.6E+00 1.5E+00 1.9E+00 1.1E+00 2.2E+00 2.4E+00 2.4E+00 1.1E+00 6.6E-01
Acetaldehyde 1.4E-02 1.4E-02 1.4E-02 1.4E-02 1.4E-02 1.4E-02 1.4E-02 1.4E-02 1.4E-02 1.4E-02 1.4E-02 1.4E-02Acetone 5.0E-04 5.0E-04 5.0E-04 5.0E-04 5.0E-04 5.0E-04 5.0E-04 5.0E-04 5.0E-04 5.0E-04 5.0E-04 5.0E-04Acrolein and related 1.3E-01 1.3E-01 1.3E-01 1.3E-01 1.3E-01 1.3E-01 1.3E-01 1.3E-01 1.3E-01 1.3E-01 1.3E-01 1.3E-01Aldehydes, other 3.9E-03 3.9E-03 3.9E-03 3.9E-03 3.9E-03 3.9E-03 3.9E-03 3.9E-03 3.9E-03 3.9E-03 3.9E-03 3.9E-03Aliphatic alcohols - - - - - - - - - - - -Alkanes/alkenes, other C1-4 1.8E-03 1.8E-03 1.8E-03 1.8E-03 1.8E-03 1.8E-03 1.8E-03 1.8E-03 1.8E-03 1.8E-03 1.8E-03 1.8E-03Alkanes/alkenes, other C5-8 5.3E-05 5.3E-05 5.3E-05 5.3E-05 5.3E-05 5.3E-05 5.3E-05 5.3E-05 5.3E-05 5.3E-05 5.3E-05 5.3E-05Alkanes/alkenes, other C>8-10 1.6E-05 1.6E-05 1.6E-05 1.6E-05 1.6E-05 1.6E-05 1.6E-05 1.6E-05 1.6E-05 1.6E-05 1.6E-05 1.6E-05Alkanes/alkenes, other C>10-12 - - - - - - - - - - - -Alkanes/alkenes, other C>12-16 - - - - - - - - - - - -Benzene and related 7.6E-02 7.6E-02 7.6E-02 7.6E-02 7.6E-02 7.6E-02 7.6E-02 7.6E-02 7.6E-02 7.6E-02 7.6E-02 7.6E-02Butadiene, 1,3- 3.2E-04 3.2E-04 3.2E-04 3.2E-04 3.2E-04 3.2E-04 3.2E-04 3.2E-04 3.2E-04 3.2E-04 3.2E-04 3.2E-04Cycloalkanes and cycloalkenes - - - - - - - - - - - -Ethylbenzene and related 3.1E-05 3.1E-05 3.1E-05 3.1E-05 3.1E-05 3.1E-05 3.1E-05 3.1E-05 3.1E-05 3.1E-05 3.1E-05 3.1E-05Formaldehyde and related 1.8E-01 1.8E-01 1.8E-01 1.8E-01 1.8E-01 1.8E-01 1.8E-01 1.8E-01 1.8E-01 1.8E-01 1.8E-01 1.8E-01Hexane, n- - - - - - - - - - - - -Naphthalene and related - - - - - - - - - - - -Styrene 1.4E-05 1.4E-05 1.4E-05 1.4E-05 1.4E-05 1.4E-05 1.4E-05 1.4E-05 1.4E-05 1.4E-05 1.4E-05 1.4E-05Toluene and related 4.2E-04 4.2E-04 4.2E-04 4.2E-04 4.2E-04 4.2E-04 4.2E-04 4.2E-04 4.2E-04 4.2E-04 4.2E-04 4.2E-04Xylenes 3.4E-04 3.4E-04 3.4E-04 3.4E-04 3.4E-04 3.4E-04 3.4E-04 3.4E-04 3.4E-04 3.4E-04 3.4E-04 3.4E-04
Benzo(a)pyrene TEQ-Equivalents - - - - - - - - - - - -
COC
Values highlighted in orange are in excess of the acceptable CR of 1.0.- Indicates that an appropriate exposure limit (TRV) was not available for this chemical.
Critieria Air Contaminants (CACs)
Volatile Organic Chemicals (VOCs)
Polycyclic Aromatic Hydrocarbons (PAHs)
Page 1 of 3

Table 16: 2022 Assessment Scenario - Non-cancer risk estimates - Background Case
MPOI R1 R2 R3 R4 R5 R6 R7 R8 R9 R10 R11COC8-HOUR EXPOSURESCritieria Air Contaminants (CACs)Carbon monoxide (CO) 1.3E+00 3.7E-01 4.2E-01 6.6E-01 4.7E-01 3.2E-01 5.1E-01 2.3E-01 2.6E-01 4.3E-01 3.5E-01 5.2E-01
24-HOUR EXPOSURES
Carbon monoxide (CO) - - - - - - - - - - - -Nitrogen dioxide (NO2) 6.1E-01 2.4E-01 2.5E-01 2.8E-01 2.2E-01 2.1E-01 2.9E-01 3.8E-01 2.5E-01 2.3E-01 2.4E-01 2.9E-01Coarse Particulate Matter (PM10) 4.1E+00 2.9E+00 3.3E+00 2.8E+00 2.2E+00 1.9E+00 1.4E+00 2.2E+00 2.3E+00 2.0E+00 2.0E+00 1.5E+00Fine Particulate Matter (PM2.5) 4.6E+00 1.6E+00 1.8E+00 1.7E+00 1.3E+00 1.3E+00 1.2E+00 1.9E+00 1.6E+00 1.4E+00 1.4E+00 1.0E+00Sulphur Dioxide (SO2) 2.2E+00 1.1E-01 1.0E-01 1.3E-01 1.3E-01 2.1E-01 1.0E-01 2.4E-01 2.4E-01 2.0E-01 8.7E-02 6.9E-02
Acetaldehyde 5.4E-03 5.4E-03 5.4E-03 5.4E-03 5.4E-03 5.4E-03 5.4E-03 5.4E-03 5.4E-03 5.4E-03 5.4E-03 5.4E-03Acetone 4.5E-04 4.5E-04 4.5E-04 4.5E-04 4.5E-04 4.5E-04 4.5E-04 4.5E-04 4.5E-04 4.5E-04 4.5E-04 4.5E-04Acrolein and related 3.2E-01 3.2E-01 3.2E-01 3.2E-01 3.2E-01 3.2E-01 3.2E-01 3.2E-01 3.2E-01 3.2E-01 3.2E-01 3.2E-01Aldehydes, other - - - - - - - - - - - -Aliphatic alcohols - - - - - - - - - - - -Alkanes/alkenes, other C1-4 6.2E-03 6.2E-03 6.2E-03 6.2E-03 6.2E-03 6.2E-03 6.2E-03 6.2E-03 6.2E-03 6.2E-03 6.2E-03 6.2E-03Alkanes/alkenes, other C5-8 1.7E-03 1.7E-03 1.7E-03 1.7E-03 1.7E-03 1.7E-03 1.7E-03 1.7E-03 1.7E-03 1.7E-03 1.7E-03 1.7E-03Alkanes/alkenes, other C>8-10 6.7E-06 6.7E-06 6.7E-06 6.7E-06 6.7E-06 6.7E-06 6.7E-06 6.7E-06 6.7E-06 6.7E-06 6.7E-06 6.7E-06Alkanes/alkenes, other C>10-12 - - - - - - - - - - - -Alkanes/alkenes, other C>12-16 - - - - - - - - - - - -Benzene and related 2.9E-02 2.9E-02 2.9E-02 2.9E-02 2.9E-02 2.9E-02 2.9E-02 2.9E-02 2.9E-02 2.9E-02 2.9E-02 2.9E-02Butadiene, 1,3- 5.8E-03 5.8E-03 5.8E-03 5.8E-03 5.8E-03 5.8E-03 5.8E-03 5.8E-03 5.8E-03 5.8E-03 5.8E-03 5.8E-03Cycloalkanes and cycloalkenes 6.4E-05 6.4E-05 6.4E-05 6.4E-05 6.4E-05 6.4E-05 6.4E-05 6.4E-05 6.4E-05 6.4E-05 6.4E-05 6.4E-05Ethylbenzene and related 1.1E-03 1.1E-03 1.1E-03 1.1E-03 1.1E-03 1.1E-03 1.1E-03 1.1E-03 1.1E-03 1.1E-03 1.1E-03 1.1E-03Formaldehyde and related 5.6E-02 5.6E-02 5.6E-02 5.6E-02 5.6E-02 5.6E-02 5.6E-02 5.6E-02 5.6E-02 5.6E-02 5.6E-02 5.6E-02Hexane, n- 1.4E-04 1.4E-04 1.4E-04 1.4E-04 1.4E-04 1.4E-04 1.4E-04 1.4E-04 1.4E-04 1.4E-04 1.4E-04 1.4E-04Naphthalene and related 3.9E-03 3.9E-03 3.9E-03 3.9E-03 3.9E-03 3.9E-03 3.9E-03 3.9E-03 3.9E-03 3.9E-03 3.9E-03 3.9E-03Styrene 3.0E-04 3.0E-04 3.0E-04 3.0E-04 3.0E-04 3.0E-04 3.0E-04 3.0E-04 3.0E-04 3.0E-04 3.0E-04 3.0E-04Toluene and related 6.7E-04 6.7E-04 6.7E-04 6.7E-04 6.7E-04 6.7E-04 6.7E-04 6.7E-04 6.7E-04 6.7E-04 6.7E-04 6.7E-04Xylenes 1.4E-03 1.4E-03 1.4E-03 1.4E-03 1.4E-03 1.4E-03 1.4E-03 1.4E-03 1.4E-03 1.4E-03 1.4E-03 1.4E-03
Benzo(a)pyrene TEQ-Equivalents - - - - - - - - - - - -Values highlighted in orange are in excess of the acceptable CR of 1.0.- Indicates that an appropriate exposure limit (TRV) was not available for this chemical.
Critieria Air Contaminants (CACs)
Volatile Organic Chemicals (VOCs)
Polycyclic Aromatic Hydrocarbons (PAHs)
Page 2 of 3

Table 16: 2022 Assessment Scenario - Non-cancer risk estimates - Background Case
MPOI R1 R2 R3 R4 R5 R6 R7 R8 R9 R10 R11COCANNUAL AVERAGE EXPOSURESCritieria Air Contaminants (CACs)Carbon monoxide (CO) - - - - - - - - - - - -Nitrogen dioxide (NO2) 3.4E-01 8.9E-02 8.9E-02 5.5E-01 3.5E-01 3.3E-01 4.3E-01 4.3E-01 3.5E-01 3.3E-01 3.5E-01 4.3E-01Coarse Particulate Matter (PM10) 6.8E-01 4.4E-01 4.8E-01 1.8E+00 1.4E+00 1.1E+00 8.5E-01 1.2E+00 1.2E+00 1.3E+00 1.2E+00 7.5E-01Fine Particulate Matter (PM2.5) 9.9E-01 3.0E-01 3.0E-01 1.4E+00 1.0E+00 9.1E-01 9.1E-01 1.1E+00 1.1E+00 1.0E+00 1.0E+00 6.8E-01Sulphur Dioxide (SO2) 1.5E+00 3.0E-02 3.0E-02 1.4E-01 1.5E-01 1.9E-01 1.1E-01 2.3E-01 3.1E-01 2.1E-01 9.7E-02 6.9E-02Volatile Organic Chemicals (VOCs)Acetaldehyde 1.8E-03 1.6E-03 1.6E-03 6.6E-03 6.6E-03 6.6E-03 6.6E-03 6.6E-03 6.6E-03 6.6E-03 6.6E-03 6.6E-03Acetone 4.3E-05 3.8E-05 3.8E-05 1.6E-04 1.6E-04 1.6E-04 1.6E-04 1.6E-04 1.6E-04 1.6E-04 1.6E-04 1.6E-04Acrolein and related 4.6E-01 4.0E-01 4.0E-01 1.7E+00 1.7E+00 1.7E+00 1.7E+00 1.7E+00 1.7E+00 1.7E+00 1.7E+00 1.7E+00Aldehydes, other 2.8E-02 2.5E-02 2.5E-02 1.0E-01 1.0E-01 1.0E-01 1.0E-01 1.0E-01 1.0E-01 1.0E-01 1.0E-01 1.0E-01Aliphatic alcohols - - - - - - - - - - - -Alkanes/alkenes, other C1-4 1.3E-03 1.1E-03 1.1E-03 4.7E-03 4.7E-03 4.7E-03 4.7E-03 4.7E-03 4.7E-03 4.7E-03 4.7E-03 4.7E-03Alkanes/alkenes, other C5-8 3.9E-05 3.4E-05 3.4E-05 1.4E-04 1.4E-04 1.4E-04 1.4E-04 1.4E-04 1.4E-04 1.4E-04 1.4E-04 1.4E-04Alkanes/alkenes, other C>8-10 4.0E-05 3.5E-05 3.5E-05 1.5E-04 1.5E-04 1.5E-04 1.5E-04 1.5E-04 1.5E-04 1.5E-04 1.5E-04 1.5E-04Alkanes/alkenes, other C>10-12 3.2E-05 2.8E-05 2.8E-05 1.2E-04 1.2E-04 1.2E-04 1.2E-04 1.2E-04 1.2E-04 1.2E-04 1.2E-04 1.2E-04Alkanes/alkenes, other C>12-16 - - - - - - - - - - - -Benzene and related 5.5E-02 4.8E-02 4.8E-02 2.0E-01 2.0E-01 2.0E-01 2.0E-01 2.0E-01 2.0E-01 2.0E-01 2.0E-01 2.0E-01Butadiene, 1,3- 5.9E-03 5.1E-03 5.1E-03 2.1E-02 2.1E-02 2.1E-02 2.1E-02 2.1E-02 2.1E-02 2.1E-02 2.1E-02 2.1E-02Cycloalkanes and cycloalkenes 1.1E-05 9.7E-06 9.7E-06 4.1E-05 4.1E-05 4.1E-05 4.1E-05 4.1E-05 4.1E-05 4.1E-05 4.1E-05 4.1E-05Ethylbenzene and related 4.9E-04 4.2E-04 4.2E-04 1.8E-03 1.8E-03 1.8E-03 1.8E-03 1.8E-03 1.8E-03 1.8E-03 1.8E-03 1.8E-03Formaldehyde and related 4.5E-02 3.9E-02 3.9E-02 1.6E-01 1.6E-01 1.6E-01 1.6E-01 1.6E-01 1.6E-01 1.6E-01 1.6E-01 1.6E-01Hexane, n- 9.4E-05 8.2E-05 8.2E-05 3.4E-04 3.4E-04 3.4E-04 3.4E-04 3.4E-04 3.4E-04 3.4E-04 3.4E-04 3.4E-04Naphthalene and related 2.8E-03 2.5E-03 2.5E-03 1.0E-02 1.0E-02 1.0E-02 1.0E-02 1.0E-02 1.0E-02 1.0E-02 1.0E-02 1.0E-02Styrene 1.5E-05 1.3E-05 1.3E-05 5.5E-05 5.5E-05 5.5E-05 5.5E-05 5.5E-05 5.5E-05 5.5E-05 5.5E-05 5.5E-05Toluene and related 5.8E-05 5.0E-05 5.0E-05 2.1E-04 2.1E-04 2.1E-04 2.1E-04 2.1E-04 2.1E-04 2.1E-04 2.1E-04 2.1E-04Xylenes 1.4E-03 1.2E-03 1.2E-03 5.2E-03 5.2E-03 5.2E-03 5.2E-03 5.2E-03 5.2E-03 5.2E-03 5.2E-03 5.2E-03Polycyclic Aromatic Hydrocarbons (PAHs)Benzo(a)pyrene TEQ-Equivalents - - - - - - - - - - - -Values highlighted in orange are in excess of the acceptable CR of 1.0.- Indicates that an appropriate exposure limit (TRV) was not available for this chemical.
Page 3 of 3

Table 17: 2022 Assessment Scenario - Non-cancer risk estimates - Airport Case
MPOI R1 R2 R3 R4 R5 R6 R7 R8 R9 R10 R111-HOUR EXPOSURES
Carbon monoxide (CO) 2.2E-01 1.2E-01 1.6E-01 5.2E-02 3.0E-02 2.8E-02 2.0E-02 6.0E-02 2.8E-02 2.3E-02 1.6E-02 1.5E-02Nitrogen dioxide (NO2) 1.6E+00 8.8E-01 9.9E-01 7.1E-01 7.9E-01 5.7E-01 5.9E-01 1.1E+00 7.3E-01 4.8E-01 5.4E-01 4.9E-01Coarse Particulate Matter (PM10) - - - - - - - - - - - -Fine Particulate Matter (PM2.5) - - - - - - - - - - - -Sulphur Dioxide (SO2) 2.2E+00 8.3E-01 1.0E+00 5.3E-01 3.4E-01 3.0E-01 1.4E-01 7.0E-01 3.4E-01 2.5E-01 1.5E-01 1.1E-01
Acetaldehyde 6.4E-02 3.9E-02 4.4E-02 1.9E-02 1.3E-02 1.3E-02 5.8E-03 2.4E-02 1.1E-02 9.7E-03 7.4E-03 4.8E-03Acetone 9.7E-05 6.0E-05 6.7E-05 2.9E-05 2.0E-05 2.0E-05 8.7E-06 3.6E-05 1.7E-05 1.5E-05 1.1E-05 7.3E-06Acrolein and related 7.8E+00 4.9E+00 5.4E+00 2.3E+00 1.6E+00 1.6E+00 7.1E-01 2.9E+00 1.4E+00 1.2E+00 9.1E-01 5.9E-01Aldehydes, other 1.1E-02 6.9E-03 7.6E-03 3.3E-03 2.3E-03 2.3E-03 1.0E-03 4.1E-03 2.0E-03 1.7E-03 1.3E-03 8.3E-04Aliphatic alcohols 5.5E-03 3.4E-03 3.8E-03 1.7E-03 1.1E-03 1.1E-03 5.0E-04 2.1E-03 9.7E-04 8.4E-04 6.4E-04 4.2E-04Alkanes/alkenes, other C1-4 6.4E-03 4.0E-03 4.4E-03 1.9E-03 1.3E-03 1.3E-03 5.8E-04 2.4E-03 1.1E-03 9.8E-04 7.4E-04 4.8E-04Alkanes/alkenes, other C5-8 2.0E-04 1.3E-04 1.4E-04 6.1E-05 4.2E-05 4.2E-05 1.8E-05 7.6E-05 3.6E-05 3.1E-05 2.4E-05 1.5E-05Alkanes/alkenes, other C>8-10 2.4E-03 1.5E-03 1.6E-03 7.0E-04 4.8E-04 4.9E-04 2.1E-04 8.7E-04 4.2E-04 3.6E-04 2.7E-04 1.8E-04Alkanes/alkenes, other C>10-12 - - - - - - - - - - - -Alkanes/alkenes, other C>12-16 - - - - - - - - - - - -Benzene and related 6.0E-01 3.7E-01 4.2E-01 1.8E-01 1.2E-01 1.3E-01 5.5E-02 2.2E-01 1.1E-01 9.2E-02 7.0E-02 4.5E-02Butadiene, 1,3- 1.8E-02 1.1E-02 1.2E-02 5.3E-03 3.6E-03 3.7E-03 1.6E-03 6.6E-03 3.1E-03 2.7E-03 2.1E-03 1.3E-03Cycloalkanes and cycloalkenes - - - - - - - - - - - -Ethylbenzene and related 1.4E-04 9.0E-05 1.0E-04 4.3E-05 3.0E-05 3.0E-05 1.3E-05 5.4E-05 2.5E-05 2.2E-05 1.7E-05 1.1E-05Formaldehyde and related 2.2E+00 1.4E+00 1.5E+00 6.6E-01 4.5E-01 4.6E-01 2.0E-01 8.2E-01 3.9E-01 3.4E-01 2.5E-01 1.7E-01Hexane, n- - - - - - - - - - - - -Naphthalene and related - - - - - - - - - - - -Styrene 1.0E-04 6.2E-05 6.9E-05 3.0E-05 2.0E-05 2.1E-05 9.0E-06 3.7E-05 1.8E-05 1.5E-05 1.2E-05 7.5E-06Toluene and related 4.5E-04 2.8E-04 3.1E-04 1.3E-04 9.2E-05 9.3E-05 4.1E-05 1.7E-04 7.9E-05 6.9E-05 5.2E-05 3.4E-05Xylenes 5.2E-04 3.2E-04 3.6E-04 1.6E-04 1.1E-04 1.1E-04 4.7E-05 1.9E-04 9.2E-05 7.9E-05 6.0E-05 3.9E-05
Benzo(a)pyrene TEQ-Equivalents - - - - - - - - - - - -
COC
Values highlighted in orange are in excess of the acceptable CR of 1.0.- Indicates that an appropriate exposure limit (TRV) was not available for this chemical.
Critieria Air Contaminants (CACs)
Volatile Organic Chemicals (VOCs)
Polycyclic Aromatic Hydrocarbons (PAHs)
Page 1 of 3

Table 17: 2022 Assessment Scenario - Non-cancer risk estimates - Airport Case
MPOI R1 R2 R3 R4 R5 R6 R7 R8 R9 R10 R11COC8-HOUR EXPOSURESCritieria Air Contaminants (CACs)Carbon monoxide (CO) 3.8E-01 2.1E-01 2.2E-01 8.0E-02 3.6E-02 3.6E-02 2.1E-02 8.1E-02 2.8E-02 3.7E-02 1.5E-02 1.3E-02
24-HOUR EXPOSURES
Carbon monoxide (CO) - - - - - - - - - - - -Nitrogen dioxide (NO2) 2.2E-01 1.7E-01 1.4E-01 8.5E-02 5.7E-02 4.9E-02 5.6E-02 1.5E-01 6.3E-02 4.6E-02 3.0E-02 4.8E-02Coarse Particulate Matter (PM10) 1.7E-01 7.7E-02 8.3E-02 2.8E-02 1.4E-02 8.1E-03 8.8E-03 2.3E-02 1.3E-02 1.1E-02 5.1E-03 6.6E-03Fine Particulate Matter (PM2.5) 3.1E-01 1.2E-01 1.4E-01 5.1E-02 2.6E-02 1.4E-02 1.5E-02 4.1E-02 2.4E-02 1.9E-02 9.0E-03 1.2E-02Sulphur Dioxide (SO2) 1.2E-01 6.3E-02 5.1E-02 3.9E-02 2.3E-02 1.5E-02 6.3E-03 4.0E-02 1.1E-02 1.2E-02 7.0E-03 5.9E-03
Acetaldehyde 5.9E-03 4.0E-03 3.0E-03 1.6E-03 1.0E-03 7.5E-04 3.0E-04 1.7E-03 4.7E-04 6.4E-04 3.7E-04 3.3E-04Acetone 2.1E-05 1.4E-05 1.1E-05 5.8E-06 3.6E-06 2.6E-06 1.1E-06 5.8E-06 1.7E-06 2.3E-06 1.3E-06 1.2E-06Acrolein and related 4.8E+00 3.2E+00 2.5E+00 1.3E+00 8.5E-01 6.1E-01 2.4E-01 1.4E+00 3.8E-01 5.3E-01 3.0E-01 2.7E-01Aldehydes, other - - - - - - - - - - - -Aliphatic alcohols 1.8E-03 1.2E-03 9.1E-04 4.9E-04 3.1E-04 2.3E-04 9.0E-05 5.0E-04 1.4E-04 1.9E-04 1.1E-04 9.9E-05Alkanes/alkenes, other C1-4 5.4E-03 3.6E-03 2.8E-03 1.5E-03 9.4E-04 6.8E-04 2.7E-04 1.5E-03 4.3E-04 5.9E-04 3.3E-04 3.0E-04Alkanes/alkenes, other C5-8 1.6E-03 1.1E-03 8.3E-04 4.5E-04 2.8E-04 2.0E-04 8.2E-05 4.5E-04 1.3E-04 1.8E-04 1.0E-04 9.0E-05Alkanes/alkenes, other C>8-10 2.3E-04 1.6E-04 1.2E-04 6.5E-05 4.1E-05 3.0E-05 1.2E-05 6.5E-05 1.8E-05 2.5E-05 1.4E-05 1.3E-05Alkanes/alkenes, other C>10-12 - - - - - - - - - - - -Alkanes/alkenes, other C>12-16 - - - - - - - - - - - -Benzene and related 5.5E-02 3.7E-02 2.8E-02 1.5E-02 9.7E-03 7.0E-03 2.8E-03 1.6E-02 4.4E-03 6.0E-03 3.4E-03 3.1E-03Butadiene, 1,3- 7.7E-02 5.2E-02 4.0E-02 2.2E-02 1.3E-02 9.8E-03 3.9E-03 2.2E-02 6.1E-03 8.4E-03 4.8E-03 4.3E-03Cycloalkanes and cycloalkenes 2.1E-05 1.4E-05 1.1E-05 5.9E-06 3.7E-06 2.7E-06 1.1E-06 5.9E-06 1.7E-06 2.3E-06 1.3E-06 1.2E-06Ethylbenzene and related 1.2E-03 8.2E-04 6.3E-04 3.4E-04 2.1E-04 1.6E-04 6.2E-05 3.4E-04 9.7E-05 1.3E-04 7.6E-05 6.8E-05Formaldehyde and related 1.7E-01 1.1E-01 8.5E-02 4.7E-02 2.9E-02 2.1E-02 8.4E-03 4.7E-02 1.3E-02 1.8E-02 1.0E-02 9.3E-03Hexane, n- 1.8E-05 1.2E-05 9.0E-06 4.9E-06 3.1E-06 2.2E-06 8.9E-07 4.9E-06 1.4E-06 1.9E-06 1.1E-06 9.8E-07Naphthalene and related 3.2E-02 2.2E-02 1.7E-02 9.0E-03 5.7E-03 4.1E-03 1.6E-03 9.1E-03 2.6E-03 3.5E-03 2.0E-03 1.8E-03Styrene 5.2E-04 3.5E-04 2.7E-04 1.4E-04 9.1E-05 6.6E-05 2.6E-05 1.5E-04 4.1E-05 5.6E-05 3.2E-05 2.9E-05Toluene and related 1.8E-04 1.2E-04 9.0E-05 4.9E-05 3.1E-05 2.2E-05 8.9E-06 4.9E-05 1.4E-05 1.9E-05 1.1E-05 9.8E-06Xylenes 5.2E-04 3.5E-04 2.7E-04 1.5E-04 9.1E-05 6.6E-05 2.6E-05 1.5E-04 4.1E-05 5.7E-05 3.2E-05 2.9E-05
Benzo(a)pyrene TEQ-Equivalents - - - - - - - - - - - -Values highlighted in orange are in excess of the acceptable CR of 1.0.- Indicates that an appropriate exposure limit (TRV) was not available for this chemical.
Critieria Air Contaminants (CACs)
Volatile Organic Chemicals (VOCs)
Polycyclic Aromatic Hydrocarbons (PAHs)
Page 2 of 3

Table 17: 2022 Assessment Scenario - Non-cancer risk estimates - Airport Case
MPOI R1 R2 R3 R4 R5 R6 R7 R8 R9 R10 R11COCANNUAL AVERAGE EXPOSURESCritieria Air Contaminants (CACs)Carbon monoxide (CO) - - - - - - - - - - - -Nitrogen dioxide (NO2) 5.6E-02 4.7E-02 3.8E-02 6.1E-02 4.3E-02 2.6E-02 1.1E-02 9.2E-02 2.2E-02 2.6E-02 1.5E-02 9.0E-03Coarse Particulate Matter (PM10) 1.0E-02 6.8E-03 5.1E-03 5.8E-03 3.0E-03 1.7E-03 5.6E-04 5.1E-03 1.3E-03 1.8E-03 8.9E-04 5.1E-04Fine Particulate Matter (PM2.5) 2.1E-02 1.2E-02 9.7E-03 1.2E-02 6.2E-03 3.7E-03 1.2E-03 1.1E-02 2.7E-03 3.7E-03 1.9E-03 1.1E-03Sulphur Dioxide (SO2) 2.7E-02 1.4E-02 1.2E-02 2.1E-02 1.1E-02 6.2E-03 2.1E-03 2.8E-02 5.1E-03 5.9E-03 3.1E-03 1.9E-03Volatile Organic Chemicals (VOCs)Acetaldehyde 4.9E-04 4.0E-04 2.9E-04 4.1E-04 1.9E-04 1.1E-04 3.7E-05 4.7E-04 9.3E-05 1.1E-04 5.4E-05 3.2E-05Acetone 3.6E-07 2.9E-07 2.1E-07 3.0E-07 1.4E-07 8.2E-08 2.7E-08 3.5E-07 6.8E-08 8.1E-08 3.9E-08 2.4E-08Acrolein and related 2.3E+00 1.8E+00 1.3E+00 1.9E+00 8.6E-01 5.1E-01 1.7E-01 2.2E+00 4.3E-01 5.0E-01 2.5E-01 1.5E-01Aldehydes, other 5.8E-03 4.7E-03 3.4E-03 4.8E-03 2.2E-03 1.3E-03 4.3E-04 5.5E-03 1.1E-03 1.3E-03 6.3E-04 3.7E-04Aliphatic alcohols 4.2E-05 3.4E-05 2.4E-05 3.4E-05 1.6E-05 9.4E-06 3.1E-06 4.0E-05 7.8E-06 9.3E-06 4.5E-06 2.7E-06Alkanes/alkenes, other C1-4 1.7E-04 1.4E-04 9.9E-05 1.4E-04 6.4E-05 3.8E-05 1.2E-05 1.6E-04 3.2E-05 3.7E-05 1.8E-05 1.1E-05Alkanes/alkenes, other C5-8 5.1E-06 4.2E-06 3.0E-06 4.2E-06 1.9E-06 1.2E-06 3.8E-07 4.9E-06 9.6E-07 1.1E-06 5.6E-07 3.3E-07Alkanes/alkenes, other C>8-10 3.3E-04 2.6E-04 1.9E-04 2.7E-04 1.2E-04 7.4E-05 2.4E-05 3.1E-04 6.1E-05 7.3E-05 3.5E-05 2.1E-05Alkanes/alkenes, other C>10-12 1.5E-05 1.2E-05 8.7E-06 1.2E-05 5.6E-06 3.3E-06 1.1E-06 1.4E-05 2.8E-06 3.3E-06 1.6E-06 9.6E-07Alkanes/alkenes, other C>12-16 2.6E-05 2.1E-05 1.5E-05 2.1E-05 9.7E-06 5.8E-06 1.9E-06 2.5E-05 4.8E-06 5.7E-06 2.8E-06 1.7E-06Benzene and related 1.3E-02 1.0E-02 7.4E-03 1.0E-02 4.8E-03 2.8E-03 9.3E-04 1.2E-02 2.4E-03 2.8E-03 1.4E-03 8.1E-04Butadiene, 1,3- 1.4E-02 1.1E-02 8.0E-03 1.1E-02 5.1E-03 3.1E-03 1.0E-03 1.3E-02 2.5E-03 3.0E-03 1.5E-03 8.8E-04Cycloalkanes and cycloalkenes 5.0E-07 4.1E-07 3.0E-07 4.2E-07 1.9E-07 1.1E-07 3.7E-08 4.8E-07 9.5E-08 1.1E-07 5.5E-08 3.3E-08Ethylbenzene and related 1.1E-04 9.0E-05 6.5E-05 9.1E-05 4.2E-05 2.5E-05 8.2E-06 1.1E-04 2.1E-05 2.5E-05 1.2E-05 7.2E-06Formaldehyde and related 2.8E-02 2.3E-02 1.7E-02 2.3E-02 1.1E-02 6.4E-03 2.1E-03 2.7E-02 5.3E-03 6.3E-03 3.1E-03 1.8E-03Hexane, n- 1.5E-06 1.2E-06 9.0E-07 1.3E-06 5.8E-07 3.5E-07 1.1E-07 1.5E-06 2.9E-07 3.4E-07 1.7E-07 9.9E-08Naphthalene and related 4.6E-03 3.7E-03 2.7E-03 3.8E-03 1.7E-03 1.0E-03 3.4E-04 4.4E-03 8.7E-04 1.0E-03 5.0E-04 3.0E-04Styrene 1.0E-05 8.4E-06 6.1E-06 8.5E-06 3.9E-06 2.3E-06 7.7E-07 9.9E-06 1.9E-06 2.3E-06 1.1E-06 6.7E-07Toluene and related 3.1E-06 2.5E-06 1.8E-06 2.6E-06 1.2E-06 7.0E-07 2.3E-07 3.0E-06 5.9E-07 7.0E-07 3.4E-07 2.0E-07Xylenes 8.9E-05 7.2E-05 5.2E-05 7.4E-05 3.4E-05 2.0E-05 6.6E-06 8.5E-05 1.7E-05 2.0E-05 9.6E-06 5.8E-06Polycyclic Aromatic Hydrocarbons (PAHs)Benzo(a)pyrene TEQ-Equivalents - - - - - - - - - - - -Values highlighted in orange are in excess of the acceptable CR of 1.0.- Indicates that an appropriate exposure limit (TRV) was not available for this chemical.
Page 3 of 3

Table 18: 2022 Assessment Scenario - Non-cancer risk estimates - Cumulative Case
MPOI R1 R2 R3 R4 R5 R6 R7 R8 R9 R10 R111-HOUR EXPOSURES
Carbon monoxide (CO) 3.4E-01 1.5E-01 2.1E-01 1.8E-01 1.2E-01 8.4E-02 1.2E-01 1.0E-01 7.2E-02 8.4E-02 8.6E-02 1.2E-01Nitrogen dioxide (NO2) 1.7E+00 1.0E+00 1.1E+00 1.1E+00 9.4E-01 9.6E-01 1.0E+00 1.4E+00 9.7E-01 9.5E-01 9.5E-01 9.9E-01Coarse Particulate Matter (PM10) - - - - - - - - - - - -Fine Particulate Matter (PM2.5) - - - - - - - - - - - -Sulphur Dioxide (SO2) 8.9E+00 1.6E+00 1.5E+00 1.6E+00 1.6E+00 1.9E+00 1.1E+00 2.2E+00 2.4E+00 2.4E+00 1.1E+00 6.6E-01
Acetaldehyde 7.8E-02 5.4E-02 5.8E-02 3.3E-02 2.7E-02 2.7E-02 2.0E-02 3.8E-02 2.5E-02 2.4E-02 2.1E-02 1.9E-02Acetone 5.9E-04 5.6E-04 5.6E-04 5.3E-04 5.2E-04 5.2E-04 5.0E-04 5.3E-04 5.1E-04 5.1E-04 5.1E-04 5.0E-04Acrolein and related 8.0E+00 5.0E+00 5.5E+00 2.5E+00 1.7E+00 1.8E+00 8.3E-01 3.0E+00 1.5E+00 1.3E+00 1.0E+00 7.2E-01Aldehydes, other 1.5E-02 1.1E-02 1.2E-02 7.3E-03 6.2E-03 6.2E-03 4.9E-03 8.1E-03 5.9E-03 5.6E-03 5.2E-03 4.8E-03Aliphatic alcohols 5.5E-03 3.4E-03 3.8E-03 1.7E-03 1.1E-03 1.1E-03 5.0E-04 2.1E-03 9.7E-04 8.4E-04 6.4E-04 4.2E-04Alkanes/alkenes, other C1-4 8.2E-03 5.8E-03 6.2E-03 3.7E-03 3.1E-03 3.1E-03 2.4E-03 4.2E-03 2.9E-03 2.8E-03 2.5E-03 2.3E-03Alkanes/alkenes, other C5-8 2.6E-04 1.8E-04 1.9E-04 1.1E-04 9.5E-05 9.5E-05 7.1E-05 1.3E-04 8.9E-05 8.4E-05 7.6E-05 6.8E-05Alkanes/alkenes, other C>8-10 2.4E-03 1.5E-03 1.6E-03 7.2E-04 5.0E-04 5.0E-04 2.3E-04 8.9E-04 4.3E-04 3.8E-04 2.9E-04 1.9E-04Alkanes/alkenes, other C>10-12 - - - - - - - - - - - -Alkanes/alkenes, other C>12-16 - - - - - - - - - - - -Benzene and related 6.8E-01 4.5E-01 4.9E-01 2.6E-01 2.0E-01 2.0E-01 1.3E-01 3.0E-01 1.8E-01 1.7E-01 1.5E-01 1.2E-01Butadiene, 1,3- 1.8E-02 1.1E-02 1.3E-02 5.6E-03 4.0E-03 4.0E-03 1.9E-03 6.9E-03 3.5E-03 3.0E-03 2.4E-03 1.7E-03Cycloalkanes and cycloalkenes - - - - - - - - - - - -Ethylbenzene and related 1.8E-04 1.2E-04 1.3E-04 7.4E-05 6.1E-05 6.1E-05 4.4E-05 8.5E-05 5.6E-05 5.3E-05 4.8E-05 4.2E-05Formaldehyde and related 2.4E+00 1.5E+00 1.7E+00 8.4E-01 6.3E-01 6.3E-01 3.8E-01 9.9E-01 5.7E-01 5.1E-01 4.3E-01 3.4E-01Hexane, n- - - - - - - - - - - - -Naphthalene and related - - - - - - - - - - - -Styrene 1.1E-04 7.6E-05 8.3E-05 4.4E-05 3.4E-05 3.5E-05 2.3E-05 5.1E-05 3.2E-05 2.9E-05 2.5E-05 2.1E-05Toluene and related 8.7E-04 7.0E-04 7.3E-04 5.5E-04 5.1E-04 5.1E-04 4.6E-04 5.8E-04 5.0E-04 4.8E-04 4.7E-04 4.5E-04Xylenes 8.6E-04 6.7E-04 7.0E-04 5.0E-04 4.5E-04 4.5E-04 3.9E-04 5.4E-04 4.3E-04 4.2E-04 4.0E-04 3.8E-04
Benzo(a)pyrene TEQ-Equivalents - - - - - - - - - - - -
COC
Values highlighted in orange are in excess of the acceptable CR of 1.0.- Indicates that an appropriate exposure limit (TRV) was not available for this chemical.
Critieria Air Contaminants (CACs)
Volatile Organic Chemicals (VOCs)
Polycyclic Aromatic Hydrocarbons (PAHs)
Page 1 of 3

Table 18: 2022 Assessment Scenario - Non-cancer risk estimates - Cumulative Case
MPOI R1 R2 R3 R4 R5 R6 R7 R8 R9 R10 R11COC8-HOUR EXPOSURESCritieria Air Contaminants (CACs)Carbon monoxide (CO) 1.3E+00 4.1E-01 4.9E-01 6.6E-01 4.7E-01 3.2E-01 5.0E-01 2.4E-01 2.6E-01 4.3E-01 3.5E-01 4.5E-01
24-HOUR EXPOSURES
Carbon monoxide (CO) - - - - - - - - - - - -Nitrogen dioxide (NO2) 7.2E-01 2.6E-01 2.6E-01 2.8E-01 2.2E-01 2.1E-01 3.0E-01 4.0E-01 2.6E-01 2.3E-01 2.4E-01 2.9E-01Coarse Particulate Matter (PM10) 4.1E+00 3.0E+00 3.3E+00 2.8E+00 2.3E+00 1.9E+00 1.4E+00 2.2E+00 2.3E+00 2.0E+00 2.0E+00 1.5E+00Fine Particulate Matter (PM2.5) 4.7E+00 1.7E+00 1.9E+00 1.7E+00 1.3E+00 1.3E+00 1.2E+00 2.0E+00 1.7E+00 1.4E+00 1.5E+00 1.1E+00Sulphur Dioxide (SO2) 2.2E+00 1.3E-01 1.3E-01 1.3E-01 1.3E-01 2.1E-01 1.0E-01 2.5E-01 2.4E-01 2.1E-01 8.7E-02 6.9E-02
Acetaldehyde 1.1E-02 9.4E-03 8.4E-03 7.1E-03 6.4E-03 6.2E-03 5.7E-03 7.1E-03 5.9E-03 6.1E-03 5.8E-03 5.7E-03Acetone 4.7E-04 4.6E-04 4.6E-04 4.5E-04 4.5E-04 4.5E-04 4.5E-04 4.5E-04 4.5E-04 4.5E-04 4.5E-04 4.5E-04Acrolein and related 5.2E+00 3.6E+00 2.8E+00 1.7E+00 1.2E+00 9.4E-01 5.7E-01 1.7E+00 7.1E-01 8.5E-01 6.2E-01 5.9E-01Aldehydes, other - - - - - - - - - - - -Aliphatic alcohols 1.8E-03 1.2E-03 9.1E-04 4.9E-04 3.1E-04 2.3E-04 9.0E-05 5.0E-04 1.4E-04 1.9E-04 1.1E-04 9.9E-05Alkanes/alkenes, other C1-4 1.2E-02 9.8E-03 9.0E-03 7.7E-03 7.2E-03 6.9E-03 6.5E-03 7.7E-03 6.7E-03 6.8E-03 6.6E-03 6.5E-03Alkanes/alkenes, other C5-8 3.3E-03 2.8E-03 2.6E-03 2.2E-03 2.0E-03 1.9E-03 1.8E-03 2.2E-03 1.9E-03 1.9E-03 1.8E-03 1.8E-03Alkanes/alkenes, other C>8-10 2.4E-04 1.6E-04 1.3E-04 7.2E-05 4.7E-05 3.6E-05 1.8E-05 7.2E-05 2.5E-05 3.2E-05 2.1E-05 2.0E-05Alkanes/alkenes, other C>10-12 - - - - - - - - - - - -Alkanes/alkenes, other C>12-16 - - - - - - - - - - - -Benzene and related 8.5E-02 6.6E-02 5.8E-02 4.5E-02 3.9E-02 3.6E-02 3.2E-02 4.5E-02 3.4E-02 3.5E-02 3.3E-02 3.2E-02Butadiene, 1,3- 8.3E-02 5.8E-02 4.5E-02 2.7E-02 1.9E-02 1.6E-02 9.7E-03 2.7E-02 1.2E-02 1.4E-02 1.1E-02 1.0E-02Cycloalkanes and cycloalkenes 8.5E-05 7.9E-05 7.5E-05 7.0E-05 6.8E-05 6.7E-05 6.5E-05 7.0E-05 6.6E-05 6.7E-05 6.6E-05 6.6E-05Ethylbenzene and related 2.3E-03 1.9E-03 1.7E-03 1.4E-03 1.3E-03 1.2E-03 1.2E-03 1.4E-03 1.2E-03 1.2E-03 1.2E-03 1.2E-03Formaldehyde and related 2.2E-01 1.7E-01 1.4E-01 1.0E-01 8.6E-02 7.8E-02 6.5E-02 1.0E-01 7.0E-02 7.5E-02 6.7E-02 6.6E-02Hexane, n- 1.6E-04 1.5E-04 1.5E-04 1.5E-04 1.4E-04 1.4E-04 1.4E-04 1.5E-04 1.4E-04 1.4E-04 1.4E-04 1.4E-04Naphthalene and related 3.6E-02 2.6E-02 2.0E-02 1.3E-02 9.6E-03 8.0E-03 5.6E-03 1.3E-02 6.5E-03 7.4E-03 5.9E-03 5.7E-03Styrene 8.2E-04 6.5E-04 5.6E-04 4.4E-04 3.9E-04 3.7E-04 3.3E-04 4.4E-04 3.4E-04 3.6E-04 3.3E-04 3.3E-04Toluene and related 8.5E-04 7.9E-04 7.6E-04 7.2E-04 7.0E-04 7.0E-04 6.8E-04 7.2E-04 6.9E-04 6.9E-04 6.9E-04 6.8E-04Xylenes 1.9E-03 1.8E-03 1.7E-03 1.6E-03 1.5E-03 1.5E-03 1.5E-03 1.6E-03 1.5E-03 1.5E-03 1.5E-03 1.5E-03
Benzo(a)pyrene TEQ-Equivalents - - - - - - - - - - - -Values highlighted in orange are in excess of the acceptable CR of 1.0.- Indicates that an appropriate exposure limit (TRV) was not available for this chemical.
Critieria Air Contaminants (CACs)
Volatile Organic Chemicals (VOCs)
Polycyclic Aromatic Hydrocarbons (PAHs)
Page 2 of 3

Table 18: 2022 Assessment Scenario - Non-cancer risk estimates - Cumulative Case
MPOI R1 R2 R3 R4 R5 R6 R7 R8 R9 R10 R11COCANNUAL AVERAGE EXPOSURESCritieria Air Contaminants (CACs)Carbon monoxide (CO) - - - - - - - - - - - -Nitrogen dioxide (NO2) 3.7E-01 1.1E-01 1.1E-01 5.7E-01 3.8E-01 3.3E-01 4.4E-01 4.6E-01 3.6E-01 3.5E-01 3.7E-01 1.2E-01Coarse Particulate Matter (PM10) 6.8E-01 4.4E-01 4.8E-01 1.7E+00 1.4E+00 1.1E+00 8.6E-01 1.2E+00 1.1E+00 1.3E+00 1.2E+00 2.1E-01Fine Particulate Matter (PM2.5) 1.0E+00 3.0E-01 3.2E-01 1.3E+00 1.0E+00 9.4E-01 8.6E-01 1.2E+00 1.1E+00 1.0E+00 9.9E-01 1.9E-01Sulphur Dioxide (SO2) 1.5E+00 4.4E-02 4.2E-02 1.6E-01 1.6E-01 2.0E-01 1.1E-01 2.6E-01 3.2E-01 2.2E-01 1.0E-01 1.9E-02Volatile Organic Chemicals (VOCs)Acetaldehyde 2.3E-03 2.0E-03 1.9E-03 7.0E-03 6.8E-03 6.7E-03 6.6E-03 7.1E-03 6.7E-03 6.7E-03 6.6E-03 1.8E-03Acetone 4.4E-05 3.8E-05 3.8E-05 1.6E-04 1.6E-04 1.6E-04 1.6E-04 1.6E-04 1.6E-04 1.6E-04 1.6E-04 4.3E-05Acrolein and related 2.7E+00 2.2E+00 1.7E+00 3.6E+00 2.5E+00 2.2E+00 1.8E+00 3.8E+00 2.1E+00 2.2E+00 1.9E+00 5.0E-01Aldehydes, other 3.4E-02 2.9E-02 2.8E-02 1.1E-01 1.1E-01 1.0E-01 1.0E-01 1.1E-01 1.0E-01 1.0E-01 1.0E-01 2.8E-02Aliphatic alcohols 4.2E-05 3.4E-05 2.4E-05 3.4E-05 1.6E-05 9.4E-06 3.1E-06 4.0E-05 7.8E-06 9.3E-06 4.5E-06 7.4E-07Alkanes/alkenes, other C1-4 1.4E-03 1.2E-03 1.2E-03 4.8E-03 4.7E-03 4.7E-03 4.7E-03 4.8E-03 4.7E-03 4.7E-03 4.7E-03 1.3E-03Alkanes/alkenes, other C5-8 4.4E-05 3.8E-05 3.7E-05 1.5E-04 1.4E-04 1.4E-04 1.4E-04 1.5E-04 1.4E-04 1.4E-04 1.4E-04 3.9E-05Alkanes/alkenes, other C>8-10 3.7E-04 3.0E-04 2.3E-04 4.2E-04 2.7E-04 2.2E-04 1.7E-04 4.6E-04 2.1E-04 2.2E-04 1.8E-04 4.6E-05Alkanes/alkenes, other C>10-12 4.7E-05 4.0E-05 3.6E-05 1.3E-04 1.2E-04 1.2E-04 1.2E-04 1.3E-04 1.2E-04 1.2E-04 1.2E-04 3.2E-05Alkanes/alkenes, other C>12-16 2.6E-05 2.1E-05 1.5E-05 2.1E-05 9.7E-06 5.8E-06 1.9E-06 2.5E-05 4.8E-06 5.7E-06 2.8E-06 4.6E-07Benzene and related 6.8E-02 5.8E-02 5.5E-02 2.1E-01 2.1E-01 2.0E-01 2.0E-01 2.1E-01 2.0E-01 2.0E-01 2.0E-01 5.5E-02Butadiene, 1,3- 1.9E-02 1.6E-02 1.3E-02 3.3E-02 2.7E-02 2.4E-02 2.2E-02 3.4E-02 2.4E-02 2.4E-02 2.3E-02 6.1E-03Cycloalkanes and cycloalkenes 1.2E-05 1.0E-05 1.0E-05 4.1E-05 4.1E-05 4.1E-05 4.1E-05 4.1E-05 4.1E-05 4.1E-05 4.1E-05 1.1E-05Ethylbenzene and related 6.0E-04 5.1E-04 4.9E-04 1.9E-03 1.8E-03 1.8E-03 1.8E-03 1.9E-03 1.8E-03 1.8E-03 1.8E-03 4.9E-04Formaldehyde and related 7.4E-02 6.2E-02 5.6E-02 1.9E-01 1.8E-01 1.7E-01 1.7E-01 1.9E-01 1.7E-01 1.7E-01 1.7E-01 4.6E-02Hexane, n- 9.6E-05 8.3E-05 8.2E-05 3.4E-04 3.4E-04 3.4E-04 3.4E-04 3.4E-04 3.4E-04 3.4E-04 3.4E-04 9.4E-05Naphthalene and related 7.4E-03 6.2E-03 5.2E-03 1.4E-02 1.2E-02 1.1E-02 1.1E-02 1.5E-02 1.1E-02 1.1E-02 1.1E-02 2.9E-03Styrene 2.6E-05 2.2E-05 1.9E-05 6.4E-05 5.9E-05 5.8E-05 5.6E-05 6.5E-05 5.7E-05 5.8E-05 5.6E-05 1.5E-05Toluene and related 6.1E-05 5.3E-05 5.2E-05 2.1E-04 2.1E-04 2.1E-04 2.1E-04 2.1E-04 2.1E-04 2.1E-04 2.1E-04 5.8E-05Xylenes 1.5E-03 1.3E-03 1.3E-03 5.3E-03 5.3E-03 5.3E-03 5.3E-03 5.3E-03 5.3E-03 5.3E-03 5.3E-03 1.4E-03Polycyclic Aromatic Hydrocarbons (PAHs)Benzo(a)pyrene TEQ-Equivalents - - - - - - - - - - - -Values highlighted in orange are in excess of the acceptable CR of 1.0.- Indicates that an appropriate exposure limit (TRV) was not available for this chemical.
Page 3 of 3

Table 19: 2022 Assessment Scenario - Cancer risk estimates - Background Case
MPOI R1 R2 R3 R4 R5 R6 R7 R8 R9 R10 R111-HOUR EXPOSURESCritieria Air Contaminants (CACs)Carbon monoxide (CO) - - - - - - - - - - - -Nitrogen dioxide (NO2) - - - - - - - - - - - -Coarse Particulate Matter (PM10) - - - - - - - - - - - -Fine Particulate Matter (PM2.5) - - - - - - - - - - - -Sulphur Dioxide (SO2) - - - - - - - - - - - -Volatile Organic Chemicals (VOCs)Acetaldehyde - - - - - - - - - - - -Acetone - - - - - - - - - - - -Acrolein and related - - - - - - - - - - - -Aldehydes, other - - - - - - - - - - - -Aliphatic alcohols - - - - - - - - - - - -Alkanes/alkenes, other C1-4 - - - - - - - - - - - -Alkanes/alkenes, other C5-8 - - - - - - - - - - - -Alkanes/alkenes, other C>8-10 - - - - - - - - - - - -Alkanes/alkenes, other C>10-12 - - - - - - - - - - - -Alkanes/alkenes, other C>12-16 - - - - - - - - - - - -Benzene and related - - - - - - - - - - - -Butadiene, 1,3- - - - - - - - - - - - -Cycloalkanes and cycloalkenes - - - - - - - - - - - -Ethylbenzene and related - - - - - - - - - - - -Formaldehyde and related - - - - - - - - - - - -Hexane, n- - - - - - - - - - - - -Naphthalene and related - - - - - - - - - - - -Styrene - - - - - - - - - - - -Toluene and related - - - - - - - - - - - -Xylenes - - - - - - - - - - - -Polycyclic Aromatic Hydrocarbons (PAHs)Benzo(a)pyrene TEQ-Equivalents - - - - - - - - - - - -
COC
Values highlighted in orange are in excess of the acceptable CR of 1.0.- Indicates that an appropriate exposure limit (TRV) was not available for this chemical.
Page 1 of 3
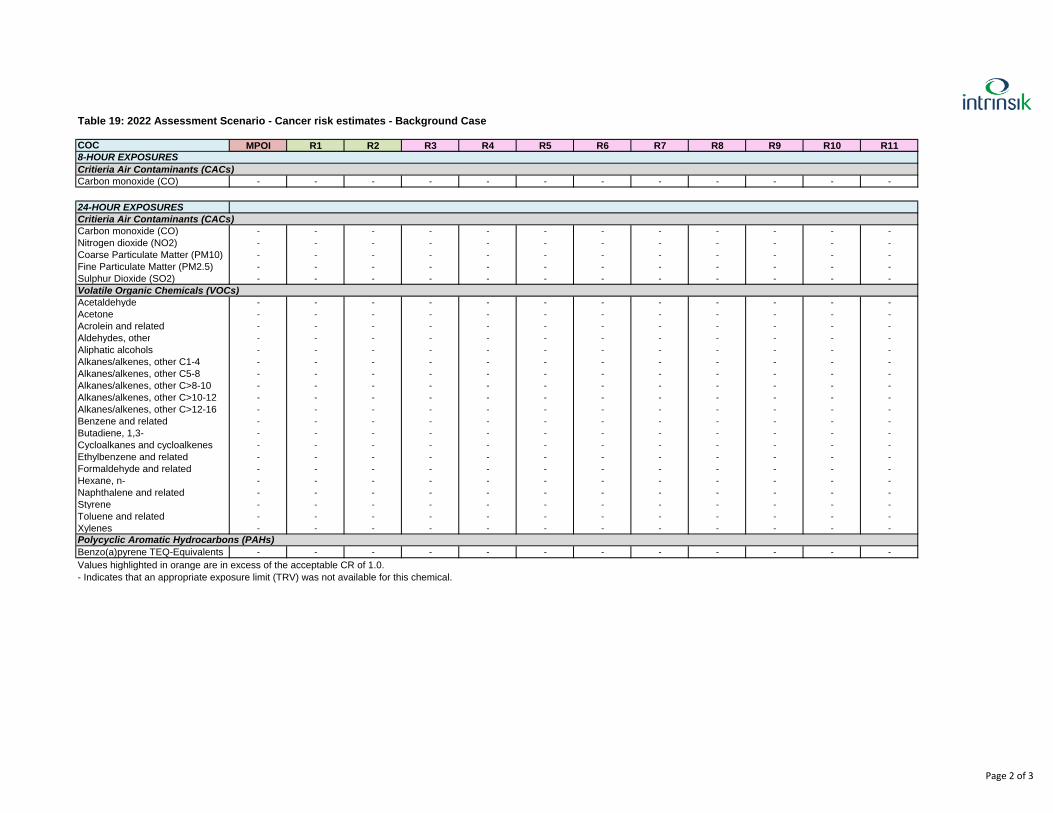
Table 19: 2022 Assessment Scenario - Cancer risk estimates - Background Case
MPOI R1 R2 R3 R4 R5 R6 R7 R8 R9 R10 R11COC
Critieria Air Contaminants (CACs)Carbon monoxide (CO) - - - - - - - - - - - -
24-HOUR EXPOSURESCritieria Air Contaminants (CACs)Carbon monoxide (CO) - - - - - - - - - - - -Nitrogen dioxide (NO2) - - - - - - - - - - - -Coarse Particulate Matter (PM10) - - - - - - - - - - - -Fine Particulate Matter (PM2.5) - - - - - - - - - - - -Sulphur Dioxide (SO2) - - - - - - - - - - - -Volatile Organic Chemicals (VOCs)Acetaldehyde - - - - - - - - - - - -Acetone - - - - - - - - - - - -Acrolein and related - - - - - - - - - - - -Aldehydes, other - - - - - - - - - - - -Aliphatic alcohols - - - - - - - - - - - -Alkanes/alkenes, other C1-4 - - - - - - - - - - - -Alkanes/alkenes, other C5-8 - - - - - - - - - - - -Alkanes/alkenes, other C>8-10 - - - - - - - - - - - -Alkanes/alkenes, other C>10-12 - - - - - - - - - - - -Alkanes/alkenes, other C>12-16 - - - - - - - - - - - -Benzene and related - - - - - - - - - - - -Butadiene, 1,3- - - - - - - - - - - - -Cycloalkanes and cycloalkenes - - - - - - - - - - - -Ethylbenzene and related - - - - - - - - - - - -Formaldehyde and related - - - - - - - - - - - -Hexane, n- - - - - - - - - - - - -Naphthalene and related - - - - - - - - - - - -Styrene - - - - - - - - - - - -Toluene and related - - - - - - - - - - - -Xylenes - - - - - - - - - - - -
Benzo(a)pyrene TEQ-Equivalents - - - - - - - - - - - -Polycyclic Aromatic Hydrocarbons (PAHs)
Values highlighted in orange are in excess of the acceptable CR of 1.0.- Indicates that an appropriate exposure limit (TRV) was not available for this chemical.
8-HOUR EXPOSURES
Page 2 of 3

Table 19: 2022 Assessment Scenario - Cancer risk estimates - Background Case
MPOI R1 R2 R3 R4 R5 R6 R7 R8 R9 R10 R11COCANNUAL AVERAGE EXPOSURESCritieria Air Contaminants (CACs)Carbon monoxide (CO) - - - - - - - - - - - -Nitrogen dioxide (NO2) - - - - - - - - - - - -Coarse Particulate Matter (PM10) - - - - - - - - - - - -Fine Particulate Matter (PM2.5) - - - - - - - - - - - -Sulphur Dioxide (SO2) - - - - - - - - - - - -Volatile Organic Chemicals (VOCs)Acetaldehyde 3.0E-07 2.6E-07 2.6E-07 2.5E-06 2.5E-06 2.5E-06 2.5E-06 2.5E-06 2.5E-06 2.5E-06 2.5E-06 2.5E-06Acetone - - - - - - - - - - - -Acrolein and related - - - - - - - - - - - -Aldehydes, other - - - - - - - - - - - -Aliphatic alcohols - - - - - - - - - - - -Alkanes/alkenes, other C1-4 - - - - - - - - - - - -Alkanes/alkenes, other C5-8 - - - - - - - - - - - -Alkanes/alkenes, other C>8-10 - - - - - - - - - - - -Alkanes/alkenes, other C>10-12 - - - - - - - - - - - -Alkanes/alkenes, other C>12-16 - - - - - - - - - - - -Benzene and related 2.1E-06 1.8E-06 1.8E-06 1.7E-05 1.7E-05 1.7E-05 1.7E-05 1.7E-05 1.7E-05 1.7E-05 1.7E-05 1.7E-05Butadiene, 1,3- 2.6E-09 2.2E-09 2.2E-09 2.1E-08 2.1E-08 2.1E-08 2.1E-08 2.1E-08 2.1E-08 2.1E-08 2.1E-08 2.1E-08Cycloalkanes and cycloalkenes - - - - - - - - - - - -Ethylbenzene and related - - - - - - - - - - - -Formaldehyde and related 1.1E-06 9.3E-07 9.3E-07 8.9E-06 8.9E-06 8.9E-06 8.9E-06 8.9E-06 8.9E-06 8.9E-06 8.9E-06 8.9E-06Hexane, n- - - - - - - - - - - - -Naphthalene and related - - - - - - - - - - - -Styrene - - - - - - - - - - - -Toluene and related - - - - - - - - - - - -Xylenes - - - - - - - - - - - -Polycyclic Aromatic Hydrocarbons (PAHs)Benzo(a)pyrene TEQ-Equivalents - - - - - - - - - - - -Values highlighted in orange are in excess of the acceptable CR of 1.0.- Indicates that an appropriate exposure limit (TRV) was not available for this chemical.
Page 3 of 3

Table 20: 2022 Assessment Scenario - Cancer risk estimates - Airport Case
MPOI R1 R2 R3 R4 R5 R6 R7 R8 R9 R10 R111-HOUR EXPOSURESCritieria Air Contaminants (CACs)Carbon monoxide (CO) - - - - - - - - - - - -Nitrogen dioxide (NO2) - - - - - - - - - - - -Coarse Particulate Matter (PM10) - - - - - - - - - - - -Fine Particulate Matter (PM2.5) - - - - - - - - - - - -Sulphur Dioxide (SO2) - - - - - - - - - - - -Volatile Organic Chemicals (VOCs)Acetaldehyde - - - - - - - - - - - -Acetone - - - - - - - - - - - -Acrolein and related - - - - - - - - - - - -Aldehydes, other - - - - - - - - - - - -Aliphatic alcohols - - - - - - - - - - - -Alkanes/alkenes, other C1-4 - - - - - - - - - - - -Alkanes/alkenes, other C5-8 - - - - - - - - - - - -Alkanes/alkenes, other C>8-10 - - - - - - - - - - - -Alkanes/alkenes, other C>10-12 - - - - - - - - - - - -Alkanes/alkenes, other C>12-16 - - - - - - - - - - - -Benzene and related - - - - - - - - - - - -Butadiene, 1,3- - - - - - - - - - - - -Cycloalkanes and cycloalkenes - - - - - - - - - - - -Ethylbenzene and related - - - - - - - - - - - -Formaldehyde and related - - - - - - - - - - - -Hexane, n- - - - - - - - - - - - -Naphthalene and related - - - - - - - - - - - -Styrene - - - - - - - - - - - -Toluene and related - - - - - - - - - - - -Xylenes - - - - - - - - - - - -Polycyclic Aromatic Hydrocarbons (PAHs)Benzo(a)pyrene TEQ-Equivalents - - - - - - - - - - - -
COC
Values highlighted in orange are in excess of the acceptable CR of 1.0.- Indicates that an appropriate exposure limit (TRV) was not available for this chemical.
Page 1 of 3

Table 20: 2022 Assessment Scenario - Cancer risk estimates - Airport Case
MPOI R1 R2 R3 R4 R5 R6 R7 R8 R9 R10 R11COC
Critieria Air Contaminants (CACs)Carbon monoxide (CO) - - - - - - - - - - - -
24-HOUR EXPOSURESCritieria Air Contaminants (CACs)Carbon monoxide (CO) - - - - - - - - - - - -Nitrogen dioxide (NO2) - - - - - - - - - - - -Coarse Particulate Matter (PM10) - - - - - - - - - - - -Fine Particulate Matter (PM2.5) - - - - - - - - - - - -Sulphur Dioxide (SO2) - - - - - - - - - - - -Volatile Organic Chemicals (VOCs)Acetaldehyde - - - - - - - - - - - -Acetone - - - - - - - - - - - -Acrolein and related - - - - - - - - - - - -Aldehydes, other - - - - - - - - - - - -Aliphatic alcohols - - - - - - - - - - - -Alkanes/alkenes, other C1-4 - - - - - - - - - - - -Alkanes/alkenes, other C5-8 - - - - - - - - - - - -Alkanes/alkenes, other C>8-10 - - - - - - - - - - - -Alkanes/alkenes, other C>10-12 - - - - - - - - - - - -Alkanes/alkenes, other C>12-16 - - - - - - - - - - - -Benzene and related - - - - - - - - - - - -Butadiene, 1,3- - - - - - - - - - - - -Cycloalkanes and cycloalkenes - - - - - - - - - - - -Ethylbenzene and related - - - - - - - - - - - -Formaldehyde and related - - - - - - - - - - - -Hexane, n- - - - - - - - - - - - -Naphthalene and related - - - - - - - - - - - -Styrene - - - - - - - - - - - -Toluene and related - - - - - - - - - - - -Xylenes - - - - - - - - - - - -
Benzo(a)pyrene TEQ-Equivalents - - - - - - - - - - - -Polycyclic Aromatic Hydrocarbons (PAHs)
Values highlighted in orange are in excess of the acceptable CR of 1.0.- Indicates that an appropriate exposure limit (TRV) was not available for this chemical.
8-HOUR EXPOSURES
Page 2 of 3

Table 20: 2022 Assessment Scenario - Cancer risk estimates - Airport Case
MPOI R1 R2 R3 R4 R5 R6 R7 R8 R9 R10 R11COCANNUAL AVERAGE EXPOSURESCritieria Air Contaminants (CACs)Carbon monoxide (CO) - - - - - - - - - - - -Nitrogen dioxide (NO2) - - - - - - - - - - - -Coarse Particulate Matter (PM10) - - - - - - - - - - - -Fine Particulate Matter (PM2.5) - - - - - - - - - - - -Sulphur Dioxide (SO2) - - - - - - - - - - - -Volatile Organic Chemicals (VOCs)Acetaldehyde 8.2E-08 6.6E-08 4.8E-08 1.5E-07 7.1E-08 4.2E-08 1.4E-08 1.8E-07 3.5E-08 4.2E-08 2.0E-08 1.2E-08Acetone - - - - - - - - - - - -Acrolein and related - - - - - - - - - - - -Aldehydes, other - - - - - - - - - - - -Aliphatic alcohols - - - - - - - - - - - -Alkanes/alkenes, other C1-4 - - - - - - - - - - - -Alkanes/alkenes, other C5-8 - - - - - - - - - - - -Alkanes/alkenes, other C>8-10 - - - - - - - - - - - -Alkanes/alkenes, other C>10-12 - - - - - - - - - - - -Alkanes/alkenes, other C>12-16 - - - - - - - - - - - -Benzene and related 4.8E-07 3.9E-07 2.8E-07 9.0E-07 4.1E-07 2.5E-07 8.1E-08 1.0E-06 2.1E-07 2.4E-07 1.2E-07 7.1E-08Butadiene, 1,3- 5.9E-09 4.8E-09 3.5E-09 1.1E-08 5.1E-09 3.1E-09 1.0E-09 1.3E-08 2.5E-09 3.0E-09 1.5E-09 8.8E-10Cycloalkanes and cycloalkenes - - - - - - - - - - - -Ethylbenzene and related - - - - - - - - - - - -Formaldehyde and related 6.7E-07 5.4E-07 3.9E-07 1.3E-06 5.8E-07 3.4E-07 1.1E-07 1.5E-06 2.9E-07 3.4E-07 1.7E-07 9.9E-08Hexane, n- - - - - - - - - - - - -Naphthalene and related - - - - - - - - - - - -Styrene - - - - - - - - - - - -Toluene and related - - - - - - - - - - - -Xylenes - - - - - - - - - - - -Polycyclic Aromatic Hydrocarbons (PAHs)Benzo(a)pyrene TEQ-Equivalents 3.7E-07 2.2E-07 1.8E-07 5.0E-07 2.6E-07 1.5E-07 4.9E-08 4.5E-07 1.1E-07 1.5E-07 7.7E-08 4.4E-08Values highlighted in orange are in excess of the acceptable CR of 1.0.- Indicates that an appropriate exposure limit (TRV) was not available for this chemical.
Page 3 of 3

Table 21: 2022 Assessment Scenario - Cancer risk estimates - Cumulative Case
MPOI R1 R2 R3 R4 R5 R6 R7 R8 R9 R10 R111-HOUR EXPOSURESCritieria Air Contaminants (CACs)Carbon monoxide (CO) - - - - - - - - - - - -Nitrogen dioxide (NO2) - - - - - - - - - - - -Coarse Particulate Matter (PM10) - - - - - - - - - - - -Fine Particulate Matter (PM2.5) - - - - - - - - - - - -Sulphur Dioxide (SO2) - - - - - - - - - - - -Volatile Organic Chemicals (VOCs)Acetaldehyde - - - - - - - - - - - -Acetone - - - - - - - - - - - -Acrolein and related - - - - - - - - - - - -Aldehydes, other - - - - - - - - - - - -Aliphatic alcohols - - - - - - - - - - - -Alkanes/alkenes, other C1-4 - - - - - - - - - - - -Alkanes/alkenes, other C5-8 - - - - - - - - - - - -Alkanes/alkenes, other C>8-10 - - - - - - - - - - - -Alkanes/alkenes, other C>10-12 - - - - - - - - - - - -Alkanes/alkenes, other C>12-16 - - - - - - - - - - - -Benzene and related - - - - - - - - - - - -Butadiene, 1,3- - - - - - - - - - - - -Cycloalkanes and cycloalkenes - - - - - - - - - - - -Ethylbenzene and related - - - - - - - - - - - -Formaldehyde and related - - - - - - - - - - - -Hexane, n- - - - - - - - - - - - -Naphthalene and related - - - - - - - - - - - -Styrene - - - - - - - - - - - -Toluene and related - - - - - - - - - - - -Xylenes - - - - - - - - - - - -Polycyclic Aromatic Hydrocarbons (PAHs)Benzo(a)pyrene TEQ-Equivalents - - - - - - - - - - - -
COC
Values highlighted in orange are in excess of the acceptable CR of 1.0.- Indicates that an appropriate exposure limit (TRV) was not available for this chemical.
Page 1 of 3

Table 21: 2022 Assessment Scenario - Cancer risk estimates - Cumulative Case
MPOI R1 R2 R3 R4 R5 R6 R7 R8 R9 R10 R11COC
Critieria Air Contaminants (CACs)Carbon monoxide (CO) - - - - - - - - - - - -
24-HOUR EXPOSURESCritieria Air Contaminants (CACs)Carbon monoxide (CO) - - - - - - - - - - - -Nitrogen dioxide (NO2) - - - - - - - - - - - -Coarse Particulate Matter (PM10) - - - - - - - - - - - -Fine Particulate Matter (PM2.5) - - - - - - - - - - - -Sulphur Dioxide (SO2) - - - - - - - - - - - -Volatile Organic Chemicals (VOCs)Acetaldehyde - - - - - - - - - - - -Acetone - - - - - - - - - - - -Acrolein and related - - - - - - - - - - - -Aldehydes, other - - - - - - - - - - - -Aliphatic alcohols - - - - - - - - - - - -Alkanes/alkenes, other C1-4 - - - - - - - - - - - -Alkanes/alkenes, other C5-8 - - - - - - - - - - - -Alkanes/alkenes, other C>8-10 - - - - - - - - - - - -Alkanes/alkenes, other C>10-12 - - - - - - - - - - - -Alkanes/alkenes, other C>12-16 - - - - - - - - - - - -Benzene and related - - - - - - - - - - - -Butadiene, 1,3- - - - - - - - - - - - -Cycloalkanes and cycloalkenes - - - - - - - - - - - -Ethylbenzene and related - - - - - - - - - - - -Formaldehyde and related - - - - - - - - - - - -Hexane, n- - - - - - - - - - - - -Naphthalene and related - - - - - - - - - - - -Styrene - - - - - - - - - - - -Toluene and related - - - - - - - - - - - -Xylenes - - - - - - - - - - - -
Benzo(a)pyrene TEQ-Equivalents - - - - - - - - - - - -Polycyclic Aromatic Hydrocarbons (PAHs)
Values highlighted in orange are in excess of the acceptable CR of 1.0.- Indicates that an appropriate exposure limit (TRV) was not available for this chemical.
8-HOUR EXPOSURES
Page 2 of 3

Table 21: 2022 Assessment Scenario - Cancer risk estimates - Cumulative Case
MPOI R1 R2 R3 R4 R5 R6 R7 R8 R9 R10 R11COCANNUAL AVERAGE EXPOSURESCritieria Air Contaminants (CACs)Carbon monoxide (CO) - - - - - - - - - - - -Nitrogen dioxide (NO2) - - - - - - - - - - - -Coarse Particulate Matter (PM10) - - - - - - - - - - - -Fine Particulate Matter (PM2.5) - - - - - - - - - - - -Sulphur Dioxide (SO2) - - - - - - - - - - - -Volatile Organic Chemicals (VOCs)Acetaldehyde 3.8E-07 3.3E-07 3.1E-07 2.6E-06 2.6E-06 2.5E-06 2.5E-06 2.7E-06 2.5E-06 2.5E-06 2.5E-06 2.5E-06Acetone - - - - - - - - - - - -Acrolein and related - - - - - - - - - - - -Aldehydes, other - - - - - - - - - - - -Aliphatic alcohols - - - - - - - - - - - -Alkanes/alkenes, other C1-4 - - - - - - - - - - - -Alkanes/alkenes, other C5-8 - - - - - - - - - - - -Alkanes/alkenes, other C>8-10 - - - - - - - - - - - -Alkanes/alkenes, other C>10-12 - - - - - - - - - - - -Alkanes/alkenes, other C>12-16 - - - - - - - - - - - -Benzene and related 2.6E-06 2.2E-06 2.1E-06 1.8E-05 1.8E-05 1.8E-05 1.8E-05 1.8E-05 1.8E-05 1.8E-05 1.8E-05 1.8E-05Butadiene, 1,3- 8.5E-09 7.0E-09 5.7E-09 3.3E-08 2.7E-08 2.4E-08 2.2E-08 3.4E-08 2.4E-08 2.4E-08 2.3E-08 2.2E-08Cycloalkanes and cycloalkenes - - - - - - - - - - - -Ethylbenzene and related - - - - - - - - - - - -Formaldehyde and related 1.7E-06 1.5E-06 1.3E-06 1.0E-05 9.5E-06 9.2E-06 9.0E-06 1.0E-05 9.2E-06 9.2E-06 9.1E-06 9.0E-06Hexane, n- - - - - - - - - - - - -Naphthalene and related - - - - - - - - - - - -Styrene - - - - - - - - - - - -Toluene and related - - - - - - - - - - - -Xylenes - - - - - - - - - - - -Polycyclic Aromatic Hydrocarbons (PAHs)Benzo(a)pyrene TEQ-Equivalents - - - - - - - - - - - -Values highlighted in orange are in excess of the acceptable CR of 1.0.- Indicates that an appropriate exposure limit (TRV) was not available for this chemical.
Page 3 of 3

Table 22: 2032 Assessment Scenario - Non-cancer risk estimates - Background Case
P R1 R2 R3 R4 R5 R6 R7 R8 R9 R10 R111-HOUR EXPOSURESCritieria Air Contaminants (CACs)Carbon monoxide (CO) 9.6E-02 1.0E-01 1.8E-01 1.2E-01 8.4E-02 1.2E-01 9.4E-02 7.2E-02 8.4E-02 8.6E-02 1.2E-01Nitrogen dioxide (NO2) 1.0E+00 1.0E+00 1.1E+00 9.4E-01 9.6E-01 9.9E-01 1.4E+00 9.7E-01 9.5E-01 9.5E-01 9.9E-01Coarse Particulate Matter (PM10) - - - - - - - - - - - -Fine Particulate Matter (PM2.5) - - - - - - - - - - - -Sulphur Dioxide (SO2) 1.4E+00 1.4E+00 1.6E+00 1.5E+00 1.9E+00 1.1E+00 2.2E+00 2.4E+00 2.4E+00 1.1E+00 6.6E-01Volatile Organic Chemicals (VOCs)Acetaldehyde 1.4E-02 1.4E-02 1.4E-02 1.4E-02 1.4E-02 1.4E-02 1.4E-02 1.4E-02 1.4E-02 1.4E-02 1.4E-02Acetone 5.0E-04 5.0E-04 5.0E-04 5.0E-04 5.0E-04 5.0E-04 5.0E-04 5.0E-04 5.0E-04 5.0E-04 5.0E-04Acrolein and related 1.3E-01 1.3E-01 1.3E-01 1.3E-01 1.3E-01 1.3E-01 1.3E-01 1.3E-01 1.3E-01 1.3E-01 1.3E-01Aldehydes, other 3.9E-03 3.9E-03 3.9E-03 3.9E-03 3.9E-03 3.9E-03 3.9E-03 3.9E-03 3.9E-03 3.9E-03 3.9E-03Aliphatic alcohols - - - - - - - - - - - -Alkanes/alkenes, other C1-4 1.8E-03 1.8E-03 1.8E-03 1.8E-03 1.8E-03 1.8E-03 1.8E-03 1.8E-03 1.8E-03 1.8E-03 1.8E-03Alkanes/alkenes, other C5-8 5.3E-05 5.3E-05 5.3E-05 5.3E-05 5.3E-05 5.3E-05 5.3E-05 5.3E-05 5.3E-05 5.3E-05 5.3E-05Alkanes/alkenes, other C>8-10 1.6E-05 1.6E-05 1.6E-05 1.6E-05 1.6E-05 1.6E-05 1.6E-05 1.6E-05 1.6E-05 1.6E-05 1.6E-05Alkanes/alkenes, other C>10-12 - - - - - - - - - - - -Alkanes/alkenes, other C>12-16 - - - - - - - - - - - -Benzene and related 7.6E-02 7.6E-02 7.6E-02 7.6E-02 7.6E-02 7.6E-02 7.6E-02 7.6E-02 7.6E-02 7.6E-02 7.6E-02Butadiene, 1,3- 3.2E-04 3.2E-04 3.2E-04 3.2E-04 3.2E-04 3.2E-04 3.2E-04 3.2E-04 3.2E-04 3.2E-04 3.2E-04Cycloalkanes and cycloalkenes - - - - - - - - - - - -Ethylbenzene and related 3.1E-05 3.1E-05 3.1E-05 3.1E-05 3.1E-05 3.1E-05 3.1E-05 3.1E-05 3.1E-05 3.1E-05 3.1E-05Formaldehyde and related 1.8E-01 1.8E-01 1.8E-01 1.8E-01 1.8E-01 1.8E-01 1.8E-01 1.8E-01 1.8E-01 1.8E-01 1.8E-01Hexane, n- - - - - - - - - - - - -Naphthalene and related - - - - - - - - - - - -Styrene 1.4E-05 1.4E-05 1.4E-05 1.4E-05 1.4E-05 1.4E-05 1.4E-05 1.4E-05 1.4E-05 1.4E-05 1.4E-05Toluene and related 4.2E-04 4.2E-04 4.2E-04 4.2E-04 4.2E-04 4.2E-04 4.2E-04 4.2E-04 4.2E-04 4.2E-04 4.2E-04Xylenes 3.4E-04 3.4E-04 3.4E-04 3.4E-04 3.4E-04 3.4E-04 3.4E-04 3.4E-04 3.4E-04 3.4E-04 3.4E-04Polycyclic Aromatic Hydrocarbons (PAHs)Benzo(a)pyrene TEQ-Equivalents - - - - - - - - - - - -
COC
Values highlighted in orange are in excess of the acceptable CR of 1.0.- Indicates that an appropriate exposure limit (TRV) was not available for this chemical.
Page 1 of 3

Table 22: 2032 Assessment Scenario - Non-cancer risk estimates - Background Case
P R1 R2 R3 R4 R5 R6 R7 R8 R9 R10 R11COC8-HOUR EXPOSURESCritieria Air Contaminants (CACs)Carbon monoxide (CO) 3.7E-01 4.2E-01 6.6E-01 4.7E-01 3.2E-01 5.1E-01 2.3E-01 2.6E-01 4.3E-01 3.5E-01 5.2E-01
24-HOUR EXPOSURESCritieria Air Contaminants (CACs)Carbon monoxide (CO) - - - - - - - - - - - -Nitrogen dioxide (NO2) 2.4E-01 2.5E-01 2.8E-01 2.2E-01 2.1E-01 2.9E-01 3.8E-01 2.5E-01 2.3E-01 2.4E-01 2.9E-01Coarse Particulate Matter (PM10) 2.9E+00 3.3E+00 2.8E+00 2.2E+00 1.9E+00 1.4E+00 2.2E+00 2.3E+00 2.0E+00 2.0E+00 1.5E+00Fine Particulate Matter (PM2.5) 1.6E+00 1.8E+00 1.7E+00 1.3E+00 1.3E+00 1.2E+00 1.9E+00 1.6E+00 1.4E+00 1.4E+00 1.0E+00Sulphur Dioxide (SO2) 1.1E-01 1.0E-01 1.3E-01 1.3E-01 2.1E-01 1.0E-01 2.4E-01 2.4E-01 2.0E-01 8.7E-02 6.9E-02Volatile Organic Chemicals (VOCs)Acetaldehyde 5.4E-03 5.4E-03 5.4E-03 5.4E-03 5.4E-03 5.4E-03 5.4E-03 5.4E-03 5.4E-03 5.4E-03 5.4E-03Acetone 4.5E-04 4.5E-04 4.5E-04 4.5E-04 4.5E-04 4.5E-04 4.5E-04 4.5E-04 4.5E-04 4.5E-04 4.5E-04Acrolein and related 3.2E-01 3.2E-01 3.2E-01 3.2E-01 3.2E-01 3.2E-01 3.2E-01 3.2E-01 3.2E-01 3.2E-01 3.2E-01Aldehydes, other - - - - - - - - - - - -Aliphatic alcohols - - - - - - - - - - - -Alkanes/alkenes, other C1-4 6.2E-03 6.2E-03 6.2E-03 6.2E-03 6.2E-03 6.2E-03 6.2E-03 6.2E-03 6.2E-03 6.2E-03 6.2E-03Alkanes/alkenes, other C5-8 1.7E-03 1.7E-03 1.7E-03 1.7E-03 1.7E-03 1.7E-03 1.7E-03 1.7E-03 1.7E-03 1.7E-03 1.7E-03Alkanes/alkenes, other C>8-10 6.7E-06 6.7E-06 6.7E-06 6.7E-06 6.7E-06 6.7E-06 6.7E-06 6.7E-06 6.7E-06 6.7E-06 6.7E-06Alkanes/alkenes, other C>10-12 - - - - - - - - - - - -Alkanes/alkenes, other C>12-16 - - - - - - - - - - - -Benzene and related 2.9E-02 2.9E-02 2.9E-02 2.9E-02 2.9E-02 2.9E-02 2.9E-02 2.9E-02 2.9E-02 2.9E-02 2.9E-02Butadiene, 1,3- 5.8E-03 5.8E-03 5.8E-03 5.8E-03 5.8E-03 5.8E-03 5.8E-03 5.8E-03 5.8E-03 5.8E-03 5.8E-03Cycloalkanes and cycloalkenes 6.4E-05 6.4E-05 6.4E-05 6.4E-05 6.4E-05 6.4E-05 6.4E-05 6.4E-05 6.4E-05 6.4E-05 6.4E-05Ethylbenzene and related 1.1E-03 1.1E-03 1.1E-03 1.1E-03 1.1E-03 1.1E-03 1.1E-03 1.1E-03 1.1E-03 1.1E-03 1.1E-03Formaldehyde and related 5.6E-02 5.6E-02 5.6E-02 5.6E-02 5.6E-02 5.6E-02 5.6E-02 5.6E-02 5.6E-02 5.6E-02 5.6E-02Hexane, n- 1.4E-04 1.4E-04 1.4E-04 1.4E-04 1.4E-04 1.4E-04 1.4E-04 1.4E-04 1.4E-04 1.4E-04 1.4E-04Naphthalene and related 3.9E-03 3.9E-03 3.9E-03 3.9E-03 3.9E-03 3.9E-03 3.9E-03 3.9E-03 3.9E-03 3.9E-03 3.9E-03Styrene 3.0E-04 3.0E-04 3.0E-04 3.0E-04 3.0E-04 3.0E-04 3.0E-04 3.0E-04 3.0E-04 3.0E-04 3.0E-04Toluene and related 6.7E-04 6.7E-04 6.7E-04 6.7E-04 6.7E-04 6.7E-04 6.7E-04 6.7E-04 6.7E-04 6.7E-04 6.7E-04Xylenes 1.4E-03 1.4E-03 1.4E-03 1.4E-03 1.4E-03 1.4E-03 1.4E-03 1.4E-03 1.4E-03 1.4E-03 1.4E-03Polycyclic Aromatic Hydrocarbons (PAHs)Benzo(a)pyrene TEQ-Equivalents - - - - - - - - - - - -
Values highlighted in orange are in excess of the acceptable CR of 1.0.- Indicates that an appropriate exposure limit (TRV) was not available for this chemical.
Page 2 of 3

Table 22: 2032 Assessment Scenario - Non-cancer risk estimates - Background Case
P R1 R2 R3 R4 R5 R6 R7 R8 R9 R10 R11COCANNUAL AVERAGE EXPOSURESCritieria Air Contaminants (CACs)Carbon monoxide (CO) - - - - - - - - - - - -Nitrogen dioxide (NO2) 8.9E-02 8.9E-02 5.5E-01 3.5E-01 3.3E-01 4.3E-01 4.3E-01 3.5E-01 3.3E-01 3.5E-01 4.3E-01Coarse Particulate Matter (PM10) 4.4E-01 4.8E-01 1.8E+00 1.4E+00 1.1E+00 8.5E-01 1.2E+00 1.2E+00 1.3E+00 1.2E+00 7.5E-01Fine Particulate Matter (PM2.5) 3.0E-01 3.0E-01 1.4E+00 1.0E+00 9.1E-01 9.1E-01 1.1E+00 1.1E+00 1.0E+00 1.0E+00 6.8E-01Sulphur Dioxide (SO2) 3.0E-02 3.0E-02 1.4E-01 1.5E-01 1.9E-01 1.1E-01 2.3E-01 3.1E-01 2.1E-01 9.7E-02 6.9E-02Volatile Organic Chemicals (VOCs)Acetaldehyde 1.6E-03 1.6E-03 6.6E-03 6.6E-03 6.6E-03 6.6E-03 6.6E-03 6.6E-03 6.6E-03 6.6E-03 6.6E-03Acetone 3.8E-05 3.8E-05 1.6E-04 1.6E-04 1.6E-04 1.6E-04 1.6E-04 1.6E-04 1.6E-04 1.6E-04 1.6E-04Acrolein and related 4.0E-01 4.0E-01 1.7E+00 1.7E+00 1.7E+00 1.7E+00 1.7E+00 1.7E+00 1.7E+00 1.7E+00 1.7E+00Aldehydes, other 2.5E-02 2.5E-02 1.0E-01 1.0E-01 1.0E-01 1.0E-01 1.0E-01 1.0E-01 1.0E-01 1.0E-01 1.0E-01Aliphatic alcohols - - - - - - - - - - - -Alkanes/alkenes, other C1-4 1.1E-03 1.1E-03 4.7E-03 4.7E-03 4.7E-03 4.7E-03 4.7E-03 4.7E-03 4.7E-03 4.7E-03 4.7E-03Alkanes/alkenes, other C5-8 3.4E-05 3.4E-05 1.4E-04 1.4E-04 1.4E-04 1.4E-04 1.4E-04 1.4E-04 1.4E-04 1.4E-04 1.4E-04Alkanes/alkenes, other C>8-10 3.5E-05 3.5E-05 1.5E-04 1.5E-04 1.5E-04 1.5E-04 1.5E-04 1.5E-04 1.5E-04 1.5E-04 1.5E-04Alkanes/alkenes, other C>10-12 2.8E-05 2.8E-05 1.2E-04 1.2E-04 1.2E-04 1.2E-04 1.2E-04 1.2E-04 1.2E-04 1.2E-04 1.2E-04Alkanes/alkenes, other C>12-16 - - - - - - - - - - - -Benzene and related 4.8E-02 4.8E-02 2.0E-01 2.0E-01 2.0E-01 2.0E-01 2.0E-01 2.0E-01 2.0E-01 2.0E-01 2.0E-01Butadiene, 1,3- 5.1E-03 5.1E-03 2.1E-02 2.1E-02 2.1E-02 2.1E-02 2.1E-02 2.1E-02 2.1E-02 2.1E-02 2.1E-02Cycloalkanes and cycloalkenes 9.7E-06 9.7E-06 4.1E-05 4.1E-05 4.1E-05 4.1E-05 4.1E-05 4.1E-05 4.1E-05 4.1E-05 4.1E-05Ethylbenzene and related 4.2E-04 4.2E-04 1.8E-03 1.8E-03 1.8E-03 1.8E-03 1.8E-03 1.8E-03 1.8E-03 1.8E-03 1.8E-03Formaldehyde and related 3.9E-02 3.9E-02 1.6E-01 1.6E-01 1.6E-01 1.6E-01 1.6E-01 1.6E-01 1.6E-01 1.6E-01 1.6E-01Hexane, n- 8.2E-05 8.2E-05 3.4E-04 3.4E-04 3.4E-04 3.4E-04 3.4E-04 3.4E-04 3.4E-04 3.4E-04 3.4E-04Naphthalene and related 2.5E-03 2.5E-03 1.0E-02 1.0E-02 1.0E-02 1.0E-02 1.0E-02 1.0E-02 1.0E-02 1.0E-02 1.0E-02Styrene 1.3E-05 1.3E-05 5.5E-05 5.5E-05 5.5E-05 5.5E-05 5.5E-05 5.5E-05 5.5E-05 5.5E-05 5.5E-05Toluene and related 5.0E-05 5.0E-05 2.1E-04 2.1E-04 2.1E-04 2.1E-04 2.1E-04 2.1E-04 2.1E-04 2.1E-04 2.1E-04Xylenes 1.2E-03 1.2E-03 5.2E-03 5.2E-03 5.2E-03 5.2E-03 5.2E-03 5.2E-03 5.2E-03 5.2E-03 5.2E-03Polycyclic Aromatic Hydrocarbons (PAHs)Benzo(a)pyrene TEQ-Equivalents - - - - - - - - - - - -
Values highlighted in orange are in excess of the acceptable CR of 1.0.- Indicates that an appropriate exposure limit (TRV) was not available for this chemical.
Page 3 of 3

Table 23: 2032 Assessment Scenario - Non-cancer risk estimates - Airport Case
P MPOI R1 R2 R3 R4 R5 R6 R7 R8 R9 R10 R111-HOUR EXPOSURESCritieria Air Contaminants (CACs)Carbon monoxide (CO) 2.4E-01 1.3E-01 1.8E-01 7.1E-02 4.2E-02 3.4E-02 2.1E-02 6.6E-02 3.2E-02 3.5E-02 1.8E-02 2.0E-02Nitrogen dioxide (NO2) 1.8E+00 9.8E-01 1.0E+00 7.5E-01 8.4E-01 5.2E-01 6.5E-01 1.0E+00 7.6E-01 4.6E-01 6.1E-01 6.5E-01Coarse Particulate Matter (PM10) - - - - - - - - - - - - -Fine Particulate Matter (PM2.5) - - - - - - - - - - - - -Sulphur Dioxide (SO2) 2.0E+00 9.6E-01 1.2E+00 7.5E-01 4.4E-01 3.7E-01 1.5E-01 6.4E-01 3.7E-01 4.6E-01 1.8E-01 1.5E-01Volatile Organic Chemicals (VOCs)Acetaldehyde 7.6E-02 4.4E-02 5.1E-02 2.6E-02 1.7E-02 1.4E-02 6.2E-03 2.9E-02 1.3E-02 1.6E-02 6.8E-03 6.0E-03Acetone 1.2E-04 6.7E-05 7.7E-05 4.0E-05 2.7E-05 2.2E-05 9.5E-06 4.4E-05 2.0E-05 2.5E-05 1.0E-05 9.2E-06Acrolein and related 9.4E+00 5.4E+00 6.2E+00 3.2E+00 2.2E+00 1.8E+00 7.7E-01 3.5E+00 1.6E+00 2.0E+00 8.4E-01 7.4E-01Aldehydes, other 1.3E-02 7.6E-03 8.8E-03 4.6E-03 3.0E-03 2.5E-03 1.1E-03 5.0E-03 2.3E-03 2.9E-03 1.2E-03 1.1E-03Aliphatic alcohols - 6.6E-03 3.8E-03 4.4E-03 2.3E-03 1.5E-03 1.2E-03 5.4E-04 2.5E-03 1.1E-03 1.4E-03 5.9E-04 5.2E-04Alkanes/alkenes, other C1-4 7.6E-03 4.4E-03 5.1E-03 2.6E-03 1.8E-03 1.4E-03 6.2E-04 2.9E-03 1.3E-03 1.6E-03 6.8E-04 6.0E-04Alkanes/alkenes, other C5-8 2.4E-04 1.4E-04 1.6E-04 8.1E-05 5.4E-05 4.4E-05 1.9E-05 8.9E-05 4.1E-05 5.1E-05 2.1E-05 1.9E-05Alkanes/alkenes, other C>8-10 2.8E-03 1.6E-03 1.9E-03 9.7E-04 6.5E-04 5.3E-04 2.3E-04 1.1E-03 4.9E-04 6.1E-04 2.5E-04 2.2E-04Alkanes/alkenes, other C>10-12 - - - - - - - - - - - - -Alkanes/alkenes, other C>12-16 - - - - - - - - - - - - -Benzene and related 7.1E-01 4.1E-01 4.7E-01 2.4E-01 1.6E-01 1.3E-01 5.8E-02 2.7E-01 1.2E-01 1.5E-01 6.3E-02 5.6E-02Butadiene, 1,3- 2.1E-02 1.2E-02 1.4E-02 7.3E-03 4.9E-03 4.0E-03 1.7E-03 8.0E-03 3.7E-03 4.6E-03 1.9E-03 1.7E-03Cycloalkanes and cycloalkenes - - - - - - - - - - - - -Ethylbenzene and related 1.7E-04 9.8E-05 1.1E-04 5.9E-05 3.9E-05 3.2E-05 1.4E-05 6.4E-05 3.0E-05 3.7E-05 1.5E-05 1.4E-05Formaldehyde and related 2.6E+00 1.5E+00 1.7E+00 9.0E-01 6.0E-01 4.9E-01 2.2E-01 9.9E-01 4.5E-01 5.7E-01 2.3E-01 2.1E-01Hexane, n- - - - - - - - - - - - - -Naphthalene and related - - - - - - - - - - - - -Styrene 1.2E-04 6.9E-05 8.0E-05 4.1E-05 2.8E-05 2.2E-05 9.8E-06 4.5E-05 2.1E-05 2.6E-05 1.1E-05 9.5E-06Toluene and related 5.3E-04 3.0E-04 3.5E-04 1.8E-04 1.2E-04 9.9E-05 4.3E-05 2.0E-04 9.1E-05 1.1E-04 4.7E-05 4.2E-05Xylenes 6.0E-04 3.5E-04 4.0E-04 2.1E-04 1.4E-04 1.1E-04 4.9E-05 2.3E-04 1.0E-04 1.3E-04 5.3E-05 4.8E-05Polycyclic Aromatic Hydrocarbons (PAHs)Benzo(a)pyrene TEQ-Equivalents - - - - - - - - - - - - -
COC
Values highlighted in orange are in excess of the acceptable CR of 1.0.- Indicates that an appropriate exposure limit (TRV) was not available for this chemical.
Page 1 of 3

Table 23: 2032 Assessment Scenario - Non-cancer risk estimates - Airport Case
P MPOI R1 R2 R3 R4 R5 R6 R7 R8 R9 R10 R11COC8-HOUR EXPOSURESCritieria Air Contaminants (CACs)Carbon monoxide (CO) 4.8E-01 2.4E-01 3.0E-01 9.9E-02 4.2E-02 3.8E-02 1.9E-02 1.1E-01 3.5E-02 4.1E-02 1.8E-02 1.8E-02
24-HOUR EXPOSURESCritieria Air Contaminants (CACs)Carbon monoxide (CO) - - - - - - - - - - - - -Nitrogen dioxide (NO2) 2.3E-01 1.5E-01 1.5E-01 8.8E-02 7.1E-02 5.6E-02 4.9E-02 1.5E-01 7.5E-02 4.8E-02 3.4E-02 5.0E-02Coarse Particulate Matter (PM10) 2.3E-01 9.0E-02 1.2E-01 3.8E-02 1.9E-02 9.2E-03 8.9E-03 3.0E-02 1.8E-02 1.3E-02 5.6E-03 7.2E-03Fine Particulate Matter (PM2.5) 4.0E-01 1.4E-01 2.1E-01 6.9E-02 3.4E-02 1.6E-02 1.6E-02 5.2E-02 3.2E-02 2.2E-02 9.7E-03 1.3E-02Sulphur Dioxide (SO2) 1.8E-01 7.3E-02 6.5E-02 3.9E-02 3.1E-02 1.8E-02 5.2E-03 4.8E-02 1.3E-02 1.5E-02 7.3E-03 6.4E-03Volatile Organic Chemicals (VOCs)Acetaldehyde 6.9E-03 4.5E-03 3.8E-03 2.0E-03 1.5E-03 9.1E-04 2.8E-04 2.1E-03 5.9E-04 7.6E-04 3.8E-04 3.1E-04Acetone 2.4E-05 1.6E-05 1.3E-05 7.0E-06 5.4E-06 3.2E-06 9.8E-07 7.5E-06 2.1E-06 2.7E-06 1.4E-06 1.1E-06Acrolein and related 5.6E+00 3.7E+00 3.1E+00 1.6E+00 1.2E+00 7.4E-01 2.3E-01 1.7E+00 4.8E-01 6.2E-01 3.1E-01 2.6E-01Aldehydes, other - - - - - - - - - - - - -Aliphatic alcohols - 2.1E-03 1.3E-03 1.1E-03 6.0E-04 4.6E-04 2.7E-04 8.4E-05 6.4E-04 1.8E-04 2.3E-04 1.2E-04 9.4E-05Alkanes/alkenes, other C1-4 6.2E-03 4.1E-03 3.4E-03 1.8E-03 1.4E-03 8.2E-04 2.5E-04 1.9E-03 5.3E-04 6.9E-04 3.5E-04 2.8E-04Alkanes/alkenes, other C5-8 1.8E-03 1.2E-03 9.9E-04 5.2E-04 4.0E-04 2.4E-04 7.3E-05 5.6E-04 1.5E-04 2.0E-04 1.0E-04 8.3E-05Alkanes/alkenes, other C>8-10 2.7E-04 1.8E-04 1.5E-04 7.8E-05 6.0E-05 3.6E-05 1.1E-05 8.3E-05 2.3E-05 3.0E-05 1.5E-05 1.2E-05Alkanes/alkenes, other C>10-12 - - - - - - - - - - - - -Alkanes/alkenes, other C>12-16 - - - - - - - - - - - - -Benzene and related 6.3E-02 4.1E-02 3.5E-02 1.8E-02 1.4E-02 8.4E-03 2.6E-03 2.0E-02 5.4E-03 7.0E-03 3.5E-03 2.9E-03Butadiene, 1,3- 9.0E-02 5.9E-02 4.9E-02 2.6E-02 2.0E-02 1.2E-02 3.6E-03 2.8E-02 7.7E-03 9.9E-03 5.0E-03 4.1E-03Cycloalkanes and cycloalkenes 2.0E-05 1.3E-05 1.1E-05 5.9E-06 4.5E-06 2.7E-06 8.3E-07 6.3E-06 1.7E-06 2.3E-06 1.1E-06 9.3E-07Ethylbenzene and related 1.4E-03 9.2E-04 7.7E-04 4.1E-04 3.1E-04 1.9E-04 5.7E-05 4.3E-04 1.2E-04 1.6E-04 7.9E-05 6.4E-05Formaldehyde and related 1.9E-01 1.3E-01 1.1E-01 5.6E-02 4.3E-02 2.6E-02 7.8E-03 6.0E-02 1.7E-02 2.1E-02 1.1E-02 8.8E-03Hexane, n- 1.7E-05 1.1E-05 9.3E-06 4.9E-06 3.8E-06 2.2E-06 6.9E-07 5.2E-06 1.4E-06 1.9E-06 9.5E-07 7.7E-07Naphthalene and related 3.8E-02 2.5E-02 2.1E-02 1.1E-02 8.4E-03 5.0E-03 1.5E-03 1.2E-02 3.2E-03 4.2E-03 2.1E-03 1.7E-03Styrene 6.0E-04 3.9E-04 3.3E-04 1.7E-04 1.3E-04 8.0E-05 2.4E-05 1.9E-04 5.2E-05 6.7E-05 3.4E-05 2.8E-05Toluene and related 2.0E-04 1.3E-04 1.1E-04 5.8E-05 4.4E-05 2.6E-05 8.1E-06 6.2E-05 1.7E-05 2.2E-05 1.1E-05 9.1E-06Xylenes 5.9E-04 3.8E-04 3.2E-04 1.7E-04 1.3E-04 7.7E-05 2.4E-05 1.8E-04 5.0E-05 6.4E-05 3.3E-05 2.7E-05Polycyclic Aromatic Hydrocarbons (PAHs)Benzo(a)pyrene TEQ-Equivalents - - - - - - - - - - - - -
Values highlighted in orange are in excess of the acceptable CR of 1.0.- Indicates that an appropriate exposure limit (TRV) was not available for this chemical.
Page 2 of 3

Table 23: 2032 Assessment Scenario - Non-cancer risk estimates - Airport Case
P MPOI R1 R2 R3 R4 R5 R6 R7 R8 R9 R10 R11COCANNUAL AVERAGE EXPOSURESCritieria Air Contaminants (CACs)Carbon monoxide (CO) - - - - - - - - - - - - -Nitrogen dioxide (NO2) 6.3E-02 5.2E-02 4.3E-02 7.1E-02 5.0E-02 3.1E-02 1.2E-02 1.0E-01 2.1E-02 3.0E-02 1.7E-02 1.0E-02Coarse Particulate Matter (PM10) 1.2E-02 8.1E-03 6.0E-03 6.9E-03 3.6E-03 2.1E-03 6.8E-04 6.2E-03 1.5E-03 2.1E-03 1.1E-03 6.0E-04Fine Particulate Matter (PM2.5) 2.2E-02 1.4E-02 1.1E-02 1.4E-02 7.4E-03 4.3E-03 1.4E-03 1.3E-02 3.2E-03 4.4E-03 2.2E-03 1.2E-03Sulphur Dioxide (SO2) 3.2E-02 1.7E-02 1.5E-02 2.6E-02 1.3E-02 7.4E-03 2.6E-03 3.4E-02 6.2E-03 7.3E-03 3.8E-03 2.2E-03Volatile Organic Chemicals (VOCs)Acetaldehyde 6.0E-04 4.7E-04 3.4E-04 5.0E-04 2.3E-04 1.3E-04 4.4E-05 5.8E-04 1.1E-04 1.3E-04 6.6E-05 3.9E-05Acetone 4.4E-07 3.5E-07 2.5E-07 3.7E-07 1.7E-07 9.7E-08 3.3E-08 4.3E-07 8.2E-08 9.8E-08 4.9E-08 2.9E-08Acrolein and related 2.8E+00 2.2E+00 1.6E+00 2.3E+00 1.0E+00 6.1E-01 2.0E-01 2.7E+00 5.1E-01 6.1E-01 3.1E-01 1.8E-01Aldehydes, other 7.1E-03 5.5E-03 4.0E-03 5.8E-03 2.6E-03 1.5E-03 5.2E-04 6.8E-03 1.3E-03 1.5E-03 7.8E-04 4.5E-04Aliphatic alcohols - 5.1E-05 4.0E-05 2.9E-05 4.2E-05 1.9E-05 1.1E-05 3.7E-06 4.9E-05 9.3E-06 1.1E-05 5.6E-06 3.3E-06Alkanes/alkenes, other C1-4 2.0E-04 1.6E-04 1.2E-04 1.7E-04 7.6E-05 4.5E-05 1.5E-05 2.0E-04 3.7E-05 4.5E-05 2.2E-05 1.3E-05Alkanes/alkenes, other C5-8 6.1E-06 4.7E-06 3.5E-06 5.0E-06 2.3E-06 1.3E-06 4.5E-07 5.9E-06 1.1E-06 1.3E-06 6.7E-07 3.9E-07Alkanes/alkenes, other C>8-10 4.0E-04 3.1E-04 2.3E-04 3.3E-04 1.5E-04 8.7E-05 2.9E-05 3.9E-04 7.4E-05 8.8E-05 4.4E-05 2.6E-05Alkanes/alkenes, other C>10-12 1.8E-05 1.4E-05 1.0E-05 1.5E-05 6.7E-06 3.9E-06 1.3E-06 1.7E-05 3.3E-06 3.9E-06 2.0E-06 1.2E-06Alkanes/alkenes, other C>12-16 - 3.1E-05 2.4E-05 1.8E-05 2.6E-05 1.2E-05 6.9E-06 2.3E-06 3.0E-05 5.8E-06 6.9E-06 3.5E-06 2.0E-06Benzene and related 1.5E-02 1.2E-02 8.6E-03 1.2E-02 5.6E-03 3.3E-03 1.1E-03 1.5E-02 2.8E-03 3.3E-03 1.7E-03 9.7E-04Butadiene, 1,3- 1.7E-02 1.3E-02 9.4E-03 1.4E-02 6.2E-03 3.6E-03 1.2E-03 1.6E-02 3.0E-03 3.6E-03 1.8E-03 1.1E-03Cycloalkanes and cycloalkenes 5.1E-07 4.0E-07 2.9E-07 4.2E-07 1.9E-07 1.1E-07 3.8E-08 5.0E-07 9.4E-08 1.1E-07 5.6E-08 3.3E-08Ethylbenzene and related 1.3E-04 1.0E-04 7.6E-05 1.1E-04 5.0E-05 2.9E-05 9.8E-06 1.3E-04 2.5E-05 2.9E-05 1.5E-05 8.6E-06Formaldehyde and related 3.5E-02 2.7E-02 2.0E-02 2.8E-02 1.3E-02 7.5E-03 2.5E-03 3.3E-02 6.3E-03 7.6E-03 3.8E-03 2.2E-03Hexane, n- 1.6E-06 1.2E-06 8.9E-07 1.3E-06 5.8E-07 3.4E-07 1.1E-07 1.5E-06 2.9E-07 3.4E-07 1.7E-07 1.0E-07Naphthalene and related 5.6E-03 4.4E-03 3.2E-03 4.7E-03 2.1E-03 1.2E-03 4.2E-04 5.5E-03 1.0E-03 1.2E-03 6.2E-04 3.6E-04Styrene 1.3E-05 9.9E-06 7.2E-06 1.0E-05 4.7E-06 2.8E-06 9.3E-07 1.2E-05 2.3E-06 2.8E-06 1.4E-06 8.2E-07Toluene and related 3.7E-06 2.9E-06 2.1E-06 3.1E-06 1.4E-06 8.2E-07 2.8E-07 3.6E-06 6.9E-07 8.2E-07 4.1E-07 2.4E-07Xylenes 1.0E-04 8.2E-05 6.0E-05 8.7E-05 3.9E-05 2.3E-05 7.7E-06 1.0E-04 1.9E-05 2.3E-05 1.2E-05 6.8E-06Polycyclic Aromatic Hydrocarbons (PAHs)Benzo(a)pyrene TEQ-Equivalents - - - - - - - - - - - - -
Values highlighted in orange are in excess of the acceptable CR of 1.0.- Indicates that an appropriate exposure limit (TRV) was not available for this chemical.
Page 3 of 3
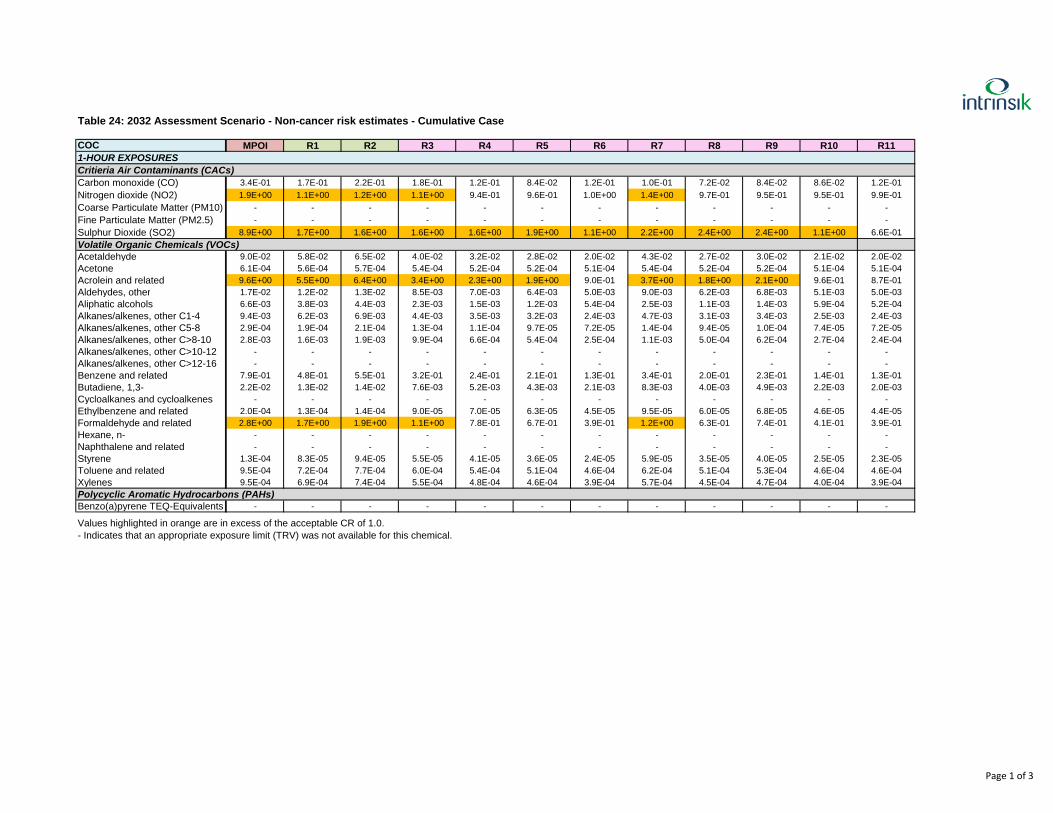
Table 24: 2032 Assessment Scenario - Non-cancer risk estimates - Cumulative Case
P MPOI R1 R2 R3 R4 R5 R6 R7 R8 R9 R10 R111-HOUR EXPOSURESCritieria Air Contaminants (CACs)Carbon monoxide (CO) 3.4E-01 1.7E-01 2.2E-01 1.8E-01 1.2E-01 8.4E-02 1.2E-01 1.0E-01 7.2E-02 8.4E-02 8.6E-02 1.2E-01Nitrogen dioxide (NO2) 1.9E+00 1.1E+00 1.2E+00 1.1E+00 9.4E-01 9.6E-01 1.0E+00 1.4E+00 9.7E-01 9.5E-01 9.5E-01 9.9E-01Coarse Particulate Matter (PM10) - - - - - - - - - - - - -Fine Particulate Matter (PM2.5) - - - - - - - - - - - - -Sulphur Dioxide (SO2) 8.9E+00 1.7E+00 1.6E+00 1.6E+00 1.6E+00 1.9E+00 1.1E+00 2.2E+00 2.4E+00 2.4E+00 1.1E+00 6.6E-01Volatile Organic Chemicals (VOCs)Acetaldehyde 9.0E-02 5.8E-02 6.5E-02 4.0E-02 3.2E-02 2.8E-02 2.0E-02 4.3E-02 2.7E-02 3.0E-02 2.1E-02 2.0E-02Acetone 6.1E-04 5.6E-04 5.7E-04 5.4E-04 5.2E-04 5.2E-04 5.1E-04 5.4E-04 5.2E-04 5.2E-04 5.1E-04 5.1E-04Acrolein and related 9.6E+00 5.5E+00 6.4E+00 3.4E+00 2.3E+00 1.9E+00 9.0E-01 3.7E+00 1.8E+00 2.1E+00 9.6E-01 8.7E-01Aldehydes, other 1.7E-02 1.2E-02 1.3E-02 8.5E-03 7.0E-03 6.4E-03 5.0E-03 9.0E-03 6.2E-03 6.8E-03 5.1E-03 5.0E-03Aliphatic alcohols - 6.6E-03 3.8E-03 4.4E-03 2.3E-03 1.5E-03 1.2E-03 5.4E-04 2.5E-03 1.1E-03 1.4E-03 5.9E-04 5.2E-04Alkanes/alkenes, other C1-4 9.4E-03 6.2E-03 6.9E-03 4.4E-03 3.5E-03 3.2E-03 2.4E-03 4.7E-03 3.1E-03 3.4E-03 2.5E-03 2.4E-03Alkanes/alkenes, other C5-8 2.9E-04 1.9E-04 2.1E-04 1.3E-04 1.1E-04 9.7E-05 7.2E-05 1.4E-04 9.4E-05 1.0E-04 7.4E-05 7.2E-05Alkanes/alkenes, other C>8-10 2.8E-03 1.6E-03 1.9E-03 9.9E-04 6.6E-04 5.4E-04 2.5E-04 1.1E-03 5.0E-04 6.2E-04 2.7E-04 2.4E-04Alkanes/alkenes, other C>10-12 - - - - - - - - - - - - -Alkanes/alkenes, other C>12-16 - - - - - - - - - - - - -Benzene and related 7.9E-01 4.8E-01 5.5E-01 3.2E-01 2.4E-01 2.1E-01 1.3E-01 3.4E-01 2.0E-01 2.3E-01 1.4E-01 1.3E-01Butadiene, 1,3- 2.2E-02 1.3E-02 1.4E-02 7.6E-03 5.2E-03 4.3E-03 2.1E-03 8.3E-03 4.0E-03 4.9E-03 2.2E-03 2.0E-03Cycloalkanes and cycloalkenes - - - - - - - - - - - - -Ethylbenzene and related 2.0E-04 1.3E-04 1.4E-04 9.0E-05 7.0E-05 6.3E-05 4.5E-05 9.5E-05 6.0E-05 6.8E-05 4.6E-05 4.4E-05Formaldehyde and related 2.8E+00 1.7E+00 1.9E+00 1.1E+00 7.8E-01 6.7E-01 3.9E-01 1.2E+00 6.3E-01 7.4E-01 4.1E-01 3.9E-01Hexane, n- - - - - - - - - - - - - -Naphthalene and related - - - - - - - - - - - - -Styrene 1.3E-04 8.3E-05 9.4E-05 5.5E-05 4.1E-05 3.6E-05 2.4E-05 5.9E-05 3.5E-05 4.0E-05 2.5E-05 2.3E-05Toluene and related 9.5E-04 7.2E-04 7.7E-04 6.0E-04 5.4E-04 5.1E-04 4.6E-04 6.2E-04 5.1E-04 5.3E-04 4.6E-04 4.6E-04Xylenes 9.5E-04 6.9E-04 7.4E-04 5.5E-04 4.8E-04 4.6E-04 3.9E-04 5.7E-04 4.5E-04 4.7E-04 4.0E-04 3.9E-04Polycyclic Aromatic Hydrocarbons (PAHs)Benzo(a)pyrene TEQ-Equivalents - - - - - - - - - - - - -
COC
Values highlighted in orange are in excess of the acceptable CR of 1.0.- Indicates that an appropriate exposure limit (TRV) was not available for this chemical.
Page 1 of 3

Table 24: 2032 Assessment Scenario - Non-cancer risk estimates - Cumulative Case
P MPOI R1 R2 R3 R4 R5 R6 R7 R8 R9 R10 R11COC8-HOUR EXPOSURESCritieria Air Contaminants (CACs)Carbon monoxide (CO) 1.3E+00 4.7E-01 5.6E-01 6.6E-01 4.7E-01 3.2E-01 5.0E-01 2.6E-01 2.6E-01 4.3E-01 3.5E-01 4.5E-01
24-HOUR EXPOSURESCritieria Air Contaminants (CACs)Carbon monoxide (CO) - - - - - - - - - - - - -Nitrogen dioxide (NO2) 6.1E-01 2.7E-01 2.7E-01 2.8E-01 2.2E-01 2.1E-01 3.0E-01 4.0E-01 2.6E-01 2.3E-01 2.4E-01 2.9E-01Coarse Particulate Matter (PM10) 4.1E+00 3.0E+00 3.4E+00 2.8E+00 2.3E+00 1.9E+00 1.4E+00 2.2E+00 2.3E+00 2.0E+00 2.0E+00 1.5E+00Fine Particulate Matter (PM2.5) 4.7E+00 1.7E+00 1.9E+00 1.7E+00 1.3E+00 1.3E+00 1.2E+00 2.0E+00 1.7E+00 1.4E+00 1.5E+00 1.1E+00Sulphur Dioxide (SO2) 2.2E+00 1.3E-01 1.3E-01 1.3E-01 1.3E-01 2.1E-01 1.0E-01 2.5E-01 2.4E-01 2.1E-01 8.7E-02 6.9E-02Volatile Organic Chemicals (VOCs)Acetaldehyde 1.2E-02 9.9E-03 9.2E-03 7.4E-03 6.9E-03 6.3E-03 5.7E-03 7.5E-03 6.0E-03 6.2E-03 5.8E-03 5.7E-03Acetone 4.7E-04 4.6E-04 4.6E-04 4.5E-04 4.5E-04 4.5E-04 4.5E-04 4.5E-04 4.5E-04 4.5E-04 4.5E-04 4.5E-04Acrolein and related 6.0E+00 4.0E+00 3.4E+00 1.9E+00 1.6E+00 1.1E+00 5.5E-01 2.1E+00 8.1E-01 9.5E-01 6.4E-01 5.8E-01Aldehydes, other - - - - - - - - - - - - -Aliphatic alcohols - 2.1E-03 1.3E-03 1.1E-03 6.0E-04 4.6E-04 2.7E-04 8.4E-05 6.4E-04 1.8E-04 2.3E-04 1.2E-04 9.4E-05Alkanes/alkenes, other C1-4 1.2E-02 1.0E-02 9.6E-03 8.0E-03 7.6E-03 7.1E-03 6.5E-03 8.1E-03 6.8E-03 6.9E-03 6.6E-03 6.5E-03Alkanes/alkenes, other C5-8 3.6E-03 2.9E-03 2.7E-03 2.3E-03 2.1E-03 2.0E-03 1.8E-03 2.3E-03 1.9E-03 1.9E-03 1.8E-03 1.8E-03Alkanes/alkenes, other C>8-10 2.8E-04 1.8E-04 1.6E-04 8.5E-05 6.7E-05 4.3E-05 1.8E-05 9.0E-05 3.0E-05 3.7E-05 2.2E-05 1.9E-05Alkanes/alkenes, other C>10-12 - - - - - - - - - - - - -Alkanes/alkenes, other C>12-16 - - - - - - - - - - - - -Benzene and related 9.3E-02 7.0E-02 6.4E-02 4.7E-02 4.3E-02 3.7E-02 3.2E-02 4.9E-02 3.5E-02 3.6E-02 3.3E-02 3.2E-02Butadiene, 1,3- 9.6E-02 6.4E-02 5.5E-02 3.2E-02 2.6E-02 1.8E-02 9.4E-03 3.3E-02 1.3E-02 1.6E-02 1.1E-02 9.9E-03Cycloalkanes and cycloalkenes 8.5E-05 7.8E-05 7.6E-05 7.0E-05 6.9E-05 6.7E-05 6.5E-05 7.1E-05 6.6E-05 6.7E-05 6.5E-05 6.5E-05Ethylbenzene and related 2.5E-03 2.0E-03 1.9E-03 1.5E-03 1.4E-03 1.3E-03 1.1E-03 1.5E-03 1.2E-03 1.2E-03 1.2E-03 1.2E-03Formaldehyde and related 2.5E-01 1.8E-01 1.6E-01 1.1E-01 9.9E-02 8.2E-02 6.4E-02 1.2E-01 7.3E-02 7.8E-02 6.7E-02 6.5E-02Hexane, n- 1.6E-04 1.5E-04 1.5E-04 1.5E-04 1.4E-04 1.4E-04 1.4E-04 1.5E-04 1.4E-04 1.4E-04 1.4E-04 1.4E-04Naphthalene and related 4.2E-02 2.9E-02 2.5E-02 1.5E-02 1.2E-02 8.9E-03 5.4E-03 1.6E-02 7.1E-03 8.1E-03 6.0E-03 5.6E-03Styrene 9.0E-04 6.9E-04 6.3E-04 4.7E-04 4.3E-04 3.8E-04 3.2E-04 4.9E-04 3.5E-04 3.7E-04 3.3E-04 3.3E-04Toluene and related 8.7E-04 8.0E-04 7.8E-04 7.3E-04 7.2E-04 7.0E-04 6.8E-04 7.4E-04 6.9E-04 7.0E-04 6.9E-04 6.8E-04Xylenes 2.0E-03 1.8E-03 1.7E-03 1.6E-03 1.6E-03 1.5E-03 1.5E-03 1.6E-03 1.5E-03 1.5E-03 1.5E-03 1.5E-03Polycyclic Aromatic Hydrocarbons (PAHs)Benzo(a)pyrene TEQ-Equivalents - - - - - - - - - - - - -
Values highlighted in orange are in excess of the acceptable CR of 1.0.- Indicates that an appropriate exposure limit (TRV) was not available for this chemical.
Page 2 of 3

Table 24: 2032 Assessment Scenario - Non-cancer risk estimates - Cumulative Case
P MPOI R1 R2 R3 R4 R5 R6 R7 R8 R9 R10 R11COCANNUAL AVERAGE EXPOSURESCritieria Air Contaminants (CACs)Carbon monoxide (CO) - - - - - - - - - - - - -Nitrogen dioxide (NO2) 3.6E-01 1.2E-01 1.2E-01 5.7E-01 3.9E-01 3.4E-01 4.4E-01 4.7E-01 3.6E-01 3.5E-01 3.7E-01 1.2E-01Coarse Particulate Matter (PM10) 6.8E-01 4.4E-01 4.8E-01 1.7E+00 1.4E+00 1.1E+00 8.6E-01 1.2E+00 1.1E+00 1.3E+00 1.2E+00 2.1E-01Fine Particulate Matter (PM2.5) 1.0E+00 3.0E-01 3.2E-01 1.3E+00 1.0E+00 9.4E-01 8.6E-01 1.2E+00 1.1E+00 1.0E+00 9.9E-01 1.9E-01Sulphur Dioxide (SO2) 1.5E+00 4.7E-02 4.5E-02 1.7E-01 1.6E-01 2.0E-01 1.1E-01 2.6E-01 3.2E-01 2.2E-01 1.0E-01 1.9E-02
Acetaldehyde 2.4E-03 2.0E-03 1.9E-03 7.1E-03 6.8E-03 6.7E-03 6.6E-03 7.2E-03 6.7E-03 6.7E-03 6.7E-03 1.8E-03Acetone 4.4E-05 3.8E-05 3.8E-05 1.6E-04 1.6E-04 1.6E-04 1.6E-04 1.6E-04 1.6E-04 1.6E-04 1.6E-04 4.3E-05Acrolein and related 3.2E+00 2.6E+00 2.0E+00 4.0E+00 2.7E+00 2.3E+00 1.9E+00 4.4E+00 2.2E+00 2.3E+00 2.0E+00 5.1E-01Aldehydes, other 3.5E-02 3.0E-02 2.9E-02 1.1E-01 1.1E-01 1.0E-01 1.0E-01 1.1E-01 1.0E-01 1.0E-01 1.0E-01 2.8E-02Aliphatic alcohols - 5.1E-05 4.0E-05 2.9E-05 4.2E-05 1.9E-05 1.1E-05 3.7E-06 4.9E-05 9.3E-06 1.1E-05 5.6E-06 9.0E-07Alkanes/alkenes, other C1-4 1.5E-03 1.3E-03 1.2E-03 4.8E-03 4.7E-03 4.7E-03 4.7E-03 4.8E-03 4.7E-03 4.7E-03 4.7E-03 1.3E-03Alkanes/alkenes, other C5-8 4.5E-05 3.9E-05 3.7E-05 1.5E-04 1.4E-04 1.4E-04 1.4E-04 1.5E-04 1.4E-04 1.4E-04 1.4E-04 3.9E-05Alkanes/alkenes, other C>8-10 4.4E-04 3.5E-04 2.6E-04 4.8E-04 3.0E-04 2.3E-04 1.8E-04 5.3E-04 2.2E-04 2.3E-04 1.9E-04 4.7E-05Alkanes/alkenes, other C>10-12 5.0E-05 4.2E-05 3.8E-05 1.3E-04 1.2E-04 1.2E-04 1.2E-04 1.3E-04 1.2E-04 1.2E-04 1.2E-04 3.2E-05Alkanes/alkenes, other C>12-16 - 3.1E-05 2.4E-05 1.8E-05 2.6E-05 1.2E-05 6.9E-06 2.3E-06 3.0E-05 5.8E-06 6.9E-06 3.5E-06 5.6E-07Benzene and related 7.0E-02 5.9E-02 5.6E-02 2.1E-01 2.1E-01 2.0E-01 2.0E-01 2.1E-01 2.0E-01 2.0E-01 2.0E-01 5.5E-02Butadiene, 1,3- 2.2E-02 1.8E-02 1.5E-02 3.5E-02 2.8E-02 2.5E-02 2.3E-02 3.7E-02 2.4E-02 2.5E-02 2.3E-02 6.2E-03Cycloalkanes and cycloalkenes 1.2E-05 1.0E-05 1.0E-05 4.1E-05 4.1E-05 4.1E-05 4.1E-05 4.1E-05 4.1E-05 4.1E-05 4.1E-05 1.1E-05Ethylbenzene and related 6.2E-04 5.3E-04 5.0E-04 1.9E-03 1.8E-03 1.8E-03 1.8E-03 1.9E-03 1.8E-03 1.8E-03 1.8E-03 4.9E-04Formaldehyde and related 8.0E-02 6.6E-02 5.9E-02 1.9E-01 1.8E-01 1.7E-01 1.7E-01 2.0E-01 1.7E-01 1.7E-01 1.7E-01 4.6E-02Hexane, n- 9.6E-05 8.3E-05 8.2E-05 3.4E-04 3.4E-04 3.4E-04 3.4E-04 3.4E-04 3.4E-04 3.4E-04 3.4E-04 9.4E-05Naphthalene and related 8.5E-03 6.8E-03 5.7E-03 1.5E-02 1.2E-02 1.2E-02 1.1E-02 1.6E-02 1.1E-02 1.2E-02 1.1E-02 2.9E-03Styrene 2.8E-05 2.3E-05 2.0E-05 6.6E-05 6.0E-05 5.8E-05 5.6E-05 6.8E-05 5.8E-05 5.8E-05 5.7E-05 1.5E-05Toluene and related 6.2E-05 5.3E-05 5.3E-05 2.1E-04 2.1E-04 2.1E-04 2.1E-04 2.2E-04 2.1E-04 2.1E-04 2.1E-04 5.8E-05Xylenes 1.5E-03 1.3E-03 1.3E-03 5.3E-03 5.3E-03 5.3E-03 5.3E-03 5.3E-03 5.3E-03 5.3E-03 5.3E-03 1.4E-03Polycyclic Aromatic Hydrocarbons (PAHs)Benzo(a)pyrene TEQ-Equivalents - - - - - - - - - - - - -
Volatile Organic Chemicals (VOCs)
Values highlighted in orange are in excess of the acceptable CR of 1.0.- Indicates that an appropriate exposure limit (TRV) was not available for this chemical.
Page 3 of 3

Table 25: 2032 Assessment Scenario - Cancer risk estimates - Background Case
MPOI R1 R2 R3 R4 R5 R6 R7 R8 R9 R10 R111-HOUR EXPOSURESCritieria Air Contaminants (CACs)Carbon monoxide (CO) - - - - - - - - - - - -Nitrogen dioxide (NO2) - - - - - - - - - - - -Coarse Particulate Matter (PM10) - - - - - - - - - - - -Fine Particulate Matter (PM2.5) - - - - - - - - - - - -Sulphur Dioxide (SO2) - - - - - - - - - - - -Volatile Organic Chemicals (VOCs)Acetaldehyde - - - - - - - - - - - -Acetone - - - - - - - - - - - -Acrolein and related - - - - - - - - - - - -Aldehydes, other - - - - - - - - - - - -Aliphatic alcohols - - - - - - - - - - - -Alkanes/alkenes, other C1-4 - - - - - - - - - - - -Alkanes/alkenes, other C5-8 - - - - - - - - - - - -Alkanes/alkenes, other C>8-10 - - - - - - - - - - - -Alkanes/alkenes, other C>10-12 - - - - - - - - - - - -Alkanes/alkenes, other C>12-16 - - - - - - - - - - - -Benzene and related - - - - - - - - - - - -Butadiene, 1,3- - - - - - - - - - - - -Cycloalkanes and cycloalkenes - - - - - - - - - - - -Ethylbenzene and related - - - - - - - - - - - -Formaldehyde and related - - - - - - - - - - - -Hexane, n- - - - - - - - - - - - -Naphthalene and related - - - - - - - - - - - -Styrene - - - - - - - - - - - -Toluene and related - - - - - - - - - - - -Xylenes - - - - - - - - - - - -Polycyclic Aromatic Hydrocarbons (PAHs)Benzo(a)pyrene TEQ-Equivalents - - - - - - - - - - - -
Values highlighted in orange are in excess of the acceptable CR of 1.0.- Indicates that an appropriate exposure limit (TRV) was not available for this chemical.
COC
Page 1 of 3

Table 25: 2032 Assessment Scenario - Cancer risk estimates - Background Case
MPOI R1 R2 R3 R4 R5 R6 R7 R8 R9 R10 R11COC
Critieria Air Contaminants (CACs)Carbon monoxide (CO) - - - - - - - - - - - -
Critieria Air Contaminants (CACs)Carbon monoxide (CO) - - - - - - - - - - - -Nitrogen dioxide (NO2) - - - - - - - - - - - -Coarse Particulate Matter (PM10) - - - - - - - - - - - -Fine Particulate Matter (PM2.5) - - - - - - - - - - - -Sulphur Dioxide (SO2) - - - - - - - - - - - -Volatile Organic Chemicals (VOCs)Acetaldehyde - - - - - - - - - - - -Acetone - - - - - - - - - - - -Acrolein and related - - - - - - - - - - - -Aldehydes, other - - - - - - - - - - - -Aliphatic alcohols - - - - - - - - - - - -Alkanes/alkenes, other C1-4 - - - - - - - - - - - -Alkanes/alkenes, other C5-8 - - - - - - - - - - - -Alkanes/alkenes, other C>8-10 - - - - - - - - - - - -Alkanes/alkenes, other C>10-12 - - - - - - - - - - - -Alkanes/alkenes, other C>12-16 - - - - - - - - - - - -Benzene and related - - - - - - - - - - - -Butadiene, 1,3- - - - - - - - - - - - -Cycloalkanes and cycloalkenes - - - - - - - - - - - -Ethylbenzene and related - - - - - - - - - - - -Formaldehyde and related - - - - - - - - - - - -Hexane, n- - - - - - - - - - - - -Naphthalene and related - - - - - - - - - - - -Styrene - - - - - - - - - - - -Toluene and related - - - - - - - - - - - -Xylenes - - - - - - - - - - - -Polycyclic Aromatic Hydrocarbons (PAHs)Benzo(a)pyrene TEQ-Equivalents - - - - - - - - - - - -
Values highlighted in orange are in excess of the acceptable CR of 1.0.- Indicates that an appropriate exposure limit (TRV) was not available for this chemical.
24-HOUR EXPOSURES
8-HOUR EXPOSURES
Page 2 of 3

Table 25: 2032 Assessment Scenario - Cancer risk estimates - Background Case
MPOI R1 R2 R3 R4 R5 R6 R7 R8 R9 R10 R11COCANNUAL AVERAGE EXPOSURESCritieria Air Contaminants (CACs)Carbon monoxide (CO) - - - - - - - - - - - -Nitrogen dioxide (NO2) - - - - - - - - - - - -Coarse Particulate Matter (PM10) - - - - - - - - - - - -Fine Particulate Matter (PM2.5) - - - - - - - - - - - -Sulphur Dioxide (SO2) - - - - - - - - - - - -Volatile Organic Chemicals (VOCs)Acetaldehyde 3.0E-07 2.6E-07 2.6E-07 2.5E-06 2.5E-06 2.5E-06 2.5E-06 2.5E-06 2.5E-06 2.5E-06 2.5E-06 2.5E-06Acetone - - - - - - - - - - - -Acrolein and related - - - - - - - - - - - -Aldehydes, other - - - - - - - - - - - -Aliphatic alcohols - - - - - - - - - - - -Alkanes/alkenes, other C1-4 - - - - - - - - - - - -Alkanes/alkenes, other C5-8 - - - - - - - - - - - -Alkanes/alkenes, other C>8-10 - - - - - - - - - - - -Alkanes/alkenes, other C>10-12 - - - - - - - - - - - -Alkanes/alkenes, other C>12-16 - - - - - - - - - - - -Benzene and related 2.1E-06 1.8E-06 1.8E-06 1.7E-05 1.7E-05 1.7E-05 1.7E-05 1.7E-05 1.7E-05 1.7E-05 1.7E-05 1.7E-05Butadiene, 1,3- 2.6E-09 2.2E-09 2.2E-09 2.1E-08 2.1E-08 2.1E-08 2.1E-08 2.1E-08 2.1E-08 2.1E-08 2.1E-08 2.1E-08Cycloalkanes and cycloalkenes - - - - - - - - - - - -Ethylbenzene and related - - - - - - - - - - - -Formaldehyde and related 1.1E-06 9.3E-07 9.3E-07 8.9E-06 8.9E-06 8.9E-06 8.9E-06 8.9E-06 8.9E-06 8.9E-06 8.9E-06 8.9E-06Hexane, n- - - - - - - - - - - - -Naphthalene and related - - - - - - - - - - - -Styrene - - - - - - - - - - - -Toluene and related - - - - - - - - - - - -Xylenes - - - - - - - - - - - -Polycyclic Aromatic Hydrocarbons (PAHs)Benzo(a)pyrene TEQ-Equivalents - - - - - - - - - - - -Values highlighted in orange are in excess of the acceptable CR of 1.0.- Indicates that an appropriate exposure limit (TRV) was not available for this chemical.
Page 3 of 3

Table 26: 2032 Assessment Scenario - Cancer risk estimates - Airport Case
MPOI R1 R2 R3 R4 R5 R6 R7 R8 R9 R10 R111-HOUR EXPOSURESCritieria Air Contaminants (CACs)Carbon monoxide (CO) - - - - - - - - - - - -Nitrogen dioxide (NO2) - - - - - - - - - - - -Coarse Particulate Matter (PM10) - - - - - - - - - - - -Fine Particulate Matter (PM2.5) - - - - - - - - - - - -Sulphur Dioxide (SO2) - - - - - - - - - - - -Volatile Organic Chemicals (VOCs)Acetaldehyde - - - - - - - - - - - -Acetone - - - - - - - - - - - -Acrolein and related - - - - - - - - - - - -Aldehydes, other - - - - - - - - - - - -Aliphatic alcohols - - - - - - - - - - - -Alkanes/alkenes, other C1-4 - - - - - - - - - - - -Alkanes/alkenes, other C5-8 - - - - - - - - - - - -Alkanes/alkenes, other C>8-10 - - - - - - - - - - - -Alkanes/alkenes, other C>10-12 - - - - - - - - - - - -Alkanes/alkenes, other C>12-16 - - - - - - - - - - - -Benzene and related - - - - - - - - - - - -Butadiene, 1,3- - - - - - - - - - - - -Cycloalkanes and cycloalkenes - - - - - - - - - - - -Ethylbenzene and related - - - - - - - - - - - -Formaldehyde and related - - - - - - - - - - - -Hexane, n- - - - - - - - - - - - -Naphthalene and related - - - - - - - - - - - -Styrene - - - - - - - - - - - -Toluene and related - - - - - - - - - - - -Xylenes - - - - - - - - - - - -Polycyclic Aromatic Hydrocarbons (PAHs)Benzo(a)pyrene TEQ-Equivalents - - - - - - - - - - - -
Values highlighted in orange are in excess of the acceptable CR of 1.0.- Indicates that an appropriate exposure limit (TRV) was not available for this chemical.
COC
Page 1 of 3

Table 26: 2032 Assessment Scenario - Cancer risk estimates - Airport Case
MPOI R1 R2 R3 R4 R5 R6 R7 R8 R9 R10 R11COC
Critieria Air Contaminants (CACs)Carbon monoxide (CO) - - - - - - - - - - - -
Critieria Air Contaminants (CACs)Carbon monoxide (CO) - - - - - - - - - - - -Nitrogen dioxide (NO2) - - - - - - - - - - - -Coarse Particulate Matter (PM10) - - - - - - - - - - - -Fine Particulate Matter (PM2.5) - - - - - - - - - - - -Sulphur Dioxide (SO2) - - - - - - - - - - - -Volatile Organic Chemicals (VOCs)Acetaldehyde - - - - - - - - - - - -Acetone - - - - - - - - - - - -Acrolein and related - - - - - - - - - - - -Aldehydes, other - - - - - - - - - - - -Aliphatic alcohols - - - - - - - - - - - -Alkanes/alkenes, other C1-4 - - - - - - - - - - - -Alkanes/alkenes, other C5-8 - - - - - - - - - - - -Alkanes/alkenes, other C>8-10 - - - - - - - - - - - -Alkanes/alkenes, other C>10-12 - - - - - - - - - - - -Alkanes/alkenes, other C>12-16 - - - - - - - - - - - -Benzene and related - - - - - - - - - - - -Butadiene, 1,3- - - - - - - - - - - - -Cycloalkanes and cycloalkenes - - - - - - - - - - - -Ethylbenzene and related - - - - - - - - - - - -Formaldehyde and related - - - - - - - - - - - -Hexane, n- - - - - - - - - - - - -Naphthalene and related - - - - - - - - - - - -Styrene - - - - - - - - - - - -Toluene and related - - - - - - - - - - - -Xylenes - - - - - - - - - - - -Polycyclic Aromatic Hydrocarbons (PAHs)Benzo(a)pyrene TEQ-Equivalents - - - - - - - - - - - -
Values highlighted in orange are in excess of the acceptable CR of 1.0.- Indicates that an appropriate exposure limit (TRV) was not available for this chemical.
24-HOUR EXPOSURES
8-HOUR EXPOSURES
Page 2 of 3

Table 26: 2032 Assessment Scenario - Cancer risk estimates - Airport Case
MPOI R1 R2 R3 R4 R5 R6 R7 R8 R9 R10 R11COCANNUAL AVERAGE EXPOSURESCritieria Air Contaminants (CACs)Carbon monoxide (CO) - - - - - - - - - - - -Nitrogen dioxide (NO2) - - - - - - - - - - - -Coarse Particulate Matter (PM10) - - - - - - - - - - - -Fine Particulate Matter (PM2.5) - - - - - - - - - - - -Sulphur Dioxide (SO2) - - - - - - - - - - - -Volatile Organic Chemicals (VOCs)Acetaldehyde 1.0E-07 7.8E-08 5.7E-08 1.9E-07 8.5E-08 5.0E-08 1.7E-08 2.2E-07 4.2E-08 5.0E-08 2.5E-08 1.5E-08Acetone - - - - - - - - - - - -Acrolein and related - - - - - - - - - - - -Aldehydes, other - - - - - - - - - - - -Aliphatic alcohols - - - - - - - - - - - -Alkanes/alkenes, other C1-4 - - - - - - - - - - - -Alkanes/alkenes, other C5-8 - - - - - - - - - - - -Alkanes/alkenes, other C>8-10 - - - - - - - - - - - -Alkanes/alkenes, other C>10-12 - - - - - - - - - - - -Alkanes/alkenes, other C>12-16 - - - - - - - - - - - -Benzene and related 5.7E-07 4.5E-07 3.3E-07 1.1E-06 4.9E-07 2.9E-07 9.7E-08 1.3E-06 2.4E-07 2.9E-07 1.4E-07 8.5E-08Butadiene, 1,3- 7.2E-09 5.6E-09 4.1E-09 1.4E-08 6.2E-09 3.6E-09 1.2E-09 1.6E-08 3.0E-09 3.6E-09 1.8E-09 1.1E-09Cycloalkanes and cycloalkenes - - - - - - - - - - - -Ethylbenzene and related - - - - - - - - - - - -Formaldehyde and related 8.2E-07 6.4E-07 4.6E-07 1.5E-06 7.0E-07 4.1E-07 1.4E-07 1.8E-06 3.4E-07 4.1E-07 2.1E-07 1.2E-07Hexane, n- - - - - - - - - - - - -Naphthalene and related - - - - - - - - - - - -Styrene - - - - - - - - - - - -Toluene and related - - - - - - - - - - - -Xylenes - - - - - - - - - - - -Polycyclic Aromatic Hydrocarbons (PAHs)Benzo(a)pyrene TEQ-Equivalents 3.9E-07 2.6E-07 2.1E-07 6.0E-07 3.1E-07 1.8E-07 5.9E-08 5.4E-07 1.3E-07 1.8E-07 9.2E-08 5.2E-08Values highlighted in orange are in excess of the acceptable CR of 1.0.- Indicates that an appropriate exposure limit (TRV) was not available for this chemical.
Page 3 of 3

Table 27: 2032 Assessment Scenario - Cancer risk estimates - Cumulative Case
MPOI R1 R2 R3 R4 R5 R6 R7 R8 R9 R10 R111-HOUR EXPOSURESCritieria Air Contaminants (CACs)Carbon monoxide (CO) - - - - - - - - - - - -Nitrogen dioxide (NO2) - - - - - - - - - - - -Coarse Particulate Matter (PM10) - - - - - - - - - - - -Fine Particulate Matter (PM2.5) - - - - - - - - - - - -Sulphur Dioxide (SO2) - - - - - - - - - - - -Volatile Organic Chemicals (VOCs)Acetaldehyde - - - - - - - - - - - -Acetone - - - - - - - - - - - -Acrolein and related - - - - - - - - - - - -Aldehydes, other - - - - - - - - - - - -Aliphatic alcohols - - - - - - - - - - - -Alkanes/alkenes, other C1-4 - - - - - - - - - - - -Alkanes/alkenes, other C5-8 - - - - - - - - - - - -Alkanes/alkenes, other C>8-10 - - - - - - - - - - - -Alkanes/alkenes, other C>10-12 - - - - - - - - - - - -Alkanes/alkenes, other C>12-16 - - - - - - - - - - - -Benzene and related - - - - - - - - - - - -Butadiene, 1,3- - - - - - - - - - - - -Cycloalkanes and cycloalkenes - - - - - - - - - - - -Ethylbenzene and related - - - - - - - - - - - -Formaldehyde and related - - - - - - - - - - - -Hexane, n- - - - - - - - - - - - -Naphthalene and related - - - - - - - - - - - -Styrene - - - - - - - - - - - -Toluene and related - - - - - - - - - - - -Xylenes - - - - - - - - - - - -Polycyclic Aromatic Hydrocarbons (PAHs)Benzo(a)pyrene TEQ-Equivalents - - - - - - - - - - - -
Values highlighted in orange are in excess of the acceptable CR of 1.0.- Indicates that an appropriate exposure limit (TRV) was not available for this chemical.
COC
Page 1 of 3

Table 27: 2032 Assessment Scenario - Cancer risk estimates - Cumulative Case
MPOI R1 R2 R3 R4 R5 R6 R7 R8 R9 R10 R11COC
Critieria Air Contaminants (CACs)Carbon monoxide (CO) - - - - - - - - - - - -
Critieria Air Contaminants (CACs)Carbon monoxide (CO) - - - - - - - - - - - -Nitrogen dioxide (NO2) - - - - - - - - - - - -Coarse Particulate Matter (PM10) - - - - - - - - - - - -Fine Particulate Matter (PM2.5) - - - - - - - - - - - -Sulphur Dioxide (SO2) - - - - - - - - - - - -Volatile Organic Chemicals (VOCs)Acetaldehyde - - - - - - - - - - - -Acetone - - - - - - - - - - - -Acrolein and related - - - - - - - - - - - -Aldehydes, other - - - - - - - - - - - -Aliphatic alcohols - - - - - - - - - - - -Alkanes/alkenes, other C1-4 - - - - - - - - - - - -Alkanes/alkenes, other C5-8 - - - - - - - - - - - -Alkanes/alkenes, other C>8-10 - - - - - - - - - - - -Alkanes/alkenes, other C>10-12 - - - - - - - - - - - -Alkanes/alkenes, other C>12-16 - - - - - - - - - - - -Benzene and related - - - - - - - - - - - -Butadiene, 1,3- - - - - - - - - - - - -Cycloalkanes and cycloalkenes - - - - - - - - - - - -Ethylbenzene and related - - - - - - - - - - - -Formaldehyde and related - - - - - - - - - - - -Hexane, n- - - - - - - - - - - - -Naphthalene and related - - - - - - - - - - - -Styrene - - - - - - - - - - - -Toluene and related - - - - - - - - - - - -Xylenes - - - - - - - - - - - -Polycyclic Aromatic Hydrocarbons (PAHs)Benzo(a)pyrene TEQ-Equivalents - - - - - - - - - - - -
Values highlighted in orange are in excess of the acceptable CR of 1.0.- Indicates that an appropriate exposure limit (TRV) was not available for this chemical.
24-HOUR EXPOSURES
8-HOUR EXPOSURES
Page 2 of 3

Table 27: 2032 Assessment Scenario - Cancer risk estimates - Cumulative Case
MPOI R1 R2 R3 R4 R5 R6 R7 R8 R9 R10 R11COCANNUAL AVERAGE EXPOSURESCritieria Air Contaminants (CACs)Carbon monoxide (CO) - - - - - - - - - - - -Nitrogen dioxide (NO2) - - - - - - - - - - - -Coarse Particulate Matter (PM10) - - - - - - - - - - - -Fine Particulate Matter (PM2.5) - - - - - - - - - - - -Sulphur Dioxide (SO2) - - - - - - - - - - - -Volatile Organic Chemicals (VOCs)Acetaldehyde 4.0E-07 3.4E-07 3.2E-07 2.7E-06 2.6E-06 2.5E-06 2.5E-06 2.7E-06 2.5E-06 2.5E-06 2.5E-06 2.5E-06Acetone - - - - - - - - - - - -Acrolein and related - - - - - - - - - - - -Aldehydes, other - - - - - - - - - - - -Aliphatic alcohols - - - - - - - - - - - -Alkanes/alkenes, other C1-4 - - - - - - - - - - - -Alkanes/alkenes, other C5-8 - - - - - - - - - - - -Alkanes/alkenes, other C>8-10 - - - - - - - - - - - -Alkanes/alkenes, other C>10-12 - - - - - - - - - - - -Alkanes/alkenes, other C>12-16 - - - - - - - - - - - -Benzene and related 2.7E-06 2.3E-06 2.1E-06 1.9E-05 1.8E-05 1.8E-05 1.8E-05 1.9E-05 1.8E-05 1.8E-05 1.8E-05 1.8E-05Butadiene, 1,3- 9.8E-09 7.9E-09 6.4E-09 3.5E-08 2.8E-08 2.5E-08 2.3E-08 3.7E-08 2.4E-08 2.5E-08 2.3E-08 2.3E-08Cycloalkanes and cycloalkenes - - - - - - - - - - - -Ethylbenzene and related - - - - - - - - - - - -Formaldehyde and related 1.9E-06 1.6E-06 1.4E-06 1.0E-05 9.6E-06 9.3E-06 9.0E-06 1.1E-05 9.2E-06 9.3E-06 9.1E-06 9.0E-06Hexane, n- - - - - - - - - - - - -Naphthalene and related - - - - - - - - - - - -Styrene - - - - - - - - - - - -Toluene and related - - - - - - - - - - - -Xylenes - - - - - - - - - - - -Polycyclic Aromatic Hydrocarbons (PAHs)Benzo(a)pyrene TEQ-Equivalents - - - - - - - - - - - -Values highlighted in orange are in excess of the acceptable CR of 1.0.- Indicates that an appropriate exposure limit (TRV) was not available for this chemical.
Page 3 of 3

Air Quality Study at Toronto Pearson International Airport – Human Health Risk Assessment Report August 2015 Intrinsik Environmental Sciences Inc. – Project 20-21515 Page B-88
E-3.1 Mixtures Assessment Risk Characterization Tables This section presents the non-cancer risk estimates for the mixtures assessment for each receptor location and year for the Baseline, Airport Alone, and Cumulative Effects cases (Tables 28 through 36).

Table 28: 2011 Mixtures Assessment - Background Case
MPOI R1 R2 R3 R4 R5 R6 R7 R8 R9 R10 R11Potential Endpoint of MixtureEndpoint of Concern1-HOUR EXPOSURESEye irritants 3.1E-01 3.1E-01 3.1E-01 3.1E-01 3.1E-01 3.1E-01 3.1E-01 3.1E-01 3.1E-01 3.1E-01 3.1E-01 3.1E-01Respiratory irritants 1.1E+01 2.4E+00 2.4E+00 2.7E+00 2.6E+00 2.8E+00 2.2E+00 3.5E+00 3.5E+00 3.4E+00 2.1E+00 1.8E+00Neurological effects 1.3E-03 1.3E-03 1.3E-03 1.3E-03 1.3E-03 1.3E-03 1.3E-03 1.3E-03 1.3E-03 1.3E-03 1.3E-03 1.3E-03Reproductive/developmental effects 3.2E-04 3.2E-04 3.2E-04 3.2E-04 3.2E-04 3.2E-04 3.2E-04 3.2E-04 3.2E-04 3.2E-04 3.2E-04 3.2E-0424-HOUR EXPOSURESEye irritants 3.8E-01 3.8E-01 3.8E-01 3.8E-01 3.8E-01 3.8E-01 3.8E-01 3.8E-01 3.8E-01 3.8E-01 3.8E-01 3.8E-01Respiratory irritants 1.2E+01 4.6E+00 5.0E+00 5.2E+00 4.2E+00 3.5E+00 3.1E+00 4.2E+00 4.4E+00 4.0E+00 3.7E+00 2.8E+00Neurological effects 4.4E-03 4.4E-03 4.4E-03 4.4E-03 4.4E-03 4.4E-03 4.4E-03 4.4E-03 4.4E-03 4.4E-03 4.4E-03 4.4E-03Reproductive/developmental effects 5.8E-03 5.8E-03 5.8E-03 5.8E-03 5.8E-03 5.8E-03 5.8E-03 5.8E-03 5.8E-03 5.8E-03 5.8E-03 5.8E-03ANNUAL AVERAGE EXPOSURESRespiratory irritants 5.4E-01 4.7E-01 4.7E-01 2.0E+00 2.0E+00 2.0E+00 2.0E+00 2.0E+00 2.0E+00 2.0E+00 2.0E+00 2.0E+00Respiratory effects 3.5E+00 9.0E-01 9.6E-01 4.1E+00 3.1E+00 2.7E+00 2.4E+00 3.1E+00 2.9E+00 3.1E+00 2.8E+00 2.1E+00Liver effects 7.2E-05 6.3E-05 6.3E-05 2.6E-04 2.6E-04 2.6E-04 2.6E-04 2.6E-04 2.6E-04 2.6E-04 2.6E-04 2.6E-04Neurological effects 1.7E-03 1.5E-03 1.5E-03 6.2E-03 6.2E-03 6.2E-03 6.2E-03 6.2E-03 6.2E-03 6.2E-03 6.2E-03 6.2E-03Reproductive/developmental effects 5.9E-03 5.1E-03 5.1E-03 2.1E-02 2.1E-02 2.1E-02 2.1E-02 2.1E-02 2.1E-02 2.1E-02 2.1E-02 2.1E-02Hematological effects 5.5E-02 4.8E-02 4.8E-02 2.0E-01 2.0E-01 2.0E-01 2.0E-01 2.0E-01 2.0E-01 2.0E-01 2.0E-01 2.0E-01
Page 1 of 1

Table 29: 2011 Mixtures Assessment - Airport Case
MPOI R1 R2 R3 R4 R5 R6 R7 R8 R9 R10 R11Potential Endpoint of MixtureEndpoint of Concern1-HOUR EXPOSURESEye irritants 3.6E+00 2.2E+00 2.3E+00 1.8E+00 9.1E-01 6.9E-01 5.0E-01 1.7E+00 5.1E-01 6.9E-01 3.4E-01 3.3E-01Respiratory irritants 3.7E+00 1.8E+00 2.3E+00 1.6E+00 9.5E-01 8.1E-01 6.2E-01 1.7E+00 7.1E-01 8.0E-01 6.6E-01 7.1E-01Neurological effects 8.5E-04 5.2E-04 5.3E-04 4.3E-04 2.2E-04 1.6E-04 1.2E-04 4.0E-04 1.2E-04 1.6E-04 8.1E-05 7.9E-05Reproductive/developmental effects 8.5E-03 5.2E-03 5.3E-03 4.3E-03 2.1E-03 1.6E-03 1.2E-03 4.0E-03 1.2E-03 1.6E-03 8.0E-04 7.8E-0424-HOUR EXPOSURESEye irritants 2.1E+00 1.5E+00 1.4E+00 4.8E-01 4.1E-01 2.6E-01 1.1E-01 3.7E-01 1.9E-01 2.1E-01 1.2E-01 1.4E-01Respiratory irritants 5.9E-01 4.0E-01 3.5E-01 1.4E-01 1.1E-01 6.6E-02 6.0E-02 1.7E-01 7.7E-02 7.1E-02 3.7E-02 4.7E-02Neurological effects 2.3E-03 2.1E-03 2.0E-03 1.6E-03 1.6E-03 1.5E-03 1.5E-03 1.6E-03 1.5E-03 1.5E-03 1.5E-03 1.5E-03Reproductive/developmental effects 3.4E-02 2.5E-02 2.3E-02 7.8E-03 6.7E-03 4.1E-03 1.7E-03 6.0E-03 3.1E-03 3.4E-03 2.0E-03 2.2E-03ANNUAL AVERAGE EXPOSURESRespiratory irritants 1.5E+00 1.3E+00 9.1E-01 9.3E-01 4.3E-01 2.5E-01 1.0E-01 7.7E-01 1.5E-01 2.7E-01 1.5E-01 9.7E-02Respiratory effects 8.9E-02 7.2E-02 5.7E-02 7.3E-02 4.1E-02 2.8E-02 1.2E-02 8.9E-02 1.7E-02 2.7E-02 1.6E-02 1.0E-02Liver effects 2.4E-04 2.1E-04 1.5E-04 1.5E-04 7.0E-05 4.0E-05 1.6E-05 1.2E-04 2.5E-05 4.3E-05 2.4E-05 1.6E-05Neurological effects 1.5E-04 1.3E-04 8.8E-05 9.0E-05 4.2E-05 2.4E-05 9.7E-06 7.5E-05 1.5E-05 2.6E-05 1.5E-05 9.4E-06Reproductive/developmental effects 9.1E-03 7.9E-03 5.5E-03 5.6E-03 2.6E-03 1.5E-03 6.0E-04 4.7E-03 9.3E-04 1.6E-03 9.1E-04 5.9E-04Hematological effects 1.2E-02 1.0E-02 7.1E-03 7.2E-03 3.4E-03 1.9E-03 7.8E-04 6.0E-03 1.2E-03 2.1E-03 1.2E-03 7.6E-04
Page 1 of 1

Table 30: 2011 Mixtures Assessment - Cumulative Case
MPOI R1 R2 R3 R4 R5 R6 R7 R8 R9 R10 R11Potential Endpoint of Mixture
Eye irritants 3.9E+00 2.5E+00 2.6E+00 2.1E+00 1.2E+00 1.0E+00 8.1E-01 2.0E+00 8.2E-01 1.0E+00 6.5E-01 6.4E-01Respiratory irritants 1.2E+01 3.0E+00 3.3E+00 3.1E+00 2.8E+00 3.0E+00 2.3E+00 3.9E+00 3.6E+00 3.6E+00 2.2E+00 1.8E+00Neurological effects 2.2E-03 1.8E-03 1.8E-03 1.7E-03 1.5E-03 1.5E-03 1.4E-03 1.7E-03 1.4E-03 1.5E-03 1.4E-03 1.4E-03Reproductive/developmental effects 8.8E-03 5.5E-03 5.6E-03 4.6E-03 2.5E-03 2.0E-03 1.5E-03 4.3E-03 1.5E-03 1.9E-03 1.1E-03 1.1E-03
Eye irritants 2.5E+00 1.9E+00 1.8E+00 8.7E-01 8.0E-01 6.4E-01 4.9E-01 7.5E-01 5.7E-01 5.9E-01 5.0E-01 5.2E-01Respiratory irritants 1.2E+01 4.8E+00 5.2E+00 5.3E+00 4.2E+00 3.5E+00 3.1E+00 4.2E+00 4.4E+00 4.0E+00 3.7E+00 2.8E+00Neurological effects 5.3E-03 5.0E-03 5.0E-03 4.6E-03 4.6E-03 4.5E-03 4.5E-03 4.6E-03 4.5E-03 4.5E-03 4.5E-03 4.5E-03Reproductive/developmental effects 4.0E-02 3.1E-02 2.9E-02 1.4E-02 1.3E-02 1.0E-02 7.5E-03 1.2E-02 8.9E-03 9.2E-03 7.8E-03 8.1E-03
Respiratory irritants 2.0E+00 1.8E+00 1.4E+00 2.9E+00 2.4E+00 2.2E+00 2.1E+00 2.7E+00 2.1E+00 2.2E+00 2.1E+00 5.7E-01Respiratory effects 3.5E+00 9.6E-01 1.0E+00 4.1E+00 3.1E+00 2.7E+00 2.4E+00 3.2E+00 3.0E+00 3.1E+00 2.8E+00 5.7E-01Liver effects 3.2E-04 2.7E-04 2.1E-04 4.1E-04 3.3E-04 3.0E-04 2.8E-04 3.9E-04 2.9E-04 3.1E-04 2.9E-04 7.7E-05Neurological effects 1.8E-03 1.6E-03 1.6E-03 6.2E-03 6.2E-03 6.2E-03 6.2E-03 6.2E-03 6.2E-03 6.2E-03 6.2E-03 1.7E-03Reproductive/developmental effects 1.5E-02 1.3E-02 1.1E-02 2.7E-02 2.4E-02 2.3E-02 2.2E-02 2.6E-02 2.2E-02 2.3E-02 2.2E-02 6.1E-03Hematological effects 6.7E-02 5.8E-02 5.5E-02 2.1E-01 2.0E-01 2.0E-01 2.0E-01 2.1E-01 2.0E-01 2.0E-01 2.0E-01 5.5E-02
24-HOUR EXPOSURES
1-HOUR EXPOSURES
ANNUAL AVERAGE EXPOSURES
Endpoint of Concern
Page 1 of 1

Table 31: 2022 Mixture Assessment - Background Case
MPOI R1 R2 R3 R4 R5 R6 R7 R8 R9 R10 R11Potential Endpoint of MixtureEndpoint of Concern1-HOUR EXPOSURESEye irritants 3.1E-01 3.1E-01 3.1E-01 3.1E-01 3.1E-01 3.1E-01 3.1E-01 3.1E-01 3.1E-01 3.1E-01 3.1E-01 3.1E-01Respiratory irritants 1.1E+01 2.7E+00 2.6E+00 2.9E+00 2.7E+00 3.1E+00 2.3E+00 3.8E+00 3.6E+00 3.5E+00 2.3E+00 1.8E+00Neurological effects 1.3E-03 1.3E-03 1.3E-03 1.3E-03 1.3E-03 1.3E-03 1.3E-03 1.3E-03 1.3E-03 1.3E-03 1.3E-03 1.3E-03Reproductive/developmental effects 3.2E-04 3.2E-04 3.2E-04 3.2E-04 3.2E-04 3.2E-04 3.2E-04 3.2E-04 3.2E-04 3.2E-04 3.2E-04 3.2E-0424-HOUR EXPOSURESEye irritants 3.8E-01 3.8E-01 3.8E-01 3.8E-01 3.8E-01 3.8E-01 3.8E-01 3.8E-01 3.8E-01 3.8E-01 3.8E-01 3.8E-01Respiratory irritants 1.2E+01 4.9E+00 5.5E+00 5.0E+00 4.0E+00 3.7E+00 3.1E+00 4.9E+00 4.5E+00 3.8E+00 3.9E+00 3.0E+00Neurological effects 4.6E-03 4.6E-03 4.6E-03 4.6E-03 4.6E-03 4.6E-03 4.6E-03 4.6E-03 4.6E-03 4.6E-03 4.6E-03 4.6E-03Reproductive/developmental effects 5.8E-03 5.8E-03 5.8E-03 5.8E-03 5.8E-03 5.8E-03 5.8E-03 5.8E-03 5.8E-03 5.8E-03 5.8E-03 5.8E-03ANNUAL AVERAGE EXPOSURESRespiratory irritants 5.4E-01 4.7E-01 4.7E-01 2.0E+00 2.0E+00 2.0E+00 2.0E+00 2.0E+00 2.0E+00 2.0E+00 2.0E+00 2.0E+00Respiratory effects 3.5E+00 8.6E-01 8.9E-01 3.8E+00 2.9E+00 2.5E+00 2.3E+00 3.0E+00 2.9E+00 2.9E+00 2.7E+00 1.9E+00Liver effects 7.2E-05 6.3E-05 6.3E-05 2.6E-04 2.6E-04 2.6E-04 2.6E-04 2.6E-04 2.6E-04 2.6E-04 2.6E-04 2.6E-04Neurological effects 1.7E-03 1.5E-03 1.5E-03 6.2E-03 6.2E-03 6.2E-03 6.2E-03 6.2E-03 6.2E-03 6.2E-03 6.2E-03 6.2E-03Reproductive/developmental effects 5.9E-03 5.1E-03 5.1E-03 2.1E-02 2.1E-02 2.1E-02 2.1E-02 2.1E-02 2.1E-02 2.1E-02 2.1E-02 2.1E-02Hematological effects 5.5E-02 4.8E-02 4.8E-02 2.0E-01 2.0E-01 2.0E-01 2.0E-01 2.0E-01 2.0E-01 2.0E-01 2.0E-01 2.0E-01
Page 1 of 1

Table 32: 2022 Mixture Assessment - Airport Case
MPOI R1 R2 R3 R4 R5 R6 R7 R8 R9 R10 R11Potential Endpoint of MixtureEndpoint of Concern1-HOUR EXPOSURESEye irritants 1.0E+01 6.2E+00 6.9E+00 3.0E+00 2.1E+00 2.1E+00 9.1E-01 3.7E+00 1.8E+00 1.5E+00 1.2E+00 7.6E-01Respiratory irritants 6.0E+00 3.1E+00 3.6E+00 1.9E+00 1.6E+00 1.3E+00 9.3E-01 2.7E+00 1.5E+00 1.1E+00 9.6E-01 7.7E-01Neurological effects 1.3E-03 7.9E-04 8.8E-04 3.8E-04 2.6E-04 2.6E-04 1.1E-04 4.7E-04 2.2E-04 1.9E-04 1.5E-04 9.6E-05Reproductive/developmental effects 2.3E-02 1.4E-02 1.6E-02 7.0E-03 4.8E-03 4.8E-03 2.1E-03 8.6E-03 4.1E-03 3.6E-03 2.7E-03 1.8E-0324-HOUR EXPOSURESEye irritants 5.0E+00 3.4E+00 2.6E+00 1.4E+00 8.7E-01 6.4E-01 2.5E-01 1.4E+00 4.0E-01 5.4E-01 3.1E-01 2.8E-01Respiratory irritants 1.0E+00 5.5E-01 5.1E-01 2.5E-01 1.5E-01 1.1E-01 9.6E-02 3.0E-01 1.2E-01 1.1E-01 6.2E-02 8.2E-02Neurological effects 2.9E-03 2.5E-03 2.3E-03 2.0E-03 1.8E-03 1.8E-03 1.7E-03 2.0E-03 1.7E-03 1.7E-03 1.7E-03 1.7E-03Reproductive/developmental effects 7.9E-02 5.3E-02 4.0E-02 2.2E-02 1.4E-02 1.0E-02 4.0E-03 2.2E-02 6.3E-03 8.6E-03 4.9E-03 4.4E-03ANNUAL AVERAGE EXPOSURESRespiratory irritants 2.3E+00 1.9E+00 1.4E+00 1.9E+00 8.7E-01 5.2E-01 1.7E-01 2.2E+00 4.3E-01 5.1E-01 2.5E-01 1.5E-01Respiratory effects 1.1E-01 8.0E-02 6.5E-02 1.0E-01 6.3E-02 3.8E-02 1.5E-02 1.4E-01 3.1E-02 3.7E-02 2.1E-02 1.2E-02Liver effects 3.7E-04 3.0E-04 2.2E-04 3.0E-04 1.4E-04 8.3E-05 2.7E-05 3.5E-04 6.9E-05 8.2E-05 4.0E-05 2.4E-05Neurological effects 1.1E-04 8.9E-05 6.4E-05 9.0E-05 4.1E-05 2.5E-05 8.1E-06 1.0E-04 2.1E-05 2.4E-05 1.2E-05 7.1E-06Reproductive/developmental effects 1.4E-02 1.1E-02 8.0E-03 1.1E-02 5.2E-03 3.1E-03 1.0E-03 1.3E-02 2.6E-03 3.0E-03 1.5E-03 8.8E-04Hematological effects 1.3E-02 1.0E-02 7.6E-03 1.1E-02 4.9E-03 2.9E-03 9.6E-04 1.2E-02 2.4E-03 2.9E-03 1.4E-03 8.4E-04
Page 1 of 1

Table 33: 2022 Mixture Assessment - Cumulative Case
MPOI R1 R2 R3 R4 R5 R6 R7 R8 R9 R10 R11Potential Endpoint of MixtureEndpoint of Concern1-HOUR EXPOSURESEye irritants 1.0E+01 6.5E+00 7.2E+00 3.3E+00 2.4E+00 2.4E+00 1.2E+00 4.0E+00 2.1E+00 1.8E+00 1.5E+00 1.1E+00Respiratory irritants 1.3E+01 4.2E+00 4.4E+00 3.6E+00 3.2E+00 3.6E+00 2.5E+00 4.6E+00 4.0E+00 3.9E+00 2.5E+00 2.0E+00Neurological effects 2.6E-03 2.1E-03 2.2E-03 1.7E-03 1.6E-03 1.6E-03 1.4E-03 1.8E-03 1.5E-03 1.5E-03 1.5E-03 1.4E-03Reproductive/developmental effects 2.4E-02 1.5E-02 1.6E-02 7.3E-03 5.1E-03 5.2E-03 2.4E-03 9.0E-03 4.4E-03 3.9E-03 3.0E-03 2.1E-0324-HOUR EXPOSURESEye irritants 5.4E+00 3.7E+00 2.9E+00 1.8E+00 1.3E+00 1.0E+00 6.4E-01 1.8E+00 7.8E-01 9.3E-01 6.9E-01 6.6E-01Respiratory irritants 1.2E+01 5.2E+00 5.8E+00 5.0E+00 4.0E+00 3.7E+00 3.1E+00 5.0E+00 4.5E+00 3.9E+00 3.9E+00 3.0E+00Neurological effects 5.9E-03 5.4E-03 5.2E-03 4.9E-03 4.8E-03 4.8E-03 4.7E-03 5.0E-03 4.7E-03 4.7E-03 4.7E-03 4.7E-03Reproductive/developmental effects 8.5E-02 5.9E-02 4.6E-02 2.8E-02 2.0E-02 1.6E-02 9.8E-03 2.8E-02 1.2E-02 1.4E-02 1.1E-02 1.0E-02ANNUAL AVERAGE EXPOSURESRespiratory irritants 2.8E+00 2.3E+00 1.8E+00 3.9E+00 2.8E+00 2.5E+00 2.1E+00 4.2E+00 2.4E+00 2.5E+00 2.2E+00 5.8E-01Respiratory effects 3.5E+00 9.0E-01 9.5E-01 3.8E+00 3.0E+00 2.6E+00 2.3E+00 3.1E+00 2.9E+00 2.9E+00 2.6E+00 5.4E-01Liver effects 4.4E-04 3.6E-04 2.8E-04 5.7E-04 4.0E-04 3.5E-04 2.9E-04 6.1E-04 3.3E-04 3.5E-04 3.0E-04 7.9E-05Neurological effects 1.8E-03 1.6E-03 1.5E-03 6.2E-03 6.2E-03 6.2E-03 6.2E-03 6.3E-03 6.2E-03 6.2E-03 6.2E-03 1.7E-03Reproductive/developmental effects 2.0E-02 1.6E-02 1.3E-02 3.3E-02 2.7E-02 2.5E-02 2.2E-02 3.4E-02 2.4E-02 2.5E-02 2.3E-02 6.1E-03Hematological effects 6.8E-02 5.8E-02 5.5E-02 2.1E-01 2.1E-01 2.0E-01 2.0E-01 2.1E-01 2.0E-01 2.0E-01 2.0E-01 5.5E-02
Page 1 of 1

Table 34: 2032 Mixture Assessment - Background Case
MPOI R1 R2 R3 R4 R5 R6 R7 R8 R9 R10 R11Potential Endpoint of MixtureEndpoint of Concern1-HOUR EXPOSURESEye irritants 3.1E-01 3.1E-01 3.1E-01 3.1E-01 3.1E-01 3.1E-01 3.1E-01 3.1E-01 3.1E-01 3.1E-01 3.1E-01 3.1E-01Respiratory irritants 1.1E+01 2.7E+00 2.6E+00 2.9E+00 2.7E+00 3.1E+00 2.3E+00 3.8E+00 3.6E+00 3.5E+00 2.3E+00 1.8E+00Neurological effects 1.3E-03 1.3E-03 1.3E-03 1.3E-03 1.3E-03 1.3E-03 1.3E-03 1.3E-03 1.3E-03 1.3E-03 1.3E-03 1.3E-03Reproductive/developmental effects 3.2E-04 3.2E-04 3.2E-04 3.2E-04 3.2E-04 3.2E-04 3.2E-04 3.2E-04 3.2E-04 3.2E-04 3.2E-04 3.2E-0424-HOUR EXPOSURESEye irritants 3.8E-01 3.8E-01 3.8E-01 3.8E-01 3.8E-01 3.8E-01 3.8E-01 3.8E-01 3.8E-01 3.8E-01 3.8E-01 3.8E-01Respiratory irritants 1.2E+01 4.9E+00 5.5E+00 5.0E+00 4.0E+00 3.7E+00 3.1E+00 4.9E+00 4.5E+00 3.8E+00 3.9E+00 3.0E+00Neurological effects 4.8E-03 4.8E-03 4.8E-03 4.8E-03 4.8E-03 4.8E-03 4.8E-03 4.8E-03 4.8E-03 4.8E-03 4.8E-03 4.8E-03Reproductive/developmental effects 5.8E-03 5.8E-03 5.8E-03 5.8E-03 5.8E-03 5.8E-03 5.8E-03 5.8E-03 5.8E-03 5.8E-03 5.8E-03 5.8E-03ANNUAL AVERAGE EXPOSURESRespiratory irritants 5.4E-01 4.7E-01 4.7E-01 2.0E+00 2.0E+00 2.0E+00 2.0E+00 2.0E+00 2.0E+00 2.0E+00 2.0E+00 2.0E+00Respiratory effects 3.5E+00 8.6E-01 8.9E-01 3.8E+00 2.9E+00 2.5E+00 2.3E+00 3.0E+00 2.9E+00 2.9E+00 2.7E+00 1.9E+00Liver effects 7.2E-05 6.3E-05 6.3E-05 2.6E-04 2.6E-04 2.6E-04 2.6E-04 2.6E-04 2.6E-04 2.6E-04 2.6E-04 2.6E-04Neurological effects 1.7E-03 1.5E-03 1.5E-03 6.2E-03 6.2E-03 6.2E-03 6.2E-03 6.2E-03 6.2E-03 6.2E-03 6.2E-03 6.2E-03Reproductive/developmental effects 5.9E-03 5.1E-03 5.1E-03 2.1E-02 2.1E-02 2.1E-02 2.1E-02 2.1E-02 2.1E-02 2.1E-02 2.1E-02 2.1E-02Hematological effects 5.5E-02 4.8E-02 4.8E-02 2.0E-01 2.0E-01 2.0E-01 2.0E-01 2.0E-01 2.0E-01 2.0E-01 2.0E-01 2.0E-01
Page 1 of 1

Table 35: 2032 Mixture Assessment - Airport Case
MPOI R1 R2 R3 R4 R5 R6 R7 R8 R9 R10 R11Potential Endpoint of MixtureEndpoint of Concern1-HOUR EXPOSURESEye irritants 1.2E+01 6.9E+00 8.0E+00 4.1E+00 2.8E+00 2.2E+00 9.9E-01 4.5E+00 2.1E+00 2.6E+00 1.1E+00 9.5E-01Respiratory irritants 6.6E+00 3.5E+00 4.0E+00 2.4E+00 1.9E+00 1.4E+00 1.0E+00 2.7E+00 1.6E+00 1.5E+00 1.0E+00 1.0E+00Neurological effects 1.5E-03 8.5E-04 9.8E-04 5.1E-04 3.4E-04 2.8E-04 1.2E-04 5.6E-04 2.6E-04 3.2E-04 1.3E-04 1.2E-04Reproductive/developmental effects 2.8E-02 1.6E-02 1.9E-02 9.6E-03 6.4E-03 5.2E-03 2.3E-03 1.1E-02 4.8E-03 6.0E-03 2.5E-03 2.2E-0324-HOUR EXPOSURESEye irritants 5.8E+00 3.8E+00 3.2E+00 1.7E+00 1.3E+00 7.7E-01 2.4E-01 1.8E+00 5.0E-01 6.4E-01 3.3E-01 2.7E-01Respiratory irritants 1.2E+00 5.9E-01 6.6E-01 2.9E-01 2.0E-01 1.3E-01 8.8E-02 3.4E-01 1.6E-01 1.2E-01 6.8E-02 8.6E-02Neurological effects 3.2E-03 2.8E-03 2.6E-03 2.2E-03 2.1E-03 2.0E-03 1.9E-03 2.3E-03 1.9E-03 2.0E-03 1.9E-03 1.9E-03Reproductive/developmental effects 9.2E-02 6.0E-02 5.0E-02 2.6E-02 2.0E-02 1.2E-02 3.7E-03 2.8E-02 7.8E-03 1.0E-02 5.1E-03 4.2E-03ANNUAL AVERAGE EXPOSURESRespiratory irritants 2.8E+00 2.2E+00 1.6E+00 2.3E+00 1.1E+00 6.2E-01 2.1E-01 2.7E+00 5.2E-01 6.2E-01 3.1E-01 1.8E-01Respiratory effects 1.3E-01 9.2E-02 7.5E-02 1.2E-01 7.4E-02 4.4E-02 1.7E-02 1.6E-01 3.2E-02 4.3E-02 2.4E-02 1.5E-02Liver effects 4.5E-04 3.5E-04 2.6E-04 3.7E-04 1.7E-04 9.8E-05 3.3E-05 4.3E-04 8.3E-05 9.9E-05 4.9E-05 2.9E-05Neurological effects 1.3E-04 1.0E-04 7.4E-05 1.1E-04 4.8E-05 2.8E-05 9.5E-06 1.3E-04 2.4E-05 2.8E-05 1.4E-05 8.3E-06Reproductive/developmental effects 1.7E-02 1.3E-02 9.5E-03 1.4E-02 6.2E-03 3.6E-03 1.2E-03 1.6E-02 3.1E-03 3.7E-03 1.8E-03 1.1E-03Hematological effects 1.6E-02 1.2E-02 8.8E-03 1.3E-02 5.8E-03 3.4E-03 1.1E-03 1.5E-02 2.9E-03 3.4E-03 1.7E-03 1.0E-03
Page 1 of 1

Table 36: 2032 Mixture Assessment - Cumulative Case
Potential Endpoint of Mixture MPOI R1 R2 R3 R4 R5 R6 R7 R8 R9 R10 R11Endpoint of Concern1-HOUR EXPOSURESEye irritants 1.2E+01 7.2E+00 8.3E+00 4.4E+00 3.1E+00 2.6E+00 1.3E+00 4.9E+00 2.4E+00 2.9E+00 1.4E+00 1.3E+00Respiratory irritants 1.4E+01 4.5E+00 4.8E+00 3.8E+00 3.3E+00 3.6E+00 2.5E+00 4.8E+00 4.1E+00 4.1E+00 2.5E+00 2.1E+00Neurological effects 2.8E-03 2.2E-03 2.3E-03 1.8E-03 1.6E-03 1.6E-03 1.4E-03 1.9E-03 1.6E-03 1.6E-03 1.4E-03 1.4E-03Reproductive/developmental effects 2.8E-02 1.6E-02 1.9E-02 9.9E-03 6.7E-03 5.5E-03 2.6E-03 1.1E-02 5.1E-03 6.3E-03 2.8E-03 2.5E-0324-HOUR EXPOSURESEye irritants 6.2E+00 4.2E+00 3.6E+00 2.1E+00 1.7E+00 1.2E+00 6.2E-01 2.2E+00 8.8E-01 1.0E+00 7.1E-01 6.5E-01Respiratory irritants 1.2E+01 5.3E+00 5.8E+00 5.0E+00 4.1E+00 3.7E+00 3.1E+00 5.0E+00 4.5E+00 3.9E+00 3.9E+00 3.0E+00Neurological effects 6.2E-03 5.7E-03 5.6E-03 5.2E-03 5.1E-03 5.0E-03 4.9E-03 5.2E-03 4.9E-03 5.0E-03 4.9E-03 4.9E-03Reproductive/developmental effects 9.8E-02 6.6E-02 5.6E-02 3.2E-02 2.6E-02 1.8E-02 9.5E-03 3.4E-02 1.4E-02 1.6E-02 1.1E-02 1.0E-02ANNUAL AVERAGE EXPOSURESRespiratory irritants 3.4E+00 2.7E+00 2.1E+00 4.3E+00 3.0E+00 2.6E+00 2.2E+00 4.7E+00 2.5E+00 2.6E+00 2.3E+00 5.9E-01Respiratory effects 3.5E+00 9.1E-01 9.6E-01 3.8E+00 3.0E+00 2.6E+00 2.3E+00 3.1E+00 2.9E+00 2.9E+00 2.6E+00 5.4E-01Liver effects 5.2E-04 4.1E-04 3.2E-04 6.3E-04 4.3E-04 3.6E-04 3.0E-04 7.0E-04 3.5E-04 3.6E-04 3.1E-04 8.0E-05Neurological effects 1.8E-03 1.6E-03 1.5E-03 6.3E-03 6.2E-03 6.2E-03 6.2E-03 6.3E-03 6.2E-03 6.2E-03 6.2E-03 1.7E-03Reproductive/developmental effects 2.3E-02 1.8E-02 1.5E-02 3.5E-02 2.8E-02 2.5E-02 2.3E-02 3.8E-02 2.5E-02 2.5E-02 2.3E-02 6.2E-03Hematological effects 7.1E-02 6.0E-02 5.7E-02 2.1E-01 2.1E-01 2.0E-01 2.0E-01 2.2E-01 2.0E-01 2.0E-01 2.0E-01 5.5E-02
Page 1 of 1

APPENDIX F
RESPONSE TO AIR QUALITY STUDY COMMUNITY ADVISORY COMMITTEE COMMENTS ON THE DRAFT HUMAN HEALTH RISK ASSESSMENT REPORT

Air Quality Study At Toronto Pearson International Airport – Human Health Risk Assessment Report August 2015 Intrinsik Environmental Sciences Inc. Project # 20-21515 Page F-1
APPENDIX F: RESPONSE TO AIR QUALITY STUDY COMMUNITY ADVISORY COMMITTEE COMMENTS ON THE DRAFT HUMAN HEALTH RISK ASSESSMENT
F-1.0 INTRODUCTION Comments were received from the Air Quality Study Community Advisory Committee for the Draft Human Health Risk Assessment Report (Phase VI) of the Air Quality Study at Toronto Pearson International Airport, dated May 2015. These comments were received by Intrinsik on July 19, 2015 from the Greater Toronto Airports Authority. Within the current appendix, Intrinsik has provided responses to these comments and has made revisions to the Human Health Risk Assessment report, as necessary. F-2.0 SPECIFIC REVIEW COMMENTS Comment #1: Executive summary – pg xi – to assist with communication and interpretation of results, would be useful to add detail that concentrations are conservative estimates of dose; this doesn’t consider bioavailability/inhalation rate to impact occurrence of adverse outcome. This is mentioned in report, but would be useful to add in case reader only reviews executive summary. Response to Comment #1: Agreed. Further information detailing some of the conservative aspects of the exposure assessment was added to the Executive Summary. Comment #2: Some discussion of the meaning of “conservation estimates” would be beneficial. Response to Comment #2: It was assumed that the Reviewer meant “conservative estimates”. One of the overarching goals of the HHRA is to ensure that the potential for adverse effects, or the risk, is not underestimated. In order to ensure this, the exposure and toxicological assumptions used to derive the risk estimates tended to be overprotective, or conservative. Therefore, the HHRA presented conservative estimates of risk. Further information detailing the conservative nature of the risk assessment was added to the Executive Summary. Comment #3: Terminology of “Baseline case” is really “Background” conditions without GTAA contribution. Is this consistent with other published reports? Response to Comment #3: Yes. Air quality studies that evaluate emissions associated with point sources or facilities typically consider the three cases presented in the HHRA, including the “Baseline Case”. While the Toronto Pearson International Airport is not strictly a point source or a facility, the same approach was applied. This approach is also consistent with the HHRA that was conducted in 2004. No revisions were made to the HHRA.

Air Quality Study At Toronto Pearson International Airport – Human Health Risk Assessment Report August 2015 Intrinsik Environmental Sciences Inc. Project # 20-21515 Page F-2
Comment #4: Editorial typo on page xiii, 2nd paragraph, 3rd line, missing a word “outcome” or “event”. Response to Comment #4: The Reviewer is correct. The referenced sentence has been revised to include the word “outcome”. Comment #5: Exceedances of acute risks are described as “acceptable” since the frequency analysis indicates exceedances are intermittent in nature. I would reconsider this interpretation in communicating the results, as exceedances of acute thresholds can lead to adverse events by nature of the definition/criteria setting (e.g., acute criteria are set for short term events). Response to Comment #5: It is unclear exactly what text the Reviewer is referring to. Acute-duration risk estimates above the acceptable risk threshold of 1.0 were predicted for four (4) chemicals: NO2, SO2, acrolein, and formaldehyde. The HHRA team could not identify an instance in the report where the acute-duration risks associated with these chemicals were identified as “acceptable”. As noted by the Reviewer, frequency analyses were conducted in order to better characterize potential risks to human receptors. Based on the frequency analyses conducted, the predicted exceedances of the acceptable risk levels were found to be highly intermittent in nature; therefore, it was concluded that these chemicals, which were associated with TPIA emissions, were not considered to represent a significant health risk to the general population. No revisions were made to the HHRA. Comment #6: Tables 5-1, 5-2, 5-3, would be useful to add another column indicating basis as NOAEL/LOAEL/BMD. Response to Comment #6: It was the preference of the HHRA team to provide this information within Appendix A of the HHRA report (Toxicity Reference Value Identification and Selection). In many cases, the point of departure used to derive a TRV was not made available by the regulatory agency cited. No revisions were made to the HHRA. Comment #7: There is minimal description regarding the cumulative effects assessment methodology in the report. Response to Comment #7: The main focus of the HHRA report was to evaluate the contribution of TPIA by itself. The Cumulative Effects assessment only provides an indication of the contribution to the surrounding environment with significant caveats with respect to the air quality data used in the Baseline Case assessment. Additional description of the assessment methodology was added to the report. However, given that significant emphasis within the report was placed on the Baseline and Airport Alone cases, which make up the Cumulative Effects case, it was not deemed necessary to explain these components.

Air Quality Study At Toronto Pearson International Airport – Human Health Risk Assessment Report August 2015 Intrinsik Environmental Sciences Inc. Project # 20-21515 Page F-3
Comment #8: As exceedances of air quality criteria are reported, we recommend additional materials be prepared clearly interpret and to communicate the results externally. Response to Comment #8: While the production of additional communication materials are outside of the scope of the HHRA, Intrinsik will contribute to any discussions with the Community Advisory Committee as to how risks should be communicated with the public. Afterwards, Intrinsik can assist in producing the materials and can communicate the results with the public in the forum deemed most appropriate by the Community Advisory Committee.