air quality impact analysis review mid-kansas electric ... · pdf fileair quality impact...
TRANSCRIPT

Air Quality Impact Analysis Review
Mid-Kansas Electric Company, LLC. Rubart Station
Air Quality Construction Permit Application
Source ID No. 0670173 C-10021
Bureau of Air
Permitting Section
DRAFT

Table of Contents
Topic Page I. Introduction .............................................................................................................1 II. Facility Description .................................................................................................3 III. Air Quality Impact Analysis (AQIA) Applicability ...............................................6 IV. Model Selection ......................................................................................................7 V. Model Inputs ...........................................................................................................8 VI. Preliminary/Significance Modeling Analysis .........................................................12 VII. Refined/NAAQS Modeling Analysis .....................................................................18 VIII. PSD Increment Modeling Analysis ........................................................................21 IX. Additional Impact Analysis ....................................................................................24 X. Summary and Conclusions .....................................................................................28 Tables
Table 1. Emissions from the Proposed Project and PSD Significant Emission Rates ..................................................................................................................6 Table 2. Meteorological Data Sites .................................................................................9 Table 3. Receptor spacing used in dispersion modeling of the proposed facility ...............................................................................................................11 Table 4. Preliminary/Significance Modeling Results .....................................................12 Table 5. Radius of impact (ROI), receptor grid size, radius selected (km) for nearby
sources, and number of nearby sources used in the refined/NAAQS modeling analysis ..............................................................................................................18
Table 6. Refined/NAAQS Modeling Results ..................................................................19 Table 7. PSD increment (maximum allowable increase) for Class II areas ..................21 Table 8. PSD increment Modeling Results ....................................................................23 Table 9. Proposed Rubart Station PSD Increment Consumption ...................................23

Table of Contents
Topic Page Figures Figure 1. Wind Rose for Years 2006 to 2010 .................................................................9 Figure 2. Map showing the proposed Rubart Station of the Mid-Kansas Electric
Company, LLC (Mid-Kansas), Garden City Regional Airport (KGCK) and Dodge City Regional Airport (KDDC) Meteorological Stations ....................10
Figure 3. SIL Modeling Isopleths for annual NO2 ..........................................................13 Figure 4. SIL Modeling Isopleths for 1-hour NO2 ..........................................................14 Figure 5. SIL Modeling Isopleths for annual PM2.5 ........................................................15 Figure 6. SIL Modeling Isopleths for 24-hour PM2.5 ......................................................16 Figure 7. SIL Modeling Isopleths for 24-hour PM10 ......................................................17 Figure 8. Refined/NAAQS Modeling Isopleths for 1-hour NO2 ....................................20 Figure 9. PSD Increment Modeling Isopleths for annual PM2.5 .....................................22

Page 1 of 29
I. Introduction
The Mid-Kansas Electric Company, LLC (Mid-Kansas) submitted a Prevention of Significant Deterioration (PSD) construction permit application to install and operate 24 natural gas-fired spark ignition (SI) reciprocating internal combustion engines (RICE) (each with 10 megawatts (MW) power output) and auxiliary emission units that include one (1) 2-MMBTU/hr fuel-gas heater, one (1) emergency fire pump engine (with 190-hp power output), two (2) emergency AC generator sets (each with 450kW power output), one (1) 280-gallon fuel oil storage tank, 12 circuit breakers, and four (4) circuit switchers at the Rubart Station to be located in Grant County, Kansas, approximately 14 miles east of Ulysses, Kansas. The proposed Rubart Station is a major PSD source based on the potential emissions of greenhouse gases (GHG) in excess of 100,000 tons per year. Mid-Kansas conducted an air dispersion modeling analysis of the following pollutants that exceeded the PSD significance thresholds: nitrogen oxides (NOx), carbon monoxide (CO), particulate matter with aerodynamic diameter equal to or less than 10 and 2.5 micrometers (PM10 and PM2.5). The proposed station is designed to meet the reserve planning and capacity margins required by the Southwest Power Pool, Inc. (SPP). The reciprocating internal combustion engines (RICE) to be installed at the proposed station are rapid-response RICE generation sources and will be dispatched in response to nearly constant changes in energy and voltage demand signals arising from integration of the station with wind based energy resources.
Sunflower Electric Power Corporation (Sunflower), a not-for-profit Kansas corporation doing business as a cooperative, operates the electric business of Mid-Kansas. Sunflower will be the operator of the proposed Rubart Station owned by Mid-Kansas.
An Air Quality Impact Analysis (AQIA) was submitted by Mid-Kansas as part of the PSD construction permit application to show the impact of the proposed project on the National Ambient Air Quality Standards (NAAQS) and PSD Class II increment consumption allowances. This document summarizes the Kansas Department of Health and Environment (KDHE) review and evaluation of Mid-Kansas’s AQIA.
The PSD construction permit application, with a compact disc (CD) containing the air dispersion modeling files, was received by KDHE on July 10, 2012. Copies of the PSD construction permit application and the CD containing the modeling files were mailed to the Environmental Protection Agency (EPA) Region 7 for their review. Table ES-1 of the Executive Summary section (or Table 1-1 of the Introduction section) of the PSD construction permit application shows the potential emissions from the proposed Rubart Station. Part 6 of the PSD construction permit application describes the air dispersion modeling that includes the significant impact, PSD increment, and NAAQS modeling analyses. Part 7 of the PSD construction permit application describes the additional

Page 2 of 29
impact study that includes construction impacts; vegetation impacts; soil impacts; industrial, residential, and commercial growth impacts; and visibility and deposition analysis.
On July 16, 2012, an additional modeling scenario (25% load) was submitted. On August 1, 2012, Mid-Kansas sent the updated Table 6-2 (page 6-4) of the PSD construction permit application.
Tables 6-1 and 6-2 of the PSD construction permit application show the parameters used in the dispersion modeling. Appendix A of the permit application shows the modeling protocol submitted in February 2012. Appendix G shows the modeling figures and Appendix H refers to the content of the CD and shows the result of VISCREEN Level 1 screening results for a Class I area.
On August 23, 2012, Mid-Kansas sent via email a letter of request for approval to EPA Region 7 to use the Tier 3 Ozone Limiting Method (OLM) to model the 1-hour and annual nitrogen dioxide (NO2) impacts from the proposed Rubart Station. On August 28, 2012, Mid-Kansas submitted via email the VISCREEN Level 2 analysis results for a Class II area.
Dispersion modeling for this project includes a demonstration of compliance with 1-hour NO2 NAAQS published by the EPA on February 9, 2010, with an effective date of April 12, 2010. EPA did not issue significant impact levels (SILs), significant monitoring concentrations (SMCs), and other implementation guidance and tools that are needed for 1-hour NO2 NAAQS and PSD increment dispersion modeling analysis. Thus, KDHE developed an interim SIL for 1-hour NO2 NAAQS. The KDHE-established interim SIL is to be valid until an EPA promulgated SIL is effective and adopted in the Kansas Air Quality Regulations. Guidance was issued by EPA for an NO2 1-hour interim SIL on June 29, 2010. In this modeling analysis of Rubart Station, the KDHE SIL was used.
On October 20, 2010, the EPA published final SIL values in the Federal Register for 24-hour and annual PM2.5 NAAQS, with an effective date of December 20, 2010. These PM2.5 SILs will have to be incorporated in the Kansas Air Quality Regulations before they become effective in Kansas. Mid-Kansas has agreed to conduct modeling using these new standards for 24-hour and annual PM2.5 NAAQS.

Page 3 of 29
II. Facility Description The proposed power generation plant will have a total nominal power output of approximately 240 MW. Each of the 24 natural gas-fired SI RICE (designated as ENG_1 through ENG_24) has a design power output rating of 10 MW (13,405 hp). Emissions estimated for the 24 engines assume an annual operational schedule of 8,760 hours per year.
One (1) 2-MMBtu/hr fuel-gas heater will be installed to maintain the temperature of the natural gas fuel, in compliance with the manufacturer’s recommendations for fuel quality parameters. Emissions estimated for the fuel-gas heater assume an annual operational schedule of 8,760 hours per year. One (1) emergency fire pump will be installed for use in case of fire. The emergency fire pump may be tested each week to confirm that it is working properly. The fire pump will have a maximum power output of 190 hp and will be operated solely on ultra low sulfur diesel (ULSD) fuel. Mid-Kansas expects to operate the emergency fire pump for up to 100 hours annually for testing and maintenance purposes, and therefore requests a limitation on its routine hours of operation. Two (2) emergency AC generators will be built to support the plant safety and control features in case of a power interruption. Each emergency generator will have a maximum power output of 450 kW and will be operated solely on natural gas fuel. One (1) emergency AC generator is being installed as a redundancy unit of the other generator. Only one (1) emergency AC generator was considered in the modeling. Mid-Kansas will operate only one (1) emergency generator at a time. Mid-Kansas expects to operate the emergency generator for up to 100 hours annually for testing and maintenance purposes, and therefore requests a limitation on routine hours of operation for this equipment.
Mid-Kansas proposes that each of the RICE will operate without restriction on utilization. The fuel-gas heater will be operating 8,760 hours annually because it will be operational whenever gas is flowing to any of the engines. The emergency fire pump and emergency AC generator are proposed to operate up to 100 annual hours, and their use will be limited primarily to testing and maintenance. Table 1-1 of the PSD construction permit application identifies the potential emissions of the proposed facility. The maximum start-up emissions for the 24 RICE are included in the potential emissions estimate. The start-up emissions are based on three (3) start-up events per engine during a 24-hour period (worse-case) or equivalent to 1,095 start-up events per year for each engine. Table 1-1 of the PSD construction permit application also includes emissions from the auxiliary equipment proposed as part of the Rubart Station.

Page 4 of 29
Emissions from the proposed Rubart Station were modeled by Mid-Kansas using six (6) different emission scenarios described below. The emissions from start-up operations were added to the emissions of 24 RICE in Scenario 1, which gave the worse-case modeled impacts among all scenarios:
Scenario 1 assumes all 24 RICE operate 8,760 hours per year on natural gas at
100 % load and start-up emissions of the 24 RICE were added in the emission rates of 24 RICE; one (1) fuel-gas heater operates 8,760 hours per year at 100 % load; one (1) emergency fire pump operates 100 hours per year at 100 % load; and one (1) emergency AC generator operates 100 hours per year at 100 % load.
Scenario 2 assumes all 24 RICE operate 8,760 hours per year on natural gas at 100% load (the start-up emissions were not included in the emission rates of 24 RICE); one (1) fuel-gas heater operates 8,760 hours per year at 100 % load; one (1) emergency fire pump operates 100 hours per year at 100 % load; and one (1) emergency AC generator operates 100 hours per year at 100 % load.
Scenario 3 assumes all 24 RICE operate 8,760 hours per year on natural gas at 85% load (the start-up emissions were not included in the emission rates of 24 RICE); one (1) fuel-gas heater operates 8,760 hours per year at 100 % load; one (1) emergency fire pump operates 100 hours per year at 100 % load; and one (1) emergency AC generator operates 100 hours per year at 100 % load.
Scenario 4 assumes all 24 RICE operate 8,760 hours per year on natural gas at 75% load (the start-up emissions were not included in the emission rates of 24 RICE); one (1) fuel-gas heater operates 8,760 hours per year at 100 % load; one (1) emergency fire pump operates 100 hours per year at 100 % load; and one (1) emergency AC generator operates 100 hours per year at 100 % load.
Scenario 5 assumes all 24 RICE operate 8,760 hours per year on natural gas at 50% load (the start-up emissions were not included in the emission rates of 24 RICE); one (1) fuel-gas heater operates 8,760 hours per year at 100 % load; one (1) emergency fire pump operates 100 hours per year at 100 % load; and one (1) emergency AC generator operates 100 hours per year at 100 % load.
Scenario 6 assumes all 24 RICE operate 8,760 hours per year on natural gas at 25% load (the start-up emissions were not included in the emission rates of 24 RICE); one (1) fuel-gas heater operates 8,760 hours per year at 100 % load; one (1) emergency fire pump operates 100 hours per year at 100 % load; and one (1) emergency AC generator operates 100 hours per year at 100 % load.
For 1-hour NO2 NAAQS modeling, the intermittent emissions units (emergency fire pump and emergency AC generator) were not included in Scenarios 1 through 6:

Page 5 of 29
Scenario 1 assumes all 24 RICE operate 8,760 hours per year on natural gas at 100 % load and start-up emissions of the 24 RICE were added in the emission rates of 24 RICE; and one (1) fuel-gas heater operates 8,760 hours per year at 100 % load.
Scenario 2 assumes all 24 RICE operate 8,760 hours per year on natural gas at 100% load (the start-up emissions were not included in the emission rates of 24 RICE); and one (1) fuel-gas heater operates 8,760 hours per year at 100 % load.
Scenario 3 assumes all 24 RICE operate 8,760 hours per year on natural gas at 85% load (the start-up emissions were not included in the emission rates of 24 RICE); and one (1) fuel-gas heater operates 8,760 hours per year at 100 % load.
Scenario 4 assumes all 24 RICE operate 8,760 hours per year on natural gas at 75% load (the start-up emissions were not included in the emission rates of 24 RICE); and one (1) fuel-gas heater operates 8,760 hours per year at 100 % load.
Scenario 5 assumes all 24 RICE operate 8,760 hours per year on natural gas at 50% load (the start-up emissions were not included in the emission rates of 24 RICE); and one (1) fuel-gas heater operates 8,760 hours per year at 100 % load.
Scenario 6 assumes all 24 RICE operate 8,760 hours per year on natural gas at
25% load (the start-up emissions were not included in the emission rates of 24 RICE); and one (1) fuel-gas heater operates 8,760 hours per year at 100 % load.
KDHE modeling scenarios, for all pollutants and averaging times, were the same with Mid-Kansas’ modeling scenarios.

Page 6 of 29
III. Air Quality Impact Analysis (AQIA) Applicability
The proposed facility is a major source as defined by K.A.R. 28-19-350, Prevention of Significant Deterioration. Major sources with pollutant emissions exceeding significant emission rates must undergo PSD review. The owner or operator must demonstrate that allowable emission increases from the proposed facility would not cause or contribute to air pollution in violation of:
A. any NAAQS in any air quality control region; or B. any applicable maximum allowable increase over the baseline concentration in
any area.
Emissions from the proposed project and significant emission rate thresholds are listed in Table 1 below.
Table 1. Emissions From the Proposed Project and PSD Significant Emission Rates
Pollutant a Project Emissions with
Controls (tpy) Significant Emission Rate
(tpy) Exceeds Significant
Emission Rate?
NOx 400.5 40 Yes SO2 14.6 40 No PM 151.2 25 Yes
PM10 b
151.2 15 Yes PM2.5
b 151.2 10 Yes
CO 896.90 100 Yes VOC 684.50 40 Yes
Ozone N/A 40 tpy VOC or 40 tpy NOx Yes a NOx = Nitrogen oxides; SO2 =Sulfur dioxide; PM = Total particulate matter; PM10 = Particulate matter less than 10 micrometers (µm) in diameter; PM2.5 = Particulate matter less than 2.5 µm in diameter; CO = Carbon monoxide; and VOC = Volatile organic compounds. b Filterable plus condensable.

Page 7 of 29
IV. Model Selection
A dispersion model is a computer simulation that uses mathematical equations to predict air pollution concentrations based on weather, topography, and emissions data. AERMOD is the current model preferred by EPA for use in nearfield regulatory applications, per 40 CFR Part 51 Appendix W, Section 3.1.2, and Appendix A to Appendix W:
“AERMOD is a steady-state plume dispersion model for assessment of pollutant concentrations from a variety of sources. AERMOD simulates transport and dispersion from multiple sources based on an up-to-date characterization of the atmospheric boundary layer. AERMOD is appropriate for: point, volume, and area sources; surface, near-surface, and elevated releases; rural or urban areas; simple and complex terrain; transport distances over which steady-state assumptions are appropriate, up to 50 km; 1-hour to annual averaging times; and continuous toxic air emissions.”
The AERMOD modeling system Version 12060 (using Lakes Environmental software AERMOD View version 7.4.1) was used by KDHE to evaluate the impacts of the following pollutant and averaging times from the proposed facility:
1-hour and annual NO2; 24-hour and annual PM2.5; 24-hour and annual PM10; 1-hour and 8-hour CO.
The AERMOD modeling system Version 12060 (using Oris Solutions software BEEST version 10.0) was used by Mid-Kansas to evaluate the impacts of the following pollutant and averaging times from the proposed facility:
1-hour and annual NO2; 24-hour and annual PM2.5; 24-hour and annual PM10; 1-hour and 8-hour CO.
AERMET Version 11059 was used to prepare meteorological data, which was provided by KDHE to Mid-Kansas for the years 2006-2010. AERMINUTE Version 11059 was used to process 1-minute ASOS wind data to generate hourly average winds for input to AERMET.
Mid-Kansas submitted a request for approval for the use of the Tier 3 OLM method for modeling the 1-hour and annual NO2 to EPA Region 7. Details of the requests to use the Tier 3 OLM non-regulatory model option is described in an email sent to EPA Region on August 23, 2012.

Page 8 of 29
V. Model Inputs A. Source Data
The emission rates, point locations, and stack parameters for the emission sources used in the model were based on the data presented in the permit application received by KDHE on July 10, 2012 and addendum received on July 16, 2012 for the 25% load modeling scenario.
B. Urban or Rural
A review of United States Geological Survey (USGS) National Land Cover Data (NLCD) for 2006 for the site and a surrounding three (3) kilometer radius was reviewed to determine if rural or urban site classification should be used for modeling. The area was deemed “rural” for air modeling purposes.
C. Terrain
The proposed project was modeled using the Elevated Terrain Mode. AERMAP processor was used by the applicant and KDHE to process the National Elevation Data (NED) files from the USGS to interpolate elevations at each receptor. The AERMAP processor was used to process the NED files and generate source, building, and receptor heights and hill height scales as applicable.
D. Meteorological Data
Five (5) consecutive years of meteorological data, considered representative of the climatology and topography for the proposed facility location, was used in the AQIA. AERMET, the meteorological data pre-processor for the AERMOD modeling system, extracts and processes data in order to calculate the boundary layer parameters that are necessary for the calculation of pollutant concentrations within the atmosphere. The surface and upper air measurements used for this analysis were for the years from 2006 to 2010. The upper air data was from the Dodge City Regional Airport (KDDC) meteorological station, WBAN# 13985 and the surface air data was from the Garden City Regional Airport (KGCK) meteorological station, WBAN #23064. Information on these stations is shown in Table 2 and a wind rose for the cumulative five-year period is provided in Figure 1. Figure 2 shows a map that includes the proposed Rubart station, the KDDC and the KGCK airport meteorological stations.
E. Center of the Facility
The center of the proposed Rubart Station is located at the following: Zone 14, Easting: 314,180.8 meters, and Northing: 4,158,892.0 meters.

Page 9 of 29
Table 2. Meteorological Data Sites
Station Type Station Name WBAN # Latitude/Longitude
Elevation (m)
Years of Data
Surface Air Station
Garden City Regional Airport (KGCK)
23064 37.9221 /-100.7242 878.4 2006-2010
Upper Air Station
Dodge City Regional Airport (KDDC)
13985 37.7711 /-99.9692
787.0
2006-2010
Figure 1. Wind Rose for Years 2006 to 2010

Page 10 of 29
Figure 2. Map showing the proposed Rubart Station of the Mid-Kansas Electric Company, LLC (Mid-Kansas), Garden City Regional Airport (KGCK) and Dodge City Regional Airport (KDDC) Meteorological Stations The surface characteristics for use with the AERMET program were determined using AERSURFACE. Evaluation of a comparison of the distance and the surface characteristics surrounding the KGCK regional airport meteorological station and the Rubart Station indicates that the KGCK regional airport meteorological station data are representative of the site.
F. Building Downwash Good Engineering Practice (GEP) stack height for stacks constructed after January 12, 1979 is defined as the greater of 65 meters, measured from the ground-level elevation at the base of the stack, and Stack height calculated from the following EPA’s refined formula:

Page 11 of 29
Hg = H + 1.5L Where Hg = GEP stack height, measured from the ground-level elevation at the base of the stack H = height of nearby structure(s) measured from the ground-level elevation at the base of the stack L = lesser dimension of the building height or the greatest crosswind distance of the building also known as maximum projected width, of nearby structure(s)
Emissions released at stack heights greater than GEP are modeled at GEP stack height. Emissions released at or below GEP are modeled at their true release height. Building downwash was calculated using the Building Profile Input Program (BPIP) with plume rise model enhancements (PRIME). It was determined, according to the BPIP-PRIME models results, that the GEP stack height for the RICE will not exceed 65 meters. The stack height of 32.31 meters (106 feet) was used in AERMOD modeling.
G. Receptors AERMOD estimates ambient concentrations using a network of points, called receptors, throughout the region of interest. The model uses emissions and weather information to estimate ambient pollutant concentrations at each receptor location. Model receptors are typically placed at locations that reflect the public’s exposure to the pollutant. Receptors were placed at 50 meter spacing along the proposed facility’s fenceline. The minimum receptor spacing used in the dispersion modeling for the proposed facility consisted of a multi-tiered grid shown in Table 3. Table 3. Receptor spacing used in dispersion modeling of the proposed facility
Distance From Facility Boundary (meters)
Receptor Spacing (meters)
Facility Center to 1000 50 1000 to 2,000 100
2,000 to 10,000 250 10,000 to 50,000 1000
Preliminary or screening modeling analysis resulting in a significant impact for any receptors at or beyond the facility fenceline requires a full impact (refined) analysis. The model radius of impact (ROI) was determined by first finding the significant impact area (SIA) or distance to the farthest receptor showing a concentration greater than the SIL. The SIA is then added to 50 kilometers (km) and the area within this radius from the center of the facility is considered to be the ROI.
Page 12 of 29
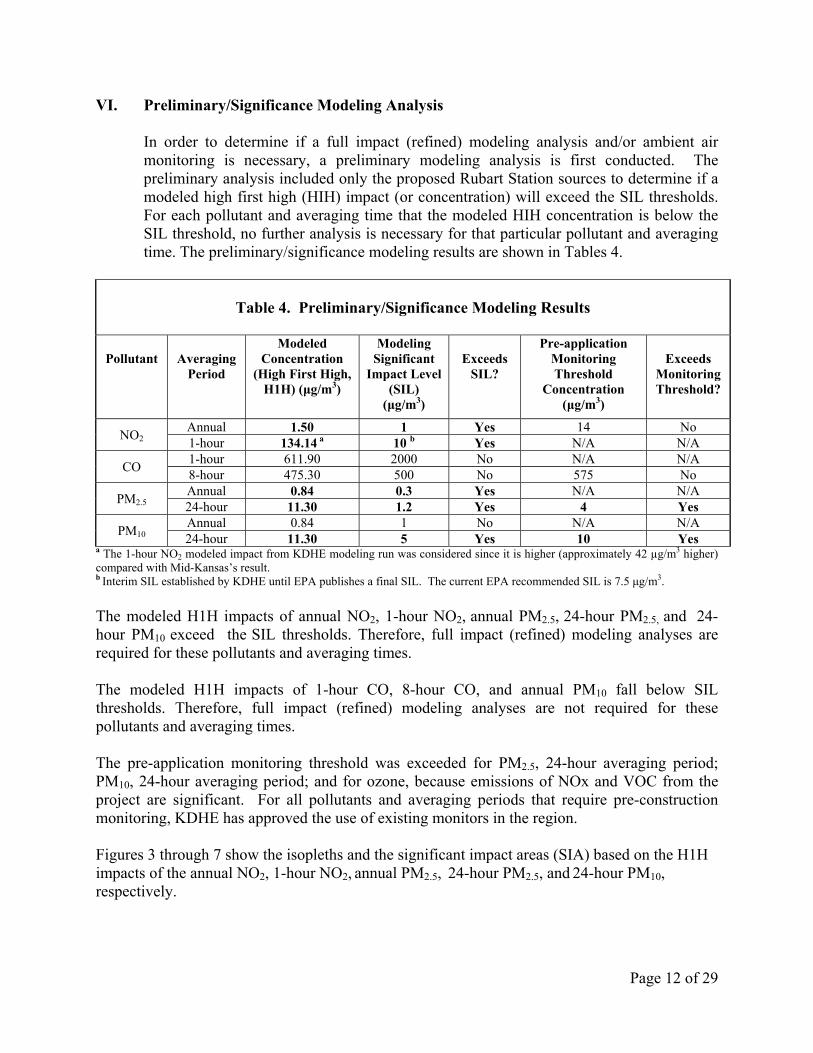
VI. Preliminary/Significance Modeling Analysis
In order to determine if a full impact (refined) modeling analysis and/or ambient air monitoring is necessary, a preliminary modeling analysis is first conducted. The preliminary analysis included only the proposed Rubart Station sources to determine if a modeled high first high (HIH) impact (or concentration) will exceed the SIL thresholds. For each pollutant and averaging time that the modeled HIH concentration is below the SIL threshold, no further analysis is necessary for that particular pollutant and averaging time. The preliminary/significance modeling results are shown in Tables 4.
Table 4. Preliminary/Significance Modeling Results
Pollutant
Averaging
Period
Modeled Concentration
(High First High, H1H) (μg/m3)
Modeling Significant
Impact Level (SIL)
(μg/m3)
Exceeds
SIL?
Pre-application Monitoring Threshold
Concentration (μg/m3)
Exceeds
Monitoring Threshold?
NO2 Annual 1.50 1 Yes 14 No 1-hour 134.14 a 10 b Yes N/A N/A
CO 1-hour 611.90 2000 No N/A N/A 8-hour 475.30 500 No 575 No
PM2.5 Annual 0.84 0.3 Yes N/A N/A 24-hour 11.30 1.2 Yes 4 Yes
PM10 Annual 0.84 1 No N/A N/A 24-hour 11.30 5 Yes 10 Yes
a The 1-hour NO2 modeled impact from KDHE modeling run was considered since it is higher (approximately 42 µg/m3 higher) compared with Mid-Kansas’s result. b Interim SIL established by KDHE until EPA publishes a final SIL. The current EPA recommended SIL is 7.5 μg/m3.
The modeled H1H impacts of annual NO2, 1-hour NO2, annual PM2.5, 24-hour PM2.5, and 24-hour PM10 exceed the SIL thresholds. Therefore, full impact (refined) modeling analyses are required for these pollutants and averaging times. The modeled H1H impacts of 1-hour CO, 8-hour CO, and annual PM10 fall below SIL thresholds. Therefore, full impact (refined) modeling analyses are not required for these pollutants and averaging times. The pre-application monitoring threshold was exceeded for PM2.5, 24-hour averaging period; PM10, 24-hour averaging period; and for ozone, because emissions of NOx and VOC from the project are significant. For all pollutants and averaging periods that require pre-construction monitoring, KDHE has approved the use of existing monitors in the region. Figures 3 through 7 show the isopleths and the significant impact areas (SIA) based on the H1H impacts of the annual NO2, 1-hour NO2, annual PM2.5, 24-hour PM2.5, and 24-hour PM10, respectively.

Page 13 of 29
Figure 3. SIL Modeling Isopleths for annual NO2

Page 14 of 29
Figure 4. SIL Modeling Isopleths for 1-hour NO2

Page 15 of 29
Figure 5. SIL Modeling Isopleths for annual PM2.5

Page 16 of 29
Figure 6. SIL Modeling Isopleths for 24-hour PM2.5

Page 17 of 29
Figure 7. SIL Modeling Isopleths for 24-hour PM10

Page 18 of 29
VII. Refined/NAAQS Modeling Analysis
Refined (cumulative) modeling was conducted to demonstrate compliance with the NAAQS for each pollutant and averaging period for which the SIL was exceeded. Evaluation of compliance with the NAAQS requires that the refined modeling accounts for the combined impact of the proposed project, nearby sources, and background concentrations.
Table 5 shows the radius of impact (ROI), the receptor grid size, and the nearby sources used in the refined/NAAQS modeling analysis. The SIA for the 1-hour NO2 averaging period extended beyond the 10 km by 10 km Cartesian receptor grid used (Figure 4), therefore, the receptor grid was extended to a 50 km by 50 km receptor grid for NAAQS modeling. Nearby NO2 sources within 20 km from the center of the facility were included in the 1-hour NO2 NAAQS modeling.
Table 5. Radius of impact (ROI), receptor grid size, radius selected (km) for nearby sources, and number of nearby sources used in the refined/NAAQS modeling analysis
Pollutant ROI (km) Receptor grid size Radius selected for
nearby sources from center of the facility (km)
Number of nearby sources
1-hour NO2 50 50 km by 50 km grid 20 120 Annual NO2 10 10 km by 10 km grid 50 318
24-hour PM2.5 10 10 km by 10 km grid 20 5 Annual PM2.5 10 10 km by 10 km grid 50 54 24-hour PM10 10 10 km by 10 km grid 20 5
The March 1, 2011 EPA Memorandum by Tyler Fox (Subject: Additional Clarification Regarding Application of Appendix W Modeling Guidance for the 1-hour NO2 National Ambient Air Quality Standard) recommends including nearby sources within about 10 km of the project location for the 1-hour NO2 NAAQS modeling. KDHE typically uses a radius of 20 km to select nearby sources for short term standards (e.g., 1-hour standards and 24-hour standards) for NAAQS modeling. If a large source outside this radius is identified and is expected to cause a significant concentration gradient in the vicinity of the proposed source, it may also be included. For long-term standards (e.g. annual standards), KDHE typically uses a radius of 50 km to select nearby sources for NAAQS modeling using AERMOD.
Table 6 shows the refined/NAAQS modeling results.
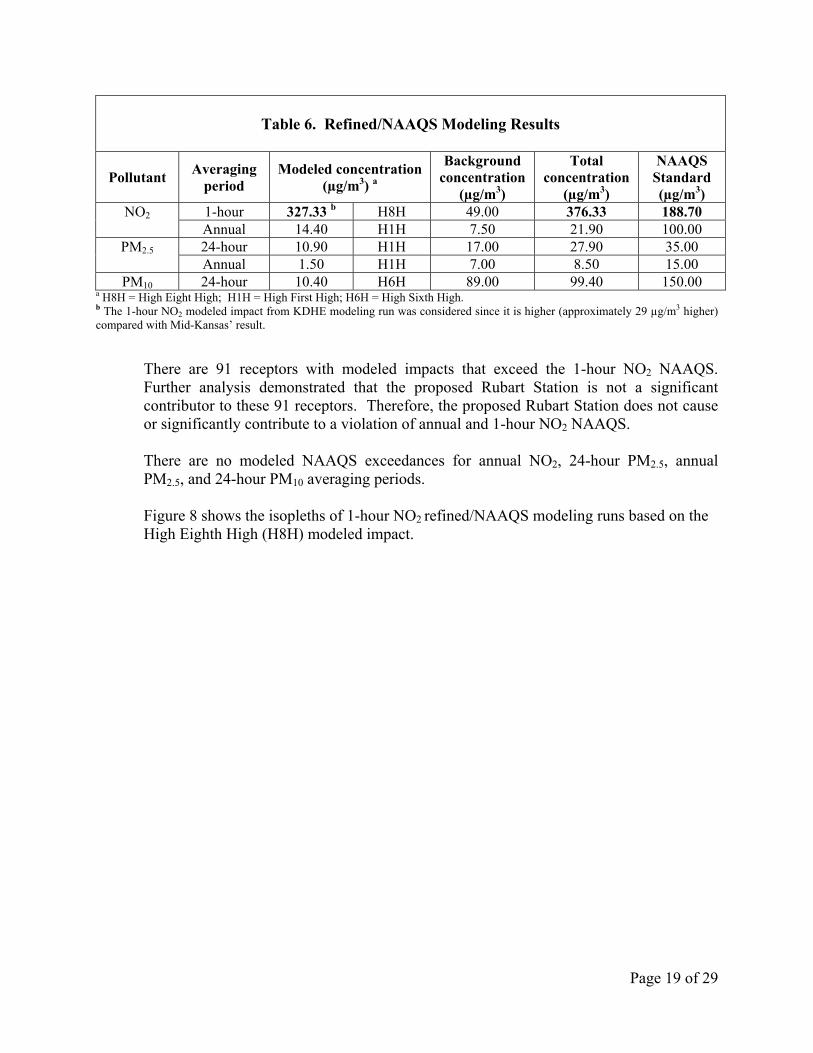
Page 19 of 29
Table 6. Refined/NAAQS Modeling Results
Pollutant Averaging
period Modeled concentration
(µg/m3) a
Background concentration
(µg/m3)
Total concentration
(µg/m3)
NAAQS Standard (µg/m3)
NO2 1-hour 327.33 b H8H 49.00 376.33 188.70 Annual 14.40 H1H 7.50 21.90 100.00
PM2.5 24-hour 10.90 H1H 17.00 27.90 35.00 Annual 1.50 H1H 7.00 8.50 15.00
PM10 24-hour 10.40 H6H 89.00 99.40 150.00 a H8H = High Eight High; H1H = High First High; H6H = High Sixth High. b The 1-hour NO2 modeled impact from KDHE modeling run was considered since it is higher (approximately 29 µg/m3 higher) compared with Mid-Kansas’ result.
There are 91 receptors with modeled impacts that exceed the 1-hour NO2 NAAQS. Further analysis demonstrated that the proposed Rubart Station is not a significant contributor to these 91 receptors. Therefore, the proposed Rubart Station does not cause or significantly contribute to a violation of annual and 1-hour NO2 NAAQS.
There are no modeled NAAQS exceedances for annual NO2, 24-hour PM2.5, annual PM2.5, and 24-hour PM10 averaging periods.
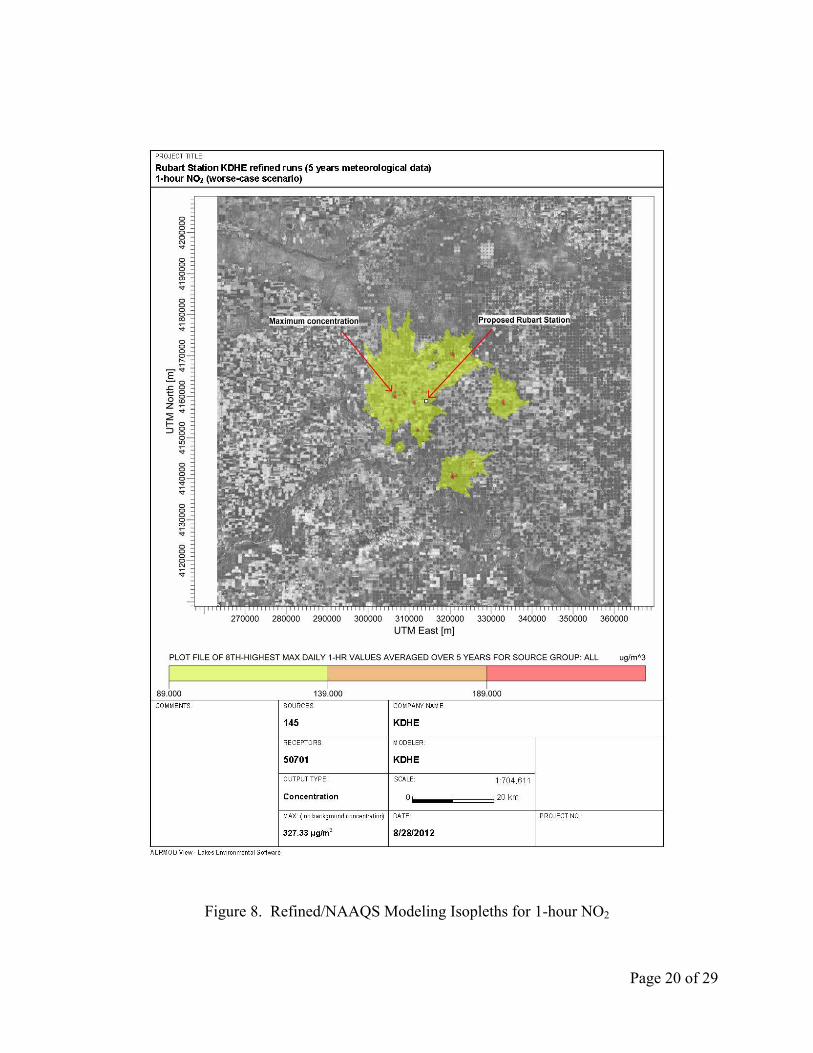
Figure 8 shows the isopleths of 1-hour NO2 refined/NAAQS modeling runs based on the High Eighth High (H8H) modeled impact.
Page 20 of 29
Figure 8. Refined/NAAQS Modeling Isopleths for 1-hour NO2

Page 21 of 29
VIII. PSD Increment Modeling Analysis
PSD increment is the maximum allowable increase in concentration that is allowed to occur above a baseline concentration for a pollutant. Significant deterioration in air quality is said to occur when the amount of new pollution would exceed the applicable PSD increment. [October 1990 Draft New Source Review (NSR) Workshop Manual for PSD and Nonattainment Area Permitting] Table 7 shows the PSD increment for PM2.5, PM10, and NO2 for Class II areas.
Table 7. PSD increment (maximum allowable increase) for Class II areas
Pollutant Averaging period PSD increment (maximum allowable
increase) for Class II area (µg/m3) NO2 Annual 25
PM2.5 24-hour 9 Annual 4
PM10 24-hour 30
To determine the PSD increment consumption (or expansion) in a PSD area, a PSD increment inventory is needed for increment dispersion modeling analysis. Mid-Kansas has agreed to use the NAAQS nearby source inventory to determine compliance with PSD increment for a Class II area for annual NO2, 24-hour PM2.5, annual PM2.5 and 24-hour PM10.
The proposed Rubart Station is the first completed PSD application submitted after the PM2.5 trigger date of October 20, 2011, therefore, the minor source baseline date will be established by this PSD application. This PSD application is deemed complete by KDHE on December 20, 2012. Figure 9 shows that Rubart Station’s annual PM2.5 modeled concentration exceeds the significant ambient impact of 0.3 ug/m3 in Grant County. The PM2.5 minor source baseline date is established in Grant County, Kansas on December 20, 2012.

Page 22 of 29
Figure 9. PSD Increment Modeling Isopleths for annual PM2.5

Page 23 of 29
Table 8 shows the PSD increment modeling results. Seven (7) receptors, located approximately 8 km west-southwest of the proposed Rubart Station exceeded 24-hour PM2.5 PSD increment of 9.0 µg/m3. Rubart Station’s contribution to this increment exceedance is less that the SIL of 1.2 µg/m3.
Table 8. PSD Increment Modeling Results
Pollutant Averaging
period Modeled concentration
(µg/m3) a PSD increment for
Class II areas (µg/m3) Exceeds PSD Increment?
NO2 Annual 14.40 H1H 25 No
PM2.5 24-hour 12.20 H2H 9 Yes Annual 1.50 H1H 4 No
PM10 24-hour 12.20 H2H 30 No a From Rubart Station and nearby sources; H1H = High First High; H2H = High Second High.
Table 9 shows PSD increment consumption from the proposed project. The concentration levels of 1-hour NO2, 24-hour PM2.5, annual PM2.5 and annual PM10 from the proposed project do not exceed the PSD increment and therefore, would comply with applicable PSD increments. EPA has not established a 1-hour Class II maximum allowable increment for NO2 or CO. Therefore, no calculation of the potential consumption of such increment is possible.
Table 9. Proposed Rubart Station PSD Increment Consumption
Pollutant Averaging
period Modeled concentration
(µg/m3) a PSD increment for
Class II areas (µg/m3)
Increment consumption
(%)NO2 Annual 1.50 H1H 25 6.0
PM2.5 24-hour 8.53 b H2H 9 94.8 Annual 0.84 H1H 4 21.0
PM10 24-hour 8.53 H2H 30 28.4 a From Rubart Station only; H1H = High First High; H2H = High Second High. b Modeled concentration at a receptor located on the Rubart Station’s fenceline.

Page 24 of 29
IX. Additional Impact Analysis
In accordance with 40 CFR 52.21(o)(1) and (o)(2), the owner or operator shall provide an analysis of the impairment to visibility, soils and vegetation that would occur as a result of the proposed project and to what extent the emissions from the proposed construction impacts the general commercial, residential, industrial and other growth. Section 7.0 of the PSD construction permit application has a more detailed discussion on the additional impact analysis for the proposed Rubart Station. A. Visibility Impacts
Mid-Kansas did visibility impact analyses for two (2) local/Class II areas close to the proposed project, namely: 1) Meade State Park, located approximately 72 km southeast of the project near Meade, Kansas and 2) Ulysses Airport, located approximately 24.5 km west of the project near Ulysses, Kansas. No assessment of visibility impacts at a Class I area was performed by Mid-Kansas because there are no Federal Class I areas located within 300 km of the proposed facility. The US EPA VISCREEN screening tool was used to determine the visual impacts to the Class II areas. The VISCREEN model is designed to determine whether a plume from a facility may be visible from a given vantage point. The primary variables that affect whether a plume is visible or not at a certain location are the quantity of emissions, the types of emissions, the relative location of the emission source and the observer, and the background visibility range. Using current US EPA guidance from the Workbook for Plume Visual Impact Screening Analysis (October, 1992), the Level 1 VISCREEN analysis was conducted for Meade State Park. The results indicate that there are no exceedances of the screening criteria inside or outside of the Meade State Park. Therefore, there are no potential visibility impacts for Meade State Park that would require additional screening. The Level 2 VISCREEN analysis was conducted for Ulysses Airport. The results indicate that there are no exceedances of the screening criteria inside or outside Ulysses Airport. Therefore, there are no potential visibility impacts for Ulysses Airport that would require additional screening.
B. Vegetation Impacts
The general land use in the vicinity of Rubart Station is irrigated row cropland and dry-land farming. Common crops produced in this area include wheat (Triticum aestivum), corn (Zea mays), grain sorghum (Sorghum bicolor), alfalfa (Medicago sativa), sunflowers (Helianthus annuus), cotton (Gossypium sp.),

Page 25 of 29
sweet corn (Zea mays convar. saccharata var. rugosas), and potatoes (Solanum tuberosum).1 Trees are generally uncommon but may occur in hedgerows and along riparian corridors.
The potential effects of NO2, CO, PM/PM10/PM2.5, and CO2e produced by the Project on vegetation within the immediate vicinity of Rubart Station were compared to scientific research examining the effects of pollution on vegetation. In general, short-term, high concentrations of NO2 are required for deleterious impacts on plants.2 The injury threshold concentration for plants that are grown in Kansas is 7,380 μg/m3 for tomato (Lycopersicon esculentum) and annual sunflower (Helianthus annuus). Lamb’s quarters (Chenopodium album) a common, weedy plant found in disturbed areas in Kansas was not injured for two hours at concentrations of 1.9 μg/m3 NO2. Furthermore, short-term fumigations of approximately 1-hour, 20-hours, and 48-hours at NO2 concentrations of 940 to 38,000 μg/m3, 470 μg/m3, and 3,000 to 5,000 μg/m3, respectively, have been shown to impair photosynthesis in a number of herbaceous [tomato, oats (Avena sativa), alfalfa and woody plants.3 Moreover, Taylor and McLean (1970),4 in their review of NO2 effects on vegetation, noted that long-term exposures of phytotoxic doses of NO2 ranged from 280 to 560 μg/m3. The maximum annual and 1-hour NO2 modeled values of Mid-Kansas for the project are 1.5 and 92.0 μg/m3, respectively. These levels are low, so it is highly unlikely that NO2 emissions will impact vegetation adjacent to or surrounding Rubart Station.
Particulates have been typically shown to be detrimental to vegetation within the immediate vicinity of the source. The most obvious effect of particle deposition on vegetation is a physical smothering of the leaf surface. This will reduce light transmission to the plant and cause a decrease in photosynthesis. The maximum PM10 and PM2.5 24-hour modeled values of Mid-Kansas for the project are 11.3 μg/m3 and 11.3 μg/m3 , respectively. This level is low, so it is highly unlikely that PM10 and PM2.5 emissions will impact vegetation adjacent to Rubart Station.
CO is not known to injure plants, nor has it been shown to be taken up by plants. Consequently, no adverse impacts to vegetation at or near Rubart Station are expected from CO stack emissions from the project.
1 Kansas State University Extension, 2012. 2 Prinz and Brandt 1985. 3 Hill and Bennett 1970; Capron and Mansfield 1976; Smith 1981. 4 Taylor and McLean, 1970.

Page 26 of 29
CO2 is not known to injure plants. Long-term exposure to elevated CO2 levels has shown to improve the efficiency of nutrient, water, and photosynthesis in some plants.1 However, the improved efficiencies that result from elevated CO2 levels may not necessarily result in greater yields for crop plants.2 No adverse impacts to vegetation at or near Rubart Station are expected from CO2 stack emissions from the project.
Air pollutants are known to act in concert to cause injury to or decrease the functioning of plants.3 Synergistic refers to the combined effects of pollutants when they are greater than is expected from the additive effect of the compounds. Inhibitory effects of SO2 and NO2,
4 NO2 and NO,5 NO2 and ozone,6 and ozone and SO2
7 have been reported in various short-term studies for crop and woody plants (e.g., soybean, broad bean (Vicia faba), annual sunflower, tomato, and eastern cottonwood. Concentrations of pollutants (80 to 981 μg/m3) in these studies are higher than the concentrations predicted to occur near Rubart Station. Consequently, no synergistic effects of the air pollutants are expected to inhibit vegetation at or near Rubart Station.
C. Soil Impacts
Five (5) soil types are mapped at, or in the immediate vicinity of, the project site.8 They include:
Otero-Ulysses complex, 0 to 5 percent slopes Pleasant silty clay loam, ponded Richfield silt loam, 0 to 1 percent slopes Ulysses silt loam, 0 to 1 percent slopes and 1 to 3 percent slopes Ulysses loam, 1 to 3 percent slopes
Sulfates and nitrates resulting from SO2 and NO2 deposition on soil can be both beneficial and detrimental to soils depending on their composition. However, given the low expected deposition from the engines, operation of the RICE should not materially affect the soils on-site or in the immediate vicinity.
1 Drake, Gonzalez-Meler, and Long 1997; Leakey, Ainsworth, Bernacchi, Rogers, Long, and Ort 2009. 2 Morgan, Bollero, Nelson, Dohleman, and Long 2005. 3 See reviews of Reinert et al. 1975; Omrod 1982. 4 White et al. 1974; Wright et al. 1986. 5 Capron and Mansfield 1976. 6 Furakawa et al. 1984; Okana et al. 1985. 7 Costonis 1970, Carlson 1979; Jensen 1981; Omrod et al. 1981. 8 Natural Resources Conservation Service. 2012.

Page 27 of 29
D. Residential, Commercial and Industrial Growth Impacts
The project is expected to increase employment in the area. The building phase will last approximately one (1) year. Construction employment is expected to peak at approximately 150 skilled construction jobs. Projected employment, reflecting full-time jobs directly tied to the operation of Rubart Station is estimated to be five (5) people at the facility. This will result in moderate amounts of secondary employment being created by the economic activity of the facility. In the immediate vicinity of the facility and as a result of the project at Rubart Station, increased vehicular traffic is expected. However, these activities are not expected to significantly impact air quality.
The construction work at Rubart Station may temporarily increase the number of people residing in the area. After construction is completed, many of the new employees are expected to already live in the area. However, some new employees are expected to move into the area, with only a slight increase in the residential growth in the area. This small increase in new residences is not expected to have an impact on the air quality in the area.
Adding additional electricity to the grid in this area may increase industrial growth. However, it is unknown how increasing available electrical power in this area may affect future industrial growth.

Page 28 of 29
X. Summary and Conclusions
The results of the modeling analysis are summarized in Table 4 (preliminary/significance modeling results), Table 6 (refined/NAAQS modeling results) and Table 8 (PSD Increment modeling results). The PSD increment consumption from the proposed project is shown in Table 9. Results of preliminary/significance modeling analysis (Table 4) showed that the modeled HIH impacts of annual NO2, 1-hour NO2, annual PM2.5, 24-hour PM2.5, and 24-hour PM10
exceed the SIL thresholds, therefore, full impact (refined) modeling analyses are required for these pollutants and averaging times. No full impact modeling analyses are required for 1-hour CO, 8-hour CO, and annual PM10 since their modeled HIH impacts fall below SIL thresholds.
Results of refined/NAAQS modeling analysis (Table 6) showed that there are 91 receptors with modeled impacts that exceed the 1-hour NO2 NAAQS. Further analysis demonstrated that the proposed Rubart Station is not a significant contributor to these 91 receptors. There are no modeled NAAQS exceedances for annual NO2, 24-hour PM2.5, annual PM2.5, and 24-hour PM10 averaging periods. The proposed Rubart Station is the first completed PSD application submitted after the PM2.5 trigger date of October 20, 2011, therefore, the minor source baseline date will be established by this PSD construction permit application. The PM2.5 minor source baseline date is established in Grant County, Kansas on December 20, 2012. Results of PSD increment modeling analysis are shown in Table 8. Seven (7) receptors, located approximately 8 km west-southwest of the proposed Rubart Station exceeded 24-hour PM2.5 PSD increment of 9.0 µg/m3. Rubart Station’s contribution to this increment exceedance is less that the SIL of 1.2 µg/m3.
The PSD increment consumption from the proposed project is shown in Table 9. The PSD increment consumption analysis indicates that the concentration levels of 1-hour NO2, 24-hour PM2.5, annual PM2.5 and annual PM10 from the proposed project do not exceed the PSD increment and therefore, would comply with applicable PSD increments.
The visibility impact analysis results submitted by Mid-Kansas indicate that there are no exceedances of the screening criteria for the local/Class II areas considered, therefore, no adverse impact on visibility from the proposed project.
Page 29 of 29
Since the emission levels of NO2, CO, PM/PM10/PM2.5, and CO2e are low, Mid-Kansas anticipates that it is highly unlikely to adversely impact the vegetation adjacent to or surrounding Rubart Station. Mid-Kansas concludes that the operation of the RICE should not materially affect the soils on-site or in the immediate vicinity due to low expected deposition from the engines. Similarly, the construction activity, associated growth in residential, commercial, and industrial activities are not expected to significantly impact air quality of the nearby areas.
KDHE concludes that Mid-Kansas has sufficiently demonstrated that the proposed project does not cause or contribute to a violation of any NAAQS or PSD increment; has no adverse impact on visibility; vegetation, soils and animals.