air pollution from agriculture · the air quality expert group (aqeg) is an expert committee of the...
TRANSCRIPT

AIR QUALITY EXPERT GROUP
Air Pollution from Agriculture
Prepared for:
Department for Environment, Food and Rural Affairs;
Scottish Government; Welsh Government; and
Department of the Environment in Northern Ireland


AIR QUALITY EXPERT GROUP
Air Pollution from Agriculture
Prepared for:
Department for Environment, Food and Rural Affairs;
Scottish Government; Welsh Government; and
Department of the Environment in Northern Ireland

This is a report from the Air Quality Expert Group to the Department for Environment, Food
and Rural Affairs; Scottish Government; Welsh Government; and Department of the
Environment in Northern Ireland, on air pollution from agriculture. The information
contained within this report represents a review of the understanding and evidence
available at the time of writing.
© Crown copyright 2018
Front cover image credit: Defra
United Kingdom air quality information received from the automatic monitoring sites and
forecasts may be accessed via the following media:
Freephone Air Pollution Information Service 0800556677
Internet http://uk-air.defra.gov.uk
PB14509

i
Terms of Reference
The Air Quality Expert Group (AQEG) is an expert committee of the Department for Environment,
Food and Rural Affairs (Defra) and considers current knowledge on air pollution and provides
advice on such things as the levels, sources and characteristics of air pollutants in the UK. AQEG
reports to Defra’s Chief Scientific Adviser, Defra Ministers, Scottish Ministers, the Welsh
Government and the Department of the Environment in Northern Ireland (the Government and
devolved administrations). Members of the Group are drawn from those with a proven track record
in the fields of air pollution research and practice.
AQEG’s functions are to:
• Provide advice to, and work collaboratively with, officials and key office holders in Defra
and the devolved administrations, other delivery partners and public bodies, and EU and
international technical expert groups;
• Report to Defra’s Chief Scientific Adviser (CSA): Chairs of expert committees will meet
annually with the CSA, and will provide an annual summary of the work of the Committee to the
Science Advisory Council (SAC) for Defra’s Annual Report. In exception, matters can be escalated
to Ministers;
• Support the CSA as appropriate during emergencies;
• Contribute to developing the air quality evidence base by analysing, interpreting and
synthesising evidence;
• Provide judgements on the quality and relevance of the evidence base;
• Suggest priority areas for future work, and advise on Defra’s implementation of the air
quality evidence plan (or equivalent);
• Give advice on current and future levels, trends, sources and characteristics of air
pollutants in the UK;
• Provide independent advice and operate in line with the Government’s Principles for
Scientific Advice and the Code of Practice for Scientific Advisory Committees (CoPSAC).
Expert Committee Members are independent appointments made through open competition, in line
with the Office of the Commissioner for Public Appointments (OCPA) guidelines on best practice
for making public appointments. Members are expected to act in accord with the principles of
public life.
Further information on AQEG can be found on the Group’s website at:
https://www.gov.uk/government/policy-advisory-groups/air-quality-expert-group

ii
Membership
Chair
Professor Paul Monks
University of Leicester
Members
Dr James Allan
National Centre for Atmospheric Science, University of Manchester
Dr David Carruthers
Cambridge Environmental Research Consultants
Dr David Carslaw
Ricardo Energy and Environment and University of York
Dr Gary Fuller
King's College London
Professor Roy Harrison OBE
University of Birmingham
Dr Mat Heal
University of Edinburgh
Professor Alastair Lewis
National Centre for Atmospheric Science, University of York
Dr Eiko Nemitz
Centre for Ecology & Hydrology
Professor Claire Reeves
University of East Anglia
Professor Martin Williams
King's College London

iii
Ad hoc members
Professor David Fowler CBE
Formerly Centre for Ecology and Hydrology
Dr Ben Marner
Air Quality Consultants
Dr Andrew Williams
University of Chester
Ex officio members
Central Management and Control Unit of the automatic urban and rural networks: Dr
Richard Maggs, Bureau Veritas
National Atmospheric Emissions Inventory: Dr Tim Murrells, Ricardo Energy and
Environment
Non-automatic hydrocarbon monitoring networks and metals monitoring network: Dr Paul
Quincey, National Physical Laboratory
Quality Assurance and Quality Control of the automatic urban network and the non-
automatic monitoring networks: Dr Paul Willis, Ricardo Energy and Environment
Assessors and observers
Simon Baldwin
Welsh Government
Barry McCauley
Department of the Environment in Northern Ireland
Andrew Taylor
Scottish Government
Alison Gowers
Public Health England
Secretariat
Dr Sarah Moller
National Centre for Atmospheric Science, University of York and Department for
Environment, Food and Rural Affairs

iv
Dr Ailsa Stroud
Department for Environment, Food and Rural Affairs
Michelle Brailey-Balster
Department for Environment, Food and Rural Affairs

v
Acknowledgements
The Air Quality Expert Group would like to acknowledge the following individual and
organisation for their help in the preparation of this report:
Professor Mark Sutton
Centre for Ecology and Hydrology
Prepared for:
Department for Environment, Food and Rural Affairs;
Scottish Government; Welsh Government; and
Department of the Environment in Northern Ireland

vi
Contents 1.1 Q1. What pollutants are emitted by agriculture? ...................................................... 9
1.2 Q2. What are the impacts of ammonia upon human health and the environment? .. 9
1.3 Q3. How can these impacts best be addressed / targeted? ................................... 9
1.4 Q4: How have concentrations and the deposition of NH3 and NH4+ in the UK
changed following changes in emissions. .......................................................................... 9
1.5 Q 5: How effective have controls on NH3 elsewhere in Europe been in reducing
emissions and concentrations of NH3 and particulate matter? ......................................... 10
1.6 Q6. Have changes in UK emissions of NOx and NH3 reduced the exceedances of
critical loads for nutrient nitrogen? (and are both the oxidised and reduced forms of N
equally important for eutrophication?). ............................................................................. 10
1.7 Q7. What are the relative air quality benefits and costs for controls on ammonia
emissions? ...................................................................................................................... 11
2 State of the Evidence ................................................................................................... 12
2.1 Q1. What pollutants are emitted from agricultural activities? ................................. 12
2.1.1 Other gaseous emissions from agriculture ..................................................... 15
2.2 Q2. What are the impacts of ammonia upon human health and the environment? 16
2.3 Q3. How can these impacts best be addressed / targeted? .................................. 17
2.3.1 Pollution Swapping ........................................................................................ 20
2.3.2 Mitigating emissions using shelter belts ......................................................... 20
2.4 Q4: How have concentrations and the deposition of NH3 and NH4+ in the UK
changed following changes in emissions. ........................................................................ 21
2.4.1 Reduced nitrogen in gas, liquid and particulate phases ................................. 22
2.4.2 Ammonia in the gas phase............................................................................. 22
2.4.3 Particulate NH4+ concentrations in the air ....................................................... 23
2.4.4 NH4+
in rain .................................................................................................... 25
2.4.5 Interpretation.................................................................................................. 27
2.5 Q 5: How effective have controls on NH3 elsewhere in Europe been in reducing
emissions and concentrations of NH3 and particulate matter? ......................................... 31
2.6 Q6. Have changes in UK emissions of NOx and NH3 reduced the exceedances of
critical loads for nutrient nitrogen? (and are both the oxidised and reduced forms of N
equally important for eutrophication?). ............................................................................. 35
2.7 Q7. What are the relative air quality benefits and costs for controls on ammonia
emissions? ...................................................................................................................... 38
2.7.1 Benefits .......................................................................................................... 38
2.7.2 Costs ............................................................................................................. 40

vii
3 References .................................................................................................................. 42

8
Executive Summary
This report addresses the research and policy aspects of air pollutants from agriculture. The
approach is to identify the pollutants emitted by agriculture and the environmental issues to
which they contribute in the UK and elsewhere, the extent of knowledge and uncertainty of the
sources, fate and effects of the pollutants and available options for control. The main focus is
on ammonia, a pollutant largely from agricultural activity and an important contributor to air
quality issues in the UK. The report refers to the wider European and global environmental
issues to which nitrogen compounds contribute in recent assessments without repeating the
detail they contain (European Nitrogen Assessment (Sutton et al 2011), The Global Nitrogen
cycle in the 21st century (Fowler et al 2013)).
The format of the report is structured around a series of policy questions. It begins with a
summary of the key points of the answers to these questions.

9
1.1 Q1. What pollutants are emitted by agriculture?
A: Nitrogen-containing compounds (NO2, NO, NH3, N2O) are emitted to the atmosphere
from agricultural activities. In the case of ammonia (NH3) and nitrous oxide (N2O), agricultural
sources are the main contributors, comprising 88% and 68% respectively of annual UK
emissions in 2016. In addition, agricultural soils are becoming a significant source of nitric
oxide (NO) (projected to be 6% of UK NOx emissions by 2030) as emissions from combustion
sources are reduced by control measures. Methane and non-methane volatile organic
compounds (VOC) are emitted by agriculture, and livestock are an important source of
methane in the UK budget (51% in 2016). The pesticides/fungicides hexachlorobenzene,
hexachlorcyclohexane and pentachlorophenol, which are listed in the Stockholm Convention
on Persistent Organic Pollutants, are also emitted from agricultural and forestry use.
1.2 Q2. What are the impacts of ammonia upon human health
and the environment?
A: The main impacts of ammonia arise through its contribution to (1) formation of
particulate matter (PM) and the consequent effects on human mortality and morbidity
throughout the UK, and (2) the eutrophication of the semi-natural landscape of the UK leading
to marked reductions in plant biodiversity. Ammonium in particle form (NH4+) is a
transboundary pollutant, exchanged between European countries. Therefore, UK ammonia
emissions contribute to human health effects and biodiversity changes in the UK and
elsewhere in Europe, while the UK is impacted by emissions from elsewhere in Europe.
1.3 Q3. How can these impacts best be addressed / targeted?
A: The most effective measures to reduce these effects are those which reduce emissions
of ammonia to the atmosphere. A range of methods have been developed and field-tested at
the local and country scale, by which it is possible to reduce emissions of ammonia by at least
50%. Mitigation strategies also include separation of sensitive receptors from local sources
and the use of shelterbelts to enhance both dispersion through increasing turbulence and
capture of ammonia close to source.
1.4 Q4: How have concentrations and the deposition of NH3 and
NH4+ in the UK changed following changes in emissions.
A: A 6.4% reduction in ammonia emissions has been reported in the NAEI between 2000
and 2016, a value that is smaller than the reported uncertainty in emissions (~±20%). Over
10
the same period concentrations of ammonia over the UK as a whole have not declined
significantly, although there have been reductions in some areas. A substantial reduction in
particulate NH4+ concentration (~40%) has been observed in the UK over the period 1999 to
2014, which is mainly due to the reduction in sulphur emissions and resulting changes in
particulate matter composition.
The dry and wet deposition of ammonia and ammonium at the UK scale have not changed
significantly over this period.
1.5 Q 5: How effective have controls on NH3 elsewhere in Europe
been in reducing emissions and concentrations of NH3 and
particulate matter?
A: Control measures for ammonia from agriculture in the Netherlands have resulted in a
reduction in emissions of 64% between 1990 and 2016. The reduction in ammonia emissions
contributed to reductions in particulate NH4+ concentrations of 68% over this period, but a
much smaller reduction in ambient ammonia concentration, which was not statistically
significant. These different trends are consistent with a change in partitioning of gas and
aerosol phase NHx, which is largely a consequence of substantial reductions in sulphur
emissions over the same time period, such that a greater fraction of NHx is now present as
gaseous ammonia. The changes in the Netherlands are further complicated by changes in
emissions of NH3, SO2 and NO2 in neighbouring countries.
1.6 Q6. Have changes in UK emissions of NOx and NH3 reduced
the exceedances of critical loads for nutrient nitrogen? (and
are both the oxidised and reduced forms of N equally important
for eutrophication?).
A: Reductions in oxidised nitrogen deposition of approx. 30% have been observed in the
UK over the last decade. This has reduced total N deposition by 15% and resulted in 15%
reductions in exceedance of critical loads for nutrient nitrogen. However, widespread
exceedance of critical loads for eutrophication in the UK remains with ammonia and
ammonium deposition being the main contributors.
One of the main effects of nitrogen deposition is a reduction in species richness in UK
vegetation. The effects have been shown experimentally and in surveys to be associated with
the total annual deposition of reactive nitrogen, but the deposition of gas phase ammonia has

11
been shown to be more damaging to moorland and bog plant communities per unit nitrogen
deposited.
1.7 Q7. What are the relative air quality benefits and costs for
controls on ammonia emissions?
A: The damage costs of ammonia over Europe have been estimated in the European
Nitrogen Assessment to be in the range €2 to €20 per kg N pollution for human health and €2
to €10 per kg N pollution for biodiversity related societal costs. Combined, these provide
estimated damage costs in the region of €4 to €30 per kg N pollution. These costs represent
the potential benefits of control measures, and in the case of the Maximum Technically
Feasible Reduction (MTFR) average estimated abatement costs are €2.4 per kg of N pollution
abated.

12
2 State of the Evidence
2.1 Q1. What pollutants are emitted from agricultural activities?
A range of pollutant gases, and especially nitrogen compounds (NO2, NO, NH3, N2O) are
emitted to the atmosphere from agricultural activities, including fertilizer use, farm machinery
and livestock waste (Sutton et al. 2017). In addition, primary particulate matter is emitted from
livestock housing and tilling activities. However, the main contribution to air pollution from
agriculture in the UK is due to emissions of ammonia (NH3). The majority of agricultural NH3
emissions are from livestock farming, with cattle providing 49% of the annual total UK
agricultural emissions (244 kT-NH3 in 2016 ), and smaller contributions from other livestock
and arable agriculture, as detailed in the National Atmospheric Emission Inventory (NAEI
2016, Wakeling et al. 2018) and summarised in Figure 1. Non-agricultural UK NH3 emissions,
from vehicles, human waste and industry contributes 12% of total annual emissions in 2016.
It has been estimated that 80% of NH3 emissions in Europe are from just 5% of farms (EEA,
2016). For the UK, it is still the case that a large proportion of NH3 emissions are from a smaller
fraction of farms, but it is closer to 60% of emissions from 21% of dairy farms, because the
UK does not have the large number of very small farms that dominates the European picture.

13
Figure 1. UK NH3 emissions from all sectors in 2016 (NAEI, 2018)
Following emission of gaseous NH3 to the atmosphere, NH3 is either deposited back onto
terrestrial surfaces by dry deposition or is converted to ammonium (NH4+) in particulate matter
through reaction with atmospheric acids, and has a short lifetime in the atmosphere of just a
few hours (Fig. 2). The particulate matter has a longer lifetime in the atmosphere of a few days
on average and is removed from the atmosphere primarily by rain and snow as wet deposition.

14
Figure 2. NH3 release to the atmosphere, transformation to particulate matter and
removal by dry and wet deposition
Before the turn of the 21st century, the main acid in the UK (and European) atmosphere was
sulphuric acid (H2SO4), from emissions of SO2. The particulate matter produced through
reaction with NH3 was largely ammonium sulphate ((NH4)2SO4), which was the form in which
most of the long-range transport of sulphur and acidity throughout the countries of Europe
took place. Now that European emissions of SO2 have declined by nearly 90% from their peak
in the 1970s, the atmospheric acid forming particulate matter with NH3 is mainly nitric acid
(HNO3) and the resulting compound is ammonium nitrate (NH4NO3). The contribution of
NH4NO3 to particulate matter in the UK atmosphere varies with time between a few percent
and tens of percent in episode conditions, which often occur in spring (Twigg et al., 2015;
Young et al., 2015).
Some of the nitrogen used in agriculture is chemically transformed in soils to nitric oxide (NO)
which is emitted to the atmosphere and subsequently oxidized to NO2 and HNO3. While NH3
is the priority agricultural air pollutant, many studies have shown the relevance of nitric oxide
(NO) emissions from agricultural soils (e.g. Skiba and Ball 2002). The contribution of NO
emissions from agricultural soils has hitherto not been a major focus due to the dominance of
vehicles and power generation and other industry as NO sources in the UK. However, as the

15
combustion sources are projected to decrease the agricultural share of UK total NOx emissions
through soil NO emissions is expected to increase (currently estimated at 4% and projected
to increase to 6% by 2030 (Sutton et al., 2017)). A recent study suggest that soil NO emissions
may be larger than previously thought, being estimated to account for 20-32% of NOx
emissions in California (Almaraz et al. 2018). Recognising uncertainties in these estimates, it
has been decided that soil NOX emissions from agriculture are to be excluded when assessing
compliance with the emissions reduction commitments set out in the revised Gothenburg
Protocol (2012) and the revised National Emissions Ceilings Directive (2016)1. However, when
reporting national emissions to demonstrate on-going compliance with emissions ceilings in
the original Gothenburg Protocol and the National Emissions Ceilings Directive, the UK will
need to include soil NOX emissions from agriculture. As there is currently no strategy to reduce
soil NO emissions it is anticipated that these will not decrease as fast as combustion source
emissions, and are expected to contribute a significant share in future decades. The
uncertainty associated with estimating NO emissions from soils is particularly high, and further
work is required to improve the reliability and sophistication of methodologies for estimating
emissions. This will allow UNECE countries to consider the potential for their mitigation in
future. It should be noted that the link between soil NH3 and soil NO emissions provides an
opportunity for significant synergy as methods to improve nitrogen use efficiency in agriculture
should have the potential to reduce NH3 and NO emissions simultaneously.
Soil nitrogen compounds are also reduced to nitrous oxide (N2O), a powerful greenhouse gas.
In this regard, the use of nitrogen fertilizers and livestock wastes in agriculture is the main
contributor to UK N2O emissions, accounting for 80% of N2O emissions in the UK national
atmospheric emissions inventory. Thus a wider role of agriculture in air pollution generally,
and in greenhouse gas emissions and climate change, also needs to be considered
(Pilegaard, 2013; Skiba et al., 2014). To achieve significant emission reductions of UK N2O,
mitigation action in the agricultural sector would be required.
2.1.1 Other gaseous emissions from agriculture
2.1.1.1 Methane and Non-methane volatile organic compounds (NMVOC)
Methane is emitted from agriculture, mainly from ruminants through enteric fermentation
contributing 51% of UK methane emissions in 2016. NMVOC emissions from manure
management are particularly uncertain, and as a result have only recently been included in
national emissions inventories. The speciation of emissions from manure management is very
1 This is the commonly used name for referring to the Directive (EU) 2016/2284 on the reduction of national emissions of certain atmospheric pollutants..

16
different to emissions from e.g. combustion or solvent use. So whilst emissions from
agriculture may account for a large fraction of the national total in mass terms, it does not
necessarily follow that agricultural sources of NMVOC have a significant impact on ozone
formation. At present little is known on whether NMVOC emissions from livestock manures
have significant ozone forming potential
2.1.1.2 Pesticides
Hexachlorobenzene (HCB): Pesticides that contain HCB as an impurity are imported into the
UK, and their use contributes approximately a third of the UK’s total emissions of HCB to air.
HCB is listed in the Stockholm Convention on Persistent Organic Pollutants and the CLRTAP
requires the reporting of HCB emissions.
The UK emissions inventory programme also estimates emissions of both
hexachlorocyclohexane (HCH) and pentachlorophenol (PCP), both also listed in the
Stockholm Convention on Persistent Organic Pollutants. HCH has been used in the past as
an insecticide, fungicide and wood preservative; PCP has been used in the past as a wood
preservative. Emissions of both are declining as previously treated wood is gradually removed
from use with time.
2.2 Q2. What are the impacts of ammonia upon human health
and the environment?
There are two main effects of NH3 emissions. First, through the contribution of NH3 to the
formation of secondary inorganic particulate matter in the atmosphere (secondary inorganic
aerosol (SIA)), i.e. ammonium nitrate and ammonium sulphate, the NH3 emissions are
indirectly responsible for effects on human health, increasing mortality and morbidity
throughout the UK, and, following long-range transport, also in neighbouring countries of
continental Europe. The health effects of particulate matter have been reviewed by COMEAP
(COMEAP 2009, 2010).
Secondary inorganic aerosol is a major contributor to PM10 or PM2.5 in the UK, estimated at
~40% of total PM2.5 (AQEG 2012). The main contributions to secondary inorganic aerosol
within the UK are NO3-, SO4
2- and NH4+, with NO3
- as the dominant contributor by mass (AQEG,
2012). The contribution of NH4+ within SIA varies in time and space but is generally between
a few percent and 20% (Twigg et al., 2015). Part of the variability arises due to seasonal
variations in emissions due to fertilizer and manure spreading, but the effects of weather are
also very important as temperature strongly influences the partitioning between the gas and
condensed (aerosol) phase (Ellis et al 2011). Some of the largest contributions of NH3 to PM

17
occur in spring, when emissions are high and temperatures are cool, (in warm summer
conditions ammonium nitrate sublimes to its component gases, HNO3 and NH3). In Paris
during an Air Quality episode in spring 2014, 62% of PM2.5 was estimated to originate from
NH3 (CNRS, 2005).
It has been estimated that a global halving of agricultural emissions could reduce the mortality
attributed to PM2.5 by ~250,000 globally and by 52,000 across Europe (Pozzer et al., 2017).
The other main environmental effect of NH3 emissions is its contribution to eutrophication due
to nitrogen deposition on the semi-natural landscape. Nitrogen deposition has been estimated
to be in excess of critical loads for eutrophication over 63% of sensitive habitats of the UK.
The main effect of excessive nitrogen deposition is a reduction in plant biodiversity, which has
been demonstrated at a range of sites throughout the UK (Hall et al., 2017, Stevens et al.,
2010). While the effect of reactive nitrogen deposition on the species composition of semi-
natural plant communities is clear, it is important to appreciate the different forms of nitrogen
deposited, not all of which have the same effects on vegetation (Shepherd et al., 2014). The
different forms include dry deposition of NO2, NH3, and HNO3 as well as wet deposition of NO3
and NH4+. For some widespread ombrotrophic (rain-fed) ecosystems in upland UK, dry
deposited NH3 has been shown to be much more damaging per unit N deposited than wet
deposited NO3- and NH4
+ (Shepherd et al., 2011; APIS, 2017). Reductions in emissions of NH3
are therefore considered one of the most effective measures to reduce effects on biodiversity.
As the NH3 deposited to the landscape also contributes to eutrophication of freshwaters and
marine ecosystems, it is recognised that a range of co-benefits of control measures to reduce
emissions exist (Sutton et al., 2011).
Finally, it is also of note is that ammonia is an odorous gas, so odour reduction is another
benefit of control measures.
2.3 Q3. How can these impacts best be addressed / targeted?
Model simulations have shown that reductions in NH3 emissions are effective in reducing
concentrations of particulate matter (Megaritis et al., 2013; Vieno et al., 2016a; Pozzer et al.,
2017). Experience from other European countries shows that it is possible to achieve
substantial reductions in NH3 emissions. The countries with the most ambitious NH3 policies
are the Netherlands and Denmark, both of which are estimated to have reduced their national
NH3 emissions by 64% and 40% respectively between 1990 and 2016 (Bleeker et al., 2009,
Netherlands 2018, Denmark 2018). In the case of the Netherlands, a reduction of agricultural

18
emissions has been claimed of at least 60%, though an independent review concluded that
the available data presented was more consistent with a reduction of around 50% (40-60%)
(Sutton et al., 2015).
In both the examples of the Netherlands and Denmark, the reductions in NH3 emissions were
achieved through strict programmes of national regulations that focused primarily on manure
management, including land application of manure, manure storage and animal housing.
Technically, all the measures were achievable by farmers and in the Netherlands have now
been in routine use for over 20 years.
Considering the country case studies together, the main measures adopted have been:
Prohibiting the free surface spreading of liquid manure (i.e. prohibiting use of the
“splash plate spreader”). In both countries a high ambition approach was taken
requiring the use of shallow injection of liquid manure, and where surface “band-
spreading” was also considered insufficient, apart from exceptions:
o A trailing shoe band-spreading approach was specifically designed and
accepted in the Netherlands for use on grass swards over vulnerable peat soils,
so as not to break the coherency of the root mat.
o A relaxation to permit the use of bandspreading methods (trailing hose or
trailing shoe) has been approved in Denmark where the manure is acidified
immediately prior to application (a proprietary system is in use on many farms
who wanted to avoid manure injection).
Requirement to use covered manure stores. A wide range of covered manure storage
approaches have appeared, from tanks, to covered lagoons to slurry bag approaches.
The costs of using covered manure stores are to some extent compensated by the
higher nitrogen content, consistency and lower water content of the stored manure
product.
Requirement to use low emission housing. A wide range of animal housing systems
are in place in the Netherlands and Denmark. In particular, pig and poultry buildings
with controlled ventilation are used both to optimize indoor climate for the animals and
to allow cleaning of the exhaust air, using either chemical or biological methods. In
the Netherlands, it is reported that Smart Metering is increasingly being installed to
allow central administrative monitoring of the air purification systems.

19
Overall, it appears that the largest gains in reducing emissions, with the lowest cost to farmers
have been associated firstly with low-emission manure spreading, and secondly with low-
emission manure storage. In the case of large scale animal production (> 40,000 poultry,
2,000 pigs), the Industrial Emissions Directives (IED) of the European Union apply to regulate
emissions. Thus local emission control is already applied at some sites in the UK as part of
permitting near designated conservation areas or as planning conditions for odour control; in
these cases keeping manure/litter dry until it is incorporated in the soil is the key to reducing
emissions. The largest livestock sector of NH3 emissions in the UK and Europe is cattle. Here,
there are major opportunities for cost effective NH3 emission reduction from manure storage
and land spreading. Currently, the naturally ventilated nature of most cattle housing in the UK
can make it harder to control emissions from this source. However, there are opportunities to
reduce emissions by restricting the area of soiled surfaces and cleaning by scraping and
washing down. There is the need for research to improve housing design for cattle that
simultaneously reduces NH3 emissions, while considering opportunities for animal welfare,
energy and water savings.
One of the most cost effective ways to reduce part of the NH3 emissions is though low emission
mineral fertilizers. In the UK, most nitrogen is applied as ammonium nitrate (NH4NO3) which
is associated with low NH3 emissions, while emissions from urea are much higher. While urea
is typically cheaper to purchase, around 5 to 40% of the N applied may be lost as NH3
emissions. This loss can be minimized, for example by incorporating urea into the soil (as
widely practiced in Canada), by using chemicals that slow the break-down of urea (‘urease
inhibitors’) or by using NH4NO3 (Bittman et al., 2014). To date, it appears that strict regulatory
requirements in relation to the use of urease inhibitors for fertilizer application to reduce these
losses have not been adopted in either the Netherlands or Denmark. However, under the
Revised German Fertilizer Regulations, from 1 February 2020, urea as fertilizer “may only be
applied if it has been given a urease inhibitor or is incorporated immediately, but no later than
four hours after application” (Bundesrat 2017, Section 6 (2)).
At present the extent of Europe-wide adoption of NH3 mitigation methods can be well
illustrated by Annex IX of the Gothenburg Protocol (1999). The only firm mandatory
requirement was to establish a National Ammonia Code of good agricultural practice (NAC).
Recent review under the LRTAP Convention showed that less than 10 parties out of 25 ratified
signatories had so far established such a code (UNECE, 2017). The Annex IX requirements
for manure and fertilizer application while formulated as mandatory, either do not go beyond

20
existing EU legislation (for pig and poultry housing) or are each associated with caveats that
soften any hard requirement.
2.3.1 Pollution Swapping
Because there are risks of pollution swapping (i.e. increasing emissions of one pollutant as a
consequence of controlling another pollutant), the challenge is to look at strategies that lead
to overall pollution reduction (pollution synergies). A core strategy here is improving nitrogen
use efficiency across the agricultural chain of nitrogen flows. This approach allows a larger
fraction of input nitrogen compounds (e.g. in fertilizers and feeds) to reach products with a
smaller fraction becoming losses to the environment. In this way, multiple forms of nitrogen
pollution to air and water may be reduced simultaneously to improving agricultural productivity.
A key principle to achieve pollution reduction synergies is delivered when increases in
efficiency are accompanied by reduced fertilizer inputs or increased production outputs. This
provides opportunities for increased profits to farmers.
An example which is often discussed is the potential for pollution swapping when applying
liquid manure using surface band-spreading or injection methods as compared with the
traditional broadcast surface spreading. The UNECE estimates that these methods typically
reduce NH3 emissions by around 70% (injection), 30% to 60% (trailing shoe) or 30% (trailing
hose) (Bittman et al., 2014). These reductions in emissions provide the opportunity to increase
nitrogen use efficiency, which is further helped by the more precise and even application of
the manure fertilizer resource in these methods. Such an NH3 reduction leads to the risk that
the saving is exchanged for an increase in nitrification and denitrification emissions as nitric
oxide (NO), nitrous oxide (N2O), or as nitrate and other leaching losses to water. To avoid
such trade-offs and to fully realise the benefits of the lower NH3 emissions it is necessary to
match the manure inputs to the crop demands. This requires appropriate timing of manure
application to match crop needs, combined with either an accompanying reduction in fertilizer
inputs or strategies to increase the harvest outputs. In this way, low NH3 emission manure
spreading can become part of an overall strategy to improved nitrogen management, which
improves efficiency, and either reduces costs or increases harvest revenue.
2.3.2 Mitigating emissions using shelter belts
Ammonia emissions from small area sources such as livestock buildings rapidly disperse into
the surrounding lower atmosphere and are subject to deposition and gas to particle
conversion. Deposition rates onto vegetation close to the source can be enhanced using
shelter-belts of trees around the source. The fraction of ammonia recaptured varies with

21
characteristics of the source, meteorological and surface conditions. Studies by Fowler et al.
(1998) showed that between 3% and 8% of NH3 emissions from a livestock building were
deposited in woodland within 300 m of the source. Further work by Bealey et al. (2016)
focussed on a range of planting strategies showed that woodlands designed to recapture NH3
from a range of livestock sources could recapture a substantially greater fraction of NH3
emissions, in the range 20% to 40%, the latter representing housing of poultry under a
woodland canopy. Rough landscape features such as shelter- belts can also help disperse
ammonia, reducing concentrations near sources and therefore decreasing the most extreme
impacts on nearby sensitive receptor ecosystems. Dragosits et al. (2006) contrasted the
opportunities of two strategies: With a source-oriented landscape approach, trees planted
around farms both capture and help disperse ammonia. With a receptor-oriented landscape
approach, trees and other buffer zones around nature areas contribute to reducing ammonia
concentrations on the most sensitive locations. Both approaches were found to contribute to
the effectiveness of the mitigation measure, depending on amount of trees, distance between
source and receptor and on the regional baseline ammonia concentration. A useful guide to
near field dispersion (and measurement/model comparison) from agricultural sources is also
provided by ADMLC (2016).
2.4 Q4: How have concentrations and the deposition of NH3 and
NH4+ in the UK changed following changes in emissions.
The UK emission inventory for NH3 (NAEI, 2018) of 289 kt in 2016 is smaller than the peak
emissions in 1998 of 322.5 kt shown in Figure 1. Annual emissions of NH3 were relatively
constant between 1990 and 1997. The reduction of 33.5 kt between 1998 and 2016 represents
a 10 % reduction in emissions over the last 18 years. However, emission inventories for NH3
are highly uncertain due to the complexity and very large range of sources and agricultural
practices that give rise to NH3 emissions (Wakeling et al. 2018). Overall uncertainty in total
NH3 emissions in the UK has been estimated at ± 20%. Close links between emissions and
environmental conditions which are not fully incorporated in inventory methodology also
introduce substantial uncertainty and the emission from the same activity can differ
significantly between years, an effect not captured by the current emission inventory
methodology (Sutton et al., 2013). The uncertainty in emissions is therefore of a greater
magnitude than the reduction in emissions reported in the UK National Atmospheric Emissions
Inventory (NAEI, 2016).

22
2.4.1 Reduced nitrogen in gas, liquid and particulate phases
The atmospheric behaviour of gaseous NH3 illustrated in Figure 2 identifies the chemical
components which need to be monitored to quantify changes in emissions and concentrations
of reduced-N species over the UK. Measurements of NH3 cannot be analysed and interpreted
in isolation, and its interaction with NH4+ in the aerosol phase needs to be considered. Any
sulphuric acid (H2SO4) formed from the oxidation of SO2 reacts with any available gaseous
NH3 to form (NH4)2SO4 which will stay in the aerosol form until it is deposited, mainly through
wet deposition. Any remaining NH3 will, together with HNO3, form an equilibrium with NH4NO3
aerosol, which can be deposited but also re-evaporate into NH3 and HNO3 if gas-phase
concentrations drop or temperatures increase. Thus, the overall rate of NH3 conversion to
NH4+, but also the type of NH4
+ aerosol formed, dictate the gas/aerosol partitioning and the
atmospheric lifetime and transport distance of the total reduced nitrogen (NHx = NH3 + NH4+).
NH3 in the gas phase requires a large number of monitoring sites to identify the spatial
variability and to be operated with consistent methodology for many years to allow the inter-
year effects of meteorology to be quantified. The short atmospheric lifetime is illustrated by
the large geometric relative standard deviation of measured concentrations, typically a factor
of 3 at a rural location based on half-hourly measurements (Flechard and Fowler, 1997).
Concentrations of secondary inorganic aerosol in the countryside show much smaller temporal
and spatial variability than gas phase NH3 (RoTAP, 2012; Tang et al., 2018), and a network
to quantify the spatial and temporal trends in aerosol and rainfall composition requires fewer
sites than NH3 (RoTAP, 2012).
2.4.2 Ammonia in the gas phase
The UK national ammonia monitoring network (NAMN) has ~80 sites providing monthly data,
consisting of 49 sites with passive (alpha) samplers (Tang et al, 2018) and 59 sites with active
denuder samplers, and two sites (the super-sites) at which NH3 is continuously measured at
hourly resolution using an automated wet chemistry technique based on denuder sampling of
gas phase NH3 (Twigg et al., 2013). The different techniques are co-located at a range of sites
to allow the methods to be compared.
The annual mean NH3 concentration field is heterogeneous, with several areas of large
concentration (>4 ppb) in East Yorkshire, Norfolk, the Welsh-English border counties and in
SW England (Figure 3). In upland areas throughout the UK NH3 concentrations average < 1
ppb.

23
The longest running sites were established in 1996-7. The long-term trend in measured NH3
averaged across all sites shows a small downward trend (Figure 4), but which is not
statistically significant at the country scale using a Mann-Kendall (MK) test (Tang et al., 2018).
In areas in which emissions of NH3 are dominated by pig and poultry farming, a statistically
significant 22% reduction (MK) in annual NH3 concentrations has been observed since 1997.
By contrast, in areas with NH3 emissions dominated by cattle there was a small, non-
statistically significant increase in concentrations, despite a decrease in emissions from this
sector as estimated by the NAEI (Tang et al., 2018).
Overall, therefore, the NH3 monitoring data show only very small changes in NH3
concentrations over the period 1999 to 2015 and do not show the 16% decline reported in the
NAEI emissions.
2.4.3 Particulate NH4+ concentrations in the air
Concentrations of particulate NH4+ have been monitored since 1999. This provides a 15 year
period to examine spatial and temporal trends. The annual mean spatial concentration field is
similar to that for concentrations in precipitation with a general NW to SE increase in
concentration from the smallest values in NW Scotland (Figure 3).

24
Figure 3. Annual mean concentrations of gaseous NH3 (left), using the FRAME model,
calibrated with the UK ammonia network measurements and particulate NH4+ (right)
interpolated from the UK measurement network, for in 2015.
Over the 15 years, particulate NH4+ concentrations averaged over all measurement sites
declined by 44% (Fig. 4), along with declines in particulate SO42- and NO3
- (Tang et al., 2018).
The longer-term declines in SO42- are much larger, as reflected in trends of non-marine SO4
2-
in precipitation from 1986 onwards. The declines in particulate SO42-
have been important in
modifying the atmospheric behaviour and lifetime of NH3, in part because NH4NO3 exists in
equilibrium with gaseous NH3 and HNO3, which therefore sublimes as the HNO3 and NH3 are
dry deposited at the surface, but also because an important sink for NH3 (its reaction with
H2SO4) has been removed from the atmosphere. By contrast, when the NH3 was sequestered
by SO42-, the NH4
+ was retained within particulate matter by the SO42- throughout its
atmospheric lifetime.
25
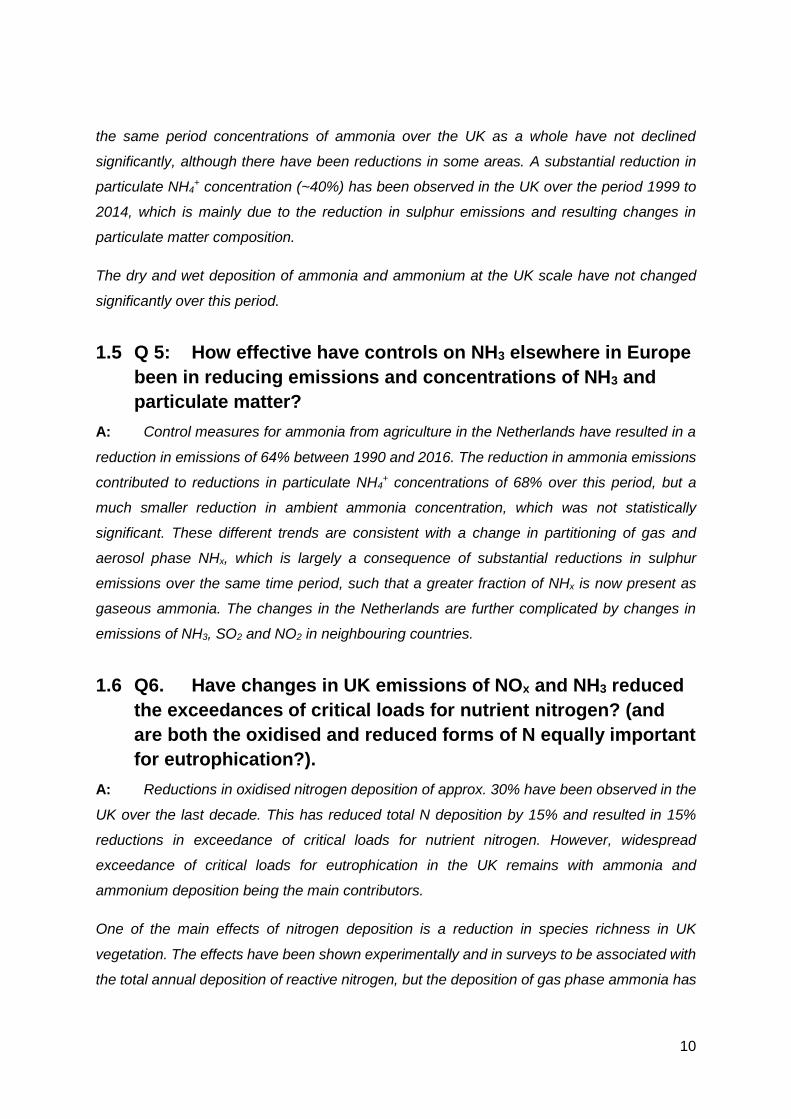
Figure 4. Upper panel: Long-term trends in annual NH3 concentrations over the UK for (a) the
59 sites operational 1998 to 2013, (b) the 66 sites operational 1999 to 2014 and (c) the 75
sites operational 2000-2014 (Tang et al., 2018). Lower panel: Long term trends in annual
particulate NH4+ concentrations between 1999 and 2014 over the UK for (a) the original 23
site network and (b) since the network was expanded to 30 sites in 2006 (from Tang et al.,
2018, Supplement). The high value of NH4+ for 2003 can be explained by long-range transport
associated with particular meteorological conditions, as explored in detail by Vieno et al.
(2016b).
2.4.4 NH4+
in rain
The concentrations of NH4+ in rain, originating from the washout of both NH3 and NH4
+, show
W-E and N-S gradients of increasing concentration with the largest concentrations in the East
and South of the UK and a region of large concentrations between North Yorkshire and Kent,
centred on Lincolnshire (Fig. 5). In these areas, the annual mean concentration exceeds those
on the west coast by approximately a factor of three. Across all sites there is a small
(statistically non-significant) reduction in wet deposition of NH4+, but with considerable spatial
variability over the period 1986 to 2015 (some individual sites report statistically significant
trends and some do not). For comparison with the measurements of NH3, which begin in the

26
late 1990s, there is no significant trend in wet NH4+ deposition over the 1999-2015 period, and
the inter-annual variability conceals any trend in the data at the UK scale.

27
Figure 5. Annual precipitation weighted mean concentrations of NH4+ in rain over the UK in
2015. The map is interpolated from measurements of UK precipitation chemistry as
described in RoTAP 2012.
2.4.5 Interpretation
At first glance, it appears inconsistent that, firstly, NH3 emissions are thought to have declined,
whilst NH3 concentrations have remained more or less constant, and, secondly, that NH4+
concentrations have declined whilst NH4+
wet deposition has shown variability but not a clear
trend. One reason is that the effective lifetime (and transport distance) of NH3 has increased
with decreasing SO2 emissions because less is tied up as non-volatile (NH4)2SO4 and more
forms the dynamic equilibrium with volatile NH4NO3. This is consistent with observations of
NH3 concentration increases in remote areas and those dominated by sheep emissions,
suggesting that more of the emitted NH3 remains in the gas phase as the acidic aerosol sinks

28
(SO42-, and NO3
-) have declined. In addition, NH3 deposition rates are thought to have
decreased due to leaf surfaces having become increasingly alkaline (Fowler et al., 2009). Both
these effects appear to have balanced the reported decrease in emission, and it follows that
in the absence of a decrease in NH3 emission, NH3 concentrations would have gone up over
the same period due to the reduction in SO2 and NOx emissions.
The NH4+ concentrations have decreased over this period because the emissions of all
precursor gases for the NH4+ compounds have decreased, less NH3 is (irreversibly) converted
to particulate NH4+ and because the lifetime of NH4
+ has decreased due to the shift from
sulphate to nitrate. In addition, as a longer-lived compound particulate NH4+ strongly reflects
emission changes elsewhere in Europe. From measurements alone it is impossible to attribute
how much of the NH4+ reduction is attributable to the reduction in NH3 emission and how much
to the reduction in SO2 and NOx emission. The change of the dominant aerosol form from
(NH4)2SO4 to NH4NO3, also reduces the average atmospheric lifetime of reduced N overall
and consequently the long-range transport out of the country.
It is unclear at present, why NH4+ wet deposition has not decreased in line with NH4
+
concentrations, but the observed trends in NH3 and NH4+ concentrations, and in NHx wet
deposition can successfully be reproduced with an atmospheric chemistry transport model
(Fig. 6).

29
Figure 6a. Modelled trends in UK average concentrations and UK total deposition in
response to emission changes as simulated with the EMEP4UK modelling system (Massimo
Vieno, pers. commun.). 2003 was a particularly dry year where the annual mean was also
affected by long-range transport events in the spring (Vieno et al. 2016b), while 2012 and
2014 were wet years.
350
300
250
200
150
100
50
0
NH
3 e
mis
sio
n [kt yr-1
]
20142012201020082006200420022000
1.2
0.8
0.4
0.0
Co
nce
ntr
atio
ns [µ
g m
-3]
60
50
40
30
20
10
0
De
po
sitio
n [kt yr-1
]1500
1000
500
0
NO
x / SO
x em
issio
n [k
t yr -1]
NH3 dry dep
NHx wet dep
NOx wet dep
NH3 emission
NOx emission
SOx emission
NH3 HNO3 NH4
+

30
Figure 6b. Modelled trends in UK average concentrations and UK total deposition in
response to emission changes as simulated with the EMEP4UK modelling system (Massimo
Vieno, pers. commun.). 2003 was a particularly dry year where the annual mean was also
affected by long-range transport events in the spring (Vieno et al. 2016b), while 2012 and
2014 were wet years.
350
300
250
200
150
100
50
0
NH
3 e
mis
sio
n [kt yr-1
]
20162012200820042000
1.5
1.0
0.5
0.0
Co
nce
ntr
atio
ns [µ
g m
-3]
80
60
40
20
0
De
po
sitio
n [kt yr-1
]
1500
1000
500
0
NO
x / SO
x em
issio
n [k
t yr-1]
NHx wet dep
NOx wet dep
NHx dry dep
NH3 emission
NOx emission
SOx emission
NH3 HNO3 NH4
+

31
2.5 Q 5: How effective have controls on NH3 elsewhere in Europe
been in reducing emissions and concentrations of NH3 and
particulate matter?
As noted above, the most effective regulatory controls on NH3 emission in Europe have been
applied in the Netherlands and Denmark since the late 1990s. In the Netherlands, a reduction
in NH3 emissions of about 50% has been estimated to be achieved between 1993 and 2014
(Figure 7) through reducing emissions from manure (van Zanten et al., 2017; Wichink Kruit et
al., 2017). There has been much debate in these countries on the “ammonia gap” where NH3
concentrations were found not to have reduced as quickly as anticipated (Erisman et al., 2001;
Bleeker et al., 2009).
Figure 7: Estimated contributions to the changes in NH3 emission from agriculture in the
Netherlands 1990 to 2014 (Wichink-Kruit et al., 2017).
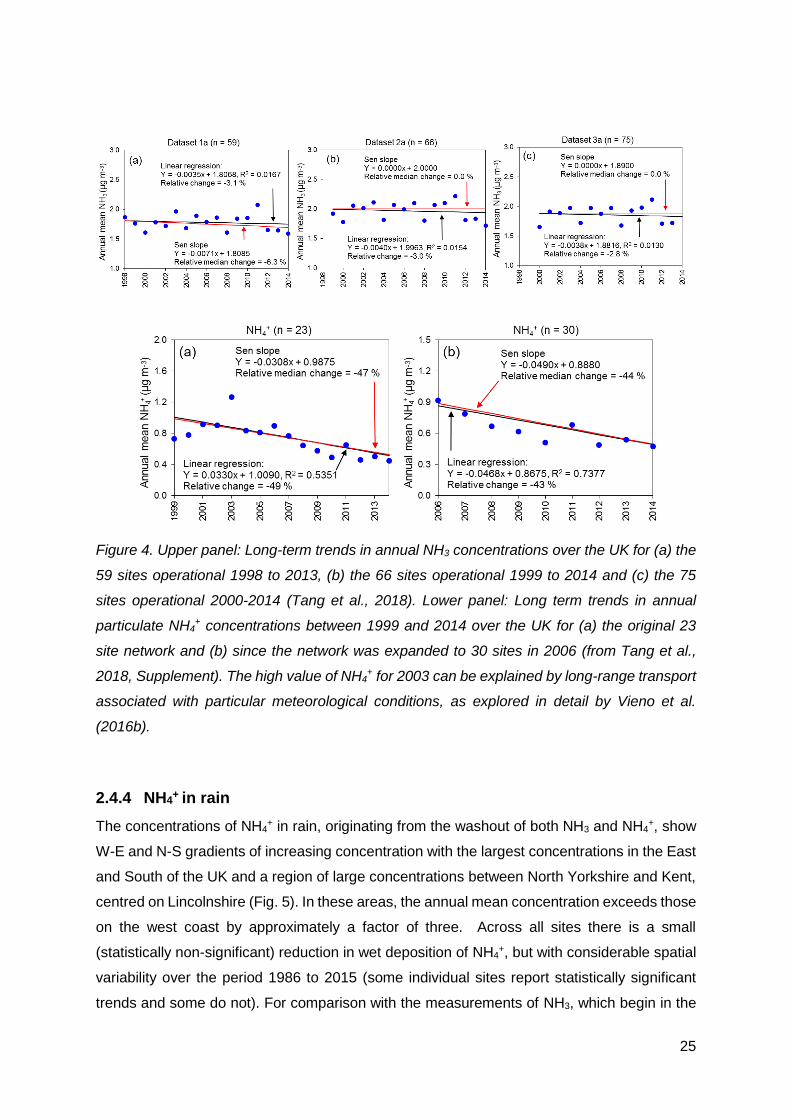
The corresponding trends in ambient NH3, NO2 and SO2 concentrations in the Netherlands
are shown in Figure 8. These show marked declines in SO2 and NO2, but much smaller
changes in NH3, despite the large reduction in reported emissions. Similar to the emission
responses in the UK, no significant trend in NH3 concentration was observed for the entire
period. However, if broken up into two periods, there was an initial statistically significant
decrease (-36%) in NH3 during 1993-2004, followed by an increase (+19%) in 2005-2014 (van
32
Zanten et al., 2017). At the same time, NH4+ concentrations decreased by 68%, i.e. by more
than the reduction in NH3 emission.
Unlike in the UK, however, total NH4+ wet deposition also decreased, by 47%.
Figure 8. Trends in NH3 emission and observed annual average NH3, NO2 and SO2 in the
Netherlands between 1990 and 2014 (from Wichink Kruit et al., 2017)
Overall, analysis of the monitoring networks in the Netherlands, the UK, other European
countries such as Hungary (Horvath et al., 2009) and Denmark (Bleeker et al., 2009), but also
the US shows that the reduction in NH3 emission since 1990 primarily resulted in reduction in
particulate NH4+ concentrations rather than in gaseous NH3 concentrations, which can be
attributed to the simultaneous reduction in atmospheric acid concentrations and the change
from sulphate to nitrate chemistry. This in turn maintained higher gaseous NH3 concentrations
in areas where NH3 emissions have reduced, compensated by a substantial reduction in
particulate NH4+ concentrations and, in the case of both the Netherlands and Denmark , a
substantial reduction in wet deposited NH4+ (47% for Netherlands, van Zanten et al., 2017;
28% for Denmark, Bleeker et al. 2009).

33
The fact that the observations of a weak response in NH3 concentration and a much stronger
response in NH4+ concentrations is due to the reduction in emissions of NH3 coupled with
simultaneous reductions in NOx and SO2 emissions is strongly supported by the ability of
atmospheric chemistry transport models to reproduce the observed trends in the Netherlands
and the UK. The modelled trends for the UK have been presented above (Fig. 6). The
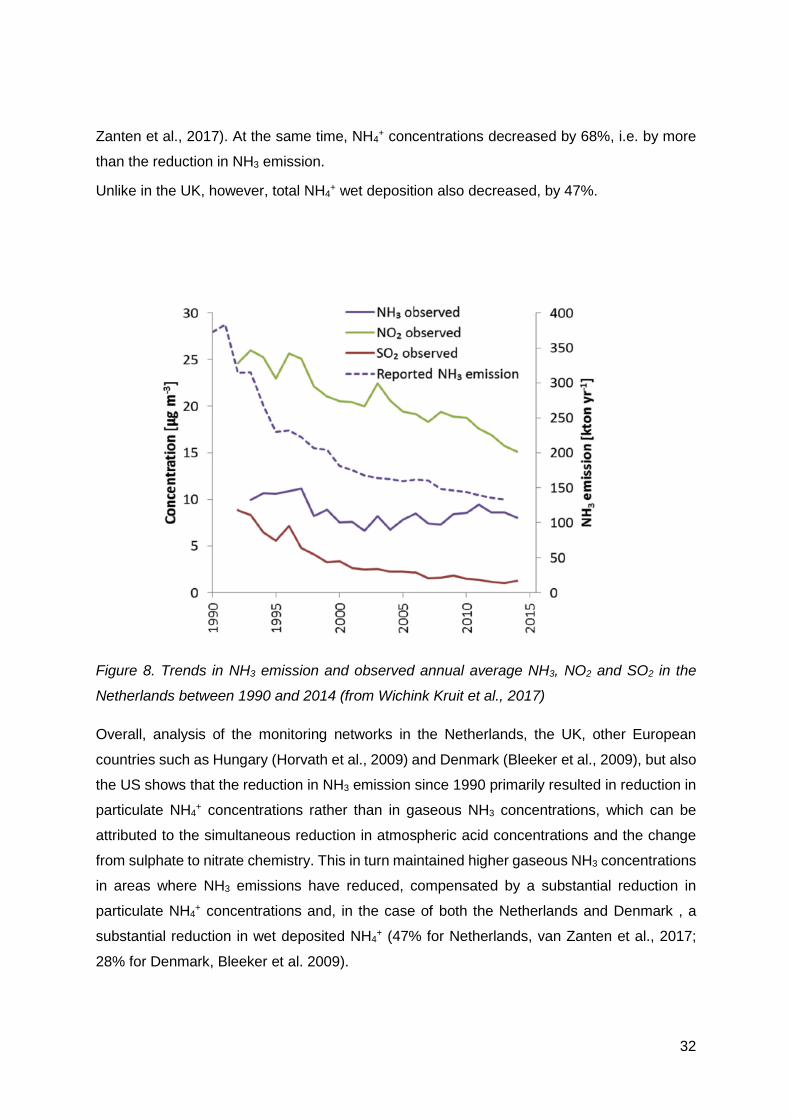
modelled Dutch trends for the period 1990 to 2014 are shown in Figure 9, alongside the
measurement trends (Wichink Kruit et al., 2017). The modelled data reproduce the trends in
particulate matter quite well. The fact that the OPS model of Wichink Kruit et al. (2017) does
not exactly match the gaseous NH3 concentrations may be due to remaining uncertainties in
capturing the chemical interactions. These findings are consistent with those also found for
Hungary, where emissions decreased due to reductions in animal numbers and fertilizer use
after 1990 (Horvath and Sutton, 1998; Horvath et al., 2009), and with the reductions in NH3
and NH4+ concentrations observed following an active programme of NH3 mitigation activities
in Denmark (Bleeker et al. 2009).
In summary, the close scrutiny of responses to NH3 emission reductions in the Netherlands
raised early concerns over the effectiveness of the control measures, but it is clear now that
temporal trends in gaseous NH3 concentrations should not be seen in isolation from
concurrent trends in particulate NH4+ and acid gas concentrations, especially SO2 and HNO3.
As outlined in answer to Question 3, a range of simple and well-validated control measures
are available to reduced NH3 emissions, which have been deployed in both the Netherlands
and Denmark. In the case of the Netherlands, the results are consistent with an NH3 emission
reduction of approximately 50%. While the resulting reductions in concentrations of NH3 in the
Netherlands have been much smaller and statistically non-significant over the entire time-
frame, particulate NH4+ reductions have been larger at 68% and NH4
+ deposition reductions
in between these two measures at 47%.
34
Figure 9. Annual average measured and modelled concentrations of NH3 (upper panels),
particulate NH4+ (middle panels) and average accumulated wet deposited NH4
+ in the
Netherlands between 1990 and 2014, (Kruit et al 2017)

35
2.6 Q6. Have changes in UK emissions of NOx and NH3 reduced
the exceedances of critical loads for nutrient nitrogen? (and
are both the oxidised and reduced forms of N equally important
for eutrophication?).
The exceedance of critical loads for nutrient nitrogen are quantified by comparing the spatial
distribution of total N deposition, including all oxidized and reduced forms of reactive nitrogen
deposition with the critical loads (Hall et al., 2017). For these calculations, no distinction is
made between the oxidized and reduced forms of nitrogen. However, it is clear that NH3 in the
gas phase is more damaging to some ecosystems per unit N deposited than oxidized N
(Sheppard et al., 2010), at least for many moorland as well as moss and lichen species. The
recognition of differential responses to different forms of reactive nitrogen deposited from the
atmosphere led to a major revision of the UNECE Critical Levels for NH3 which were reduced
from a previous value of 8 g m-3 (annual mean) to 1 g m-3 (annual mean, habitats with
lichens and bryophytes) and 3 (2-4) g m-3 (annual mean, higher plants) (Cape et al., 2009;
Sutton et al., 2009). The importance for the UK can be gauged by the findings of Hallsworth
et al. (2010), who determined the extent to which Special Areas of Conservation (SACs) are
subject to NH3 concentrations larger than critical levels. For the 1 g m-3 threshold, 69% of UK
SACs were estimated to be exceeded, with the regional figures being 97% (England), 92%
(Wales), 30% (Scotland) and 85% (Northern Ireland) and recent updates (Hall et al., 2017)
with differing methodology have shown little change over time.
Total nitrogen deposition in the UK (Fig. 10) has declined by approximately 15% since 2000
in response to reductions in the wet and dry deposition of oxidized nitrogen (of about 30%) .
The deposition of reduced nitrogen in the UK has not changed significantly since 2000, as
detailed in answers to Questions 4 and 5, but inter-year variability in wet and dry deposition is
large, typically 10 to 20 kt-N in totals of 100 to 150 kt-N. The trend of declining acid deposition
has continued as a result of declines in sulphur and oxidized nitrogen emissions and
deposition and the exceedances of critical loads for nitrogen (eutrophication) are now the main
focus of air pollution impacts on the natural environment. Recent reported trends in Critical
Load exceedances for the UK show (Hall et al 2017) :
The area of acid-sensitive habitats in the UK with exceedance of acidity critical loads has
fallen by over a third, from 72.6% in 1995 to 44.1% in 2015.

36
The magnitude of the acidity exceedance (expressed as the Average Accumulated
Exceedance) for all UK habitats combined more than halved, from 0.78 to 0.28 keq ha-1
year-1 between 1995 and 2015.
The area of nitrogen-sensitive habitats in the UK with exceedance of nutrient nitrogen
critical loads has fallen from 75% in 1995 to 63.4% in 2015, (i.e., overall decline of about
15%).
The magnitude of nutrient nitrogen exceedance (expressed as the Average Accumulated
Exceedance) for all UK habitats combined has decreased by one-third, from 9.5 kg N ha-
1 year-1 in 1995 to 6.2 kg N ha-1 year-1 in 2015.

37
Figure 10. Total deposition of N in the UK 2015. The map comprises wet deposition of NH4+,
NO3- and dry deposition of NO2, HNO3 and NH3. Estimates from CBED (concentration based
estimates of deposition) as described in RoTAP 2012.

38
2.7 Q7. What are the relative air quality benefits and costs for
controls on ammonia emissions?
The cost benefit analysis needs to consider the costs to farmers of taking action to reduce
NH3 emissions, the benefits to farmers of improving nitrogen use efficiency and the benefits
to society of improving air quality.
2.7.1 Benefits
2.7.1.1 PM concentrations
The greatest benefits of control measures to reduce NH3 emissions to date have been the
reductions in particulate NH4+, which (as detailed in answers to Questions 4 and 5) have
declined more rapidly than NH3 concentrations in air. However, from the measurements alone
it is unclear how much of the NH4+ reduction observed can be attributed to decreases in NH3
emission and how much to the simultaneous decrease in emissions of NOx and SO2. Such
attribution is only possible through model scenario runs. Because the formation of NH4NO3
approximately forms an equilibrium with the concentration product of NH3 and HNO3, there
are areas where NH4NO3 formation is NH3 limited (i.e. it responds more sensitively to changes
in NH3 concentration) and areas that are HNO3 limited. A modelling study, using the same
EMEP4UK modelling framework that has successfully reproduced past trends (Fig. 6 above),
suggested that a 30% reduction in UK NH3 emissions would reduce PM2.5 concentrations by
0.3 to 0.5 g m-3 over most of England and Wales, for the reference year 2010 (Figure 11;
Vieno et al., 2016a). At the same time, the model suggested that about 50% of the particulate
NH4+ related PM in the UK originated from gases emitted elsewhere in Europe. Thus,
additional NH3 emission reduction across Europe would result in a larger reduction in PM.

39
Figure 11. (a) PM2.5 concentrations simulated for 2010 (bottom colour scale) and changes in
PM2.5 concentrations in response to 30% emission reductions of (b) NH3 , (c) NOx, (d) SOx,
(e) volatile organic compounds and (f) primary PM2.5 (right-hand-side colour scale) (from Vieno
et al., 2016a).
A global modelling study (Pozzer et al., 2017) calculated that a 50% reduction in European
NH3 emissions would result in a reduction of the European average PM2.5 concentration by
about 1 g m-3. This would be associated with a reduction of the UK PM2.5-related premature
mortality by 21%. It should be noted that this analysis of premature mortality assumes all
chemical components of PM2.5 to be equally detrimental to human health. There is currently
no conclusive evidence to either support or disprove this assumption.
A similar sensitivity of PM to changes in NH3 emission was derived in a further European
modelling study (Megaritis et al., 2013). By contrast, two studies (Redington et al., 2009;
Harrison et al., 2013) derived much smaller sensitivities to NH3 emission reductions, but both
these studies did not use fully coupled 3-dimensional Eulerian chemistry and transport models
and derived their conclusions from the modelling of short time-periods which increases
uncertainty of being representative of the full year. Some of the high NH4NO3 episodes in the

40
UK are dominated by UK emissions, whilst others are controlled by European emissions
outside the UK (Vieno et al., 2014, 2016b), and some high concentration episodes (as
investigated by Redington et al. (2009)) may be particularly insensitive to NH3 changes
because they are particularly HNO3 limited.
2.7.1.2 Deposition
The effect of ammonia emission abatement on the area of critical loads exceedance can also
be simulated using atmospheric chemistry transport models. For 2020 emissions as predicted
in 2012, further NH3 emission reduction scenarios of 15 to 26% has been suggested to result
in an additional protection of 26 to 72% of unprotected area of the Spatial Areas of
Conservation sites in the UK (CEH, 2012). Available evidence suggests that that ecosystems
tend to recover following a reduction in ammonia deposition, although there has been much
debate on the timescales needed for recovery (ROTAP, 2012). For example, Mitchell et al.
(2004) found recovery of epiphytic species one year after transplanting from a polluted to a
clean site, while for forest ground flora, trees and soils cycling of available nitrogen pools may
require several decades for full recovery. Field observations from a peatland ecosystem
showed substantial recovery in moss and lichen (Sphagnum and Cladonia) populations within
5 years of cessation of a local point source of NH3 emissions (M. Sutton and N. van Dijk, pers.
commun.).
2.7.2 Costs
Most effort has been placed on estimating the NH3 mitigation costs. In early studies during the
2000s, assessments tended to estimate very high costs of NH3 mitigation. This seemed to be
based on a precautionary approach to the costs and lack of widespread experience, as well
as the potential for improved experience and scaling up to reduce costs. A major review and
re-evaluation of the mitigation costs led to substantial re-valuing of the mitigation costs, which
led to much smaller estimates (Reis et al., 2015). At the same time it was agreed that the
value of the nitrogen saved in reducing NH3 emissions should be included in regional cost
estimates.
The resulting cost estimates calculated for the European Commission under the review of the
National Emissions Ceilings Directive included these revisions. These included cost curves,
such that the first measures taken could be estimated to be profitable for farmers, while
increasing ambition would be associated with larger costs. The report of Amann et al. (2014)
estimated that maximum technically feasible reduction in emissions (MTFR) would reduce EU
emissions by around 1000 kt NH3 per year, almost all of which was associated with agricultural

41
mitigation, at a cost of around 2000 million € per year, which is equivalent to around €2 per kg
NH3 abated, or about €2.40 per kg N abated.
By comparison the European Nitrogen Assessment estimated the damage costs of different
forms of nitrogen pollution at 70-320 billion € per year (Sutton et al., 2011), subsequently
updated by van Grinsven et al. (2013) to 75-485 billion € per year. Embedded in these
estimates were estimated costs of NH3 pollution to human health and biodiversity protection.
According to the ENA approach, these were estimated at €2 to €20 per kg N pollution for
human health and €2 to €10 per kg N pollution for biodiversity related societal costs.
Combined these provide estimates in the region of €4 to €30 per kg N pollution as NH3, with
the wide uncertainty ranges reflective of both the uncertainty in scientific knowledge and the
challenge of applying a willingness to pay approach to different societal costs.
Overall, this comparison shows that the mitigation costs (even with a MFTR scenario) are
much smaller than the estimated societal benefits based on the current estimates. The
costs to farmers would also be expected to reduce substantially through further upscaling
and technological refinement as circular economy approach emerges more strongly in the
next years offering profits to farmers when combining the most cost-effective approaches as
part of a strategy to improve nitrogen use efficiency. Here innovative approaches to
improving nitrogen management may make a substantial contribution to cost savings and
profitability on farms. For example, it has been calculated that total nitrogen losses from
European farms amount to 18 billion tonnes per year (Sutton et al., 2011, ENA). Based on a
fertilizer value of €0.80 per kg N, Sutton et al. (2017) have shown that these losses
represent a cash loss of 25% of the entire EU Common Agricultural Policy (CAP) budget of
€56 billion per year. Recognition of the scale of this financial loss should provide a huge
motivation for farmers to reduce NH3 and other nitrogen emissions. A study by Pinder et al
(2007) of the options for reducing PM2.5 concentrations in Eastern United States of America
suggested that controlling ammonia emissions provided a more cost effective approach
relative to further controls on SO2 and NOx emissions.

42
3 References
ADML 2016 Atmospheric Dispersion Modelling Liaison Committee. ADMLC-R8. (April
2016) Includes annex: A review of the limitations and uncertainties of modelling pollutant
dispersion from non-point sources. Link to annex and links to datasets used: FarmF, FarmG
and SiteB (Please note that the Whitelees data is available from CERC provided permission
for their use has been obtained from the Sniffer.)
Amaraz M., Bai E., Wang C., Trousdel J., Conley S., Faloona I. and Houlton B.Z. (2018).
Agriculture is a major source of NOx pollution in California. Science Advances 4: eaao3477.
Bealey W.J.,Dore A.J., Dragosits U., Reis S., Reay D.S. and Sutton M.A. 2016 The potential
for tree planting strategies to reduce local and regional ecosystem impacts of agricultural
ammonia emissions. J. Environmental Management 165 pp106-116
Sutton M.A., Reis S., and Baker S.M.H. (2009) Atmospheric Ammonia: Detecting emission
changes and environmental impacts. (Eds). Springer, 464 pp.
Aksoyoglu, S., Keller, J., Ciarelli, G., Prévôt, A. S. H., and Baltensperger, U.: A model study
on changes of European and Swiss particulate matter, ozone and nitrogen deposition between
1990 and 2020 due to the revised Gothenburg protocol, Atmos. Chem. Phys., 14, 13081-
13095, https://doi.org/10.5194/acp-14-13081-2014, 2014.
Amann M. et al. (2014) The Final Policy Scenarios of the EU Clean Air Policy Package.
TSAP Report #11 Version 1.1a.
http://www.iiasa.ac.at/web/home/research/researchPrograms/air/policy/TSAP_11-finalv1-
1a.pdf
APIS 2017 apis.ac.uk/overview/pollutants_NH3.htm
AQEG 2012 Fine Particulate Matter (PM2.5 ) in the United Kingdom
Bittman, S., Dedina, M., Howard C.M., Oenema, O. and Sutton, M.A. (2014) (eds.) Options
for ammonia mitigation: Guidance from the UNECE Task Force on Reactive Nitrogen. TFRN-
CLRTAP, Centre for Ecology and Hydrology, UK. [ ISBN: 978-1-906698-46-1]
Bleeker A., Sutton M.A., Acherman B., Alebic-Juretic A., Aneja V.P., Ellermann T., Erisman
J.W., Fowler D., Fagerli H., Gauger T., Harlen K.S., Hole L.R., Horváth L., Mitosinkova M.,
Smith R.I., Tang Y.S., van Pul. A. (2009) Linking ammonia emission trends to measured
concentrations and deposition of reduced nitrogen at different scales. Chapter 11, in:
Atmospheric Ammonia: Detecting emission changes and environmental impacts (eds. M.A.
Sutton, S. Reis and S.M.H. Baker), pp 123-180, Springer.
Bundesrat (2017) Drucksache 148/17 Verordnung des Bundesministeriums für Ernährung und
Landwirtschaft. Verordnung zur Neuordnung der guten fachlichen Praxis beim Düngen.
http://www.bmel.de/SharedDocs/Downloads/Service/Rechtsgrundlagen/Entwuerfe/EntwurfD
uengeverordnung.pdf?__blob=publicationFile
43
Cape, J.N., van der Eerden, L.J.; Sheppard, L.J., Leith, I.D., Sutton, M.A. (2009) Evidence
for changing the critical level for ammonia. Environmental Pollution 157, 1033-1037. DOI:
10.1016/j.envpol.2008.09.049.
CEH (2012) Future patterns of ammonia emissions across the UK and the potential impact
of local emission reduction measures - AC0109,
http://sciencesearch.defra.gov.uk/Default.aspx?Menu=Menu&Module=More&Location=None
&Completed=0&ProjectID=14938
CNRS cnrs.fr/presse/communique/3481.htm
COMEAP (2009) Long-term exposure to Air Pollution: Effect on mortality. The committee on
the Medical effects of Air Pollutants.
COMEAP (2010). The mortality effects of long term exposure to ParticulateAir Pollution in the
United Kingdom. The Committee on the Medical effects of Air Pollutants. 2005
Denmark Emissions inventory submission under NECD and CLRTAP (2018), http://cdr.eionet.
europa.eu/dk/eu/nec_revised/inventories
Dragosits U, Theobald M , Place CJ, ApSimon H.M., and M.A. Sutton 2006 The potential for
spatial planning at the landscape level tomitigate the effects of atmospheric ammonia
deposition. Environmental science & policy 9 (2006) 626 – 638.
EEA 2016 Facts and figures on agriculture reductions as proposed under the Commission’s
NECD proposal
Ellis , J. G. Murphy1, M. Z. Markovic , T. C. VandenBoer , P. A. Makar , J. Brook , and C.
Mihele (2011) The influence of gas-particle partitioning and surface-atmosphere exchange
on ammonia during BAQS-Met . Atmos. Chem. Phys., 11, 133–145, 2011
Erisman J.W., Mosquera J. and Hensen A. (2001) Two options to explain the ammonia gap in
The Netherlands. Environmental Science and Policy 4, 97-105. Flechard, C.R. and Fowler, D.
1998. Atmospheric ammonia at a moorland site. I: The meteorological control of ambient
ammonia concentrations and the influence of local sources. Q. J. R. Meteorol. Soc 124, 733-
757.
Fowler, D., Pitcairn, C.E.R., Sutton, M.A., Flechard, C., Loubet, B., Coyle, M. and Munro, R.C.
1998. The mass budget of atmospheric ammonia in woodland within 1km of livestock
buildings. Environ. Pollut.. 102, S1, 343-348.
Fowler, D., Pilegaard, K., Sutton, M.A., Ambus, P., Raivonen, M., Duyzer, J., Simpson, D.,
Fagerli, H., Fuzzi, S., Schjoerring, J.K., Grainer, C., Neftel, A., Isaksen, I.S.A., Laj, P., Maione,
M., Monks, P.S., Burkhardt, J., Daemmgen, U., Neirynck, J., Personne, E., Wichink-Kruit, R.,
Butterbach-Bahl, K., Flechard, C., Tuovinen, J.P., Coyle, M., Gerosa, G., Loubet, B., Altimir,
N., Gruenhage, L., Ammann, C., Cieslik, S., Paoletti, E., Mikkelsen, T.N., Ro-Poulsen, H.,
Cellier, P., Cape, J.N., Horvath, L., Loreto, F., Niinemets, U., Palmer, P.I., Rinne, J., Misztal,
P., Nemitz, E., Nilsson, D., Pryor, S., Gallagher, M.W., Vesala, T., Skiba, U., Brueggemann,
N., Zechmeister-Boltenstern, S., Williams, J., O'Dowd, C., Facchini, M.C., de Leeuw, G.,

44
Flossman, A., Chaumerliac, N., Erisman, J.W. 2009 Atmospheric Composition Change:
Ecosystems-Atmosphere interactions. Atmospheric Environment, 43 (33). 5193-5267.
10.1016/j.atmosenv.2009.07.068
Fowler, D., Coyle, M., Skiba, U., Sutton, M.A., Cape, J.N., Reis, S., Sheppard, L.J., Jenkins,
A., Grizzetti, B., Galloway, J.N., Vitousek, P., Leach, A., Bouwman, A.F., Butterbach-Bahl, K.,
Dentener, F., Stevenson, D., Amann, M., Voss, M. 2013. The global nitrogen cycle in the
twenty-first century. Philosophical Transactions of The Royal Society B 368 (1621),
20130164. DOI: 10.1098/rstb.2013.0164
Hall, J., Rowe, E., Smith, R., Dore, T., Jarvis, S., Bealey, B., Roberts, E., Smart, S., Henrys,
P., Evans, C. 2017. Provision of Mapping and Modelling of Critical Loads and Critical Levels
Exceedance 2016-19. Annual Report: Year 1. Report to Defra under contract AQ0843 (CEH
Project NEC05708), submitted 21/06/17.
Hallsworth S., Dore A.J., Bealey W.J., Dragosits U., Vieno M., Hellsten S.. Tang Y.S. and M.A.
Sutton M.A. (2010) The role of indicator choice in quantifying the threat of atmospheric
ammonia to the ‘Natura 2000’ network. Environmental Science and Policy 13, 671-687.
Harrison, R.M., Jones, A.M., Beddows, D.C.S., Derwent, R.G. (2013). The effect of varying
primary emissions on the concentrations of inorganic aerosols predicted by the enhanced UK
Photochemical Trajectory Model. Atmos. Environ. 69, 211-218.
Horváth L., Fagerli H. and Sutton M.A. (2009) Long-Term Record (1981–2005) of ammonia
and ammonium concentrations at K-Puszta Hungary and the effect of sulphur dioxide emission
change on measured and modelled concentrations. Chapter 12, in: Atmospheric Ammonia:
Detecting emission changes and environmental impacts (eds. M.A. Sutton, S. Reis and S.M.H.
Baker), pp 181-186, Springer.
Makar, P. A., Moran, M. D., Zheng, Q., Cousineau, S., Sassi, M., Duhamel, A., Besner, M.,
Davignon, D., Crevier, L.-P., and Bouchet, V. S.: Modelling the impacts of ammonia emissions
reductions on North American air quality, Atmos. Chem. Phys., 9, 7183-7212,
https://doi.org/10.5194/acp-9-7183-2009, 2009.
Megaritis, A. G., Fountoukis, C., Charalampidis, P. E., Pilinis, C., and Pandis, S. N.: Response
of fine particulate matter concentrations to changes of emissions and temperature in Europe,
Atmos. Chem. Phys., 13, 3423-3443, https://doi.org/10.5194/acp-13-3423-2013, 2013.
Netherlands Emissions inventory submission under NECD and CLRTAP (2018),
http://cdr.eionet. europa.eu/nl/eu/nec_revised/inventories/
Pozzer, A., Tsimpidi, A. P., Karydis, V. A., de Meij, A., and Lelieveld, J.: Impact of agricultural
emission reductions on fine-particulate matter and public health, Atmos. Chem. Phys., 17,
12813-12826, https://doi.org/10.5194/acp-17-12813-2017, 2017.
Reis S., Howard C.M. and Sutton M.A., (eds) (2015). Costs of ammonia abatement and the
climate co-benefits. Springer. 284 pp.

45
ROTAP (2012) Review of Transboundary Air Pollution: Acidification, Eutrophication, Ground
level Ozone and Heavy Metals in the UK. Report to Defra. Published by the Centre for Ecology
and Hydrology.
Sheppard, L. J., Leith, I. D.; Mizunuma, T., Cape, J.N., Crossley, A., Leeson, S., Sutton, M.A.,
Fowler, D., van Dijk, N. 2011. Dry deposition of ammonia gas drives species change faster
than wet deposition of ammonium ions: evidence from a long-term field manipulation. Global
Change Biology, 17 (12). 3589-3607. 10.1111/j.1365-2486.2011.02478.x
Sheppard, L.J., Leith, I.D., Mizunuma, T., Leeson, S., Kivimaki, S., Cape, J.N., van Dijk, N.,
Leaver, D., Sutton, M.A., Fowler, D., van den Berg, L.J.L., Crossley, A., Fields, C., Smart, S.
2014. Inertia in an ombrotrophic bog ecosystem in response to 9 years’ realistic perturbation
by wet deposition of nitrogen, separated by form. Global Change Biology 20. 566-580. DOI:
10.1111/gcb.12357.
Skiba U. and Ball B. (2002) The effect of soil texture and soil drainage on emissions of nitric
oxide and nitrous oxide. Soil Use and Management 18, 56-60.
Stevens, C. J., Duprè, C., Dorland, E., Gaudnik, C., Gowing, D. J. G., Bleeker, A., Diekmann,
M., Alard, D., Bobbink, R., Fowler, D., Corcket, E., Mountford, J. O., Vandvik, V., Aarrestad,
P. A., Muller, S., Dise, N. B. 2010 Nitrogen deposition threatens species richness of
grasslands across Europe. Environmental Pollution, 158. 2940-2945.
10.1016/j.envpol.2010.06.006
Sutton M.A., Dragosits U., Geels C., Gyldenkærne S., Misselbrook T.H. and Bussink W.
(2015) Review on the scientific underpinning of calculation of ammonia emission and
deposition in the Netherlands. Report for the Netherlands Minister of Economic Affairs.
http://www.tweedekamer.nl/kamerstukken/brieven_regering/detail?id=2015Z16003&did=201
5D32493
Sutton M.A., Howard C.M., Brownlie W.J., Skiba U., Hicks W.K., Winiwarter W., van Grinsven
H., Bleeker A., Westhoek H., Oenema O., de Vries W., Leip A., Geupel M., Kugelberg S.,
Koslova N., Lukin S.M., Bittman S, Amon B., Cordovil C. M. d. S., and Dalgaard T. (2017) The
European Nitrogen Assessment 6 years after: What was the outcome and what are the future
research challenges? In: Innovative Solutions for Sustainable Management of Nitrogen.
Procs. From the International Conference, Aarhus, Denmark (25-28 June 2017). (Eds.:
Dalgaard T., Oelesen J.E., Schjoering J.K., Jensen L.S., Vejre H., Andersen P.S., Gundersen
P., Jacobsen B.H., Jensen J.D., Hasler B., Termansen M., Hertel O., Brock S., Kronvang B.,
Svenning J.C., Sigsgaard T., Hansen B., Thorling L., Hoejberg A.L., Wiborg I.A., Piil K.,
Kjeldsen ., Graversgaard M., Hutchings N., de Vries W., Gristensen J. and Mukendi T.). pp
40-49. Aarhus University and the dNmark Research Alliance.
Sutton, M.A., Reis, S., Riddick, S.N., Dragosits, U., Nemitz, E., Theobald, M.R., Tang, Y.S.,
Braban, C.F., Vieno, M., Dore, A.J., Mitchell, R.F., Wanless, S., Daunt, F., Fowler, D., Blackall,
T.D., Milford, C., Flechard, C.R., Loubet, B., Massad, R., Cellier, P., Personne, E., Coheur,
P.F., Clarisse, L., Van Damme, M., Ngadi, Y., Clerbaux, C., Skjoth, C.A., Geels, C., Hertel,
O., Kruit, R.J.W., Pinder, R.W., Bash, J.O., Walker, J.T., Simpson, D., Horvath, L.,
Misselbrook, T.H., Bleeker, A., Dentener, F., de Vries, W. 2013. Towards a climate-dependent

46
paradigm of ammonia emission and deposition. Philosophical Transactions of The Royal
Society B 368 (1621), 20130166. DOI: 10.1098/rstb.2013.0166
Tang, Y. S., Braban, C. F., Dragosits, U., Dore, A. J., Simmons, I., van Dijk, N., Poskitt, J.,
Dos Santos Pereira, G., Keenan, P. O., Conolly, C., Vincent, K., Smith, R. I., Heal, M. R., and
Sutton, M. A.: Drivers for spatial, temporal and long-term trends in atmospheric ammonia and
ammonium in the UK, Atmos. Chem. Phys., 18, 705-733, https://doi.org/10.5194/acp-18-705-
2018, 2018.
UNECE (2017) Report of the Working Group on Strategies and Review (June 2017): Special
Session on Agriculture and Air Pollution.
UK Greenhouse Gas Inventory, 1990 to 2016: Annual Report for submission under the
Framework Convention on Climate Change (2018) https://uk-
air.defra.gov.uk/assets/documents/reports/cat07/1804191054_ukghgi-90-
16_Main_Issue1.1_UNFCCC.pdf
Vieno, M., Heal, M. R., Hallsworth, S., Famulari, D., Doherty, R. M., Dore, A. J., Tang, Y. S.,
Braban, C. F., Leaver, D., Sutton, M. A., and Reis, S.: The role of long-range transport and
domestic emissions in determining atmospheric secondary inorganic particle concentrations
across the UK, Atmos. Chem. Phys., 14, 8435-8447, https://doi.org/10.5194/acp-14-8435-
2014, 2014.
Vieno, M., Heal, M. R., Williams, M. L., Carnell, E. J., Nemitz, E., Stedman, J. R., and Reis,
S.: The sensitivities of emissions reductions for the mitigation of UK PM2.5, Atmos. Chem.
Phys., 16, 265-276, https://doi.org/10.5194/acp-16-265-2016, 2016a.
Vieno M., Heal M.R., Twigg M.M., MacKenzie I.A., Braban C.F., Lingard J.N.N., Ritchie S.,
Beck R.C., Móring A., Ots R., Di Marco C.F., Nemitz E., Sutton M.A. and Reis S. (2016b) The
UK particulate matter air pollution episode of March–April 2014: more than Saharan dust.
Environmental Research Letters 11, 044004, doi:10.1088/1748-9326/11/4/044004
Van Zanten, M.C., Wichink Kruit, R.J., Hoogerbrugge, R., Van der Swaluw, E., van Pul, W.A.J.
(2017). Trends in ammonia measurements in the Netherlands over the period 1993-2014.
Atmos. Environ. 148, 352-360.
Wakeling, D., Passant, N.R., Murrells, T.P., Misra, A., Pang, Y., Thistlethwaite, G.,Walker,
C.,Brown, P., Del Vento, S., Hunter, R., Wiltshire, J., Broomfield, M., Watterson, J., Pearson,
B., Rushton K., Hobson, M., Dore C., Misselbrook T, (2018), UK Informative Inventory Report
(1990 to 2016) https://uk-
air.defra.gov.uk/assets/documents/reports/cat07/1803161032_GB_IIR_2018_v1.2.pdf
Wichink-Kruit R.J., Aben J., de Vries W., Sauter F., van der Swaluw E., van Zanten M.C., van
Pul W.A.J. (2017). Modelling trends in ammonia in the Netherlands over the period 1990-2014.
Atmos. Environ. 154, 20-30.