air pollution and cardiovascular disease...
TRANSCRIPT

Air pollution and cardiovascular disease
Antonella ZanobettiHarvard T.H. Chan School of Public Health

Introduction• Air pollution has been consistently associated with both acute and chronic
adverse health:– Cardiovascular mortality & morbidity– Respiratory mortality & morbidity– Cerebrovascular events– Lung cancer– Neurodegeneration (e.g. Parkinson's & Alzheimer's)
• Ambient particulate pollution and traffic have been linked to:– myocardial infarction – cardiac death risk– sudden deaths, arrhythmias
• People with diabetes have twice the risk of PM-associated heart disease compared to those without diabetes.
• Elderly• Subjects with previous hospitalizations

Potential Mechanisms• A number of potential pathways have been proposed to explain
the associations between short-term and long-term exposure to particulate air pollution and cardiovascular heath, including:– increased oxidative stress – systemic inflammation– changes in autonomic function– autonomic dysfunction– cerebrovascular dysfunction
• The specific underlying biological pathways are poorly understood and the identification of these mechanistic pathways warrants further study.
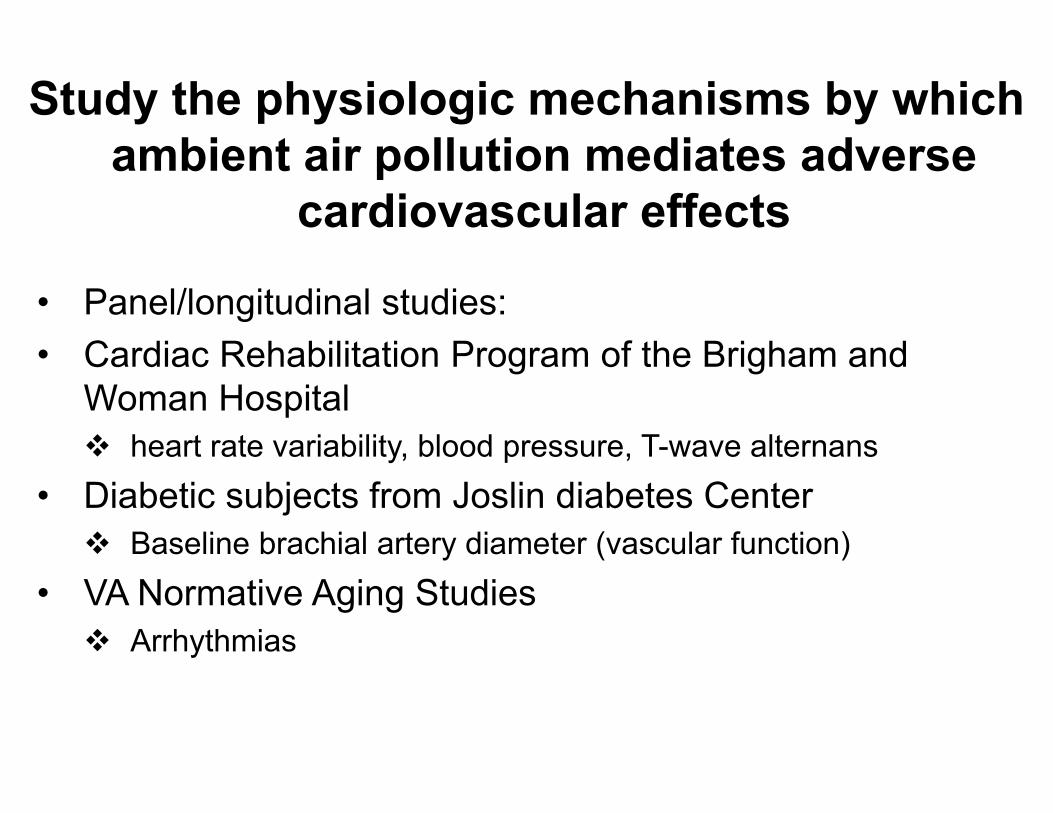
Study the physiologic mechanisms by which ambient air pollution mediates adverse
cardiovascular effects
• Panel/longitudinal studies:• Cardiac Rehabilitation Program of the Brigham and
Woman Hospital heart rate variability, blood pressure, T-wave alternans
• Diabetic subjects from Joslin diabetes Center Baseline brachial artery diameter (vascular function)
• VA Normative Aging Studies Arrhythmias

Cardiac Rehabilitation Program • Population: 66 39- to 86 year old Boston residents
– total of 641 visits between 1999 and 2001 Protocol:
• Treadmill, bicycle exercise, or weight training.• Baseline questionnaires on patients characteristics.• Height, weight, and blood pressure were measured
• Post-hospitalization had repeated visits every 3 months with Holtermonitoring for 24 hours.
– Visit 1: directly post MI (2 to 4 weeks after hospital discharge).– Visits 2-4: every 3 months
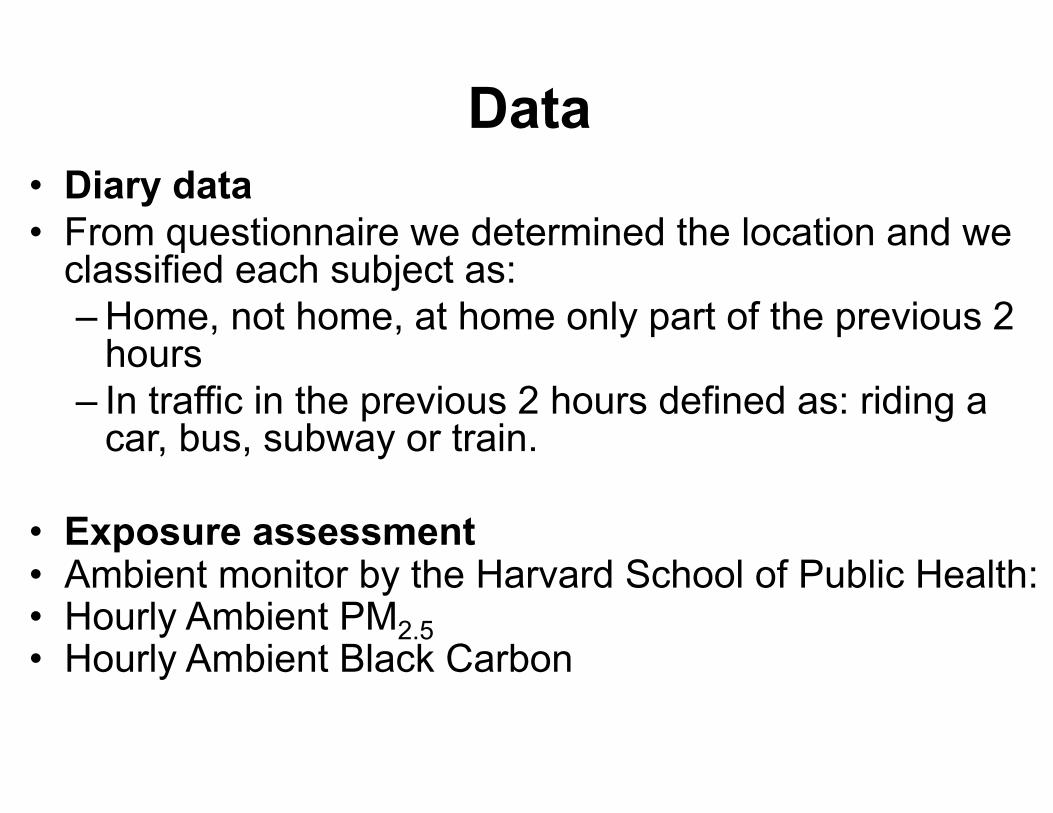
Data• Diary data• From questionnaire we determined the location and we
classified each subject as: – Home, not home, at home only part of the previous 2
hours – In traffic in the previous 2 hours defined as: riding a
car, bus, subway or train.
• Exposure assessment • Ambient monitor by the Harvard School of Public Health:• Hourly Ambient PM2.5• Hourly Ambient Black Carbon
Ambient pollution and blood pressure in cardiac rehabilitation patients
-6-5-4-3-2-101234567
48h 72h 96h 120h 48h 72h 96h 120h 48h 72h 96h 120h
Perc
ent c
hang
e in
DBP
, SB
P an
d M
AP
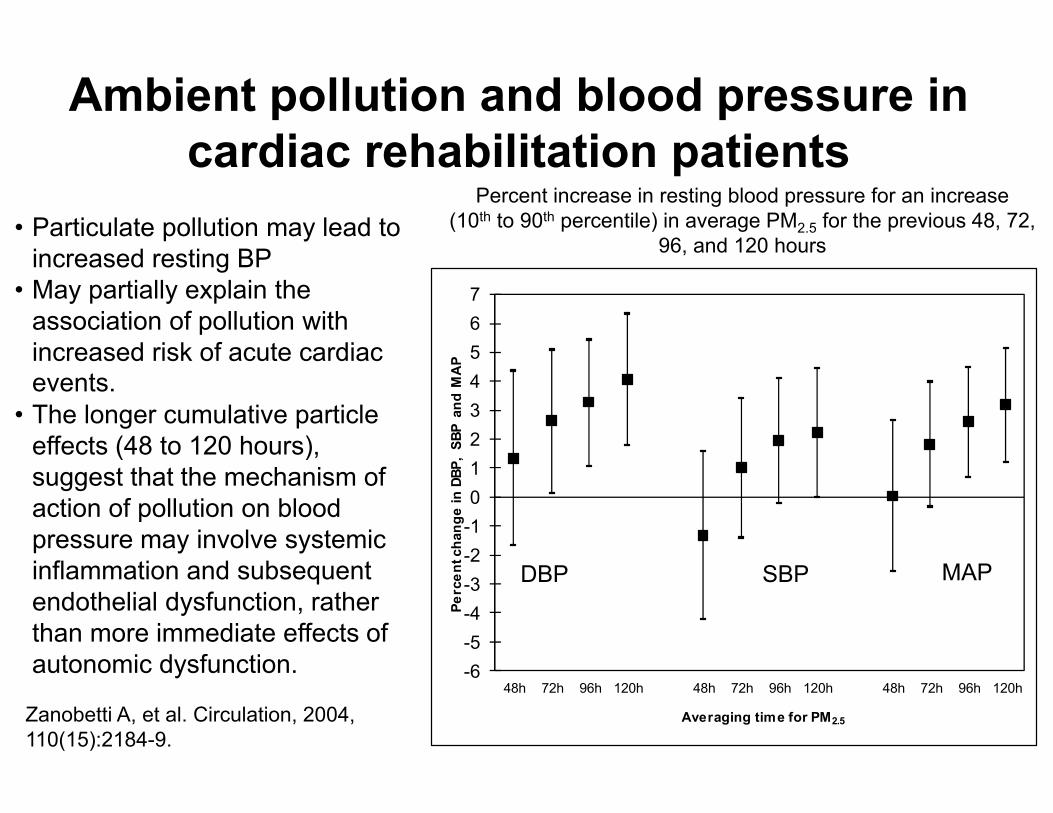
Averaging time for PM2.5Zanobetti A, et al. Circulation, 2004, 110(15):2184-9.
Percent increase in resting blood pressure for an increase (10th to 90th percentile) in average PM2.5 for the previous 48, 72,
96, and 120 hours
DBP MAPSBP
• Particulate pollution may lead to increased resting BP
• May partially explain the association of pollution with increased risk of acute cardiac events.
• The longer cumulative particle effects (48 to 120 hours), suggest that the mechanism of action of pollution on blood pressure may involve systemic inflammation and subsequent endothelial dysfunction, rather than more immediate effects of autonomic dysfunction.
Reduction in Heart Rate Variability with traffic and air pollution in coronary artery disease patients
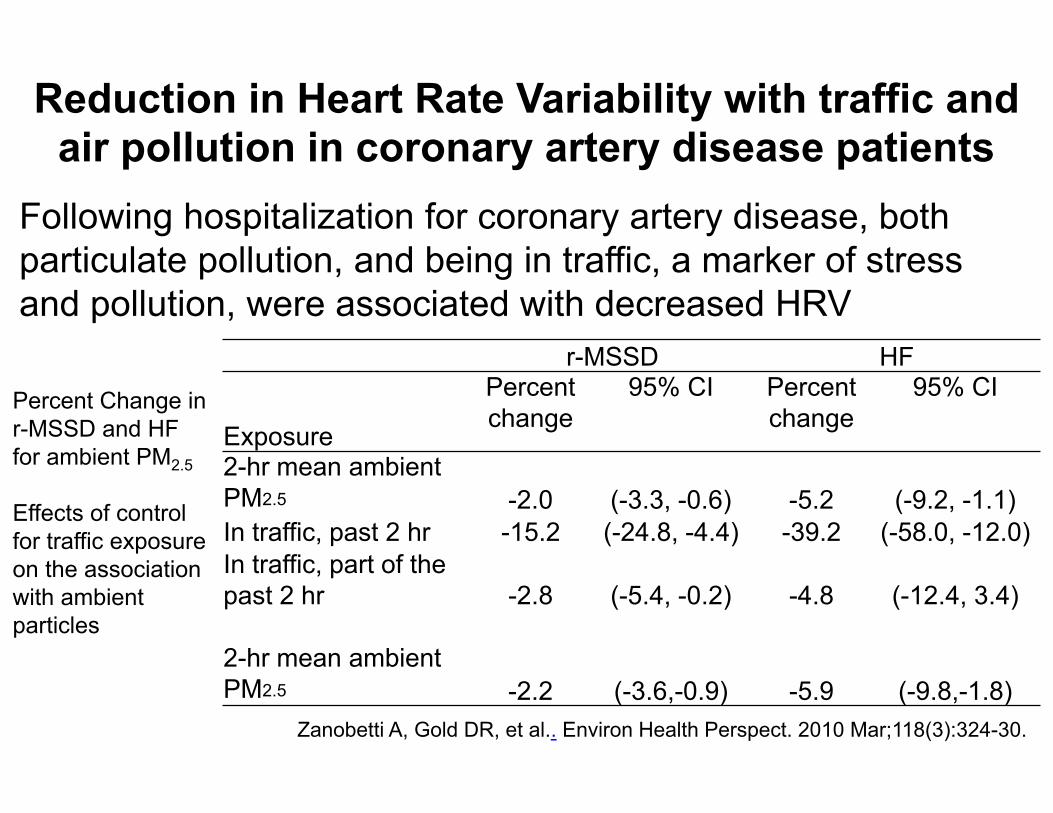
Zanobetti A, Gold DR, et al.. Environ Health Perspect. 2010 Mar;118(3):324-30.
Following hospitalization for coronary artery disease, both particulate pollution, and being in traffic, a marker of stress and pollution, were associated with decreased HRV
r-MSSD HF
Exposure
Percent change
95% CI Percent change
95% CI
2-hr mean ambient PM2.5 -2.0 (-3.3, -0.6) -5.2 (-9.2, -1.1)In traffic, past 2 hr -15.2 (-24.8, -4.4) -39.2 (-58.0, -12.0)In traffic, part of the past 2 hr -2.8 (-5.4, -0.2) -4.8 (-12.4, 3.4)
2-hr mean ambient PM2.5 -2.2 (-3.6,-0.9) -5.9 (-9.8,-1.8)
Percent Change in r-MSSD and HF for ambient PM2.5
Effects of control for traffic exposure on the association with ambient particles
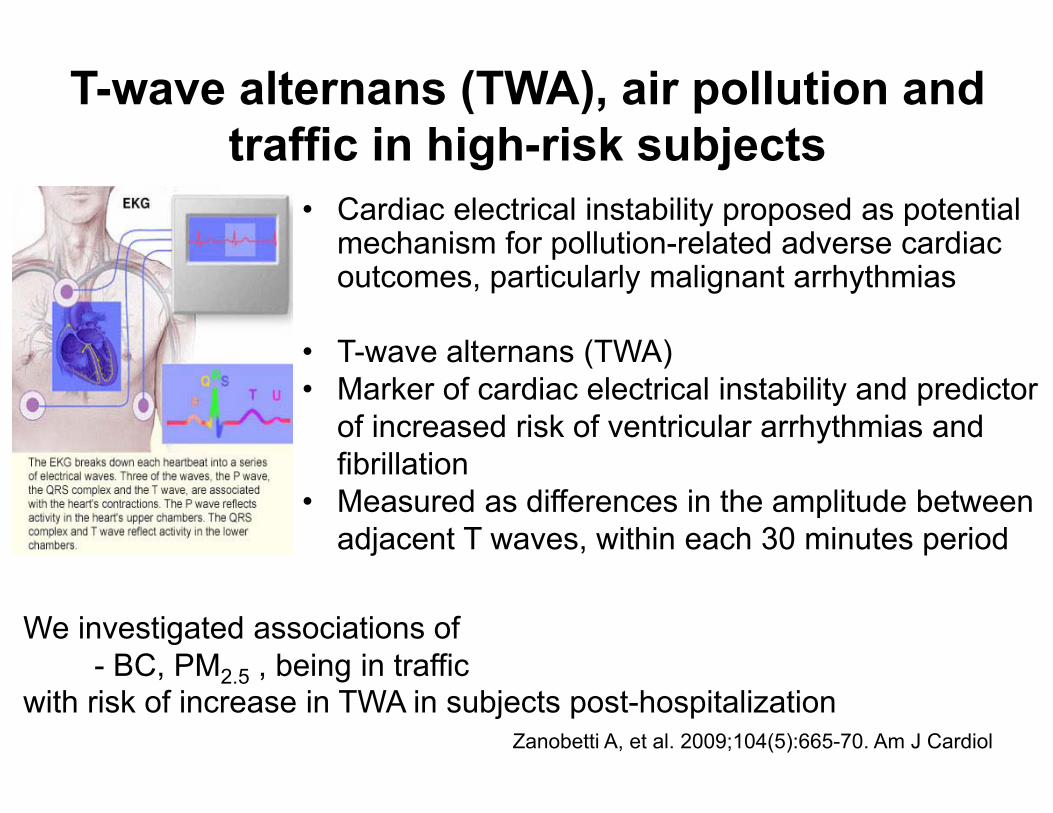
T-wave alternans (TWA), air pollution and traffic in high-risk subjects
• Cardiac electrical instability proposed as potential mechanism for pollution-related adverse cardiac outcomes, particularly malignant arrhythmias
• T-wave alternans (TWA)• Marker of cardiac electrical instability and predictor
of increased risk of ventricular arrhythmias and fibrillation
• Measured as differences in the amplitude between adjacent T waves, within each 30 minutes period
Zanobetti A, et al. 2009;104(5):665-70. Am J Cardiol
We investigated associations of - BC, PM2.5 , being in traffic
with risk of increase in TWA in subjects post-hospitalization
% 95% C.I. % 95% C.I.
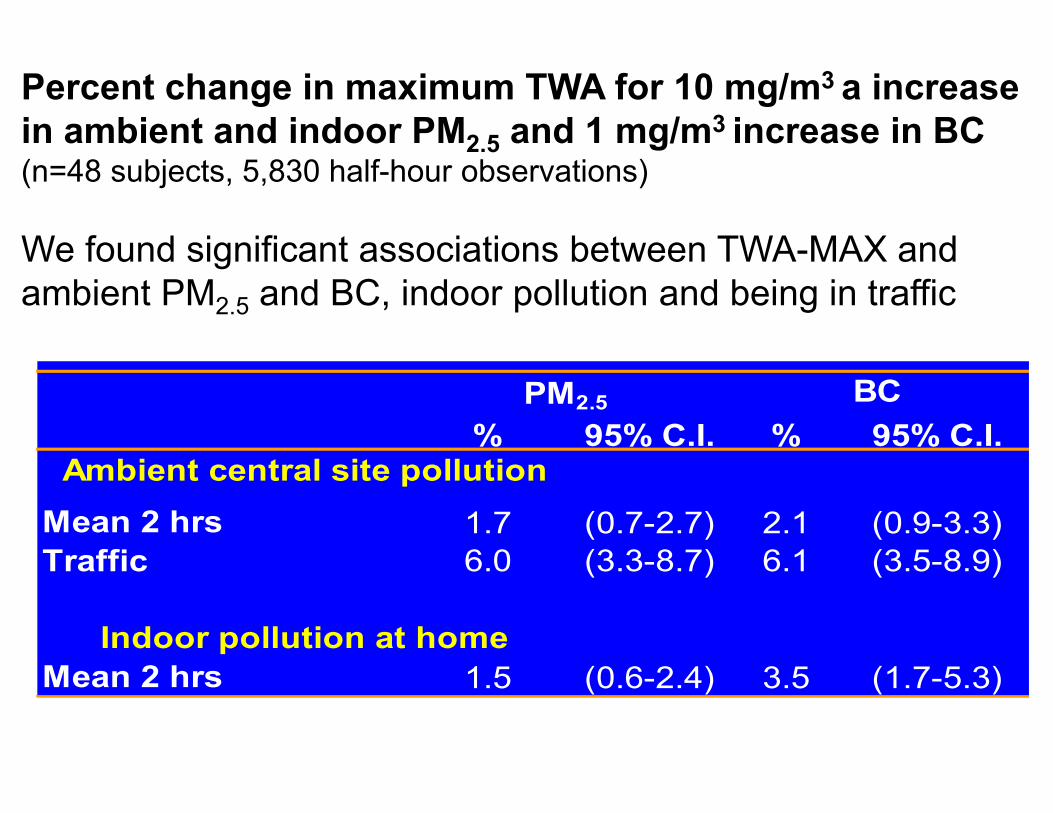
Mean 2 hrs 1.7 (0.7-2.7) 2.1 (0.9-3.3)Traffic 6.0 (3.3-8.7) 6.1 (3.5-8.9)
Mean 2 hrs 1.5 (0.6-2.4) 3.5 (1.7-5.3)Indoor pollution at home
PM2.5 BC
Ambient central site pollution
Percent change in maximum TWA for 10 mg/m3 a increase in ambient and indoor PM2.5 and 1 mg/m3 increase in BC (n=48 subjects, 5,830 half-hour observations)
We found significant associations between TWA-MAX and ambient PM2.5 and BC, indoor pollution and being in traffic

Estimated changes (95% CI) in brachial artery diameter (BAD, in mm) after brachial artery occlusion and nitroglycerin-mediated dilation associated with
IQR increases in mean 5-day pollution
-0.10-0.08-0.06-0.04-0.020.000.020.040.060.08
Ambi
ent B
C
Hom
e/tri
p in
tegr
ated
BC
Ambi
ent P
M2.
5
Hom
e/tri
p co
ntin
uous
PM
2.5
Hom
e/tri
p in
tegr
ated
PM
2.5
Ambi
ent O
C
Ambi
ent B
C
Hom
e/tri
p in
tegr
ated
BC
Ambi
ent P
M2.
5
Hom
e/tri
p co
ntin
uous
PM
2.5
Hom
e/tri
p in
tegr
ated
PM
2.5
Ambi
ent O
C
BAD after occlusion BAD after nitroglycerin
Cha
nges
in B
AD (m
m)
Increases in air pollution narrow brachial artery diameter
Brachial Artery Responses to Ambient Pollution, Temperature, and Humidity in People with Type 2 Diabetes:
A Repeated-Measures Study64 Diabetic subjects from Joslin diabetes Center, Boston49- to 85-year-old
Up to 5 Visits every 2 weeksTotal 280 repeated measures
Zanobetti A, et al. EHP; 2014;122(3):242-8
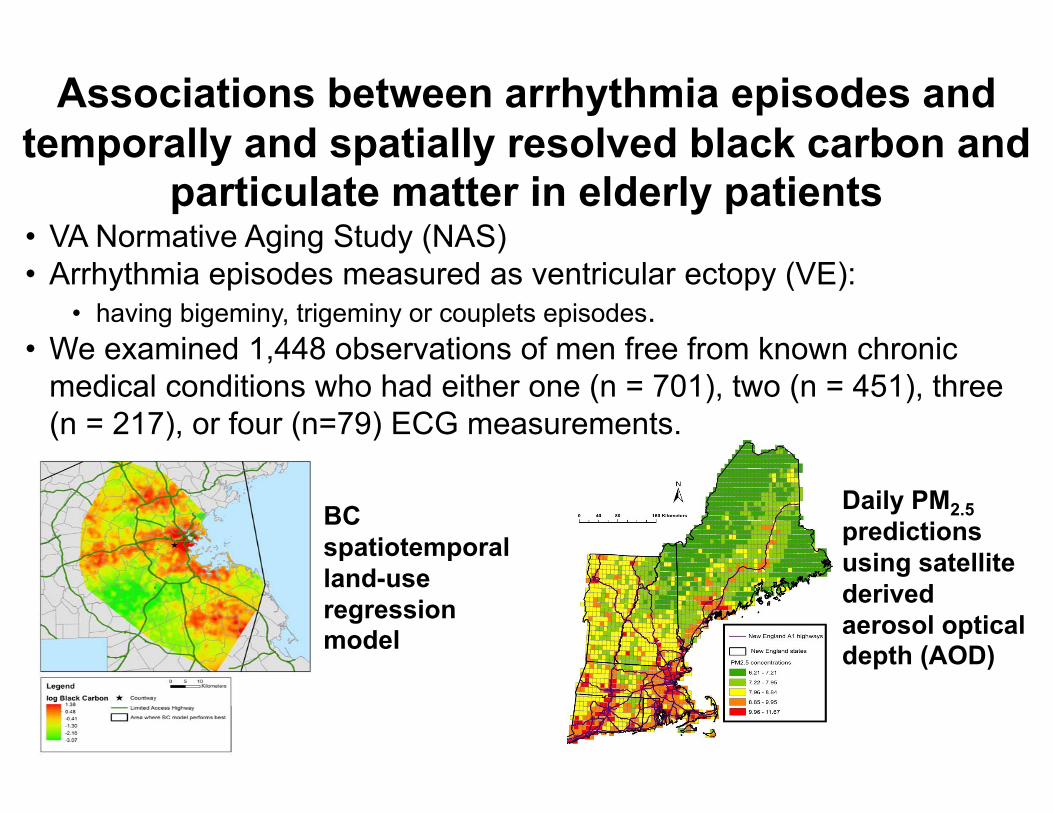
Associations between arrhythmia episodes and temporally and spatially resolved black carbon and
particulate matter in elderly patients• VA Normative Aging Study (NAS) • Arrhythmia episodes measured as ventricular ectopy (VE):
• having bigeminy, trigeminy or couplets episodes. • We examined 1,448 observations of men free from known chronic
medical conditions who had either one (n = 701), two (n = 451), three (n = 217), or four (n=79) ECG measurements.
BC spatiotemporal land-use regression model
Daily PM2.5predictions using satellite derived aerosol optical depth (AOD)
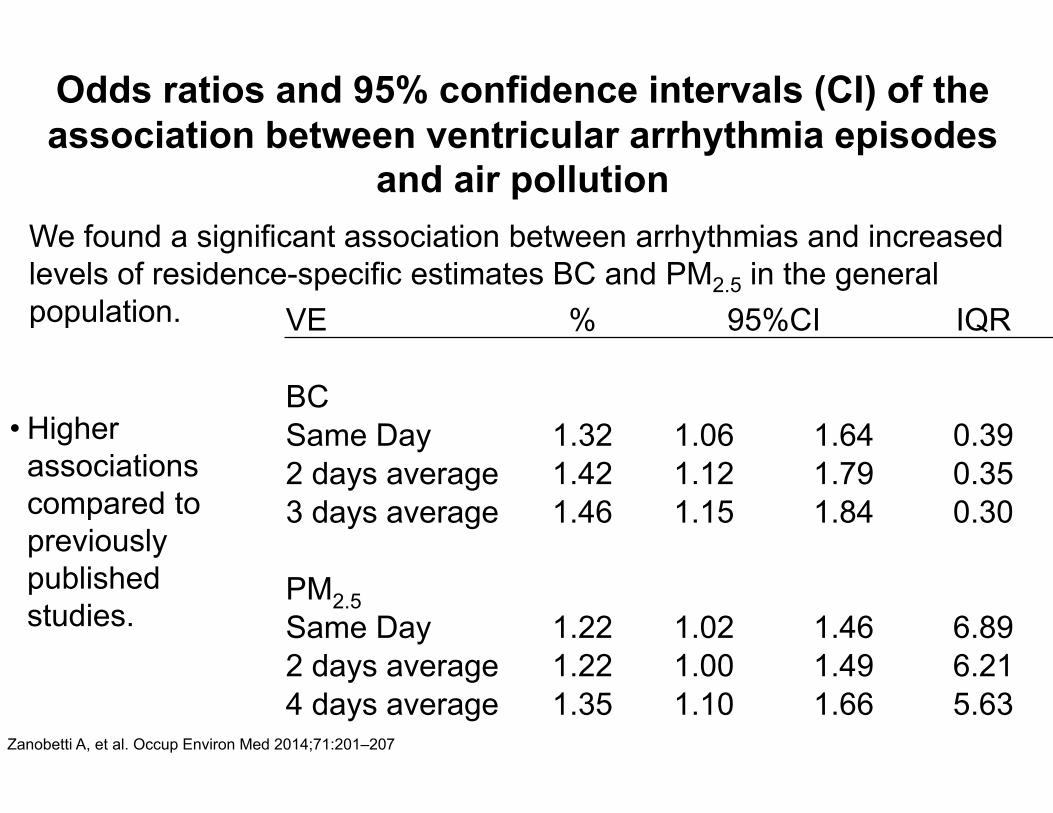
Odds ratios and 95% confidence intervals (CI) of the association between ventricular arrhythmia episodes
and air pollution
VE % 95%CI IQR
BCSame Day 1.32 1.06 1.64 0.392 days average 1.42 1.12 1.79 0.353 days average 1.46 1.15 1.84 0.30
PM2.5Same Day 1.22 1.02 1.46 6.892 days average 1.22 1.00 1.49 6.214 days average 1.35 1.10 1.66 5.63
• Higher associations compared to previously published studies.
We found a significant association between arrhythmias and increased levels of residence-specific estimates BC and PM2.5 in the general population.
Zanobetti A, et al. Occup Environ Med 2014;71:201–207

Circulation. 2010;121:2331-2378
• “….The overall evidence is consistent with a causal relationship between PM2.5 exposure and cardiovascular morbidity and mortality.”
• “Finally, PM2.5 exposure is deemed a modifiable factor that contributes to cardiovascular morbidity and mortality.”

THANK YOU!