air force working capital fund - globalsecurity.org · air force working capital fund fiscal year...
TRANSCRIPT

AIR FORCE WORKING CAPITAL FUND FISCAL YEAR (FY) 2011
BUDGET ESTIMATES TABLE OF CONTENTS
AFWCF SUMMARY ……………………………………………..…………..…….……........ 1 OPERATING BUDGET ………………………..…………………………..………………… 11 CONSOLIDATED SUSTAINMENT ACTIVITY GROUP …………………............13 SUPPLY MANAGEMENT ACTIVITY GROUP - RETAIL …………………......... 41 TRANSPORTATION WORKING CAPITAL FUND …………….…………....... 63 CAPITAL BUDGET ..…………………………………………………….…………….......... 87

THIS PAGE INTENTIONALLY LEFT BLANK

AIR FORCE WORKING CAPITAL FUND
SUMMARY
1

Air Force Working Capital Fund Fiscal Year (FY) 2011 Budget Estimates
The FY 2011 Air Force Working Capital Funds (AFWCF) Budget Estimates reflect current execution plans and a number of Air Force initiatives to improve the efficiency and effectiveness of our activities while continuing to meet the needs of the warfighting forces. Successful WCF operations are essential to the Air Force’s mission. In order to continue as a world class operation, logistics and business processes are continuously improved to ensure war fighters receive the right item at the right place, right time and lowest cost. Activity Group Overview The AFWCF conducts business in two primary areas: the Consolidated Sustainment Activity Group (CSAG) and the Supply Management Activity Group-Retail (SMAG-R). The Transportation Working Capital Fund (TWCF), for which the Air Force assumed responsibility of cash oversight in FY 1998, is part of this submission, although the Air Force does not have day-to-day management responsibility for TWCF operations. Air Force Core Strategic Capabilities The AFWCF activities support the following Air Force core functions: Nuclear Deterrence Operations, Rapid Global Mobility, Global Precision Attack, Special Operations, Agile Combat Support, and Global Integrated Intelligence, Surveillance, and Reconnaissance. These core functions are fundamental to the Air Force mission. In support of core functions, the AFWCF activities provide maintenance services, weapon system spare parts, base supplies, and transportation services. The working capital funds are integral to readiness and sustainability of our air and space assets and our ability to deploy forces around the globe and across any theater in support of Overseas Contingency Operations and National Military Strategy requirements. Maintenance depots provide the equipment, skills and repair services necessary to keep forces operating worldwide. Supply management activities procure and manage inventories of consumable and reparable spare parts required to keep all elements of the force structure mission ready. Transportation provides the worldwide mobility element of the global engagement vision. Directly or indirectly, working capital fund activities provide warfighters the key services needed to meet mission capability requirements.
2

Air Force Initiatives The Air Force has launched a campaign called eLog21 or Expeditionary Logistics for the 21st Century. eLog21 is designed to bring logistics operations into the 21st Century by modernizing processes and systems with new expeditionary, network-centric, enterprise wide processes and systems. As processes continue to be improved, the warfighter will receive the right support at the right place and the right time. We are benchmarking against industry to capitalize on best practices used in the areas of repair processes, inventory management and cost control. Other acquisition reform efforts are underway to streamline contracting, strengthen vendor relationships and expand the use of electronic interchanges for material management. Two major initiatives included under the umbrella of e-Log21 are the Repair Network Integration (RNI), formerly Repair Enterprise 21 (RE21), and Air Force Global Logistics Support Center (AFGLSC) initiatives. RNI is a process-focused initiative to standardize work and reduce waste through comprehensive management at an enterprise level. RNI examines processes that impact weapon system availability across the enterprise, including product flow, funding, requirements, capability, capacity, supply chain replenishment and information technology. The RNI initiative creates two networks. The first is a mission generation network focused on the day-to-day mission, such as servicing, launching and recovering aircraft. The second is a repair network using an integrated approach that manages repairs across the enterprise to maximize effectiveness and efficiency. The AFGLSC provides global logistics support to the Air Force, operating as the hub for Supply Chain Management, and networking logistics experts from around the Air Force together to link wholesale and retail logistics. It now administers the majority of AFWCF supply chain processes, new technologies, and resources to deliver end-to-end warfighter support. In addition, the AFGLSC is transforming supply chain processes to improve weapon system and equipment availability, and to deliver support with increased velocity and at reduced cost. The AFGLSC is expected to achieve full operational capability by FY 2011. The transition of contract depot maintenance out of the working capital fund was completed in FY 2008. The activity ceased accepting new orders at the end of FY 2008 and is expected to close out all accounting records by the end of FY 2010. This change brings the user and provider of contract depot maintenance services closer together and removes the WCF from its current role as the “middleman.” This action allows depot managers to dedicate time and efforts to organic production.
3

The Air Force has formalized the use of functional and financial performance plans to assess business operations at both Air Force Materiel Command and Air Logistics Center levels since FY 1997. Quarterly reviews with the Deputy Chief of Staff for Logistics, Installations and Mission Support continue to focus management attention on cost performance as well as the ability to deliver quality parts and maintenance on time. The Air Force continues to make improvements in our financial and reporting structures through close cooperation with the Office of the Secretary of Defense and the Defense Finance and Accounting Service. Financial reporting improvements allow us to work closely with customers by having consistent and timely data, resulting in the ability to identify discrepancies between the accounting system and the logistics feeder systems from which data is supplied. Consolidated Sustainment Activity Group The Consolidated Sustainment Activity Group (CSAG) was launched as a new AFWCF business activity in FY 2009. The CSAG consolidated the Depot Maintenance Activity Group (DMAG) and the Material Support Division (MSD) from the Supply Management Activity Group into a single business enterprise. This consolidation eliminated internal financial transactions between MSD and DMAG, resulting in a more efficient business enterprise and customer support improvements. The mission of CSAG is supply management of reparable and consumable items as well as maintenance services. Under CSAG, business operations formerly known as DMAG are now characterized as the Maintenance Division and business operations formerly known as MSD are now designated the Supply Division. The CSAG Supply Division is primarily responsible for Air Force-managed, depot-level reparable spares and consumable spares unique to the Air Force. In addition to management of these inventories, the Supply Division provides a wide range of logistics support services including requirements forecasting, item introduction, cataloging, provisioning, procurement, repair, technical support, data management, item disposal, distribution management and transportation. The CSAG Supply Division is committed to implementing improvements that meet customer demands and lower cost. The Air Force is examining new ways of doing business and leveraging new technologies to support war fighter needs. We are committed to reducing the impact of parts obsolescence and material shortage problems associated with supporting aircraft fleets with an average age of 24 years. The number of parts that have no qualified manufacturing or repair source is
4

expected to increase over the next ten years. In addition there are increasing numbers of manufacturers not willing to produce and/or repair aging spare parts. The CSAG Supply Division remains committed to re-engineer these parts for which no supplier exists and take proactive action to identify future obsolescence issues lead time away. Supporting aging weapon systems requires proactive management as well as increased inventory levels. As weapon systems exceed their life expectancy, additional maintenance drives increased demands on spare parts inventory. At the same time, an initiative is underway to reduce excess on-order and on-hand inventory. Inventory levels have been reduced by 5.8 million cubic feet since the beginning of FY 2003. Quarterly reviews have been established and metrics are reported to the Air Force Deputy Chief of Staff for Logistics, Installations and Mission Support. The CSAG Maintenance Division repairs systems and spare parts to ensure readiness in peacetime and to provide sustainment for combat forces in wartime. This division operates on the funds received from its customers through sales of its services. In peacetime, the Air Force enhances readiness by efficiently and economically repairing, overhauling and modifying aircraft, engines, missiles, components and software to meet customer demands. The CSAG Maintenance Division’s depots have unique skills and equipment required to support and overhaul both new, complex components as well as aging weapon systems. During wartime or contingencies, the depots can surge repair operations and realign capacity to support the war fighter’s immediate needs. A number of initiatives have begun to ensure the depots are poised to fulfill war fighter mission needs with the best product at the best price. These initiatives include formal training programs to develop multi-skilled “maintenance-ready” technicians and managers, benchmarking programs to identify industry leaders in various production processes, and the institutionalizing of lean principles within the workforce. By embedding these initiatives into the maintenance culture, reductions are being made in shop flow days and cost. Supply Management Activity Group–Retail The Supply Management Activity Group-Retail (SMAG-R) manages over 1.4 million inventory items including weapon system spare parts, medical-dental supplies and equipment, and other supply items used in non-weapon system
5

applications. The Air Force SMAG-R is a critical component in the support of combat readiness by procuring materiel and selling spares to authorized retail customers. Within SMAG-R, the Medical Dental Division inventory includes a War Reserve Materiel (WRM) Stockpile. WRM provides initial war fighting capability until re-supply lines can sustain wartime demands for medical and dental supplies and equipment. Transportation Working Capital Funds (TWCF) USTRANSCOM, as the single Department of Defense (DOD) manager for the Defense Transportation System (DTS), exercises combatant command and peacetime management over all common user aspects of the global mobility system. One of DoD’s highest priority goals is to maintain a robust and responsive defense transportation and distribution system as a critical element of America's national security strategy for rapid power projection and sustainment. USTRANSCOM's ability to move and sustain sufficient numbers of U.S. forces, equipment and supplies, enables us to defend vital national interests anywhere in the world at a moment’s notice. Additionally, USTRANSCOM’s efforts as the DOD Distribution Process Owner to improve joint logistics support continue to expand and produce results. Working with the DOD, regional Combatant Commands, joint agencies, and the Services, USTRANSCOM is leading the collaborative effort to make joint logistics a reality – leveraging experience and using information technology to consolidate logistics requirements in real time, compress the decision cycle, and empower smarter decisions. USTRANSCOM is synchronizing the deployment, distribution, and sustainment of forces to achieve maximum efficiency and interoperability by eliminating duplication and nonstandard practices. Together with its components and national partners, USTRANSCOM is building a truly seamless, end-to-end defense logistics enterprise. FY 2009 data are actuals while FY 2010 and FY 2011 contain Overseas Contingency Operations assumptions. Since 1994, USTRANSCOM productivity and cost avoidance initiatives and organizational streamlining efforts have resulted in savings of over $2.0 billion. In addition, since USTRANSCOM’s designation as DPO in 2004, the DPO has validated $3.2 billion in cost avoidance initiatives. The savings accrue to the DOD budget (primarily contingency supplementals).
6

Direct Appropriations In FY 2009, AFWCF received a total of $76.5 million in direct appropriations. Air Force received $61.5 million for Medical Dental War Reserve Material requirements; and TWCF received an Overseas Contingency Operations (OCO) appropriation of $15.0 million for transportation of our Fallen Heroes. For FY 2010, AFWCF requests a total of $817.8 million in direct appropriations. Air Force has received $64.0 million for Medical Dental War Reserve Material requirements and TWCF has received $15.3 million in OCO funding for transportation of our Fallen Heroes. Additionally, the AFWCF is requesting OCO funding to off-set most of the estimated FY 2010 increase in the price of fuel (Air Force $4.0 million and TWCF $734.5 million). For FY 2011, AFWCF requests a total of $83.9 million in direct appropriations. Air Force requests $66.9 million for Medical Dental War Reserve Material requirements; and TWCF requests OCO funding for transportation of our Fallen Heroes ($15.0 million) and for container consolidation ($2.0 million). Cash Management In FY 2009, AFWCF cash balance remained relatively stable. Cash increases $25.1 million primarily due to the TWCF operational tempo associated with Overseas Contingency Operations. The FY 2009 cash balance includes a $61.5 million direct appropriation requested for Medical Dental WRM requirements. In FY 2010, AFWCF cash decreases by $915.6 million primarily due to $250.0 million transferring to Air Force Operations and Maintenance appropriation as congressionally directed, fuel price increase, and increased costs for manpower and material. The FY 2010 cash balance includes a $64.0 million direct appropriation requested for Medical Dental WRM requirements. In FY 2011, AFWCF cash increases by $130.0 million primarily due to recoupment of prior year losses. The FY 2011 cash balance includes a $66.9 million direct appropriation requested for Medical Dental WRM requirements.
7

AFWCF Budget Estimates Overview
Air Force Working Capital Fund Cash Including TWCF
(Dollars in Millions) FY 2009 FY 2010 FY 2011BOP Cash Balance 1,384.1 1,409.1 493.5Disbursements 23,212.7 25,382.4 24,918.4Collections 23,412.5 23,899.0 24,964.5Transfers (251.3) (250.0) 0.0Direct Appropriations Fallen Heroes 15.0 15.3 15.0 Fuel 0.0 738.5 0.0 WRM 61.5 64.0 66.9 Container Consolidation 0.0 0.0 2.0EOP Cash Balance 1,409.1 493.5 623.5 7-Days of Cash 885.3 903.5 854.510-Days of Cash 1,159.8 1,195.6 1,126.8
8

AFWCF Total Summary(Dollars in Millions)
Total Fund SummaryAir Force Working Capital Fund
Fiscal Year (FY) 2011Budget Estimate
February 2010
FY 2009 FY 2010 FY 2011Total Revenue 23,730.5 24,596.8 25,031.4
Cost of Goods Sold 23,394.0 25,266.5 24,877.3
WRM -61.5 -64.1 -66.9
Net Operating Result (NOR) 275.0 -733.8 87.2
Accumulated Operating Result (AOR)1 358.1 -383.0 0.0
Civilian End Strength 26,717 27,726 25,725
Military End Strength 12,351 13,720 13,712
Civilian Workyears 26,376 27,206 26,793
Military Workyears 12,168 12,273 12,254
Capital Budget 389.0 338.4 308.8 Direct Appropriation 76 5 818 3 83 9
FOR OFFICIAL USE ONLYAFWCF Summary
Direct Appropriation 76.5 818.3 83.9
Fallen Heroes 15.0 15.3 15.0
Fuel 0.0 739.0 0.0
WRM 61.5 64.0 66.9
Container Consolidation 0.0 0.0 2.0
1 Includes Non-Recoverable AOR Adjustments
FOR OFFICIAL USE ONLYAFWCF Summary
9

THIS PAGE INTENTIONALLY LEFT BLANK
10

AIR FORCE WORKING CAPITAL FUND
OPERATING BUDGET
11

THIS PAGE INTENTIONALLY LEFT BLANK
12

AIR FORCE WORKING CAPITAL FUND
CONSOLIDATED SUSTAINMENT ACTIVITY GROUP
13

Consolidated Sustainment Activity Group Fiscal Year (FY) 2011 Budget Estimates
The Consolidated Sustainment Activity Group (CSAG) is an, innovative approach to business in the U.S. Air Force Working Capital Fund (AFWCF). The CSAG reflects the combination of the Depot Maintenance Activity Group (DMAG) and the Material Support Division (MSD) from the Supply Management Activity Group into a single enterprise. This consolidation eliminated internal financial transactions between MSD and DMAG, to include improving customer support by efficiently working as one entity. The mission of CSAG is supply management of reparable and consumable items as well as maintenance services. Reparable supply items are economically maintained through overhaul or repair. Consumable supply items are consumed in use or discarded when worn out or broken because they cannot be repaired economically. Under CSAG, business operations formerly known as DMAG are characterized as the Maintenance Division. Likewise, business operations formerly known as MSD are designated the Supply Division. Maintenance Division Description:
The Maintenance Division repairs systems and spare parts to ensure readiness in peacetime and to provide sustainment for combat forces in wartime. This division operates on funds received from its customers through sales of its services. In peacetime, the Air Force enhances readiness by efficiently and economically repairing, overhauling and modifying aircraft, engines, missiles, components and software to meet customer demands. The depots have unique skills and equipment required to support and overhaul both new, complex components as well as aging weapon systems. An extremely important facet of the depots is that during wartime or contingencies, the Air Force can surge repair operations and realign capacity to support the war fighter’s immediate needs. Business initiatives are underway to reduce cost, improve performance and increase availability of aircraft through an enterprise-wide repair capability, managed within a centralized repair network. These improvements are critical to the Maintenance Division remaining a fundamental element of both readiness and sustainability by providing a cost effective, rapid repair capability.
Historically, repair and overhaul are accomplished by both organic depots, that Air Force Materiel Command (AFMC) manages, and contractor facilities. Beginning in FY 2009 the Maintenance Division no longer accepts new orders for contract depot maintenance. The transition of contract depot maintenance from the Working Capital Fund (WCF) began FY 2003 and completed FY 2008. The AFWCF is expected to close out all accounting records for contract depot maintenance by the end of FY 2010. This change brings the user and provider of contract depot maintenance services closer together and removes the
14

WCF from its current role as the “middleman.” This action allows depot managers to dedicate their time and efforts to organic production.
Organic maintenance ensures support of mission essential workloads and support of workloads that commercial sources cannot or will not perform. Organic services include repair, overhaul and modification of aircraft, missiles, engines, engine modules and associated component items, exchangeable spare parts and other major end items. Other services include local manufacture, software maintenance, aircraft storage and reclamation, and support to base tenants. Organic maintenance sites include:
Ogden Air Logistics Center (OO-ALC), Ogden, UT Oklahoma City Air Logistics Center (OC-ALC), Oklahoma City, OK Warner Robins Air Logistics Center (WR-ALC), Warner Robins, GA Aerospace Maintenance and Regeneration Group (AMARG), Tucson, AZ
Supply Division Description:
The Supply Division is primarily responsible for Air Force-managed, depot-level reparable spares and consumable spares unique to the Air Force. In addition to management of these inventories, the Supply Division provides a wide range of logistics support services including requirements forecasting, item introduction, cataloging, provisioning, procurement, repair, technical support, data management, item disposal, distribution management and transportation.
CSAG Customer Base:
Maintenance and Supply customers include Air Force Major Commands (including Air National Guard & Air Force Reserves), the Army, the Navy, other WCF activities such as the Transportation Working Capital Fund, other government agencies and foreign countries.
CSAG Initiatives:
Operating under the auspices of the Air Force campaign Expeditionary Logistics for the 21st Century (eLog21), initiatives are underway within the Supply Division to modernize processes and integrate supply management into a corporate network focused on customer support. The Air Force Global Logistics Support Center (AFGLSC) integrated two Logistics Support Centers into a single enterprise network of supply chain experts. The AFGLSC merged wholesale (i.e. depot) and retail (i.e. base level) supply chain entities. It also integrates and oversees wholesale and retail supply chain processes, technology, and
15

resources to deliver end-to-end war fighter support. In addition, the AFGLSC manages materiel and its distribution, and oversees execution of the supply plan to improve the delivery of serviceable spare parts to the war fighter. AFGLSC is designed to establish an Air Force supply chain management capability that provides enterprise planning, global command and control and a single focal point in support of logistics requirements. At the same time, an initiative is underway to reduce excess on-order and on-hand inventory. Inventory levels have been reduced by 5.8 million cubic feet since the beginning of FY 2003. Maintenance Division initiatives are underway with the intent of reducing cost, improving performance and war fighter aircraft availability. Specifically, the Repair Network Integration (RNI) initiative aims to establish an enterprise-wide repair capability that gains efficiencies through standardized repair processes; dynamically adjusts to changing demand; and effectively utilizes existing depots and establishing Centralized Repair Facilities.
These improvements are critical to the Maintenance Division remaining a fundamental element of both readiness and sustainability by providing a cost effective, rapid repair capability. The Maintenance Division will: a) continue to provide a core Air Force depot capability to retain an in-house source of technical competence; b) continually seek new methods for efficient use of our resources such as partnering, government owned/contractor operated facilities, and contract field teams augmenting in-house operations; and c) continue to find innovative ways to decrease flow days for systems and components, increase parts availability to the repair line and control material costs through process reviews, adoption of commercial practices and engineered standards.
The Expeditionary Combat Support System (ECSS) is an Enterprise Resource Program being developed to integrate logistics and AFWCF financial systems. ECSS consists of modules that will integrate financial, order management, purchasing, inventory management, distribution, and other Air Force business functions onto one platform. ECSS will enable coordination of systems and process changes necessary to streamline and improve the Air Force logistics supply chain. ECSS will replace over 240 legacy Air Force information technology systems with a commercial off the shelf information technology suite that provides capabilities in product support and engineering, supply chain management, expeditionary logistics command and control, and maintenance, repair, and overhaul. Automatic Identification Technology (AIT) client devices will support inventory in-transit visibility across the entire logistics supply chain through technology like ruggedized laptops and hand-held scanning devices. This hardware will interface with the ECSS system footprint by capturing transactions for maintenance, inventory, purchasing, shipping, and material activities, among other functions. ECSS is scheduled to achieve full operating capability in FY 2015.
16

CSAG Financial and Performance Summary:
Financial Performance ($ Millions) FY 2009 FY 2010 FY 2011Total Revenue 7,974.3* 8,047.9* 8,766.9*Total Expenses 8,025.2 8,427.1 8,342.9Net Operating Results -50.9 -379.2 424.0Accumulated Operating Results -44.8 -424.0 0.0
*Includes revenue adjustment to account for depreciation recognized on buildings capitalized into the Maintenance Division.
The FY 2010 prices for fuel in this submission are calculated using the current fuel composite rate of $118.02 per barrel versus the FY 2010 President's Budget rate of $89.46. This will result in a projected revenue shortfall of $5.2 million of which $4.0 million is being requested as a direct Working Capital Fund (WCF) appropriation in the FY 2010 supplemental. The remainder will be handled from either WCF cash balances or through an additional customer surcharge.
Cash: ($ Millions) FY 2009 FY 2010 FY 2011BOP Cash Balance 925.0 569.1 -62.4Disbursements 8,023.5 8,417.5 8,323.5Collections 7,919.2 8,032.0 8,722.2Transfers (+/-) -251.6 -246.0 0.0Change in Cash -355.9 -631.5 398.7Cash Balance 569.1 -62.4 336.3
Stabilized Sales Rates and Prices FY 2009 FY 2010 FY 2011 Maintenance Composite Sales Rate per hour 263.32 271.80 278.18
Maintenance Rate Change 3.22% 2.35%Supply Customer Price Change 1.03% 0.92% 3.26%Supply Unit Cost 0.89 0.86 0.83
17

CSAG Manpower Resources: FY 2009 FY 2010 FY 2011Civilian End strengths 24,160 24,639 23,627Civilian Full Time Equivalents 23,829 24,395 24,137Military End strengths 234 258 258Military Workyears 159 267 253
Capital Budget Program Authority
($Millions):
FY 2009 FY 2010 FY 2011
Equipment – Weapon System Support/Test 79.3 126.5 132.1Depot Maintenance Transformation 77.6 0.0 0.0 ADPE & Telecom 2.4 6.6 8.9Software Development 7.8 10.5 8.6Minor Construction 6.6 6.9 6.9TOTAL 173.7 150.5 156.5
Maintenance Depot Six Percent Capital Investment Plan
($Millions):
FY 2009 FY 2010 FY 2011
Required Investment 305.7 283.6 265.8Total Investment Budgeted 401.4 417.9 388.0Percent Invested 7.9% 8.8% 8.8%
18

Supply Mission Capable (MICAP) Hours* FY 2009 FY 2010 FY 2011Actual Performance 565 Objective 560 560 541
*Hours in Thousands
Mission Incapable (MICAP) Hours are the sum of hours a customer waits for a part that grounds an aircraft, piece of equipment, or vehicle. For every day during the month the requisition is unfilled, 24 hours are assigned to the requisition.
Supply Customer Wait Time (CWT) FY 2009* FY 2010 FY 2011Actual Performance 5.8 Objective 5.1 5.1 5.1
Customer Wait Time (CWT) is the average number of days accrued from the time a customer orders a spare part until the part is received.
Supply Stockage Effectiveness FY 2009 FY 2010 FY 2011Actual Performance 80% Objective 80% 80% 81%
Stockage Effectiveness measures how often the supply system has available for immediate sale those items required to be maintained at base and depot level supply locations.
19

Supply Undelivered Orders
Undelivered Orders ($ Millions) FY 2009 FY 2010 FY 2011Supply Division 4,085.4 4044.6 4044.1
Decreases in undelivered orders are predominately due to adjustments in customer requirements and continuing transfers of consumable items from Supply Division to Defense Logistics Agency for management.
Supply Item Quantity Requirements
Item FY 2009 FY 2010 FY 2011Number of Issues 2,365,903 2,264,169 2,166,810
Number of Receipts 1,757,752 1,682,196 1,609,835
Number of Requisitions (1) 636,707 609,329 583,127
Contracts Executed (2) 3,163 3,163 3,163
Purchase Inflation 3.05% 4.05% 4.00%
Items Managed 102,788 99,788 99,788
(1) Requisitions are lower than issues due to Supply requisitions containing quantities greater than one, while issues are counted per unit. For example, one requisition for a National Stock Number (NSN) may order a quantity greater than one. When the requisitioned NSNs are issued, each unit is counted as an individual issue. (2) Contracts containing multiple fund citations have been omitted because the current contracting system cannot distinguish Supply funding under those conditions.
20
CSAG FY 2011 Budget Estimates
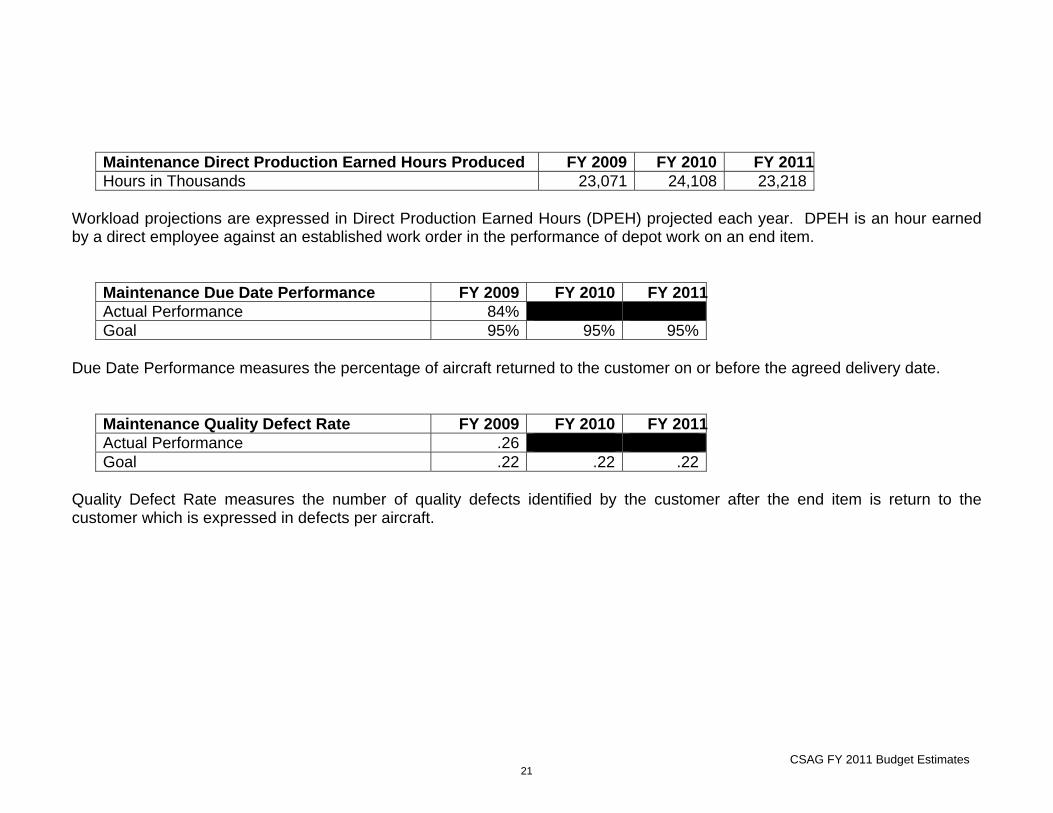
Maintenance Direct Production Earned Hours Produced FY 2009 FY 2010 FY 2011Hours in Thousands 23,071 24,108 23,218
Workload projections are expressed in Direct Production Earned Hours (DPEH) projected each year. DPEH is an hour earned by a direct employee against an established work order in the performance of depot work on an end item.
Maintenance Due Date Performance FY 2009 FY 2010 FY 2011Actual Performance 84% Goal 95% 95% 95%
Due Date Performance measures the percentage of aircraft returned to the customer on or before the agreed delivery date.
Maintenance Quality Defect Rate FY 2009 FY 2010 FY 2011Actual Performance .26 Goal .22 .22 .22
Quality Defect Rate measures the number of quality defects identified by the customer after the end item is return to the customer which is expressed in defects per aircraft.
21

Fund 11(Dollars in Millions)
Source of RevenueAir Force Working Capital Fund
Consolidated Sustainment Activity Group (CSAG)
Fiscal Year (FY) 2011Budget Estimates
February 2010
CSAG
FY 2009 FY 2010 FY 20111. New Orders a. Orders From DOD Components: (1) Air Force (a) Aircraft Procurement 300.122 175.838 187.986 (b) Missile Procurement 0.137 0.420 0.428 (c) Other Procurement 0.125 2.381 2.422 (d) Military Construction 0.000 0.000 0.000 (e) Operations & Maintenance - AF 4,504.420 3,998.552 4,381.469 (f) Operations & Maintenance - AFRC 452.179 603.033 618.798 (g) Operations & Maintenance - ANG 1,073.291 1,351.248 1,200.820 (h) Research & Development - AF 103.222 80.165 103.777 (i) Military Personnel - AF 0.000 0.000 0.000 (j) Reserve Personnel - AF 0.000 0.000 0.000 (k) Guard Personnel - ANG 0.000 0.000 0.000 (l) Family Housing 0.000 0.024 0.000 (m) Special Trust Funds 0.000 0.000 0.000 (n) Other Air Force 138.135 68.815 68.451 (o) Other 0.000 0.000 0.000Total Air Force 6,571.632 6,280.477 6,564.150
(2) Army 41.499 33.472 32.737 (3) Navy 206.038 204.864 202.860 (4) Marine Corps 13.930 11.203 11.377 (5) MAP/Grant Aid 0.000 0.000 0.000
(6) Other DOD 133.877 216.321 239.156 (6) Other DOD 133.877 216.321 239.156Total DOD excluding WCF 6,966.975 6,746.336 7,050.280
b. Orders From Other Fund Activity Groups (1) Oth AF Supply Management Activity Groups 83.606 20.984 21.319 (2) Transportation Activity Group - TRANSCOM 449.512 533.070 554.258 (3) Other WCF Activity Groups 144.290 0.000 0.000 (4) Commissary, Sur. Coll. 0.000 0.000 0.000Total Other Fund Activity Groups 677.408 554.054 575.577
c. Other Internal to AF Consolidated Sustainment Activity Group (1) Internal Material Transfer Orders (Maintenance Orders toSupply) 1,856.723 1,807.941 1,859.669 (2) Internal Material Repair Orders (Supply Orders to Maintenance) 2,672.516 2,629.140 2,624.603 Total Internal AF Consolidated Sustainment Activity Group 4,529.239 4,437.081 4,484.272
d. Grand Total DOD 12,173.622 11,737.471 12,110.129
FOR OFFICIAL USE ONLY Fund 11 CSAG

Fund 11(Dollars in Millions)
Source of RevenueAir Force Working Capital Fund
Consolidated Sustainment Activity Group (CSAG)
Fiscal Year (FY) 2011Budget Estimates
February 2010
CSAG
FY 2009 FY 2010 FY 2011
e. Other Orders: (1) Other Federal Agencies 10.757 11.962 7.908 (2) Non Federal Agencies 60.168 177.624 308.927 (3) FMS 226.292 243.304 274.691Total Other Orders 297.217 432.890 591.526
Total New Gross Orders 12,470.839 12,170.361 12,701.654
2. Carry-In Orders 2,206.630 2,009.414 1,714.908
3. Total Gross Orders 14,677.469 14,179.776 14,416.562 a. Less Internal Material Transfer Orders (Maintenance Orders to Supply) 1,856.723 1,807.941 1,859.669 b. Less Internal Material Repair Orders (Supply Orders to Maintenance) 2,672.516 2,629.140 2,624.603Total External Gross Orders 10,148.230 9,742.694 9,932.290
4. Revenue 8,058.332 8,027.786 8,719.124
5. End of Year W-I-P 45.096 30.938 31.099
6. Exclusion (Non-DoD, BRAC, FMS and Supply Internal Carry-In Orders) 185.022 220.196 356.017
7. Funded Carryover 1,859.781 1,463.775 826.051
FOR OFFICIAL USE ONLY Fund 11 CSAG

Fund 14(Dollars in Millions)
Revenue and ExpensesAir Force Working Capital Fund
Consolidated Sustainment Activity Group (CSAG)
Fiscal Year (FY) 2011Budget Estimates
February 2010
CSAG
FY 2009 FY 2010 FY 2011Revenue: Income: Maintenance Division 3,582.764 3,499.072 3,637.511 Supply Division (Material Gross Sales) 4,467.892 4,508.719 5,028.526 Less - Credit Returns 213.228 135.808 137.962 Total Income 7,837.428 7,871.984 8,528.076
Depreciation Offset (Major Construction) 7.676 19.995 53.086 Other Revenue 230.906 137.362 166.310 Total Other Revenue 238.582 157.357 219.396
Total Revenue 8,076.010 8,029.340 8,747.472
Expenses: Maintenance Division Cost of Repair (Direct and POH Costs) 3,747.759 3,832.923 3,671.408
Supply Division Cost of Material Sold 289.864 311.713 273.023 Cost of Material Repair 1,122.377 1,292.944 1,492.013 Condemnation Material Expense Recover (CMER) 1,049.322 1,050.140 1,030.234 Other Expenses 40.926 47.362 76.310Subtotal Material & Other Expenses 2,502.490 2,702.159 2,871.580 Operating Expenses Military Personnel 9.519 7.890 8.219y Civilian Personnel 341.738 367.148 363.310 Travel & Transportation of Personnel 6.868 7.426 7.378 Materials & Supplies 44.525 42.661 41.096 Equipment 12.460 28.041 28.026 Other Purchases from Revolving Funds 288.080 309.058 324.203 Transportation of Things 63.001 84.636 84.471 Depreciation - Capital 72.043 63.778 91.587 Printing and Reproduction 2.570 4.986 5.030 Advisory and Assistance Services 62.877 68.169 67.692 Rent, Communication, Utilities & Misc Charges 108.941 123.395 115.526 Other Purchases Services 670.468 770.662 663.510 Cost of Direct Reimbursable Material 0.000 0.000 0.000 Initial Spares 0.000 0.000 0.000 Other Direct Reimbursements 0.000 0.000 0.000Total Operating Expenses 1,683.090 1,877.851 1,800.047
FOR OFFICIAL USE ONLY Fund 14 CSAG
24

Fund 14(Dollars in Millions)
Revenue and ExpensesAir Force Working Capital Fund
Consolidated Sustainment Activity Group (CSAG)
Fiscal Year (FY) 2011Budget Estimates
February 2010
CSAG
FY 2009 FY 2010 FY 2011
Total Expenses 7,933.338 8,412.933 8,343.035
Work in Process, Beginning of Year 133.340 41.451 27.293Work in Process, End of Year 41.451 27.293 27.454Work in Process, Change (91.889) (14.158) 0.161
Total Expenses Adjusted for Work in Process 8,025.227 8,427.091 8,342.874
Operating Results (Net Operating Results on 1307 - Line 11) 50.783 (397.751) 404.597
Less Capital Surchg Reservation 0.000 0.000 0.000 Plus Pass through or Other Approps (NOR) 0.000 0.000 0.000 Other Adjustments Affecting NOR and Other Changes (101.708) 18.538 19.429
Net Operating Result (Recoverable NOR on 1307 - Line 13) (50.925) (379.213) 424.026
Prior Year Adjustments 0.000 0.000 0.000 Other Changes Affecting AOR 0.000 0.000 0.000 Prior Year AOR 257.748 (44.813) (424.026)
Accumulated Operating Result 206.822 (424.026) 0.000 Non-Recoverable Adjustment Impacting AOR (251.635) 0.000 0.000Accumulated Operating Result for Budget Purposes (44.813) (424.026) 0.000
FOR OFFICIAL USE ONLY Fund 14 CSAG
25

Fund 2(Dollars in Millions)
Changes in Cost of OperationsAir Force Working Capital Fund
Consolidated Sustainment Activity Group (CSAG)
Fiscal Year (FY) 2011Budget Estimates
February 2010
CSAG - Maintenance Division
FY2009 to FY2010 FY2010 to FY2011Cost of OperationsOrganic 3,966.697 4,420.112Contract 315.236 50.000Total 4,281.933 4,470.112
ANNUALIZATIONAnnualization of Civilian Pay 16.384 8.757Annualization of Military Pay 0.092 0.088TOTAL ANNUALIZATION 16.475 8.845
PRICE CHANGESCivilian Pay Raises 22.631 18.197Military Pay Raises 0.288 0.158Material Price Growth 23.980 27.831Fuel Price Growth 0.125 0.173Other Growth 7.749 11.641TOTAL PRICE CHANGES 54.773 57.999
PRODUCTIVITY SAVINGSCivilian Labor Savings 0.000 0.000Military Labor Savings 0.000 0.000Material/Supply Savings 0.000 0.000Travel & Transportation Savings 0.000 0.000Communication Savings 0.000 0.000Utility Savings 0.000 0.000Utility Savings 0.000 0.000Equipment Rental Savings 0.000 0.000Printing & Reproduction Savings 0.000 0.000Equip/Vehicle Rep & Maint Savings 0.000 0.000Custodial Savings 0.000 0.000Facility Maintenance Savings 0.000 0.000Training Savings 0.000 0.000ADP Savings 0.000 0.000Base Operating Support 0.000 0.000Environment Savings 0.000 0.000Miscellaneous Savings 0.000 0.000TOTAL PRODUCTIVITY SAVINGS 0.000 0.000
FOR OFFICIAL USE ONLY Fund 2 CSAG Maintenance
26

Fund 2(Dollars in Millions)
Changes in Cost of OperationsAir Force Working Capital Fund
Consolidated Sustainment Activity Group (CSAG)
Fiscal Year (FY) 2011Budget Estimates
February 2010
CSAG - Maintenance Division
FY2009 to FY2010 FY2010 to FY2011
PROGRAM CHANGESLabor Workload 116.941 (71.511)Material Workload 62.098 (98.574)BOS 12.482 (39.526)Contract Changes (158.987) (50.000)TOTAL PROGRAM CHANGES 32.534 (259.612)
OTHER CHANGESData Systems Support 6.674 0.356Data Systems Development (10.717) 0.027Other ADP 0.000 0.000Equipment Depreciation 0.522 3.828Minor Construction Depreciation 12.319 33.091Data System Depreciation (33.217) (1.018)Travel & Transportation 3.242 (0.184)Communications 1.159 (0.334)Utilities 2.774 0.755Equipment Rental 2.320 (0.048)Printing & Equipment (1.929) (0.009)Equip/Vehicle Rep & Maintenance 20.372 (0.652)Custodial 1.492 0.110Facility Maintenance (6.137) (12.802)Training 1.810 (0.148)Environmental 0.000 0.000Environmental 0.000 0.000Miscellaneous 83.712 (62.150)TOTAL OTHER CHANGES 84.396 (39.177)
TOTAL CHANGES 188.178 (231.945)
Cost of OperationsOrganic 4,420.112 4,238.166Contract 50.000 0.000Total 4,470.112 4,238.166
FOR OFFICIAL USE ONLY Fund 2 CSAG Maintenance
27

Fund 6(Dollars in Millions)
Depot Maintenance 6% Capital Investment PlanAir Force Working Capital Fund
Consolidated Sustainment Activity Group (CSAG)
Fiscal Year (FY) 2011Budget Estimates
February 2010
CSAG - Maintenance Division
Revenue3 Year Average Budget Capital Difference
2006 - 2008 2007 - 2009 2008 - 2010 FY 2009 FY 2010 FY2011 FY 2009 FY 2010 FY2011Revenue 6.0% 6.0% 6.0% Working Capital Fund 5,094.265 4,726.233 4,431.407 Appropriations 0.000 0.000 0.000Total Revenue 5,094.265 4,726.233 4,431.407
Required Investment 305.656 283.574 265.884
AF Depot InvestmentFacility, Sustainment, Restoration & Modernization 85.230 92.528 80.704Equipment
Aircraft Procurement (3010) 36.000 153.270 132.700WCF Capital Investment Program 87.952 137.985 143.661Productivity Enhancements Depot Maintenance Transformation 156.219 0.000 0.000AF MILCON (3300) 36.000 34.090 41.800
Component Total Investment 401.401 417.873 398.865
Variance of Required to Actual Investment 95.745 134.299 132.981(Positive number exceeds 6% requirement)
FOR OFFICIAL USE ONLY Fund 6 CSAG Maintenance
Note: Depot maintenance average revenue has decreased due to the elimination of internal transactions between the Supply and Maintenance Divisions. Even though the billing elimination decreases the stated revenue which would seem to reduce the required investment in the depots, the Air Force has continued to fund the depot investments at historical levels.
FOR OFFICIAL USE ONLY Fund 6 CSAG Maintenance
28

Fund 11A(Dollars in Millions)
Carryover ReconciliationAir Force Working Capital Fund
Consolidated Sustainment Activity Group (CSAG)
Fiscal Year (FY) 2011Budget Estimates
February 2010
CSAG Maintenance DivisionExternal Orders
FY 2009 FY 2010 FY 2011*Gross Carry-in 1,662.832 1,885.078 1,627.125WIP 10.634 12.562 27.293
1 Net Carry-in 1,652.198 1,872.516 1,599.8322 Revenue (Billings) 3,178.859 3,489.067 3,690.5973 New Orders 3,401.105 3,231.115 3,193.943
4 Exclusion (FMS, BRAC, Other Federal & Agency, Non-Federal) 104.539 220.196 356.017
Exclusion Adjustment 0.000 0.000 0.000Total Exclusion (FMS, BRAC, Other Federal & Agency, Non-Federal) 104.539 220.196 356.017
5 Orders for Carry-over Calculation 3,296.566 3,010.919 2,837.926
6 Weighted Composite Outlay Rate (New Orders) 64.71% 67.28% 66.85%7 Carry-over Rate (New Orders) 35.29% 32.72% 33.15%
Carry-over Rate (Prior Year Procurement) 44.44% 45.37% 40.68%
8 Allowable Carry-over (New Orders) 1,163.520 985.304 940.690Allowable Carry-over (Prior Year Procurement) 114.916 147.345 84.527Total Allowable Carry-over 1,278.436 1,132.649 1,025.216
Total Unbilled Balance 1,885.078 1,627.125 1,130.471
10 Work-in-Process Carry-over 12.562 27.293 27.45411 Actual Carry-over 1,872.516 1,599.832 1,103.017
FOR OFFICIAL USE ONLY Fund 11A CSAG Maintenance
11 Actual Carry-over 1,872.516 1,599.832 1,103.017Exclusion (FMS, BRAC, Other Federal & Agency, Non-Federal) 26.135 55.049 89.004
12 Calculated Actual Carry-over 1,846.381 1,544.783 1,014.012
Excess Carryover 567.945 412.134 (11.204)(Negative number best)
**Organic maintenance carry-in for FY 2009 reflects increases in FY 2008 new orders and production delays which created a $585 million bow-wave primarily in aircraft and engines. This bow-wave was partially driven by increased overseas contingency operation funding at the depots and the timing of funding. Carry-in for FY 2010 reflects the $284 million increase in FY 2009 new customer orders and remaining production impacts from the prior year bow-wave. FY 2009 carry-over orders include A-10 wing repairs, C-130 programmed depot maintenance, C-5 programmed depot maintenance, F-16 aircraft workload and software maintenance for multiple weapon systems. The Air Force aggressive get-well plan focuses on augmented and efficient manpower utilization to bring FY2010 carry-over in line with accepted levels by end of year while balancing readiness requirements.
*Beginning in FY09, this exhibit reflects external orders only due to the elimination of internal transactions between Supply and Maintenance under the Consolidated Sustainment Activity Group.
FOR OFFICIAL USE ONLY Fund 11A CSAG Maintenance
29

Fund 16(Dollars in Millions)
Material Inventory DataAir Force Working Capital Fund
Consolidated Sustainment Activity Group (CSAG)
Fiscal Year (FY) 2011Budget Estimates
February 2010
CSAG - Maintenance Division
FY 2009 FY 2010 FY 20111. Material Inventory BOP 193.577 143.418 105.535
2. A. BOP Reclassification Changes 0.000 0.000 0.000 B. Adjust to Standard Prices 0.000 0.000 0.000
3. A. Price Changes 0.000 0.000 0.000 B. Inventory Reclass & Repriced 193.577 143.418 105.535
4. Receipts from Commercial Sources 950.779 1,063.891 1,064.591
5. Negotiated Purchases from Customers 0.000 0.000 0.000
6. Gross Sales 1,000.938 1,101.775 1,062.730
7. Inventory Adjustments A. Capitalizations (Net) (+/-) 0.000 0.000 0.000 B. Returns to Suppliers (-) 0.000 0.000 0.000 C. Transfer to Prop Disposal (-) 0.000 0.000 0.000 D. Issues/Receipts W/O Reimbursement (+/-) 0.000 0.000 0.000 E. Cust Returns W/O Credit (+) 0.000 0.000 0.000 F. DLR Retrograde (+) 0.000 0.000 0.000 G. Other Inventory Adjustments 1. Other-Destructions (-) 0.000 0.000 0.000 2. Other-Discounts on Returns 0.000 0.000 0.000 3. Other-Trade-Ins (-) 0.000 0.000 0.000 4. Other-Loss from Disast (-) 0.000 0.000 0.000 5. Other-Assembly/Disassembly (+/-) 0.000 0.000 0.000
FOR OFFICIAL USE ONLY Fund 16 CSAG Maintenance
y y ( ) 6. Other-Physical Inventory Adj (+/-) 0.000 0.000 0.000 7. Other-Accounting Adjustments (+/-) 0.000 0.000 0.000 8. Other-Shipment Discrepancies (+/-) 0.000 0.000 0.000 9. Other-other Gains/Losses (+/-) 0.000 0.000 0.000 10. Other-Strata Transfers (+/-) 0.000 0.000 0.000 11. Other-Stata Transf in Trans 0.000 0.000 0.000 12. Other-Total 0.000 0.000 0.000 H. Adjustments to Revised Valuation 0.000 0.000 0.000 I. Total Adjustments 0.000 0.000 0.000
8. Inventory - End of Period 143.418 105.535 107.395 A. Economic Retention (Memo) 0.000 0.000 0.000 B. Policy Retention (Memo) 0.000 0.000 0.000 C. Potential Excess (Memo) 0.000 0.000 0.000 D. Other (Memo) 0.000 0.000 0.000
9. Inventory On Order (EOP) 0.000 0.000 0.000
FOR OFFICIAL USE ONLY Fund 16 CSAG Maintenance
30

SM-1
(Dollars in Millions)
Supply Management SummaryAir Force Working Capital Fund
Consolidated Sustainment Activity Group (CSAG)
Fiscal Year (FY) 2011Budget Estimates
February 2010
CSAG-Supply Division FY 2009
DivisionPeacetime Inventory
Net Customer Orders Net Sales Operating Mobilization Other Total
Variability Target
TargetTotal
Supply Management Activity Group
Consolidated Sustainment Activity Group Supply Division - Wholesale 22,429.217 4,231.355 4,254.665 3,523.894 0.000 48.099 3,571.993 0.000 3,571.993Subtotal CSAG 22,429.217 4,231.355 4,254.665 3,523.894 0.000 48.099 3,571.993 0.000 3,571.993
Component Total 22,429.217 4,231.355 4,254.665 3,523.894 0.000 48.099 3,571.993 0.000 3,571.993
Note: Obligation Target Other includes initial spares and capital investment program obligation requirements.
Obligation Target
FOR OFFICIAL USE ONLY SM-1 CSAG SupplyFOR OFFICIAL USE ONLY SM-1 CSAG Supply
31

SM-1
(Dollars in Millions)
Supply Management SummaryAir Force Working Capital Fund
Consolidated Sustainment Activity Group (CSAG)
Fiscal Year (FY) 2011Budget Estimates
February 2010
FY 2010
DivisionPeacetime Inventory
Net Customer Orders Net Sales Operating Mobilization Other Total
Variability Target
TargetTotal
Supply Management Activity Group
Consolidated Sustainment Activity Group Supply Division - Wholesale 20,714.052 4,366.357 4,372.911 3,732.450 0.000 69.693 3,802.143 200.000 4,002.143Subtotal CSAG 20,714.052 4,366.357 4,372.911 3,732.450 0.000 69.693 3,802.143 200.000 4,002.143
Component Total 20,714.052 4,366.357 4,372.911 3,732.450 0.000 69.693 3,802.143 200.000 4,002.143
Note: Obligation Target Other includes initial spares and capital investment program obligation requirements.
Obligation Target
FOR OFFICIAL USE ONLY SM-1 CSAG SupplyFOR OFFICIAL USE ONLY SM-1 CSAG Supply
32

SM-1
(Dollars in Millions)
Supply Management SummaryAir Force Working Capital Fund
Consolidated Sustainment Activity Group (CSAG)
Fiscal Year (FY) 2011Budget Estimates
February 2010
FY 2011
DivisionPeacetime Inventory
Net Customer Orders Net Sales Operating Mobilization Other Total
Variability Target
TargetTotal
Supply Management Activity Group
Consolidated Sustainment Activity Group Supply Division - Wholesale 19,144.333 4,885.477 4,890.564 4,022.659 0.000 103.634 4,126.293 200.000 4,326.293Subtotal CSAG 19,144.333 4,885.477 4,890.564 4,022.659 0.000 103.634 4,126.293 200.000 4,326.293
Component Total 19,144.333 4,885.477 4,890.564 4,022.659 0.000 103.634 4,126.293 200.000 4,326.293
Note: Obligation Target Other includes initial spares and capital investment program obligation requirements.
Obligation Target
FOR OFFICIAL USE ONLY SM-1 CSAG SupplyFOR OFFICIAL USE ONLY SM-1 CSAG Supply
33

SM-3B(Dollars in Millions)
Weapon System FundingAir Force Working Capital Fund
Consolidated Sustainment Activity Group (CSAG)
Fiscal Year (FY) 2011Budget Estimates
February 2010
CSAG-Supply Division
FY 2009 Rep Buy Con Buy Total Buy Initial SparesInternal/Organic
RepairCost Authority
Contract Repair Total Repair TotalNMCRS Percent
A-10 68.226 17.757 85.983 0.000 161.455 161.908 323.363 409.346 10.1%B-1B 133.350 16.179 149.529 1.685 231.793 106.856 338.649 489.862 9.3%B-2 76.210 3.503 79.713 0.556 26.474 74.408 100.882 181.151 13.5%B-52 68.361 4.829 73.189 0.042 111.906 6.652 118.558 191.789 11.1%C-5 60.566 19.070 79.635 0.000 214.530 41.697 256.227 335.863 8.4%C-17 0.786 0.000 0.786 0.000 0.240 0.008 0.248 1.034 2.8%C-130 42.291 18.623 60.914 12.484 128.761 106.329 235.090 308.488 9.5%C-135 97.615 1.018 98.633 9.656 220.389 70.720 291.110 399.398 8.8%C-141 0.000 0.000 0.000 0.000 0.069 0.021 0.091 0.091 0.0%E-3 43.393 2.975 46.368 4.223 64.902 17.173 82.076 132.667 7.2%E-4 0.000 0.000 0.000 0.000 0.940 0.092 1.032 1.032 11.0%E-8 0.331 0.000 0.331 0.000 2.748 0.067 2.815 3.146 8.8%F-4 1.082 0.409 1.492 0.000 8.357 0.275 8.633 10.124 0.0%F-15 39.778 7.025 46.803 0.833 350.332 79.443 429.775 477.411 8.2%F-16 44.824 22.339 67.163 8.894 215.013 37.561 252.574 328.631 10.1%F100 Engines 0.000 0.000 0.000 0.000 301.417 61.803 363.219 363.219 0.0%F110 Engines 0.000 0.000 0.000 0.000 219.224 3.264 222.488 222.488 0.0%F-22 0.000 0.000 0.000 0.000 0.000 0.000 0.000 0.000 10.1%F-111 0.781 2.800 3.581 0.000 0.139 0.117 0.255 3.836 0.0%F-117 0.000 0.020 0.020 0.000 0.000 0.011 0.011 0.031 0.0%H-1 3.903 2.154 6.057 0.000 0.377 5.592 5.969 12.026 9.2%H-3 0.000 0.000 0.000 0.000 0.000 0.000 0.000 0.000 0.0%H-53 28.741 35.527 64.268 0.000 0.017 0.000 0.017 64.285 0.0%H-60 180.125 8.046 188.171 0.500 0.041 6.509 6.551 195.222 6.4%H-60 180.125 8.046 188.171 0.500 0.041 6.509 6.551 195.222 6.4%Trainers 72.616 35.207 107.823 0.000 12.474 8.330 20.804 128.627 3.7%Other Aircraft 4.251 0.806 5.057 0.000 4.366 1.366 5.732 10.790 6.5%SOF 2.437 14.805 17.242 0.549 11.830 30.221 42.051 59.843 9.5%Common 34.509 7.033 41.542 0.000 219.968 46.557 266.526 308.067 0.0%Common EW 0.789 0.559 1.349 0.000 49.834 30.468 80.302 81.651 0.0%Missiles 0.664 0.422 1.086 0.000 4.845 3.562 8.407 9.493 0.0%Other 10.116 3.448 13.564 0.594 23.883 40.092 63.974 78.133 0.0%NIMSC5 0.000 0.000 0.000 0.000 0.000 176.591 176.591 176.591 0.0%New WS Fund 1 0.000 0.000 0.000 0.000 0.000 0.000 0.000 0.000 0.0%RSP 0.000 0.000 0.000 0.000 17.994 8.491 26.485 26.485 0.0%JEIM 0.000 0.000 0.000 0.000 77.438 0.000 77.438 77.438 0.0%Local Manufacture Buy 0.000 0.000 0.000 0.000 25.363 0.000 25.363 25.363 0.0%AMARG 0.000 0.000 0.000 0.000 6.082 0.000 6.082 6.082 0.0%Org Sustaining Engrg 0.000 0.000 0.000 0.000 1.762 0.000 1.762 1.762 0.0%PBL 0.000 0.000 0.000 0.000 0.000 34.431 34.431 34.431 0.0%
Total 1,015.746 224.553 1,240.299 40.015 2,714.965 1,160.616 3,875.581 5,155.895 8.6%FOR OFFICIAL USE ONLY SM-3B CSAG Supply
34

SM-3B(Dollars in Millions)
Weapon System FundingAir Force Working Capital Fund
Consolidated Sustainment Activity Group (CSAG)
Fiscal Year (FY) 2011Budget Estimates
February 2010
CSAG-Supply Division
FY 2010 Rep Buy Con Buy Total Buy Initial SparesInternal/Organic
RepairCost Authority
Contract Repair Total Repair TotalNMCRS Percent
A-10 25.339 3.256 28.595 0.000 171.794 133.562 305.355 333.950 10.2%B-1B 88.758 23.675 112.433 10.094 195.946 70.342 266.288 388.815 11.8%B-2 31.870 1.752 33.622 0.000 28.447 60.434 88.881 122.503 18.5%B-52 65.185 3.440 68.625 8.640 138.980 7.004 145.985 223.250 10.7%C-5 92.392 27.363 119.755 0.000 238.146 43.133 281.278 401.033 13.4%C-17 0.172 0.000 0.172 0.000 0.289 0.006 0.295 0.467 2.9%C-130 53.384 12.079 65.463 0.000 126.902 74.908 201.810 267.273 9.5%C-135 65.755 0.742 66.497 7.070 251.680 60.259 311.939 385.506 7.8%C-141 0.004 0.000 0.004 0.000 0.069 0.000 0.069 0.073 0.0%E-3 40.084 2.232 42.316 10.980 51.952 9.914 61.866 115.162 6.5%E-4 0.000 0.000 0.000 0.000 0.715 0.057 0.771 0.771 9.2%E-8 0.157 0.000 0.157 0.000 4.142 0.186 4.328 4.485 10.0%F-4 2.430 0.447 2.877 0.000 7.669 1.648 9.317 12.194 0.0%F-15 41.942 14.684 56.626 7.815 244.603 57.828 302.431 366.872 8.6%F-16 88.386 17.717 106.103 6.889 186.399 71.178 257.577 370.569 9.3%F100 Engines 173.388 14.243 187.631 0.000 252.013 270.756 522.769 710.400 0.0%F110 Engines 60.717 39.466 100.183 0.000 236.797 5.093 241.890 342.073 0.0%F-22 0.000 0.000 0.000 0.000 0.000 0.000 0.000 0.000 15.2%F-111 0.000 0.000 0.000 0.000 0.038 0.000 0.038 0.038 0.0%F-117 0.000 0.000 0.000 0.000 0.000 0.005 0.005 0.005 0.0%H-1 2.686 4.034 6.720 0.000 0.655 7.754 8.409 15.129 9.2%H-3 0.000 0.000 0.000 0.000 0.000 0.000 0.000 0.000 0.0%H-53 0.032 0.075 0.107 0.000 0.000 0.000 0.000 0.107 0.0%H-60 3.902 0.177 4.079 1.645 0.000 6.193 6.193 11.917 8.1%H-60 3.902 0.177 4.079 1.645 0.000 6.193 6.193 11.917 8.1%Trainers 12.732 63.952 76.684 0.000 12.114 11.200 23.315 99.999 3.4%Other Aircraft 4.178 0.582 4.760 0.000 3.581 2.255 5.836 10.596 5.5%SOF 14.989 8.033 23.022 3.087 11.814 33.445 45.259 71.368 9.3%Common 31.413 9.466 40.879 0.000 204.804 42.440 247.244 288.123 0.0%Common EW 9.208 1.121 10.329 0.000 46.680 39.981 86.661 96.990 0.0%Missiles 16.484 2.630 19.114 0.000 5.676 6.154 11.830 30.944 0.0%Other 12.629 3.435 16.064 0.919 25.207 73.076 98.282 115.265 0.0%NIMSC5 0.000 0.000 0.000 0.000 0.000 152.424 152.424 152.424 0.0%New WS Fund 1 0.000 0.000 0.000 0.000 0.000 0.000 0.000 0.000 0.0%RSP 0.000 0.000 0.000 0.000 53.642 32.204 85.846 85.846 0.0%JEIM 0.000 0.000 0.000 0.000 133.555 0.000 133.555 133.555 0.0%Local Manufacture Buy 0.000 0.000 0.000 0.000 22.534 0.000 22.534 22.534 0.0%AMARG 0.000 0.000 0.000 0.000 6.111 0.000 6.111 6.111 0.0%Org Sustaining Engrg 0.000 0.000 0.000 0.000 2.600 0.000 2.600 2.600 0.0%PBL 0.000 0.000 0.000 0.000 0.000 106.370 106.370 106.370 0.0%
Total 938.216 254.601 1,192.817 57.139 2,665.554 1,379.808 4,045.362 5,295.318 8.9%FOR OFFICIAL USE ONLY SM-3B CSAG Supply
35

SM-3B(Dollars in Millions)
Weapon System FundingAir Force Working Capital Fund
Consolidated Sustainment Activity Group (CSAG)
Fiscal Year (FY) 2011Budget Estimates
February 2010
CSAG-Supply Division
FY 2011 Rep Buy Con Buy Total Buy Initial SparesInternal/Organic
RepairCost Authority
Contract Repair Total Repair TotalNMCRS Percent
A-10 51.277 8.324 59.601 0.000 162.893 145.808 308.701 368.302 10.0%B-1B 85.054 22.825 107.879 14.238 188.255 68.312 256.567 378.684 11.3%B-2 116.792 1.759 118.551 15.529 26.288 61.115 87.403 221.483 17.2%B-52 64.757 3.176 67.933 13.400 140.166 7.127 147.293 228.626 10.5%C-5 98.341 28.151 126.492 0.000 256.562 38.219 294.781 421.273 12.3%C-17 0.133 0.000 0.133 0.000 0.309 0.009 0.319 0.452 3.0%C-130 105.588 12.353 117.941 3.420 156.035 104.880 260.915 382.276 9.2%C-135 75.336 0.689 76.025 7.847 232.530 46.883 279.413 363.285 7.9%C-141 0.004 0.000 0.004 0.000 0.071 0.024 0.095 0.099 0.0%E-3 41.843 1.694 43.537 18.767 56.262 9.807 66.068 128.372 6.9%E-4 0.000 0.000 0.000 0.000 0.518 0.037 0.555 0.555 9.3%E-8 0.275 0.000 0.275 0.000 4.279 0.228 4.506 4.781 10.2%F-4 2.752 0.439 3.191 0.000 8.826 0.990 9.815 13.006 0.0%F-15 50.806 17.910 68.716 6.605 230.037 54.763 284.799 360.120 8.4%F-16 99.503 18.313 117.816 8.435 184.651 43.269 227.920 354.171 9.5%F100 Engines 221.510 26.643 248.153 0.000 290.665 175.422 466.086 714.239 0.0%F110 Engines 45.335 43.243 88.578 0.000 210.689 4.537 215.227 303.805 0.0%F-22 0.000 0.000 0.000 0.000 0.000 0.000 0.000 0.000 13.8%F-111 0.009 0.000 0.009 0.000 0.039 0.052 0.091 0.100 0.0%F-117 0.000 0.000 0.000 0.000 0.000 0.005 0.005 0.005 0.0%H-1 1.845 4.333 6.178 0.000 1.249 6.269 7.518 13.696 9.6%H-3 0.000 0.000 0.000 0.000 0.000 0.000 0.000 0.000 0.0%H-53 0.034 0.106 0.140 0.000 0.005 0.002 0.007 0.147 0.0%H-60 2.402 0.909 3.311 1.669 0.038 5.903 5.941 10.921 7.3%H-60 2.402 0.909 3.311 1.669 0.038 5.903 5.941 10.921 7.3%Trainers 16.568 13.364 29.932 0.000 14.200 13.135 27.334 57.266 3.5%Other Aircraft 4.703 0.674 5.377 0.000 4.812 2.365 7.177 12.554 6.0%SOF 6.573 7.151 13.724 0.000 12.414 36.957 49.371 63.095 8.8%Common 39.146 12.748 51.894 0.000 202.674 41.972 244.646 296.540 0.0%Common EW 12.795 1.141 13.936 0.000 47.623 41.333 88.956 102.892 0.0%Missiles 17.675 1.645 19.320 0.000 6.082 4.237 10.319 29.639 0.0%Other 5.703 2.940 8.643 0.934 25.681 52.491 78.172 87.749 0.0%NIMSC5 0.000 0.000 0.000 0.000 0.000 238.316 238.316 238.316 0.0%New WS Fund 1 0.000 0.000 0.000 0.000 0.000 0.000 0.000 0.000 0.0%RSP 0.000 0.000 0.000 0.000 56.986 25.775 82.761 82.761 0.0%JEIM 0.000 0.000 0.000 0.000 128.753 0.000 128.753 128.753 0.0%Local Manufacture Buy 0.000 0.000 0.000 0.000 23.973 0.000 23.973 23.973 0.0%AMARG 0.000 0.000 0.000 0.000 6.160 0.000 6.160 6.160 0.0%Org Sustaining Engrg 0.000 0.000 0.000 0.000 2.600 0.000 2.600 2.600 0.0%PBL 0.000 0.000 0.000 0.000 0.000 220.279 220.279 220.279 0.0%
Total 1,166.759 230.530 1,397.289 90.844 2,682.326 1,450.519 4,132.845 5,620.978 8.7%FOR OFFICIAL USE ONLY SM-3B CSAG Supply
36
SM-4(Dollars in Millions)
Inventory StatusAir Force Working Capital Fund
Consolidated Sustainment Activity Group (CSAG)
Fiscal Year (FY) 2011Budget Estimates
February 2010
CSAG-Supply Division
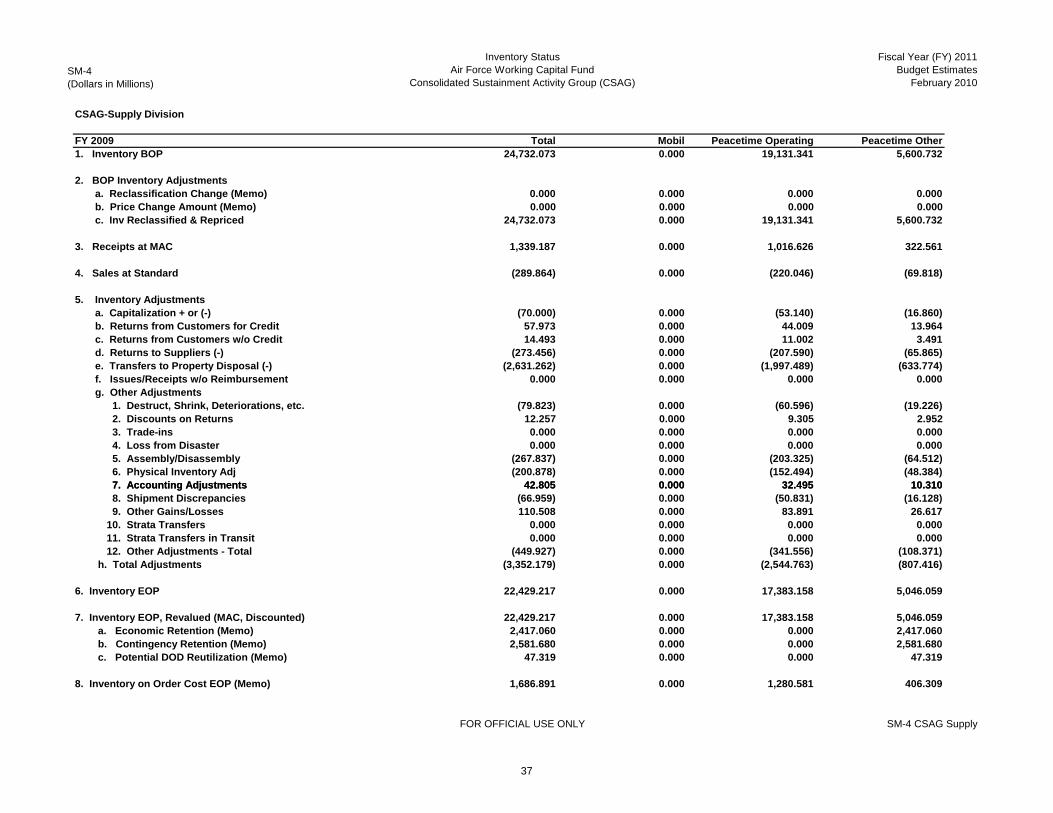
FY 2009 Total Mobil Peacetime Operating Peacetime Other1. Inventory BOP 24,732.073 0.000 19,131.341 5,600.732
2. BOP Inventory Adjustments a. Reclassification Change (Memo) 0.000 0.000 0.000 0.000 b. Price Change Amount (Memo) 0.000 0.000 0.000 0.000 c. Inv Reclassified & Repriced 24,732.073 0.000 19,131.341 5,600.732
3. Receipts at MAC 1,339.187 0.000 1,016.626 322.561
4. Sales at Standard (289.864) 0.000 (220.046) (69.818)
5. Inventory Adjustments a. Capitalization + or (-) (70.000) 0.000 (53.140) (16.860) b. Returns from Customers for Credit 57.973 0.000 44.009 13.964 c. Returns from Customers w/o Credit 14.493 0.000 11.002 3.491 d. Returns to Suppliers (-) (273.456) 0.000 (207.590) (65.865) e. Transfers to Property Disposal (-) (2,631.262) 0.000 (1,997.489) (633.774) f. Issues/Receipts w/o Reimbursement 0.000 0.000 0.000 0.000 g. Other Adjustments 1. Destruct, Shrink, Deteriorations, etc. (79.823) 0.000 (60.596) (19.226) 2. Discounts on Returns 12.257 0.000 9.305 2.952 3. Trade-ins 0.000 0.000 0.000 0.000 4. Loss from Disaster 0.000 0.000 0.000 0.000 5. Assembly/Disassembly (267.837) 0.000 (203.325) (64.512) 6. Physical Inventory Adj (200.878) 0.000 (152.494) (48.384) 7. Accounting Adjustments 42.805 0.000 32.495 10.310 7. Accounting Adjustments 42.805 0.000 32.495 10.310 8. Shipment Discrepancies (66.959) 0.000 (50.831) (16.128) 9. Other Gains/Losses 110.508 0.000 83.891 26.617 10. Strata Transfers 0.000 0.000 0.000 0.000 11. Strata Transfers in Transit 0.000 0.000 0.000 0.000 12. Other Adjustments - Total (449.927) 0.000 (341.556) (108.371) h. Total Adjustments (3,352.179) 0.000 (2,544.763) (807.416)
6. Inventory EOP 22,429.217 0.000 17,383.158 5,046.059
7. Inventory EOP, Revalued (MAC, Discounted) 22,429.217 0.000 17,383.158 5,046.059 a. Economic Retention (Memo) 2,417.060 0.000 0.000 2,417.060 b. Contingency Retention (Memo) 2,581.680 0.000 0.000 2,581.680 c. Potential DOD Reutilization (Memo) 47.319 0.000 0.000 47.319
8. Inventory on Order Cost EOP (Memo) 1,686.891 0.000 1,280.581 406.309
FOR OFFICIAL USE ONLY SM-4 CSAG Supply
37

SM-4(Dollars in Millions)
Inventory Status Air Force Working Capital Fund
Consolidated Sustainment Activity Group (CSAG)
Fiscal Year (FY) 2011Budget Estimates
February 2010
CSAG-Supply Division
FY 2010 Total Mobil Peacetime Operating Peacetime Other1. Inventory BOP 22,429.217 0.000 17,383.158 5,046.059
2. BOP Inventory Adjustments a. Reclassification Change (Memo) 0.000 0.000 0.000 0.000 b. Price Change Amount (Memo) 0.000 0.000 0.000 0.000 c. Inv Reclassified & Repriced 22,429.217 0.000 17,383.158 5,046.059
3. Receipts at MAC 1,361.853 0.000 1,033.833 328.020
4. Sales at Standard (311.713) 0.000 (236.633) (75.080)
5. Inventory Adjustments a. Capitalization + or (-) (90.000) 0.000 (68.322) (21.678) b. Returns from Customers for Credit 62.343 0.000 47.327 15.016 c. Returns from Customers w/o Credit 15.586 0.000 11.832 3.754 d. Returns to Suppliers (-) (277.011) 0.000 (210.289) (66.722) e. Transfers to Property Disposal (-) (2,368.136) 0.000 (1,797.740) (570.396) f. Issues/Receipts w/o Reimbursement 0.000 0.000 0.000 0.000 g. Other Adjustments 1. Destruct, Shrink, Deteriorations, etc. (80.860) 0.000 (61.384) (19.476) 2. Discounts on Returns 12.417 0.000 9.426 2.991 3. Trade-ins 0.000 0.000 0.000 0.000 4. Loss from Disaster 0.000 0.000 0.000 0.000 5. Assembly/Disassembly (272.371) 0.000 (206.767) (65.604) 6. Physical Inventory Adj (204.278) 0.000 (155.075) (49.203) 7. Accounting Adjustments 404.880 0.000 307.359 97.521 7. Accounting Adjustments 404.880 0.000 307.359 97.521 8. Shipment Discrepancies (68.093) 0.000 (51.692) (16.401) 9. Other Gains/Losses 100.218 0.000 76.079 24.139 10. Strata Transfers 0.000 0.000 0.000 0.000 11. Strata Transfers in Transit 0.000 0.000 0.000 0.000 12. Other Adjustments - Total (108.087) 0.000 (82.053) (26.034) h. Total Adjustments (2,765.305) 0.000 (2,099.245) (666.060)
6. Inventory EOP 20,714.052 0.000 16,081.112 4,632.940
7. Inventory EOP, Revalued (MAC, Discounted) 20,714.052 0.000 16,081.112 4,632.940 a. Economic Retention (Memo) 2,219.176 0.000 0.000 2,219.176 b. Contingency Retention (Memo) 2,370.319 0.000 0.000 2,370.319 c. Potential DOD Reutilization (Memo) 43.445 0.000 0.000 43.445
8. Inventory on Order Cost EOP (Memo) 1,519.720 0.000 1,153.676 366.044
FOR OFFICIAL USE ONLY SM-4 CSAG Supply
38

SM-4(Dollars in Millions)
Inventory StatusAir Force Working Capital Fund
Consolidated Sustainment Activity Group (CSAG)
Fiscal Year (FY) 2011Budget Estimates
February 2010
CSAG-Supply Division
FY 2011 Total Mobil Peacetime Operating Peacetime Other1. Inventory BOP 20,714.052 0.000 16,081.112 4,632.940
2. BOP Inventory Adjustments a. Reclassification Change (Memo) 0.000 0.000 0.000 0.000 b. Price Change Amount (Memo) 0.000 0.000 0.000 0.000 c. Inv Reclassified & Repriced 20,714.052 0.000 16,081.112 4,632.940
3. Receipts at MAC 1,303.257 0.000 989.351 313.906
4. Sales at Standard (273.023) 0.000 (207.262) (65.761)
5. Inventory Adjustments a. Capitalization + or (-) (90.000) 0.000 (68.322) (21.678) b. Returns from Customers for Credit 54.605 0.000 41.452 13.152 c. Returns from Customers w/o Credit 13.651 0.000 10.363 3.288 d. Returns to Suppliers (-) (281.550) 0.000 (213.735) (67.815) e. Transfers to Property Disposal (-) (2,131.322) 0.000 (1,617.966) (513.357) f. Issues/Receipts w/o Reimbursement 0.000 0.000 0.000 0.000 g. Other Adjustments 1. Destruct, Shrink, Deteriorations, etc. (82.186) 0.000 (62.390) (19.795) 2. Discounts on Returns 12.620 0.000 9.581 3.040 3. Trade-ins 0.000 0.000 0.000 0.000 4. Loss from Disaster 0.000 0.000 0.000 0.000 5. Assembly/Disassembly (260.651) 0.000 (197.870) (62.781) 6. Physical Inventory Adj (195.489) 0.000 (148.403) (47.086) 7. Accounting Adjustments 332.977 0.000 252.775 80.202 7. Accounting Adjustments 332.977 0.000 252.775 80.202 8. Shipment Discrepancies (65.163) 0.000 (49.468) (15.695) 9. Other Gains/Losses 92.555 0.000 70.262 22.293 10. Strata Transfers 0.000 0.000 0.000 0.000 11. Strata Transfers in Transit 0.000 0.000 0.000 0.000 12. Other Adjustments - Total (165.337) 0.000 (125.513) (39.823) h. Total Adjustments (2,599.953) 0.000 (1,973.721) (626.232)
6. Inventory EOP 19,144.333 0.000 14,889.481 4,254.852
7. Inventory EOP, Revalued (MAC, Discounted) 19,144.333 0.000 14,889.481 4,254.852 a. Economic Retention (Memo) 2,038.072 0.000 0.000 2,038.072 b. Contingency Retention (Memo) 2,176.880 0.000 0.000 2,176.880 c. Potential DOD Reutilization (Memo) 39.900 0.000 0.000 39.900
8. Inventory on Order Cost EOP (Memo) 1,504.523 0.000 1,142.139 362.384
FOR OFFICIAL USE ONLY SM-4 CSAG Supply
39

SM-5B(Dollars in Millions)
Customer Price ChangeAir Force Working Capital Fund
Consolidated Sustainment Activity Group (CSAG)
Fiscal Year (FY) 2011Budget Estimates
February 2010
CSAG-Supply Division
$ FY 2009 $ FY 2010 $ FY 2011FY 2009 Inflation FY 2010 Inflation FY 2011 Inflation
1. Net Sales @ Cost 3,948.349 4,045.411 4,342.036
Repair Cost 3,632.479 3.95% 3,733.698 4.95% 4,069.013 4.25% Buy Cost 315.870 3.05% 311.713 4.05% 273.023 4.00% 2. Less: Material Inflation Adjustment 147.510 188.248 176.384
3. Revised Net Sales @ Cost 3,800.839 3,857.163 4,165.652
Business Overhead Expenses 1,254.864 1,232.911 1,233.289Condemnations/Material Expense 1,191.939 1,050.140 1,030.234Cash/AOR Recovery (93.902) (115.967) 0.000
4. Surcharge Dollars 2,352.900 2,167.083 2,263.523
5. Change to Customers a. Prev Year's Surcharge (%) 64.09% 59.59% 53.57%
b. This Year's Surcharge and MaterialInflation Divided by Revised Net Salesat Cost 65.79% 61.06% 58.57%
c. Percent Change to Customer 1.03% 0.92% 3.26%
FOR OFFICIAL USE ONLY SM-5B CSAG Supply
c. Percent Change to Customer 1.03% 0.92% 3.26%
FOR OFFICIAL USE ONLY SM-5B CSAG Supply
40

AIR FORCE WORKING CAPITAL FUND
SUPPLY MANAGEMENT ACTIVITY GROUP - RETAIL
41

FOR OFFICIAL USE ONLY SMAG–Retail Budget Overview
Supply Management Activity Group–Retail Overview Fiscal Year (FY) 2011 Budget Estimates
Activity Group Overview
The Air Force Supply Management Activity Group–Retail (SMAG-R) is comprised of three divisions: General Support, Medical-Dental, and the United States Air Force Academy.
SMAG–Retail Mission Description
The SMAG-R manages over 1.4 million inventory items including weapon system spare parts, medical-dental supplies and equipment, and other supply items used in non-weapon system applications. The Air Force SMAG-R is a critical component in the support of combat readiness. It procures materiel and makes spares available to authorized customers. Within SMAG-R, the Medical-Dental Division inventory includes a WRM Stockpile. WRM provides initial war fighting capability until re-supply lines can sustain wartime demands for medical and dental supplies and equipment.
The Air Force SMAG-R provides a wide range of logistics support services including requirements forecasting, item introduction, cataloging, provisioning, procurement, repair, technical support, data management, item disposal, distribution management and transportation. Inventories are an integral part of SMAG-R and are maintained by each of the divisions in support of customer requirements. The SMAG-R objective is to replenish inventories and provide supplies to customers in a timely manner within customer funding constraints, while maintaining fund solvency.
The Air Force SMAG-R generates revenue from sales of various supplies to a diverse customer base. Primary SMAG-R customers are Air Force Major Commands (including Air Force Reserve and Air National Guard), Foreign Military Sales, Army, Navy and non-DoD activities, as well as other working capital activity groups, such as Air Force Consolidated Sustainment Activity Group – Maintenance Division.
42

FOR OFFICIAL USE ONLY SMAG–Retail Budget Overview
War Reserve Materiel (WRM)/Direct Appropriation
The Medical-Dental Division’s WRM provides supplies and equipment vital to support forces in the full range of military operations for the first 60 days of a contingency operation, and provides force health protection materiel to all deploying Air Force active, reserve, and guard personnel. Availability of this materiel ensures Air Force personnel can deploy as scheduled and that contingency operations can be conducted until re-supply lines are established and materiel is routinely received from the contiguous United States. The appropriation funds the establishment and sustainment of 2,431 assemblages that are maintained in the Medical-Dental Division until required to provide direct support to the war fighters. Approximately one third of WRM pharmaceuticals must be replaced annually because of shelf life or emergence of newer, more effective treatments. Medical equipment requires constant upgrade to maintain the medical standard of care for required deployable capability. New technology constantly allows for replacement of equipment with smaller, more proficient models which often drives a change in other supply requirements. In FY 2009 and FY 2010, WRM received $61.5 million and $64.0 million, respectively. In FY 2011, funding requirement forecast is $66.9 million.
The Air Force ensures airman and joint warfighters have the best possible care provided when they go in harm’s way by keeping pace with medical device technological advances; however, staying abreast of these rapid innovations places significant financial burden on our WRM resources. Medical assemblies are classified into 6 capabilities: Expeditionary Medical Support (EMEDS) assemblages, aero-medical evacuation sets, patient staging assemblies, specialty care sets, AF Special Operations, and medical personal protection prophylaxis/antidotes. Between FY 2009 and FY 2011, the Medical-Dental Division will modernize 45 Expeditionary Medical Support Systems and 109 Specialty Care Sets (Air Transportable Clinics, CT Scanners, and Ancillary Care Sets), sustain existing packages, and build new/replacement assemblies.
The Medical-Dental Division finances contingency medical assets via a direct Congressional appropriation that enables procurement of medical WRM for the Air Force. The Surgeon General of the Air Force is responsible for programming and executing funding to provide contingency health care in accordance with Combatant Commander Operational Plans.
43

FOR OFFICIAL USE ONLY SMAG–Retail Budget Overview
Division Overviews
The General Support Division (GSD) manages over 1.4 million different items, which are procured from Defense Logistics Agency (DLA) and General Services Administration (GSA). GSD customers use the majority of these items to support field and depot maintenance of aircraft, ground and airborne communication and electronic systems, as well as other sophisticated systems and equipment. The General Support Division also manages many items related to installation, maintenance, and administrative functions. GSD manages stock levels and procurement for critical overseas contingency operation (OCO) requirements.
The Medical-Dental Division (MDD) manages nearly 9,000 different items for 74 Medical Treatment Facilities (MTF) worldwide supported by 85 individual MDD working capital fund accounts. All supply and equipment requirements generated by AF treatment facilities are procured through this division. The Medical-Dental Division also maintains the WRM requirement.
The Air Force Academy Division finances the purchase of uniforms and uniform accessories for sale to cadets in accordance with regulations of the Air Force Academy and related statutes. The customer base consists of approximately 4,500 cadets. The Air Force Academy Division procures both distinctive uniforms and accessories from various manufacturing contractors as well as regular Air Force uniforms purchased through the Defense Logistics Agency.
44

FOR OFFICIAL USE ONLY SMAG–Retail Budget Overview
Financial and Performance Summary
Analysis of Undelivered Orders
Dollars in Millions FY 2009 FY 2010 FY 2011Academy Division $0.1 $0.1 $0.1Medical-Dental Division $145.8 $150.2 $154.7General Support Division $756.7 $822.4 $829.5Total SMAG-Retail $902.6 $972.7 $984.3
The General Support Division received significant OCO orders from customers in the fourth quarter of FY 2009. As a result of the timing of the OCO orders, funds were obligated late in the year, resulting in deliveries not occurring until FY 2010. Changes for FY 2010 and FY 2011 are projected to remain relatively constant.
The Medical-Dental Division maintains only 2 - 4 days worth of inventory on hand. It experiences an inventory turnover rate of more than 200 times per year with most items having a short delivery schedule. Year-to-year increases in Undelivered Orders are primarily due to customers purchasing late in the fiscal year.
The Air Force Academy Division is fairly stable from one year to the next. Every item issued to cadets for reimbursement is seasonally scheduled and does not change significantly from one year to the next. Purchases and cadet orders are seasonally driven due to order lead times and a consistent schedule for incoming classes.
45

FOR OFFICIAL USE ONLY SMAG–Retail Budget Overview
Revenue, Expenses and Net Operating Results
(Dollars in Millions) FY 2009 FY 2010 FY 2011Total Revenue $3,651.1 $3,878.6 $3,947.1Total Expenses $3,512.8 $3,864.6 $3,892.9Operating Results Other Adjustments (WRM) Net Operating Results
$138.3 $14.0 $54.2-$61.5 -$64.0 -$66.9$76.8 -$50.0 -$12.7
Non-Recoverable AOR Adjustment $0.0 $0.0 $0.0Accumulated Operating Results $62.7 $12.7 $0.0
The table above provides revenue and expenses for the total SMAG-R.
Cash Management
(Dollars in Millions) FY 2009 FY 2010 FY 2011BOP Cash Balance $34.2 $127.3 $90.9Disbursements $3,550.1 $3,882.5 $3,959.5Collections $3,581.7 $3,782.0 $3,876.8WRM $61.5 $64.1 $66.9EOP Cash Balance $127.3 $90.9 $75.1
46

FOR OFFICIAL USE ONLY SMAG–Retail Budget Overview
Customer Price Change (%)
Division FY 2009 FY 2010 FY 2011General Support 3.30% -1.54% 1.27%Medical-Dental 5.95% -0.44% 7.67%Academy 2.12% 2.34% -1.89%
Stockage Effectiveness
Division FY 2009 FY 2010 FY 2011General Support 84% 84% 84%Medical-Dental 85% 85% 85%Academy 99% 95% 95%
Stockage Effectiveness measures how often the supply system has available for immediate sale those items it intends to maintain at base and depot level supply locations.
47

FOR OFFICIAL USE ONLY SMAG–Retail Budget Overview
Item Quantity Requirements
Item FY 2009 FY 2010 FY 2011
Number of Issues 8,106,352 8,326,000 8,565,005
Number of Receipts 6,707,778 6,898,290 7,060,344
Number of Requisitions 6,564,410 6,743,694 6,923,279
Contracts Executed 26,102 27,002 27,449
Purchase Inflation 2.6% 2.0% 2.2%
Items Managed 1,456,029 1,456,293 1,456,565
48

Fund 11(Dollars in Millions)
Source of RevenueAir Force Working Capital Fund
Supply Management Activity Group - Retail
Fiscal Year (FY) 2011Budget Estimates
February 2010 Supply Management Activity Group - Retail
FY 2009 FY 2010 FY 20111. New Orders a. Orders From DOD Components: (1) Air Force (a) Aircraft Procurement 5.134 3.075 4.854 (b) Missile Procurement 0.030 0.003 0.003 (c) Other Procurement 0.006 0.959 0.905 (d) Military Construction 0.000 0.000 0.000 (e) Operations & Maintenance - AF 873.117 1,113.467 1,031.084 (f) Military Personnel - AF 0.569 0.428 0.444 (g) Research & Development - AF 20.296 0.137 0.000 (h) Reserve Personnel - AF 6.216 3.027 6.892 (i) Operations & Maintenance - AFRES 66.650 88.995 94.439 (j) Operations & Maintenance - ANG 208.678 182.987 183.081 (k) Guard Personnel - ANG 21.065 (15.387) 1.880 (l) Family Housing 1.197 (0.563) 0.184 (m) Special Trust Funds 6.175 6.292 5.771 (n) Other Air Force 0.005 0.022 0.023Total Air Force 1,209.139 1,383.441 1,329.560
(2) Army 17.968 7.421 7.536 (3) Navy 3.298 2.033 1.473 (4) MAP/Grant Aid 0.015 0.003 0.005 (5) Other DOD 1,031.548 1,145.234 1,259.138Total DOD excluding WCF 2,261.968 2,538.132 2,597.711
b. Orders From Other Fund Activity Groups 0.000 0.000 0.000 (1) Oth AF Supply Management Activity Groups 1.058 0.583 0.717 (2) Transportation Activity Group - TRANSCOM 145.005 146.461 138.221 (3) Consolidated Sustainment Activity Group 1,081.136 1,161.543 1,194.965 (4) Other WCF Activity Groups 0.000 0.011 0.012 (5) Commissary, Sur. Coll. 0.000 0.000 0.000Total Other Fund Activity Groups 1,227.199 1,308.598 1,333.915
c. Total DOD 3,489.167 3,846.730 3,931.627
FOR OFFICIAL USE ONLY Fund 11 Supply Management Activity Group - Retail
49
Fund 11(Dollars in Millions)
Source of RevenueAir Force Working Capital Fund
Supply Management Activity Group - Retail
Fiscal Year (FY) 2011Budget Estimates
February 2010 Supply Management Activity Group - Retail
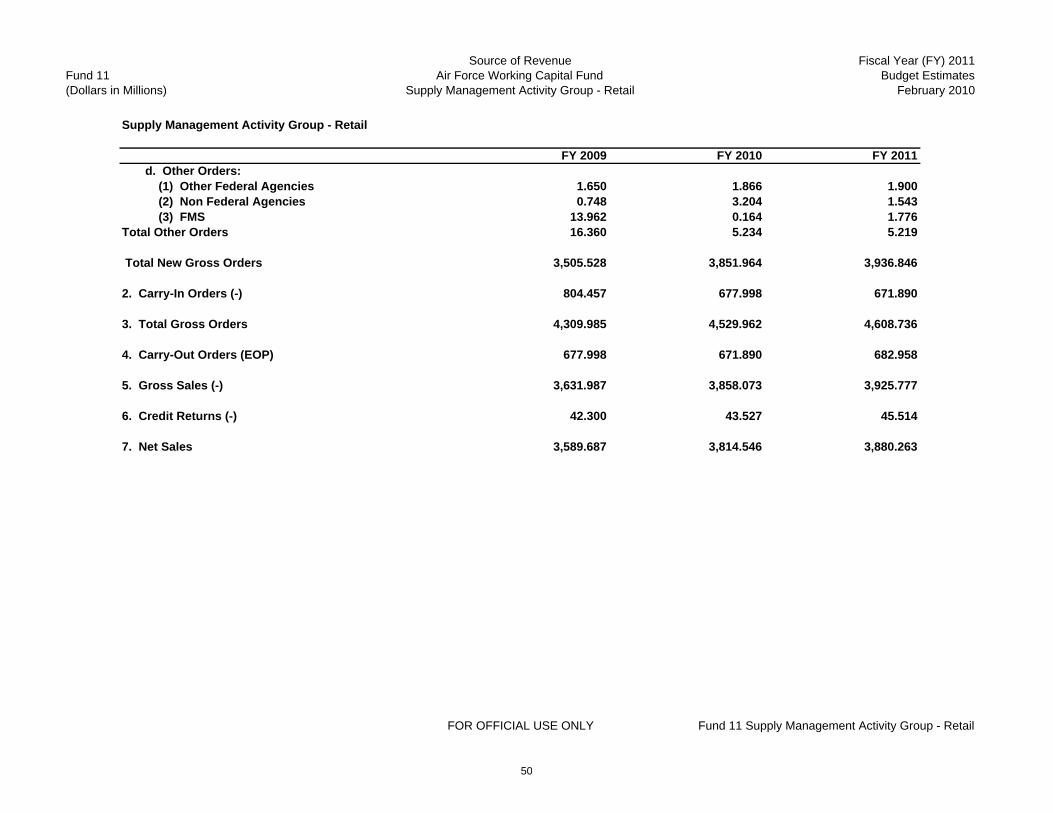
FY 2009 FY 2010 FY 2011 d. Other Orders: (1) Other Federal Agencies 1.650 1.866 1.900 (2) Non Federal Agencies 0.748 3.204 1.543 (3) FMS 13.962 0.164 1.776Total Other Orders 16.360 5.234 5.219
Total New Gross Orders 3,505.528 3,851.964 3,936.846
2. Carry-In Orders (-) 804.457 677.998 671.890
3. Total Gross Orders 4,309.985 4,529.962 4,608.736
4. Carry-Out Orders (EOP) 677.998 671.890 682.958
5. Gross Sales (-) 3,631.987 3,858.073 3,925.777
6. Credit Returns (-) 42.300 43.527 45.514
7. Net Sales 3,589.687 3,814.546 3,880.263
FOR OFFICIAL USE ONLY Fund 11 Supply Management Activity Group - Retail
50

Fund 14(Dollars in Millions)
Revenue and ExpensesAir Force Working Capital Fund
Supply Management Activity Group - Retail
Fiscal Year (FY) 2011Budget Estimates
February 2010
Supply Management Activity Group - Retail
FY 2009 FY 2010 FY 2011PY
ActualsCY
Revised RequestBY1
Revised RequestRevenue: Gross Revenue from Sales 3,631.987 3,858.073 3,925.777 Less Credit Returns 42.300 43.527 45.514 Net Revenue from Sales 3,589.687 3,814.546 3,880.263
Direct Reimbursables 61.465 64.054 66.861Total Net Revenue 3,651.152 3,878.600 3,947.124
Expense: Cost of Material Sold 3,420.606 3,763.940 3,791.469 Cost of Material Repair 0.020 0.033 0.034Subtotal Sales Material Expense 3,420.626 3,763.973 3,791.503 Condemnation Material Expense Recovery (CMER) 0.000 0.000 0.000 Cost of Direct Reimbursable Material 0.000 0.000 0.000 Initial Spares 0.000 0.000 0.000 Readiness Spares Package 0.000 0.000 0.000 Mobilization 0.000 0.000 0.000 Other Direct Reimbursements 0.000 0.000 0.000Subtotal Material Expenses 3,420.626 3,763.973 3,791.503
Business Operations Military Personnel 0.000 0.000 0.000 Civilian Personnel 0.000 0.000 0.000 Travel &Transportation of People 0.176 0.130 0.132 Materials & Supplies 0.000 0.010 0.011 Equipment 0.000 0.000 0.000 Other WCF Purchases 35.883 37.289 35.485 Transportation of Things 42.093 45.001 45.242 Capital Investment Depreciation 0.000 0.000 (0.000) Printing and Reproduction 0.000 0.000 0.000 Advisory and Assistance Services 0.000 0.000 0.000 Rent, Comm, Utilities and Misc Charges 1.387 1.300 1.250 Other Purchased Services 12.647 16.923 19.304Subtotal Business Operations 92.186 100.652 101.424
Total Expenses 3,512.812 3,864.625 3,892.927
FOR OFFICIAL USE ONLY Fund 14 Supply Management Activity Group - Retail
51

Fund 14(Dollars in Millions)
Revenue and ExpensesAir Force Working Capital Fund
Supply Management Activity Group - Retail
Fiscal Year (FY) 2011Budget Estimates
February 2010
Supply Management Activity Group - Retail
FY 2009 FY 2010 FY 2011PY
ActualsCY
Revised RequestBY1
Revised Request
Operating Result 138.340 13.975 54.197
Less Capital Surcharge 0.000 0.000 0.000Plus Passthroughs or Other Approps (NOR) 0.000 0.000 0.000Mobilization (NOR) 0.000 0.000 0.000Other Adjustments (NOR) (61.465) (64.054) (66.861)Other Changes (NOR) 0.000 0.000 0.000
NET OPERATING RESULT (NOR) 76.875 (50.079) (12.664)
Prior Year Adjustments (AOR) 0.000 0.000 0.000Other Changes (AOR) 0.000 0.000 0.000Plus Prior Year AOR (14.133) 62.742 12.664
Accumulated Operating Result (AOR) 62.742 12.664 0.000 Non-Recoverable Adjustment (AOR) 0.000 0.000 0.000Accumulated Operating Result for Budget Purposes 62.742 12.664 0.000
FOR OFFICIAL USE ONLY Fund 14 Supply Management Activity Group - Retail
52

SM-1(Dollars in Millions)
Supply Management SummaryAir Force Working Capital Fund
Supply Management Activity Group - Retail
Fiscal Year (FY) 2011Budget Estimates
February 2010
Supply Management Activity Group - Retail FY 2009
DivisionPeacetime Inventory
Net Customer Orders Net Sales Operating Mobilization Other Total
Variability Target
TargetTotal
Supply Management Activity Group - Retail
ICP Retail Summary GSD 2,052.634 2,405.300 2,486.398 2,433.194 0.000 0.000 2,433.194 0.000 2,433.194 Med/Dent 6.850 1,051.763 1,097.124 1,069.610 61.465 0.000 1,131.075 0.000 1,131.075 Academy 2.828 6.164 6.164 4.815 0.000 0.000 4.815 0.000 4.815TOTAL Retail 2,062.312 3,463.227 3,589.686 3,507.619 61.465 0.000 3,569.084 0.000 3,569.084
Obligation Target
FOR OFFICIAL USE ONLY SM-1 Supply Management Activity Group - Retail
53

SM-1(Dollars in Millions)
Supply Management SummaryAir Force Working Capital Fund
Supply Management Activity Group - Retail
Fiscal Year (FY) 2011Budget Estimates
February 2010
Supply Management Activity Group - Retail FY 2010
DivisionPeacetime Inventory
Net Customer Orders Net Sales Operating Mobilization Other Total
Variability Target
TargetTotal
Supply Management Activity Group - Retail
ICP Retail Summary GSD 1,984.010 2,666.869 2,654.315 2,652.883 0.000 0.000 2,652.883 0.000 2,652.883 Med/Dent 7.361 1,135.026 1,153.688 1,191.298 64.054 0.000 1,255.352 0.000 1,255.352 Academy 2.408 6.543 6.543 6.280 0.000 0.000 6.280 0.000 6.280TOTAL Retail 1,993.779 3,808.438 3,814.546 3,850.462 64.054 0.000 3,914.516 200.000 4,114.516
Obligation Target
FOR OFFICIAL USE ONLY SM-1 Supply Management Activity Group - Retail
54

SM-1(Dollars in Millions)
Supply Management SummaryAir Force Working Capital Fund
Supply Management Activity Group - Retail
Fiscal Year (FY) 2011Budget Estimates
February 2010
Supply Management Activity Group - Retail
FY 2011
DivisionPeacetime Inventory
Net Customer Orders Net Sales Operating Mobilization Other Total
Variability Target
TargetTotal
Supply Management Activity Group - Retail
ICP Retail Summary GSD 2,074.670 2,664.807 2,663.765 2,675.879 0.000 0.000 2,675.879 0.000 2,675.879 Med/Dent 7.741 1,220.504 1,210.478 1,200.037 66.861 0.000 1,266.898 0.000 1,266.898 Academy 2.694 6.020 6.020 6.407 0.000 0.000 6.407 0.000 6.407TOTAL Retail 2,085.105 3,891.331 3,880.263 3,882.323 66.861 0.000 3,949.184 200.000 4,149.184
Obligation Target
FOR OFFICIAL USE ONLY SM-1 Supply Management Activity Group - Retail
55

SM-4(Dollars in Millions)
Inventory StatusAir Force Working Capital Fund
Supply Management Activity Group - Retail
Fiscal Year (FY) 2011Budget Estimates
February 2010
Supply Management Activity Group - Retail FY 2009 Total Mobil Peacetime Operating Peacetime Other1. Inventory BOP 2,635.243 454.469 1,527.662 653.112
2. BOP Inventory Adjustments a. Reclassification Change (Memo) 0.000 0.000 0.000 0.000 b. Price Change Amount (Memo) (122.541) 5.485 (89.601) (38.426) c. Inv Reclassified & Repriced 2,507.218 459.954 1,438.063 614.686
3. Receipts at MAC 3,560.789 61.878 2,778.286 720.625
4. Sales at Standard (Cost of Goods Sold) 3,318.843 11.385 2,658.192 649.266
5. Inventory Adjustments a. Capitalization + or (-) (209.907) 38.911 (172.886) (75.932) b. Returns from Customers for Credit 3.041 1.191 1.850 0.000 c. Returns from Customers w/o Credit 592.184 0.000 416.069 176.115 d. Returns to Suppliers (-) (125.722) (0.883) (87.330) (37.509) e. Transfers to Property Disposal (-) (640.377) (6.619) (442.446) (191.313) f. Issues/Receipts w/o Reimbursement (26.527) 2.093 (19.019) (9.601) g. Other Adjustments 0.000 0.000 0.000 0.000 1. Destruct, Shrink, Deteriorations, etc. (21.450) (4.526) (16.599) (0.325) 2. Discounts on Returns (34.738) 0.000 (24.317) (10.421) 3. Trade-ins 0.000 0.000 0.000 0.000 4. Loss from Disaster 0.000 0.000 0.000 0.000 5. Assembly/Disassembly (7.926) (0.565) (5.154) (2.207) 6. Physical Inventory Adj 8.766 0.390 5.874 2.502 7. Accounting Adjustments 273.403 (10.380) 201.684 82.100 8. Shipment Discrepancies (62.502) (15.500) (32.553) (14.449) 9. Other Gains/Losses 73.977 0.000 61.442 12.536 10. Strata Transfers 0.000 0.000 0.000 0.000 11. Strata Transfers in Transit 0.000 0.000 0.000 0.000 12. Other Adjustments - Total 229.530 (30.581) 190.376 69.735 h. Total Adjustments (177.778) 4.112 (113.385) (68.505)
6. Inventory EOP 2,576.871 514.559 1,444.772 617.540
7. Inventory EOP, Revalued (MAC, Discounted) 2,576.871 514.559 1,444.772 617.540 a. Economic Retention (Memo) 0.000 0.000 0.000 0.000 b. Contingency Retention (Memo) 0.000 0.000 0.000 0.000 c. Potential DOD Reutilization (Memo) 0.000 0.000 0.000 0.000
8. Inventory on Order Cost EOP (Memo) 977.437 0.000 750.442 226.995
FOR OFFICIAL USE ONLY SM-4 Supply Management Activity Group - Retail
56

SM-4(Dollars in Millions)
Inventory StatusAir Force Working Capital Fund
Supply Management Activity Group - Retail
Fiscal Year (FY) 2011Budget Estimates
February 2010
Supply Management Activity Group - Retail
FY 2010 Total Mobil Peacetime Operating Peacetime Other1. Inventory BOP 2,576.871 514.559 1,444.772 617.540
2. BOP Inventory Adjustments a. Reclassification Change (Memo) 0.000 0.000 0.000 0.000 b. Price Change Amount (Memo) (28.490) 0.000 (19.940) (8.550) c. Inv Reclassified & Repriced 2,548.381 514.559 1,424.832 608.990
3. Receipts at MAC- Material Purchase Cost 3,629.605 64.054 2,853.351 712.200
4. Sales at Standard - Cost of Goods sold 3,403.444 0.000 2,742.244 661.200
5. Inventory Adjustments a. Capitalization + or (-) (369.182) 6.000 (262.663) (112.519) b. Returns from Customers for Credit 3.101 0.000 3.101 0.000 c. Returns from Customers w/o Credit 401.215 5.500 278.545 117.170 d. Returns to Suppliers (-) (90.200) (1.200) (62.300) (26.700) e. Transfers to Property Disposal (-) (388.348) (10.348) (264.600) (113.400) f. Issues/Receipts w/o Reimbursement (20.790) 6.700 (21.165) (6.325) g. Other Adjustments 0.000 0.000 0.000 0.000 1. Destruct, Shrink, Deteriorations, etc. (24.813) (23.000) (1.643) (0.170) 2. Discounts on Returns (18.000) 0.000 (12.000) (6.000) 3. Trade-ins 0.000 0.000 0.000 0.000 4. Loss from Disaster 0.000 0.000 0.000 0.000 5. Assembly/Disassembly (6.175) (0.375) (3.800) (2.000) 6. Physical Inventory Adj 23.390 0.400 15.990 7.000 7. Accounting Adjustments 241.245 (8.755) 175.000 75.000 8. Shipment Discrepancies (34.500) (12.500) (15.000) (7.000) 9. Other Gains/Losses 37.829 (5.500) 33.496 9.833 10. Strata Transfers 0.000 0.000 0.000 0.000 11. Strata Transfers in Transit 0.000 0.000 0.000 0.000 12. Other Adjustments - Total 218.976 (49.730) 192.043 76.663 h. Total Adjustments (245.228) (43.078) (137.039) (65.111)
6. Inventory EOP 2,529.314 535.535 1,398.900 594.879
7. Inventory EOP, Revalued (MAC, Discounted) 2,529.314 535.535 1,398.900 594.879 a. Economic Retention (Memo) 0.000 0.000 0.000 0.000 b. Contingency Retention (Memo) 0.000 0.000 0.000 0.000 c. Potential DOD Reutilization (Memo) 0.000 0.000 0.000 0.000
8. Inventory on Order Cost EOP (Memo) 997.712 0.000 750.995 246.717
FOR OFFICIAL USE ONLY SM-4 Supply Management Activity Group - Retail
57

SM-4(Dollars in Millions)
Inventory StatusAir Force Working Capital Fund
Supply Management Activity Group - Retail
Fiscal Year (FY) 2011Budget Estimates
February 2010
Supply Management Activity Group - Retail
FY 2011 Total Mobil Peacetime Operating Peacetime Other1. Inventory BOP 2,529.314 535.535 1,398.900 594.879
2. BOP Inventory Adjustments a. Reclassification Change (Memo) 0.000 0.000 0.000 0.000 b. Price Change Amount (Memo) (28.256) 0.000 (18.622) (9.634) c. Inv Reclassified & Repriced 2,501.058 535.535 1,380.278 585.245
3. Receipts at MAC 3,780.401 66.861 2,980.940 732.600
4. Sales at Standard 3,557.175 0.000 2,873.775 683.400
5. Inventory Adjustments a. Capitalization + or (-) 5.904 6.100 (0.175) (0.021) b. Returns from Customers for Credit 3.256 0.000 3.256 0.000 c. Returns from Customers w/o Credit 385.710 (5.600) 275.315 115.995 d. Returns to Suppliers (-) (82.260) (1.260) (56.700) (24.300) e. Transfers to Property Disposal (-) (375.760) (10.760) (255.500) (109.500) f. Issues/Receipts w/o Reimbursement (35.266) (6.700) (20.225) (8.341) g. Other Adjustments 0.000 0.000 0.000 0.000 1. Destruct, Shrink, Deteriorations, etc. (24.895) (23.000) (1.724) (0.171) 2. Discounts on Returns (20.586) 0.000 (14.586) (6.000) 3. Trade-ins 0.000 0.000 0.000 0.000 4. Loss from Disaster 0.000 0.000 0.000 0.000 5. Assembly/Disassembly (6.973) (0.395) (4.690) (1.888) 6. Physical Inventory Adj (4.451) 0.420 (3.239) (1.632) 7. Accounting Adjustments 69.956 (8.700) 55.059 23.597 8. Shipment Discrepancies (41.971) (12.500) (23.665) (5.806) 9. Other Gains/Losses 43.658 15.500 25.770 2.388 10. Strata Transfers 0.000 0.000 0.000 0.000 11. Strata Transfers in Transit 0.000 0.000 0.000 0.000 12. Other Adjustments - Total 14.713 (28.675) 32.900 10.488 h. Total Adjustments (83.678) (46.895) (21.104) (15.679)
6. Inventory EOP 2,640.606 555.501 1,466.339 618.766
7. Inventory EOP, Revalued (MAC, Discounted) 2,640.606 555.501 1,466.339 618.766 a. Economic Retention (Memo) 0.000 0.000 0.000 0.000 b. Contingency Retention (Memo) 0.000 0.000 0.000 0.000 c. Potential DOD Reutilization (Memo) 0.000 0.000 0.000 0.000
8. Inventory on Order Cost EOP (Memo) 986.282 0.000 737.426 248.856
FOR OFFICIAL USE ONLY SM-4 Supply Management Activity Group - Retail
58

SM-5B(Dollars in Millions)
Customer Price ChangeAir Force Working Capital Fund
Supply Management Activity Group - Retail
Fiscal Year (FY) 2011Budget Estimates
February 2010 Supply Management Activity Group - Retail
$ FY 2009 $ FY 2010 $ FY 2011FY 2009 Inflation FY 2010 Inflation FY 2011 Inflation
1. Net Sales @ Cost 3,476.336 3,413.905 3,791.503
Repair Cost 0.032 2.30% 0.033 2.30% 0.034 1.40% Buy Cost 3,476.304 2.57% 3,413.872 1.99% 3,791.469 2.17% 2. Less: Material Inflation Adjustment 87.260 66.663 82.337
3. Revised Net Sales @ Cost 3,389.077 3,347.242 3,709.165
Business Overhead Expenses 97.355 90.064 101.424Condemnations/Material Expense 0.000 0.000 0.000Cash/AOR Recovery 53.900 (52.847) (14.393)
4. Surcharge Dollars 151.255 37.217 87.031
5. Change to Customers a. Prev Year's Surcharge (%) 2.81% 4.35% 1.09%
b. This Year's Surcharge and MaterialInflation Divided by Revised Net Salesat Cost 7.04% 3.10% 4.57%
c. Percent Change to Customer 4.11% -1.20% 3.44%
FOR OFFICIAL USE ONLY SM-5B Supply Management Activity Group - Retail
59

SM-6(Dollars in Millions)
War Reserve Material (WRM) StockpileAir Force Working Capital Fund
Supply Management Activity Group - Retail
Fiscal Year (FY) 2011Budget Estimates
February 2010
Supply Management Activity Group - Retail FY 2009STOCKPILE STATUS Total WRM Protected WRM Other
1. Inventory BOP @ std 454.469 454.469 0.000
2. Price Change 5.485 5.485 0.000
3. Reclassification 0.000 0.000 0.000
4. Inventory Changes 77.375 77.375 0.000 a. Receipts @ std 63.069 63.069 0.000 (1). Purchases 61.878 61.878 0.000 (2). Returns from customers 1.191 1.191 0.000
b. Issues @ std 5.976 5.976 0.000 (1). Sales 11.385 11.385 0.000 (2). Returns to suppliers (0.883) (0.883) 0.000 (3). Disposals (4.526) (4.526) 0.000
c. Adjustments @ std 8.330 8.330 0.000 (1). Capitalizations 38.911 38.911 0.000 (2). Gains and losses 0.000 0.000 0.000 (3). Other (30.581) (30.581) 0.000
Inventory EOP 514.559 514.559 0.000
STOCKPILE COSTS
1. Storage 0.0002. Management 0.0003. Maintenance/Other 0.000Total Cost 0.000
WRM BUDGET REQUEST
1. Obligations @ cost 61.465 a. Additional WRM Investment 61.465 b. Replen/Repair WRM -Reinvest 0.000 c. Stock Rotation/Obsolescence 0.000 d. Assemble/Disassemble 0.000 e. Other 0.000Total Request 61.465
FOR OFFICIAL USE ONLY SM-6 Supply Management Activity Group - Retail
60

SM-6(Dollars in Millions)
War Reserve Material (WRM) StockpileAir Force Working Capital Fund
Supply Management Activity Group - Retail
Fiscal Year (FY) 2011Budget Estimates
February 2010
Supply Management Activity Group - Retail
FY 2010STOCKPILE STATUS Total WRM Protected WRM Other
1. Inventory BOP @ std 514.559 514.559 0.000
2. Price Change 0.000 0.000 0.000
3. Reclassification 0.000 0.000 0.000
4. Inventory Changes 20.976 20.976 0.000 a. Receipts @ std 69.554 69.554 0.000 (1). Purchases 64.054 64.054 0.000 (2). Returns from customers 5.500 5.500 0.000
b. Issues @ std (4.848) (4.848) 0.000 (1). Sales 0.000 0.000 0.000 (2). Returns to suppliers (1.200) (1.200) 0.000 (3). Disposals (3.648) (3.648) 0.000
c. Adjustments @ std (43.730) (43.730) 0.000 (1). Capitalizations 6.000 6.000 0.000 (2). Gains and losses (5.500) (5.500) 0.000 (3). Other (44.230) (44.230) 0.000
Inventory EOP 535.535 535.535 0.000
STOCKPILE COSTS
1. Storage 0.0002. Management 0.0003. Maintenance/Other 0.000Total Cost 0.000
WRM BUDGET REQUEST
1. Obligations @ cost 64.054 a. Additional WRM Investment 64.054 b. Replen/Repair WRM -Reinvest 0.000 c. Stock Rotation/Obsolescence 0.000 d. Assemble/Disassemble 0.000 e. Other 0.000Total Request 64.054
FOR OFFICIAL USE ONLY SM-6 Supply Management Activity Group - Retail
61

SM-6(Dollars in Millions)
War Reserve Material (WRM) StockpileAir Force Working Capital Fund
Supply Management Activity Group - Retail
Fiscal Year (FY) 2011Budget Estimates
February 2010
Supply Management Activity Group - Retail
FY 2011STOCKPILE STATUS Total WRM Protected WRM Other
1. Inventory BOP @ std 535.535 535.535 0.000
2. Price Change 0.000 0.000 0.000
3. Reclassification 0.000 0.000 0.000
4. Inventory Changes 19.966 19.966 0.000 a. Receipts @ std 61.261 61.261 0.000 (1). Purchases 66.861 66.861 0.000 (2). Returns from customers (5.600) (5.600) 0.000
b. Issues @ std (18.720) (18.720) 0.000 (1). Sales 0.000 0.000 0.000 (2). Returns to suppliers (1.260) (1.260) 0.000 (3). Disposals (17.460) (17.460) 0.000
c. Adjustments @ std (22.575) (22.575) 0.000 (1). Capitalizations 6.100 6.100 0.000 (2). Gains and losses 15.500 15.500 0.000 (3). Other (44.175) (44.175) 0.000
Inventory EOP 555.501 555.501 0.000
STOCKPILE COSTS
1. Storage 0.0002. Management 0.0003. Maintenance/Other 0.000Total Cost 0.000
WRM BUDGET REQUEST
1. Obligations @ cost 66.861 a. Additional WRM Investment 66.861 b. Replen/Repair WRM -Reinvest 0.000 c. Stock Rotation/Obsolescence 0.000 d. Assemble/Disassemble 0.000 e. Other 0.000Total Request 66.861
FOR OFFICIAL USE ONLY SM-6 Supply Management Activity Group - Retail
62

AIR FORCE WORKING CAPITAL FUND
UNITED STATES TRANSPORTATION COMMAND
63

TWCF Budget Analysis Overview
United States Transportation Command Transportation Working Capital Fund Fiscal Year (FY) 2011 Budget Analysis
Background This submission provides justification for the United States Transportation Command (USTRANSCOM) Transportation Working Capital Fund (TWCF) budget. The Secretary of Defense has designated the Commander, United States Transportation Command (CDR USTRANSCOM) as the single Department of Defense (DOD) manager for the Defense Transportation System (DTS) in peace and war. As such, all common-user transportation assets are under the command authority of CDR USTRANSCOM, except for Service-unique or theater-assigned assets. As designated in 2003, re-designated in 2006, codified in the 2006 Unified Command Plan, and now institutionalized in DOD instructions, USTRANSCOM is the DOD’s Distribution Process Owner (DPO), charged with improving the overall efficiency and interoperability of distribution related activities to include deployment, sustainment, and redeployment. USTRANSCOM submits the TWCF budget as a distinct subset of the Air Force Working Capital Fund (AFWCF) budget submission. It reflects the cost authority needed to meet peacetime operations, Overseas Contingency Operations, and the surge/readiness requirements to support the National Military Strategy. Capital funding supports the Department's In-Transit Visibility and Command and Control needs, facilitating continuous process improvement and modernization. Composition of Component Business Areas USTRANSCOM’s mission is to provide air, land, and sea transportation for the Department of Defense (DOD) in time of peace and war, with a primary focus on wartime readiness. Our $12.6 billion budget provides synchronized transportation and sustainment, making it possible to project and maintain national power where needed, with the greatest speed and agility, the highest efficiency, and the most reliable level of trust and accuracy. We accomplish our joint mission through our three Component Commands— Air Mobility Command (AMC), Military Sealift Command (MSC), and Military Surface Deployment and Distribution Command (SDDC). This joint team of transportation components provides mobility forces and assets for a seamless transition from peace to war. USTRANSCOM is always ready to meet the strategic mobility needs of our nation. A brief description of the role of each Component follows:
64

TWCF Budget Analysis Overview
Air Mobility Command serves as the single DOD manager for the nation’s airlift services and maintains the worldwide airlift system in a constant state of readiness. AMC’s mission directly affects the readiness and sustainability of deployed forces throughout the world as well as the nation's ability to project forces quickly. Airlift capacity generated by the military airlift readiness training program and augmentation from commercial Civil Reserve Air Fleet carriers is used to satisfy requirements. AMC also manages Service-unique airlift assets for the Department of the Air Force. Military Sealift Command provides sealift support for the Department for both emergent and peacetime requirements. MSC obtains the majority of its sealift capacity through contracts and government owned/contract operated vessels. MSC also manages Service-unique sealift assets for the Department of the Navy. Surface Deployment and Distribution Command is the single defense manager for traffic management, land transportation, common-user ocean terminals, and common-user intermodal container management during peacetime and war. SDDC manages surface freight movement, personal property shipment, and passenger traffic worldwide. SDDC also manages Service-unique assets for the Department of the Army. Our components provide the critical link to the Services’ core competencies in organizing, training, and equipping forces. They provide lines of communication to the Services, ensuring assets are available when needed for the transition from peace to war. The surge from peacetime sustainment to a massive deployment of people and material in support of Overseas Contingency Operations is the most recent example of our ability to execute our mission. Our successes result from the synergy of military and commercial lift (air, land, and sea), air refueling, port operations, and afloat prepositioning—all requiring the team efforts of the Commander’s Staff and our components.
65

TWCF Budget Analysis Overview
Budget Highlights One of DOD’s highest priority goals is to maintain a robust and responsive defense transportation and distribution system as a critical element of America's national security strategy for rapid power projection and sustainment. USTRANSCOM's ability to move and sustain sufficient numbers of U.S. forces, equipment, and supplies, often at a moment’s notice, enables us to defend vital national interests anywhere in the world. Additionally, USTRANSCOM’s efforts as the DOD DPO to improve joint logistics support continue to expand and produce results. Working with the DOD, regional combatant commands, agencies, and the Services, USTRANSCOM is leading the collaborative effort to make joint logistics a reality – leveraging experience and using information technology to consolidate logistics requirements in real time, compress the decision cycle, and continually improve response capabilities supporting our diverse customers and requirements. USTRANSCOM is synchronizing the deployment, distribution, and sustainment of forces to achieve maximum efficiency and interoperability by eliminating duplication and standardizing practices. Working with our Joint Deployment and Distribution Enterprise partners, USTRANSCOM has implemented initiatives such as the Joint Task Force-Port Opening (JTF-PO), which will dramatically improve port activation processes and timelines. The Defense Transportation Coordination Initiative (DTCI) is providing visibility of CONUS freight movement, enabling load consolidation, increased use of cost effective intermodal solutions and intelligent scheduling. Combining our command-wide analytical capabilities, USTRANSCOM established the Joint TWCF Billing Center and the Joint Distribution Process Analysis Center (JDPAC). Creating further economies, the JDPAC will function as the major focal point for analyzing, modeling, understanding, and resolving complex logistics issues through the application of state-of-the-art research, decision support tools, and best practices to distribution, deployment, and sustainment operations. Together with its components and national partners, USTRANSCOM is building a truly seamless, end-to-end defense logistics enterprise. Our support for the Overseas Contingency Operations (OCO) dominates the cost changes from FY 2009 to FY 2011. We are on track with our Base Realignment and Closure (BRAC) plan to save the taxpayer $1.2 billion over the next 20 years. SDDC, our Army component command, moved to Scott Air Force Base in FY 2007. This realignment has facilitated consolidation savings plus fused operations. FY 2009 data are actuals while FY 2010 and FY2011 contain Overseas Contingency Operations assumptions.
66

TWCF Budget Analysis Overview
Economies and Efficiencies
Productivity and Cost Avoidance Initiatives and Organizational Streamlining: Since 1994, USTRANSCOM productivity and cost avoidance initiatives and organizational streamlining efforts have resulted in savings of over $2.0 billion. These include:
− Renegotiating ship contracts − Reducing ship testing periods − Devising fuel savings techniques for ship charters and military aircraft − Operating aircraft channels and utilizing aircraft more efficiently − Scrubbing asset maintenance requirements to ensure only minimum required expenditures − Revising flying hour models to reduce flying hours − Reducing commercial airlift by using organic seat-pallet equipped C-17s − Phasing out unneeded commercial air passenger and cargo capacity − Reengineering strategic airlift − Eliminating redundancies between components − Accelerating implementation of BRAC actions − Rightsizing port infrastructure − Consolidating command headquarters − Streamlining organizational structures − Implementing cost savings initiatives − Making greater use of “partial planeload” charters (chartering a portion of commercial aircraft’s space), and relying less
on chartering an entire aircraft’s capacity when not needed − Improving container utilization on ocean liner missions
67

TWCF Budget Analysis Overview
Distribution Process Owner (DPO) Cost Avoidance Initiatives: Since USTRANSCOM’s designation as DPO, in 2004 through September 2009, the DPO has validated $3.2 billion in cost avoidance initiatives. The savings accrue to the DOD budget (primarily contingency supplementals) and have allowed the Services to purchase other high priority items. Initiatives include:
− Shifting transportation modes from air to sea and truck to rail − Canceling redundant orders or contracts due to supply system interventions − Identifying and returning lost transportation equipment to the supply system − Canceling redundant refrigerated container contracts − Comparing non-standard transportation mode rates prior to awarding contracts − Creating an in-field repair capability for airlift pallets − Opening of a Defense Distribution Center Depot in Kuwait − Leveraging opportune lift to avoid dedicated contract move of equipment supporting Hurricane Katrina relief − Developing tools that highlight the heaviest and bulkiest cargo moving in standard distribution pipelines to Operation
Iraqi Freedom/Operation Enduring Freedom (OIF/OEF) which are being used to challenge requests to move those items by airlift
− Engaging Services early in deployment process to maximize use of sealift − Making greater use of “partial planeload” charters (chartering a portion of commercial aircraft’s space), and relying less
on chartering an entire aircraft’s capacity when not needed − Improving container utilization on ocean liner missions
68

TWCF Budget Analysis Overview
Costs
COST ($ IN MILLIONS) FY 2009 FY 2010 FY 2011AMC $8,325 $9,472 $9,357MSC $950 $822 $908SDDC $2,568 $2,669 $2,366Defense Courier Division (DCD) $13 $12 $11Total $11,856 $12,975 $12,642
FY 2010 in the FY 2010 PB – FY 2010 Current Estimate: Total USTRANSCOM: Cost increased in FY 2010 by $3,141 million, major changes are listed below: − +$2,017 million – Workload Increase − +$842 million – Fuel Pricing* − +$326 million – Price Changes and Change in Commodity Mix − +$12 million – Defense Personal Property Increase − +$11 million – Automated Data Processing Equipment Adjustment − ($24) million – DPO Strategic Opportunities − ($23) million – Decreased Depot Maintenance/Contractor Logistics Support − ($20) million – Other
*The FY 2010 prices for fuel in this submission are calculated using the current fuel composite rate of $118.02 per barrel versus the FY 2010 President's Budget rate of $89.46. This will result in a projected revenue shortfall of $842 million; $734 million of this amount is being requested as a direct Working Capital Fund (WCF) appropriation in the FY 2010 supplemental and the remainder will be handled from either WCF cash balances or through an additional customer surcharge.
69

TWCF Budget Analysis Overview
FY 2010 – FY 2011: Total USTRANSCOM: Cost decreased in FY 2011 by $333 million, major changes are listed below: − ($592) million – Workload Decrease − ($24) million – DPO Strategic Opportunities − ($4) million – Other − +$224 million – Other Pricing Changes/Commercial Transportation Pricing − +$63 million – Fuel
Revenue
REVENUE ($ IN MILLIONS) FY 2009 FY 2010 FY 2011AMC $8,944 $9,259 $9,087MSC $1,011 $706 $903SDDC $2,139 $2,693 $2,315DCD $11 $12 $12Total $12,105 $12,670 $12,317
Revenue: Revenue estimates are derived by using approved stabilized rates multiplied by various workload measures (i.e., flying hours, ton miles, passenger miles, ship days, measurement tons, and vehicles). While workload can vary widely, prices established during the budget process generally remain fixed during the year of execution. However, to avoid excessive build up or depletion of cash balances that have taken place in the recent past, USTRANSCOM rates can be adjusted to maintain AFWCF solvency or to prevent the buildup of excess cash. Another source of revenue for USTRANSCOM is the Air Force Airlift Readiness Account (ARA). The ARA is funded by the Air Force for military-unique costs of airlift operations. AMC’s airlift system is structured to meet readiness requirements, resulting
70

TWCF Budget Analysis Overview
in additional costs not incurred by the commercial sector. The ARA represents an additional source of funding to cover the gap between the TWCF readiness-driven expenses and commercially competitive rate revenue. The ARA requirement is based on the calculated difference between budgeted TWCF costs less anticipated revenue based on commercial transportation rates. Air Force partially funded the ARA at $315 million for FY 2010 and $184 million for FY 2011.
Net Operating Result (NOR) / Accumulated Operating Result (AOR)
NOR/AOR ($ IN MILLIONS) FY 2009 FY 2010 FY 2011NOR $249 -$305 -$324Ending AOR $340 $28 $0
TOTAL FY 2010 USTRANSCOM OPERATING RESULT: FY 2010 President’s Budget estimated operating result was a negative $282 million. The current FY 2010 estimate is a negative $305 million, a decrease of $23 million.
− ($487) million – Fuel Changes − ($343) million – Commercial Transportation Pricing − ($27) million – Other − +$785 million – Workload Increase − +$25 million – Increased Depot Maintenance/Contractor Logistics Support − +$24 million – DPO Strategic Opportunities
FY11 OPERATING RESULT: FY11 operating result brings USTRANSCOM to zero accumulated operating result by FY 2011 in accordance with Working Capital Fund policy.
71

TWCF Budget Analysis Overview
Disbursements, Collections, and Net Outlays
($ IN MILLIONS) FY 2009 FY 2010 FY 2011Disbursements $11,639 $13,082 $12,640Collections $11,926 $12,834 $12,387Net Outlays ($287) $248 $253Ending Cash Balance $712 $464 $2117 Day Cash Goal $459 $505 $475
Cash decreased from FY 2009-FY 2010 due to fuel price increases. Workload and fuel price volatility make cash projections difficult. The estimate for FY 2011 will reduce the possibility of a build-up of excess cash in the Fund. If necessary, the Department will take steps to maintain adequate cash.
Unit Cost
AMC UNIT COST
FY 2009 FY 2010 FY 2011
Channel Passenger (million PAX miles) $369,183 $548,812 $530,336Channel Cargo (million ton miles) $2,152,264 $2,515,925 $2,591,051SAAM/JCS (million ton miles) $1,172,726 $1,403,481 $1,430,307Training (cost per flying hour) --- C-5 $30,601 $34,373 $34,451 --- C-17 $16,055 $16,704 $17,074
72

TWCF Budget Analysis Overview
MSC UNIT COST
FY 2009 FY 2010 FY 2011
Petroleum Tanker Ship Days $51,014 $48,189 $44,474Surge Full Operating Status (FOS) Ship Days
$131,250 $80,750 $141,000
Surge Reduced Operating Status (ROS) Ship Days
$23,387 $24,687 $26,493
Army Afloat Prepo Ship Days $31,282 $54,309 $62,164Air Force Afloat Prepo Ship Days $45,191 $47,945 $44,247Defense Logistics Agency (DLA) Afloat Prepo Ship Days
$41,096 $49,589 $50,000
Chartered Cargo per Diem Days $50,579 $55,450 $49,711
SDDC UNIT COST
FY 2009 FY 2010 FY 2011
Cargo Operations (measurement ton) $25.50 $23.67 $24.20Global POV (vehicle) $3,350.00 $3,421.00 $3,475.00Liner Ocean Transportation (measurement ton)
$170.11 $190.19 $186.67
DCD UNIT COST
FY 2009 FY 2010 FY 2011
Cost per pound delivered $9.21 $8.07 $7.67
Workload
73

TWCF Budget Analysis Overview
AMC WORKLOAD
FY 2009 FY 2010 FY 2011
Channel Passenger (million PAX miles) 703 669 779Channel Cargo (million ton miles) 1,024 994 994SAAM/JCS (million ton miles) 4,263 4,042 3,790Training-C-5 (flying hours) 3,094 3,690 3,690Training-C-17 (flying hours) 25,366 27,814 27,814
MSC WORKLOAD
FY 2009 FY 2010 FY 2011
Petroleum Tanker Ship Days 3,009 3,009 4,162Surge FOS Ship Days 400 400 400Surge ROS Ship Days 4,015 3,832 3,650Army Afloat Prepositioning Ship Days 3,104 3,075 3,650Air Force Afloat Prepositioning Ship Days
759 730 730
DLA Afloat Prepositioning Ship Days 730 730 730Chartered Cargo Ship Days 3,539 2,945 2,945
SDDC WORKLOAD
FY 2009 FY 2010 FY 2011
Cargo Operations (measurement ton) 11,278,158 10,244,432 10,244,432Global POV (vehicle) 63,673 72,000 72,000Liner Ocean Transportation (measurement ton)
11,551,000 10,846,331 9,408,000
74

TWCF Budget Analysis Overview
DCD WORKLOAD
FY 2009 FY 2010 FY 2011
Pounds Delivered 1,378,750 1,500,000 1,500,000
Customer Rate Changes
AMC RATE CHANGES
FY 2009 FY 2010 FY 2011
Channel Passenger 2.1% 4.9% 1.6%Channel Cargo 2.0% 4.0% 1.6%SAAM/JCS 11.8% -8.2% 12.0%Training 9.7% -17.3% 10.7%
MSC RATE CHANGES
FY 2009 FY 2010 FY 2011
Petroleum Tankerships -5.7% -28.0% -3.3%Surge FOS 11.3% -43.9% 26.2%Surge ROS -20.9% 3.5% 5.7%Army Afloat Prepositioning -10.5% -2.8% 5.2%Air Force Afloat Prepositioning 18.5% -21.3% -7.7%DLA Afloat Prepositioning 20.2% -0.3% -40.0%Chartered Cargo -6.1% 10.0% 15.4%
SDDC RATE CHANGES
FY 2009 FY 2010 FY 2011
Cargo Operations -9.9% 39.7% -22.1%Global POV 7.6% 3.7% +2.4%Liner Ocean Transportation -25.0% 34.1% -1.3%
75

TWCF Budget Analysis Overview
DCD RATE CHANGES
FY 2009 FY 2010 FY 2011
Pounds Delivered 11.6% 2.3% -3.9%
Capital Purchase Program
This budget enables USTRANSCOM to continue system enhancements and upgrades to ensure readiness for the 21st century. Our Capital Purchase Program (CPP) includes investment in Equipment, Automated Data Processing Equipment (ADPE) and Telecommunications Equipment, Software Development, and Minor Construction. The CPP also enables the Distribution Process Owner (DPO) to rapidly produce or modify software/ADPE applications to meet emerging distribution portfolio requirements. The Distribution Portfolio Manager (DPFM) recommends capability-based decisions on whether to develop, combine, modify, or terminate DOD distribution related systems. Integrated Data Environment/Global Transportation Network Convergence (IGC) Defense Enterprise, Automated Transportation for the 21st Century (AT21), Defense Personal Property System (DPS), Defense Enterprise Accounting and Management System (DEAMS), and Global Air Transportation Execution System (GATES) are our major CPP transformational system efforts. USTRANSCOM and Defense Logistics Agency (DLA) have partnered with assistance from OSD, Joint Staff, Combatant Commands (COCOMs), Services, and Agencies to establish IGC. IGC will provide common integrated supply chain, logistics, and distribution related data and application services enabling cohesive distribution solutions with a global perspective for the warfighter. The IGC effort will increase logistics information sharing across the DOD to achieve end-to-end visibility. AT21 will provide the Joint Deployment Distribution Enterprise (JDDE) the capability to optimize end-to-end delivery of forces to maximize on-time delivery at the lowest overall transportation cost. AT21 will also optimize end-to-end delivery of sustainment to maximize time-definite delivery at the lowest overall supply chain cost. DPS funding provides key functionality and usability needed for users to move their personal property and corrects issues and deficiencies identified by the users and Services. DEAMS will transform business and financial management processes and systems to provide accurate, reliable, and timely business information to support effective business decision making for USTRANSCOM.
76

TWCF Budget Analysis Overview
CPP ($ IN MILLIONS) FY 2009 FY 2010 FY 2011Equipment 8.0 .9 2.4ADPE and Telecom Equip 16.6 30.3 38.1Software Development 112.6 154.4 111.2Minor Construction 10.4 10.7 11.3Total 147.6 196.3 163.0
Manpower Trends USTRANSCOM’s staffing is comprised of approximately 76 percent military and 24 percent civilian.
Military End Strength and Workyears
FY 2009 FY 2010 FY 2011Army 186 243 244Navy 152 178 177Marine Corps 10 13 12Air Force 12,117 13,462 13,454Total Military End Strength 12,465 13,896 13,887Total Military Workyears 12,352 12,392 12,391
Civilian End Strength
77

TWCF Budget Analysis Overview
FY 2009 FY 2010 FY 2011
U.S. Direct Hire 3,739 3,753 3,873Foreign National Direct Hire 184 215 210Foreign National Indirect Hire 406 423 423Total Civilian End strength 4,329 4,391 4,506
Civilian Full-Time Equivalents
FY 2009 FY 2010 FY 2011U.S. Direct Hire 3,739 3,722 3,842Foreign National Direct Hire 182 213 208Foreign National Indirect Hire 406 419 419Total Civilian FTEs 4,327 4,354 4,469
FY10 in the FY10 PB – FY10 Current Estimate:
- No change FY 2010 – FY 2011:
- Military to civilian conversions at MSC and USTRANSCOM Staff - Contractor to civilian conversions at SDDC and USTRANSCOM Staff
Performance Measures Air Mobility Command:
− Number of Pallets – GOAL: 92%; FY 2009 ACTUAL: 94% - Percentage of pallet positions offered versus used on CONUS outbound channel cargo missions
78

TWCF Budget Analysis Overview
− Pure Pallets – GOAL: 100%; FY 2009 ACTUAL: 98% -Quantity and percentage of aerial port-built pure pallets compliant with route plans
Military Sealift Command: − On-Time Pickup or Delivery – GOAL: 95%; FY 2009 ACTUAL: 95% - Percentage of shipments that meet required lift
dates or delivery dates based on predetermined agreed upon lift and delivery requirements as established by the customer − Ship Availability – GOAL: 95%; FY 2009 ACTUAL: 95% - Days against plan that ships are actually available to perform
their intended function Surface Deployment and Distribution Command: − Customer Satisfaction (Customer and Industry) – GOAL: 80%; FY 2009 ACTUAL: 80% - Measured with an annual survey.
Percent of ratings of “strongly agree” or “agree”. − Contract Compliance – GOAL: 96%; FY 2009 ACTUAL: 96% - Measures Required Delivery Date (RDD) and Electronic
Data Interchange (EDI) requirements for ocean, rail, and motor modes. Measures percent of shipments delivered on or before customer’s RDD and percent of shipments for which carrier submitted the required EDI transactions.
− Surface Movement (Unit Moves / Sustainment Intermodal Distribution Lanes (IDLs)) – GOAL: 97% Unit Moves, 85%
Sustainment IDLs; FY 2009 ACTUAL: 97% Unit Moves, 85% Sustainment IDLs – Unit Moves: Tracks percentage of shipments outgating (leaving) Port of Debarkation (POD) within X days of Latest Arrival Date (LAD). Sustainment IDLs: Determines if transporter segment of IDL meets lane-specific negotiated standard.
Overseas Contingency Operations Direct Appropriations
79

TWCF Budget Analysis Overview
($ IN MILLIONS)
FY 2010 FY 2011Transportation of Fallen Heroes $15.3 $15.0 Fuel Price Increase $734.5DPO Strategic Opportunities—Container Deconsolidation $2.0
Fallen Heroes - The National Defense Authorization Act 2007, Section 562 requires the use of military or military contracted aircraft to transport Service members killed in combat operations from Dover Port Mortuary, Delaware to their final destination. Funds are needed to provide this dedicated contract airlift. Impact if not funded: If not funded, the military contract option will cease and operations will have to revert back to commercial airlift, thus not providing a dignified and direct service benefiting the family. Fuel Price Increase - Funds most of the projected increase in the price for fuel for FY 2010. Impact if not funded - Inadequate funding of fuel puts the TWCF at risk of a negative cash balance. Container Deconsolidation - Funding is required to perform deconsolidation functions at Defense Distribution Depot Kuwait/Southwest Asia (DDKS), Defense Distribution Depot Europe ( DDDE) and Central Receiving and Shipping Point (CRSP). Currently, only pure containers are shipped to these locations. This initiative consolidates pure containers into mixed containers resulting in higher container utilization and reduced costs. Once consolidated, the mixed containers must then be deconsolidated in theater for forward movement. The funding required provides resources to manage this deconsolidation. Impact if not funded - Projected enterprise performance improvements and savings will be significantly delayed if this Distribution Process Owner Strategic Opportunities (DSO) initiative is not funded.
80

Fund 2(Dollars in Millions)
Changes in the Cost of OperationAir Force Working Capital Fund
TWCF
Fiscal Year (FY) 2011Budget Estimates
February 2010Expenses
FY 2009 Actuals: $11,856.0
FY 2010 Estimate in President's Budget: $9,833.7
Estimated Impact in FY 2010 of ActualFY 2009Experience: $0.0
Pricing Adjustments: $1,182.7a. FY 2010 Pay Raise $0.0
(1) Civilian Personnel $0.0(2) Military Personnel $0.0
b. Annualization of Prior Year Pay Raises $0.0(1) Civilian Personnel $0.0(2) Military Personnel $0.0
c. Fuel Pricing $842.3d. Commercial Transportation Pricing Changes $326.2e. Increased Depot Maintenance $15.7f. General Purchase Inflation ($1.5)
Productivity Initiatives & Other Efficiencies: ($27.3)a. DPO Strategic Opportunities ($23.8)b. Reduced Air Transport Use ($3.5)
Program Changes: $1 985 7Program Changes: $1,985.7a. Workload Changes $2,017.3b. Defense Personal Property Increase $12.0c. ADPE $10.5d. Depot Maintenance/Contractor Logistics Support ($39.2)e. Other ($14.9)
FY2010 Current Estimate: $12,974.8
Fund 2, TWCFFor Official Use Only
81

Fund 2(Dollars in Millions)
Changes in the Cost of OperationAir Force Working Capital Fund
TWCF
Fiscal Year (FY) 2011Budget Estimates
February 2010Expenses
FY2010 Current Estimate: $12,974.8
Pricing Adjustments: $322.8a. FY 2011 Pay Raise $4.4
(1) Civilian Personnel $3.9(2) Military Personnel $0.5
b. Annualization of Prior Year Pay Raises $2.0(1) Civilian Personnel $1.9(2) Military Personnel $0.1
c. Commercial Transportation Pricing Changes $185.0d. Fuel Pricing $98.8e. General Purchase Inflation $32.6
Productivity Initiatives & Other Efficiencies: ($30.3)a. DPO Strategic Opportunities ($23.6)b. Cost Efficiencies ($3.8)c. BRAC Savings ($2.3)d. Reduced Air Transport Use ($0.6)
Program Changes: ($625.8)a. Workload Changes ($592.0)b. Fuel ($36.3)c. Other $2.5
FY 2011 Estimate: $12,641.5
Fund 2, TWCFFor Official Use Only
82

Fund 11(Dollars in Millions)
Source of New Orders and RevenueAir Force Working Capital Fund
Transportation
Fiscal Year (FY) 2011Budget Estimates
February 2010
FY2009 FY2010 FY2011
a. Orders from DOD Components 11057.3 11886 11487.3
Air Force 3295.1 3331.4 3305.3 Miltary Personnel 155.4 183 185.1 Missile Procurement 0.2 0.2 0.2 Other Procurement 15.7 15.7 16.5 Operations and Maintenance 2858.8 2895 2842.3 ANG, O&M 23.1 19.9 21.7 AFRES, O&M 236.6 211.2 233.9 RDT&E 3.1 2.7 2.9 Other 2.2 3.7 2.7
Army: 5657.6 6173.4 5834.7 Miltary Personnel 148.5 228.8 230.1 Other Procurement 89.6 207.6 195.3 AAFES 51.2 62.7 103.4 Operations and Maintenance 5311.4 5615.1 5252.5 NG, O&M 10.6 12.3 10.8 Army Reserve 13.9 16 7.5 RDT&E 13 27.2 31.6 Other 19.4 3.7 3.5
1. New Orders
Navy: 1143.4 1301.1 1257.9 Military Personnel 59.1 75.4 78.5 Aircraft Procurement 3.9 3.5 3.8 NEXCOM 0 12 10.5 Operations and Maintenance 981.2 1112.3 1068.8 NG, O&M 0.5 0.4 0.4 NDSF 81.5 77.1 77.5 RDT&E 4.7 3.6 4 Other 12.5 16.8 14.4
For Official Use Only Exhibit Fund - 11 Source of Revenue
83

Fund 11(Dollars in Millions)
Source of New Orders and RevenueAir Force Working Capital Fund
Transportation
Fiscal Year (FY) 2011Budget Estimates
February 2010
FY2009 FY2010 FY2011
Marines: 338 420 380.5 Military Personnel 101.6 105.6 105.5 Operations and Maintenance 235.2 313.3 273.7 Other 1.2 1.1 1.3
OSD: 623.2 660.1 708.9 Operations & Maintenance: 621.8 646 696.6 JCS 109.9 184.4 200.3 SOCOM 193.2 191.1 203.3 NSA 4.9 4.9 4.9 DIA 0.2 0.2 0.2 Other 309.1 252.9 280.3 DLA (Non-WCF) 4.5 12.5 7.6 Procurement 0.1 3.4 3.1 Other 1.3 10.7 9.2
b. Orders from other Fund Activity groups 635.3 471 531.5 DECA 19.9 43.1 41.6 DLA 55.9 100.6 75.8 Other 559.5 327.3 414.1
c. Total DoD 11692.6 12357 12018.8
d Other Orders: 412 4 313 3 298 6 d. Other Orders: 412.4 313.3 298.6 Other Federal Agencies 17.5 37.4 36.1 Trust Fund 82.1 80.1 87 Non Federal Agencies 49.8 52 52 Foreign Military Sales 263 143.8 123.5
Total New Orders 12105 12670.3 12317.4
2. Carry-In Orders 0 0 0
3. Total Gross Orders 12105 12670.3 12317.4
4. Funded Carry-over 0 0 0
5. Total Gross Sales 12105 12670.3 12317.4
For Official Use Only Exhibit Fund - 11 Source of Revenue
84
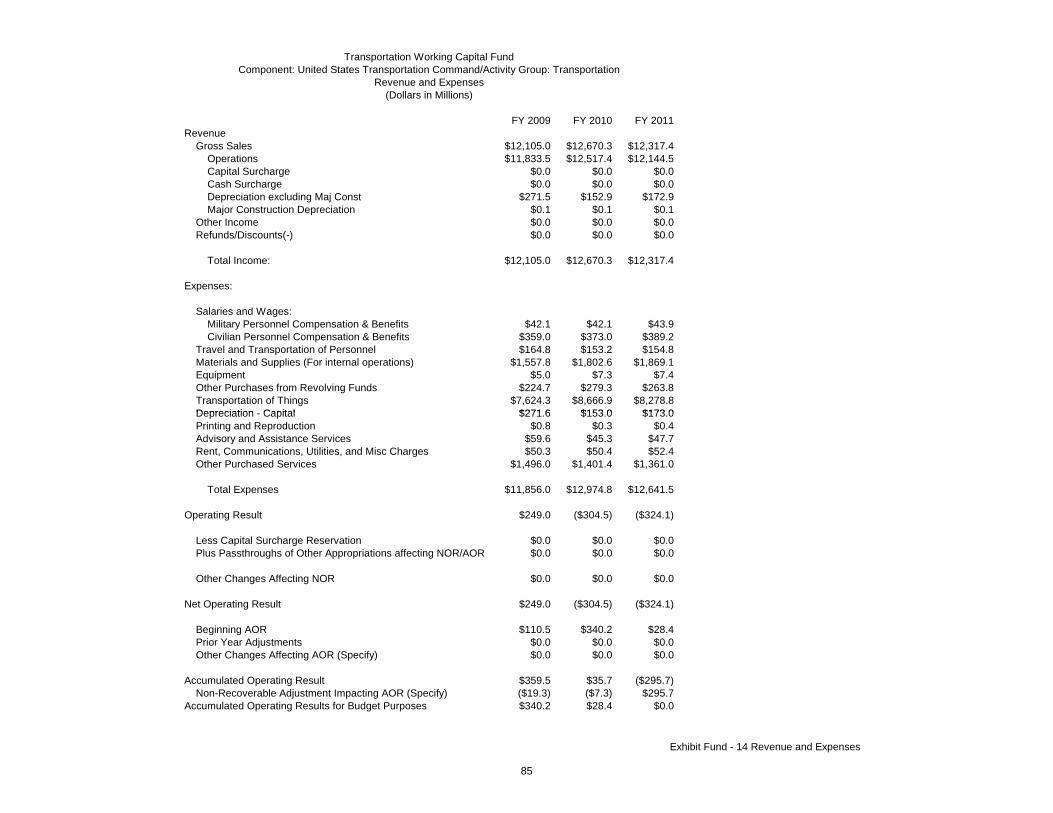
FY 2009 FY 2010 FY 2011
Gross Sales $12,105.0 $12,670.3 $12,317.4 Operations $11,833.5 $12,517.4 $12,144.5 Capital Surcharge $0.0 $0.0 $0.0 Cash Surcharge $0.0 $0.0 $0.0 Depreciation excluding Maj Const $271.5 $152.9 $172.9 Major Construction Depreciation $0.1 $0.1 $0.1 Other Income $0.0 $0.0 $0.0 Refunds/Discounts(-) $0.0 $0.0 $0.0
Total Income: $12,105.0 $12,670.3 $12,317.4
Military Personnel Compensation & Benefits $42.1 $42.1 $43.9 Civilian Personnel Compensation & Benefits $359.0 $373.0 $389.2 Travel and Transportation of Personnel $164.8 $153.2 $154.8 Materials and Supplies (For internal operations) $1,557.8 $1,802.6 $1,869.1 Equipment $5.0 $7.3 $7.4 Other Purchases from Revolving Funds $224.7 $279.3 $263.8 Transportation of Things $7,624.3 $8,666.9 $8,278.8
Depreciation Capital $271 6 $153 0 $173 0
Transportation Working Capital FundComponent: United States Transportation Command/Activity Group: Transportation
Revenue and Expenses(Dollars in Millions)
Revenue
Expenses:
Salaries and Wages:
Depreciation - Capital $271.6 $153.0 $173.0 Printing and Reproduction $0.8 $0.3 $0.4 Advisory and Assistance Services $59.6 $45.3 $47.7 Rent, Communications, Utilities, and Misc Charges $50.3 $50.4 $52.4 Other Purchased Services $1,496.0 $1,401.4 $1,361.0
Total Expenses $11,856.0 $12,974.8 $12,641.5
Operating Result $249.0 ($304.5) ($324.1)
Less Capital Surcharge Reservation $0.0 $0.0 $0.0 Plus Passthroughs of Other Appropriations affecting NOR/AOR $0.0 $0.0 $0.0
Other Changes Affecting NOR $0.0 $0.0 $0.0
Net Operating Result $249.0 ($304.5) ($324.1)
Beginning AOR $110.5 $340.2 $28.4 Prior Year Adjustments $0.0 $0.0 $0.0 Other Changes Affecting AOR (Specify) $0.0 $0.0 $0.0
Accumulated Operating Result $359.5 $35.7 ($295.7) Non-Recoverable Adjustment Impacting AOR (Specify) ($19.3) ($7.3) $295.7 Accumulated Operating Results for Budget Purposes $340.2 $28.4 $0.0
Exhibit Fund - 14 Revenue and Expenses
85
THIS PAGE INTENTIONALLY LEFT BLANK
86

AIR FORCE WORKING CAPITAL FUND
CAPITAL BUDGET
87

Fund 9A(Dollars in Millions)
Capital Investment SummaryAir Force Working Capital Fund
Consolidated Sustainment Activity Group (CSAG)
Fiscal Year (FY) 2011Budget Estimates
February 2010
CSAG
Line Number Item Description Quantity Total Cost Quantity Total Cost Quantity Total Cost
EQUIPMENT 86 79.348 61 126.489 51 132.050 Maintenance Division 86 79.348 61 126.489 51 132.050 Supply Division 0 0.000 0 0.000 0 0.000
*DEPOT MAINTENANCE TRANSFORMATION (DMT) 33 77.619 0 0.000 0 0.000
ADPE & TELECOM 4 2.352 6 6.626 7 8.864 Maintenance Division 3 2.051 4 4.561 4 4.692 Supply Division 1 0.301 2 2.065 3 4.171
SOFTWARE DEVELOPMENT 4 7.783 5 10.489 5 8.618 Maintenance Division 0 0.000 0 0.000 0 0.000 Supply Division 4 7.783 5 10.489 5 8.618
MINOR CONSTRUCTION 27 6.553 11 6.935 12 6.919 Maintenance Division 27 6.553 11 6.935 12 6.919 Supply Division 0 0.000 0 0.000 0 0.000
TOTAL 154 173.655 83 150.539 75 156.451
2009 2010 2011
FOR OFFICIAL USE ONLY Fund 9A CSAG
Total Capital Outlay 150.146 124.640 156.862Total Depreciation Expense 161.955 128.887 162.820
*Total DMT Budget for FY09 is $83.4 million. In addition to the $77.6 million shown above, $5.8 million was obligated in the operational authority program.
FOR OFFICIAL USE ONLY Fund 9A CSAG
88

Fund 9B(Dollars in Millions)
Capital Investment JustificationAir Force Working Capital Fund
Consolidated Sustainment Activity Group (CSAG)
Fiscal Year (FY) 2011Budget Estimates
February 2010
CSAG Maintenance Division - Organic
Department of the Air ForceDepot Maintenance
FY 2009 FY 2010 FY2011Element of Cost Unit Total Unit Total Unit Total
Qty Cost Cost Qty Cost Cost Qty Cost CostEquipment-WSS 1 71,516.000 71,516.000 1 122,589.000 122,589.000 1 126,086.000 126,086.000
Activity Group Capital Investment Justification ($ in Thousands)
Line Number Activity IdentificationEquipment - Weapon System HQ AFMC
Narrative Justification:This capability represents an array of capital equipment investment requirements that aligns with the overall Air Force strategic objectives for sustaining depot facilities and equipment. Projects are in direct support of Aircraft, Missiles, Engines, Exchangeable, or other Depot mission and are designed, scheduled, and installed in accordance with established Air Logistics or Aerospace Maintenance and Regeneration Group processes and priorities. WSS projects support the depot maintenance mission requirements to sustain the existing organic industrial base, save dollars through increased productivity, and support customer requirements. When replaced, upgraded, integrated, or combined into depot industrial operations, the equipment will improve efficiency and personnel safety, support hazardous waste minimization and pollution prevention efforts, enhance product quality and increase customer satisfaction in performing the Air Force mission. Time criticality of projects to accommodate new or emerging workload requirements and produce an acceptable end state is a critical factor in depot operations. As such, program and execution in this line is essential as equipment requirements may change. Supporting documentation and project justification are certified and maintained on file, including, when appropriate, economic analysis in accordance with the established guidance.
Impact if not provided:Without the required equipment, AFMC would be unable to provide reliable, cost-effective and timely depot support services and products to operational forces around the world. Depots would be unable to accommodate new workload requirements and produce acceptable end state products. Depot infrastructure would deteriorate and become unproductive. Ability to execute capital budgets in support mission objectives would be severely hampered. These investments are critical to remaining competitive and provide combat mission support
Narrative Justification:This capability represents an array of capital equipment investment requirements that aligns with the overall Air Force strategic objectives for sustaining depot facilities and equipment. Projects are in direct support of Aircraft, Missiles, Engines, Exchangeable, or other Depot mission and are designed, scheduled, and installed in accordance with established Air Logistics or Aerospace Maintenance and Regeneration Group processes and priorities. WSS projects support the depot maintenance mission requirements to sustain the existing organic industrial base, save dollars through increased productivity, and support customer requirements. When replaced, upgraded, integrated, or combined into depot industrial operations, the equipment will improve efficiency and personnel safety, support hazardous waste minimization and pollution prevention efforts, enhance product quality and increase customer satisfaction in performing the Air Force mission. Time criticality of projects to accommodate new or emerging workload requirements and produce an acceptable end state is a critical factor in depot operations. As such, program and execution in this line is essential as equipment requirements may change. Supporting documentation and project justification are certified and maintained on file, including, when appropriate, economic analysis in accordance with the established guidance.
Impact if not provided:Without the required equipment, AFMC would be unable to provide reliable, cost-effective and timely depot support services and products to operational forces around the world. Depots would be unable to accommodate new workload requirements and produce acceptable end state products. Depot infrastructure would deteriorate and become unproductive. Ability to execute capital budgets in support mission objectives would be severely hampered. These investments are critical to remaining competitive and provide combat mission support.
FOR OFFICIAL USE ONLY Fund 9B CSAG Maintenance
89

Fund 9B(Dollars in Millions)
Capital Investment JustificationAir Force Working Capital Fund
Consolidated Sustainment Activity Group (CSAG)
Fiscal Year (FY) 2011Budget Estimates
February 2010
CSAG Maintenance Division - Organic
Department of the Air ForceDepot Maintenance
FY 2009 FY 2010 FY2011Element of Cost Unit Total Unit Total Unit Total
Qty Cost Cost Qty Cost Cost Qty Cost CostEquipment - Test & Inspection 1 7,831.000 7,831.000 1 3,900.000 3,900.000 1 5,964.000 5,964.000
Activity Group Capital Investment Justification ($ in Thousands)
Line Number Activity IdentificationEquipment - Test & Inspection HQ AFMC
Narrative Justification:This capability represents an array of capital equipment investment requirements that aligns with the overall Air Force strategic objectives for sustaining depot facilities and equipment. Projects are in direct support of Aircraft, Missiles, Engines, Exchangeable, or other Depot mission and are designed, scheduled, and installed in accordance with established Air Logistics or Aerospace Maintenance and Regeneration Group processes and priorities. Test & Inspection projects support the depot maintenance mission requirements to sustain the existing organic industrial base, save dollars through increased productivity, and support customer requirements. The equipment when replaced, upgraded, integrated, or combined, into depot industrial operations, will improve efficiency and personnel safety, support hazardous waste minimization and pollution prevention efforts, enhance product quality and increase customer satisfaction in performing the Air Force mission. Time criticality of projects to accommodate new or emerging workload requirements and produce an acceptable end state is a critical factor in depot operations. As such, program and execution in this line is essential as equipment requirements may change. Supporting documentation and project justification are certified and maintained on file, including; when appropriate, economic analysis in accordance with the established guidance.
Impact if not provided:AFMC would be unable to provide reliable, cost-effective and timely depot support services and products to operational forces around the world. Depots would be unable to accommodate new workload requirements and produce acceptable end state products. Depot infrastructure would deteriorate and become unproductive. Ability to execute capital budgets in support mission objectives would be severely hampered. These investments are critical to remaining competitive and provide combat mission support
Narrative Justification:This capability represents an array of capital equipment investment requirements that aligns with the overall Air Force strategic objectives for sustaining depot facilities and equipment. Projects are in direct support of Aircraft, Missiles, Engines, Exchangeable, or other Depot mission and are designed, scheduled, and installed in accordance with established Air Logistics or Aerospace Maintenance and Regeneration Group processes and priorities. Test & Inspection projects support the depot maintenance mission requirements to sustain the existing organic industrial base, save dollars through increased productivity, and support customer requirements. The equipment when replaced, upgraded, integrated, or combined, into depot industrial operations, will improve efficiency and personnel safety, support hazardous waste minimization and pollution prevention efforts, enhance product quality and increase customer satisfaction in performing the Air Force mission. Time criticality of projects to accommodate new or emerging workload requirements and produce an acceptable end state is a critical factor in depot operations. As such, program and execution in this line is essential as equipment requirements may change. Supporting documentation and project justification are certified and maintained on file, including; when appropriate, economic analysis in accordance with the established guidance.
Impact if not provided:AFMC would be unable to provide reliable, cost-effective and timely depot support services and products to operational forces around the world. Depots would be unable to accommodate new workload requirements and produce acceptable end state products. Depot infrastructure would deteriorate and become unproductive. Ability to execute capital budgets in support mission objectives would be severely hampered. These investments are critical to remaining competitive and provide combat mission support.
FOR OFFICIAL USE ONLY Fund 9B CSAG Maintenance
90

Fund 9B(Dollars in Millions)
Capital Investment JustificationAir Force Working Capital Fund
Consolidated Sustainment Activity Group (CSAG)
Fiscal Year (FY) 2011Budget Estimates
February 2010
CSAG Maintenance Division - Organic
Department of the Air ForceDepot Maintenance
FY2009 FY2010 FY2011Element of Cost Unit Total Unit Total Unit Total
Qty Cost Cost Qty Cost Cost Qty Cost CostDepot Maintenance Transformation (DMT) 1 77,619.000 77,619.000 0 0.000 0.000 0 0.000 0.000
Activity Group Capital Investment Justification ($ in Thousands)
Line Number Activity IdentificationDepot Maintenance Transformation HQ AFMC
Narrative Justification:Depot Maintenance Transformation (DMT) projects were realigned from appropriated funds to working capital fund. Projects were accomplished using the Capital Purchase Program (CPP) and using operational authority. DMT projects are identified in the Fund 9A and 9B Exhibits and were separately tracked and recorded for congressional interest. DMT provides new technology and state-of-the-art equipment to support the Air Force Depot Maintenance Strategy and Master Plan as directed by Congress. Depot Transformation provides each of the three Air Logistics Centers the capability to meet current and future core requirements for avionics, instruments, oxygen components, software, fuel accessories and engines. A comprehensive study of the Depots’ facilities and equipment identified significant deficiencies impacting Depot operations. The study concluded commercial industry reinvested 6% per year to recapitalize facilities and equipment, where as the Air Force historically was only able to fund 3% or less. This reinvestment disparity adversely impacted the depots’ ability to support the demands necessitated by the operational community to meet mission requirements. As a result the Air Force committed to invest $150M per year for FY04-09 to re-capitalize facilities and equipment. Only the equipment is funded within CSAG Maintenance Division Capital Purchase Program. The facility projects are appropriately funded in the Air Force Military Construction appropriation. This equipment re-capitalization represents an array of weapon system support and test equipment requirements and aligns with the Air Force strategic objectives for sustaining and modernizing equipment. Specifically, this equipment will improve industrial processes and systems testing to ensure customer requirements are timely supported at the lowest cost. The equipment when replaced or upgraded will improve efficiency, personnel safety, minimize hazardous waste and pollution, enhance quality and increase the Air Force’s ability to achieve our mission.
Impact if not provided: N/A
FOR OFFICIAL USE ONLY Fund 9B CSAG Maintenance
91

Fund 9B(Dollars in Millions)
Capital Investment JustificationAir Force Working Capital Fund
Consolidated Sustainment Activity Group (CSAG)
Fiscal Year (FY) 2011Budget Estimates
February 2010
CSAG Maintenance Division - Organic
Department of the Air ForceDepot Maintenance
FY2009 FY2010 FY2011Element of Cost Unit Total Unit Total Unit Total
Qty Cost Cost Qty Cost Cost Qty Cost CostADPE & Telecommunications 1 2,051.000 2,051.000 1 4,561.000 4,561.000 1 4,692.000 4,692.000
Activity Group Capital Investment Justification ($ in Thousands)
Line Number Activity IdentificationADPE & Telecommunications HQ AFMC
Narrative Justification:This project will upgrade the infrastructure required to maintain the Depot Maintenance Accounting and Production System (DMAPS) and depot maintenance legacy systems. All upgrades are being implemented within one common infrastructure. This effort will upgrade fiber optics, routers, servers and other infrastructure items required to support the implementation of an XP (operating system) network. This investment is required to ensure commonality and to replace equipment expecting to fail due to age. The equipment replacement is in accordance with the logistics strategic plan approved by the Deputy Under Secretary of Defense (Logistics).
Impact if not provided:Hardware upgrades are critical to maintaining system reliability and improving operating performance. The new operating system will improve depot maintenance’s capability to actively monitor and make corrective actions in financial and operational performance. Prior to upgrading the new operating system, infrastructure upgrades must be placed into service. Without the planned infrastructure replacement and improvement, the Air Force will be unable to track financial and operational performance. Lack of investment will impact the depot’s ability to effectively monitor performance, which results in cost increases and reduction in available aircraft for the warfighter.
FOR OFFICIAL USE ONLY Fund 9B CSAG Maintenance
92

Fund 9B(Dollars in Millions)
Capital Investment JustificationAir Force Working Capital Fund
Consolidated Sustainment Activity Group (CSAG)
Fiscal Year (FY) 2011Budget Estimates
February 2010
CSAG Maintenance Division - Organic
Department of the Air ForceDepot Maintenance
FY2009 FY2010 FY2011Element of Cost Unit Total Unit Total Unit Total
Qty Cost Cost Qty Cost Cost Qty Cost CostMinor Construction 1 6,553.000 6,553.000 1 6,935.000 6,935.000 1 6,919.000 6,919.000
Activity Group Capital Investment Justification ($ in Thousands)
Line Number Activity IdentificationMinor Construction HQ AFMC
Narrative Justification: This category includes an array of minor construction projects that allows flexibility in adapting to new and changing workloads. Projects are small scale (costing between $100,000 and $750,000) and are designed, scheduled, and constructed in accordance with Air Logistic Centers' established priorities. These projects support the depot maintenance mission requirements, correct safety and health problems; improve productivity through quality of life improvement projects, and support office and work space reorganization. These projects also provide construction required to install needed mission essential equipment.
Impact if not provided: If facilities are not properly maintained, there will be work stoppages, safety and security issues. The minor construction that is required for new equipment set-up will not be in place, thus severely impacting the depots’ ability to efficiently provide repair services and meet warfighter requirements.
FOR OFFICIAL USE ONLY Fund 9B CSAG Maintenance
93

Fund 9B(Dollars in Millions)
Capital Investment JustificationAir Force Working Capital Fund
Consolidated Sustainment Activity Group (CSAG)
Fiscal Year (FY) 2011Budget Estimates
February 2010
CSAG - Supply Division
Department of the Air ForceSupply Management
FY 2009 FY 2010 FY2011Element of Cost Unit Total Unit Total Unit Total
Qty Cost Cost Qty Cost Cost Qty Cost CostPRPS 1 2,867.000 2,867.000 1 525.000 525.000 0 0.000 0.000
Activity Group Capital Investment Justification ($ in Thousands)
Line Number Activity IdentificationSoftware Externally Developed – PRPS HQ AFMC
Narrative Justification: The Purchase Request Process System (PRPS) automates the front-end of the acquisition process and bridges the requirement and contracting stages. The PRPS automates the Purchase Instrument (PI) process, beginning with initiation of a requirement and proceeds through creation of a technical data package, generation of electronic Purchase Requests (PRs), Military Interdepartmental Purchase Requests (MIPRs), Delivery Order Requests (DORs), Amendments, Activities/Attachments, Funding Coordination, and transition of the PR/MIPR/DOR submission to Contracting. The current business process is a combination of manual processes and existing legacy systems. This system automates business processes, eliminates outdated legacy systems, enables real-time capability, and facilitates paperless contracting. Full Operational Capability (FOC) will be achieved in February 2010. After FOC, funding is required to meet mandated system upgrades, new interfaces, Global Combat Support System - Air Force (GCSS-AF) updates, ad-hoc query capability, modifications to business processes and general enhancements. A Business Case Analysis was prepared for PRPS and is on file. Total cost includes $124K required for FY09 carryover authority in FY10 for contingent liabilities.
Impact if not provided: Without the requested funding, this system will not move into a modern architecture and the internal control issues of the existing manual, paper intensive, purchase request process and legacy information systems will continue. Additionally, the cost of maintaining outdated legacy systems will continue to be incurred.
FOR OFFICIAL USE ONLY Fund 9B CSAG Supply
94

Fund 9B(Dollars in Millions)
Capital Investment JustificationAir Force Working Capital Fund
Consolidated Sustainment Activity Group (CSAG)
Fiscal Year (FY) 2011Budget Estimates
February 2010
CSAG - Supply Division
Department of the Air ForceSupply Management
FY 2009 FY 2010 FY2011Element of Cost Unit Total Unit Total Unit Total
Qty Cost Cost Qty Cost Cost Qty Cost CostCSWS DE 1 67.000 67.000 1 2,300.000 2,300.000 1 2,500.000 2,500.000
Activity Group Capital Investment Justification ($ in Thousands)
Line Number Activity IdentificationSoftware Externally Developed – CSWS DE HQ AFMC
Narrative Justification: The Contractor Supported Weapon Systems Data Exchange (CSWS DE) is a software solution that automates data collection from weapon system contractors and supports Air Force decision making and program assessments during acquisition. This software solution is part of the over-arching CSWS process, a partnership between government and industry that streamlines weapon system spares and equipmentacquisition processes. The CSWS DE acts as a bridge for spares data. By passing data between contractor and Air Force legacy systems, it allows Contractor Inventory Control Points (C-ICP) to send and receive information to/from Air Force systems. CSWS DE is designed as a gateway into government systems, ensuring contractors are able to input and view information securely.
CSWS DE achieved initial operating capability in FY 2002. After several upgrades were incorporated, the system reached GCSS-AF Level 1 compliance in November 2004. Since achieving Level 1 compliance, the CSWS DE has been directed to provide the C-ICP with repair status data for assets under repair at Air Logistics Centers. An approved economic analysis is on file.
Impact if not provided: The CSWS DE is the sole means of providing electronic C-ICP data to Government/Air Force systems that do not authorize direct linkage/access to contractor data systems or personnel. Lack of this information will increase Air Force operational risk while severely hampering the effectiveness of Depot Partnering and Performance Based Logistics (PBL) initiatives Without funding transfer of repair data
Narrative Justification: The Contractor Supported Weapon Systems Data Exchange (CSWS DE) is a software solution that automates data collection from weapon system contractors and supports Air Force decision making and program assessments during acquisition. This software solution is part of the over-arching CSWS process, a partnership between government and industry that streamlines weapon system spares and equipmentacquisition processes. The CSWS DE acts as a bridge for spares data. By passing data between contractor and Air Force legacy systems, it allows Contractor Inventory Control Points (C-ICP) to send and receive information to/from Air Force systems. CSWS DE is designed as a gateway into government systems, ensuring contractors are able to input and view information securely.
CSWS DE achieved initial operating capability in FY 2002. After several upgrades were incorporated, the system reached GCSS-AF Level 1 compliance in November 2004. Since achieving Level 1 compliance, the CSWS DE has been directed to provide the C-ICP with repair status data for assets under repair at Air Logistics Centers. An approved economic analysis is on file.
Impact if not provided: The CSWS DE is the sole means of providing electronic C-ICP data to Government/Air Force systems that do not authorize direct linkage/access to contractor data systems or personnel. Lack of this information will increase Air Force operational risk while severely hampering the effectiveness of Depot Partnering and Performance Based Logistics (PBL) initiatives. Without funding, transfer of repair data to the C-ICP remains a labor-intensive, manual process. Air Force partnering initiatives with contractors (Depot Partnering and Performance Based Logistics) will be significantly impaired due to insufficient data visibility between Air Logistics Centers, C-ICPs, and other repair contractors.
FOR OFFICIAL USE ONLY Fund 9B CSAG Supply
95

Fund 9B(Dollars in Millions)
Capital Investment JustificationAir Force Working Capital Fund
Consolidated Sustainment Activity Group (CSAG)
Fiscal Year (FY) 2011Budget Estimates
February 2010
CSAG - Supply Division
Department of the Air ForceSupply Management
FY2009 FY2010 FY2011Element of Cost Unit Total Unit Total Unit Total
Qty Cost Cost Qty Cost Cost Qty Cost CostGCSS-AF DS 0 0.000 0.000 1 1,493.000 1,493.000 1 1,523.000 1,523.000
Activity Group Capital Investment Justification ($ in Thousands)
Line Number Activity IdentificationADPE & Telecom Resources – GCSS-AF DS HQ AFMC
Narrative Justification:Global Combat Support System – Air Force Data Services (GCSS-AF DS) integrates the full spectrum of Air Force combat support data, including maintenance, supply, transportation, finance, contracting, and planning. It will support AF war fighters by providing data sharing capabilities and functional data integration through modern query and data mining tools. These tools gather and store enterprise-wide data in a secure, reliable, and consistent manner through web accessible portals. GCSS-AF DS decision support tools will provide users with quick, clear, and accurate information. Cross-functional data maintained in GCSS-AF DS include maintenance data for aircraft, communications-electronics equipment, engines, and a wide spectrum of supply chain management data. The Supply Division has thelargest volume of data that will reside in GCSS-AF DS.
To date, supply data has been populated from selected Supply systems including Stock Control System, Master Item Identification Control System, Mission Capable data, Weapon System Management Information System, Requirements Management System, and Contractor Supported Weapon Systems. As GCSS-AF DS development progresses, storage capacity must be increased to accommodate planned data systems feeds. The entire combat support enterprise will be completed by the close of FY 2011. An approved economic analysis is on file.
Impact if not provided:
Narrative Justification:Global Combat Support System – Air Force Data Services (GCSS-AF DS) integrates the full spectrum of Air Force combat support data, including maintenance, supply, transportation, finance, contracting, and planning. It will support AF war fighters by providing data sharing capabilities and functional data integration through modern query and data mining tools. These tools gather and store enterprise-wide data in a secure, reliable, and consistent manner through web accessible portals. GCSS-AF DS decision support tools will provide users with quick, clear, and accurate information. Cross-functional data maintained in GCSS-AF DS include maintenance data for aircraft, communications-electronics equipment, engines, and a wide spectrum of supply chain management data. The Supply Division has thelargest volume of data that will reside in GCSS-AF DS.
To date, supply data has been populated from selected Supply systems including Stock Control System, Master Item Identification Control System, Mission Capable data, Weapon System Management Information System, Requirements Management System, and Contractor Supported Weapon Systems. As GCSS-AF DS development progresses, storage capacity must be increased to accommodate planned data systems feeds. The entire combat support enterprise will be completed by the close of FY 2011. An approved economic analysis is on file.
Impact if not provided: If storage capacity is not increased, GCSS-AF DS development will not be completed which detrimentally impacts Air Force users' ability to query and mine data. Lacking this additional capacity, the program cannot be implemented to connect systems, mine data and present accurate information to Air Force decision makers. Timeliness of data will continue to lag commanders’ needs, accuracy will remain suspect and relationships between activities such as supply, maintenance, and operations will remain disconnected. GCSS-AF DS is vital to successful enterprise-wide integration, cross-functional visibility, and agile combat support.
FOR OFFICIAL USE ONLY Fund 9B CSAG Supply
96

Fund 9B(Dollars in Millions)
Capital Investment JustificationAir Force Working Capital Fund
Consolidated Sustainment Activity Group (CSAG)
Fiscal Year (FY) 2011Budget Estimates
February 2010
CSAG - Supply Division
Department of the Air ForceSupply Management
FY2009 FY2010 FY2011Element of Cost Unit Total Unit Total Unit Total
Qty Cost Cost Qty Cost Cost Qty Cost CostGCSS-AF DS 1 4,525.000 4,525.000 1 4,616.000 4,616.000 1 4,708.000 4,708.000
Activity Group Capital Investment Justification ($ in Thousands)
Line Number Activity IdentificationSoftware Externally Developed – GCSS-AF DS HQ AFMC
Narrative Justification:Global Combat Support System – Air Force Data Services (GCSS-AF DS) integrates the full spectrum of Air Force combat support data, including maintenance, supply, transportation, finance, contracting, and planning. It will support Air Force war fighters by providing data sharing capabilities and functional data integration through modern query and data mining tools. These tools gather and store enterprise-wide data in a secure, reliable, and consistent manner through web accessible portals. GCSS-AF DS decision support tools will provide users with quick, clear and accurate information. Cross-functional data maintained in GCSS-AF DS include maintenance data for aircraft, communications-electronics equipment, engines, and a wide spectrum of supply chain management data. The Supply Division has thelargest volume of data that will reside in GCSS-AF DS.
To date, supply data has been populated from selected Supply systems including Stock Control System, Master Item Identification Control System, Mission Capable data, Weapon System Management Information System, Requirements Management System, and Contractor Supported Weapon Systems. Currently, the AF employs several systems that transfer data multiple times and stores it in many places, resulting in outdated and inaccurate data. GCSS-AF DS provides the AF reliable, accurate data from a single source. The entire combat support enterprise will be completed by the close of FY 2011. An approved economic analysis is on file. Total cost includes $521K required for FY09 carryover authority in FY10 for contingent liabilities.
Impact if not provided: Failure to fund GCSS-AF DS will continue the AF’s reliance on closed, rigid, compartmentalized, and non-integrated combat support data to underpin key decisions. Timeliness of data will continue to lag commanders’ needs, accuracy will remain suspect and relationships between activities such as supply, maintenance, and operations will remain disconnected. GCSS-AF DS is vital to successful enterprise-wide integration, cross-functional visibility, and agile combat support.
FOR OFFICIAL USE ONLY Fund 9B CSAG Supply
97

Fund 9B(Dollars in Millions)
Capital Investment JustificationAir Force Working Capital Fund
Consolidated Sustainment Activity Group (CSAG)
Fiscal Year (FY) 2011Budget Estimates
February 2010
CSAG - Supply Division
Department of the Air ForceSupply Management
FY2009 FY2010 FY2011Element of Cost Unit Total Unit Total Unit Total
Qty Cost Cost Qty Cost Cost Qty Cost CostKEYSTONE (KDSS) 1 324.031 324.031 1 332.000 332.000 1 338.000 338.000
Activity Group Capital Investment Justification ($ in Thousands)
Line Number Activity IdentificationSoftware Externally Developed – Keystone (KDSS) HQ AFMC
Narrative Justification:The Keystone Decision Support System (KDDS) provides WCF sales and costs analysis capability and facilitates in-depth analysis of budgeted versus actual execution performance. These processes are part of the long term Enterprise Resource Planning (ERP) solution. System software enhancements are required to implement expansion of KDSS, as identified in the Keystone Strategic Roadmap. Identified expansion of Keystone's capabilities include additional analysis requirements, incorporating additional financial data from legacy systems, providing enhanced data analysis capabilities, and assuring compatibility with projected Defense Finance and Accounting Services data systems’ conversions and mergers. Additional enhancements will provide more detailed weapon system cost analysis and reporting capabilities, along with cost accounting and reporting for the working capital fund. An approved economic analysis is on file.
Impact if not provided:Disapproval of this request will limit Keystone's performance parameters, and thus reduce the AF’s capability to efficiently analyze execution performance which is necessary to manage the AFWCF portfolio in a business-like manner.
FOR OFFICIAL USE ONLY Fund 9B CSAG Supply
98

Fund 9B(Dollars in Millions)
Capital Investment JustificationAir Force Working Capital Fund
Consolidated Sustainment Activity Group (CSAG)
Fiscal Year (FY) 2011Budget Estimates
February 2010
CSAG - Supply Division
Department of the Air ForceSupply Management
FY2009 FY2010 FY2011Element of Cost Unit Total Unit Total Unit Total
Qty Cost Cost Qty Cost Cost Qty Cost CostAFWCF BDT 0 0.000 0.000 1 2,716.000 2,716.000 1 572.000 572.000
Activity Group Capital Investment Justification ($ in Thousands)
Line Number Activity IdentificationSoftware Externally Developed – AFWCF BDT HQ AFMC
Narrative Justification:The AFWCF Budget Development Tool (BDT) is used to prepare budget exhibits and reports in a structured format for submission to Congress and the Under Secretary of Defense (Comptroller). The current tool does not provide timely, accurate information needed to complete the various budget exhibits and required reports. The current tool cannot be salvaged--a new tool is needed. The search for an alternative is underway with a Request for Information (RFI) awaiting industry response. An economic analysis and an estimated completion date will be accomplished once assessments are complete and a new tool selected.
Impact if not provided: Offline excel spreadsheets will be used to build and submit the annual AFWCF budget. Without requested funding, offline spreadsheets will continue with minimal internal control and inefficient processes resulting in excessive labor to complete budget submissions.
FOR OFFICIAL USE ONLY Fund 9B CSAG Supply
99

Fund 9B(Dollars in Millions)
Capital Investment JustificationAir Force Working Capital Fund
Consolidated Sustainment Activity Group (CSAG)
Fiscal Year (FY) 2011Budget Estimates
February 2010
CSAG - Supply Division
Department of the Air ForceSupply Management
FY2009 FY2010 FY2011Element of Cost Unit Total Unit Total Unit Total
Qty Cost Cost Qty Cost Cost Qty Cost CostADPE & Telecom 1 301.364 301.364 1 572.200 572.200 1 648.400 648.400
Activity Group Capital Investment Justification ($ in Thousands)
Line Number Activity IdentificationHARDWARE - ADPE HQ AFMC
Narrative Justification:Capacity Optimized Storage (COS) backup appliances will support consolidating all legacy tape libraries, file archive content management servers and backup software utilized to support them. The fiscal years associated with effort are FY2009 and FY2010. This COS appliance will dramatically lower the total cost of ownership of the backup and archive environment due to the compression ratios achieved. The COS appliance will bring Wide Area Network into compliance with DoD Directive 5015.2. Critical data and information systems have been consolidated into a standard archive solution however, current capabilities will be expanded to accommodate data backup and archiving of supply systems. An economic analysis is on file.
A Continuity of Operations (COOP) site is required for Hill AFB, Utah in the event of a widespread natural or manmade disaster or contingency. The fiscal year associated with effort is FY2011. Expansion to a remote COOP provides or a physically separated location while maintaining continuity of management. The COOP requires primary data storage, archiving and communications capabilities for information systems. Housing critical infrastructure in a physically separated facility provides availability, reliability and survivability required to support the WCF mission in any emergency. An economic analysis and an estimated completion date will be accomplished once assessments are complete.
Impact if not provided:
Narrative Justification:Capacity Optimized Storage (COS) backup appliances will support consolidating all legacy tape libraries, file archive content management servers and backup software utilized to support them. The fiscal years associated with effort are FY2009 and FY2010. This COS appliance will dramatically lower the total cost of ownership of the backup and archive environment due to the compression ratios achieved. The COS appliance will bring Wide Area Network into compliance with DoD Directive 5015.2. Critical data and information systems have been consolidated into a standard archive solution however, current capabilities will be expanded to accommodate data backup and archiving of supply systems. An economic analysis is on file.
A Continuity of Operations (COOP) site is required for Hill AFB, Utah in the event of a widespread natural or manmade disaster or contingency. The fiscal year associated with effort is FY2011. Expansion to a remote COOP provides or a physically separated location while maintaining continuity of management. The COOP requires primary data storage, archiving and communications capabilities for information systems. Housing critical infrastructure in a physically separated facility provides availability, reliability and survivability required to support the WCF mission in any emergency. An economic analysis and an estimated completion date will be accomplished once assessments are complete.
Impact if not provided: Hardware upgrades are critical to maintaining system reliability and improving operating performance. Without the planned infrastructure replacement and improvement, the Air Force will be unable to track financial and operational performance. Lack of investment will impact ability to effectively monitor performance, which results in cost increases and reduction in available aircraft to the warfighter.
The COOP facility will provide secure storage of data and processing capability for critical mission support services in case of service loss at the primary data facility. Hill AFB modernization data facility will increase the availability and survivability of the information systems . Failure to fund could result in failure of vital systems support and loss of critical mission data.
FOR OFFICIAL USE ONLY Fund 9B CSAG Supply
100

Fund 9B(Dollars in Millions)
Capital Investment JustificationAir Force Working Capital Fund
Consolidated Sustainment Activity Group (CSAG)
Fiscal Year (FY) 2011Budget Estimates
February 2010
CSAG - Supply Division
Department of the Air Force Line Number Activity
Supply Management HQ AFMC
FY2009 FY2010 FY2011Element of Cost Unit Total Unit Total Unit Total
Qty Cost Cost Qty Cost Cost Qty Cost CostREMIS HARDWARE 0 0.000 0.000 0 0.000 0.000 1 2,000.000 2,000.000
Activity Group Capital Investment Justification($ in Thousands)
HARDWARE - Reliability and Maintainability Information System (REMIS)
Narrative Justification: REMIS is a stand alone data system that runs on a TANDEM mainframe environment and the last hardware replacement was in 2005. Due to the age and performance issues experienced with the current series hardware platform, the Air Force must replace the current REMIS HP/TANDEM mainframe "S" Series hardware to a "Blade" Series HP/TANDEM mainframe environment. An economic analysis and an estimated completion date will be accomplished once assessments are complete.
Impact if not provided: Hardware upgrades are critical to maintaining system reliability and improving operating performance. Without the planned infrastructure replacement and improvement, the Air Force will be unable to track financial and operational performance. Lack of investment will impact ability to effectively monitor performance, which results in cost increases and reduction in available aircraft to the warfighter.
FOR OFFICIAL USE ONLY Fund 9B CSAG Supply
101

Fund 9B(Dollars in Millions)
Capital Investment JustificationAir Force Working Capital Fund
Consolidated Sustainment Activity Group (CSAG)
Fiscal Year (FY) 2011Budget Estimates
February 2010
CSAG - Supply Division
Department of the Air Force Line Number Activity
Supply Management HQ AFMC
FY2009 FY2010 FY2011Element of Cost Unit Total Unit Total Unit Total
Qty Cost Cost Qty Cost Cost Qty Cost CostREMIS SOFTWARE 0 0.000 0.000 0 0.000 0.000 1 500.000 500.000
Activity Group Capital Investment Justification($ in Thousands)
SOFTWARE - Reliability and Maintainability Information System (REMIS)
Narrative Justification: REMIS is a stand alone data system that runs on a TANDEM mainframe environment and the last hardware replacement was in 2005. Due to the age and performance issues experienced with the current series hardware platform, the Air Force must replace the current REMIS HP/TANDEM mainframe "S" Series hardware to a "Blade" Series HP/TANDEM mainframe environment. Approximately 3.8 million lines of code (LOC) comprise REMIS functionality and over 54% of the code is in COBOL 85 language which is incompatible with the new hardware. Thus, funding is required for replacing the "Operating Software" to the proper configuration in support of the HP/TANDEM "Blade" Seriesplatform. An economic analysis and an estimated completion date will be accomplished once assessments are complete.
Impact if not provided: Software upgrades are critical to maintaining system reliability and improving operating performance. Without the planned replacement and improvement, the Air Force will be unable to track reliability and maintainability performance. Lack of investment will impact ability to effectively monitor performance, which results in cost increases and reduction in available aircraft to the warfighter.
FOR OFFICIAL USE ONLY Fund 9B CSAG Supply
102

Fund 9C(Dollars in Millions)
Capital Budget ExecutionAir Force Working Capital Fund
Consolidated Sustainment Activity Group (CSAG)
Fiscal Year (FY) 2011Budget Estimates
February 2010
CSAG Maintenance Division
FY 2009
Line Number Project PB (Set Cost) ReprogsInternal
Transfers CarryoverApproved Proj
CostCurrent Proj
Cost Asset/
DeficiencyEQUIPMENT
H75NGB Chemical Cleaning Equipment B3001 PH.1 5.000 0.300 (3.338) 0.000 1.963 1.963 0.000H9WC22 Laser Tracker 0.000 0.000 0.460 0.000 0.460 0.460 0.000H9WA17 GSE Blast Booth 0.000 0.000 0.375 0.000 0.375 0.375 0.000H9WA10 400Hz Power Converter 0.000 0.000 0.250 0.000 0.250 0.250 0.000H9WP08 Robotic Grit Blasting Unit 0.000 0.000 0.406 0.000 0.406 0.406 0.000H9WC09 CNC Vertical Machining Center 0.000 0.000 0.473 0.000 0.473 0.473 0.000H9WM02 Laser Cutting System 0.000 0.000 0.690 0.000 0.690 0.690 0.000H85MG2 Decontamination Chamber 0.000 0.000 0.310 0.000 0.310 0.310 0.000H85LG2 Material Lift, E-3, B2136 0.000 0.000 0.445 0.000 0.445 0.445 0.000H2M1GB Machine Shop Modernization PH. IV 2.390 0.005 (0.168) 0.000 2.228 2.228 0.000H5C1G9 Pneumatic Test Stand Replacement 0.000 0.000 0.836 0.000 0.836 0.836 0.000H5C1G3 Engine Manifold Cleaning System (EMCS) 6.500 0.000 0.000 0.000 6.500 6.500 0.000H852GH KC135 Maintenance Platforms 0.000 0.000 5.218 0.000 5.218 5.218 0.000H85MG8 Power Converter 400Hz 0.000 0.000 0.250 0.000 0.250 0.250 0.000H5CFG4 Bonded Flight Control Structural Repair 3.250 0.000 (0.004) 0.000 3.246 3.246 0.000H85EG7 Air Bearing System 0.000 0.000 0.250 0.000 0.250 0.250 0.000H9WP01 Large Electron Beam Welder (Refurbish Old EB Welder) 0.000 0.000 0.858 0.000 0.858 0.858 0.000H9WC26 Four Post Press 0.000 0.000 0.800 0.000 0.800 0.800 0.000H9WM24 Equipment Monitoring System 0.000 0.000 1.048 0.000 1.048 1.048 0.000H2PXG4 Build-up & Tear- down Test Stands B3234 1.750 0.000 (1.750) 0.000 0.000 0.000 0.000H75FTB Tanker Business Unit 4.500 0.000 (4.500) 0.000 0.000 0.000 0.000H75FT9 GE Business Unit 0.500 0.000 (0.500) 0.000 0.000 0.000 0.000H62RG3 Drop Bottom Furnace 0.350 0.000 (0.350) 0.000 0.000 0.000 0.000H145G8 Automatic Dabber Arc Welders 0.375 0.000 (0.375) 0.000 0.000 0.000 0.000H62RG6 Tri-Electronic Generators (2) 0.570 0.000 (0.570) 0.000 0.000 0.000 0.000H5C1GB Heat Treat Steel Cell for Sheetmetal Shop (phase II) 1.500 0.000 (1.500) 0.000 0.000 0.000 0.000G676G1 Linear Accelerator (X-Ray Source 0.930 0.000 (0.193) 0.000 0.737 0.737 0.000G690G1 Cellular Work Platforms 2.310 0.000 0.397 0.000 2.707 2.707 0.000G14HG0 Hydraulic Test Equipment Bldg. 238 0.000 0.000 0.826 0.000 0.826 0.000 0.826G155G8 Shaker Systems Replacement # 1 and 2 0.000 (0.933) 0.933 0.000 0.000 0.000 0.000A25HM4 PMB Bead Blasting Booth 0.445 0.280 0.000 0.000 0.280 0.280 0.000G9WA31 C-130 Paint Platform "Fall Protection" 0.000 2.200 0.000 0.000 2.200 2.200 0.000G9WA81 Outside Fuel Dock "Fall Protection" 0.000 0.600 0.000 0.000 0.600 0.600 0.000G9WA71 Outside Fuel Dock "Fall Protection" 0.000 0.600 0.000 0.000 0.600 0.600 0.000G767G1 Load Control Valve Test Cell Upgrade 1.100 0.000 (1.100) 0.000 0.000 0.000 0.000G765G1 Generator Set Gas Turbine Engine TS 0.800 0.000 (0.800) 0.000 0.000 0.000 0.000L96BG2 FlashJet Upgrade Option 1.000 0.000 0.000 0.000 1.000 1.000 0.000L9M1U1 AN/ALM-205 A/B Analog Module Test Sets & TPS Rehost (IH) 0.000 0.700 5.529 0.000 6.229 6.229 0.000L9ANG1 C-5 Landing Gear Fixtures (2ea) 0.000 0.000 0.600 0.000 0.600 0.600 0.000LA6BG2 ADTS 2000/HDTS Rehost 0.000 0.000 0.593 0.000 0.593 0.593 0.000L988G2 C130 AMP Enclosures (6ea) 0.000 0.000 2.400 0.000 2.400 2.400 0.000L8MBE1 Plating Shop (AMFF) Plating Tanks 0.000 0.000 2.600 0.000 2.600 2.600 0.000
FOR OFFICIAL USE ONLY Fund 9C CSAG Maintenance
103

Fund 9C(Dollars in Millions)
Capital Budget ExecutionAir Force Working Capital Fund
Consolidated Sustainment Activity Group (CSAG)
Fiscal Year (FY) 2011Budget Estimates
February 2010
CSAG Maintenance Division
FY 2009
Line Number Project PB (Set Cost) ReprogsInternal
Transfers CarryoverApproved Proj
CostCurrent Proj
Cost Asset/
DeficiencyL8CJG3 F-15 Wiring Analyzer (08/09) 0.000 0.000 0.975 0.000 0.975 0.975 0.000L969G1 Wing Maintenance Platform B83 0.000 0.000 2.650 0.000 2.650 2.650 0.000L94KI1 C-130 Wing Stand Fall Protection Syst (1 set of 4) 0.000 0.000 0.500 0.000 0.500 0.500 0.000LAMAG1 Supporting KPST/APST Workload with VDATS 0.000 0.000 0.437 0.000 0.437 0.437 0.000L92KG1 C-17 Corral Fall Protection (1ea) 0.000 0.157 0.143 0.000 0.300 0.300 0.000L92KG2 C-17 Corral Fall Protection (1ea) 0.000 0.157 0.143 0.000 0.300 0.300 0.000L92KG3 C-17 Corral Fall Protection (1ea) 0.000 0.157 0.143 0.000 0.300 0.300 0.000L92KG4 C-17 Corral Fall Protection (1ea) 0.000 0.157 0.143 0.000 0.300 0.300 0.000L92KG5 C-17 Corral Fall Protection (1ea) 0.000 0.157 0.143 0.000 0.300 0.300 0.000L92KG6 C-17 Corral Fall Protection (1ea) 0.000 0.157 0.143 0.000 0.300 0.300 0.000L92KG7 C-17 Corral Fall Protection (1ea) 0.000 0.157 0.143 0.000 0.300 0.300 0.000LA5BG2 C-17 Work Stand 0.000 2.316 0.384 0.000 2.700 2.700 0.000L958G1 C-130 Wraparound Stands 0.000 1.767 0.000 0.000 1.767 1.767 0.000L958G2 C-130 Wraparound Stands 0.000 1.767 0.000 0.000 1.767 1.767 0.000L958G3 C-130 Wraparound Stands 0.000 1.767 0.000 0.000 1.767 1.767 0.000L958G4 C-130 Wraparound Stands 0.000 1.750 0.000 0.000 1.750 1.750 0.000LA72G2 C-130 Wraparound Stands 0.000 1.750 0.000 0.000 1.750 1.750 0.000L96UG1 3-Axis Machining Center 0.000 0.000 1.200 0.000 1.200 1.200 0.000L96UG3 Fluid Cell Press Controls replacement 0.000 0.000 1.000 0.000 1.000 1.000 0.000L96UG2 Fastwire Foam Cutter 0.000 0.000 0.400 0.000 0.400 0.400 0.000L96UG4 Retrofit of obsolete CNC Controls 0.000 0.000 1.000 0.000 1.000 1.000 0.000L9MBI1 Etching Shop Renovation 2.000 0.000 0.508 0.000 2.508 2.508 0.000LA6CG2 980L-A1 Upgrade Rehost 0.000 0.000 0.747 0.000 0.747 0.747 0.000L45PGA A/C Equip Modernization Program (3) moved from FY08 5.529 0.000 (5.529) 0.000 0.000 0.000 0.000L96PG1 C-130 AMP Equipment Requirements 4.020 0.000 (4.020) 0.000 0.000 0.000 0.000L45PGQ FY09 Equipment Bundle 5.000 0.000 (5.000) 0.000 0.000 0.000 0.000L96BG3 HVOF Equipment Bundle 1.900 0.000 (1.900) 0.000 0.000 0.000 0.000L1M3U1 AN/ALM-205(A/B) Analog Mod T/S 5.752 0.000 (5.752) 0.000 0.000 0.000 0.000A009M1 Paint Shop Expansion, Drying/Curing Area. 0.000 (0.651) 0.000 0.000 (0.651) (0.651) 0.000
Equipment-WSS Total 57.026 15.316 0.000 0.000 72.342 71.517 0.826
FOR OFFICIAL USE ONLY Fund 9C CSAG Maintenance
104

Fund 9C(Dollars in Millions)
Capital Budget ExecutionAir Force Working Capital Fund
Consolidated Sustainment Activity Group (CSAG)
Fiscal Year (FY) 2011Budget Estimates
February 2010
CSAG Maintenance Division
FY 2009
Line Number Project PB (Set Cost) ReprogsInternal
Transfers CarryoverApproved Proj
CostCurrent Proj
Cost Asset/
DeficiencyEQUIPMENT TEST
H4M5GD AFATS PH. IV 3.431 0.000 (2.500) 0.000 0.931 0.931 0.000H85MM6 F101-102 Engine Test Frame Adapter #1 0.000 0.000 2.500 0.000 2.500 2.500 0.000G768G1 Servo Actuator Test Stands 0.000 (1.400) 1.400 0.000 0.000 0.000 0.000G325G1 Guided Missile Test Stand (GMCTS) 0.000 2.500 1.600 0.000 4.100 4.100 0.000A99YG9 Hydraulic Component Test Stand 0.000 0.000 0.280 0.000 0.280 0.280 0.000G1M2G4 Re-entry Sys Test Equipment 2 of 2 3.300 0.000 (3.280) 0.000 0.020 0.020 0.000
Equipment-Test Total 6.731 1.100 0.000 0.000 7.831 7.831 0.000
TOTAL EQUIPMENT 63.757 16.416 0.000 0.000 80.173 79.348 0.826
ADPE & TELECOMA96001 DMAPS/Legacy System Modernization 2.051 0.000 (2.051) 0.000 0.000 0.000 0.000G9AMO1 Server consolidation DMAG 0.000 0.000 0.544 0.000 0.544 0.544 0.000H9AI23 TAC Wired Infrastructure 0.000 0.000 1.507 0.000 1.507 1.507 0.000
TOTAL ADPE & TELECOM 2.051 0.000 0.000 0.000 2.051 2.051 0.000
FOR OFFICIAL USE ONLY Fund 9C CSAG Maintenance
105

Fund 9C(Dollars in Millions)
Capital Budget ExecutionAir Force Working Capital Fund
Consolidated Sustainment Activity Group (CSAG)
Fiscal Year (FY) 2011Budget Estimates
February 2010
CSAG Maintenance Division
FY 2009
Line Number Project PB (Set Cost) ReprogsInternal
Transfers CarryoverApproved Proj
CostCurrent Proj
Cost Asset/
DeficiencyDEPOT MAINTENANCE TRANSFORMATION (DMT) DMT Operating Authority 0.000 0.000 5.800 0.000 5.800 5.800 0.000
H85MG5 Tanker KC-135 Platforms (TBU) 0.000 0.000 5.110 0.000 5.110 5.110 0.000H82XG7 Anodizing Line (CBU) 0.000 0.000 1.366 0.000 1.366 1.366 0.000H831GT Media Blast Booths (CBU) 0.000 0.000 0.318 0.000 0.318 0.318 0.000H82XG5 Parts Paint Booth (CBU) 0.000 0.000 2.099 0.000 2.099 2.099 0.000H831GW Stripping Booths (CBU) 0.000 0.000 2.716 0.000 2.716 2.716 0.000H9DP21 Plasma Tank Farm 0.000 0.000 1.082 0.000 1.082 1.082 0.000H75FTG Plasma Phase II (F100BU) 0.000 0.000 1.464 0.000 1.464 1.464 0.000H9DC27 Purchase Paint and Pre-Paint Booths (Phase 2) 0.000 0.000 2.514 0.000 2.514 2.514 0.000H9DC25 Establish Adhesive Bonding Primer Spray and Cure System 0.000 0.000 1.068 0.000 1.068 1.068 0.000H85VT3 Commodities, Bomber & Tanker Bs. Unit 0.000 0.000 0.000 0.000 0.000 0.000 0.000H65GG1 Transformation 22.000 0.000 (22.000) 0.000 0.000 0.000 0.000G548G1 Cylindrical Grinder 0.000 0.000 1.350 0.000 1.350 1.350 0.000G8DN71 High Speed PTO Shaft Balancer 0.000 0.000 0.325 0.000 0.325 0.325 0.000G8DNC1 Manual Flow Grinder 0.000 0.000 0.350 0.000 0.350 0.350 0.000G8DNA1 EPU Incinerator 0.000 0.000 0.300 0.000 0.300 0.300 0.000G848G1 Tooling Control Project 0.000 0.000 0.400 0.000 0.400 0.400 0.000G753G1 Rapid Fabrication of Critical Components 8.800 0.000 (0.181) 0.000 8.619 8.619 0.000G750G1 Streamlined Avionics Test Equipment (R-IAIS 08) 22.560 (0.800) (9.111) 0.000 12.650 12.600 0.050G841G1 DOH/WAC Tables 0.000 0.000 1.000 0.000 1.000 1.000 0.000G843G1 Fuel and Liquid Quantity Indicators 0.000 0.000 0.500 0.000 0.500 0.500 0.000G659IE Textron Hydraulic Test Stand 0.000 0.000 0.650 0.000 0.650 0.650 0.000G849G1 Test Station to Replace Paveways Test Stations (Bldg 5C) 0.000 0.000 1.100 0.000 1.100 1.100 0.000G852G1 A-10 Alpha-Mach/B-52 Air Data Test Stands Replacements 0.000 0.000 1.000 0.000 1.000 1.000 0.000G847G1 Integrex E500H or Equivalent Machining Center 0.000 0.000 0.750 0.000 0.750 0.750 0.000G850G1 A-10 Servo Actuator Test Stand 0.000 0.000 0.637 0.000 0.637 0.590 0.047G842G1 High Voltage Power Supply (HVPS) Washer 0.000 0.000 0.867 0.000 0.867 0.783 0.084G846G1 Command Module Motor and Actuator Control Integrated Test Stand,
(CMMAC). 0.000 0.000 0.400 0.000 0.400 0.400 0.000
G851G1 KC-135 Fuel Savings Advisory System (FSAS) 0.000 0.000 0.750 0.000 0.750 0.750 0.000G432I3 IOE Software Support Equipment 0.000 0.000 0.833 0.000 0.833 0.833 0.000G695G4 General Automatic Test System (GATS-Ph 4) 0.000 0.000 1.709 0.000 1.709 1.709 0.000G752G1 Ultra High Pressure Water Jet (UHPWJ) Paint Stripping 3.830 0.000 (3.830) 0.000 0.000 0.000 0.000G695G3 Generic Automatic Test Station (GATS) 0.000 0.000 0.000 0.000 0.000 0.000 0.000L969T1 Like-Instrumented Testers, Phase III (VDATS) 25.750 0.000 0.000 0.000 25.750 25.750 0.000
CSN A4DM DMT Budget 1.460 0.000 (1.337) 0.000 0.123 0.123 0.000 DMT Total 84.400 (0.800) 0.000 0.000 83.600 83.419 0.181 DMT OA (Operating Authority) (5.800) 0.000 0.000 0.000 (5.800) (5.800) 0.000
TOTAL DMT 78.600 (0.800) 0.000 0.000 77.800 77.619 0.181OA 5.800 (5.800) 0.000 0.000 0.000 0.000 0.000 Baseline w/ OA 84.400 (6.600) 0.000 0.000 77.800 77.619 0.181
FOR OFFICIAL USE ONLY Fund 9C CSAG Maintenance
106

Fund 9C(Dollars in Millions)
Capital Budget ExecutionAir Force Working Capital Fund
Consolidated Sustainment Activity Group (CSAG)
Fiscal Year (FY) 2011Budget Estimates
February 2010
CSAG Maintenance Division
FY 2009
Line Number Project PB (Set Cost) ReprogsInternal
Transfers CarryoverApproved Proj
CostCurrent Proj
Cost Asset/
Deficiency
SOFTWARE DEVELOPMENT
S97002 DMAPS Development/Implementation 3.400 (3.400) 0.000 0.000 0.000 0.000 0.000
TOTAL SOFTWARE 3.400 (3.400) 0.000 0.000 0.000 0.000 0.000
MINOR CONSTRUCTION
H9MA06 Ramp concrete, South Side of B3102 0.000 (0.002) 0.190 0.000 0.188 0.188 0.000H75CMB Remove Asphalt and Pave w/ Concrete NE B2122 PH.1 0.750 0.000 0.000 0.000 0.750 0.750 0.000H85XM4 Pave Scrap Metal Yard 0.000 (0.242) 0.750 0.000 0.508 0.508 0.000H75GM6 Bldg 3 HVAC & Upgrades 0.000 0.000 0.700 0.000 0.700 0.700 0.000H78AM2 B801 Improvements 0.000 0.000 0.300 0.000 0.300 0.300 0.000H9MA07 Install Electronic Gate/Security System 0.000 0.000 0.207 0.000 0.207 0.207 0.000H9MA04 Aircraft Engine Blast Deflector, ALC Ramp East of K5/K6 0.000 0.000 0.043 0.000 0.043 0.043 0.000H85MG7 Cabin Pressure Support J-Row 0.000 0.000 0.050 0.000 0.050 0.050 0.000H75GM2 Install A/C Bomber Consolidation Offices 0.750 0.000 (0.750) 0.000 0.000 0.000 0.000H75BME Clean Room for Tab/Ruddevator Shop - 300,000 class 0.750 0.000 (0.750) 0.000 0.000 0.000 0.000H75GM5 Convert East Dock To Paint 0.740 (0.740) 0.000 0.000 0.000 0.000 0.000A009M1 Paint Shop Expansion, Drying/Curing Area. 0.500 (0.091) 0.000 0.000 0.409 0.409 0.000A25HM4 PMB Bead Blasting Booth 0.445 0.000 0.000 0.000 0.000 0.000 0.000L731M1 Live Pad F-15's by bldg 131 0.000 0.000 0.260 0.000 0.705 0.705 0.000LA6BM2 Construct Storage Facility at old Bldg 650 Site 0.000 0.000 0.700 0.000 0.700 0.700 0.000L45PMR Welding Shop, B321 Yard 0.000 0.000 0.500 0.000 0.500 0.500 0.000L96PM3 Construct Facility Enclosure 0.350 (0.013) 0.125 0.000 0.462 0.462 0.000L96BM2 Construct Pad for Fence 0.700 (0.700) 0.000 0.000 0.000 0.000 0.000L96AM1 Install Chilled Water System B180 0.000 (0.144) 0.400 0.000 0.256 0.256 0.000L45PM5 Construct Kitting Facility for C-130 AMP 0.700 0.000 0.000 0.000 0.700 0.700 0.000L96PM4 Special Tools Bldg (F-15) 0.700 0.000 (0.700) 0.000 0.000 0.000 0.000L96PM5 Access road behind Bldg 137 0.700 0.000 (0.700) 0.000 0.000 0.000 0.000L96BM3 F-15 Engine Storage Apron 0.700 0.000 (0.625) 0.000 0.075 0.075 0.000L96BM4 Convert Bldg 648 to Electronics Prod Area 0.700 0.000 (0.700) 0.000 0.000 0.000 0.000
TOTAL MINOR CONSTRUCTION 8.485 (1.932) 0.000 0.000 6.553 6.553 0.000
162.093 4.484 0.000 0.000 166.577 165.571 1.006TOTAL FY 2009 CAPITAL OBLIGATION AUTHORITY
FOR OFFICIAL USE ONLY Fund 9C CSAG Maintenance
107

Fund 9C(Dollars in Millions)
Capital Budget ExecutionAir Force Working Capital Fund
Consolidated Sustainment Activity Group (CSAG)
Fiscal Year (FY) 2011Budget Estimates
February 2010
CSAG-Supply Division
FY 2009
Line Number Approved Project PB (Set Cost) Reprogs
Internal Transfers
Approved Proj Cost
Current Proj Cost (Est)
Asset/ Deficiency Explanation
EQUIPMENTTotal 0.000 0.000 0.000 0.000 0.000 0.000
ADPE & TELECOM GCSS-AF DS 2.413 (2.110) (0.303) 0.000 0.000 0.000 KDDS (formerly Keystone) 0.000 0.000 0.000 0.000 0.000 0.000 AFWCF BDT (formerly ABACUS) 0.000 0.000 0.000 0.000 0.000 0.000 ADPE 0.000 0.000 0.303 0.303 0.301 0.002Total 2.413 (2.110) 0.000 0.303 0.301 0.002
SOFTWARE DEVELOPMENT AFWCF BDT (formerly ABACUS) 0.000 0.000 0.000 0.000 0.000 0.000 GCSS-AF DS 3.925 0.000 0.600 4.525 4.525 0.000 $.521 carryover for award fees KDDS (formerly Keystone) 0.325 0.000 0.000 0.325 0.324 0.001 PRPS 2.701 0.000 0.170 2.871 2.867 0.004 $.124 carryover for award fees CSWS/DE 2.100 (1.474) (0.170) 0.456 0.067 0.389 ABACUS 1.500 (0.900) (0.600) 0.000 0.000 0.000Total 10.551 (2.374) 0.000 8.177 7.783 0.394
MINOR CONSTRUCTIONTotal 0.000 0.000 0.000 0.000 0.000 0.000
FY TOTAL 12.964 (4.484) 0.000 8.480 8.084 0.396
FOR OFFICIAL USE ONLY Fund 9C CSAG Supply
Note: Dollars were reprogrammed to CSAG Maintenance
FOR OFFICIAL USE ONLY Fund 9C CSAG Supply
108

Fund 9a(Dollars in Millions)
Activity Group Capital Investment SummaryAir Force Working Capital Fund
Transportation Working Capital Fund
Fiscal Year (FY) 2011Budget Estimates
February 2010
Line ItemNumber Description Quantity Total Cost Quantity Total Cost Quantity Total Cost
A. EquipmentA(3) New Mission $0.0 $0.0 $0.0A(1) Replacement
Various types and cats of equip for safety and ops - SDDC $5.0 $0.5 $0.0Various Non-ADPE replacement items - AMC $3.0 $0.4 $2.4
Subtotal $8.0 $0.9 $2.4
B. ADPE & Telecomm Automated Transportation Data (AUTOSTRAD) 2000 $2.3 $1.2 $2.0 Consolidated Air Mobility Planning System (CAMPS) $1.9 $0.0 $0.8 Corporate Data Solution (CDS) $0.0 $0.0 $0.3 Corporate Environment (CE) $0.1 $1.4 $1.2 Computing Infrastructure (CI) $0.0 $0.4 $0.5
Defense Personal Property System (DPS) $0.2 $0.0 $0.0 Defense Red Switch Network (DRSN) $0.0 $0.0 $0.6
Global Air Transportation Execution System (GATES) $3.7 $1.3 $0.0 Global Surface Distribution Management (GSDM) $0.3 $0.1 $0.6 Infostructure $4.6 $13.2 $17.3 Integrated Command, Control, Communications (IC3) $1.0 $0.0 $0.0 Int. Data Env/Global Trans Netwk Converg (IGC) $0.7 $6.2 $6.1 Intelligent Road/Rail Information Server (IRRIS) $0.0 $0.0 $0.3 Joint Mobility Control Group (JMCG) $0.1 $0.0 $0.0 Local Area Network (USTRANSCOM LAN) $0.7 $5.2 $4.8 Objective Wing Command Post (OWCP) $0.0 $0.0 $1.1 Theater Deployable Communications (TDC) $0.0 $0.0 $0.0
FY 09 FY 10 FY 11
Theater Deployable Communications (TDC) $0.0 $0.0 $0.0 Wing Local Area Network (Wing-LAN) - AMC $1.0 $1.3 $2.5Subtotal $16.6 $30.3 $38.1
C. Software Development (Internally Developed)Subtotal $0.0 $0.0 $0.0
D. Software Development (Externally Developed) Advanced Computer Flight Plan (ACFP) $2.5 $2.6 $2.6 Agile Trans for the 21st Century (AT21) $0.6 $8.0 $6.8 Analysis of Mobility Platform (AMP) $1.5 $1.4 $1.9 Automated Transportation Data (AUTOSTRAD) 2000 $0.5 $0.0 $0.3 Consolidated Air Mobility Planning System (CAMPS) $2.5 $2.5 $1.8 Core Automated Maintenance System (CAMS) $1.8 $3.2 $3.3 Corporate Data Solution (CDS) $1.7 $3.5 $4.8 Corporate Environment (CE) $4.5 $4.9 $4.9 Customs Process Automation (CPA) $2.1 $0.0 $2.4
For Official Use Only Fund 9a, TWCF
109
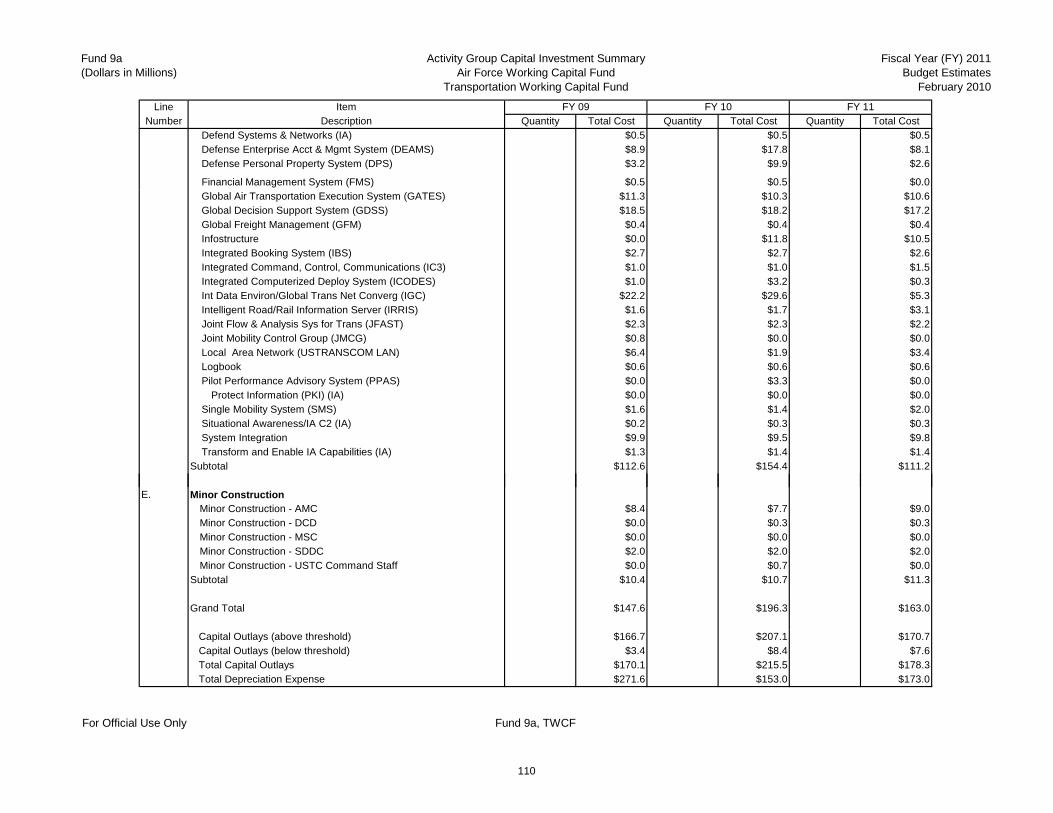
Fund 9a(Dollars in Millions)
Activity Group Capital Investment SummaryAir Force Working Capital Fund
Transportation Working Capital Fund
Fiscal Year (FY) 2011Budget Estimates
February 2010
Line ItemNumber Description Quantity Total Cost Quantity Total Cost Quantity Total Cost
FY 09 FY 10 FY 11
Defend Systems & Networks (IA) $0.5 $0.5 $0.5 Defense Enterprise Acct & Mgmt System (DEAMS) $8.9 $17.8 $8.1 Defense Personal Property System (DPS) $3.2 $9.9 $2.6
Financial Management System (FMS) $0.5 $0.5 $0.0 Global Air Transportation Execution System (GATES) $11.3 $10.3 $10.6 Global Decision Support System (GDSS) $18.5 $18.2 $17.2 Global Freight Management (GFM) $0.4 $0.4 $0.4 Infostructure $0.0 $11.8 $10.5 Integrated Booking System (IBS) $2.7 $2.7 $2.6 Integrated Command, Control, Communications (IC3) $1.0 $1.0 $1.5 Integrated Computerized Deploy System (ICODES) $1.0 $3.2 $0.3 Int Data Environ/Global Trans Net Converg (IGC) $22.2 $29.6 $5.3 Intelligent Road/Rail Information Server (IRRIS) $1.6 $1.7 $3.1 Joint Flow & Analysis Sys for Trans (JFAST) $2.3 $2.3 $2.2 Joint Mobility Control Group (JMCG) $0.8 $0.0 $0.0 Local Area Network (USTRANSCOM LAN) $6.4 $1.9 $3.4 Logbook $0.6 $0.6 $0.6 Pilot Performance Advisory System (PPAS) $0.0 $3.3 $0.0
Protect Information (PKI) (IA) $0.0 $0.0 $0.0 Single Mobility System (SMS) $1.6 $1.4 $2.0 Situational Awareness/IA C2 (IA) $0.2 $0.3 $0.3 System Integration $9.9 $9.5 $9.8 Transform and Enable IA Capabilities (IA) $1.3 $1.4 $1.4Subtotal $112.6 $154.4 $111.2
E. Minor ConstructionMinor Construction - AMC $8.4 $7.7 $9.0Minor Construction - DCD $0.0 $0.3 $0.3Minor Construction - MSC $0.0 $0.0 $0.0Minor Construction - SDDC $2.0 $2.0 $2.0Minor Construction - USTC Command Staff $0.0 $0.7 $0.0
Subtotal $10.4 $10.7 $11.3
Grand Total $147.6 $196.3 $163.0
Capital Outlays (above threshold) $166.7 $207.1 $170.7 Capital Outlays (below threshold) $3.4 $8.4 $7.6 Total Capital Outlays $170.1 $215.5 $178.3 Total Depreciation Expense $271.6 $153.0 $173.0
For Official Use Only Fund 9a, TWCF
110

Fund 9b(Dollars in Thousands)
Activity Group Capital Investment JustificationAir Force Working Capital Fund
Transportation Working Capital Fund
Fiscal Year (FY) 2011Budget Estimates
February 2010
Air Mobility Command/Transportation/February 2010 HQ AMC, Scott AFB IL
Element of Cost Quantity Unit Cost Total Cost Quantity Unit Cost Total Cost Quantity Unit Cost Total CostA. EquipmentA(1) ReplacementA(2) ProductivityA(3) New MissionA(4) Environmental ComplianceSubtotal $0.0 $0.0 $0.0
B. ADPE/TelecommB(1) Computer Hardware $0.0 $0.0 $0.0 B(2) Computer SoftwareB(3) TelecommunicationsB(3) Other ComputerSubtotal $0.0 $0.0 $0.0
C. Software DevelopmentC(1) Planning/DesignC(2) System Development $2,554.0 $2,580.0 $2,621.0 C(3) DeploymentC(4) Mgt/Tech SupportSubtotal $2,554.0 $2,580.0 $2,621.0
D. Minor ConstructionSubtotal $0.0 $0.0 $0.0
TOTAL $2,554.0 $2,580.0 $2,621.0 Narrative Justification:
Component/Activity/Date Line No. & Item Description Activity IdentificationAdvanced Computer Flight (ACFP)
FY09 FY10 FY11
Description: Advanced Computer Flight Planning (ACFP) program is a flight planning system used to produce wind optimized flight plans. Users are able to create flight plans via internet or remote dial‐up. Additional capabilities include weather information Notice to Airmen (NOTAM) access creation of 175/1801 forms and electronic flight plan filingDescription: Advanced Computer Flight Planning (ACFP) program is a flight planning system used to produce wind optimized flight plans. Users are able to create flight plans via internet or remote dial‐up. Additional capabilities include weather information, Notice to Airmen (NOTAM) access, creation of 175/1801 forms, and electronic flight plan filing.
Mission Benefits: ACFP provides foundation flight planning capabilities for inclusion in the Air Force (AF) flight planning systems. It also reduces the risk of flight planning/management failure by running on modem hardware, operating systems, and databases. It provides common interface to all Headquarters Air Mobility (HQ AMC) Command and Control (C2) systems requiring flight plan generation. Deliverables: FY09: Modifications required to implement Mission Assurance Category 1 required capabilities to provide alternative site capabilities. Software (SW) upgrades required to elevate to vendor supported environment and ensure vendor supplied security patches are available. This will bring ACFP in compliance with Federal Desktop Core Compliance requirements; FY10: Modifications required to ensure continued availability of Navigational Aid data required to produce flight plans. Current Digital Aeronautical Flight Information File (DAFIF) interface to be retired and replaced with new format/interface; FY11: Modifications required to manage obsolescence and supportability of ACFP, as well as remaining compliant with security and Department of Deferse (DoD) systems policies.
Economic Analysis: Economic Analysis (EA) certified March 2008. Estimated Certification July 2009.
Impact: If not funded, potential failure of HQ AMC's and United States Transportation Command (USTRANSCOM) premiere flight planning system that provides wind‐optimized routes of flight to the warfighter. Without this capability, the flight managers will not be able to centrally file/dispatch flight plans for the thousands of Mobility Air Force missions and there will be an increased risk of information security threats to the system.There would be no SW updates/patches being published for this antiquated system. .
Software: Not applicable.
For Official Use Only Fund 9b, TWCF
111

Fund 9b(Dollars in Thousands)
Activity Group Capital Investment JustificationAir Force Working Capital Fund
Transportation Working Capital Fund
Fiscal Year (FY) 2011Budget Estimates
February 2010
Element of Cost Quantity Unit Cost Total Cost Quantity Unit Cost Total Cost Quantity Unit Cost Total CostA. EquipmentA(1) ReplacementA(2) ProductivityA(3) New MissionA(4) Environmental ComplianceSubtotal $0.0 $0.0 $0.0
B. ADPE/TelecommB(1) Computer HardwareB(2) Computer SoftwareB(3) TelecommunicationsB(3) Other ComputerSubtotal $0.0 $0.0 $0.0
C. Software DevelopmentC(1) Planning/DesignC(2) System Development $1,512.2 $1,441.0 $1,936.0 C(3) DeploymentC(4) Mgt/Tech SupportSubtotal $1,512.2 $1,441.0 $1,936.0
D. Minor ConstructionSubtotal $0.0 $0.0 $0.0
TOTAL $1,512.2 $1,441.0 $1,936.0 Narrative Justification:
Activity IdentificationUSTRANSCOM Command Staff/Transportation/February 2010
FY09 FY10 FY11Command Staff
Line No. & Item DescriptionAnalysis of Mobility Platform (AMP)
Component/Activity/Date
Description: The Analysis of Mobility Platform (AMP) is an end‐to‐end modeling and simulation environment to support programmatic analysis, planning, execution analysis and peacetime operations. The primary focus of AMP is to support progammatic analysis. AMP allows mobility analysts to provide multi‐level detailed analyses to support Department of Defense (DOD) mobility analytical studies. AMP consists of a federation of models linked by a set of intelligent agents and a runtime infrastructure (RTI) which allows the models to pass data to one another in parallel during model execution. This results in a highly organized approach to
bilit d li i i l i t d d i l h d l tf
Description: The Analysis of Mobility Platform (AMP) is an end‐to‐end modeling and simulation environment to support programmatic analysis, planning, execution analysis and peacetime operations. The primary focus of AMP is to support progammatic analysis. AMP allows mobility analysts to provide multi‐level detailed analyses to support Department of Defense (DOD) mobility analytical studies. AMP consists of a federation of models linked by a set of intelligent agents and a runtime infrastructure (RTI) which allows the models to pass data to one another in parallel during model execution. This results in a highly organized approach to mobility modeling in a single environment and accessed on a single hardware platform.
Mission Benefits: This modeling and simulation federation provides integrated, authoritative modeling, simulation, and analysis tools for effective and efficient warfighter power projection and sustainment long range planning. Deliverables: FY09 work will add support for global infrastructure analysis ($266K), add surface modeling capabilities ($385K), integrate End‐to‐End Distribution model ($160K), support additional federates ($885K), and enhance analytical efficiency ($325K). FY10 will start development of cost modeling and assessment ($515K), continue surface model development ($315K), continue global infrastructure analysis ($325K), incorporate data mining tools ($150K), enhance interaction with Joint Integrated Contingency Model ($50K), and AMP enhancements to include Analytical SOA ($585K). FY11 will include complete seaport simulation ($100K), surface model activity ($270K), Distribution Performance Nodal Modeling (DPNM)($125K), enhancing analytical efficiencies ($200K), data mining tools ($50K), auto‐population of AMP data fields ($200K), analytic SOA ($390K), and seabasing enhancements ($175K). The FY12 work will continue enhancing the AMP Seabasing capability, AMP Surface Modeling, DPNM, and AMP, APOD Model, MIDAS, and ELIST integration.
Economic Analysis: Certified on January 2009.
Impact: Without this investment, United States Transportation Command (USTRANSCOM) will be unable to provide a Modeling and Simulation environment of interoperable, collaborative models and execution systems capable of providing accurate and consistent answers at the required breadth and depth of the Defense Transportation System (DTS) problem space.
Software: N/A
For Official Use Only Fund 9b, TWCF
112

Fund 9b(Dollars in Thousands)
Activity Group Capital Investment JustificationAir Force Working Capital Fund
Transportation Working Capital Fund
Fiscal Year (FY) 2011Budget Estimates
February 2010
Element of Cost Quantity Unit Cost Total Cost Quantity Unit Cost Total Cost Quantity Unit Cost Total CostA. EquipmentA(1) ReplacementA(2) ProductivityA(3) New MissionA(4) Environmental ComplianceSubtotal $0.0 $0.0 $0.0
B. ADPE/TelecommB(1) Computer HardwareB(2) Computer SoftwareB(3) TelecommunicationsB(3) Other ComputerSubtotal $0.0 $0.0 $0.0
C. Software DevelopmentC(1) Planning/DesignC(2) System Development $558.8 $7,989.0 $6,832.0 C(3) DeploymentC(4) Mgt/Tech SupportSubtotal $558.8 $7,989.0 $6,832.0
D. Minor ConstructionSubtotal $0.0 $0.0 $0.0
TOTAL $558.8 $7,989.0 $6,832.0 Narrative Justification:
Line No. & Item DescriptionAgile Transportation for the 21st Century (AT21)
Activity IdentificationCommand Staff
Component/Activity/DateUSTRANSCOM Command Staff/Transportation/February 2010
FY09 FY10 FY11
Description: Agile Transportation for the 21st Century (AT21) will provide continuous process improvement with supporting information technology that improves forecast accuracy; optimizes transportation planning in joint distribution operations (JDO) and increases on‐time delivery of forces and sustainment at least cost given operational needs/constraints.
AT21 includes the influence of stock locations for optimized transportation and leverages the results of supply chain and force movement optimization efforts.
Mi i B fit AT21 ill id i d ti d fi it d li d b t l t t ti l ti t f ll t b t t d ’ t i t Additi l b fit i l d
Description: Agile Transportation for the 21st Century (AT21) will provide continuous process improvement with supporting information technology that improves forecast accuracy; optimizes transportation planning in joint distribution operations (JDO) and increases on‐time delivery of forces and sustainment at least cost given operational needs/constraints.
AT21 includes the influence of stock locations for optimized transportation and leverages the results of supply chain and force movement optimization efforts.
Mission Benefits: AT21 will provide improved time‐definite delivery and best‐value transportation solutions to fully support combatant commanders’ movement requirements. Additional benefits include:‐Meet Combatant Commanders’, other authorized DOD‐supported customers’, and multinational delivery requirements while providing optimization through improved mode determination, network modeling, and asset scheduling ‐ Improve agility, responsiveness, and reliability of the DOD supply chain ‐ Enhance multi‐modal analysis and streamline decision processes, including transportation feasibility assessment while movement plans are still malleable to align expectations anddistribution pipeline capabilities‐ Provide optimization to solve a periodic (e.g., daily, weekly, monthly) set of movement requirements iteratively to satisfy one or more constraints (e.g., solve for delivery date, solve for cost, solve for maximize asset utilization, etc.); optimization also supports rapid “what if” analyses to collaboratively find best fit solutions for a given scenario.‐ Establish a process framework using standardized, repeatable processes thus reducing manual workload that capture and execute movement requirements in a collaborative environment‐ Early identification of bottlenecks, missed transfers, work‐arounds, and mission change notifications‐ As part of the DPO performance measure framework, AT21 will improve delivery performance, decrease cost given operational needs/constraints, and increase throughput and visibility.
Deliverables: FY09 through FY12‐ Business Process Management capability. FY10 $1.2M increase to topline.
Economic Analysis: An Economic Analysis (EA) and Life Cycle Cost Estimate (LCCE) was certified in July 2007. The EA and LCCE are being updated; revisions will be completed in 4th QTR FY09.Impact: Inability to provide the mission benefits stated above resulting in inefficient operation of the Joint Deployment Distribution Environment (JDDE).Software: AT21 will implement commericial and/or government off‐the‐shelf business process management and optimization tool suites.
For Official Use Only Fund 9b, TWCF
113

Fund 9b(Dollars in Thousands)
Activity Group Capital Investment JustificationAir Force Working Capital Fund
Transportation Working Capital Fund
Fiscal Year (FY) 2011Budget Estimates
February 2010
Surface Deployment and Distribution Center/Transportation/February 2010 SDDC
Element of Cost Quantity Unit Cost Total Cost Quantity Unit Cost Total Cost Quantity Unit Cost Total CostA. EquipmentA(1) ReplacementA(2) ProductivityA(3) New MissionA(4) Environmental ComplianceSubtotal $0.0 $0.0 $0.0
B. ADPE/TelecommB(1) Computer Hardware $2,311.0 $1,198.0 $2,060.0 B(2) Computer SoftwareB(3) TelecommunicationsB(3) Other ComputerSubtotal $2,311.0 $1,198.0 $2,060.0
C. Software DevelopmentC(1) Planning/DesignC(2) System Development $519.0 $0.0 $262.0 C(3) DeploymentC(4) Mgt/Tech SupportSubtotal $519.0 $0.0 $262.0
D. Minor ConstructionSubtotal $0.0 $0.0 $0.0
TOTAL $2,830.0 $1,198.0 $2,322.0 Narrative Justification:
Component/Activity/Date Line No. & Item Description Activity IdentificationAutomated Transportation Data 2000 (AUTOSTRAD 2000)
FY09 FY10 FY11
Description: The Automated Transportation Data (AUTOSTRAD) 2000 initiative maintains Military Surface Deployment and Distribution Commands (SDDCs) automation architecture in an Open System Environment (OSE) infrastructure. While major automated information systems at SDDC are developed by project managers under full Department of Defense (DOD) life cycle procedures, the AUTOSTRAD 2000 program provides the Information Mission Area (IMA) common‐user utilities to support the SDDC population at large.
Mission Benefits: The program supports approximately 2,100 individuals at 52 worldwide headquarters locations, 5 major subordinate commands and ports. It provides ongoing modernization of the underlying core of common‐user utility functions such as: common user open access data; mission systems; data access tools to allow the analytical staff access to all SDDC data and manipulate it as needed; Storage Area Network/Network attached storage; Optical Storage
( ) ( ) / ( )
Description: The Automated Transportation Data (AUTOSTRAD) 2000 initiative maintains Military Surface Deployment and Distribution Commands (SDDCs) automation architecture in an Open System Environment (OSE) infrastructure. While major automated information systems at SDDC are developed by project managers under full Department of Defense (DOD) life cycle procedures, the AUTOSTRAD 2000 program provides the Information Mission Area (IMA) common‐user utilities to support the SDDC population at large.
Mission Benefits: The program supports approximately 2,100 individuals at 52 worldwide headquarters locations, 5 major subordinate commands and ports. It provides ongoing modernization of the underlying core of common‐user utility functions such as: common user open access data; mission systems; data access tools to allow the analytical staff access to all SDDC data and manipulate it as needed; Storage Area Network/Network attached storage; Optical Storage Commercial‐Off‐the‐Shelf (COTS); Digital Video Disk (DVD+ Memory) to replace hard copy library stacks with electronic library services; DVD/Compact Disk Read Only Memory (CD ROM) based electronic preparation and printing of forms; video teleconferencing and low cost Video Information (VI) COTS. AUTOSTRAD 2000 provides Local Area Networks (LAN), communications backbone, communications infrastructure upgrades at ports and piers, Land Mobile Radio (LMR) equipment replacements, web application to provide a common user interface to SDDCs broad customer base, and contract support for unique requirements.
Deliverables: FY09 ‐ Upgrade group/battalion/HQ network infrastructure and LMR upgrade/replacement. FY10 ‐ Phase replacement, refresh and upgrade of group/battalion/HQ network infrastructure and LMR upgrade/replacement; FY11 ‐ Phase replacement, refresh and upgrade of group/battalion/HQ network infrastructure and LMR upgrade/replacement.
Economic Analysis: Certified 22 Apr 09.
Impact: The AUTOSTRAD project funds SDDCs network infrastructure worldwide as well as funds SDDCs internal administrative systems such as tasker tracking; Base Realignment and Closure (BRAC) Central, Capability Request (CAPR) tracking; the Electronic Transportation Acquisition (ETA) single sign‐on front end to all SDDCs Defense Transportation System (DTS) systems; the consolidated help desk that supports the SDDC systems, and the history database that stores all historical data for the SDDC systems. Critical infrastructure initiatives that would not be funded include the stand up of the new 598th Transportation Group facility to be built in Rotterdam and network upgrades at the ports supported by the 597th, 598th, and 599th Transportation Groups.
Software: Not applicable.
For Official Use Only Fund 9b, TWCF
114

Fund 9b(Dollars in Thousands)
Activity Group Capital Investment JustificationAir Force Working Capital Fund
Transportation Working Capital Fund
Fiscal Year (FY) 2011Budget Estimates
February 2010
Air Mobility Command/Transportation/February 2010 HQ AMC, Scott AFB IL
Element of Cost Quantity Unit Cost Total Cost Quantity Unit Cost Total Cost Quantity Unit Cost Total CostA. EquipmentA(1) ReplacementA(2) ProductivityA(3) New MissionA(4) Environmental ComplianceSubtotal $0.0 $0.0 $0.0
B. ADPE/TelecommB(1) Computer Hardware $1,946.0 $0.0 $844.0 B(2) Computer SoftwareB(3) TelecommunicationsB(3) Other ComputerSubtotal $1,946.0 $0.0 $844.0
C. Software DevelopmentC(1) Planning/DesignC(2) System Development $2,528.0 $2,483.0 $1,820.0 C(3) DeploymentC(4) Mgt/Tech SupportSubtotal $2,528.0 $2,483.0 $1,820.0
D. Minor ConstructionSubtotal $0.0 $0.0 $0.0
TOTAL $4,474.0 $2,483.0 $2,664.0 Narrative Justification:
Component/Activity/Date Line No. & Item Description Activity IdentificationConsolidated Air Mobility Planning System (CAMPS)
FY09 FY10 FY11
Description: Consolidated Air Mobility Planning System (CAMPS) is Headquarters' Air Mobility Command (HQ AMCs) Command and Control (C2) planning and scheduling system that provides mobility mission planners with an integrated view for airlift and air refueling requirements management, planning, and scheduling of AMC/Mobility Air Forces (MAF) air mobility resources to support peacetime, contingency, humanitarian, and wartime operations. CAMPS provides separate unclassified and classified requirements, planning and scheduling capabilities, and also provides advanced user capabilities for operational planning and allocation management. CAMPS provides a joint capability to gather and manage mobility requirements for all Aerial Refueling Missions, Special Assignment Airlift Missions, and Central Command's (CENTCOM) airlift requirements. CAMPS Migration Completion Date (MCD) was achieved in Feb 02, and will continue development under the approved MAF C2 Framework Capabilities Design Document (CDD).
Description: Consolidated Air Mobility Planning System (CAMPS) is Headquarters' Air Mobility Command (HQ AMCs) Command and Control (C2) planning and scheduling system that provides mobility mission planners with an integrated view for airlift and air refueling requirements management, planning, and scheduling of AMC/Mobility Air Forces (MAF) air mobility resources to support peacetime, contingency, humanitarian, and wartime operations. CAMPS provides separate unclassified and classified requirements, planning and scheduling capabilities, and also provides advanced user capabilities for operational planning and allocation management. CAMPS provides a joint capability to gather and manage mobility requirements for all Aerial Refueling Missions, Special Assignment Airlift Missions, and Central Command's (CENTCOM) airlift requirements. CAMPS Migration Completion Date (MCD) was achieved in Feb 02, and will continue development under the approved MAF C2 Framework Capabilities Design Document (CDD).
Mission Benefits: CAMPS will provide HQ AMCs mission planners and schedulers with the integrated, automated tools they require to manage and prioritize mobility requirements and to analyze, plan, and schedule mobility missions to meet airlift and air refueling requirements. These tools will optimize the use of scarce Defense Transportation System (DTS) airlift assets by: reducing empty (or low) cargo weight missions; reducing the number of supplemental contract airlift required; providing timely and accurate contingency support through rapid and more efficient planning tools; improving asset tracking; and improving response to supported unified or combined command requirements. Additionally, this capability will be provided in a more secure, user‐friendly, and integrated environment. Deliverables: FY09: Initial migration to AMC Enclave and shared use of basic network services. (FY09‐FY11); FY10: Implement improved data sharing via web services to better integrate force‐level and deployed requirements management, planning, and scheduling; FY11: Migrate applications to fully web‐based, and provide enhanced integration between global requirements management, planning and scheduling, execution and movement of tracking systems and users.
Economic Analysis: Certified May 2007. EA is currently being reaccomplished by Center of Expertise (CoE) and estimated certification November 2009.
Impact: Without CAMPS, United States Transportation Command (USTRANSCOM) and joint worldwide customers would be unable to input or submit airlift and air refueling requirements, and would lose visibility of those scheduled missions. HQ AMC would experience a major loss of capability to efficiently plan and schedule complex airlift and air refueling missions to meet real‐world mobility and contingency requirements. In addition, planners would be unable to integrate automated decision support tools into the dynamic planning and scheduling process. HQ AMC would be unable to improve and standardize integration and information flow to other C2 systems. This would increase the potential for loss of critical C2 data and the inefficient or ineffective use of scarce DTS mobility resources, and even more supplemental contract expenditures will be made. Also, CAMPS would be unable to achieve USTRANSCOM's architecture goals and hardware maintenance costs would increase due to continued use of outdated hardware platforms.
Software: License fees are required for Oracle Database Management System (DBMS), Windows/ Sun operating system support, Rational ClearQuest, SharePlex, and Structured Query Language (SQL) Report Writer
For Official Use Only Fund 9b, TWCF
115

Fund 9b(Dollars in Thousands)
Activity Group Capital Investment JustificationAir Force Working Capital Fund
Transportation Working Capital Fund
Fiscal Year (FY) 2011Budget Estimates
February 2010
Air Mobility Command/Transportation/February 2010 HQ AMC, Scott AFB IL
Element of Cost Quantity Unit Cost Total Cost Quantity Unit Cost Total Cost Quantity Unit Cost Total CostA. EquipmentA(1) ReplacementA(2) ProductivityA(3) New MissionA(4) Environmental ComplianceSubtotal $0.0 $0.0 $0.0
B. ADPE/TelecommB(1) Computer HardwareB(2) Computer SoftwareB(3) TelecommunicationsB(3) Other ComputerSubtotal $0.0 $0.0 $0.0
C. Software DevelopmentC(1) Planning/Design $1,748.0 $3,255.0 $3,306.0 C(2) System DevelopmentC(3) DeploymentC(4) Mgt/Tech SupportSubtotal $1,748.0 $3,255.0 $3,306.0
D. Minor ConstructionSubtotal $0.0 $0.0 $0.0
TOTAL $1,748.0 $3,255.0 $3,306.0 Narrative Justification:
Component/Activity/Date Line No. & Item Description Activity IdentificationCore Automated Maintenance System for Mobility (CAMS)
FY09 FY10 FY11
Description: Core Automated Maintenance System For Mobility (CAMS‐FM/G081) is the central common source of all unclassified maintenance data for mobility airlift aircraft. It accumulates, validates, processes, stores, and makes accessible to Air Force (AF) and Air Mobility Command (AMC) managers the data necessary to keep AMC assigned and gained aircraft combat‐ready. G081 is a centrally managed On‐Line Transactional Processing (OLTP) information system. The G081 system currently processes an average of 6 to 7 million on‐line transactions per month on a mainframe computer in the Defense Information Systems Agency (DISA) Computing Services System Management Centers (SMCs) at Oklahoma City and Odgen. Worldwide logistics users connect to G081 at the Defense Enterprise Computer Center (DECC) via the NIPRNET from desktop PCs (thick‐clients) and from thin‐client devices utilizing Radio Frequency (RF) technology from the point‐of‐maintenance. AMC home and enroute base locations access the central OLTP system, providing worldwide visibility of aircraft status, location and availability of all AMC assigned and gained (Air National Guard and Air Force Reserve Center) airlift and tanker airlift. G081 centrally stores, in real time, all information at the DISA SMCs needed to support the AMC global mission of its aircraft. G081 is still undergoing required enhancements needed to support the Global Combat Support System (GCSS) Air Force Integrated Framework architecture and AMCmission planning & execution requirements for the Tanker
Description: Core Automated Maintenance System For Mobility (CAMS‐FM/G081) is the central common source of all unclassified maintenance data for mobility airlift aircraft. It accumulates, validates, processes, stores, and makes accessible to Air Force (AF) and Air Mobility Command (AMC) managers the data necessary to keep AMC assigned and gained aircraft combat‐ready. G081 is a centrally managed On‐Line Transactional Processing (OLTP) information system. The G081 system currently processes an average of 6 to 7 million on‐line transactions per month on a mainframe computer in the Defense Information Systems Agency (DISA) Computing Services System Management Centers (SMCs) at Oklahoma City and Odgen. Worldwide logistics users connect to G081 at the Defense Enterprise Computer Center (DECC) via the NIPRNET from desktop PCs (thick‐clients) and from thin‐client devices utilizing Radio Frequency (RF) technology from the point‐of‐maintenance. AMC home and enroute base locations access the central OLTP system, providing worldwide visibility of aircraft status, location and availability of all AMC assigned and gained (Air National Guard and Air Force Reserve Center) airlift and tanker airlift. G081 centrally stores, in real time, all information at the DISA SMCs needed to support the AMC global mission of its aircraft. G081 is still undergoing required enhancements needed to support the Global Combat Support System (GCSS)‐Air Force Integrated Framework architecture and AMC mission planning & execution requirements for the Tanker Airlift Control Center (TACC) as well as the maintenance production environment.
Mission Benefits: CAMS‐FM/G081 is HQ AMC's primary mission critical computer resource. It provides HQ AMC, the United States Transportation Command (USTRANSCOM), TACC and AF leaders with worldwide visibility/ of aircraft availability, status, capability, and utilization data. The logistics Command and Control (C2) interface is with Command and Control Information Processing System (C2IPS), Global Decision Support System (GDSS), Global Transportation Network (GTN), and Reliability and Maintainability Management Information System (REMIS). The capital investment funds provide logistics infrastructure Local Area Network (LAN), client/server capability, to move to an open environment, and to support Broker. Deliverables: FY09: C5 Avionics Modernization Program (AMP); Improved Decision Information: User Accessibility ; C‐17 Enhancements: FY10: C5 Reliability Enhancement and Re‐Engineering Program (RERP ) Improved Analysis Capability; FY11: C‐17 Interactive Electronic Technical Manual (ETM) Integration, Upgrade Logistics Executive Decision Support Dashboard.
Economic Analysis: EA was certified 25 March 2008. Updated EA was submitted in April 09 and has been certified.
Impact: If not funded, there would be a loss of interface with GDSS, C2IPS, GTN, Standard Base Supply System (SBSS), REMIS, Comprehensive Engine Management System (CEMS), and Logistics Composite Module (LCOM). The capability to identify and allocate in‐commission AMC aircraft by tapping one database would be lost. The aircraft availability increase (+ 8%) due to automated system use would be lost. USTRANSCOM, TACC, and mobility planners would not have central visibility of the status of AMCs worldwide fleet. The aircraft maintenance systems will not be logistically supportable. Finally, there would be no ability to implement the Department of Defense (DoD) directed joint Computer‐Aided Acquisition & Logistics Support (CALS).
Software: Not applicable.
For Official Use Only Fund 9b, TWCF
116

Fund 9b(Dollars in Thousands)
Activity Group Capital Investment JustificationAir Force Working Capital Fund
Transportation Working Capital Fund
Fiscal Year (FY) 2011Budget Estimates
February 2010
Element of Cost Quantity Unit Cost Total Cost Quantity Unit Cost Total Cost Quantity Unit Cost Total CostA. EquipmentA(1) ReplacementA(2) ProductivityA(3) New MissionA(4) Environmental ComplianceSubtotal $0.0 $0.0 $0.0
B. ADPE/TelecommB(1) Computer Hardware $0.0 $0.0 $262.0 B(2) Computer SoftwareB(3) TelecommunicationsB(3) Other ComputerSubtotal $0.0 $0.0 $262.0
C. Software DevelopmentC(1) Planning/DesignC(2) System Development $1,728.1 $3,518.0 $4,747.0 C(3) DeploymentC(4) Mgt/Tech SupportSubtotal $1,728.1 $3,518.0 $4,747.0
D. Minor ConstructionSubtotal $0.0 $0.0 $0.0
TOTAL $1,728.1 $3,518.0 $5,009.0 Narrative Justification:
FY09 FY10 FY11
Activity IdentificationCommand Staff
Component/Activity/Date Line No. & Item DescriptionUSTRANSCOM Command Staff/Transportation/February 2010 Corporate Data Solution (CDS)
Description: Corporate Data Solution (CDS) Program is responsible for providing data, information, knowledge, and engineering services in support of United States Transportation Command (USTRANSCOM) business processes. The program is focused on managing data in a net-centric environment as an enterprise asset by implementing properly engineered data exchanges, defining common vocabulary, federating metadata, and overseeing data quality initiatives. The six (6) System, Project, Initiative, Functionality (SPIF) of CDS are: Data Quality, Data Architecture and Information Engineering, Reference Data Management, Enterprise Management, Knowledge Management, and Enterprise Impact Analysis. CDS Initial Operating Capability (IOC) is expected in Fiscal Year 2009 and Full Operating Capability (FOC) in Fiscal Year 2013.
Description: Corporate Data Solution (CDS) Program is responsible for providing data, information, knowledge, and engineering services in support of United States Transportation Command (USTRANSCOM) business processes. The program is focused on managing data in a net-centric environment as an enterprise asset by implementing properly engineered data exchanges, defining common vocabulary, federating metadata, and overseeing data quality initiatives. The six (6) System, Project, Initiative, Functionality (SPIF) of CDS are: Data Quality, Data Architecture and Information Engineering, Reference Data Management, Enterprise Management, Knowledge Management, and Enterprise Impact Analysis. CDS Initial Operating Capability (IOC) is expected in Fiscal Year 2009 and Full Operating Capability (FOC) in Fiscal Year 2013.
Mission Benefits: CDS will increase the effectiveness of Information Technology (IT) development and mission capability of USTRANSCOM, while decreasing overall costs. In FY09 major deliverables will be transitioning from Table Management Distribution System (TMDS) system to Transportation Reference Data Management (TRDM) system, implementation of Distribution Process Information Exchange Data Model (DPIEDM), implementation of Meta Data Repository into Corporate Resource Information Source (CRIS) database, development of Service Oriented Architecture (SOA) with implementation guidelines and 2-3 SOA services running. Other major deliverables will be development of business processes of manifests, supply due-in, and supply outbound, development of cargo status for information exchange. In FY09/FY10, Data Quality (DQ) team will be working with the Research & Development (R,D,T&E) Contractors developing a data profiling capability using Data Flux which will result in effective DQ metrics. Also in FY09, the CDS will continue the developing of the Distribution Data Community of Interest (DD COI) utilizing the structure to socialize and implement initiatives from the Corporate Service Vision (CSV). In FY09, major deliverables will include the population of the DPIEDM with the legacy interfaces, standard transactions templates and with the standard reference data in support to the implementation of the CSV. It will also include modifications to CRIS to support the Enterprise Architecture. FY10/FY12 deliverables will be the continued support of the DPIEDM and the CRIS but with more emphasis on the analysis capability that the tools provide in order to support CSV in providing "services" to the USTRANSCOM community.
Economic Analysis: Economic analysis to be completed by 30 Sep 2009.
Impact: If not funded, status quo information management and information technology development will continue but will be cumbersome to manage, expensive to execute, and will hinder the commands ability to meet Department of Defense required data sharing capabilities.
Software: License fees are at Enterprise level, paid for by Infostructure and CDS.
For Official Use Only Fund 9b, TWCF
117

Fund 9b(Dollars in Thousands)
Activity Group Capital Investment JustificationAir Force Working Capital Fund
Transportation Working Capital Fund
Fiscal Year (FY) 2011Budget Estimates
February 2010
Military Sealift Command/Transportation/February 2010
Element of Cost Quantity Unit Cost Total Cost Quantity Unit Cost Total Cost Quantity Unit Cost Total CostA. EquipmentA(1) ReplacementA(2) ProductivityA(3) New MissionA(4) Environmental ComplianceSubtotal $0.0 $0.0 $0.0
B. ADPE/TelecommB(1) Computer Hardware $441.0 $448.0 B(2) Computer SoftwareB(3) TelecommunicationsB(3) Other ComputerSubtotal $0.0 $441.0 $448.0
C. Software DevelopmentC(1) Planning/DesignC(2) System DevelopmentC(3) DeploymentC(4) Mgt/Tech SupportSubtotal $0.0 $0.0 $0.0
D. Minor ConstructionSubtotal $0.0 $0.0 $0.0
TOTAL $0.0 $441.0 $448.0 Narrative Justification:
Component/Activity/Date Line No. & Item Description Activity IdentificationMilitary Sealift Command - Computing Infrastructure (MSC-IC3)
Military Sealift Command
FY09 FY10 FY11
Description: MSC‐CI provides centralized support for ashore and afloat communications, data center operations and infrastructure, Navy Marine Corps Internet (NMCI), and global helpdesk. Description: MSC‐CI provides centralized support for ashore and afloat communications, data center operations and infrastructure, Navy Marine Corps Internet (NMCI), and global helpdesk.
‐ 24/7 helpdesk operational support ensures MSC users and customers around the world receive timely support and problem resolution.
Mission Benefits: MSC has a critical need to have a robust and reliable communications and computing infrastructure. These infrastructures are key tools for decision makers at all levels and have become an essential part of the day‐to‐day operations. MSC‐CI supports the smooth operations of the world‐wide communications infrastructure. Deliverables: Two refurbished Mobile Sealift Operations Communication (MSOC) vans each fiscal year.
Economic Analysis: Life Cycle Cost Estimate: February 2009
Impact: MSC will not be able to maintain 24/7 world‐wide communications and computing infrastructure.
Software: N/A
For Official Use Only Fund 9b, TWCF
118

Fund 9b(Dollars in Thousands)
Activity Group Capital Investment JustificationAir Force Working Capital Fund
Transportation Working Capital Fund
Fiscal Year (FY) 2011Budget Estimates
February 2010
Military Sealift Command/Transportation/February 2010
Element of Cost Quantity Unit Cost Total Cost Quantity Unit Cost Total Cost Quantity Unit Cost Total CostA. EquipmentA(1) ReplacementA(2) ProductivityA(3) New MissionA(4) Environmental ComplianceSubtotal $0.0 $0.0 $0.0
B. ADPE/TelecommB(1) Computer Hardware $100.0 $1,412.0 $1,214.0 B(2) Computer SoftwareB(3) TelecommunicationsB(3) Other ComputerSubtotal $100.0 $1,412.0 $1,214.0
C. Software DevelopmentC(1) Planning/DesignC(2) System Development $4,512.0 $4,815.0 $4,890.0 C(3) DeploymentC(4) Mgt/Tech SupportSubtotal $4,512.0 $4,815.0 $4,890.0
D. Minor ConstructionSubtotal $0.0 $0.0 $0.0
TOTAL $4,612.0 $6,227.0 $6,104.0 Narrative Justification:
Component/Activity/Date Line No. & Item Description Activity IdentificationMilitary Sealift Command - Core Enterprise Services (MSC_CES)
Military Sealift Command
FY09 FY10 FY11
Description: MSC‐CES provides Data Warehousing Tools, Engineering, Enterprise Infrastructure Services, Enterprise Architecture, Information Assurance, Continuity of Operations (COOP), Help desk Services, Ashore operations, and video services .
‐ Information Assurance includes firewall monitoring, system certification and acreditation services for Federal Information Security Management Act (FISMA) compliance mission continuity planning.‐ Data warehouse provides support for fast retrieval of data by users, managers, and staff.
Description: MSC‐CES provides Data Warehousing Tools, Engineering, Enterprise Infrastructure Services, Enterprise Architecture, Information Assurance, Continuity of Operations (COOP), Help desk Services, Ashore operations, and video services .
‐ Information Assurance includes firewall monitoring, system certification and acreditation services for Federal Information Security Management Act (FISMA) compliance mission continuity planning.‐ Data warehouse provides support for fast retrieval of data by users, managers, and staff.‐ COOP provides back‐up operating capability for Military Sealift Command (MSC) Corporate Data Center (MCDC) to be used in the event that actual MCDC becomes non‐functional.‐ Enterpise Architecture ensures all MSC systems align with federal, Department of Defense (DoD), NAvy and United States Transportation Command (USTRANSCOM) policy.
Mission Benefits: MSC has a critical need to have a robust and reliable infrastructure to support its automated information systems and networks. These systems are key elements for decision makers at all levels and have become an essential part of the day‐to‐day operations. MSC‐CES also allows connectivity and access to operational and administrative data to MSC worldwide sites. Deliverables: Lifecycle refresh and upgrade of the IT infrastructure within the MSC Corporate Data Center and Data Warehousing to collect and report command wide performance metrics.
Economic Analysis: Life Cycle Cost Estimate: February 2009
Impact: MSC will not have a common platform and access to corporate database.
Software: N/A
For Official Use Only Fund 9b, TWCF
119

Fund 9b(Dollars in Thousands)
Activity Group Capital Investment JustificationAir Force Working Capital Fund
Transportation Working Capital Fund
Fiscal Year (FY) 2011Budget Estimates
February 2010
Element of Cost Quantity Unit Cost Total Cost Quantity Unit Cost Total Cost Quantity Unit Cost Total CostA. EquipmentA(1) ReplacementA(2) ProductivityA(3) New MissionA(4) Environmental ComplianceSubtotal $0.0 $0.0 $0.0
B. ADPE/TelecommB(1) Computer HardwareB(2) Computer SoftwareB(3) TelecommunicationsB(3) Other ComputerSubtotal $0.0 $0.0 $0.0
C. Software DevelopmentC(1) Planning/DesignC(2) System Development $2,070.0 $0.0 $2,415.0 C(3) DeploymentC(4) Mgt/Tech SupportSubtotal $2,070.0 $0.0 $2,415.0
D. Minor ConstructionSubtotal $0.0 $0.0 $0.0
TOTAL $2,070.0 $0.0 $2,415.0 Narrative Justification:
FY09 FY10 FY11
Activity IdentificationCommand Staff
Component/Activity/Date Line No. & Item DescriptionUSTRANSCOM Command Staff/Transportation/February 2010 Customs Process Automation (CPA)
Description: The Customs Process Automation (CPA) program will automate the creation and distribution of customs documents and related Defense Transportation System (DTS) shipping documents. The system will provide the capabilities to: 1) create customs documents electronically; 2) populate these documents with information from Service/Agency or vendor shipper systems (Transportation Coordinators Automated Information of Movement System II (TC‐AIMS II), Global Transportation Network (GTN), Global Air Transportation Execution System (GATES), Worldwide Port System (WPS), Global Freight Management (GFM), Cargo Movement Operating System (CMOS), Defense Supply System (DPS), Transportation Operational Personal Property System (TOPS) and Defense Supply System (DSS) at the time shipments are tendered for movement; 3) capture related shipping documents (i.e., commercial bills of lading, carrier manifests, etc) and attach them to their related customs documents; 4) transmit these packages to Port of Debarkation (POD) activities
Description: The Customs Process Automation (CPA) program will automate the creation and distribution of customs documents and related Defense Transportation System (DTS) shipping documents. The system will provide the capabilities to: 1) create customs documents electronically; 2) populate these documents with information from Service/Agency or vendor shipper systems (Transportation Coordinators Automated Information of Movement System II (TC‐AIMS II), Global Transportation Network (GTN), Global Air Transportation Execution System (GATES), Worldwide Port System (WPS), Global Freight Management (GFM), Cargo Movement Operating System (CMOS), Defense Supply System (DPS), Transportation Operational Personal Property System (TOPS) and Defense Supply System (DSS) at the time shipments are tendered for movement; 3) capture related shipping documents (i.e., commercial bills of lading, carrier manifests, etc) and attach them to their related customs documents; 4) transmit these packages to Port of Debarkation (POD) activities and destination transportation offices/vendors and Host Nation Customs authorities so that the documentation arrives before the shipment; 5) file the customs entry either electronically or to print out the package; 6) report the customs clearance status of these shipments, the elapsed time required to gain clearance, the reasons for any delay, and any associated costs incurred; 7) generate adhoc reports based on this information.
Mission Benefits: 1) Accurate and complete documentation; 2) positive control and feedback on the status of customs/border clearance actions (shipment status, time required to gain clearance, delay reasons, and associated costs); 3) automated source and ad‐hoc report generation capability for customs/border clearance‐related metrics data plus in‐transit visibility graphics; 4) capability to create customs/border documents electronically, 5) capability to populate customs documents with information from service/agency or vendor shipper systems when shipments are tendered, 6) capability to capture related shipping documents (commerical bills of lading, carrier manifests, etc.); 7) capability to transmit (prior to actual shipment arrival) customs packages to ports of debarkation, including host nation customs authorities; and 8) capability to submit forms electronically and/or to print out the packages and submit them manually. Deliverables: FY08 will deploy capability for Germany and Korea to accept commercial air shipments and develop buisness processes for 2 additional countries. FY09 funding will expand automated customs processing for military/commercial air and surface shipments to three additional countries. FY10 funding will expand automated customs processing for military/commercial air and surface shipments to three additional countries. FY11‐FY12 funding will expand automated customs processing for military/commercial air and surface shipments to two additional countries.
Economic Analysis: Certified June 2006; recertification of existing EA anticipated October 2009.
Impact: If not funded, United States Transportation Command will be unable to meet mission requirements to ensure creation of shipping and customs forms ahead of shipment movement. Software: N/A
For Official Use Only Fund 9b, TWCF
120

Fund 9b(Dollars in Thousands)
Activity Group Capital Investment JustificationAir Force Working Capital Fund
Transportation Working Capital Fund
Fiscal Year (FY) 2011Budget Estimates
February 2010
Element of Cost Quantity Unit Cost Total Cost Quantity Unit Cost Total Cost Quantity Unit Cost Total CostA. EquipmentA(1) ReplacementA(2) ProductivityA(3) New MissionA(4) Environmental ComplianceSubtotal $0.0 $0.0 $0.0
B. ADPE/TelecommB(1) Computer HardwareB(2) Computer SoftwareB(3) TelecommunicationsB(3) Other ComputerSubtotal $0.0 $0.0 $0.0
C. Software DevelopmentC(1) Planning/Design $0.0 $0.0 $0.0 C(2) System Development $8,949.6 $17,795.0 $8,100.0 C(3) Deployment $0.0 $0.0 $0.0 C(4) Mgt/Tech Support $0.0 $0.0 $0.0 Subtotal $8,949.6 $17,795.0 $8,100.0
D. Minor ConstructionSubtotal $0.0 $0.0 $0.0
TOTAL $8,949.6 $17,795.0 $8,100.0 Narrative Justification:
FY09 FY10 FY11
Component/Activity/Date Activity IdentificationCommand Staff
Line No. & Item DescriptionDefense Enterprise Accounting & Management System (DEAMS)
USTRANSCOM Command Staff/Transportation/February 2010
Description: Defense Enterprise Accounting and Managment System (DEAMS) is a financial management initiative that will transform business and financial management processes and systems to provide accurate, reliable, and timely business information to support effective business decision making for United States Transportation Command (USTRANSCOM). Includes but not limited to the following core functions: funds control, accounts payable, accounts receivable, general ledger, purchasing, cost management, revenue, expenses and billing. DEAMS will interface with other systems such as travel, payroll, disbursing, and non-core accounting support systems to address financial activities. In addition to billing, DEAMS also addresses the following Business Enterprise Architecture (BEA) Packages: Accounts Receivable, Cash Management, Collections Manager, Contract Payment Management, and Cost Management.
Description: Defense Enterprise Accounting and Managment System (DEAMS) is a financial management initiative that will transform business and financial management processes and systems to provide accurate, reliable, and timely business information to support effective business decision making for United States Transportation Command (USTRANSCOM). Includes but not limited to the following core functions: funds control, accounts payable, accounts receivable, general ledger, purchasing, cost management, revenue, expenses and billing. DEAMS will interface with other systems such as travel, payroll, disbursing, and non-core accounting support systems to address financial activities. In addition to billing, DEAMS also addresses the following Business Enterprise Architecture (BEA) Packages: Accounts Receivable, Cash Management, Collections Manager, Contract Payment Management, and Cost Management.
Mission Benefits: DEAMS will provide accurate cost data allowing managers to make informed decisions that contribute to improved operating efficiency and reduced rates. DEAMS will provide accurate and timely billing of Accounts Receivable (AR), reduction in aged AR balances, and timely realization of collections. DEAMS will provide pre-validation of obligations prior to payment to eliminate unmatched disbursements and overpayments. DEAMS will capture cost of ownership at organizational levels to include: full cost of project, business line, and costs to support Activity Based Costing (ABC). DEAMS will integrate separate financial management systems into a single automated system that contributes to an environment that quickly and easily reacts to changes in business processes. DEAMS will also drive transformation in business processes and operations, enabling managers to better support the warfighter. DEAMS goals include meeting the requirements of the Business Management Modernization Program (BMMP) architecture, consistent with Department of Defense (DOD) BEA.
Economic Analysis: Business Case Analysis completed in May 2003, the Service Cost Position was updated 9 March 2005, and the Analysis of Alternatives was completed 13 August 2005. Defense BusinessSystems Certification Dashboard with Target Approval Date of 15 Jul 09 reflects a BCR of 1.05; Breakeven 2020+ and NPV of 7.957.
Impact: Existing legacy systems data fields do not use Standard Financial Information Structure (SFIS) and data fields are not standard. Therefore, USTRANSCOM remains unable to meet the Chief Financial Officers (CFO) Act of 1990 which requires an annual submission of fully auditable CFO reports using SFIS. USTRANSCOMs statutory financial management responsibility effectiveness continues to be severely diminished without high-level visibility of financial data to make informed decisions.
Software: DEAMS will use Oracle software.
For Official Use Only Fund 9b, TWCF
121

Fund 9b(Dollars in Thousands)
Activity Group Capital Investment JustificationAir Force Working Capital Fund
Transportation Working Capital Fund
Fiscal Year (FY) 2011Budget Estimates
February 2010
Air Mobility Command/Transportation/February 2010 HQ AMC, Scott AFB IL
Element of Cost Quantity Unit Cost Total Cost Quantity Unit Cost Total Cost Quantity Unit Cost Total CostA. EquipmentA(1) ReplacementA(2) ProductivityA(3) New MissionA(4) Environmental ComplianceSubtotal $0.0 $0.0 $0.0
B. ADPE/TelecommB(1) Computer Hardware $0.0 $0.0 $529.0 B(2) Computer SoftwareB(3) TelecommunicationsB(3) Other ComputerSubtotal $0.0 $0.0 $529.0
C. Software DevelopmentC(1) Planning/DesignC(2) System DevelopmentC(3) DeploymentC(4) Mgt/Tech SupportSubtotal $0.0 $0.0 $0.0
D. Minor ConstructionSubtotal $0.0 $0.0 $0.0
TOTAL $0.0 $0.0 $529.0 Narrative Justification:
Component/Activity/Date Line No. & Item Description Activity IdentificationDefense Redswitch System Network (DRSN)
FY09 FY10 FY11
Description: Defense Red Switch Network (DRSN) is a sub‐function under the Air Mobility Command (AMC) Command, Control Communications, and Computer System (C4S) program. DRSN is a Defense Information Systems Agency managed DOD critical command and control system supporting the National Command Authority. It is the most critical component of the Global Secure Voice System (GSVS). DRSN is a circuit‐switched network that provides (1) integrated RED/BLACK (secure/non‐secure) call origination/termination (2) switching interoperable secure voice conferencing with both the tactical and the strategic communities, and (3) direct interoperability with other secure voice networks through secure interfaces. DRSN rides the Defense Information Systems Network (DISN) backbone to tie all networks together. DRSN switches are located at United States Transportation Command (USTC), Headquarters AMC, 21st Air Force, and 15th Air Force.
Mission Benefits: Provides seamless interoperability of incoming and outgoing calls between USTC DRSN switch Future Narrowband Digital Terminals (FNBDTs). Deliverables: FY09: Cable infrastructure upgraded/repaired; FY10: Purchase of Switch ; FY11: Installation of Switch
Economic Analysis: Economic Analysis (EA) certified March 2009.
Impact: Without this upgrade, DRSN will not be able to communicate with Future Narrowband Digital Terminals (FNBDT) devices.
Software: Not applicable
For Official Use Only Fund 9b, TWCF
122

Fund 9b(Dollars in Thousands)
Activity Group Capital Investment JustificationAir Force Working Capital Fund
Transportation Working Capital Fund
Fiscal Year (FY) 2011Budget Estimates
February 2010
Element of Cost Quantity Unit Cost Total Cost Quantity Unit Cost Total Cost Quantity Unit Cost Total CostA. EquipmentA(1) ReplacementA(2) ProductivityA(3) New MissionA(4) Environmental ComplianceSubtotal $0.0 $0.0 $0.0
B. ADPE/TelecommB(1) Computer Hardware $0.0 $0.0 $0.0 B(2) Computer SoftwareB(3) TelecommunicationsB(3) Other ComputerSubtotal $0.0 $0.0 $0.0
C. Software DevelopmentC(1) Planning/DesignC(2) System Development $478.5 $500.0 $517.0 C(3) DeploymentC(4) Mgt/Tech SupportSubtotal $478.5 $500.0 $517.0
D. Minor ConstructionSubtotal $0.0 $0.0 $0.0
TOTAL $478.5 $500.0 $517.0 Narrative Justification:
Activity IdentificationCommand Staff
Line No. & Item DescriptionDefend Systems & Networks - Information Assurance (IA)
Component/Activity/DateUSTRANSCOM Command Staff/Transportation/February 2010
FY09 FY10 FY11
Description: Program to provide information operations capabilities that protect and defend information and information systems by ensuring their availability, integrity, authentication, confidentiality and non‐repudiation. Program is aligned with the Department of Defense (DOD) Information Assurance (IA) Strategic Plan. Develop and enforce Computer Network Defense (CND) policies across the enterprise to hi ti l di t i t ti t t tt k ll i id E l t d d l CND t l d biliti E t bli h h i d d ithi CND ti
Description: Program to provide information operations capabilities that protect and defend information and information systems by ensuring their availability, integrity, authentication, confidentiality and non‐repudiation. Program is aligned with the Department of Defense (DOD) Information Assurance (IA) Strategic Plan. Develop and enforce Computer Network Defense (CND) policies across the enterprise to achieve an optimal readiness posture against nation state attackers as well as insiders. Evaluate and deploy CND tools and capabilities. Establish mechanisms and procedures within CND response action guidelines that effectively utilize developed CND tools and capabilities to react and respond to events. Mitigate insider threat across the DOD through the implementation of advanced tools, processes, and operational capabilities.
Mission Benefits: Provide ability to recognize, react to, and respond to threats, vulnerabilities, and deficiencies in systems and networks. Includes equipment and personnel to support the following capabilities: firewalls, proxy servers, antivirus, intrusion detection, vulnerability assessment, etc. Deliverables: FY09 ‐ FY12 Mobile team personnel who provide security engineering suppport to USTRANSCOM's and its components.
Economic Analysis: Life Cycle Cost Estimate (LCCE) received August 2007.
Impact: Failure to provide and improve network security architectures increases the vulnerability of USTRANSCOM and its component networks to electronic attacks resulting in the loss of critical command and control functions.
Software: No license fees apply.
For Official Use Only Fund 9b, TWCF
123

Fund 9b(Dollars in Thousands)
Activity Group Capital Investment JustificationAir Force Working Capital Fund
Transportation Working Capital Fund
Fiscal Year (FY) 2011Budget Estimates
February 2010
Element of Cost Quantity Unit Cost Total Cost Quantity Unit Cost Total Cost Quantity Unit Cost Total CostA. EquipmentA(1) Replacement $0.0 $0.0 $0.0 A(2) ProductivityA(3) New MissionA(4) Environmental ComplianceSubtotal $0.0 $0.0 $0.0
B. ADPE/TelecommB(1) Computer Hardware $228.5 $0.0 $0.0 B(2) Computer SoftwareB(3) TelecommunicationsB(3) Other ComputerSubtotal $228.5 $0.0 $0.0
C. Software DevelopmentC(1) Planning/DesignC(2) System Development $3,236.8 $9,858.0 $2,578.0 C(3) DeploymentC(4) Mgt/Tech SupportSubtotal $3,236.8 $9,858.0 $2,578.0
D. Minor ConstructionSubtotal $0.0 $0.0 $0.0
TOTAL $3,465.3 $9,858.0 $2,578.0 Narrative Justification:
FY09 FY10 FY11
Activity IdentificationCommand Staff
Component/Activity/Date Line No. & Item DescriptionUSTRANSCOM Command Staff/Transportation/February 2010 Defense Personal Property System (DPS)
Description: The Defense Personal Property System (DPS) is a next generation, fully integrated, best of breed, centralized, web‐based system for the management of personal property shipments for the Department of Defense (DOD). DPS is the materiel solution to achieve the Defense Personal Property Program (DP3) objectives. The DPS customer‐centric approach will provide a more responsive, user‐friendly experience while ensuring timely and accurate delivery of personal property shipments. It also provides direct customer feedback to identify and reward Transportation Service Providers (TSPs) that deliver quality service at reasonable rates. The DPS program management responsibilities transferred from Surface Deployment and Distribution Command (SDDC) to United States Transportation Command (USTRANSCOM) Command Staff in Fiscal Year 2007 (FY07). In order to properly manage the DPS Program, USTRANSCOM established the Joint Program Management Office for Household Goods Systems (JPMO HHGS) comprised
Description: The Defense Personal Property System (DPS) is a next generation, fully integrated, best of breed, centralized, web‐based system for the management of personal property shipments for the Department of Defense (DOD). DPS is the materiel solution to achieve the Defense Personal Property Program (DP3) objectives. The DPS customer‐centric approach will provide a more responsive, user‐friendly experience while ensuring timely and accurate delivery of personal property shipments. It also provides direct customer feedback to identify and reward Transportation Service Providers (TSPs) that deliver quality service at reasonable rates. The DPS program management responsibilities transferred from Surface Deployment and Distribution Command (SDDC) to United States Transportation Command (USTRANSCOM) Command Staff in Fiscal Year 2007 (FY07). In order to properly manage the DPS Program, USTRANSCOM established the Joint Program Management Office for Household Goods Systems (JPMO HHGS) comprised of USTRANSCOM personnel and matrixed SDDC personnel.
Mission Benefits: DPS implements the objectives/benefits of (DP3) , to include:‐‐ Full Replacement Value for damaged/lost household goods. Adequate payment is number one relocation concern. Current program only provides depreciated value for damaged items.‐‐ An integrated information management system for household goods processes.‐‐ Improved communications between member/employees, the transportation service provider and the military personal property office. Direct communications will enable quick response to changes in member/employee situations and allow for more direct deliveries, thereby reducing damages and storage costs.
Deliverables: FY09 ‐ DPS Phase II capability deployed worldwide to all of the sites. Implemented Non‐Temporary Storage (NTS) and Direct Procurement Move (DPM ) capabilities in accordance with current business rules, i.e. non‐Best Value Scoring (BVS). FY10 ‐ Incorporate additional software enhancements and capabilities as determined and prioritized by the DPS Functional Requirements Board (FRB) and Configuration Control Board (CCB) as permitted by funding. FY11 ‐ Incorporate additional software enhancements as determined and prioritized by the DPS FRB and CCB as permitted by funding. FY12 ‐ Incorporate additional software enhancements as determined and prioritized by the DPS FRB and CCB as permitted by funding.
Economic Analysis (EA): The DPS EA was approved on 24 July 2008 by USTRANSCOM leadership. This DPS EA was updated from the earlier May 07 DPS EA to reflect the life cycle cost estimate and expected savings and benefits through FY19. For FY09, USTC is working a minor update to the DPS EA and conducting a complete Analysis of Alternatives (AoA) in FY10.
Impact: Inability to provide DP3 benefits. Rapidly escalating sustainment costs of legacy systems; Transportation Operational Personal Property System (TOPS) may not receive Interim Authority to Operate extensions due to security issues.
For Official Use Only Fund 9b, TWCF
124

Fund 9b(Dollars in Thousands)
Activity Group Capital Investment JustificationAir Force Working Capital Fund
Transportation Working Capital Fund
Fiscal Year (FY) 2011Budget Estimates
February 2010
Air Mobility Command/Transportation/February 2010 HQ AMC, Scott AFB IL
Element of Cost Quantity Unit Cost Total Cost Quantity Unit Cost Total Cost Quantity Unit Cost Total CostA. EquipmentA(1) Replacement $400.0 $2,400.0 A(2) ProductivityA(3) New Mission $2,996.0 A(4) Environmental ComplianceSubtotal $2,996.0 $400.0 $2,400.0
B. ADPE/TelecommB(1) Computer HardwareB(2) Computer SoftwareB(3) TelecommunicationsB(3) Other ComputerSubtotal $0.0 $0.0 $0.0
C. Software DevelopmentC(1) Planning/DesignC(2) System DevelopmentC(3) DeploymentC(4) Mgt/Tech SupportSubtotal $0.0 $0.0 $0.0
D. Minor ConstructionSubtotal $0.0 $0.0 $0.0
TOTAL $2,996.0 $400.0 $2,400.0 Narrative Justification:
Component/Activity/Date Line No. & Item Description Activity IdentificationEquipment - AMC
FY09 FY10 FY11
Description: Funds are used to support Base Procured Investment Equipment for flight line maintenance.
Mission Benefits: Funds allow for the procurement of one time purchases to replace/procure new equipment.
Economic Analysis: Economic Analysis (EA) are completed for individual projects that qualify.
Impact: Without these funds, wings would not be able to procure needed replacement items. These funds are normally required to support one‐time requirements for equipment that is becoming obsolete and logistically unsupportable.With a certified EA, it is verified that these capital items meet requirements as a replacement item and result in improved efficiency and capability.
Software: Not applicable
For Official Use Only Fund 9b, TWCF
125

Fund 9b(Dollars in Thousands)
Activity Group Capital Investment JustificationAir Force Working Capital Fund
Transportation Working Capital Fund
Fiscal Year (FY) 2011Budget Estimates
February 2010
Surface Deployment and Distribution Center/Transportation/February 2010 SDDC
Element of Cost Quantity Unit Cost Total Cost Quantity Unit Cost Total Cost Quantity Unit Cost Total CostA. EquipmentA(1) Replacement $4,980.0 $500.0 $0.0 A(2) ProductivityA(3) New MissionA(4) Environmental ComplianceSubtotal $4,980.0 $500.0 $0.0
B. ADPE/TelecommB(1) Computer HardwareB(2) Computer SoftwareB(3) TelecommunicationsB(3) Other ComputerSubtotal $0.0 $0.0 $0.0
C. Software DevelopmentC(1) Planning/DesignC(2) System DevelopmentC(3) DeploymentC(4) Mgt/Tech SupportSubtotal $0.0 $0.0 $0.0
D. Minor ConstructionSubtotal $0.0 $0.0 $0.0
TOTAL $4,980.0 $500.0 $0.0 Narrative Justification:
Component/Activity/Date Line No. & Item Description Activity IdentificationEquipment - SDDC
FY09 FY10 FY11
Description: The Military Ocean Terminal Sunny Point (MOTSU) is the premier Department of Defense (DOD) ammunition terminal and is considered a vital part of the strategic Continental United StatesDescription: The Military Ocean Terminal Sunny Point (MOTSU) is the premier Department of Defense (DOD) ammunition terminal and is considered a vital part of the strategic Continental United States (CONUS) power projection platform supporting warfighting Commanders (CDRs) around the world. It is relied upon to maintain a high optempo consisting of ammunition resupply mission and Preposition Operations (prepo).
Mission Benefits: Various types and categories of equipment are needed for operations and safety. Equipment is scheduled for periodic replacement as service lives are reached and equipment becomes uneconomical to repair.
Economic Analysis: Economic Analysis (EA) are completed for individual projects that qualify.
Equipment:FY09: D5 DozerFY10: Switch at 596th and Fire Boat at MOTSUFY11: n/a
Impact: Failure to fund will adversely impact Surface Deployment and Distribution Commands (SDDCs) ability to meet safety standards and support the warfighters.
Software: Not applicable.
For Official Use Only Fund 9b, TWCF
126

Fund 9b(Dollars in Thousands)
Activity Group Capital Investment JustificationAir Force Working Capital Fund
Transportation Working Capital Fund
Fiscal Year (FY) 2011Budget Estimates
February 2010
Date: February 2010 QTY FY09 QTY FY10 QTY FY11
Equipment is as follows:
FY09 (Over $250K)D5 Dozer 1 $50075 ft Fire Boat 1 $4,500
FY10 (Over $250K)Switch at 596th 1 $500
FY11 (Over $250K)
FY12 (Over $250K)MI-JACK Container Handling 45TMI-JACK Container Handling 50T
FY13 (O $2 0K)
Equipment (Atch) - SDDC
For Official Use Only Fund 9b, TWCF
FY13 (Over $250K)MI-JACK Container Handling 45TMI-JACK Container Handling 50T
FY14 (Over $250K)MI-JACK Container Handling 45T
FY15 (Over $250K)MI-JACK Container Handling 45T
TOTALS $5,000 $500 $0
For Official Use Only Fund 9b, TWCF
127

Fund 9b(Dollars in Thousands)
Activity Group Capital Investment JustificationAir Force Working Capital Fund
Transportation Working Capital Fund
Fiscal Year (FY) 2011Budget Estimates
February 2010
Military Sealift Command/Transportation/February 2010
Element of Cost Quantity Unit Cost Total Cost Quantity Unit Cost Total Cost Quantity Unit Cost Total CostA. EquipmentA(1) ReplacementA(2) ProductivityA(3) New MissionA(4) Environmental ComplianceSubtotal $0.0 $0.0 $0.0
B. ADPE/TelecommB(1) Computer HardwareB(2) Computer SoftwareB(3) TelecommunicationsB(3) Other ComputerSubtotal $0.0 $0.0 $0.0
C. Software DevelopmentC(1) Planning/DesignC(2) System Development $489.0 $535.0 C(3) DeploymentC(4) Mgt/Tech SupportSubtotal $489.0 $535.0 $0.0
D. Minor ConstructionSubtotal $0.0 $0.0 $0.0
TOTAL $489.0 $535.0 $0.0 Narrative Justification:
Component/Activity/Date Line No. & Item Description Activity IdentificationMSC Financial Management System (MSC-FMS) Military Sealift Command
FY09 FY10 FY11
Description: MSC‐FMS is a state of the art fully integrated finance and accounting system that replaced non‐compliant legacy systems in FY 2000. The new system is Joint Financial Improvement Program (JFMIP) certified meets and exceeds numerous Federal Financial Management System requirements and is Chief Financial Officer (CFO) compliant This system is based on Oracle FederalDescription: MSC‐FMS is a state of the art fully integrated finance and accounting system that replaced non‐compliant legacy systems in FY 2000. The new system is Joint Financial Improvement Program (JFMIP) certified, meets and exceeds numerous Federal Financial Management System requirements, and is Chief Financial Officer (CFO) compliant. This system is based on Oracle Federal Financials and includes Federalized General Ledger utilizing the United States Standard General Ledger (USGL) at the detailed transaction level along with federalized modules for Accounts Receivable, Accounts Payable and Purchasing. In addition, Oracle commercial modules supporting project costing, project billing, inventory and fixed assets were implemented. Finally, for internal reporting and presentation of decision making information, MSC developed a financial data mart.
Mission Benefits: Allows MSC to be compliant with Chief Financial Officer (CFO) requirements. MSC personnel have access to current financial data affecting all MSC programs.Deliverables: Reduce legacy applications, implement DOD compliant Wide Area Workflow interface, and reduce contractor support with more efficient automated interfaces.
Economic Analysis: Economic Analysis certified February 2009
Impact: If not funded, MSC will not be in compliance with the CFO Act.
Software: N/A
For Official Use Only Fund 9b, TWCF
128

Fund 9b(Dollars in Thousands)
Activity Group Capital Investment JustificationAir Force Working Capital Fund
Transportation Working Capital Fund
Fiscal Year (FY) 2011Budget Estimates
February 2010
Air Mobility Command/Transportation/February 2010 HQ AMC, Scott AFB IL
Element of Cost Quantity Unit Cost Total Cost Quantity Unit Cost Total Cost Quantity Unit Cost Total CostA. EquipmentA(1) ReplacementA(2) ProductivityA(3) New MissionA(4) Environmental ComplianceSubtotal $0.0 $0.0 $0.0
B. ADPE/TelecommB(1) Computer Hardware $3,657.0 $1,336.0 $0.0 B(2) Computer SoftwareB(3) TelecommunicationsB(3) Other ComputerSubtotal $3,657.0 $1,336.0 $0.0
C. Software DevelopmentC(1) Planning/DesignC(2) System Development $11,274.0 $10,306.0 $10,548.0 C(3) DeploymentC(4) Mgt/Tech SupportSubtotal $11,274.0 $10,306.0 $10,548.0
D. Minor ConstructionSubtotal $0.0 $0.0 $0.0
TOTAL $14,931.0 $11,642.0 $10,548.0 Narrative Justification:
Component/Activity/Date Line No. & Item Description Activity IdentificationGlobal Air Transportation Execurtion System (GATES)
FY09 FY10 FY11
Description: Global Air Transportation Execution System (GATES) is a single automated system serving management of both aerial port and surface port operations for the Department of Defense (DoD) transportation, worldwide. Its support is mission‐critical since the ports sustain global air and surface movement of personnel and materiel and serve as the entrance into or departure from the country where located. Serving peacetime and contingency operations, GATES support includes processing and tracking cargo and passenger information to speed their timely arrival and know their location at all times (i.e., In‐Transit Visibility (ITV). GATES also aids DoD's capability to bill for cargo and passenger movement. It is a financial feeder system providing manifest information to the Airlift Service Industrial Fund Integrated Computer System (ASIFICS), a billing system belonging to the Air Force. In the near future, GATES will also feed the Cargo and Billing System (CAB), a billing system belonging to the Military Surface Deployment and Distribution Command (SDDC). GATES surface port function will include capability formerly provided by the SDDC Worldwide Port System (WPS). WPS was designed to support the water port operations of DoD by providing cargo management, documentation, and accountability to water port and regional commanders while providing ITV to higher echelons
Description: Global Air Transportation Execution System (GATES) is a single automated system serving management of both aerial port and surface port operations for the Department of Defense (DoD) transportation, worldwide. Its support is mission‐critical since the ports sustain global air and surface movement of personnel and materiel and serve as the entrance into or departure from the country where located. Serving peacetime and contingency operations, GATES support includes processing and tracking cargo and passenger information to speed their timely arrival and know their location at all times (i.e., In‐Transit Visibility (ITV). GATES also aids DoD's capability to bill for cargo and passenger movement. It is a financial feeder system providing manifest information to the Airlift Service Industrial Fund Integrated Computer System (ASIFICS), a billing system belonging to the Air Force. In the near future, GATES will also feed the Cargo and Billing System (CAB), a billing system belonging to the Military Surface Deployment and Distribution Command (SDDC). GATES surface port function will include capability formerly provided by the SDDC Worldwide Port System (WPS). WPS was designed to support the water port operations of DoD by providing cargo management, documentation, and accountability to water port and regional commanders while providing ITV to higher echelons.
Mission Benefits: GATES is a Headquarters Air Mobility Command (HQ AMC) program developed to provide visibility of cargo and passenger assets moved by HQ AMC. It operates in an open system platform/environment utilizing Unix Servers and Windows Personal Computer (PC) workstations. Applications software is currently being updated to meet the Defense Transportation System (DTS) architecture requirements for GATES to remain in concert with the HQ AMC and United States Transportation Command (USTRANSCOM) Command, Control, Communications and Computer (C4) Systems Master Plan as a command and control enhancer. Also, the functions of the World Wide Port System (WPS) will be integrated into GATES by January 2009. Deliverables: FY09: GATES Version 4.0 ‐First phase of single port, results in decommissioningof the WPS central; Second phase carries into FY10 and will result in replacement of WPS terminal, & final decommissioning of WPS central. FY10: GATES Version 5.0 ‐Completes single port capability, migration of the Military Standard System (MILS) to Defense Logistics Management Standards (DLMS); FY11: GATES Version 6.0‐Enhancement to the single port operations capability.
Economic Analysis: Economic Analysis (EA) certified April 2006. Estimated certificationNovember 2009.
Impact: If not funded, there would be a direct impact on warfighter readiness. The mobility mission is supported by the Air Force aerial ports which utilize new software development each year. Hand‐held terminal upgrades and fixes could not be done. In addition, migration to the USTRANSCOM Logical Data Model and other portal requirements supporting the Tanker Airlift Control Center (TACC) would not be accomplished. Requirements to develop Public Key Enabling (PKE) and Public Key Infrastructure (PKI) Certificates and Extensible Markup Language (XML) requirements for development would also be affected. There are other sister services (i.e. Navy) which require other system configurations to fit into their architecture. Billing modernization changes would have to be put on hold until the transition is complete.
Software: Alcatel; Movian; F‐Secure; Sybase‐licenses; BRIO; Rational ; Storeedge; Togethersoft; NetIQ; TCC Radius; Planet; CE Fusion; Sun Software.
For Official Use Only Fund 9b, TWCF
129

Fund 9b(Dollars in Thousands)
Activity Group Capital Investment JustificationAir Force Working Capital Fund
Transportation Working Capital Fund
Fiscal Year (FY) 2011Budget Estimates
February 2010
Air Mobility Command/Transportation/February 2010 HQ AMC, Scott AFB IL
Element of Cost Quantity Unit Cost Total Cost Quantity Unit Cost Total Cost Quantity Unit Cost Total CostA. EquipmentA(1) ReplacementA(2) ProductivityA(3) New MissionA(4) Environmental ComplianceSubtotal $0.0 $0.0 $0.0
B. ADPE/TelecommB(1) Computer HardwareB(2) Computer SoftwareB(3) TelecommunicationsB(3) Other ComputerSubtotal $0.0 $0.0 $0.0
C. Software DevelopmentC(1) Planning/DesignC(2) System Development $18,458.0 $18,190.0 $17,204.0 C(3) DeploymentC(4) Mgt/Tech SupportSubtotal $18,458.0 $18,190.0 $17,204.0
D. Minor ConstructionSubtotal $0.0 $0.0 $0.0
TOTAL $18,458.0 $18,190.0 $17,204.0 Narrative Justification:
Component/Activity/Date Line No. & Item Description Activity IdentificationGlobal Decision Support System (GDSS)
FY09 FY10 FY11
Description: The Global Decision Support System (GDSS) is an United States Transportation Command (USTRANSCOM) funded system providing Mobility Air Forces (MAF) Command and Control (C2) information for the Defense Transportation System (DTS) to combatant commanders throughout the full spectrum of military operations. As the MAF's principal C2 system, the operational imperative is to deliver robust capabilities to command and control (MAF forces using a net‐centric environment, allowing access and information sharing across classified and unclassified domains). Direction given by the Secretary of Defense (SECDEF) assigning USTRANSCOM responsibility for Distribution Process Ownership increases the need for greater theater and strategic mobility operations and control. GDSS will interoperate with Air Force/Army/Joint C2 systems, and is an integral part of USTRANSCOM's DTS. As the USTRANSCOM, Joint, and Air Force C2 architectures mature, GDSS will be consistent with the USTRANSCOM, Joint, and Air Force C2 Communities of Interest (COI).
Description: The Global Decision Support System (GDSS) is an United States Transportation Command (USTRANSCOM) funded system providing Mobility Air Forces (MAF) Command and Control (C2) information for the Defense Transportation System (DTS) to combatant commanders throughout the full spectrum of military operations. As the MAF's principal C2 system, the operational imperative is to deliver robust capabilities to command and control (MAF forces using a net‐centric environment, allowing access and information sharing across classified and unclassified domains). Direction given by the Secretary of Defense (SECDEF) assigning USTRANSCOM responsibility for Distribution Process Ownership increases the need for greater theater and strategic mobility operations and control. GDSS will interoperate with Air Force/Army/Joint C2 systems, and is an integral part of USTRANSCOM's DTS. As the USTRANSCOM, Joint, and Air Force C2 architectures mature, GDSS will be consistent with the USTRANSCOM, Joint, and Air Force C2 Communities of Interest (COI).
Mission Benefits: GDSS complies with the USTRANSCOM/Headquarters Air Mobility Command (HQ AMC) enterprise architecture and logical data model development. This helps in future development and simplifies interfaces with other systems. The system reduces data integrity challenges caused by latency in transmission of data from /between legacy systems to GDSS due to present reliance on text messaging data exchange. Better data integrity provides more accurate, dependable C2 data for decision makers, allowing more efficient and/or effective airlift and air refueling support to the warfighter. GDSS eliminates the inefficiency of separate stove‐piped program management, development, and operations/support structures of C2 programs. Deliverables: FY09: Weather functionality delivered with V2.2.2 in Jun 09; complete second classified enclave; FY10: Legacy functional capabilities and technical interfaces to be delivered with V2.3 in Dec 09 (this interface will take users off legacy systems and close all legacy interfaces); continue to develop Operational Risk Management (ORM) tools version 2.4; FY11: Finalize ORM V2.4, integrate with Work Center Interface Distribution Enterprise (WIDE), depending how WIDE is developed and fielded.
Economic Analysis: Certified May 2007. EA was submitted Mar 09 and estimated certification November 2009.
Impact: If not funded, the USTRANSCOM Commander's efforts to migrate functions to the right number of systems would be slowed while forcing sustainment of obsolete legacy systems. There would be significant reduction in capability to perform basic flight scheduling, flight following, MAF and DTS resource and facilities allocation, and decisionmaking for HQ AMC's Tanker Airlift Control Center (TACC) and other customers listed above. There would be loss of required total asset visibility interface. All other sites supported worldwide by GDSS would experience reduced capability to perform MAF resources C2 and/or a reduced ability to MAF related data.
Software: Share Plex Software
For Official Use Only Fund 9b, TWCF
130

Fund 9b(Dollars in Thousands)
Activity Group Capital Investment JustificationAir Force Working Capital Fund
Transportation Working Capital Fund
Fiscal Year (FY) 2011Budget Estimates
February 2010
Surface Deployment and Distribution Center/Transportation/February 2010 SDDC
Element of Cost Quantity Unit Cost Total Cost Quantity Unit Cost Total Cost Quantity Unit Cost Total CostA. EquipmentA(1) ReplacementA(2) ProductivityA(3) New MissionA(4) Environmental ComplianceSubtotal $0.0 $0.0 $0.0
B. ADPE/TelecommB(1) Computer HardwareB(2) Computer SoftwareB(3) TelecommunicationsB(3) Other ComputerSubtotal $0.0 $0.0 $0.0
C. Software DevelopmentC(1) Planning/DesignC(2) System Development $370.0 $438.0 $435.0 C(3) DeploymentC(4) Mgt/Tech SupportSubtotal $370.0 $438.0 $435.0
D. Minor ConstructionSubtotal $0.0 $0.0 $0.0
TOTAL $370.0 $438.0 $435.0 Narrative Justification:
Component/Activity/Date Line No. & Item Description Activity IdentificationGlobal Freight Management (GFM)
FY09 FY10 FY11
Description: Global Freight Management (GFM) provides Department of Defense (DOD) Installation Transportation Officers (ITOs) with an electronic commerce capability for the procurement of commercial freight transportation services and provides a real‐time data feed to war fighters. GFM provides a centralized automated freight rating, costing, and routing system DOD‐wide. GFM also provides a Spot Bid system for procurement of freight transportation services for overweight or over‐dimensional shipments as well as other unique or one‐time only shipments. GFM also supports an automated interface for existing DOD contracts with Small Package (shipments of less than 300 pounds) domestic and international express carriers. The GFM system supplies more timely and accurate routing information to shippers and substantially improves the ability of the Surface Deployment and Distribution Command (SDDC) to support DOD shipping. The GFM interface with PowerTrack streamlines the DOD transportation financial payment process.
Mi i B fit GFM id DOD d hi i ti iti d t t ith t ff ti d ffi i t it f b b d t t ti b i t l t t lti d l DOD hi t l i d ti
Description: Global Freight Management (GFM) provides Department of Defense (DOD) Installation Transportation Officers (ITOs) with an electronic commerce capability for the procurement of commercial freight transportation services and provides a real‐time data feed to war fighters. GFM provides a centralized automated freight rating, costing, and routing system DOD‐wide. GFM also provides a Spot Bid system for procurement of freight transportation services for overweight or over‐dimensional shipments as well as other unique or one‐time only shipments. GFM also supports an automated interface for existing DOD contracts with Small Package (shipments of less than 300 pounds) domestic and international express carriers. The GFM system supplies more timely and accurate routing information to shippers and substantially improves the ability of the Surface Deployment and Distribution Command (SDDC) to support DOD shipping. The GFM interface with PowerTrack streamlines the DOD transportation financial payment process.
Mission Benefits: GFM provides DOD‐approved shipping activities and contractors with a cost effective and efficient suite of web‐based transportation business tools to support multi‐modal DOD shipment planning and execution utilizing commercial transportation services. GFM complements DOD tactical transportation systems by providing military ITOs with the ability to support unit deployment, sustainment and redeployment activities. GFM is used at each of the Army’s power projection and power support platforms.Deliverables: FY09 ‐ GFM will implement a Transportation Tracking Number interface to support expanded visibility of unit equipment deployments, calculate Desired Delivery Dates to improve shipment execution and traffic reception management, and implement the capability; FY10 ‐ GFM will (1) implement Munitions Transportation Management System (MTMS) Interface to transmit shipment data from the MTMS field module to GFM's Freight Shipment Execution application (2) establish interface to transmit hazardous material data to the SDDC SafetyNet System (3) Provide web service to accept Transportation Discrepancy Reports by enabling the electronic sharing in a common database (4) Build new interfaces for all carriers participating in the WWX‐4 contract to do business in GFM. FY11 ‐ (1) Provide the ITO with the capability to put a carrier into local nonuse. (2) Eliminate batch processing of tenders.
Economic Analysis: Certified 28 Apr 09
Impact: If not funded, GFM will be unable to support United States Transportation Command's strategic objective to optimize Joint Deployment and Distribution Enterprise processes to provide improved end‐to‐end joint deployment and distribution that enables warfighters to successfully project and sustain combat power. It will prevent GFM from continuing to adopt relevant best practices derived from the business community, minimize waste and redundancy, and synchronize global distribution. GFM will be unable to improve automation tools used by transportation managers to monitor shipment planning, manage transportation risk, and influence freight mobility requirements that support Defense Transportation System initiatives.
Software: Not applicable.
For Official Use Only Fund 9b, TWCF
131

Fund 9b(Dollars in Thousands)
Activity Group Capital Investment JustificationAir Force Working Capital Fund
Transportation Working Capital Fund
Fiscal Year (FY) 2011Budget Estimates
February 2010
Surface Deployment and Distribution Center/Transportation/February 2010 SDDC
Element of Cost Quantity Unit Cost Total Cost Quantity Unit Cost Total Cost Quantity Unit Cost Total CostA. EquipmentA(1) ReplacementA(2) ProductivityA(3) New MissionA(4) Environmental ComplianceSubtotal $0.0 $0.0 $0.0
B. ADPE/TelecommB(1) Computer Hardware $300.0 $54.0 $584.0 B(2) Computer SoftwareB(3) TelecommunicationsB(3) Other ComputerSubtotal $300.0 $54.0 $584.0
C. Software DevelopmentC(1) Planning/DesignC(2) System DevelopmentC(3) DeploymentC(4) Mgt/Tech SupportSubtotal $0.0 $0.0 $0.0
D. Minor ConstructionSubtotal $0.0 $0.0 $0.0
TOTAL $300.0 $54.0 $584.0 Narrative Justification:
Component/Activity/Date Line No. & Item Description Activity IdentificationGlobal Surface Distribution Management (GSDM)
FY09 FY10 FY11
Description: The Global Surface Distribution Management (GSDM) program provides the facility, automated tools, and communications infrastructure to support the Military Surface Deployment and Distribution Command (SDDC) worldwide deployment and distribution mission in an austere environment. The Deployable Port Operations Center (DPOC), Mobile Port Operations Center (MPOC) and Scalable Port Operations Communications Kit (SPOCK) provide fully equipped, self‐sustaining command and control port opening capability at surface locations where facilities for cargo documentation and processing, local long haul telecommunications, and computer d ffi i il bl A k f f h d l bl bili i i i i d i i i d d l f U i d S f ili
Description: The Global Surface Distribution Management (GSDM) program provides the facility, automated tools, and communications infrastructure to support the Military Surface Deployment and Distribution Command (SDDC) worldwide deployment and distribution mission in an austere environment. The Deployable Port Operations Center (DPOC), Mobile Port Operations Center (MPOC) and Scalable Port Operations Communications Kit (SPOCK) provide fully equipped, self‐sustaining command and control port opening capability at surface locations where facilities for cargo documentation and processing, local long haul telecommunications, and computer and office automation support are not available. A key focus of these deployable capabilities is to support reception, staging, onward movement, integration, sustainment, and redeployment of United States forces at military, common user, and contingency seaports worldwide. They are designed to support limited/small scale operations and full scale/sustained operations. They are totally self‐sustaining and independent of any host nation/theater facilities and services.
Mission Benefits: Supports SDDC worldwide deployment and distribution mission in an austere environment.
Deliverables: FY09 ‐ Rapid Port Opening Elements (RPOE) Tent and remaining funds reprogrammed due to complete refresh accomplished in FY08. FY10 ‐ US Army Soldier Systems Center Natick, MA provide engineering support DPOC/MPO) and upgrade hardware as required; FY11 ‐ US Army Soldier Systems Center Natick, MA and Tobyhanna Army Depot, PA to provide engineering support DPOC/MPOC and upgrade hardware as required.
Economic Analysis: Certified 14 Apr 09
Impact: The systems provided under the GSDM program are essential in providing port managers with the Command and Control (C2) capabilities to ensure Intransit Visibility (ITV) of sustainment cargo and unit equipment moving forward. Without this capability, units may arrive at the fight without the necessary equipment and no assurance of sustainment once in the theater of operations resulting in mission failure.
Software: Not applicable.
For Official Use Only Fund 9b, TWCF
132
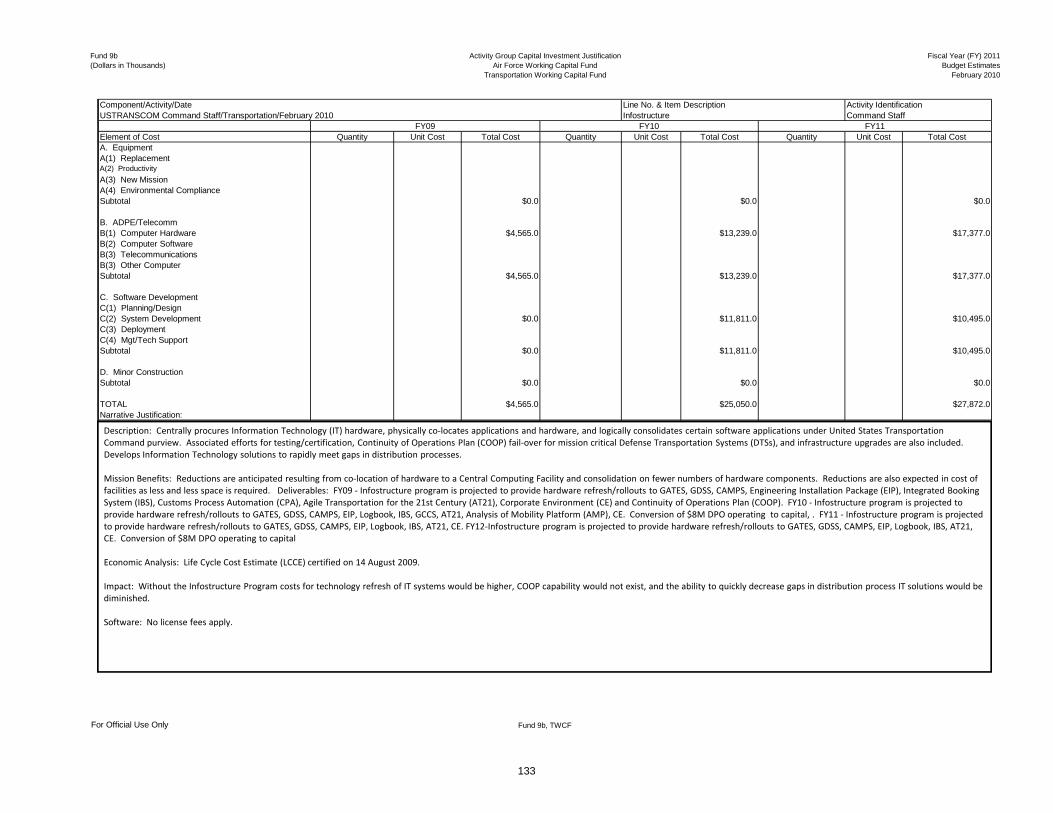
Fund 9b(Dollars in Thousands)
Activity Group Capital Investment JustificationAir Force Working Capital Fund
Transportation Working Capital Fund
Fiscal Year (FY) 2011Budget Estimates
February 2010
Element of Cost Quantity Unit Cost Total Cost Quantity Unit Cost Total Cost Quantity Unit Cost Total CostA. EquipmentA(1) ReplacementA(2) ProductivityA(3) New MissionA(4) Environmental ComplianceSubtotal $0.0 $0.0 $0.0
B. ADPE/TelecommB(1) Computer Hardware $4,565.0 $13,239.0 $17,377.0 B(2) Computer SoftwareB(3) TelecommunicationsB(3) Other ComputerSubtotal $4,565.0 $13,239.0 $17,377.0
C. Software DevelopmentC(1) Planning/DesignC(2) System Development $0.0 $11,811.0 $10,495.0 C(3) DeploymentC(4) Mgt/Tech SupportSubtotal $0.0 $11,811.0 $10,495.0
D. Minor ConstructionSubtotal $0.0 $0.0 $0.0
TOTAL $4,565.0 $25,050.0 $27,872.0 Narrative Justification:
FY09 FY10 FY11Infostructure
Activity IdentificationCommand Staff
Component/Activity/DateUSTRANSCOM Command Staff/Transportation/February 2010
Line No. & Item Description
Description: Centrally procures Information Technology (IT) hardware, physically co‐locates applications and hardware, and logically consolidates certain software applications under United States Transportation Command purview. Associated efforts for testing/certification, Continuity of Operations Plan (COOP) fail‐over for mission critical Defense Transportation Systems (DTSs), and infrastructure upgrades are also included. Develops Information Technology solutions to rapidly meet gaps in distribution processes.
Mission Benefits: Reductions are anticipated resulting from co‐location of hardware to a Central Computing Facility and consolidation on fewer numbers of hardware components. Reductions are also expected in cost of
Description: Centrally procures Information Technology (IT) hardware, physically co‐locates applications and hardware, and logically consolidates certain software applications under United States Transportation Command purview. Associated efforts for testing/certification, Continuity of Operations Plan (COOP) fail‐over for mission critical Defense Transportation Systems (DTSs), and infrastructure upgrades are also included. Develops Information Technology solutions to rapidly meet gaps in distribution processes.
Mission Benefits: Reductions are anticipated resulting from co‐location of hardware to a Central Computing Facility and consolidation on fewer numbers of hardware components. Reductions are also expected in cost of facilities as less and less space is required. Deliverables: FY09 ‐ Infostructure program is projected to provide hardware refresh/rollouts to GATES, GDSS, CAMPS, Engineering Installation Package (EIP), Integrated Booking System (IBS), Customs Process Automation (CPA), Agile Transportation for the 21st Century (AT21), Corporate Environment (CE) and Continuity of Operations Plan (COOP). FY10 ‐ Infostructure program is projected to provide hardware refresh/rollouts to GATES, GDSS, CAMPS, EIP, Logbook, IBS, GCCS, AT21, Analysis of Mobility Platform (AMP), CE. Conversion of $8M DPO operating to capital, . FY11 ‐ Infostructure program is projected to provide hardware refresh/rollouts to GATES, GDSS, CAMPS, EIP, Logbook, IBS, AT21, CE. FY12‐Infostructure program is projected to provide hardware refresh/rollouts to GATES, GDSS, CAMPS, EIP, Logbook, IBS, AT21, CE. Conversion of $8M DPO operating to capital
Economic Analysis: Life Cycle Cost Estimate (LCCE) certified on 14 August 2009.
Impact: Without the Infostructure Program costs for technology refresh of IT systems would be higher, COOP capability would not exist, and the ability to quickly decrease gaps in distribution process IT solutions would be diminished.
Software: No license fees apply.
For Official Use Only Fund 9b, TWCF
133

Fund 9b(Dollars in Thousands)
Activity Group Capital Investment JustificationAir Force Working Capital Fund
Transportation Working Capital Fund
Fiscal Year (FY) 2011Budget Estimates
February 2010
Surface Deployment and Distribution Center/Transportation/February 2010 SDDC
Element of Cost Quantity Unit Cost Total Cost Quantity Unit Cost Total Cost Quantity Unit Cost Total CostA. EquipmentA(1) ReplacementA(2) ProductivityA(3) New MissionA(4) Environmental ComplianceSubtotal $0.0 $0.0 $0.0
B. ADPE/TelecommB(1) Computer HardwareB(2) Computer SoftwareB(3) TelecommunicationsB(3) Other ComputerSubtotal $0.0 $0.0 $0.0
C. Software DevelopmentC(1) Planning/DesignC(2) System Development $2,703.0 $2,659.0 $2,621.0 C(3) DeploymentC(4) Mgt/Tech SupportSubtotal $2,703.0 $2,659.0 $2,621.0
D. Minor ConstructionSubtotal $0.0 $0.0 $0.0
TOTAL $2,703.0 $2,659.0 $2,621.0 Narrative Justification:
Component/Activity/Date Line No. & Item Description Activity IdentificationIntegrated Booking System (IBS)
FY09 FY10 FY11
Description: The Integrated Booking System (IBS) is the lead execution system of the Defense Transportation System (DTS) for the global shipment of ocean cargo in support of all wars, major contingencies, and humanitarian relief operations where our military forces are deployed as well as sustainment of forces worldwide. The IBS consists of the following modules: Carrier Analysis and Rate Evaluation II (CARE II), Requirements Forecasting and Rate Analysis Module (RF‐RAM), Unit, Sustainment, Commercial Sealift Solutions (CSS), Ocean Carrier Interface (OCI), Web Vessel Schedule, One‐Time‐Only, electronic Shipper System (eSS), Container Management Module (CMM) and Advanced Transportation Control and Movement Documentation (ATCMD). These modules provide automated tools to: support carrier contract requirement definition, rate and service solicitations and evaluation, capture vessel schedules, book unit and sustainment cargo, produce shipment documentation, provide cargo offering and status information, and produce payment and billing information.
Mission Benefits: IBS supports Military Surface Deployment and Distribution Command's (SDDC) global surface deployment command & control and distribution mission by providing automated tools to support rapid effective and
Description: The Integrated Booking System (IBS) is the lead execution system of the Defense Transportation System (DTS) for the global shipment of ocean cargo in support of all wars, major contingencies, and humanitarian relief operations where our military forces are deployed as well as sustainment of forces worldwide. The IBS consists of the following modules: Carrier Analysis and Rate Evaluation II (CARE II), Requirements Forecasting and Rate Analysis Module (RF‐RAM), Unit, Sustainment, Commercial Sealift Solutions (CSS), Ocean Carrier Interface (OCI), Web Vessel Schedule, One‐Time‐Only, electronic Shipper System (eSS), Container Management Module (CMM) and Advanced Transportation Control and Movement Documentation (ATCMD). These modules provide automated tools to: support carrier contract requirement definition, rate and service solicitations and evaluation, capture vessel schedules, book unit and sustainment cargo, produce shipment documentation, provide cargo offering and status information, and produce payment and billing information.
Mission Benefits: IBS supports Military Surface Deployment and Distribution Command's (SDDC) global surface deployment command & control and distribution mission by providing automated tools to support rapid, effective and efficient projections of power both at home and abroad. IBS provides end‐to‐end distribution and visibility of Department of Defense (DOD) cargo from time of request for payment to the ocean carrier for services provided. IBS ensures the most cost effective routing of cargo is utilized while ensuring the war fighter receives his cargo on time and cargo preference laws are met. In addition, IBS provides tools for carrier contract requirement definition, rate and service solicitations and evaluation, capture vessel schedules, book unit and sustainment cargo, produce shipment documentation, provide cargo offering and event status information, and produce payment and billing information. IBS provides high‐level data quality edits with instantaneous in‐the‐clear error messages, and utilizes Electronic Commerce and Electronic Data Interchange (EDI) standards. SDDCs Electronic Transportation Acquisition web portal provides DOD transportation officials with a single sign‐on capability to access IBS for their transportation needs.
Deliverables: FY09 ‐Software development per software change packages to enhance capabiltiies 1 Oct 08 ‐ 30 Sep 09; FY10 ‐Software development per software change packages to enhance capabiltiies 1 Oct 09 ‐ 30 Sep 10; FY11 ‐Software development per software change packages to enhance capabilities, Joint Interoperability Test Command (JITC) Certification 1 Oct 10 ‐ 30 Sep 11.
Economic Analysis: Certified 28 Apr 09
Impact: If not funded, IBS will be unable to support United States Transportation Command's and SDDC's mission to provide efficient and cost effective projection of forces and provide improved end‐to‐end joint deployment and distribution. Specifically, maintenance, new software development, and independent verification and validation contracts supporting ocean contract management and sealift requirement processing will terminate. Without commercial contract support, IBS will no longer function.
Software: Software Release every six weeks.
For Official Use Only Fund 9b, TWCF
134

Fund 9b(Dollars in Thousands)
Activity Group Capital Investment JustificationAir Force Working Capital Fund
Transportation Working Capital Fund
Fiscal Year (FY) 2011Budget Estimates
February 2010
Military Sealift Command/Transportation/February 2010
Element of Cost Quantity Unit Cost Total Cost Quantity Unit Cost Total Cost Quantity Unit Cost Total CostA. EquipmentA(1) ReplacementA(2) ProductivityA(3) New MissionA(4) Environmental ComplianceSubtotal $0.0 $0.0 $0.0
B. ADPE/TelecommB(1) Computer Hardware $1,036.0 $0.0 $0.0 B(2) Computer SoftwareB(3) TelecommunicationsB(3) Other ComputerSubtotal $1,036.0 $0.0 $0.0
C. Software DevelopmentC(1) Planning/DesignC(2) System Development $1,005.0 $1,020.0 $1,520.0 C(3) DeploymentC(4) Mgt/Tech SupportSubtotal $1,005.0 $1,020.0 $1,520.0
D. Minor ConstructionSubtotal $0.0 $0.0 $0.0
TOTAL $2,041.0 $1,020.0 $1,520.0 Narrative Justification:
Component/Activity/Date Line No. & Item Description Activity IdentificationIntegrated Command, Control, Communications System Portal (MSC-IC3)
Military Sealift Command
FY09 FY10 FY11
Description: MSC‐IC3 is a migration program to integrate systems and business process from delibrate planning through execution in a common operating environment. MSC‐IC3 is an extention of the Global Command and Control System (GCCS) infrastructure allowing MSC to reduce redundancy in hardware, software, and communications while maintaining compatibility with Department of Defense (DOD), Department of the Navy (DON), and transformation migration initatives. MSC‐IC3 interfaces with: United States Transportation Command's (USTRANSCOM) Global Transformation Network (GTN) to provide ship schedules, Joint Mobility Command Group (JMCG) to provide information for decision making, and Joint Flow and Analysis System for Transformation (JFAST) for execution and deliberate planning. MSC‐IC3
Description: MSC‐IC3 is a migration program to integrate systems and business process from delibrate planning through execution in a common operating environment. MSC‐IC3 is an extention of the Global Command and Control System (GCCS) infrastructure allowing MSC to reduce redundancy in hardware, software, and communications while maintaining compatibility with Department of Defense (DOD), Department of the Navy (DON), and transformation migration initatives. MSC‐IC3 interfaces with: United States Transportation Command's (USTRANSCOM) Global Transformation Network (GTN) to provide ship schedules, Joint Mobility Command Group (JMCG) to provide information for decision making, and Joint Flow and Analysis System for Transformation (JFAST) for execution and deliberate planning. MSC‐IC3 interfaces with joint systems such as the Joint Planning and Execution System (JOPES) operating in GCCS for operations/exercise/contingency requirements and the Surface Deployment and Distribution Commands (SDDC) World wide Port System (WPS). IC3 also provides support for standardized communications and client server infrastructure for data warehouse requirements, standardization, and readiness.
Mission Benefits: IC3 supports the readiness and operations of MSC and is MSC's single integration system in support of Command, Control, Communications, Computers, Intelligence, Surveillance and Reconnaissance (C4SIR) for MSC Defense Transportation System (DTS) responsibilities. IC3 tracks all MSC assets for In‐Transit Visibility (ITV) and feeds data to GTN in support of Total Asset Visibility (TAV). Deliverables: Automated name search, create prototypes for Movement Reports (MOVEREP) and OILSPILL Parsers, Common Operational Enhancements, creation of domain entity for operational program, integration with JOPES, and automatic area command updates.
Economic Analysis: Sustainment Review certified February 2009.
Impact: If not funded, MSC will not be able to continue tracking sealift assets and ITV will be halted. Migration to integrate systems and business processes also will be impacted.
Software: N/A
For Official Use Only Fund 9b, TWCF
135

Fund 9b(Dollars in Thousands)
Activity Group Capital Investment JustificationAir Force Working Capital Fund
Transportation Working Capital Fund
Fiscal Year (FY) 2011Budget Estimates
February 2010
Surface Deployment and Distribution Center/Transportation/February 2010 SDDC
Element of Cost Quantity Unit Cost Total Cost Quantity Unit Cost Total Cost Quantity Unit Cost Total CostA. EquipmentA(1) ReplacementA(2) ProductivityA(3) New MissionA(4) Environmental ComplianceSubtotal $0.0 $0.0 $0.0
B. ADPE/TelecommB(1) Computer HardwareB(2) Computer SoftwareB(3) TelecommunicationsB(3) Other ComputerSubtotal $0.0 $0.0 $0.0
C. Software DevelopmentC(1) Planning/DesignC(2) System Development $1,051.0 $3,189.0 $295.0 C(3) DeploymentC(4) Mgt/Tech SupportSubtotal $1,051.0 $3,189.0 $295.0
D. Minor ConstructionSubtotal $0.0 $0.0 $0.0
TOTAL $1,051.0 $3,189.0 $295.0 Narrative Justification:
Component/Activity/Date Line No. & Item Description Activity IdentificationIntegrated Computerized Deployment System (ICODES)
FY09 FY10 FY11
Description: The Integrated Computerized Deployment System (ICODES) is a joint decision‐support system developed to assist users with planning and executing the loading and stowage of military cargo aboard military and commercial ships, rail cars, and trucks. ICODES enables users to track cargo movements from the fort through the port, onto the ship for stowage and into the port of debarkation. This application supporting architecture incorporates service unique business practices. It also enables the joint community to easily produce, exchange and interpret multi‐modal cargo movement plans and reports through a single software application. Other features and functions assist users by providing higher quality alternative solutions to complex loading and discharge problems. ICODES integrates multiple expert systems, knowledge bases, databases, and graphical user interfaces within a computer‐based distributed cooperative operational environment.
Description: The Integrated Computerized Deployment System (ICODES) is a joint decision‐support system developed to assist users with planning and executing the loading and stowage of military cargo aboard military and commercial ships, rail cars, and trucks. ICODES enables users to track cargo movements from the fort through the port, onto the ship for stowage and into the port of debarkation. This application supporting architecture incorporates service unique business practices. It also enables the joint community to easily produce, exchange and interpret multi‐modal cargo movement plans and reports through a single software application. Other features and functions assist users by providing higher quality alternative solutions to complex loading and discharge problems. ICODES integrates multiple expert systems, knowledge bases, databases, and graphical user interfaces within a computer‐based distributed cooperative operational environment.
Mission Benefits: ICODES enables users to track cargo movements from the fort through the port, onto the ship for stowage, and into the port of debarkation. ICODES enables the joint community to easily produce, exchange and interpret multi‐modal cargo movement plans and reports in a single software application. ICODES further assists users by providing higher quality alternative solutions to complex loading and discharge problems. Deliverables: Existing Ship Loading Capabilities, Existing Port Operations Planning, External Interface Changes, Help Desk/Customer Support, Information Assurance (IA) Controls/Information Assurance Vulnerability Assessment (IAVA) Updates, Fielding Version 5.4.3, Configuration Management/System Administration, Enhance Port Operations Planning, Air Loader Prototype, Air Loader Initial Operating Capability (IOC), Air Loader Final Operating Capability (FOC), Rail Loader IOC, Rail Loader FOC, Conveyance Estimator IOC, Conveyance Estimator FOC, Equipment Refresh, Fielding Version 6.0.Deliverables; FY09 ‐ External Interface Changes; Air‐Loader; Rail‐Loader; Conveyance Estimator, Development and Maintenance of Ship Characteristics; FY10 ‐ ICODES Stow Framework and Enhance Port Operation and Planning; Air Loader; Rail Loader; Coveyance Estimator; Fielding Version 6.0; FY11 ‐ ICODES Stow Framework and Enhance Port Operation and Planning, Coveyance Estimator.
Economic Analysis: Economic Analysis (EA) certified June 2009.
Impact: Funding reductions or eliminations will have an immediate affect on the ability of 2300 military and civilian Cargo Specialists to create plans and execute deployment of military cargoes from marshalling yards and onto ships, rail cars and trucks. This will dramatically increase costs, extend deployment times and seriously reduce data quality. Marine Cargo Specialists will have to create plans from scratch thereby increasing planning time by a factor of 20, and driving up the number of people required to create the plan from 1.5 to 5. Services will lose the ability to electronically exchange files using a common system. Department of Defense (DOD) will lose the ability for services to exchange plans and communicate intent.
Software: Not applicable.
For Official Use Only Fund 9b, TWCF
136

Fund 9b(Dollars in Thousands)
Activity Group Capital Investment JustificationAir Force Working Capital Fund
Transportation Working Capital Fund
Fiscal Year (FY) 2011Budget Estimates
February 2010
Element of Cost Quantity Unit Cost Total Cost Quantity Unit Cost Total Cost Quantity Unit Cost Total CostA. EquipmentA(1) ReplacementA(2) ProductivityA(3) New MissionA(4) Environmental ComplianceSubtotal $0.0 $0.0 $0.0
B. ADPE/TelecommB(1) Computer Hardware $671.4 $6,167.0 $6,141.0 B(2) Computer SoftwareB(3) TelecommunicationsB(3) Other ComputerSubtotal $671.4 $6,167.0 $6,141.0
C. Software DevelopmentC(1) Planning/Design $0.0 $0.0 C(2) System Development $22,244.7 $29,602.0 $5,326.0 C(3) DeploymentC(4) Mgt/Tech SupportSubtotal $22,244.7 $29,602.0 $5,326.0
D. Minor ConstructionSubtotal $0.0 $0.0 $0.0
TOTAL $22,916.1 $35,769.0 $11,467.0 Narrative Justification:
FY09 FY10 FY11
Integrated Data Environment/Global Transportation Network Convergence (IGC)
Activity IdentificationCommand Staff
Component/Activity/DateUSTRANSCOM Command Staff/Transportation/February 2010
Line No. & Item Description
Description: The Defense Logistics Agency (DLA) and the United States Transportation Command (USTRANSCOM) are partnering to provide supply chain, distribution, and logistics information fusion through common integrated data and application services enabling development of cohesive business decision solutions both by and for the supported Combatant Commands (COCOMs), Components, Services, Joint Staff, Agencies, and other Federal organizations. The Integrated Data Environment/Global Transportation Network program will create an environment where logistics and distribution data and information from both DLA and USTRANSCOM are accessible from a single place, leveraging work already being done by DLAs Integrated Data Environment (IDE ‐ Initiative #6516) and USTRANSCOMs Global Transportation Network (GTN ‐ Initiative
Description: The Defense Logistics Agency (DLA) and the United States Transportation Command (USTRANSCOM) are partnering to provide supply chain, distribution, and logistics information fusion through common integrated data and application services enabling development of cohesive business decision solutions both by and for the supported Combatant Commands (COCOMs), Components, Services, Joint Staff, Agencies, and other Federal organizations. The Integrated Data Environment/Global Transportation Network program will create an environment where logistics and distribution data and information from both DLA and USTRANSCOM are accessible from a single place, leveraging work already being done by DLAs Integrated Data Environment (IDE ‐ Initiative #6516) and USTRANSCOMs Global Transportation Network (GTN ‐ Initiative #0886) programs. USTRANSCOM had pursued an earlier effort called Global Transportation Network for the 21st Century (GTN21 ‐ Initiative #6487) which was planned to replace the legacy GTN system. IGC allows the newer Enterprise Data Warehousing capabilities of GTN and the capability deliveries of the IDE to be managed by a single Program Manager; retiring the legacy GTN components in 2010, providing a state‐of‐the‐art capability to perform reporting, ad hoc queries, and multi‐dimensional analyses, as well as, ensuring consistent access to common, authoritative logistics data, business rules, and reliable information. IGC enhances capability to interoperate, unifies Information Technology (IT) development across the Domain, synchronizes investment into objective systems, and eliminates legacy/redundant data stores and interfaces.
Mission Benefits: Mission relates directly to the USTRANSCOM Strategic Goals and Supporting Objectives which include Goal 4.0, "Implement the Defense Transportation System Enterprise Architecture to provide USTRANSCOM and its customers global access to decision quality transportation information" and Goal 4.6, "Provide interoperable, collaborative, and cost effective Command, Control, Communication, and Computer (C4) Systems functional applications that rapidly process data and produce decision quality information which satisfies USTRANSCOM operational and customer requirements." Program Deliverables: FY09 ‐Unclassisfied system capacity enhancements, and Unclassified and Classified software development. FY10 ‐ Completion of GTN Integration with converged environment. GTN system sunset. Exercise replacement system for the GTN exercise system (GES). FY11 ‐ IGC Low‐side coop and Full Operational Capability (FOC). FY12‐Technical refresh on all environments, including Teradata H/W replacement .
Economic Analysis: Economic Analysis completed in May 2007. Economic Analysis Update completed Aug 2008. Next Economic Analysis Update due NLT Sep 2009.
Impact: Degradation to program will result in severe shortcomings in the Defense Transportation System. Jeopardizes "wholesale through retail/factory to foxhole" In‐Transit Visibility (ITV) required to provide DoD visibility of materiel across the spectrum of warfare.
For Official Use Only Fund 9b, TWCF
137

Fund 9b(Dollars in Thousands)
Activity Group Capital Investment JustificationAir Force Working Capital Fund
Transportation Working Capital Fund
Fiscal Year (FY) 2011Budget Estimates
February 2010
Surface Deployment and Distribution Center/Transportation/February 2010 SDDC
Element of Cost Quantity Unit Cost Total Cost Quantity Unit Cost Total Cost Quantity Unit Cost Total CostA. EquipmentA(1) ReplacementA(2) ProductivityA(3) New MissionA(4) Environmental ComplianceSubtotal $0.0 $0.0 $0.0
B. ADPE/TelecommB(1) Computer Hardware $0.0 $0.0 $283.0 B(2) Computer SoftwareB(3) TelecommunicationsB(3) Other ComputerSubtotal $0.0 $0.0 $283.0
C. Software DevelopmentC(1) Planning/DesignC(2) System Development $1,603.0 $1,723.0 $3,090.0 C(3) DeploymentC(4) Mgt/Tech SupportSubtotal $1,603.0 $1,723.0 $3,090.0
D. Minor ConstructionSubtotal $0.0 $0.0 $0.0
TOTAL $1,603.0 $1,723.0 $3,373.0 Narrative Justification:
Component/Activity/Date Line No. & Item Description Activity IdentificationIntelligent Road/Rail Information Server (IRRIS)
FY09 FY10 FY11
Description: The Intelligent Road/Rail Information Server (IRRIS) is a web‐based tool that provides information on characteristics and readiness of commercial highway, rail, and port deployment infrastructure. IRRIS integrates detailed surface transportation infrastructure data, real‐time visualization tools, and near real‐time carrier tracking of shipments to enhance carrier performance monitoring and evaluation. The system provides the real‐time ability to track surface shipments on an extremely accurate spatial data background for both the Continental United States and outside of the Continental United States (CONUS and OCONUS). IRRIS provides a single point of reference for worldwide surface shipment asset visibility/in‐transit visibility and detailed transportation infrastructure information.
Description: The Intelligent Road/Rail Information Server (IRRIS) is a web‐based tool that provides information on characteristics and readiness of commercial highway, rail, and port deployment infrastructure. IRRIS integrates detailed surface transportation infrastructure data, real‐time visualization tools, and near real‐time carrier tracking of shipments to enhance carrier performance monitoring and evaluation. The system provides the real‐time ability to track surface shipments on an extremely accurate spatial data background for both the Continental United States and outside of the Continental United States (CONUS and OCONUS). IRRIS provides a single point of reference for worldwide surface shipment asset visibility/in‐transit visibility and detailed transportation infrastructure information.
Mission Benefits: The overall mission area of IRRIS is to provide a single point of interface for worldwide spatial surface movement control, along with the detailed infrastructure information visually displayed supporting rapid deployment. IRRIS will become the front spatial presentation piece of the Global Transportation Network of the future, creating an environment to allow key government staff the real time and static information necessary for planning and executing to fulfill their mission.
Deliverables: FY 09 ‐ Operationalize the Nodal Management and Enhanced Geospatial Information System (GIS ) initiatives. Develop the capabilities to provide increased in‐transit visibility of Arms, Ammunition, and Explosives (AA&E) shipments. Provide a GIS based dedicated road network for assigning sensitive shipments to specific routes. Enhance the control of surface shipments and re‐routing of shipments in‐transit. Provide tools for actively managing surface shipments and the carriers moving these shipments. Develop the ability to map and query current track of a railcar/barge or map and query all current shipment positions and track shipments regardless of conveyance and change of conveyance in‐route with Geospatial mapping. Provides enhanced Intransit Visibility (ITV) and Total Asset Visibility (TAV) throughout the pipeline. Map supplies worldwide. FY10‐ Visualization of Infrastructure Data Software Upgrade; FY11 ‐ Visualization of Infrastructure Data Software Upgrade.
Economic Analysis: Certified 24 Apr 09
Impact: If not funded, the capability to support current worldwide deployments and natural disasters with the tracking of surface shipments will be significantly degraded. Additionally, Surface Deployment and Distribution Command (SDDC) will be unable to realize improvements in efficiencies and elimination of voids to the Department of Defense (DOD) emergency response process in accordance with DOD Distribution and Strategic Plan.
Software: Not Applicable.
For Official Use Only Fund 9b, TWCF
138

Fund 9b(Dollars in Thousands)
Activity Group Capital Investment JustificationAir Force Working Capital Fund
Transportation Working Capital Fund
Fiscal Year (FY) 2011Budget Estimates
February 2010
Element of Cost Quantity Unit Cost Total Cost Quantity Unit Cost Total Cost Quantity Unit Cost Total CostA. EquipmentA(1) ReplacementA(2) ProductivityA(3) New MissionA(4) Environmental ComplianceSubtotal $0.0 $0.0 $0.0
B. ADPE/TelecommB(1) Computer Hardware $101.7 $0.0 B(2) Computer SoftwareB(3) TelecommunicationsB(3) Other ComputerSubtotal $101.7 $0.0 $0.0
C. Software DevelopmentC(1) Planning/DesignC(2) System Development $778.8 $0.0 $0.0 C(3) DeploymentC(4) Mgt/Tech SupportSubtotal $778.8 $0.0 $0.0
D. Minor ConstructionSubtotal $0.0 $0.0 $0.0
TOTAL $880.5 $0.0 $0.0 Narrative Justification:
Activity IdentificationCommand Staff
Line No. & Item DescriptionJoint Mobility Control Group (JMCG)
Component/Activity/DateUSTRANSCOM Command Staff/Transportation/February 2010
FY09 FY10 FY11
Description: Joint Mobility Control Group (JMCG) is the focal point for the development and implementation of new software tools to facilitate and improve the efficiency of operations of the Deployment Distribution Operations Center (DDOC). JMCG provides tools to support command and control (C2) operations of the DDOC and the Transportation Component Commands (TCCs).
Mission Benefits: Collaborative Transportation Flow Analysis (TransViz) ‐ Provides decision support for exception management in a collaborative environment. TransViz also provides shared visualizations that allow United States Transportation Command, its TCCs, the Component Commands (COCOMs), and the Services to collaboratively identify transportation bottlenecks and capacity shortfalls, and identify alternative courses of action to smooth the transportation flow. Deliverables: FY09 deployment schedule ‐March 2009 European Command (EUCOM); May 2009 Northern Command (NORTHCOM); August 2009 Pacific Command (PACOM).
Description: Joint Mobility Control Group (JMCG) is the focal point for the development and implementation of new software tools to facilitate and improve the efficiency of operations of the Deployment Distribution Operations Center (DDOC). JMCG provides tools to support command and control (C2) operations of the DDOC and the Transportation Component Commands (TCCs).
Mission Benefits: Collaborative Transportation Flow Analysis (TransViz) ‐ Provides decision support for exception management in a collaborative environment. TransViz also provides shared visualizations that allow United States Transportation Command, its TCCs, the Component Commands (COCOMs), and the Services to collaboratively identify transportation bottlenecks and capacity shortfalls, and identify alternative courses of action to smooth the transportation flow. Deliverables: FY09 deployment schedule ‐March 2009 European Command (EUCOM); May 2009 Northern Command (NORTHCOM); August 2009 Pacific Command (PACOM). The requested additional funding would also allow TransViz releases/major deliverables are scheduled as follows: M‐Tier deployment ‐May 2009; Web enabling of TransViz ‐May 2009; TransViz Release 2.3 ‐May 2009; TransViz Release 2.4 ‐ September 2009. In addition, effort is underway to transfer TransViz to the Defense Information Systems Agency (DISA) Global Command and Control System ‐ Joint (GCCS‐J) Program Management Office (PMO) in the FY09 timeframe.
Economic Analysis: Analysis of Alternatives validated July 2007. In process of completing a sustainment review for TransViz due to transitioning to DISA GCCS‐J program office.
Impact: Inability to provide the mission benefits stated above resulting in inefficient operations of the Defense Transportation System.
Software: JMCG utilizes five major software suites: Global Command and Control System‐ Joint (GCCS‐J) Common Operating Picture (COP), Intelligent Road and Rail Information S ystem (IRRIS), Command and COntrol PC (C2PC), Transportation Visualizer, and Defense Collaboration Online (DCO) as the collaboration suite .
For Official Use Only Fund 9b, TWCF
139

Fund 9b(Dollars in Thousands)
Activity Group Capital Investment JustificationAir Force Working Capital Fund
Transportation Working Capital Fund
Fiscal Year (FY) 2011Budget Estimates
February 2010
Element of Cost Quantity Unit Cost Total Cost Quantity Unit Cost Total Cost Quantity Unit Cost Total CostA. EquipmentA(1) ReplacementA(2) ProductivityA(3) New MissionA(4) Environmental ComplianceSubtotal $0.0 $0.0 $0.0
B. ADPE/TelecommB(1) Computer HardwareB(2) Computer SoftwareB(3) TelecommunicationsB(3) Other ComputerSubtotal $0.0 $0.0 $0.0
C. Software DevelopmentC(1) Planning/DesignC(2) System Development $2,349.0 $2,300.0 $2,144.0 C(3) DeploymentC(4) Mgt/Tech SupportSubtotal $2,349.0 $2,300.0 $2,144.0
D. Minor ConstructionSubtotal $0.0 $0.0 $0.0
TOTAL $2,349.0 $2,300.0 $2,144.0 Narrative Justification:
Component/Activity/DateUSTRANSCOM Command Staff/Transportation/February 2010
Activity IdentificationCommand Staff
Line No. & Item DescriptionJoint Flow and Analysis Systems for Transportation (JFAST)
FY09 FY10 FY11
Description: Joint Flow and Analysis System for Transportation (JFAST) is a user‐friendly analysis tool that quickly determines transportation feasibility. Regional Commanders and United States Transportation Command (USTRANSCOM) employ JFAST to analyze the transportation requirements for the execution of operations, Crisis Action Plans, Operation Plans (OPLANs), Concept of Operation Plan (CONPLAN) with Time Phased Force Deployment Data (TPFDD), Course of Action development, "what‐if" scenarios, and exercises. From mobilization to Tactical Assembly Area (TAA), JFAST projects full end‐to‐end delivery profiles of
Description: Joint Flow and Analysis System for Transportation (JFAST) is a user‐friendly analysis tool that quickly determines transportation feasibility. Regional Commanders and United States Transportation Command (USTRANSCOM) employ JFAST to analyze the transportation requirements for the execution of operations, Crisis Action Plans, Operation Plans (OPLANs), Concept of Operation Plan (CONPLAN) with Time Phased Force Deployment Data (TPFDD), Course of Action development, "what‐if" scenarios, and exercises. From mobilization to Tactical Assembly Area (TAA), JFAST projects full end‐to‐end delivery profiles of troops and equipment by all air, land, and sea modes of transportation. JFAST also generates the sustainment required by deployed forces and then determines the transportation requirements for that sustainment. JFAST, developed by USTRANSCOM, is designed for use by the entire Joint Planning and Execution Community (JPEC). JFAST is the only Joint Strategic Capabilities Plan (JSCP) approved program to determine transportation feasibility.
Mission Benefits: The JFAST provides integrated, authoritative modeling, simulation, and analysis for effective and efficient warfighter power projection and sustainment planning, operations, and training. The FY09 enhancements will expand the Distribution Environment Support System (DESS) capability, start development of continuous scheduling, expand land POE to POD movement, enhance air refueling modeling capability, and start development of web‐based capability. The FY10 work will continue to enhance the Distribution Environment Support System (DESS) capability, continue development of continuous scheduling, and add bidiretional flow, and continue to enhance web‐based capability. The FY11 work will continue to refine the DESS capability, develop capability for automatic port requirement generation, add capability for seaport multiplexing, and add multiport workflow analysis capability. The FY12 work will extend marshalling and staging capacity to airlift, add volumetric loading of aircraft, and develop a manual route planner for the ground scheduler.
Economic Analysis: Certified June 2007. New EA completed June 2009.
Impact: Without this investment, USTRANSCOM will be unable to provide a Modeling and Simulation environment of interoperable, collaborative models and executuion systems capable of providing accurate and consistent answers at the required breadth and depth of the Defense Transportation System (DTS) problem space.
Software: N/A
For Official Use Only Fund 9b, TWCF
140

Fund 9b(Dollars in Thousands)
Activity Group Capital Investment JustificationAir Force Working Capital Fund
Transportation Working Capital Fund
Fiscal Year (FY) 2011Budget Estimates
February 2010
Element of Cost Quantity Unit Cost Total Cost Quantity Unit Cost Total Cost Quantity Unit Cost Total CostA. EquipmentA(1) ReplacementA(2) ProductivityA(3) New MissionA(4) Environmental ComplianceSubtotal $0.0 $0.0 $0.0
B. ADPE/TelecommB(1) Computer Hardware $718.8 $5,176.0 $4,760.0 B(2) Computer SoftwareB(3) TelecommunicationsB(3) Other ComputerSubtotal $718.8 $5,176.0 $4,760.0
C. Software DevelopmentC(1) Planning/DesignC(2) System Development $6,360.6 $1,938.0 $3,393.0 C(3) DeploymentC(4) Mgt/Tech SupportSubtotal $6,360.6 $1,938.0 $3,393.0
D. Minor ConstructionSubtotal $0.0 $0.0 $0.0
TOTAL $7,079.4 $7,114.0 $8,153.0 Narrative Justification:
Activity IdentificationUSTRANSCOM Command Staff/Transportation/February 2010
FY09 FY10 FY11Command Staff
Line No. & Item DescriptionLocal Area Network (USTRANSCOM LAN)
Component/Activity/Date
Description: The United States Transportation Command Local Area Network (USTRANSCOM LAN) is the network backbone supporting all command and control (C2) communications of the USTRANSCOM Commander and his staff. It is comprised of ~ 3400 distinct personal computers, numerous servers and routers, a multitude of switches and the hardware and software infrastructure comprising the classified and unclassified Local Area Networks (LANs) at the USTRANSCOM command site on Scott Air Force Base, Illinois. This program supports the following activities: Upgrade of network infrastructure
Description: The United States Transportation Command Local Area Network (USTRANSCOM LAN) is the network backbone supporting all command and control (C2) communications of the USTRANSCOM Commander and his staff. It is comprised of ~ 3400 distinct personal computers, numerous servers and routers, a multitude of switches and the hardware and software infrastructure comprising the classified and unclassified Local Area Networks (LANs) at the USTRANSCOM command site on Scott Air Force Base, Illinois. This program supports the following activities: Upgrade of network infrastructure to support increasing bandwidth, service, systems and reliability requirements. Server upgrades, network router and switch upgrades, cable installation, network component upgrades and wide area network connectivity with component commands. Upgrade of standard server commercial off‐the‐shelf (COTS) products. Provides worldwide Defense Transportation System (DTS) theater‐centric Command, Control, Communications and Computer (C4) infrastructure baseline assessments, engineering and documentation. Provides Operations and Maintenance (O&M) hardware and system administration support. Provides studio and portable Video Teleconferencing (VTC) support. Provides Audiovisual (AV) presentation system support.
Mission Benefits: The USTRANSCOM networks are comprised of classified and unclassified LAN segments and Wide Area Network (WAN) connectivity with transportation component commands (TCCs). LAN improvements are designed to support increasing performance and bandwidth. FY09 and FY10 will provide the 10‐year cabling refresh for USTRANSCOM headquarters buildings as well as begin an expected switchover from traditional (ISDN) phones to Voice Over Internet Protocol (VOIP). FY11 will provide improved, secure remote access to the network for travelling personnel and our global partners. FY12 ‐expected hardware refreshes and upgrades.
Economic Analysis: Life Cycle Cost Estimate (LCCE) certified March 2007.
Impact: The interruption of capabilities would lead to rapid degradation of Command and Control for all aspects of the DTS. Gaps in reporting data would immediately affect the Commanders decision cycle, crippling the ability of USTRANSCOM to accomplish its mission of managing Department of Defense transportation assets.
Software: N/A
For Official Use Only Fund 9b, TWCF
141

Fund 9b(Dollars in Thousands)
Activity Group Capital Investment JustificationAir Force Working Capital Fund
Transportation Working Capital Fund
Fiscal Year (FY) 2011Budget Estimates
February 2010
Element of Cost Quantity Unit Cost Total Cost Quantity Unit Cost Total Cost Quantity Unit Cost Total CostA. EquipmentA(1) ReplacementA(2) ProductivityA(3) New MissionA(4) Environmental ComplianceSubtotal $0.0 $0.0 $0.0
B. ADPE/TelecommB(1) Computer HardwareB(2) Computer SoftwareB(3) TelecommunicationsB(3) Other ComputerSubtotal $0.0 $0.0 $0.0
C. Software DevelopmentC(1) Planning/DesignC(2) System Development $561.3 $588.0 $596.0 C(3) DeploymentC(4) Mgt/Tech SupportSubtotal $561.3 $588.0 $596.0
D. Minor ConstructionSubtotal $0.0 $0.0 $0.0
TOTAL $561.3 $588.0 $596.0 Narrative Justification:
Activity IdentificationUSTRANSCOM Command Staff/Transportation/February 2010
FY09 FY10 FY11Command Staff
Line No. & Item DescriptionLogbook
Component/Activity/Date
Description: Logbook supports peacetime and wartime Deployment Distribution Operations Center (DDOC) and United States Transportation Command (USTRANSCOM) operations with a command and control information sharing tool that provides concurrent commentary and iterative working of linked tasks. This real‐time cataloging and sharing of data/information provides a complete record of all taskings and reports generated within the tool. Logbook provides the means for sharing movement requirement actions with the Transportation Component Commands (TCCs) and for disseminating message traffic i hi h DDOC
Description: Logbook supports peacetime and wartime Deployment Distribution Operations Center (DDOC) and United States Transportation Command (USTRANSCOM) operations with a command and control information sharing tool that provides concurrent commentary and iterative working of linked tasks. This real‐time cataloging and sharing of data/information provides a complete record of all taskings and reports generated within the tool. Logbook provides the means for sharing movement requirement actions with the Transportation Component Commands (TCCs) and for disseminating message traffic within the DDOC.
Mission Benefits: Logbook is the primary record‐copy command and control (C2) system within the DDOC and between the DDOC and TCCs. This includes contingency/exercise report generation and publication as well as automated information flow between DDOC shifts/positions and TCCs. Logbook replaces the green record books used for station logs with automated logs capable of archiving, speedy queries, and phone calls/emails with record‐copy taskings and suspenses both within USTRANSCOM and to the TCCs. FY09 capabilities include improved offline work capability and improved math function analytical capability. FY10 capabilities include improved knowledge management capabilities and improved crisis and contingency support. FY11 development will include improved analytical spreadsheet and math function capabilities. FY12‐Pending AoA results/determination.
Economic Analysis: Economic Analysis certified January 2008, anticipate EA completion Fall 2009.
Impact: Without this tool, USTRANSCOMs operations hub would resort to several stubby pencil tools previously used. Without this collaborative tool, operators would spend several hours creating, coordinating and working tasks that now take just minutes; additionally, other tools that perform similar functions do not provide the speedy archival search/retrieval capability that Logbook gives its users.
Software: Fairplay software is shared by both the Single Mobility System (SMS) and Logbook programs and is paid for with operating funds.
For Official Use Only Fund 9b, TWCF
142

Fund 9b(Dollars in Thousands)
Activity Group Capital Investment JustificationAir Force Working Capital Fund
Transportation Working Capital Fund
Fiscal Year (FY) 2011Budget Estimates
February 2010
Air Mobility Command/Transportation/February 2010 HQ AMC, Scott AFB IL
Element of Cost Quantity Unit Cost Total Cost Quantity Unit Cost Total Cost Quantity Unit Cost Total CostA. EquipmentA(1) ReplacementA(2) ProductivityA(3) New MissionA(4) Environmental ComplianceSubtotal $0.0 $0.0 $0.0
B. ADPE/TelecommB(1) Computer HardwareB(2) Computer SoftwareB(3) TelecommunicationsB(3) Other ComputerSubtotal $0.0 $0.0 $0.0
C. Software DevelopmentC(1) Planning/DesignC(2) System DevelopmentC(3) DeploymentC(4) Mgt/Tech SupportSubtotal $0.0 $0.0 $0.0
D. Minor ConstructionSubtotal $8,379.0 $7,700.0 $9,000.0
TOTAL $8,379.0 $7,700.0 $9,000.0 Narrative Justification:
Component/Activity/Date Line No. & Item Description Activity IdentificationMinor Construction - AMC
FY09 FY10 FY11
Description: Minor Construction (MC), funds all minor construction work to rebuild new facilities or construct additions to existing facilities that qualify for Transportation Working Capital Funds (TWCF).
Mi i B fit Th H d t Ai M bilit C d (HQ AMC) TWCF i t t t t i i li ith th D t t f D f (D D) T t ti Vi i f th T t Fi t C t It' i t t i t
Description: Minor Construction (MC), funds all minor construction work to rebuild new facilities or construct additions to existing facilities that qualify for Transportation Working Capital Funds (TWCF).
Mission Benefits: The Headquarters Air Mobility Command (HQ AMC) TWCF investment strategy is in line with the Department of Defense (DoD) Transportation Vision for the Twenty‐First Century. It's intent is to ensure sustainability and quality of life. One of the guiding principles requires us to invest in transportation programs, systems, and enhancements that support mobility requirements, assets visibility, and efficient transportation operations.
Economic Analysis: EA to be done by projects.
Impact: Funding cuts will impact our ability to support critical HQ AMC, 515 Air Mobility Operations Wing (AMOW), and 521 AMOW requirements to enhance or improve mobility operations and provide adequate force protection through the construction of new facilities and additions in the Continental United States (CONUS) and en‐route infrastructure. Reductions to this program will have a negative impact on our ability to provide seamless airlift from point of origin to destination, to provide quality customer service, and to bring our existing facilities up to HQ AMC and Air Force standards. Many TWCF facilities are old, inadequate facilities, far from meeting acceptable standards, especially at our en‐route locations. Pavement requirements continue to grow for both new parking/loading/refueling areas and required improvements on deteriorating pavement resulting from heavy airlift use. Unfunded pavement requirements will result in limitations on AMC's ability to deliver passengers and cargo anywhere in the world. Passengers, troops, and valuable cargo and equipment will remain inadequately protected from terrorist threats. A multi‐million dollar Mechanized Handling Equipment (MHE) and Aerospace Ground Equipment (AGE) inventory will continue to be exposed to the elements causing the expected life span of this high priced equipment (including our costly flagship 60K Tunner loaders) to rapidly deteriorate and will remain inadequately protected from terrorist threats.
Software: Not Applicable
For Official Use Only Fund 9b, TWCF
143

Fund 9b(Dollars in Thousands)
Activity Group Capital Investment JustificationAir Force Working Capital Fund
Transportation Working Capital Fund
Fiscal Year (FY) 2011Budget Estimates
February 2010
Minor Construction (Atch) - AMCPROJECT CATEGORY QTY FY09 QTY FY10 QTY FY11
FY11 PBA/C Ground Equip (AGE) Storage 3 1,780.0 1 600.0 2 1,000.0Aerial Delivery System Facility 0 0 1 225.0 0 0Aircraft Support Equip Storage Yards 0 .0 0 0 1 300.0Airfield Flood Lighting 0 0 0 0 1 200.0Air Freight Terminals 4 718.0 1 700.0 1 750.0Air Passenger Terminal 0 .0 1 600.0 1 625.0Air Frt/Pax Terminals 0 0 0 0 1 400.0Aircraft Maint Control Office 0 0 1 600.0 0 0Apron Parking 3 1755 1 400.0 0 0Blast Deflectors 0 0 0 0 0 0Command Posts 0 0 1 300.0 0 0Covered MHE Storage 1 709.0 0 0 1 725.0Cryogenics Facilities 1 298 1 580.0 0 0Engine Maintenance 0 0 1 600.0 0 0Fleet Services 0 0 0 0 0 0Warehouse Storage 0 0 0 0 0 0Forward Supply Locations 0 0 0 0 0 0Fuel Hydrants 0 0 0 0 0 0General Purpose Maint Shops 1 592.0 0 0 1 1,200.0
For Official Use Only Fund 9b, TWCF
Large Aircraft Maint Dock 0 0 1 300.0 0 0Maintenance Hangars 1 210.0 0 0 1 700.0Pad Aircraft Wash Rack 0 0 0 0 0 0Open Storage, Air Freight 1 701.0 0 0 1 700.0Organizational Maint Shops 0 0 1 500.0 0 0Rate Fluctuations/Change Orders/Design 75 1,504.0 75 1,295.0 75 1,400.0Staging/Storage Yards 1 112 0 0 0 0Squadron Operations 0 0 0 0 0 0Test Cells 0 0 0 0 0 0Vehicle Maintenance Shops 0 .0 1 500.0 1 700.0Water Fire Pump Station 0 0 1 500.0 0 0Weighing Scale 0 0 0 0 1 300.0
TOTAL 8,379.0 7,700.0 9,000.0
For Official Use Only Fund 9b, TWCF
144

Fund 9b(Dollars in Thousands)
Activity Group Capital Investment JustificationAir Force Working Capital Fund
Transportation Working Capital Fund
Fiscal Year (FY) 2011Budget Estimates
February 2010
Element of Cost Quantity Unit Cost Total Cost Quantity Unit Cost Total Cost Quantity Unit Cost Total CostA. EquipmentA(1) ReplacementA(2) ProductivityA(3) New MissionA(4) Environmental ComplianceSubtotal $0.0 $0.0 $0.0
B. ADPE/TelecommB(1) Computer Hardware $0.0 $0.0 $0.0 B(2) Computer Software B(3) TelecommunicationsB(3) Other ComputerSubtotal $0.0 $0.0 $0.0
C. Software DevelopmentC(1) Planning/DesignC(2) System Development $0.0 $0.0 $0.0 C(3) DeploymentC(4) Mgt/Tech SupportSubtotal $0.0 $0.0 $0.0
D. Minor ConstructionSubtotal $0.0 $700.0 $0.0
TOTAL $0.0 $700.0 $0.0 Narrative Justification:
Component/Activity/Date Line No. & Item Description Activity IdentificationUSTRANSCOM Command Staff/Transportation/February 2010 Minor Construction - Command Staff Command Staff
FY09 FY10 FY11
Description: Expansion of Front Lobby Building. Description: Expansion of Front Lobby Building.
Mission Benefits: Increase the available space for official functions in the Front Lobby. Improves the force protection posture. Meets Anti‐terrorisom Force Protection standards.
Economic Analysis: Cost analysis was performed by the 375 AW as part of the Minor MILCON programing and acquisit ion processes.
Impact: Front Lobby will not meet Anti‐terrorisom Force Protection standards.
Software: NA
For Official Use Only Fund 9b, TWCF
145

Fund 9b(Dollars in Thousands)
Activity Group Capital Investment JustificationAir Force Working Capital Fund
Transportation Working Capital Fund
Fiscal Year (FY) 2011Budget Estimates
February 2010
Element of Cost Quantity Unit Cost Total Cost Quantity Unit Cost Total Cost Quantity Unit Cost Total CostA. EquipmentA(1) ReplacementA(2) ProductivityA(3) New MissionA(4) Environmental ComplianceSubtotal $0.0 $0.0 $0.0
B. ADPE/TelecommB(1) Computer HardwareB(2) Computer SoftwareB(3) TelecommunicationsB(3) Other ComputerSubtotal $0.0 $0.0 $0.0
C. Software DevelopmentC(1) Planning/DesignC(2) System DevelopmentC(3) DeploymentC(4) Mgt/Tech SupportSubtotal $0.0 $0.0 $0.0
D. Minor ConstructionSubtotal $0.0 $300.0 $300.0
TOTAL $0.0 $300.0 $300.0 Narrative Justification:
Component/Activity/Date Line No. & Item Description Activity IdentificationDefense Courier Division/Transportation/February 2010 Minor Construction - DCD DCD
FY09 FY10 FY11
Description: Defense Courier Station(s) (DCS) ‐ Sensitive Compartmented Information Facility (SCIF) and security system upgrade as deemed necessary by Defense Intelligence Agency (DIA) and duringDescription: Defense Courier Station(s) (DCS) ‐ Sensitive Compartmented Information Facility (SCIF) and security system upgrade as deemed necessary by Defense Intelligence Agency (DIA) and during building renovations.
Mission Benefits: Every courier station must maintain a SCIF accredited by DIA. Construction must be in compliance with Director of Central Intelligence Directive (DCID) 6/9. If facilities are found in non‐compliance during DIA inspections, immediate repairs are required. Deliverables:FY09 ‐ $200K DCS ‐ Travis. Funds required to upgrade facility to the required standards for top secret mission ‐ to include SCIF, $100K ‐ J3 ‐ Emergency security upgrades to SCIFs at any of the 18 DCS separate operating locations. FY10 ‐ $200K ‐ DCS ‐ Travis. Funds required to upgrade facility to the required standards for top secret mission ‐ to include SCIF and $100K Emergency security upgrades to SCIFs. J3 ‐ $100K‐ Emergency upgrades required at any of the 18 DCS separate operating locations. FY12 ‐ $100K Emergency security upgrades to SCIFs at any of the 18 DCS separate operating locations.
Economic Analysis: The Travis CE is accomplishing the economic analysis of the upgrades. Project has been approved and may start either late FY09 or in FY10.
Impact: Stations will lose their accreditation and be required to relocate to a different SCIF that is accredited.
Software: Not applicable.
For Official Use Only Fund 9b, TWCF
146

Fund 9b(Dollars in Thousands)
Activity Group Capital Investment JustificationAir Force Working Capital Fund
Transportation Working Capital Fund
Fiscal Year (FY) 2011Budget Estimates
February 2010
Project Category QTY FY09 QTY FY10 QTY FY11Minor Construction - Emergency Security Upgrades to SCIFs 0 0 1 300 1 300 Facility Upgrade (Travis) 0 0 0 0 0 0
Total 0 0 1 300 1 300
Minor Construction (Atch) - DCD
For Official Use Only Fund 9b, TWCFFor Official Use Only Fund 9b, TWCF
147

Fund 9b(Dollars in Thousands)
Activity Group Capital Investment JustificationAir Force Working Capital Fund
Transportation Working Capital Fund
Fiscal Year (FY) 2011Budget Estimates
February 2010
Surface Deployment and Distribution Center/Transportation/February 2010 SDDC
Element of Cost Quantity Unit Cost Total Cost Quantity Unit Cost Total Cost Quantity Unit Cost Total CostA. EquipmentA(1) ReplacementA(2) ProductivityA(3) New MissionA(4) Environmental ComplianceSubtotal $0.0 $0.0 $0.0
B. ADPE/TelecommB(1) Computer Hardware $0.0 $0.0 B(2) Computer SoftwareB(3) TelecommunicationsB(3) Other ComputerSubtotal $0.0 $0.0 $0.0
C. Software DevelopmentC(1) Planning/DesignC(2) System DevelopmentC(3) DeploymentC(4) Mgt/Tech SupportSubtotal $0.0 $0.0 $0.0
D. Minor ConstructionSubtotal $2,000.0 $2,000.0 $2,000.0
TOTAL $2,000.0 $2,000.0 $2,000.0 Narrative Justification:
Component/Activity/Date Line No. & Item Description Activity IdentificationMinor Construction - SDDC
FY09 FY10 FY11
Description: Most Surface Deployment and Distribution Command (SDDC) Minor Construction projects are currently scheduled for Military Ocean Terminal Sunny Point (MOTSU). MOTSU is the premier Department of Defense ammunition terminal and is considered a vital part of the strategic Continental United States (CONUS) power projection platform supporting warfighting Commanders around the world. It is relied upon to maintain a high OPTEMPO consisting of ammunition resupply missions pre‐position operations, and Foreign Military Sales operations.
FY09: Expand Re‐Stuff Facility ($750) ‐ Justification: Cost Savings. Currently, MOTSU is required to lease portable office space to accommodate Army and Air Force Prep operations personnel. Expansion of Building 120 will eliminate the requirement for mobile offices and provide a permanent field office used during Prep operations. Department of Emergency Services (DES) Storage building ($750)‐Due to increased mission capabilities and added (new) equipment requirements the Fire Dept. and Provost Marshal Office (PMO) need of a storage facility. The nature of the emergency response mission requires equipment and supplies in a ready posture. Hazardous Materials / Chemical, biological, radiological, nuclear and high yield expolisves (CBRNE) and Weapons of mass destruction (WMD) equipment continues to be the bulk of storage requirements. Currently, equipment is being stored in temporary facilities and in work spaces within the fire station and PMO. Estimated storage space needed, 2500 sqft. Connect Visitor Center Parking to Truck Inspection ($500K)‐Improves traffic circulation in and around the front gate(s). Ammo trucks taking the wrong entrance jam up traffic as they have to back down the road one‐quarter mile.
FY10: Improvements to Fire Station #2 ($650K) ‐ Auxiliary Fire Station #2, constructed in 1994, Figure 12, was built to meet the requirement of Army Regulation (AR) 420‐90, which requires a seven‐minute‐minimum response time to 90% of all alarms and emergencies on terminal. It was built simply as an “auxiliary” station and does not meet National Fire Protection Association (NFPA) nor DOD standards, although it operates in the same 24/7 manner as the main fire station. This renovation and improvementwill provide necessary space to adequately house equipment and personnel to meet new and broadening response criteria. Construct Canopy over Rail Inspection Facility ($600K) ‐ Constructs canopy over the rail inspection facility. The rail inspection facility is an essential component in the security operations of MOTSU. The inspection pit facilitates electronic and manual inspection of the underside of each car. A canopy will protect the equipment from the elements and facilitate the inspection process in inclement weather.Construct Equipment Shelter ‐Logistics ($750) ‐ Project constructs a covered facility at remote location on MOTSU. Shelter to allow for pre‐positioning of critical mission support equipment, at the point‐of‐use, in direct support of the MOTSU mission.
FY11: Fire Training Tower ($750K) ‐ Add new burn rooms and add Liquid Propane (LP) gas burners in Fire Training Building. Improvements are required to meet NFPA code requirements. Operations Support: Insures that the fire fighters are properly trained to provide fire protection during operations. Fire fighters will not receive realistic fire ground training needed to maintain the proper levels of proficiency. Training will be insufficient to safely support the fire‐fighting mission of the ammunition port. Restroom Addition to Post 2 ($350K) ‐ Project constructs a restroom addition to the Post 2 Guard Facility. Install Second Connection to Brunswick Co. Water System ($275K) ‐ There is currently only one pipe that brings water onto the Installation. The water system into MOTSU is vulnerable from both security and maintenance perspectives. . Should that pipe be damaged or sabotaged, the water system would be affected base wide. Moreover, the addition of a loop in the system would provide additional flow capacity and pressure for use in fire fighting. Install water loop down range ($275) ‐ Installs water lines to connect laterals. Improves water pressure and fire fighting capability. Allows isolation of areas without shutting off water to everything downstream Forklift Storage at TA‐1 ($350K) ‐ Contructs a canopy over forklift staging area at TA‐1. It is imperative to provide some level of protection to our equipment in an effort to minimize maintenance and repair costs throughout their lifecycle. This project will provide a canopy over an existing hardstand where forklifts are pre‐positioned at the point‐of‐use.
Impact: Projects ensure continuous operations and support for the terminals important warfighting mission.
For Official Use Only Fund 9b, TWCF
148

Fund 9b(Dollars in Thousands)
Activity Group Capital Investment JustificationAir Force Working Capital Fund
Transportation Working Capital Fund
Fiscal Year (FY) 2011Budget Estimates
February 2010
Minor Construction (Atch) - SDDC
Date: February 2010 QTY FY09 QTY FY10 QTY FY11
Minor Construction is as follows:
FY09 (Over $100K)FY10 PB - Expand Re-Stuff Facility 1 $750Moved forward from FY10 - DES Storage Building 1 $750Moved forward from FY11 - Connector Road to Truck Inspection & Op Ar 1 $500
FY10 (Over $100K)FY10 PB - Improvements to Fire Station #2 1 $650Construct Canopy over Rail Inspection Facility 1 $600Delayed from FY09 - Construct equipment shelter (S. Holding) 1 $750
FY11 (Over $100K)FY10 PB - Fire Training Tower Improvements 1 $750FY10 PB R Addi i P 2 $
For Official Use Only Fund 9b, TWCF
FY10 PB - Restroom Addition to Post 2 1 $350Delayed - Install Water Loops Down Range 1 $275Delayed - Install 2nd Connection to Brunswick Co. 1 $275Forklift Storage at TA-1 1 $350
FY12 (Over $100K)FY10 PB - Construct Env & Nat Res Storage ShedFY10 PB - Construct Equipment Shelter Center WharfFY10 PB - LPS at North Wharf Backup Yard
FY13 (Over $100K)FY10 PB - Construct Equipment Shelter South WharfFY10 PB - LPS at Center Wharf Backup YardFY10 PB - Construct Quick-Range
For Official Use Only Fund 9b, TWCF
149
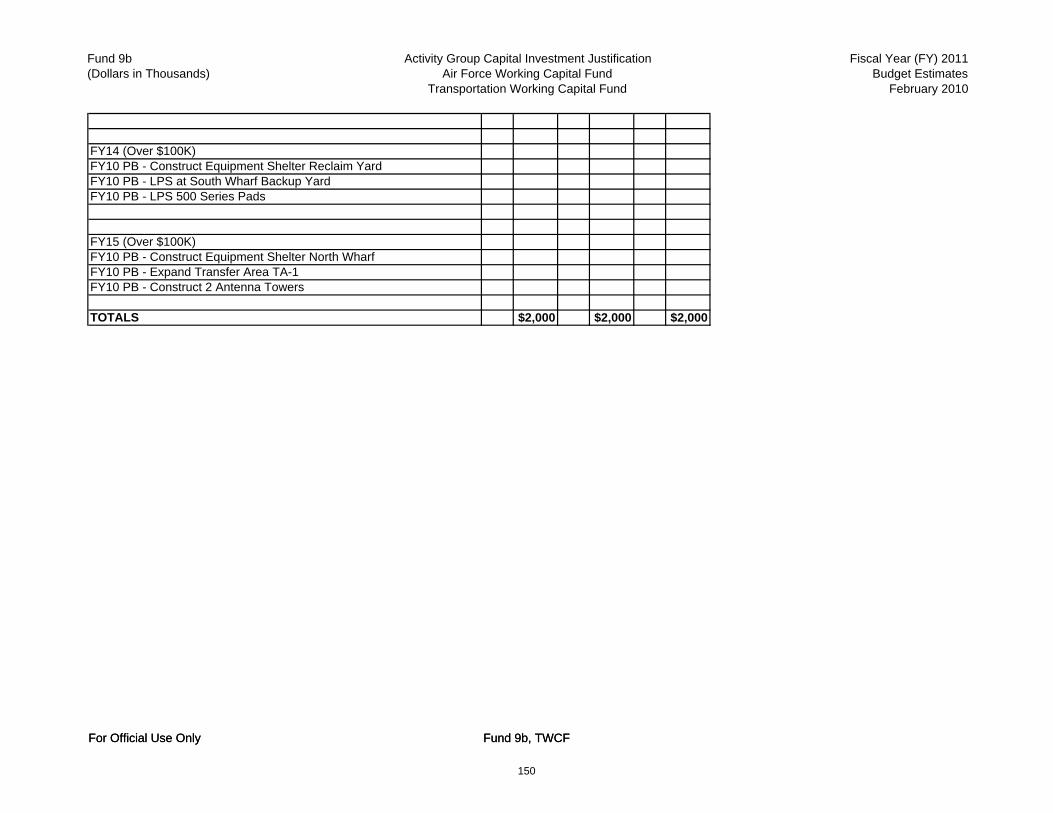
Fund 9b(Dollars in Thousands)
Activity Group Capital Investment JustificationAir Force Working Capital Fund
Transportation Working Capital Fund
Fiscal Year (FY) 2011Budget Estimates
February 2010
FY14 (Over $100K)FY10 PB - Construct Equipment Shelter Reclaim YardFY10 PB - LPS at South Wharf Backup YardFY10 PB - LPS 500 Series Pads
FY15 (Over $100K)FY10 PB - Construct Equipment Shelter North WharfFY10 PB - Expand Transfer Area TA-1FY10 PB - Construct 2 Antenna Towers
TOTALS $2,000 $2,000 $2,000
For Official Use Only Fund 9b, TWCFFor Official Use Only Fund 9b, TWCF
150

Fund 9b(Dollars in Thousands)
Activity Group Capital Investment JustificationAir Force Working Capital Fund
Transportation Working Capital Fund
Fiscal Year (FY) 2011Budget Estimates
February 2010
Air Mobility Command/Transportation/February 2010 HQ AMC, Scott AFB IL
Element of Cost Quantity Unit Cost Total Cost Quantity Unit Cost Total Cost Quantity Unit Cost Total CostA. EquipmentA(1) ReplacementA(2) ProductivityA(3) New MissionA(4) Environmental ComplianceSubtotal $0.0 $0.0 $0.0
B. ADPE/TelecommB(1) Computer Hardware $0.0 $0.0 $1,078.0 B(2) Computer SoftwareB(3) TelecommunicationsB(3) Other ComputerSubtotal $0.0 $0.0 $1,078.0
C. Software DevelopmentC(1) Planning/DesignC(2) System DevelopmentC(3) DeploymentC(4) Mgt/Tech SupportSubtotal $0.0 $0.0 $0.0
D. Minor ConstructionSubtotal $0.0 $0.0 $0.0
TOTAL $0.0 $0.0 $1,078.0 Narrative Justification:
Component/Activity/Date Line No. & Item Description Activity IdentificationObjective Wing Command Post (OWCP)
FY09 FY10 FY11
Description: The Objective Wing Command Post (OWCP) is an umbrella program providing modernization and standardization of Air Mobility Command (AMC) Command Posts and Air Mobility Control Description: The Objective Wing Command Post (OWCP) is an umbrella program providing modernization and standardization of Air Mobility Command (AMC) Command Posts and Air Mobility Control Centers (AMCCs) by installing the Air Mobility Advanced Console System (AMACS) and digital recorders.
Mission Benefits: The OWCP includes two‐sub programs: the AMACS is the management/mission monitoring, maintenance coordination, and operational reporting in support of the AMC Global Reach Mission and the Closed Circuit Flightline Video (CCFV) is a surveillance system, with recording capability, to monitor flightline activities and provide security for loading of aircraft, and surveillance security while parked. Deliverables: FY09: Switch Upgrade at Yokota, Incirlik, Osan, Incirlik AB; FY10: No deliverable due to capital threshold amount. FY 11: Provide technical refresh at Elmendorf and software upgrades to all enroute systems.
Economic Analysis: Economic Analysis (EA) certified April 2009.
Impact: CCFV and AMACS equipment would not be installed.
Software: Not applicable.
For Official Use Only Fund 9b, TWCF
151

Fund 9b(Dollars in Thousands)
Activity Group Capital Investment JustificationAir Force Working Capital Fund
Transportation Working Capital Fund
Fiscal Year (FY) 2011Budget Estimates
February 2010
Air Mobility Command/Transportation/February 2010 HQ AMC, Scott AFB IL
Element of Cost Quantity Unit Cost Total Cost Quantity Unit Cost Total Cost Quantity Unit Cost Total CostA. EquipmentA(1) ReplacementA(2) ProductivityA(3) New MissionA(4) Environmental ComplianceSubtotal $0.0 $0.0 $0.0
B. ADPE/TelecommB(1) Computer Hardware $0.0 $0.0 $0.0 B(2) Computer SoftwareB(3) TelecommunicationsB(3) Other ComputerSubtotal $0.0 $0.0 $0.0
C. Software DevelopmentC(1) Planning/DesignC(2) System DevelopmentC(3) Deployment $3,300.0 C(4) Mgt/Tech SupportSubtotal $0.0 $3,300.0 $0.0
D. Minor ConstructionSubtotal $0.0 $0.0 $0.0
TOTAL $0.0 $3,300.0 $0.0 Narrative Justification:
Component/Activity/Date Line No. & Item Description Activity IdentificationPilot Performance Advisory System (PPAS)
FY09 FY10 FY11
Description: The Pilot Performance Advisory System (PPAS) is a cost index optiminization software that will allow aircraft operators to minimize operating costs without using on board flight management systems. It allows for in‐flight changes to compute the best vertical profile, speed, and power settings to minimize fuel burn rates. Description: The Pilot Performance Advisory System (PPAS) is a cost index optiminization software that will allow aircraft operators to minimize operating costs without using on board flight management systems. It allows for in‐flight changes to compute the best vertical profile, speed, and power settings to minimize fuel burn rates.
Mission Benefits: PPAS will allow C‐17 aircrew to make in‐flight adjustments to optimize fuel consumption as well as other flying cost objectives. Pilots will be able to enter data into PPAS which will then indicate flying parameters (speed and altitude) to most economically achieve these objectives. Parameters include optimal mach numbers, altitude, and descent profiles within safe operating thresholds. PPAS helps aircrew fly within optimal parameters, yet is flexible enough to allow aircrew to make necessary adjustments to enable mission success.
FY10: Deliverable is PPAS software with C‐17 performance data loaded into the software tables, including a Graphic User Interface (GUI)‐Provide cruise optimization options for various desired flight outcomes including minimum overall operating costs, minimum flight time, and minimum fuel burn for maximum range.‐Optimize in all phases of flight, including climb, cruise, descent, and holding.‐Provide pilots with optimum predicted altitude information using actual wind and temperature for each of the desired flight outcomes.‐Be compatible with existing electronics currently operating on the aircraft.‐Provide a training package, to include a Computer Base Training (CBT) for crewmembers.‐Provide tabular data cards for in‐flight use prior to software availability on laptop.
Economic Analysis: In a business case analysis performed by USAF FM Center of Excellence, 1 Oct 2009 , it was determined that implementation of PPAS results in an ROI of 1936.2% (based on jet fuel @ $2.13/gal, present price $2.78/gal) with payback occurring in the first year of implementation.
Impact: If PPAS is not procured/used in the C‐17, the C‐17 crew will not be able to improve optimization of fuel usage and continue to burn excess fuel on missions.Software: PPAS Software.
For Official Use Only Fund 9b, TWCF
152

Fund 9b(Dollars in Thousands)
Activity Group Capital Investment JustificationAir Force Working Capital Fund
Transportation Working Capital Fund
Fiscal Year (FY) 2011Budget Estimates
February 2010
Element of Cost Quantity Unit Cost Total Cost Quantity Unit Cost Total Cost Quantity Unit Cost Total CostA. EquipmentA(1) ReplacementA(2) ProductivityA(3) New MissionA(4) Environmental ComplianceSubtotal $0.0 $0.0 $0.0
B. ADPE/TelecommB(1) Computer Hardware $0.0 $0.0 $0.0 B(2) Computer Software B(3) TelecommunicationsB(3) Other ComputerSubtotal $0.0 $0.0 $0.0
C. Software DevelopmentC(1) Planning/DesignC(2) System Development $0.0 $0.0 $0.0 C(3) DeploymentC(4) Mgt/Tech SupportSubtotal $0.0 $0.0 $0.0
D. Minor ConstructionSubtotal $0.0 $0.0 $0.0
TOTAL $0.0 $0.0 $0.0 Narrative Justification:
Activity IdentificationUSTRANSCOM Command Staff/Transportation/February 2010
FY09 FY10 FY11
Command StaffLine No. & Item DescriptionProtect Information - Information Assurance (IA)
Component/Activity/Date
Description: Program to provide information operations capabilities that protect and defend information and information systems by ensuring their availability, integrity, authentication, confidentiality and non‐repudiation. Program is aligned with the Department of Defense (DOD) Information Assurance (IA) Strategic Plan. Develop and deploy protection capabilities across the enterprise. Includes capabilities such as Communication Security (COMSEC) Data at Rest (DaR) and identity & access management
Description: Program to provide information operations capabilities that protect and defend information and information systems by ensuring their availability, integrity, authentication, confidentiality and non‐repudiation. Program is aligned with the Department of Defense (DOD) Information Assurance (IA) Strategic Plan. Develop and deploy protection capabilities across the enterprise. Includes capabilities such as Communication Security (COMSEC), Data at Rest (DaR), and identity & access management.
Mission Benefits: Safeguard data (as information) as it is being created, used, modified, stored, moved, and destroyed. Deliverables: FY09 through FY12‐ Not Applicable./ no funding
Economic Analysis: Life Cycle Cost Estimate (LCCE) received August 2007; recertification of existing EA anticipated November 2009.
Impact: Failure to protect United States Transportation Command (USTRANSCOM) data increases operational risk to USTRANSCOM missions.
Software: Initial licenses for DaR software being purchased in FY08. Maintenance of license fees is at the enterprise level, paid for by Infostructure.
For Official Use Only Fund 9b, TWCF
153

Fund 9b(Dollars in Thousands)
Activity Group Capital Investment JustificationAir Force Working Capital Fund
Transportation Working Capital Fund
Fiscal Year (FY) 2011Budget Estimates
February 2010
Element of Cost Quantity Unit Cost Total Cost Quantity Unit Cost Total Cost Quantity Unit Cost Total CostA. EquipmentA(1) ReplacementA(2) ProductivityA(3) New MissionA(4) Environmental ComplianceSubtotal $0.0 $0.0 $0.0
B. ADPE/TelecommB(1) Computer Hardware $0.0 $0.0 $0.0 B(2) Computer SoftwareB(3) TelecommunicationsB(3) Other ComputerSubtotal $0.0 $0.0 $0.0
C. Software DevelopmentC(1) Planning/DesignC(2) System Development $232.1 $270.0 $276.0 C(3) DeploymentC(4) Mgt/Tech SupportSubtotal $232.1 $270.0 $276.0
D. Minor ConstructionSubtotal $0.0 $0.0 $0.0
TOTAL $232.1 $270.0 $276.0 Narrative Justification:
Activity IdentificationUSTRANSCOM Command Staff/Transportation/February 2010
FY09 FY10 FY11
Command StaffLine No. & Item DescriptionProvide IA Situational Awareness/IA C2 - Information Assurance (IA)
Component/Activity/Date
Description: Program to provide information operations capabilities that protect and defend information and information systems by ensuring their availability, integrity, authentication, confidentiality and non‐repudiation. Program is aligned with the Department of Defense (DOD) Information Assurance (IA) Strategic Plan. Establish effective indications and warning (I&A) of potential or ongoing attacks against the enterprise. Develop and deploy an Information Assurance (IA) User Defined Operational Picture (UDOP). Conduct near real time and integrated IA and Network Operations (NETOPS) decision making
Description: Program to provide information operations capabilities that protect and defend information and information systems by ensuring their availability, integrity, authentication, confidentiality and non‐repudiation. Program is aligned with the Department of Defense (DOD) Information Assurance (IA) Strategic Plan. Establish effective indications and warning (I&A) of potential or ongoing attacks against the enterprise. Develop and deploy an Information Assurance (IA) User Defined Operational Picture (UDOP). Conduct near real time and integrated IA and Network Operations (NETOPS) decision making across the enterprise. Harmonize NETOPS, Information Operations (IO), Computer Network Attack (CNA) and Computer Network Defense (CND) policies, doctrine, relationships, and operations.
Mission Benefits: Integrate IA posture into a User Defined Operational Picture (UDOP). Synchronize with NETOPS and Joint Command and Control (C2) Common Operational Picture (COP) programs. Deliverables: FY09‐FY12: Design and develop new custom software modules and monitoring scripts to incorporate the monitoring of additional DTSs. Modify the SA COP's custom software modules to incorporate new and/or adjust the current functionality to meet USTRANSCOM monitoring requirements.
Economic Analysis: Life Cycle Cost Estimate received August 2007; recertification of existing EA anticipated November 2009.
Impact: The USTRANSCOM Global C4S Coordination Center (GCCC) will not have situational awareness of the service levels and availability of selected automated DTSs that are critical for USTRANSCOM to execute its operational mission.
Software: No license fees apply.
For Official Use Only Fund 9b, TWCF
154

Fund 9b(Dollars in Thousands)
Activity Group Capital Investment JustificationAir Force Working Capital Fund
Transportation Working Capital Fund
Fiscal Year (FY) 2011Budget Estimates
February 2010
Element of Cost Quantity Unit Cost Total Cost Quantity Unit Cost Total Cost Quantity Unit Cost Total CostA. EquipmentA(1) ReplacementA(2) ProductivityA(3) New MissionA(4) Environmental ComplianceSubtotal $0.0 $0.0 $0.0
B. ADPE/TelecommB(1) Computer HardwareB(2) Computer SoftwareB(3) TelecommunicationsB(3) Other ComputerSubtotal $0.0 $0.0 $0.0
C. Software DevelopmentC(1) Planning/DesignC(2) System Development $1,610.6 $1,433.0 $2,038.0 C(3) DeploymentC(4) Mgt/Tech SupportSubtotal $1,610.6 $1,433.0 $2,038.0
D. Minor ConstructionSubtotal $0.0 $0.0 $0.0
TOTAL $1,610.6 $1,433.0 $2,038.0 Narrative Justification:
Activity IdentificationCommand Staff
Component/Activity/Date Line No. & Item DescriptionSingle Mobility System (SMS)USTRANSCOM Command Staff/Transportation/February 2010
FY09 FY10 FY11
Description: Single Mobility System (SMS) is a suite of tools that provide for planning, visibility of requirements and missions (scheduled and unscheduled) and data visualization. SMS provides visibility of Special Assignment Airlift Mission (SAAM), Channel, Operational Support Airlift (OSA), contingency, exercise, Guard and Reserve missions and requirements. Additionally, it provides visibility of ship schedules, booked and manifested cargo, planning tools (Horse Blanket), Surface Deployment and Distribution Command (SDDC) Situation Reports (SITREPS) and Sport Reports (SPOTREPS), port data and decision support tools such as cost calculators, port locators, station and International Civil Aviation Organization (ICAO) workloads as well as mission monitoring of air land and sea conveyances. It provides visualization and analysis of Joint Planning and Execution System (JOPES) data exercise planning actions force movement tracking leading indicators for performance executive management visualizations tools for metrics and monitoring the
Description: Single Mobility System (SMS) is a suite of tools that provide for planning, visibility of requirements and missions (scheduled and unscheduled) and data visualization. SMS provides visibility of Special Assignment Airlift Mission (SAAM), Channel, Operational Support Airlift (OSA), contingency, exercise, Guard and Reserve missions and requirements. Additionally, it provides visibility of ship schedules, booked and manifested cargo, planning tools (Horse Blanket), Surface Deployment and Distribution Command (SDDC) Situation Reports (SITREPS) and Sport Reports (SPOTREPS), port data and decision support tools such as cost calculators, port locators, station and International Civil Aviation Organization (ICAO) workloads as well as mission monitoring of air land and sea conveyances. It provides visualization and analysis of Joint Planning and Execution System (JOPES) data, exercise planning actions, force movement tracking, leading indicators for performance, executive management visualizations, tools for metrics and monitoring the state of the enterprise.
Mission Benefits: SMS provides United States Transportation Command (USTRANSCOM) and its customers a quick, web‐based means of accessing transportation information in a user‐friendly format. By fusing data from various systems, users can quickly compare planned, scheduled, and actual movement information. This is a vast improvement over the alternative of logging into various other transportation systems and looking for data, or performing independent queries as needed against the data warehouse. FY09 planned capabilities include migration of major legacy interfaces to the Integrated Data Environement/Global Transportation Network Converegence (IGC). FY10 planned capabilities include improved situational displays, improved sealift tracking capabilities, and replacement of existing Global Transportation Network (GTN) interfaces with data from the IGC. FY11 Operations Requirements (30%), Development of follow on capability under AT21 . FY12‐ Continued support of Operations Requirements (30%), and development of follow on capability under AT21
Economic Analysis: Economic Analysis anticipated to be completed in November 2009.
Impact: Customers would be forced to query data from numerous transportation information systems to gather, compare, and report data as movements progress through the planning, scheduling and execution phases. Additionally, USTRANSCOM action officers would be forced back to "hunt and create" methods of building movement groupings, which are in turn tracked for feasibility analysis, tracking, and reporting.
Software: Fairplay software is shared by the Logbook and SMS programs and is paid for with operating funds.
For Official Use Only Fund 9b, TWCF
155
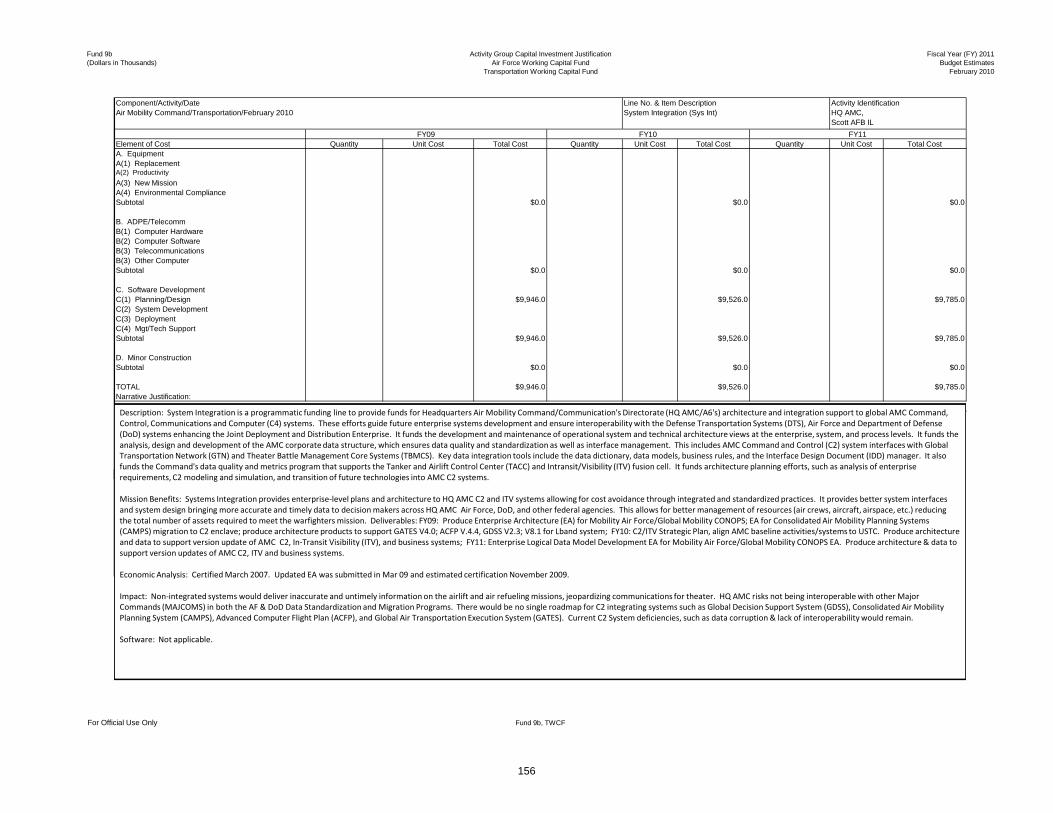
Fund 9b(Dollars in Thousands)
Activity Group Capital Investment JustificationAir Force Working Capital Fund
Transportation Working Capital Fund
Fiscal Year (FY) 2011Budget Estimates
February 2010
Air Mobility Command/Transportation/February 2010 HQ AMC, Scott AFB IL
Element of Cost Quantity Unit Cost Total Cost Quantity Unit Cost Total Cost Quantity Unit Cost Total CostA. EquipmentA(1) ReplacementA(2) ProductivityA(3) New MissionA(4) Environmental ComplianceSubtotal $0.0 $0.0 $0.0
B. ADPE/TelecommB(1) Computer HardwareB(2) Computer SoftwareB(3) TelecommunicationsB(3) Other ComputerSubtotal $0.0 $0.0 $0.0
C. Software DevelopmentC(1) Planning/Design $9,946.0 $9,526.0 $9,785.0 C(2) System DevelopmentC(3) DeploymentC(4) Mgt/Tech SupportSubtotal $9,946.0 $9,526.0 $9,785.0
D. Minor ConstructionSubtotal $0.0 $0.0 $0.0
TOTAL $9,946.0 $9,526.0 $9,785.0 Narrative Justification:
Component/Activity/Date Line No. & Item Description Activity IdentificationSystem Integration (Sys Int)
FY09 FY10 FY11
Description: System Integration is a programmatic funding line to provide funds for Headquarters Air Mobility Command/Communication's Directorate (HQ AMC/A6's) architecture and integration support to global AMC Command, Control, Communications and Computer (C4) systems. These efforts guide future enterprise systems development and ensure interoperability with the Defense Transportation Systems (DTS), Air Force and Department of Defense (DoD) systems enhancing the Joint Deployment and Distribution Enterprise. It funds the development and maintenance of operational system and technical architecture views at the enterprise, system, and process levels. It funds the analysis, design and development of the AMC corporate data structure, which ensures data quality and standardization as well as interface management. This includes AMC Command and Control (C2) system interfaces with Global Transportation Network (GTN) and Theater Battle Management Core Systems (TBMCS). Key data integration tools include the data dictionary, data models, business rules, and the Interface Design Document (IDD) manager. It also funds the Command's data quality and metrics program that supports the Tanker and Airlift Control Center (TACC) and Intransit/Visibility (ITV) fusion cell. It funds architecture planning efforts, such as analysis of enterprise requirements C2 modeling and simulation and transition of future technologies into AMC C2 systems
Description: System Integration is a programmatic funding line to provide funds for Headquarters Air Mobility Command/Communication's Directorate (HQ AMC/A6's) architecture and integration support to global AMC Command, Control, Communications and Computer (C4) systems. These efforts guide future enterprise systems development and ensure interoperability with the Defense Transportation Systems (DTS), Air Force and Department of Defense (DoD) systems enhancing the Joint Deployment and Distribution Enterprise. It funds the development and maintenance of operational system and technical architecture views at the enterprise, system, and process levels. It funds the analysis, design and development of the AMC corporate data structure, which ensures data quality and standardization as well as interface management. This includes AMC Command and Control (C2) system interfaces with Global Transportation Network (GTN) and Theater Battle Management Core Systems (TBMCS). Key data integration tools include the data dictionary, data models, business rules, and the Interface Design Document (IDD) manager. It also funds the Command's data quality and metrics program that supports the Tanker and Airlift Control Center (TACC) and Intransit/Visibility (ITV) fusion cell. It funds architecture planning efforts, such as analysis of enterprise requirements, C2 modeling and simulation, and transition of future technologies into AMC C2 systems.
Mission Benefits: Systems Integration provides enterprise‐level plans and architecture to HQ AMC C2 and ITV systems allowing for cost avoidance through integrated and standardized practices. It provides better system interfaces and system design bringing more accurate and timely data to decision makers across HQ AMC Air Force, DoD, and other federal agencies. This allows for better management of resources (air crews, aircraft, airspace, etc.) reducing the total number of assets required to meet the warfighters mission. Deliverables: FY09: Produce Enterprise Architecture (EA) for Mobility Air Force/Global Mobility CONOPS; EA for Consolidated Air Mobility Planning Systems (CAMPS) migration to C2 enclave; produce architecture products to support GATES V4.0; ACFP V.4.4, GDSS V2.3; V8.1 for Lband system; FY10: C2/ITV Strategic Plan, align AMC baseline activities/systems to USTC. Produce architecture and data to support version update of AMC C2, In‐Transit Visibility (ITV), and business systems; FY11: Enterprise Logical Data Model Development EA for Mobility Air Force/Global Mobility CONOPS EA. Produce architecture & data to support version updates of AMC C2, ITV and business systems.
Economic Analysis: Certified March 2007. Updated EA was submitted in Mar 09 and estimated certification November 2009.
Impact: Non‐integrated systems would deliver inaccurate and untimely information on the airlift and air refueling missions, jeopardizing communications for theater. HQ AMC risks not being interoperable with other Major Commands (MAJCOMS) in both the AF & DoD Data Standardization and Migration Programs. There would be no single roadmap for C2 integrating systems such as Global Decision Support System (GDSS), Consolidated Air Mobility Planning System (CAMPS), Advanced Computer Flight Plan (ACFP), and Global Air Transportation Execution System (GATES). Current C2 System deficiencies, such as data corruption & lack of interoperability would remain.
Software: Not applicable.
For Official Use Only Fund 9b, TWCF
156

Fund 9b(Dollars in Thousands)
Activity Group Capital Investment JustificationAir Force Working Capital Fund
Transportation Working Capital Fund
Fiscal Year (FY) 2011Budget Estimates
February 2010
Element of Cost Quantity Unit Cost Total Cost Quantity Unit Cost Total Cost Quantity Unit Cost Total CostA. EquipmentA(1) ReplacementA(2) ProductivityA(3) New MissionA(4) Environmental ComplianceSubtotal $0.0 $0.0 $0.0
B. ADPE/TelecommB(1) Computer Hardware $0.0 $0.0 $0.0 B(2) Computer SoftwareB(3) TelecommunicationsB(3) Other ComputerSubtotal $0.0 $0.0 $0.0
C. Software DevelopmentC(1) Planning/DesignC(2) System Development $1,257.5 $1,342.0 $1,367.0 C(3) DeploymentC(4) Mgt/Tech SupportSubtotal $1,257.5 $1,342.0 $1,367.0
D. Minor ConstructionSubtotal $0.0 $0.0 $0.0
TOTAL $1,257.5 $1,342.0 $1,367.0 Narrative Justification:
Component/Activity/Date Activity IdentificationLine No. & Item DescriptionUSTRANSCOM Command Staff/Transportation/February 2010
FY09 FY10 FY11
Command StaffTransform and Enable IA Capabilities - Information Assurance (IA)
Description: Program to provide information operations capabilities that protect and defend information and information systems by ensuring their availability, integrity, authentication, confidentiality and non‐repudiation. Program is aligned with the Department of Defense (DOD) Information Assurance (IA) Strategic Plan. Ensure that IA is integrated and sustained throughout the lifecycle of all DOD programs. Improve the quality of strategic decision making and net‐centric IA governance. Expedite the development and delivery of dynamic IA capabilities through innovation. Enable efficient information sharing and
Description: Program to provide information operations capabilities that protect and defend information and information systems by ensuring their availability, integrity, authentication, confidentiality and non‐repudiation. Program is aligned with the Department of Defense (DOD) Information Assurance (IA) Strategic Plan. Ensure that IA is integrated and sustained throughout the lifecycle of all DOD programs. Improve the quality of strategic decision making and net‐centric IA governance. Expedite the development and delivery of dynamic IA capabilities through innovation. Enable efficient information sharing and collaboration across traditional boundaries.
Mission Benefits: Discover emerging technologies, experiment, and refine development, delivery, and deployment processes. Deliverables: FY09 ‐ FY12 Provides security engineering support for deployment of new security capabilities; security evaluations of systems/applications; daily security operations; and program development.
Economic Analysis: Life Cycle Cost Estimate (LCCE) received August 2007;recertification of existing EA anticipated November 2009.
Impact: Failure to provide and improve network security architectures increases the vulnerability of United States Transportation Command (USTRANSCOM) and Transportation Component Command networks to electronic attack resulting in the loss of critical command and control functions.
Software: No license fees apply.
For Official Use Only Fund 9b, TWCF
157

Fund 9b(Dollars in Thousands)
Activity Group Capital Investment JustificationAir Force Working Capital Fund
Transportation Working Capital Fund
Fiscal Year (FY) 2011Budget Estimates
February 2010
Air Mobility Command/Transportation/February 2010 HQ AMC, Scott AFB IL
Element of Cost Quantity Unit Cost Total Cost Quantity Unit Cost Total Cost Quantity Unit Cost Total CostA. EquipmentA(1) ReplacementA(2) ProductivityA(3) New MissionA(4) Environmental ComplianceSubtotal $0.0 $0.0 $0.0
B. ADPE/TelecommB(1) Computer Hardware $972.0 $1,236.0 $2,522.0 B(2) Computer SoftwareB(3) TelecommunicationsB(3) Other ComputerSubtotal $972.0 $1,236.0 $2,522.0
C. Software DevelopmentC(1) Planning/DesignC(2) System DevelopmentC(3) DeploymentC(4) Mgt/Tech SupportSubtotal $0.0 $0.0 $0.0
D. Minor ConstructionSubtotal $0.0 $0.0 $0.0
TOTAL $972.0 $1,236.0 $2,522.0 Narrative Justification:
Component/Activity/Date Line No. & Item Description Activity IdentificationWing Local Area Network (Wing LAN)
FY09 FY10 FY11
Description: The Wing Local Area Network (Wing LAN) is Headquarters Air Mobility Command's (HQ AMC) comprehensive plan to implement Local Area Network (LAN) used to access Command and Control (C2) systems including Transportation Working Capital Funds (TWCF) facilities and enroutes. Command‐wide hardware includes; intra‐building infrastructure and cabling, routers, bridges, repeaters, servers, and technical training (no Personal Computers (PCs)). No full operational capability date‐‐on‐going capability and enhancement program.
Description: The Wing Local Area Network (Wing LAN) is Headquarters Air Mobility Command's (HQ AMC) comprehensive plan to implement Local Area Network (LAN) used to access Command and Control (C2) systems including Transportation Working Capital Funds (TWCF) facilities and enroutes. Command‐wide hardware includes; intra‐building infrastructure and cabling, routers, bridges, repeaters, servers, and technical training (no Personal Computers (PCs)). No full operational capability date‐‐on‐going capability and enhancement program.
Mission Benefits: Wing LAN provides access to Command and Control (C2 ) systems, other hosts, and other systems. It builds an enhanced, robust standardized, and reliable command‐wide network capability throughout all HQ AMC bases to support implementation of the Department of Defense (DoD), United States Transportation Command (USTRANSCOM), and Air Force (AF) downward directed systems like Combat Information Transport System (CITS), Defense Message System (DMS), Global Command and Control System (GCCS), Global Decision Support System (GDSS), Command and Control Information Processing System (C2IPS) and Global Transportation Network (GTN). This includes intra‐building networking infrastructure, servers/gateways, file servers, communications servers, initial technical training, installation, and installation support for unclassified, classified and Radio Frequency (RF) LAN connectivity. This program constantly reassesses the needs of the warfighter and obtains the necessary LAN infrastructure required to sustain current capabilities and implement new C2 systems. Wing LAN also constructs the common platform to improve collection, retrieval, creation, sharing, and reporting data electronically. It discourages units from piecing together LANs which result in disparate, non‐standard systems to support the HQ AMC airlift mission. Deliverables: FY09: Premise wiring, install equipment at AMC TWCF bases; FY10: Premise wiring, install equipment at one AMC TWCF base; FY11: Premise wiring, install equipment at AMC TWCF bases. The FY11 is to replace aging LAN infrastructure deferred during FY10.
Economic Analysis: Economic Analysis (EA) certified April 2009.
Impact: The Wing LAN program provides access to many vital information systems and services. Without it, users cannot access electronic mail, worldwide web file sharing, C2IPS, GCSS, DMS, and base level data processing applications.
Software: Not applicable.
For Official Use Only Fund 9b, TWCF
158

Fund 9c(Dollars in Millions)
Capital Budget ExecutionAir Force Working Capital Fund
Transportation Working Capital Fund
Fiscal Year (FY) 2011Budget Estimates
February 2010
FY10 Approved Current Asset/FY Approved Projects PB Amount Reprogs Proj Cost Proj Cost Deficiency Explanation
09 Equipment except ADPE & Telecomm $3.4 $4.6 $8.0 $8.0 $0.009 Material Handling Equipment - SDDC $1.0 $4.0 $5.0 $5.0 $0.0 Purchase 75ft Fire Boat09 Non ADPE Equipment - AMC $2.4 $0.6 $3.0 $3.0 $0.0
09 ADPE & Telecomm $27.6 -$11.0 $16.6 $16.6 $0.009 Automated Trans Data (AUTOSTRAD) 2000 $0.2 $2.1 $2.3 $2.3 $0.0
Reprog $2.4M from AUTOSTRAD to purchase Blue Coat Proxy Servers for EIP and reprog from GSDM; reprog $.3M to USTC LAN
09 Consolidated Air Mobility Planning System (CAMPS) $0.8 $1.2 $2.0 $2.0 $0.0 Reprogrammed from Infostructure09 Corporate Environment (CE) $0.0 $0.1 $0.1 $0.1 $0.0 Inflation Adjustment09 Def Systems & Networks (IA) $0.0 $0.0 $0.0 $0.0 $0.009 Defense Personal Property System (DPS) $0.0 $0.2 $0.2 $0.2 $0.0 Purchase of server storage capability for the Phase III.09 Defense Redswitch Network (DRSN) $0.0 $0.0 $0.0 $0.0 $0.009 Global Air Transportation Execution System (GATES) $3.6 $0.0 $3.6 $3.6 $0.009 Global Surface Distribution Management (GSDM) $2.6 -$2.3 $0.3 $0.3 $0.0 Reprog to AMC-OWCP for En route comm equipment & to ICODES Single
Load Planning Capability (SLPC). Also, reprog to AUTOSTRAD and Infostructure.
09 Global Transportation Network for 21st Century (GTN21) $0.0 $0.0 $0.0 $0.0 $0.0
09 Infostructure $9.3 -$4.7 $4.6 $4.6 $0.0 FY09 Carryover & reprogram to IGC Capital SW for Spiral III development efforts.
09 Int. Data Env/Global Trans Netwk Converg (IGC) $2.2 -$1.5 $0.7 $0.7 $0.0 Reprogram to IGC Capital SW for Spiral III development efforts.09 Int Command, Control, & Comm (IC3) $1.6 -$0.6 $1.0 $1.0 $0.0 Decrease due to higher command priorities09 Joint Mobility Control Group (JMCG) $0.2 -$0.1 $0.1 $0.1 $0.0 Inflation Adustment09 Local Area Network (USTRANSCOM LAN) $3.7 -$3.0 $0.7 $0.7 $0.0 FY09 carryover09 Objective Wing Command Post (OWCP) $0.3 -$0.3 $0.0 $0.0 $0.0 Upgrades not obligated due to FY09 carryover authority request09 Theater Deployable Communication (TDC) $0.4 -$0.4 $0.0 $0.0 $0.0 Reprogrammed to DRSN and OWCP09 Wing Local Area Network (LAN) $2.7 -$1.7 $1.0 $1.0 $0.0 Funds of $0.6M due to FY09 carryover authority; remaining funds not
obligated
Component: United States Transportation Command (USTC)
obligated.
09 Software Development $129.4 -$16.8 $112.6 $112.6 $0.009 Advanced Computer Flight Plan (ACFP) $2.6 $0.0 $2.6 $2.6 $0.009 Agile Trans for the 21st Century (AT21) $8.3 -$7.7 $0.6 $0.6 $0.0 Reprogram for functional support.09 Analysis of Mobility Platform (AMP) $2.0 -$0.5 $1.5 $1.5 $0.0 FY09 carryover09 Automated Transportation Data (AUTOSTRAD) $1.8 -$1.3 $0.5 $0.5 $0.0 Reprog to AUTOSTRAD to purchase Blue Coat Proxy Servers for EIP09 Cargo and Billing (CAB) $0.0 $0.0 $0.0 $0.0 $0.009 Consolidated Air Mobility Planning System (CAMPS) $1.6 $0.9 $2.5 $2.5 $0.0 Reprogrammed from Infostructure09 Core Automated Maintenance System (CAMS) $3.0 -$1.3 $1.7 $1.7 $0.0 Reprogrammed funds to support OWCP requirements09 Corporate Data Solution (CDS) $1.8 -$0.1 $1.7 $1.7 $0.0 Inflation Adustment09 Corporate Environment (CE) $4.8 -$0.3 $4.5 $4.5 $0.0 Reprogram to USTC LAN09 Customs Process Automation (CPA) $4.5 -$2.4 $2.1 $2.1 $0.0 Reprogram to AMC OWCP for end of life command post comm09 Defend Systems & Networks (IA) $0.5 $0.0 $0.5 $0.5 $0.009 Defense Enterprise Acct & Mgmt System (DEAMS) $10.1 -$1.2 $8.9 $8.9 $0.0 FY09 carryover09 Defense Personal Property System (DPS) $3.7 -$0.5 $3.2 $3.2 $0.0 Reprogram to DPS Capital HW for Phase III capability.09 Financial Management System (FMS) $0.4 $0.1 $0.5 $0.5 $0.0 Inflation Adjustment09 Global Air Transportation Execution System (GATES) $11.3 $0.0 $11.3 $11.3 $0.009 Global Decision Support System (GDSS) $18.5 $0.0 $18.5 $18.5 $0.009 Global Freight Management (GFM) $0.4 $0.0 $0.4 $0.4 $0.009 Global Trans Net for the 21st Century (GTN21) $0.0 $0.0 $0.0 $0.0 $0.0
For Official Use Only Fund 9c, TWCF
159

Fund 9c(Dollars in Millions)
Capital Budget ExecutionAir Force Working Capital Fund
Transportation Working Capital Fund
Fiscal Year (FY) 2011Budget Estimates
February 2010
FY10 Approved Current Asset/FY Approved Projects PB Amount Reprogs Proj Cost Proj Cost Deficiency Explanation
Component: United States Transportation Command (USTC)
09 Infostructure $8.1 -$8.1 $0.0 $0.0 $0.0 Reprogram $3.3M to CAMPS(HW)/Non-IT Ops & remaining funds were FY09 carryover.
09 Integrated Booking System (IBS) $2.8 -$0.1 $2.7 $2.7 $0.0 Reprog to IRRIS software to enhance visualization and tracking of courier shipments
09 Int Command, Control & Comm (IC3) $1.6 -$0.6 $1.0 $1.0 $0.0 Reprogram to USTC LAN09 Integrated Computerized Deploy Sys (ICODES) $1.1 -$0.1 $1.0 $1.0 $0.0 Inflation adjustment09 Int Data Environ/Global Trans Net Converg (IGC) $20.0 $2.2 $22.2 $22.2 $0.0 Reprogram to IGC Capital SW for Spiral III development efforts.09 Intelligent Road/Rail Information Server (IRRIS) $1.6 $0.0 $1.6 $1.6 $0.009 Joint Flow & Analysis Sys for Trans (JFAST) $2.6 -$0.3 $2.3 $2.3 $0.0 Reprogram to IGC Capital SW for Spiral III development efforts.09 Joint Mobility Control Group (JMCG) $1.3 -$0.5 $0.8 $0.8 $0.0 FY09 carryover09 Local Area Network (USTRANSCOM LAN) $1.3 $5.1 $6.4 $6.4 $0.0 Increase for campus requirements and FY09 carryover09 Logbook $0.6 $0.0 $0.6 $0.6 $0.009 Protect Information (PKI) (IA) $0.0 $0.0 $0.0 $0.0 $0.009 Single Mobility System (SMS) $1.7 -$0.1 $1.6 $1.6 $0.0 Inflation Adustment09 Situational Awareness/IA C2 (IA) $0.2 $0.0 $0.2 $0.2 $0.009 System Integration $9.9 $0.0 $9.9 $9.9 $0.009 Transform and Enable IA Capabilities (IA) $1.3 $0.0 $1.3 $1.3 $0.0
09 Minor Construction $11.5 -$1.1 $10.4 $10.4 $0.009 Minor Contruction - AMC $9.0 -$0.6 $8.4 $8.4 $0.0 Funds reprogrammed to Non-ADPE equipment for Mobile Tail Enclosure09 Minor Construction - DCD $0.5 -$0.5 $0.0 $0.0 $0.0 Travis-project not labeled 'minor construction' by base CE; Operating funds
used for project.09 Minor Construction - SDDC $2.0 $0.0 $2.0 $2.0 $0.0 009 Minor Construction - USTC Command Staff $0.0 $0.0 $0.0 $0.0 $0.0
09 Total FY $171.9 -$24.3 $147.6 $147.6 $0.0
For Official Use Only Fund 9c, TWCF
160