air emissions from shipping in the asean region · 2018-09-10 · need for better understanding of...
TRANSCRIPT

Air emissions from shipping in the ASEAN region Norwegian Maritime Authority
Report No.: 2018-0260, Rev. 1 Document No.: 1183LM7J-4 Date: 2018-04-27

DNV GL – Report No. 2018-0260, Rev. 1 – www.dnvgl.com Page i
DNV GL AS Maritime Environment Advisory Veritasveien 1 1363 Høvik Norway Tel:
Report title: ASEAN ship emission inventory Customer: Norwegian Maritime Authority, Post box 2222
5509 HAUGESUND Norway
Customer contact: Date of issue: 2018-04-27 Project No.: 10078022 Organisation unit: Environment Advisory Report No.: 2018-0260, Rev. 1 Document No.: 1183LM7J-4 Applicable contract(s) governing the provision of this Report: Objective:
- Prepare a detailed overview of maritime traffic and the associated emissions for the ASEAN region today (baseline)
- Use the baseline estimates for further analysis of abatement measures to reduce the emission footprints, and
- Discuss policy instruments relevant for reducing emissions in the ASEAN region Prepared by: Verified by: Approved by:
Alvar Mjelde Principal Consultant
Magnus S. Eide Principal Consultant
Terje Sverud Head of Section
Øyvind Endresen Principal Consultant
[Name] [title]
[Name] [title]
[Name] [title]
Copyright © DNV GL 2018. All rights reserved. Unless otherwise agreed in writing: (i) This publication or parts thereof may not be copied, reproduced or transmitted in any form, or by any means, whether digitally or otherwise; (ii) The content of this publication shall be kept confidential by the customer; (iii) No third party may rely on its contents; and (iv) DNV GL undertakes no duty of care toward any third party. Reference to part of this publication which may lead to misinterpretation is prohibited. DNV GL and the Horizon Graphic are trademarks of DNV GL AS.
DNV GL Distribution: Keywords: ☒ Unrestricted distribution (internal and external) ASEAN
Air emissions Fuel consumption Emission abatement technologies
☐ Unrestricted distribution within DNV GL Group
☐ Unrestricted distribution within DNV GL contracting party ☐ No distribution (confidential)
Rev. No. Date Reason for Issue Prepared by Verified by Approved by
0 20.04.2018 Final report AMJ EIDE TSV
1 27.04.2018 Open report AMJ EIDE TSV

DNV GL – Report No. 2018-0260, Rev. 1 – www.dnvgl.com Page ii
Table of contents
1 EXECUTIVE SUMMARY ................................................................................................... 1
2 INTRODUCTION ............................................................................................................ 7
3 ASEAN FUEL CONSUMPTION AND AIR EMISSION INVENTORY ............................................. 9 3.1 Geographical area covered 9 3.2 Inventory of ship fuel consumption 10 3.3 Inventory of ship emissions 13
4 LOW- AND ZERO EMISSION TECHNOLOGIES FOR SHIPS .................................................. 15 4.1 Alternative fuels 15 4.2 Technical and operational measures 17 4.3 Exhaust gas treatment 18 4.4 Barriers to overcome 20
5 DEEP SEA CASE - SPEED LIMIT IN ASEAN REGION .......................................................... 21 5.1 AIS-modelling of speed reduction 21 5.2 Modelling results 22
6 SHORT SEA CASE - ELECTRIFICATION OF PASSENGER SHIPS IN THE ASEAN REGION .......... 24 6.1 AIS-based screening of potential for electrification 24 6.2 Modelling results 25
7 POLICY MEASURES REDUCING SHIP EMISSIONS ............................................................. 27 7.1 Regulatory measures 28 7.2 Economic measures 29 7.3 Other measures 30
8 REFERENCES.............................................................................................................. 31 Appendix A - METHODOLOGY, AIS BASED MODELLING OF SHIP EMISSIONS

DNV GL – Report No. 2018-0260, Rev. 1 – www.dnvgl.com Page 1
1 EXECUTIVE SUMMARY Southeast Asia is one of the most densely trafficked shipping areas in the world, with some of the major international sea routes for large cargo ships. Domestic and regional traffic has also increased, following the economic growth of the countries in the ASEAN (Association of Southeast Asian Nations). There is a need for better understanding of both emissions and impacts resulting from shipping activity in the ASEAN region. Geographically gridded inventories of emissions to air from shipping are fundamental as input to evaluate impacts on the environment, human health and climate, and to effectively assess what options are available to mitigate the impacts.
This report has been prepared for the Asia Europe Meeting (ASEM)-Conference “Green Shipping. Blue Business” in Singapore 26-27 April 2018.
What we did
This paper models shipping air emissions in the ASEAN region, and assess what options are available to mitigate the impacts. The objectives are three-fold;
Prepare a detailed overview of maritime traffic and the associated emissions for the ASEAN region today (baseline), using AIS ship movement data
Use the baseline estimates as basis for analysis of abatement measures to reduce the emission footprints, and
Discuss policy instruments relevant for reducing emissions in the ASEAN region.
This three-phased approach is inspired by the document “Charting a course for green coastal shipping” published by the Green Coastal Shipping Program (2016) in Norway – a collaborative project between government authorities and the private sector with the objective of driving a green transformation of the Norwegian maritime sector.
What we found
Baseline for maritime traffic, fuel consumption and the associated emissions to air
The AIS-based modelling shows that a total of 29 630 oceangoing ships had operations in, or transits through, the ASEAN region, consuming about 35.1 Mton1 of oil equivalents in 2017. The numbers are based on analysis of ships having AIS-transponders, covering domestic, international and transit sailings in the area. The key findings from fuel consumption modelling are:
Bulk carriers, container vessels and oil tankers together accounts for more than 73% of the total fuel consumption in the region.
Larger ships, above 10 000 gross tonnage, accounts for more than 85% of the total fuel consumption in the region.
Depending on ship type, the time spent at berth/stationary/anchorage for cargo ships range from 40% to 60% of the vessels’ total operating time in the area.
Fuel is consumed in cruising mode (82%), manoeuvring mode (1%) and berth/stationary/anchorage mode (17%).
1 1 Mton = 1 000 000 tonnes

DNV GL – Report No. 2018-0260, Rev. 1 – www.dnvgl.com Page 2
Ship emissions in the ASEAN region are calculated by multiplying the AIS-based fuel consumption by emission factors. The AIS based tracking also allow for calculating sailed distance for individual ships and aggregated.
Table 1-1 present an overview of emissions by ship types for the ASEAN region. Key findings from the AIS -based emission modelling are:
CO2 emissions are 112 million tonnes, representing about 14% of the global ship emissions.
Emissions of NOx and SOx are 2 320 and 1 730 Kton2, respectively.
Emissions of PM10 and PM2.5 are 214 and 194 Kton, respectively.
Table 1-1 ASEAN ship emissions for 2017 Ship type CO2
[Kton] NOx
[Kton] SOx
[Kton] PM10 [Kton]
PM2.5 [Kton]
Oil tankers 19 490 340 308 37.0 33.4 Chemical/prod. Tankers 6 510 120 105 12.6 11.4 Gas carriers 9 360 200 151 18.1 16.4 Bulk carriers 33 750 790 545 65.4 59.1 General cargo vessels 4 420 80 71 8.6 7.8 Container vessels 29 030 630 469 56.4 50.9 Ro-Ro vessels 2 150 50 34 4.1 3.7 Reefers 510 10 8 1.0 0.9 Passenger vessels 2 800 50 36 4.4 4.0 Offshore vessels 2 160 30 1 4.1 3.7 Other vessels incl. Fishing 1 750 20 1 2.9 2.7 Total 111 930 2 320 1 729 214.6 194.0
Figure 1-1 shows the geographical distribution of modelled ship fuel consumption for the entire ASEAN region. The fuel consumption and associated emissions to air varies within the region, with hot-spots along the main international sea lanes, largest ports and busiest straits and channels (i.e. red color).
2 1 Kton = 1 000 tonnes

DNV GL – Report No. 2018-0260, Rev. 1 – www.dnvgl.com Page 3
Figure 1-1: Shipping traffic 2017 tracked by fuel use (Source: DNV GL).
Analysis of abatement measures to reduce air emissions
A high-level review highlights the current global uptake of low and zero emission technologies worldwide. LNG powered vessels have already been introduced (currently 121 ships in operation and 127 confirmed newbuilds), biofuels and methanol are available in certain ports, and full electrical/hybrid ships are emerging in the short sea segment for offshore and passenger ships/ferries. Shore-side electricity is also emerging in certain ports, is the provision of electrical power to ships while at berth. An important development is the electrification of the Norwegian domestic ferry sector, with phasing in of about 60 battery electric ferries over the next few years.
The study points to promising operational and technical measures, alternative fuels, and exhaust gas treatment systems. Zero emissions alternatives are full-electric ships (currently applied in the ferry segment) and hydrogen fuel cell powered ships (first commercial application planned in 2021). Compared to the short sea segment, deep sea vessels have fewer options for zero emission solutions. Low emission solutions can be achieved by applying a wide number of solutions, such as alternative fuels and energy carriers (e.g. LNG, biofuels, methanol, hybridization with batteries, etc.), technical and operational measures (e.g. speed reduction, air lubrication, improved hull and propulsion technology, etc.), and exhaust gas after treatment (e.g. scrubber, SCR, filters, etc.).
Two example cases for application of reduction of air emission in the ASEAN region are presented; slow steaming for large container ships and electric operation of small passenger ships.

DNV GL – Report No. 2018-0260, Rev. 1 – www.dnvgl.com Page 4
Deep sea case - slow steaming for large container ships: The 460 largest container vessels (above 100 000 GT) consumed approximately 2.1 Mton of fuel, representing 6% of the totals for the ASEAN region. This case assesses the effect of enforcing a speed limit for these ships. AIS-based analyses have been used to identify current sailing speeds and operating patterns for this fleet, and to calculate fuel consumption and associated emissions. The method is based on unchanged total sailing distance, but where fuel consumption (per nautical mile) at sailing speeds above the speed limit is adjusted down to consumption (per nautical mile) at the set speed limit. The modelling results for the introduced speed limits, shows:
6% reduction in reduction in air emissions, when applying a speed limit of 18 knots.
23% reduction in reduction in air emissions, when applying a speed limit of 15 knots.
The overall emission reductions achieved by introducing local speed restrictions may be cancelled or even negative if sailing time lost in the regulated areas are made up for by increased speed in other areas. However, the ASEAN region having high density traffic areas close to shore and in populated areas, would experience significant reduction effects on important local pollutants like NOx, SOx and PM if speed is reduced.
This case indicates that speed reduction could be an effective measure for emission reductions in the ASEAN region. Furthermore, it demonstrates a methodology which could be extended to other ship segments to assess the full potential for emission reduction through speed reduction in the ASEAN region.
Short sea case - electric operation of small passenger ships: A high level feasibility study was carried out for all passenger ships smaller than 1000 GT with registered port calls in the ASEAN region during a month of operation. The distance and fuel consumption between port calls was calculated for each voyage. A battery with an energy capacity of 1000 kWh can simplified be estimated to cover a distance up to 25 km (depending on the energy need of the ship). This covers the majority of the voyages in this segment.
For longer voyages, hybridisation with a high degree of charged electrical power from land may provide an option for very high emission reductions, with significantly reduced cost compared to full-electrification. To illustrate this a specific distance operated by smaller passenger ships (< 1000 GT) in the Philippines was investigated.
The high-level analysis indicates that electrification of smaller passenger ships is technically feasible – in particular in case of hybridisation with high degree of electrification is considered. Passenger vessels below 1000 GT account for 0.65 % of total ASEAN fuel consumption and emissions. This corresponds to 728 kton CO2, 15 kton NOx and 11 kton SOx, which could be eliminated by full electrification.
It should be noted that the time spent in port is crucial for design of the energy transfer system, shore to ship, while battery banks onshore can lower the power requirement from the shore power grid. The overall emission reduction potentials, by using electric driven ships, are closely linked to the energy sources used by the onshore power grid.
The methodology demonstrated in this case could be further detailed to include economic factors and shore-side infrastructure. The analysis could also be extended to other ship segments to assess the full potential for emission reduction through electrification/hybridisation in the ASEAN region.

DNV GL – Report No. 2018-0260, Rev. 1 – www.dnvgl.com Page 5
Policy instruments relevant for reducing emissions
This study outlines options available to policymakers and industry to further provide incentives for emission reductions from ships operating in the region. The options include measures from three categories:
Regulatory measures (rules and regulations); Measures in this category directly impose demands on behavior or technology. Examples of legal instruments may be requirements in the form of laws, regulations or standards;
o Among the latest international developments is that, MEPC 72 adopted the “Initial IMO Strategy on reduction of GHG emissions from ships”, (resolution MEPC.304(72)). This is IMO’s vision to phase out GHG emission as soon as possible within the end of this century. The aim is also to reduce total emissions from shipping by 50% in 2050 compared to 2008. A carriage ban on non-compliant fuel was approved, and is expected to enter into force in March 2020.
Economic measures (taxes, subsidies, quotas, etc.); Economic instruments are based on incentives to change environmentally harmful behavior by making environmentally harmful activity more expensive or environmentally friendly activity cheaper. This is done by taxing unwanted behavior in the form of fees, or by subsidizing desired behavior or making allowances in a quota market. Incentive schemes such as the Norwegian NOx-fund arrangement can also be considered, were paid tax is distributed back to the industry as direct investment support for emission reducing technologies.
Other measures, including research and development; Measures that do not involve economic or legal measures embrace a wide range of opportunities, from research and development, to targeted procurement policies (favouring low emission solutions) at government agencies.
Note that the options listed are not intended to be exhaustive. Rather, the intention is to point to relevant examples which could serve as inspiration and guidance for future work.
What we recommend
This study has shown an AIS-based emission modelling approach, which geographically allocates the emissions. Results from the modelling in the ASEAN region may be presented on different time scales (e.g. hourly, daily, monthly, yearly), for different ship types and size categories, and operating modes. These data can be integrated with Geographic Information System (GIS) software to ease analysis, and take advantage of the geospatial processing functionality. A reliable and up-to-date ship emission inventory is essential for getting overview of the trends and challenges, and for assessing the effect of different emission control options. It is therefore recommended to establish an environmental accounting model for continuous monitoring of ship traffic, air emissions and impacts in the region. The model could provide stakeholders with updated status for the most important air emission components, both local pollutants and GHG emissions.
Furthermore, it is recommended that the AIS-based emission inventory is further detailed to categorize emissions as domestic, international or transit. This could help guide ASEAN members in making targeted policy choices to fulfill national obligations relating to domestic emissions.
This study has also provided a high-level overview of the emission reduction technologies and fuels available. It is recommended that a detailed study is undertaken to simulate the possible uptake of these

DNV GL – Report No. 2018-0260, Rev. 1 – www.dnvgl.com Page 6
emission reduction options in ASEAN waters, in order to quantify the emission reduction potentials and associated costs.
Finally, this study has provided an overview of policy options available for stakeholders to stimulate phasing in of new and alternative emission reducing technologies and fuels. It is recommended to initiate studies that identify barriers in way of achieving the policy targets, in order to tailor a package of policy measures which could lead to sustainable emission levels in specific areas or for the region.

DNV GL – Report No. 2018-0260, Rev. 1 – www.dnvgl.com Page 7
2 INTRODUCTION Southeast Asia is one of the most densely trafficked shipping areas in the world, with some of the major international sea routes for large cargo ships (e.g. Tournadre, 2014; Johansson et al, 2017; DNV GL, 2017). Asia is the main importing and exporting region in the world, accounting for 61% of unloaded cargo volume and 40% of loaded cargo volume in 2016, and has experienced heavy growth (UNCTAD, 2016). In 2016, 60% of the 250 Mtoe3 fuel consumed by global shipping was consumed in Indian and Pacific waters (DNV GL, 2017). As illustrated in Figure 2-1, the Straits of Malacca is the major passageway between the Pacific and Indian Oceans for the large cargo ships. The number of transits has increased by 50% between 2000 and 2016, and is dominated by container ships followed by oil tankers and bulk ships.4
Recent estimates indicate that 21% of global trade passed through the South China Sea in 2016, with China heavily influencing as over 64% of China’s maritime trade transited the waterway.5 According to OECD (2018a), Southeast Asia had an average economic growth of 5.1% between 2011 and 2015. National and regional traffic has also increased, followed the economic growth of the ten countries in ASEAN (Association of Southeast Asian Nations). The region’s seaborne exports to non-ASEAN countries accounts for 74%.6
There is a need for better understanding of both emissions and impacts resulting from the shipping activities in the ASEAN region. Geographically resolved ship emissions inventories are a fundamental input to evaluate impacts on the environment, human health and climate – and to effectively assess what options are available to mitigate these impacts (e.g. Endresen et al, 2003; Corbett et al, 2008; OECD, 2010; Liu et al, 2016; Li et al, 2017). The AIS (Automatic Identification System) ship movement data opens for expedient and accurate emission accounting.
This paper describes a framework for accounting of shipping emission in the ASEAN region, building on recent DNV GL work, with AIS ship tracking data from satellites as the cornerstone. Regional and global ship emission inventories has been developed, based on fleet and AIS ship tracking data, regionally (e.g. Endresen et al, 2007; Mjelde al, 2014; Pitana et al, 2010; Jalkanen et al, 2009; Winther et al, 2014, 2017; DNV GL 2015b, 2016c; Liu et al, 2016; Li et al, 2017) and globally (e.g. Buhaug et al, 2009; Smith et al, 2014; Johansson et al, 2017; ICCT 2017a,b; DNV GL, 2017; Li et al, 2017). The objective in this project is three-fold:
Prepare a detailed overview of maritime traffic and the associated air emissions for the ASEAN region (baseline).
Use the baseline estimates for fuel consumption and air emissions as basis for analysis of abatement measures to reduce the future emission footprints.
Discuss policy instruments relevant for reducing air emissions in the ASEAN region.
This three-phased approach is inspired by the document “Charting a course for green coastal shipping” published by the Green Coastal Shipping Program (2016) in Norway, which is a collaborative project between the government, authorities and the private sector with the objective of driving a green transformation of the Norwegian maritime sector.7
In this study, AIS-based modelling is carried out for 2017, and the emission components covered are CO2, NOx, SOx and particulate matters (PM10 and PM2.5). The emission inventory is aggregated for 11 ship types and 7 ship size segments. The results are geographically distributed and presented on maps for selected ships types. A high-level discussion of possible low and zero emission technologies is given in Section 4. 3 Million tonnes of oil equivalent 4 http://www.seatrade-maritime.com/news/asia/malacca-and-s-pore-strait-traffic-hits-new-high-in-2016-vlccs-fastest-growing-segment.html 5 https://chinapower.csis.org/much-trade-transits-south-china-sea/ 6 http://asean.org/storage/2016/11/Table18_as-of-6-dec-2016.pdf 7 https://www.dnvgl.com/news/developing-a-roadmap-for-green-coastal-shipping-75090

DNV GL – Report No. 2018-0260, Rev. 1 – www.dnvgl.com Page 8
Ways to reduced emissions for the ASEAN region is demonstrated in two case studies; slow steaming for deep sea segment and electrification for short sea shipping, section 6 and 7. The report also presents a high-level discussion of policy measures for reduction of ship emissions in the ASEAN region.
Figure 2-1 Worldwide ship traffic for 2017. The distribution is presented on a global grid of 0.1 by 0.1 degree latitude and longitude (Source: DNV GL, 2017).

DNV GL – Report No. 2018-0260, Rev. 1 – www.dnvgl.com Page 9
3 ASEAN FUEL CONSUMPTION AND AIR EMISSION INVENTORY ASEAN was established in August 1967 with the purpose of accelerating the economic growth, social progress, and cultural development in the region, and promoting regional peace and stability. 8 ASEAN was established by the five original member countries: Indonesia, Malaysia, Philippines, Singapore, and Thailand. In addition, five countries have joined in; Brunei, Vietnam, Laos, Myanmar and Cambodia.
This section presents the estimated ship fuel consumption and emissions for the ASEAN region for the base year 2017. The analyses utilize DNV GLs AIS-based software tool for quantification of maritime emissions, as descried in Appendix A. It should be noted that this work does not separate between domestic and international traffic, nor traffic only passing through the ASEAN area (transit).
3.1 Geographical area covered The inventory results are dependent on boundary limits set in the analysis. Figure 3-1 shows the geographical area covered by the fuel and emission modelling, i.e. between latitude 14 degree south and 22.5 degree north, and between longitude 90 degree east and 141.5 degree east. This area embrace all member countries in the ASEAN region and some open sea areas outside or between the respective country economic zones. The figure shows the geographical distribution of modelled ship fuel consumption for the entire ASEAN region (described in the next section).
Figure 3-1 The geographical area covered by this analysis, including all vessels traffic 2017 by location and fuel use (Source: DNV GL).
8 Association of Southeast Asian Nations (ASEAN): http://www.nti.org/learn/treaties-and-regimes/association-southeast-asian-nations-asean/

DNV GL – Report No. 2018-0260, Rev. 1 – www.dnvgl.com Page 10
3.2 Inventory of ship fuel consumption The AIS-based modelling indicates that a total of 29 630 oceangoing ships travelled in the ASEAN area, consuming about 35.1 million tonnes of oil equivalents (Mtoe) in 2017. Table 3-1 shows the distribution of activity on different ship types. The numbers are based on analysis of ships having AIS-transponders, covering domestic, international and transit sailings in the area.
Table 3-1 ASEAN number of vessels, sailed distances and fuel consumption in 2017 Ship type # vessels
Sailed distance
[KNM] Fuel consumption
[Kton] Oil tankers 3750 36 410 6 110 Chemical / prod. tankers 2270 25 800 2 040 Gas carriers 1130 18 920 2 930 Bulk carriers 8730 95 720 10 560 General cargo vessels 3460 28 950 1 390 Container vessels 3290 62 690 9 090 Ro Ro vessels 920 9 180 670 Reefers 300 2 580 160 Passenger vessels 920 15 450 880 Offshore vessels 1580 5 430 690 Other vessels inkl. Fishing 3280 10 280 580 Total 29 630 311 410 35 100
The AIS-based modelling offers great potential for performing in-depth studies on specific ship segments. Table 3-2 presents an overview of share of fuel consumed by 11 ship types and 7 size segments. Bulk carriers, container vessels and oil tankers together accounts for more than 73% of the total fuel oil consumption. The larger ships, above 10 000 gross tonnage accounts for more than 85% of the total fuel consumption. The fuel consumption in the ASEAN region amounts to approximately 14% of the global maritime fuel consumption. More than half of the worlds cargo carrying ships greater than 100 GT visited the ASEAN region in 2017, by number.
Table 3-2 ASEAN share of fuel consumption by ship type and size category in 2017 Ship type <1000
GT * 1000 -
4999 GT 5000 –
9999 GT 10000- 24999
GT
25000- 49999
GT
50000-99999
GT
≥100000 GT
Totals
Oil tankers 0.53 % 2.35 % 0.84 % 0.94 % 2.03 % 4.17 % 6.55 % 17.4 %Chemical / prod. tankers 0.03 % 0.38 % 1.71 % 1.73 % 1.96 % 0.01 % 0.00 % 5.8 %Gas carriers 0.04 % 0.44 % 0.20 % 0.40 % 1.25 % 1.65 % 4.37 % 8.3 %Bulk carriers 0.01 % 0.09 % 0.22 % 2.49 % 11.62 % 10.15 % 5.50 % 30.1 %General cargo vessels 0.03 % 0.65 % 1.68 % 1.15 % 0.43 % 0.02 % 0.00 % 4.0 %Container vessels 0.00 % 0.13 % 1.35 % 5.22 % 6.04 % 7.08 % 6.08 % 25.9 %Ro Ro vessels 0.03 % 0.07 % 0.11 % 0.09 % 0.55 % 1.06 % 0.00 % 1.9 %Reefers 0.00 % 0.11 % 0.26 % 0.08 % 0.00 % 0.00 % 0.00 % 0.5 %Passenger vessels 0.65 % 0.21 % 0.26 % 0.73 % 0.14 % 0.28 % 0.24 % 2.5 %Offshore vessels 0.13 % 1.10 % 0.25 % 0.08 % 0.10 % 0.13 % 0.18 % 2.0 %Other vessels inkl. fishing 0.39 % 0.29 % 0.30 % 0.41 % 0.19 % 0.04 % 0.02 % 1.6 %Total 1.8 % 5.8 % 7.2 % 13.3 % 24.3 % 24.6 % 22.9 % 100%
AIS-based modelling has also been made to calculated fuel consumption by main operating modes. The time spent by each ship in the ASEAN region and associated fuel consumption are split in three operation modes; berth/stationary/anchorage, manoeuvring and cruising. The split is based on the AIS calculated speed over ground for each vessel and summarised for all vessels at berth/stationary/anchorage (0 knot), manoeuvring (1-5 knots) and cruising mode (above 5 knots).

DNV GL – Report No. 2018-0260, Rev. 1 – www.dnvgl.com Page 11
Figure 3-2 shows how the time spent in each mode varies for each major ship type. The share of time spent in port/at anchor etc. for cargo ships in the ASEAN region range between 40% to 60% depending on ship type. The corresponding numbers for non-cargo ships and passenger ships range between 60% and 80%. This reflects large variations in trading patterns, services, turnaround time and operational efficiency. Bulk and container ships are the ones having typically the lowest share of time (typically 40%) spent at berth/stationary/anchor and 4-7% in manoeuvring. Oil tankers have the highest time spent in port/at anchor etc. It should be noted that the Singapore area is a major international hub for ships, hence the share of time spent at berth/stationary/anchor can typically be expected to be high.
Figure 3-2 Share of time in each operation mode for major sip types (Source: DNV GL).
The time in the different operation modes is not proportional to fuel consumption. Figure 3-3 shows how the fuel usage by operation mode varies for each major ship type. The cruising mode dominates for the cargo ships, as between 65% to 95% of total fuel is used in this mode. The corresponding numbers for non-cargo ships is significantly lower, reflecting time a low speed operations. The share of fuel consumption in the three operation modes (berth/stationary/anchorage, manoeuvring and cruising) are overall approximately 17%, 1% and 82% respectively (see total, Figure 3-3).
0 %
10 %
20 %
30 %
40 %
50 %
60 %
70 %
80 %
90 %
100 %
Total Oiltankers
Chemical/ prod.tankers
Gascarriers
Bulkcarriers
Generalcargovessels
Containervessels
Ro Rovessels
Reefers Passengervessels
Offshorevessels
Othervesselsinkl.
fishing
Percentage of time per operation m
ode
Berth/Stationary/Anchorage Maneuvering Cruising

DNV GL – Report No. 2018-0260, Rev. 1 – www.dnvgl.com Page 12
Figure 3-3 Share of fuel used by operation mode for major ship types. The distribution is based on fuel used for each ship type, as reported in Table 4-1 (Source: DNV GL).
The share fuel used in the different operation modes depends strongly on ship size. Figure 3-4 shows the gradually decrease in berth/stationary/anchoring consumption moving from smallest size categories to the largest vessels typically operating in long haul trades. The smallest size categories have around half of the fuel consumption in berth/stationary/anchoring mode, while the largest only around 5%. The three smallest size categories account for 15% of the overall emissions, but operates often close to shore and major shipping ports, surrounded by large populations. Reducing emission from the small ship segments could therefor give important contributions on improving local air quality.
Figure 3-4 Share of fuel used by operation mode for different ship size segments. The distribution is based on fuel used for each size category, as reported in Table 4-1 (Source: DNV GL).
0 %
10 %
20 %
30 %
40 %
50 %
60 %
70 %
80 %
90 %
100 %
Total Oiltankers
Chemical/ prod.tankers
Gascarriers
Bulkcarriers
Generalcargovessels
Containervessels
Ro Rovessels
Reefers Passengervessels
Offshorevessels
Othervesselsinkl.
fishing
Percentage of fuel used per operation m
ode
Berth/Stationary/Anchorage Maneuvering Cruising
0 %
10 %
20 %
30 %
40 %
50 %
60 %
70 %
80 %
90 %
100 %
Total 1. < 1000 GT 2. 1000 ‐4999 GT
3. 5000 ‐9999 GT
4. 10000 ‐24999 GT
5. 25000 ‐49999 GT
6. 50000 ‐99999 GT
7. >= 100000GT
Share of fuel per operation m
ode
Berth/Stationary/Anchorage Maneuvering Cruising
DNV GL – Report No. 2018-0260, Rev. 1 – www.dnvgl.com Page 13
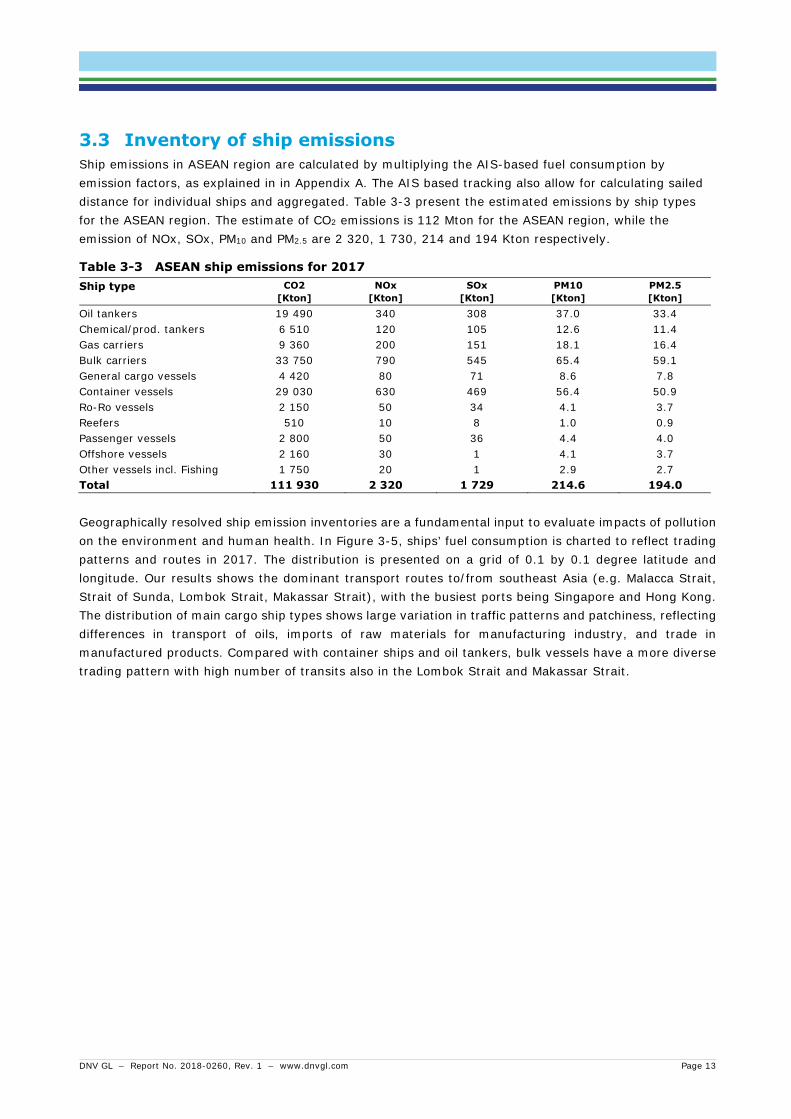
3.3 Inventory of ship emissions Ship emissions in ASEAN region are calculated by multiplying the AIS-based fuel consumption by emission factors, as explained in in Appendix A. The AIS based tracking also allow for calculating sailed distance for individual ships and aggregated. Table 3-3 present the estimated emissions by ship types for the ASEAN region. The estimate of CO2 emissions is 112 Mton for the ASEAN region, while the emission of NOx, SOx, PM10 and PM2.5 are 2 320, 1 730, 214 and 194 Kton respectively.
Table 3-3 ASEAN ship emissions for 2017 Ship type CO2
[Kton] NOx
[Kton] SOx
[Kton] PM10 [Kton]
PM2.5 [Kton]
Oil tankers 19 490 340 308 37.0 33.4 Chemical/prod. tankers 6 510 120 105 12.6 11.4 Gas carriers 9 360 200 151 18.1 16.4 Bulk carriers 33 750 790 545 65.4 59.1 General cargo vessels 4 420 80 71 8.6 7.8 Container vessels 29 030 630 469 56.4 50.9 Ro-Ro vessels 2 150 50 34 4.1 3.7 Reefers 510 10 8 1.0 0.9 Passenger vessels 2 800 50 36 4.4 4.0 Offshore vessels 2 160 30 1 4.1 3.7 Other vessels incl. Fishing 1 750 20 1 2.9 2.7 Total 111 930 2 320 1 729 214.6 194.0
Geographically resolved ship emission inventories are a fundamental input to evaluate impacts of pollution on the environment and human health. In Figure 3-5, ships’ fuel consumption is charted to reflect trading patterns and routes in 2017. The distribution is presented on a grid of 0.1 by 0.1 degree latitude and longitude. Our results shows the dominant transport routes to/from southeast Asia (e.g. Malacca Strait, Strait of Sunda, Lombok Strait, Makassar Strait), with the busiest ports being Singapore and Hong Kong. The distribution of main cargo ship types shows large variation in traffic patterns and patchiness, reflecting differences in transport of oils, imports of raw materials for manufacturing industry, and trade in manufactured products. Compared with container ships and oil tankers, bulk vessels have a more diverse trading pattern with high number of transits also in the Lombok Strait and Makassar Strait.

DNV GL – Report No. 2018-0260, Rev. 1 – www.dnvgl.com Page 14
All ships Oil tankers
Bulk ships Container vessels
Figure 3-5 Shipping traffic 2017 by location and fuel use. Upper left All vessels, upper right Oil tankers, lower left Bulk ships, and lower right Container vessels (Source: DNV GL).

DNV GL – Report No. 2018-0260, Rev. 1 – www.dnvgl.com Page 15
4 LOW- AND ZERO EMISSION TECHNOLOGIES FOR SHIPS Exhaust emissions from a marine diesel engine, the typical power unit in the world fleet, largely comprise of CO2, NOx and SOx, but also smaller quantities of CO and PM. There are several mitigation measures available for ships, where some influence specific exhaust gas components (such as scrubbers for SOx), while others influence several or all emission components (such as electrification). The emissions of CO2, NOx and SOx are subjected to international regulations.
While some solutions allow for zero emissions from ships, others are categorized as low emission solutions. Two main options are available for achieving zero emissions:
– Battery-electric, charged from shore
– Hydrogen for use in marine fuel cells
Moving towards true zero emission shipping, both hydrogen and electricity must be produced with zero emission, e.g. from renewable energy sources or having carbon capture and storage (CCS) in place.
Low emission solutions can be achieved by applying a wide number of solutions. The measures can be compiled in main groups such as:
– Alternative fuels and energy carriers (e.g. LNG, biofuels, methanol, hybridisation with batteries and hydrogen, etc.)
– Technical and operational measures (e.g. hull efficiency, propulsion/machinery efficiency (including hybridization), voyage execution, logistics, etc)
– Exhaust gas after treatment (e.g. selective catalytic reduction (SCR), scrubbers, particle filters, etc.)
These categories are discussed below, as well as barriers for uptake.
4.1 Alternative fuels A wide range of alternative fuels can contribute to low and zero emission ships – although applicability, cost and availability currently restrict their use. The direct emission from the ship (tank to propeller) for selected fuels/energy carriers varies, as indicated in Figure 4-1. For example, using LNG as marine fuel significantly reduces SOx and PM emissions, having an approximately 10% reduction in greenhouse gas (GHG) emissions and diminishes emissions of NOx by 85-90% in the case of low-pressure engines. Only electrification and hydrogen give zero tank-to-propeller emissions. When considering alternative marine fuels, life cycle emissions should also be assessed, as large variation is reported for different fuels in different regions (e.g. Bengtsson et al, 2011, 2012; Chryssakis et al, 2013; DNV GL, 2014; Gilbert et al, 2018).
LNG powered vessels have already been introduced (currently 121 ships in operation and 127 confirmed newbuilds), biofuels and methanol9,10 are available in certain ports, and full electrical/hybrid ships are emerging in the short sea, offshore and passenger segments. The recently introduced two-stoke dual fuel engines has increased significantly the fuel flexibility, as they use fuels such as methanol, ethanol and LPG (or LNG/NG, Ethan), in addition to HFO/MGO. Marine fuel cells are also emerging, providing a higher 9 Stena Germanica bunkering in Gothenburg is the only example of methanol bunkering to a ship being carried out presently, http://www.bunkerindex.com/news/article.php?article_id=18047 10 Seven 50,000 dead weight tonne vessels are built with the first-of-its kind MAN B&W ME-LGI 2-stroke dual fuel engine that can run on methanol, fuel oil, marine diesel oil, or gas oil. https://www.methanex.com/about-methanol/methanol-marine-fuel#sthash.oW84bYPp.dpuf

DNV GL – Report No. 2018-0260, Rev. 1 – www.dnvgl.com Page 16
efficiency and thereby lower fuel consumption and associated emissions compared to combustion engines. Shore-side electricity is also emerging in certain ports, 11 also referred to as cold ironing and shore power. This allows for the ship’s on-board generators to be shut down, reducing its corresponding emissions in port.
Based on current technology, a distinction between short-sea and deep-sea shipping should be made with regards to applicability of various fuels, as deep-sea vessels have fewer options compared to the short-sea segment:
Short-sea shipping includes vessels typically operating in limited geographical areas, in relatively short routes, with frequent port calls. Energy demand, sailing schedule and bunkering pattern for such vessels may be suitable for testing new fuels, such as LNG, methanol and biofuels. Some segments have an operating profile suitable for the use of batteries as fully battery powered or in hybrid propulsion configurations. For instance, the Norwegian ferry sector is currently being electrified, with phasing in of about 60 battery electric ferries over the next few years. The use of hydrogen is also technically feasible, and Norway has an ongoing development project, with ambitions of putting in service a new ferry on hydrogen in 2021.12
Deep-sea shipping includes mostly large ocean-going vessels covering long routes and often without a regular schedule (except for container vessels). These vessels require fuel that is globally available, while energy density is important to ensure maximization of space available for cargo transport over long distances. For such vessels, LNG is emerging as a viable low emission option as bunkering infrastructure becomes globally available. Biofuels can also be used, if they can be available in the quantities required and at a quality that will not create fuel compatibility problems. Based on current technological developments, electricity cannot be used in large scale for these vessels in the foreseeable future (Sandia report, 2017), although hybrid solutions can be of interest also for deep-sea shipping. Nuclear propulsion is technically feasible for large vessels, but political, societal and regulatory barriers can hinder its use. Various sail arrangements (e.g. sail, kite, fixed wing, Flettner rotors) have been tested out on merchant vessels over the years (DNV, 2010a), potentially reducing fuel consumption. A new Delft study estimated significant saving potentials applying wind powering on large tank and bulk ships (Delft, 2017).
The potential for alternative marine fuels will depend on factors related to meeting emission requirements, physical and chemical characteristics, availability, cost, safety, and local and global environmental footprint (e.g. DNV GL, 2014a, 2015a, 2017a). Recently, promising alternative fuels have been ranked using multi criteria methods (e.g. Deniz, 2016, Månsson, 2017; Hansson et al, 2017). Such methods are expected to give an additional support to ship owners and policy makers.
There is no “silver bullet” solution, and in most cases selection will be based on a compromise between benefits and drawbacks of various fuel options (DNV GL, 2015a). The final decision will vary for different ship types/sizes, operations, and strategic directions of each ship owner. In all cases, the cost associated with machinery, as well as the expected fuel prices, will play the dominant role. Safety will also be a primary concern and can also be translated into monetary terms once a design has been established and the necessary safety measures identified.
11 http://coastalconservationleague.org/wp-content/uploads/2010/01/EERA-Charleston-Shoreside-Power-Report-.pdf https://www.zero.no/wp-content/uploads/2016/05/landstrom-i-norge.pdf http://cruising.org/docs/default-source/research/environment-research-2017.pdf 12 Breaking new ground in hydrogen ferry project: https://www.sjofartsdir.no/en/news/news-from-the-nma/breaking-new-ground-in-hydrogen-ferry-project/

DNV GL – Report No. 2018-0260, Rev. 1 – www.dnvgl.com Page 17
Figure 4-1 Indicative reduction potential for key emission components using selected low and zero emission fuels and technologies (Tank-to-Propeller emissions). Green indicates high potential. Red indicates low potential.
4.2 Technical and operational measures A variety of technical and operational measures are available for reducing shipping’s fuel consumption and emissions. The mitigation measures range from easily achievable operational measures to capital intensive technical solutions.
Technical measures are improving the energy efficiency of the ship. They are typically divided into measures for reducing propulsion energy demand (e.g. hull and propeller efficiency), improving energy production (e.g. waste heat recovery and machinery system optimization) and measures reducing the energy use of other on-board consumers (e.g. cargo handling systems, deck machinery, etc.).
Operational measures relate to how ships, integrated with maritime transport systems, can be operated more energy efficient (e.g. speed reduction, ship-port interface, weather routing, etc). A promising operational measure, with large saving potentials, are reduced speed of ships (e.g. Corbett et al, 2009; Zanne et al 2013; Lindstad et al., 2015; Eide et al 2017; Yin et al, 2017; CE Delft, 2012; 2017;). Speed reduction can be achieved by improving port and cargo operations in such a way that slow steaming can be accepted, or by explicitly changing the time tables and schedules. Part of the speed reduction can be absorbed in the current transport systems through reduced time in port and improved coordination and synchronisation between ship and port to avoid waiting in port, and use the extra time to slow steam (Longva, 2011; Andersson, 2017). There is a significant potential to improve efficiencies throughout the transport networks aligning the transport demand with size, operations and functionality of ships and with land-based infrastructure and logistics systems. The industry and related stakeholders must work together to realise on this potential. Increasing the transport system efficiency is a more complex matter that includes modal shifts and integration of value chains.
A recent literature review, covering 60 studies, provide quantitative estimates of CO2 emission reduction potentials for different measures (Bouman et al, 2017). The reduction potential for each measure strongly depends on factors such as ship type, size, operational profile, technical conditions/status and ageing (e.g. DNV GL, 2016b; DNV GL, 2017c). Eide et al (2017) divided the measures per maturity level, indicating at which time the measures can be applied, rather than by functional area such as hull, machinery and operations:
Quick wins: measures that are mature and in common use for existing ships and new builds (e.g. hull and propeller efficiency, voyage execution, etc.).
Up and coming: measures that are tested and well known, but are still 3-5 years from being commonly applied (e.g. hybrids and use of shore power for propulsion).

DNV GL – Report No. 2018-0260, Rev. 1 – www.dnvgl.com Page 18
Next generation: measures that are being piloted today and are 5-10 years from becoming mature (e.g. wind power, air cavity lubrication, ballast free, etc.).
Black swans: measure that are only at an idea stage. The impact and applicability of these measures are highly uncertain (e.g. wave powering13 of ships).
Medium and long-term projections for decarbonization in shipping has been reported by several studies (e.g. IMO, 2011; Eide et al 2011, 2013, 2017; Smith et al, 2016; OECD, 2018a). The results indicate cost-effective reduction potential for technical and operational measures (not including fuels) in the range of 20-30 %, and up to around 50-60 % if including the more expensive and novel technologies and solutions. An example of a Marginal Abatement Cost (MAC) curve for the world fleet in 2030 is presented in Figure 4-2. The MAC curves quantify theoretical reduction potentials, if a set of CO2 reducing measures were to be implemented on the predefined ship categories.
Figure 4-2 Average marginal abatement cost curve for the fleet in 2030 (Eide et al, 2011).
4.3 Exhaust gas treatment To reduce emissions from marine engines, the measures can either be initiated before start of the combustion process, during the combustion or after as treatment of the exhaust gas. The most ideal reduction method depends on which component that is to be controlled.
For instance, SOX can easily be controlled before the combustion process by removal of sulphur in the fuel, while NOX can be controlled during the combustion process. After treatment is also an option for both components. Some of the reduction methods can have negative or positive effects on other exhaust gas
13 The history of wave-powered boats: http://www.wavepropulsion.com/ and http://www.bluebird-electric.net/wave_powered_ships_marine_renewable_energy_research.htm

DNV GL – Report No. 2018-0260, Rev. 1 – www.dnvgl.com Page 19
components. The measures using combustion modifications or after-treatment to reduce the emissions in general comes with a fuel penalty.
The amount of CO2 and SOX in the exhaust gas from an engine is directly proportional with the carbon and sulphur level in the fuel burned. Reduction of CO2 and SOX emissions can be achieved by an engine efficiency increase, or through a change to alternative fuels with lower carbon and sulphur contents (e.g. LNG). A short outline on relevant reduction measures are given below, and for more details consider e.g. DNV GL (2015b), Danish Environmental Protection Agency (2012), and Leinonen (2016).
4.3.1 SOx reduction measures Exhaust gas scrubbers is a well-known and a commonly used method for reducing the SOx emissions from a ship. Worldwide, there are 297 scrubbers in operation at the end of 2017, and 134 in order.14 Cruise ships have the highest uptake of scrubbers. By 2020, different projections report between 3,200 to 4,400 scrubbers in service,15 although these estimates seem optimistic given the current number of installations.
In a scrubber, the exhaust gas from main- and auxiliary engines and boilers are cleaned by using sea water or chemically treated fresh water as a scrubbing agent. Additionally, there exist other scrubber technologies applying dry substances such as limestone. By using the exhaust gas scrubber technology, the ship can continue using high sulphur fuels, which is well-known and typically comes at an attractive price. In sulphur regulated areas, scrubbers are an attractive solution avoiding use of costly low sulphur heavy fuels or distillates.
Wet scrubbers are divided between open loop and close loop systems or as a hybrid system which allows for running in closed loop mode for a given time. In an open loop system sulphur is released to the sea in the scrubber waste water. There are local regulations prohibiting discharges of waste water from scrubbers (open loop systems). The use of scrubbers comes typically with a fuel penalty of up to 2%, costs for chemicals and extra maintenance.
4.3.2 NOx reduction measures Several methods which separately or combined reduce the NOX emission from marine engines are available (DNV GL, 2015b). The methods are mostly based on changing the combustion temperature or by performing after treatment of the exhaust gas. Selective catalytic reduction (SCR) is the most commonly used method for removal of NOX in the exhaust gas. The SCR method use a catalyst and a reductant, typically urea or NH3 (ammonia), to chemically reduce NOx to nitrogen gas (N2) and water vapour (H2O).
The total number of SCR installations in the world fleet prior 2013 was 519 (Makoveyenko, 2015). Over half of the ships with SCR installations are cargo ships. Data from the NOx fund16 shows that ships operating in Norwegian waters dominates, accounting for more than 30% of the SCR installations worldwide. Applying this relationship and recent NOx fund data (2014-2017), the SCR installations today is estimated to be around 670.17
Another emerging NOx reduction measure is exhaust gas re-circulation (EGR), which can reduce the NOx emission significantly. EGR involves circulating a controllable proportion of the engine's exhaust back into
14 LNGi: https://www.dnvgl.com/maritime/mydnvgl-service-overview/lng-intelligence-lngi/index.html 15 https://www.bunkerspot.com/global/43344-global-2020-scrubbing-will-the-lowest-cost-route-to-compliance-says-consultant 16 The NOx Fund gives support to NOx reducing measures: https://www.nho.no/Prosjekter-og-programmer/NOx-fondet/The-NOx-fund/ 17 The NOx Fund gives support to NOx reducing measures: https://www.nho.no/Prosjekter-og-programmer/NOx-fondet/The-NOx-fund/
DNV GL – Report No. 2018-0260, Rev. 1 – www.dnvgl.com Page 20
the intake air, which reduce the formation of NOx in the combustion process. The EGR system reduces available oxygen in the cylinder and it is observed the production of particulates may increase.
Addition of water to the combustion process will also reduce the formation of NOX in the combustion process. There are several ways of adding water to the combustion process, like fuel-water emulsions, humid air systems or direct water injections.
LNG as alternative fuel reduce the NOx emissions significantly.
4.3.3 PM reduction measures The formation of particulate matters (PM) are closely linked to fuel type and quality, the sulphur content and the operational load of the engine (ICCT, 2017a). Technical measures which reduces particulate emissions are few. However, it is known that the alternative fuels, like LNG and low sulphur fuels, reduce the PM emissions significantly.
For road engines, a series of filter solutions have been developed, providing more than 90% reduction in PM emissions. These filters may also be tuned to reduce around 90% of CO and Hydrocarbon (HC) emission from diesel engines. For maritime engines, such filters have not proven to be practicable due to the large amount of ash emission from the fuel and lubrication oil, and the consequent clogging of the filters. However, the development is on-going and tests have indicated reduction potentials in the region of 60-90% (Jacobs, 2014) 18. This is counterbalanced by a small penalty on energy consumption due to increased back-pressure from the filters. There are also other challenges reported such as space requirements and cleaning/maintenance needs (Danish Environmental Protection Agency 2012; Leinonen, 2016). An overview of use of diesel filters in the maritime sector has recently been reported.19 Measures initiated primarily to reduce SOx typically also reduce PM emissions.
4.4 Barriers to overcome There are multiple challenges with introducing novel technologies. This can be safety requirements, space and weight limitations, system integration and alternative operational practices, limited knowledge and experience with the solution, no verification methods or test facilities available, limited funding to carry out demonstration projects, limited financial capacity to handle increased investment costs or building new ships, lack of supporting policy instruments and legal and regulatory issues.
The barriers for uptake of reduction technologies in shipping have been investigated by several studies (e.g. DNV 2012; DNV GL, 2016d; DNV GL, 2017c; Acciaro et al 2013; Rehmatulla et al 2015; Rehmatulla & Smith 2015). Findings indicate the importance of financial and technical barriers, but also managerial practices and legal constraints. Each reduction technology will have very specific challenges and barriers to be realised and considered as viable alternative for a significant part of the world fleet. Action to be taken to overcome these barriers, are suggested by Eide et al (2017).
18 https://en.nabu.de/imperia/md/content/nabude/verkehr/1602-info_heincke_measurements_en.pdf 19 http://www.theicct.org/sites/default/files/12-
Diesel%20Particulate%20Filters%20for%20PM%20Control%20from%20Marine%20Engines%20-%20Mike%20Geller%2C%20MECA.pdf

DNV GL – Report No. 2018-0260, Rev. 1 – www.dnvgl.com Page 21
5 DEEP SEA CASE - SPEED LIMIT IN ASEAN REGION One of the options available to reduce emissions from shipping is reduced speed – as outlined in Section 4. The amount of fuel a ship uses for propulsion is proportional to the energy required to overcome the resistance the ship meets as it travels through the water at a given speed. Fuel savings from reduced speed have been documented in practice (e.g. Zanne et al 2013) and through theoretical studies (e.g. Eide et al 2017; Lindstad et al., 2015; Corbett et al, 2009; Yin et al, 2017; Traut et al, 2013). Legal, technical and environmental aspects of introducing speed limits at sea have also been considered (e.g. CE Delft, 2012). This section presents a case study for slow steaming for large container ships in the ASEAN region. The effect of speed reduction on fuel consumption and emissions for the 460 largest container vessels (above 100 000 GT) in the ASEAN region is estimated.
5.1 AIS-modelling of speed reduction AIS-based analyses have been used to identify current sailing speeds and operating patterns for the assessed fleet, and to calculate fuel consumption and associated emissions. The AIS analyses are used to establish the baseline for current fuel consumption and emissions to air.
The analysis of emission reduction from speed limitation has been performed for all selected vessels in the area, where various maximum allowed speeds are entered into the model. All observed speeds of a single ship exceeding the specified limit within the analysis area adjusted down to the specified limit. The model then calculates the amount of fuel savings, as well as the associated emission reductions, using the “Cubic Rule” method. Change in specific fuel consumption at modified engine load is also considered. The method is based on unchanged total sailing distance, but where fuel consumption (per nautical mile) at sailing speeds above the speed limit is adjusted down to consumption (per nautical mile) at the set speed limit. Figure 5-1 shows the calculation principle used, where each ship sailing above the speed limit is assigned a speed within the assigned speed limit.
The methodology has been developed in a recent project for the Norwegian Maritime Authority (DNV GL 2018).
Figure 5-1 Principle for estimating emission reduction potentials introducing speed limits (DNV GL, 2018)

DNV GL – Report No. 2018-0260, Rev. 1 – www.dnvgl.com Page 22
5.2 Modelling results This study encompasses all container vessels larger than 100 000 GT, observed in the ASEAN region from January to December 2017. The amount of fuel consumed for this container segment is approximately 2.1 Mton, representing 6 % of the totals for the ASEAN region. Figure 5-2 presents the average speed profile for the vessels observed in this ship segment. As the average design speed is 23 knots, the AIS based results shows that slow steaming already occurs for the large container vessels operating within ASEAN region.
Figure 5-2 Average fuel and speed profile for all container vessels above 100 000 gross tonnage, cruise mode in the ASEAN region (Source: DNV GL).
An analysis of fuel consumption (tonnes/nm) has been performed at different sailing speeds. The effect of speed reduction is calculated for each individual vessel, as there are large operating variations between the ships. As an illustration, Figure 5-3 shows the average fuel consumption/nautical mile for all container vessels above 100 000 GT. The figure shows that there is typically a lower threshold of 6-8 knots where reduced speed no longer gives reduced fuel consumption/nautical miles. If the speed is reduced too much, consumption and emissions will increase.
Figure 5-3 Average fuel consumption per nautical mile for container vessels above 100 000 gross tonnage (Source: DNV GL).
0%
2%
4%
6%
8%
10%
12%
14%
16%
18%
6 7 8 9 10 11 12 13 14 15 16 17 18 19 20 21 22 23 24 25
Share of fuel consumption
Speed segment (knot)
Moderate speed reduction
Significant speed reduction

DNV GL – Report No. 2018-0260, Rev. 1 – www.dnvgl.com Page 23
For estimating the effect of reduced fuel consumption and emissions, a moderate speed reduction of 18 knots and a significant speed limit of 15 knots are used for the entire ASEAN region. Both speed limits are significantly above the threshold level where reduced speed no longer will give a reduction in the fuel consumption. The effect of speed reduction is calculated for all 460 container vessels observed in the selected size segment.
The modelling results shows that setting the moderate speed limit at 18 knots gives a potential 6 % reduction in fuel consumption and emissions. If the speed limit is lowered significantly, to 15 knots, the fuel and emission reductions is approximately 23%. The fuel and emission reductions observed in this regional study is in line with global estimates reported by OECD (2018b).
The emission reductions achieved by introducing local speed restrictions may be cancelled or even negative if sailing time lost in the regulated areas are made up for by increased speed in other areas. However, the ASEAN region having high density traffic areas close to shore and in populated areas, would experience significant reduction effects on important local pollutants like NOx, SOx and PM if speed is reduced. Ways of introducing lower speed as an emission reduction measure are discussed in OECD (2018b) and CE Delft (2017).
Maritime engines are typically designed for a certain specific load and speed range at which the total efficiency is optimised. In case of introducing a significant speed reduction, it is likely that technical adjustments on the propulsion engines are required to maintain safe and efficient long term operation of the vessels. Derating of engines could be the best solution if a vessel is scheduled for long term reduction of operation speeds (e.g. Wartsila 2010).
This case analysis indicates that speed reduction could be an effective measure for emission reductions in the ASEAN region. Furthermore, it demonstrates a methodology which could be extended to other ship segments to assess the full potential for emission reduction through speed reduction in the ASEAN region.

DNV GL – Report No. 2018-0260, Rev. 1 – www.dnvgl.com Page 24
6 SHORT SEA CASE - ELECTRIFICATION OF PASSENGER SHIPS IN THE ASEAN REGION
As stated in Section 4, electrification is one of the few options available for zero-emission shipping. This section presents a high level feasibility study for electrification (fully or partly in hybrid solutions) of passenger ships smaller than 1000 GT with registered port calls in the ASEAN region.
On a full-electric ship, all the power, for both propulsion and auxiliaries, comes from batteries which are charged from an on-shore connection to the electric grid while the ship is at berth. A hybrid-electric solution can also charge its batteries from shore, but has also conventional machinery to cover smaller or larger parts of the operation (as well as charging the batteries on Voyage). A ship can operate on batteries alone for parts of the operation, for instance in port operation, during stand-by operations, etc. Hybrid solutions without battery charging from shore can also reduce fuel consumption and emissions, by increasing the effectiveness of the conventional machinery. Today, limited shore based infrastructure for charging is available, but progress is made in certain regions20,21 (e.g. Ecofys, 2015).
Installing battery systems (incl. replacement after typically 8-10 years) on board will increase investment costs, compared to traditional diesel engines. In addition, infrastructure investments on land is required to provide electricity. The electricity production from hydropower is reported to be price competitive (e.g. Hansson et al 2016, DNV GL 2015c) with MGO.
Smaller passenger ships/ferries are often ideal candidates for electrification, as they typically operate in limited geographical areas, in relatively short routes, with frequent port calls, suitable for charging of the batteries. Their local operation profile, as well as their energy demand, therefore make them suitable candidates for the use of batteries (fully battery powered or in hybrid propulsion configurations). For comparison, the Norwegian ferry sector is currently being electrified, with phasing in of about 60 battery electric ferries over the next few years. Even though most of the energy consumption on these ferries will be electricity charged from land, the concepts are typically hybrid solutions including diesel engines for back-up and limited parts of the operation.
6.1 AIS-based screening of potential for electrification The potentials for electrification is assessed using a novel AIS-based screening methodology, that consider operational patterns and typical distances sailed and related fuel consumption between port calls.
Based on AIS data, the fuel consumed between each port call is calculated for each ship. The fuel consumption estimate corresponds to an energy requirement (kWh), which is used as an estimate for the battery capacity required for the ship to operate either fully electric or partly electric (ref. “plug-in” hybrid).
Since smaller passenger ships are the most prominent candidates for electrification, only passenger ships with tonnage below 1000 GT are assessed in this case analysis, using data for one month.
20 First for Shore Power in India: http://www.maritime-executive.com/editorials/first-for-shore-power-in-india 21 Shore power, Norway: http://www.tu.no/artikler/havner-vil-fa-hurtigruten-over-pa-landstrom/193818 http://www.mynewsdesk.com/no/enova-sf/pressreleases/140-millioner-til-landstroem-1689508

DNV GL – Report No. 2018-0260, Rev. 1 – www.dnvgl.com Page 25
6.2 Modelling results The distance and fuel consumption between port calls is calculated for each voyage, and plotted in Figure 6-1. It is seen that the typical fuel consumption for a given distance can vary greatly, depending on the energy need of the ship (primarily determined by its weight and speed). A battery with an energy capacity of 1000 kWh can simplified be estimated to replace slightly below 0.2 tonne of conventional fuel. As indicated in Figure 6-1, this can typically cover a distance up to 25 km, depending on the energy need of the ship.
The figure shows that the majority of voyages can be covered using less than 1000 kWh of energy. Furthermore, it can be inferred from the figure that by doubling the battery capacity, virtually all voyages can be battery powered for this segment.
Figure 6-1 Fuel consumption (tonne) plotted against distance of voyage (km) for passenger vessels < 1000 GT operating in ASEAN region. The capacity of a 1000 kWh battery is indicated by the green line (Source: DNV GL).
For longer voyages, hybridisation with a high degree of charged electrical power from land may provide an option for very high emission reduction, with significantly reduced cost compared to full-electrification. To illustrate this a specific distance operated by smaller passenger ships (< 1000 GT) in the Philippines is investigated. The fuel consumption for each voyage of a year of operation is calculated based on AIS ship movement data.
Figure 6-2 shows how the fuel consumption per voyage is distributed among the voyages for a crossing distance of around 40 km. The figure shows that a battery must be dimensioned at around 2150 kWh to operate all voyages full-electric. A 1500 kWh battery may be sufficient for full-electric operation of half of the voyages. However, using a 1500 kWh battery in hybrid solution with a conventional fuel engine may be an option for such operation; this would lead to a hybridization factor (energy consumption covered by battery divided by total energy consumption) of around 70 % for the most energy requiring voyages.
This high-level analysis indicates that fully electrifying this ship segment is technically feasible – in particular if hybridisation with high share of electricity from shore is considered. From Section 3 we see that passenger vessels below 1000 GT account for 0.65 % of total ASEAN region fuel consumption and

DNV GL – Report No. 2018-0260, Rev. 1 – www.dnvgl.com Page 26
emissions. This corresponds to 728 kton CO2, 15 kton NOx and 11 ktnn SOx, which could be eliminated by electrification.
It should be noted that the time spent in port is crucial for dimensioning of the system transferring power to the ship and how the connection to the power grid is arranged. The charge effect (kW) between shore connection and the ship is reduced by 50% if the time spent in port is doubled. The use of battery banks onshore (as a buffer) can lower the power requirement from the shore power grid. The emission reduction potentials, by using electric driven ships, are closely linked to the energy sources used by the onshore power grid.
The AIS-based analyses can be extended to other ship segments, and could also provide the most promising high emission areas suitable for electrification. Such areas could overlap with existing and planned on-shore infrastructure capacities.
Figure 6-2 Accumulated percentage of voyages plotted against fuel consumption per voyage for a selected passenger ship < 1000 GT, operating a crossing distance around 40 km (Source: DNV GL).
DNV GL – Report No. 2018-0260, Rev. 1 – www.dnvgl.com Page 27
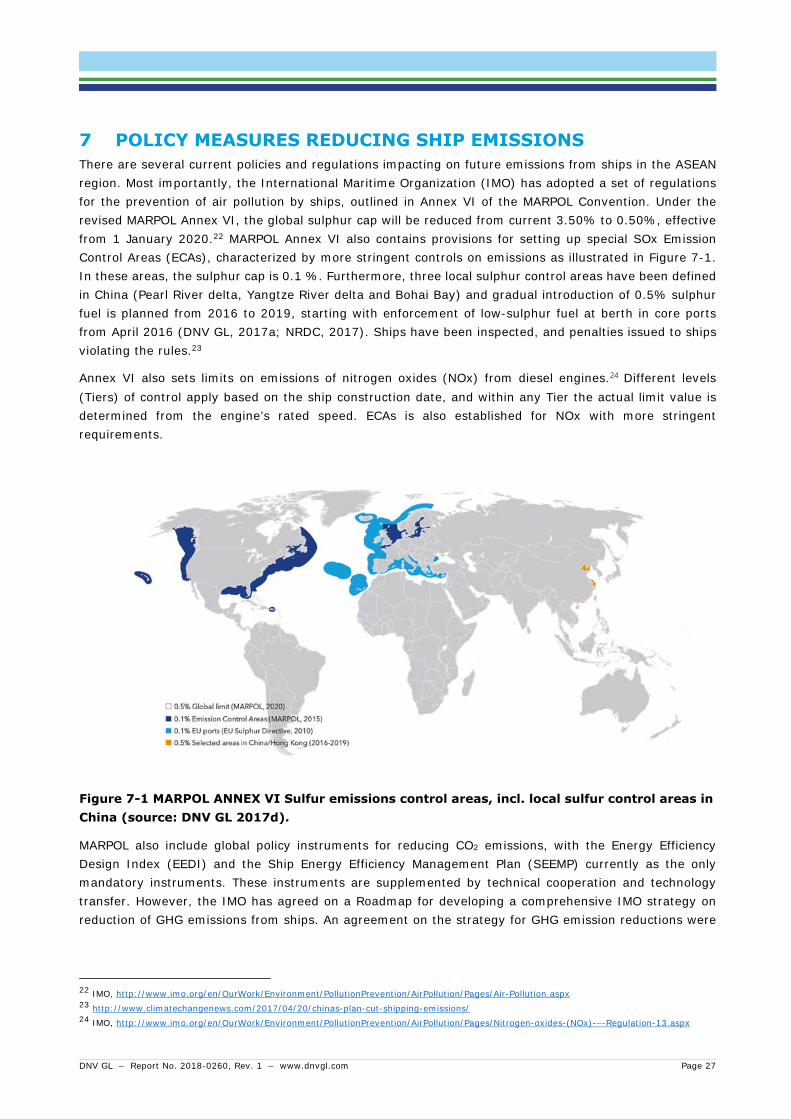
7 POLICY MEASURES REDUCING SHIP EMISSIONS There are several current policies and regulations impacting on future emissions from ships in the ASEAN region. Most importantly, the International Maritime Organization (IMO) has adopted a set of regulations for the prevention of air pollution by ships, outlined in Annex VI of the MARPOL Convention. Under the revised MARPOL Annex VI, the global sulphur cap will be reduced from current 3.50% to 0.50%, effective from 1 January 2020.22 MARPOL Annex VI also contains provisions for setting up special SOx Emission Control Areas (ECAs), characterized by more stringent controls on emissions as illustrated in Figure 7-1. In these areas, the sulphur cap is 0.1 %. Furthermore, three local sulphur control areas have been defined in China (Pearl River delta, Yangtze River delta and Bohai Bay) and gradual introduction of 0.5% sulphur fuel is planned from 2016 to 2019, starting with enforcement of low-sulphur fuel at berth in core ports from April 2016 (DNV GL, 2017a; NRDC, 2017). Ships have been inspected, and penalties issued to ships violating the rules.23
Annex VI also sets limits on emissions of nitrogen oxides (NOx) from diesel engines.24 Different levels (Tiers) of control apply based on the ship construction date, and within any Tier the actual limit value is determined from the engine’s rated speed. ECAs is also established for NOx with more stringent requirements.
Figure 7-1 MARPOL ANNEX VI Sulfur emissions control areas, incl. local sulfur control areas in China (source: DNV GL 2017d).
MARPOL also include global policy instruments for reducing CO2 emissions, with the Energy Efficiency Design Index (EEDI) and the Ship Energy Efficiency Management Plan (SEEMP) currently as the only mandatory instruments. These instruments are supplemented by technical cooperation and technology transfer. However, the IMO has agreed on a Roadmap for developing a comprehensive IMO strategy on reduction of GHG emissions from ships. An agreement on the strategy for GHG emission reductions were
22 IMO, http://www.imo.org/en/OurWork/Environment/PollutionPrevention/AirPollution/Pages/Air-Pollution.aspx 23 http://www.climatechangenews.com/2017/04/20/chinas-plan-cut-shipping-emissions/ 24 IMO, http://www.imo.org/en/OurWork/Environment/PollutionPrevention/AirPollution/Pages/Nitrogen-oxides-(NOx)-–-Regulation-13.aspx

DNV GL – Report No. 2018-0260, Rev. 1 – www.dnvgl.com Page 28
made at MEPC 72, with commitment to reduce GHG emissions and aiming to phase out GHG emissions as soon as possible within this century.
There are also existing market-based drivers for reducing GHG emissions in the maritime sector; mainly high fuel costs and market competition. High fuel prices combined with a competitive market due to an overcapacity in the world fleet have been a driver to improve ships’ energy efficiency and reduce fuel costs. To date, however, the shipping industry has not capitalized on the full reduction potential, despite the development of “eco” ships. Other relevant market-based drivers are for example:
Indexing system for green shipping, such as Rightship, Clean Cargo Working Group (CCWG), Clean Shipping Index (CSI), The Environmental Ship Index (ESI), Green Award.
Push from charterers, banks, investors, and insurance companies to reduce CO2 emissions. A premium for energy efficient ships in the charter market.
This section outlines an array of options available to ASAN region and its members to further provide incentives for emission reductions from ships in the region. The options include measures from three categories:
Regulatory measures (rules and regulations);
Economic measures (taxes, subsidies, quotas, etc.);
Other measures, including research and development.
Note that the options listed are not exhaustive. Rather, the intention is to point to relevant examples which could serve as inspiration and guidance for future work. More information on economic measures and green schemes are available (e.g. NRDC, 2017; COGEA, 2017; OECD, 2014; OECD 2018b,c).
7.1 Regulatory measures Measures in this category directly impose demands on behavior or technology. Examples of legal instruments may be requirements in the form of laws, regulations or standards. Agreements between authorities and individual companies are also included in this category.
Examples include;
Emission standards – like those covered by IMOs MARPOL convention.
o Among the latest international developments is that, MEPC 72 adopted the “Initial IMO
Strategy on reduction of GHG emissions from ships” (resolution MEPC.304(72)). The vision
unequivocally states that the ultimate goal is full decarbonization as soon as possible within
this century. The specific goals are set as efficiency targets of at least 40% by 2030,
pursuing efforts towards 70% by 2050, as well as reducing the total annual GHG emissions
by at least 50% by 2050 compared to 2008. A carriage ban on non-compliant fuel was
approved, and is expected to enter into force in March 2020.
o I.e. parts of ASEAN may for instance apply for ECA status.
Mandatory Requirements for the inclusion of biofuels in fuel sold: This may include requirements
for the percentage of biodiesel in MGO and percentage of biogas in LNG. Though not yet applied
to the maritime sector, this measure is used in the automotive fuel markets e.g. in Norway.
DNV GL – Report No. 2018-0260, Rev. 1 – www.dnvgl.com Page 29
Requirements for technology or emissions in other public regulations: There may also be
demands for technology and emissions e.g. resource extraction permits on the continental shelf
and in the aquaculture or fishing industries. Could also include:
o Requirements on tug-boats, pilot vessels
o Requirements on ferries
o Requirements on coast-guard vessels
7.2 Economic measures Economic instruments are based on incentives to change environmentally harmful behavior by making environmentally harmful activity more expensive or environmentally friendly activity cheaper. This is done by taxing unwanted behavior in the form of fees, or by subsidizing desired behavior or making allowances in a quota market.
Examples include;
Differentiated port fees: Differentiated port infrastructure fees to promote environmentally friendly maritime transport activities and sustainable transportation have been applied in Norway, Sweden and Netherland. A new report claim that reduced fees potentially could reduce payback time for both LNG and power from shore (COGEA, 2017).
Vessel speed reduction: Programme of Port of Long Beach and Port of Los Angeles, the Eco Action Programme and Blue Circle Award in Port of Vancouver (Winnes, 2015). Initiative for reducing emissions from vessels entering and leaving the harbour.25
Voluntary fuel switch scheme: Programs applied in various ports that provides incentives to ships to use low sulphur fuel (OECD, 2014). For example, the Fair Winds Charter (FWC) voluntary at-berth fuel switching program for ocean-going vessels calling at Hong Kong. Participating vessels switch to low-sulphur fuel (0.5% sulphur content or less) while at berth in Hong Kong.26
Fees and taxes: Fees on emission of CO2 and NOx for all fossil fuels will make environmentally friendly alternatives more attractive. Reduced fees for selected alternative fuels can provide further incentives
National policies are also in place to promote technology uptake and emission reduction. For example, Norway has implemented the following policies:
Enova27: A Norwegian state support body that contributes to reduced greenhouse gas emissions, development of energy and climate technology and a strengthened security of supply. Enova shall help national reduction in greenhouse gas emissions and develop new energy and climate technology, as well as push ideas to the market and ensure innovations increase in both scope and speed.
NOx fund28: The Business Sector's NOx Fund gives support to NOx reducing measures. Shipping and other industries are exempted from state NOx-tax, and instead pay a lower fee into the NOx-fund (owned by the business sector itself). In return, the Fund is strictly committed to achieve significant emission reductions. All funds are thus redistributed back to the associated enterprises to support NOx reducing measures. Enterprises apply for support to a variety of projects, and
25Port of Los Angeles, https://www.portoflosangeles.org/environment/progress/initiatives/vessel-speed-reduction-program/ Port of Long Beach, http://www.polb.com/environment/air/greenflag.asp 26Fair Winds Charter: http://civic-exchange.org/fair-winds-charter/ 27 ENOVA: https://www.enova.no/about-enova 28NOx Fund: https://www.nho.no/Prosjekter-og-programmer/NOx-fondet/The-NOx-fund/

DNV GL – Report No. 2018-0260, Rev. 1 – www.dnvgl.com Page 30
granted support will be paid once the relevant measure have been implemented and documented. Stimulates innovation and implementation of new technology, incl. CO2 reduction. Other authorities show increasing interest in the NOx Fund model.
Relevant for ASEAN is the green shipping initiatives in Singapore, that includes seven programmes designed to provide incentives to adopt clean and green shipping practices.29
7.3 Other measures Measures that do not involve economic or legal measures embrace a wide range of opportunities, from research and development, to targeted procurement policies at government agencies.
Examples include:
Targeted research and development
Targeted public procurement policies, for instance such as in the Norwegian ferry sector,
where zero emission solutions are favoured.
Information work to enlighten and inspire
o Ship-owners
o Charterers
o Government agencies
o The general public
International cooperation on standards, including
o Global standards; IMO, ISO etc.
o Regional standards; EU, ASEAN etc.
Green Coastal shipping program30: Is a joint program between government and industry to create the world’s most effective and environmentally-friendly fleet of coastal vessels. The program was initiated by and is organised by DNV GL. The program is aiming to revolutionise the way coastal shipping operates, converting fleets to run partly or entirely on batteries, liquified natural gas (LNG) or other green fuels. The program has 34 members and carry out pilot projects focusing on uptake of environmentally-friendly fuels and energy efficient design.
29 Green shipping initiatives: https://www.mpa.gov.sg/web/portal/home/maritime-singapore/green-efforts/maritime-singapore-green-initiative
30 https://www.dnvgl.com/maritime/research-and-development/futuristic-projects-transform-coastlines/index.html https://www.dnvgl.com/news/developing-a-roadmap-for-green-coastal-shipping-75090

DNV GL – Report No. 2018-0260, Rev. 1 – www.dnvgl.com Page 31
8 REFERENCES Acciaro et al (2013). The Energy Efficiency Cap in Maritime Transport. Journal of Shipping and Ocean Engineering 3 (2013) 1-10. http://www.davidpublishing.com/davidpublishing/Upfile/3/3/2014/2014030371606417.pdf
Andersson, P. (2017): Green approaches at sea – The benefits of adjusting speed instead of anchoring, Transportation Research Part D: Transport and Environment Volume 51, March 2017, Pages 240–249.
Bengtsson S, Andersson K, Fridell E. (2011), A comparative life cycle assessment of marine fuels; liquefied natural gas and three other fossil fuels. Proceedings of the Institution of Mechanical Engineers, Part M: Journal of Engineering for the Maritime Environment. 225, 97-110.
Bengtsson S, Fridell E, Andersson, K. (2012), Environmental assessment of two pathways towards the use of biofuels in shipping. Energy Policy, 44, 451-463.
Bouman E.A. et al. (2017), State-of-the-art technologies, measures, and potential for reducing GHG emissions from shipping, - A review, Transportation Research Part D 52 (2017) 408–421 409.
Buhaug, Ø., et al., Second IMO GHG study 2009, International Maritime Organization (IMO), London, UK, April 2009.
CE Delft (2012), Regulated slow steaming in Mariam transport, An assessment of Options, Cost and Benefits, Delft, CE Delft, February 2012. https://www.transportenvironment.org/sites/te/files/media/Slow%20steaming%20CE%20Delft%20final.pdf
CE Delft (2017), Regulating speed: a short-term measure to reduce maritime GHG emissions. https://www.cedelft.eu/en/publications/2024/regulating-speed-a-short-term-measure-to-reduce-maritime-ghg-emissions
Chryssakis C., S. Stahl (2013), Well-To-Propeller Analysis of Alternative Fuels for Maritime Applications, Paper No. 265, CIMAC Congress 2013.
COGEA, 2017, Differentiated port infrastructure charges to promote environmentally friendly maritime transport activities and sustainable transportation, June 2017 https://ec.europa.eu/transport/sites/transport/files/2017-06-differentiated-port-infrastructure-charges-report.pdf
Corbett et al (2008), Mortality from ship emission: A global Assessment, Environmental Science and Technology 41 (24):8512-8, January 2008. https://www.researchgate.net/profile/James_Winebrake/publication/5650440_Mortality_from_Ship_Emissions_A_Global_Assessment/links/5a52b946aca2725638c7b407/Mortality-from-Ship-Emissions-A-Global-Assessment.pdf?origin=publication_detail
Corbett J.J., Wang H., Winebrake J. J. (2009), The effectiveness and costs of speed reductions on emissions from international shipping, Transportation Research Part D: Transport and Environment, Volume 14, Issue 8, December 2009, Pages 593-598. http://www.winebrake.com/uploads/2/9/4/9/29493665/corbettwangwinebraketrd2009_as_published.pdf
Danish Environmental Protection Agency (2012), Reducing Air Pollution from Ships - a cost benefit analysis and feasibility study on possible means for further reduction of emissions, by Jørgen Jordal-Jørgensen COWI, ISBN no. 978-87-92903-11-2. https://www2.mst.dk/Udgiv/publications/2012/06/978-87-92903-11-2.pdf

DNV GL – Report No. 2018-0260, Rev. 1 – www.dnvgl.com Page 32
Delft (2017), Study on the analysis of market potentials and market barriers for wind propulsion technologies for ships.
Deniz C. & Zincir B. (2016), Environmental and economical assessment of alternative marine fuels, Journal of Cleaner Production, Volume 113, 1 February 2016, Pages 438-449. https://www.sciencedirect.com/science/article/pii/S0959652615018119
DNV GL (2018), The effect of reducing cruise ship speed in the World Heritage fjords, By Alvar Mjelde et al., DNV GL rep. 2018-0260, Rev 2. https://www.sdir.no/globalassets/sjofartsdirektoratet/regelverk-og-int.-arbeid---dokumenter/pollution-from-shipping-in-world-heritage-fjords/dnv-gl-report-2018-0025_-rev02_english.pdf?t=1520121600026
DNV GL (2017a), LPG as a marine fuel, by H.W. Brinks, C. Chryssakis, DNV GL Position Paper, 2017. https://www.dnvgl.com/technology-innovation/sri/maritime-transport/publications.html
DNV GL (2017b), Maritime forecast to 2050 - Energy Transition Outlook 2017, Past and Present shipping, By Ø. Endresen, T. Longva, A. Mjelde et al. December 2017. https://eto.dnvgl.com/2017/maritime
DNV GL (2017c), Low Carbon Shipping Towards 2050, DNV GL. https://www.dnvgl.com/publications/low‐
carbon‐shipping‐towards‐2050‐93579
DNV GL (2016a), Reduksjon av klimagassutslipp fra norsk innenriks skipsfart, utredning for Klima‐ og
miljødepartementet (in Norwegian), rep. no 2016‐0150, Rev 0,
https://www.regjeringen.no/contentassets/b3df5ceb865e42b48befdf132a95a8be/skipsfart‐klimagasser‐
dnvgl.pdf
DNV GL (2016b), Teknologier og tiltak for energieffektivisering av skip (in Norwegian), DNV GL 2016‐0511.
DNV GL (2016c), Study on the ship air emission in the port of Singapore, 2013 Emission Inventory,
Maritime and Port Authority of Singapore, Rev 2, April 2016.
DNV GL (2016d), Realisering av null‐ og lavutslippsløsninger I anbudsprosesser for ferjesamband. DNV GL-2016-0119 http://www.nhosjofart.no/getfile.php/Dokumenter/Publikasjoner/Null‐
%20og%20lavutslippsferjer%20i%20fylkene.pdf
DNV GL (2015a), The Fuel Trilemma: Next generation of marine fuels, by C. Chryssakis, H.W. Brinks, T. King, DNV GL position paper 03-2015. https://production.presstogo.com/fileroot7/gallery/DNVGL/files/original/9fef597280b44480b6455332c7886d74.pdf
DNV GL (2015b), Emissions from ships operating in the Greater Metropolitan Area, report for the New South Wales Environment Protection Authority, DNV rep. 1K2V16P-6, http://www.epa.nsw.gov.au/~/media/EPA/Corporate%20Site/resources/air/gma-ship-emissions.ashx
DNV GL (2015c), Vurdering av tiltak og virkemidler for mer miljøvennlige drivstoff i skipsfartsnæringen, Utredning for Klima- og miljødepartementet (In Norwegian), Rapportnr. 2015-008.
DNV GL (2014a), Alternative fuels for shipping, by C. Chryssakis, O. Balland, H.A. Tvete, A. Brandsæter, DNV-GL strategic research and innovation position paper 1-2014.
DNV GL (2014b), AIS ship movement data: creating a bird’s‐eye view on shipping, Maritime white paper,
2014.

DNV GL – Report No. 2018-0260, Rev. 1 – www.dnvgl.com Page 33
DNV (2012), Identifying and overcoming Barriers of the implementation of emission reduction measures in
shipping, prepared in the Low carbon shipping project, DNV rep. no 2010‐1800.
Ecofys (2015), Potential for Shore side electricity in Europe http://www.ecofys.com/files/files/ecofys-2014-potential-for-shore-side-electricity-in-europe.pdf
Eide M., Longva T., and Endresen Ø. (2017), Navigating a low-carbon future, prepared for the Norwegian Shipowners’ Association, rep. no. 2017-0205. https://www.rederi.no/en/DownloadFile/?file=176270
Eide, M.S., Chryssakis, C., and Endresen, Ø., CO2 abatement potential towards 2050 for shipping including alternative fuels, Carbon Management, June, Vol. 4, No. 3, Pages 275-289, 2013.
Eide, M., Longva, T., Hoffmann, P., Endresen, Ø., Dalsøren, S. Future cost scenarios for reduction of ship CO2 emissions (2011), Maritime Policy & Management, 38:1, 11-37, 2011.
Endresen, Ø., Sørgård E., Sundet J. K. , Dalsøren S. B., Isaksen I. S. A., Berglen T. F., and Gravir G., Emission from international sea transportation and environmental impact, Journal of Geophysical Research, 108 (D17), 4560, doi:10.1029/2002JD002898, 2003.
Endresen Ø., T. Longva and M. Eide, Modelling past, present and future ship emissions – uncertainties in estimates, The European Environment Agency (EEA) conference, Holmenkollen, Norway, 5 Nov 2007.
EMEP/EEA air pollution emission inventory guidebook, Carlo Trozzi, Riccardo De Laurenis, 2016.
Gilbert P., et al (2018), Assessment of full life-cycle emissions of alternative shipping fuels, Journal of Cleaner Production, Volume 172, 20 January 2018, Pages 855-866. https://www.sciencedirect.com/science/article/pii/S0959652617324721
Green Coastal Shipping Programme (2016), Charting a course for green coastal shipping, Published by the Green Coastal Shipping Programme ‐ a collaborative project between Norwegian government authorities and the private sector.
Hansson et al (2016), The potential role of electro-fuels as marine fuel: A cost-effective option for the future shipping sector, Shipping in Changing climates (SCC), Newcastle, 10-11 Nov 2016. http://publications.lib.chalmers.se/records/fulltext/245468/local_245468.pdf
Hansson J., Grahn M., and Månsson S. (2017), Assessment of the possibilities for selected alternative fuels for the maritime sector, Conference proceedings, Shipping in Changing Climates (SCC), London, Sept 2017, http://publications.lib.chalmers.se/records/fulltext/254514/local_254514.pdf
ICCT (International Council on Clean transportation) (2017a), Black carbon emissions and fuel use in global shipping, 2015, By B. Comer, N. Olmer, X. Mao, B. Roy, and D. Rutherford, Published: 2017.12.15, https://www.theicct.org/publications/black-carbon-emissions-global-shipping-2015
ICCT (International Council on Clean transportation) (2017b), Greenhouse gas emissions from global shipping, 2013–2015., by N. Olmer, B. Comer, B. Roy, X. Mao, and D. Rutherford, published: 2017.10.17, https://www.theicct.org/publications/GHG-emissions-global-shipping-2013-2015
IMO, 2011, Reduction of GHG emissions from ships, Marginal Abatement Cost and Cost Effectiveness of Energy-efficiency measures. MEPC 62/INF.7
Jacobs T. (2014), Demonstration of hug filtersystems nauticlean SCR/DPF system on a marine vessel, Submitted to: South Coast Air Quality Management District 21865 Copley Drive Diamond Bar, CA 91765-4178, Revision Issue: July 29, 2014.

DNV GL – Report No. 2018-0260, Rev. 1 – www.dnvgl.com Page 34
https://www.arb.ca.gov/msprog/aqip/demo/demo%20final%20reports/final_report_hug_scr_dpf_072914.pdf
Jalkanen, J.-P., Brink, A., Kalli, J., Pettersson, H., Kukkonen, J., and Stipa, T.: A modelling system for the exhaust emissions of marine traffic and its application in the Baltic Sea area, Atmos. Chem. Phys., 9, 9209-9223, doi:10.5194/acp-9-9209-2009, 2009.
Johansson L., Jalkanen J.-P., Kukkonen J. (2017), Global assessment of shipping emissions in 2015 on a high spatial and temporal resolution, Atmospheric Environment, Volume 167, October 2017, Pages 403-415. https://www.sciencedirect.com/science/article/pii/S1352231017305563?dgcid=raven_sd_aip_email
Leinonen, J., (2016), Literature review regarding SCR engine integration and particulate abatement, Hercules -2 deliverable, Horizon 2020, June 2016, http://www.hercules-2.com/sites/default/files/pub/634135_Literature%20review%20regarding%20SCR%20engine%20integration%20and%20particulate%20abatement.pdf
Lindstad H. and Eskeland, G.S. (2015): Low carbon maritime transport: How speed, size and slenderness amounts to substantial capital energy substitution, Transportation Research Part D 41, 2015, 244–256.https://brage.bibsys.no/xmlui/bitstream/id/382147/Low+carbon+maritime+transport+-+How+speed+size+and+Slenderness+amounts+to+substantial+capital+for+energy+subsitution.pdf
Li C., Borken-Kleefeld J., et al (2017), Decadal evolution of ship emissions in China from 2004 to 2013 by using an integrated AIS-based approach and projection to 2040, Atmos. Chem. Phys. Discuss., https://doi.org/10.5194/acp-2017-743, in review, 2017.
Liu H., Fu M.L., et al (2016), Health and climate impacts of ocean-going vessels in East Asia. Nature climate change, doi: 10.1038/NCLIMATE3083.
Longva, T. (2011): A New Queuing Policy in Ports, Proceedings of MTEC2011, 13-15 April 2011, Singapore.
Makoveyenko V. (2015), Investigation of gaseous ammonia for NOx control by SCR on an experimental basis, Master Thesis in Energy Technology, University of Bergen, August 2015
http://bora.uib.no/bitstream/handle/1956/12780/148690005.pdf?sequence=1
Mjelde, A., Martinsen K., Eide M., Endresen Ø . (2014a), Environmental accounting for Arctic shipping – A
framework building on ship tracking data from satellites, Marine Pollution Bulletin 87 (2014) 22–28.
Månsson S. (2017), Prospects for renewable marine fuels: a multi-criteria decision analysis of alternative fuels for the maritime sector, master’s thesis, Chalmers university of technology, Gothenburg, Sweden 2017, http://www.nordicenergy.org/wp-content/uploads/2017/06/Multi_Criteria_Analysis_of_Alternative_Fuels_for_The_Maritime_Sector_StinaMånsson.pdf
OECD (2014), Shipping emissions in ports, Discussion paper no. 2014-20. https://www.itf-oecd.org/shipping-emissions-ports
OECD (2018a), Economic Outlook for Southeast Asia, China and India 2018, fostering growth through digitalisation, http://www.oecd.org/dev/asia-pacific/SAEO2018_Overview.pdf
OECD (2018b), Decarbonising Maritime Transport by 2035, 26 March 2018. https://www.itf-oecd.org/sites/default/files/docs/decarbonising-maritime-transport.pdf
DNV GL – Report No. 2018-0260, Rev. 1 – www.dnvgl.com Page 35
OECD (2018c), Decarbonising Maritime Transport, Case-Specific Policy Analysis, 26 March 2018, https://www.itf-oecd.org/decarbonising-maritime-transport
OECD (2010), Globalisation, Transport and the Environment, 2010. http://www.oecd.org/env/greening-transport/globalisationtransportandtheenvironment2010.htm
NRDC (2017), Incentive schemes for promoting green shipping, Discussion paper, June 2017 https://www.nrdc.org/sites/default/files/incentive-schemes-promoting-green-shipping-ip.pdf
Pitana, T, Kobayashi, E. ; Wakabayashi, N., Estimation of exhaust emissions of marine traffic using Automatic Identification System data (case study: Madura Strait area, Indonesia), 2010.
Rehmatulla et al (2015), The diffusion of energy efficiency technologies in shipping, Conference: Shipping in Changing Climates Conference 2015. http://www.lowcarbonshipping.co.uk/files/Ben_Howett/SCC2015/THE_DIFFUSION_OF_ENERGY_EFFICIENCY_TECHNOLOGIES_IN_SHIPPING.pdf
Rehmatulla N. & Smith T. (2015). Barriers to energy efficiency in shipping: A triangulated approach to investigate the principal agent problem, Volume 84, September 2015, Pages 44-57 http://www.sciencedirect.com/science/article/pii/S030142151500169X
SANDIA REPORT SAND2017-12665, Practical Application Limits of Fuel Cells and Batteries for Zero Emission Vessels, November, 2017.
Smith T., et al (2014), Third IMO GHG Study 2014; IMO London, UK, June 2014.
Smith, T., et al (2016), CO2 emissions from international shipping. Possible reduction targets and their associated pathways. Prepared by UMAS, October 2016, London.
Tournadre, J. (2014), Anthropogenic pressure on the open ocean: The growth of ship traffic revealed by altimeter data analysis, Geophys. Res. Lett., 41, 7924–7932, doi:10.1002/2014GL061786. https://agupubs.onlinelibrary.wiley.com/doi/epdf/10.1002/2014GL061786
Traut M. et al (2013), Monitoring of shipping emissions via AIS data? Certainly, Low Carbon shipping conference, London 2013. http://www.lowcarbonshipping.co.uk/files/ucl_admin/LCS%202013/Traut_et_al.pdf
UNCTAD (2016), Review of Maritime Transport, UN, New York, ISBN 978-92-1-112904-5
Wartsila (2010), Wartsila technical journal 02.2010. https://www.itf-oecd.org/sites/default/files/docs/decarbonising-maritime-transport.pdf
Winnes H., et al (2015), Reducing GHG emissions from ships in port areas, Vol. 17, Dec. 2015, Pages 73‐82
https://www.sciencedirect.com/science/article/pii/S2210539515000590
Winther, M., Christensen, J.H., Plejdrup, M.S., Ravn, E.S., Eriksson, Ó.F., Kristensen, H.O. (2014), Emission
inventories for ships in the Arctic based on satellite sampled AIS data, Atmospheric Environment, doi:
10.1016/j.atmosenv.2014.03.006.
Winther M., Christensen J. H, Angelidis I., and Sonne Ravn E. S. (2017), Emissions from shipping in the arctic from 2012-2016 and emission projections for 2020, 2030 and 2050, Scientific Report from DCE – Danish Centre for Environment and Energy, Aarhus University, No. 252 2017, http://dce2.au.dk/pub/SR252.pdf

DNV GL – Report No. 2018-0260, Rev. 1 – www.dnvgl.com Page 36
Zanne et al (2013), Environmental and economic benefits of slow steaming, Trans. Marit.sci 2013; 02:123-127. http://hrcak.srce.hr/file/161552
Yin Y., et al (2017), Reviwe of exsiting emission account models in the maritime Industry. Meeting the Energy Demands of Emerging Economies, 40th IAEE International Conference, 2017, Singapore. http://www.iaee.org/iaee2017/submissions/OnlineProceedings/IAEE2017%20Review%20of%20Emission%20Accounting%20Models%20in%20the%20Maritime%20Industry_final.pdf

DNV GL – Report No. 2018-0260, Rev. 1 – www.dnvgl.com Page 37
APPENDIX A METHODOLOGY, AIS BASED MODELLING OF SHIP EMISSIONS This section give an overview of the AIS-based software tool established by DNV GLs for modelling of fuel consumption, emission and abatement potentials for the shipping industry.
DNV GL has access to global data from the Automatic Identification System (AIS), for the period 2013 to date. The AIS data provide a detailed and high-resolution overview of all ship movements, where current sailing speeds, operating patterns, sailed distances (nautical miles) and time spent in areas are identifiable for each identified ship (those having the AIS system installed). The AIS transponder is mandatory for almost all ships above 300 gross tons, which automatically transmits a unique ship identity code, a precise position reference and the ship’s heading and speed down to seconds’ intervals. The AIS system is also used by many smaller vessels, and these ships will be included in the modelling.
The information from the AIS system is merged with technical databases for detailed information on the individual ships, such as installed power on main and auxiliary engines, machinery configurations, ship design speed, tonnage, etc. The two data sources together with several supporting data tables form the basis for the AIS-based environmental accounting system for ships, as outlined in
Figure A-1. The model is used to calculate engine load profile, fuel consumption, emissions and operational characteristics for main engines, auxiliary engines and boilers for each individual AIS registered ship position. The AIS-based modelling offers great potentials for performing in-depth studies and aggregation of results, e.g. in time periods, for geographical areas, specific ship types and size segments, etc.
The emission components covered in this study is CO2, NOx, Sox and particulate matters (PM10 and PM2.5) and the emission factors denote the amount of pollutant as function of the fuel consumption (kg pollutant per tonne of fuel). The following factors form the basis for the emissions calculations:
• Specific fuel consumption for main and auxiliary engines for different types and size categories of ships is based on the 2009 IMO GHG study (Buhaug et al, 2009), as used in havbase.no.
• Calculation of CO2 is based on standard factors for Marine Distillate Fuel and HFO, as used in havbase.no.
• Calculation of NOx emissions is based on standard factors for different types and size categories of ships based on EIAPP values (weighted values) for relevant machinery, as used in havbase.no.
• SOx and particulate matter are based on emission factors for world average sulphur content in marine distillates and HFO, where distillates have 12.6 kg SOx/ton fuel (0.63%S) and HFO 51.6 kg SOx/ton fuel (2.58%S) (EMEP/EEA, 2016).
• PM10 and PM2.5 differs for marine distillates and HFO. For marine distillates, the emissions factors are 1.5 and 1.4 kg/ton fuel respectively, while the corresponding emission factors for HFO are 6.2 and 5.6 kg/ton fuel (EMEP/EEA, 2016).

DNV GL – Report No. 2018-0260, Rev. 1 – www.dnvgl.com Page 38
Figure A-1: Framework for AIS-based environmental accounting and abatement modelling (Mjelde et al, 2014; DNV GL, 2014b)
The AIS-based environmental accounting model has been established in cooperation with the Norwegian Coastal Administration (NCA), where results for Norwegian waters are typically aggregated for selected ship types and size segments and presented in the NCA owned web portal havbase.no.
Additionally, DNV GL incorporate information on abatement technologies for estimating effects of introducing alternative fuels and emission abatement technologies. DNV GL has its own CO2 database for different ship types, covering costs and emission reduction potential for a large number of measures. DNV GL has recently also provided IMO with an interactive web tool for assessing and screening of CO2 measures (IMO, MEPC 69/INF. 18).31 DNV GL has also an in-house alternative fuel portal, the LNGi portal32, which is a unique LNG intelligence portal established by DNV GL for supporting and accelerating the uptake of LNG as fuel. With the CO2 abatement database and alternative fuel portal as input, it is possible to calculate mitigation potentials and marginal abatement cost (MAC) curves for ships. The use of alternative fuels is a particularly interesting measure, since they can contribute to substantial emissions reductions. The abatement module is using AIS-data for identifying ship performances and modelling of ship emissions and mitigation potentials (e.g. Eide at al, 2013; Mjelde et al, 2014; DNV GL, 2016a; DNV GL, 2017).
31 IMO: http://www.imo.org/en/OurWork/Environment/PollutionPrevention/AirPollution/Pages/Computer-based-model-to-appraise-the-technical-
and-operational-energy-efficiency-measures-for-ships.aspx 32 LNGi: https://www.dnvgl.com/maritime/mydnvgl-service-overview/lng-intelligence-lngi/index.html
AIS Ship ID, Positions and time stamps
Ship register Ship ID, Main- & Auxiliary engine power, service
speed, tonnage & type
Supporting Data Emission factors, Specific fuel oil
consumption, fuel type data
Accounting Model
Inventory Emissions, Discharges, Fuel
carriage etc. Abatement
options
Annual
updates

DNV GL – Report No. 2018-0260, Rev. 1 – www.dnvgl.com Page 39
Uncertainties
When interpreting the results one should keep in mind that the inventories presented is based on AIS modelling for the ship types tracked. Uncertainty in total fuel consumption can be divided into:
- Propulsion of the ship: AIS-based fuel consumption modelling for propulsion machinery performed according to the "Cubic Rule" method utilizes knowledge of the ship's design speed and observed speed from the AIS system. This means that we can calculate relatively accurately the load on the main engine, and hence the ship's fuel consumption.
- Onboard energy use: Uncertainty in total fuel consumption will be linked to fuel consumption for auxiliary engines and boiler, where AIS cannot be used for other than indicating operating hours. Separate calculations are made for each individual ship at sea and in port, based on AIS data and assumed the operational practises of the auxiliary engines and boilers.
For ships analysed, the uncertainty is typically with a 5-10% margin of error compared to reported consumption (fleet based estimate).


About DNV GL Driven by our purpose of safeguarding life, property and the environment, DNV GL enables organizations to advance the safety and sustainability of their business. We provide classification and technical assurance along with software and independent expert advisory services to the maritime, oil & gas and energy industries. We also provide certification services to customers across a wide range of industries. Operating in more than 100 countries, our professionals are dedicated to helping our customers make the world safer, smarter and greener.