air data and surface pressure measurement for …
TRANSCRIPT

AIR DATA AND SURFACE PRESSURE MEASUREMENTFOR HYPERSONIC VEHICLES
by
BRYAN H. KANG
S.B., University of Southern California(1987)
SUBMITTED IN PARTIAL FULFILLMENTOF THE REQUIREMENTS FOR THE
DEGREE OF
MASTER OF SCIENCE INAERONAUTICS AND ASTRONAUTICS
at the
MASSACHUSETTS INSTITUTE OF TECHNOLOGYMay 1989
© Massachusetts Institute of Technology 1989/ -9
Signature of Author
Certified by-
D artndt of Aeronati-s and AstronauticsMav 12, 1989
Associate Professor R. John HansmanThesis Supervisor, Department ofS/ Aeronautics and Astronautics
Accepted by--. -ProfessrHXyold Y. Wachman
owrP Graduate Cartetme Graduate ComitteeOF TECHNOLOGy
\WITHORAWNJUN 07 1989 MI.T.UAI 3 LIBRARIES
Aero

AIR DATA AND SURFACE PRESSURE MEASUREMENTFOR HYPERSONIC VEHICLES
by
BRYAN H. KANG
Submitted to the Department of Aeronautics and Astronauticson May 12,1989 in partial fulfillment of the the
requirements for the degree of Master of Sciencein Aeronautics and Astronautics
ABSTRACT
The air data and propulsion state measurement requirements for advanced air breathinghypersonic vehicles were estimated based on anticipated trajectories and vehicleconfigurations. Stringent requirements result from the harsh thermal environment in whichthe sensors must operate and interaction between the flight control and propulsion controlsystems. Flow direction measurement is critical for high speed air-breathing engines suchas the scramjet. Based on prior hypersonic air data systems on the X-15, SR-71, and theSpace Shuttle, surface pressure based measurement systems such as the Shuttle Entry AirData System (SEADS) appears to be the most promising candidates for advancedhypersonic vehicles. A SEADS-like forebody pressure distribution measurement for airdata system combined with an inlet surface pressure array for active inlet control isconsidered to be the most viable technology. Due to stringent requirements on the air dataand inlet control parameters, as well as the need to locate the surface pressure sensors inregions of extreme thermal load, rigorous pressure transducer requirements (0.1% accuracyat 30000 F orifice temperature) are considered necessary. Existing technology highprecision pressure transducers were found to require active or passive cooling in ahypersonic air data system.
Thesis Supervisor: R.John HansmanAssociate ProfessorDept. of Aeronautics & Astronautics

ACKNOWLEDGMENTS
The author wishes to thank Prof. R.J. Hansman for valuable advice. Also, Prof.
Martinez Sanchez, Lewis. M., P. Gibson from NASA Langley provided valuable
information for this work. Finally the author wishes to thank his parent and peers at room
442 for their support. This work was supported by the Charles Stark Draper Laboratory.

TABLE OF CONTENTS
ABSTRACT
ACKNOWLEDGEMENTS
TABLE OF CONTENTS
1.0 INTRODUCTION
1.1 Instrumentation Requirements
1.2 Overview
2.0 HISTORY OF HYPERSONIC PRESSURE MEASUREMENT
2.1 X-15 Air Data System2.1.1 Sensor Problems Encountered During X-15
Operation
2.2 Shuttle Air Data System
2.3 SR-712.3.12.3.2
SR-71 Air Data SystemSR-71 Propulsion Control System
3.0 PROJECTED SENSOR ENVIRONMENT
3.1 Vehicle Description
3.2 Potential Configurations
3.3 Flight Envelope
3.4 Sensor Environment
4.0 THE INSTRUMENTATION REQUIREMENTSIMPOSED BY THE FLIGHT AND PROPULSIONCONTROL SYSTEM
4.1 Overview
4.2 Flight Control System
'38
42
42

4.3 Propulsion System 43
4.3.1 Sensitivity of Scramjet Combustionto Thermodynamic Flow Conditions 44
4.3.2 Sensitivity of Scramjet Combustion toVehicle Attitude and Trajectory 46
4.4 Propulsion Control System 49
5.0 PRELIMINARY AIR DATA MEASUREMENT SPECIFICATIONS 55
5.1 Angle of Attack 55
5.2 Side Slip Angle 58
5.3 Mach number 61
5.4 Dynamic Pressure 62
5.5 Static Pressure and Altitude 65
5.6 Inlet Pressure 65
5.7 Inlet Temperature 66
5.8 Shock Location 66
6.0 AIR DATA SENSING TECHNIQUES 68
6.1 Forebody Surface Pressure Measurement 706.1.1 Flow Modeling 726.1.2 Numerical Techniques 72
6.2 Propulsion State Sensing Techniques 73
7.0 PRESSURE MEASUREMENT TECHNIQUES 75
7.1 Pressure Sensing Orifice Considerations 757.1.1 Sources of Error 77
8.0 SENSOR SYSTEM THERMAL CONSIDERATIONS 83
8.1 Sensor Installation and Design Rrequirements 88
9.0 PRESSURE TRANSDUCER EVALUATION 90
9.1 Performance Requirements 90
9.2 Applicability of Current Technology Sensors 92

8.0 CONCLUSION
REFERENCES

1.0 INTRODUCTION
In this thesis, surface pressure measurement concepts and requirements for
hypersonic vehicle instrumentation system are discussed based on functional requirements
of the vehicle flight and propulsion control systems.
In the 1950's and 1960's, extensive hypersonic research was pursued to solve
problems associated with ballistic reentry vehicles and high speed aircraft. The high
supersonic and hypersonic flight regime was explored with research vehicles such as the
X-15. Also several configurations of ramjet mounted winged missiles were tested to study
the feasibility of the airbreathing engines. 11 These vehicles were limited to high supersonic
speed (M < 3.5) because of the inherent limitation of ramjet combustion and the limitations
of high temperature materials. Hypersonic flight vehicle research was then discontinued
because the technology of the 60's could not provide efficient, operational propulsion
systems for hypersonic vehicles, and the practical application for such high speed vehicles
was not clear since the reliability of rocket systems was preferred over the potential
efficiency of airbreathing hypersonic flight.
Hypersonic flight vehicle research was partially revived to study issues associated
with the Space Shuttle reentry. However airbreathing propulsion was not a thrust of this
effort.
In recent years, enthusiasm for hypersonic flight research has been revived by the
promise of a fully reusable, horizontal take off, single stage to orbit flight vehicle with
airbreathing engines. This vehicle (National Aero-Space Plane NASP) would potentially be
very efficient. 8 Full reusability and single stage to orbit capability provides saving in
spacecraft construction costs and horizontal takeoff capability eliminates complicated

launch facilities. The airbreathing propulsion system provide the most significant
advantage of this vehicle configuration. Using atmospheric oxygen significantly reduces
oxidizer weights when compared to the rocket propulsion system with similar payload
capability.
The design of this vehicle is, however, a difficult task. The technical requirements
are a challenge to every aspect of current technology. Advances in high speed
aerothermodynamics, high temperature material science, supersonic combustion propulsion
system, and high temperature instrumentation techniques are necessary for the successful
development of an airbreathing hypersonic vehicle.
1.1 INSTRUMENTATION REQUIREMENTS
Airbreathing hypersonic vehicle configurations pose stringent requirements on the
instrumentation system for both flight and propulsion control systems. The
instrumentation system functions as the nervous system to connect the propulsion and
flight control system, as well as sending information to controllers, safety devices, and
crew displays. In flight control system, air data parameters such as angle of attack, side
slip angle, flight Mach number, and altitude are needed to stabilize the vehicle and follow
desired trajectory. The flow direction parameters such as angle of attack and side slip
would be used to supplement the Inertial Navigation System (INS) and flight control
system. Perturbation in the vehicle attitude would result in tremendous error rate at high
Mach numbers and deviation from the desired trajectory. Also flight Mach number and
altitude are needed by the guidance system to remain within the airbreathing (Mach number
, altitude) corridor. The measurement of these air data parameters is difficult due to high
thermal loads which result from high Mach number flight.

Past experience with the supersonic turbojet and the ramjet engines suggest that
active control of the airbreathing engines is essential for the efficient engine operation and
the vehicle safety at high speed. Hypersonic airbreathing engines such as ramjets or
scramjets pose stringent requirements on the observability of inlet flow quality. Diffuser
pulsing and upstream flow instabilities are difficult to control in high speed combustion and
often cause the engine to unstart. Unstart of an airbreathing engine occurs when pressure
builds inside the combustor and results in flame out. A strong shock wave formed on front
of the unstarted engine causes tremendous drag. For example, after several SR-71
reconnaissance aircraft were lost due to engine unstart, control modifications were
implemented to cut off the second engine in the event of an engine unstart. In the case of a
single stage airbreathing hypersonic vehicle, unstart would result in formation of strong
shock in front of the airbreathing engine, and the large drag on the engine would likely
cause structural failure. In addition, excessive pitching moment caused by the high drag
may result in uncontrollable pitch instability and loss of the vehicle. Consequently, fault
tolerant control of the air-breathing engine is critical.
In order to control the air-breathing engines, propulsion parameters such as inlet
shock geometry, inlet pressure and temperature field, and combustor flow Mach numbers
are needed. The propulsion control system would require high bandwidth sensor system,
based on the study of the SR-71 pressure sensor bandwidth requirement for the normal
shock location detection.6 The propulsion state measurement is difficult due to the
extremely hostile, high temperature sensor environment.
Measurement of external air data parameters are needed for the propulsion system
as well as the flight control system. Changes in angle of attack and side slip will cause
drastic changes in inlet flow field. Slight perturbations in shock geometry, velocity and

pressure distribution inside the inlet from nominal design conditions can significantly
reduce the combustion efficiency. The motion of the vehicle perturbs the flow field near
the inlet and directly influences the combustion efficiency and combustion stability.
Consequently, the measurement of air data parameters, including the air breathing engine
inlet parameters, are essential to the propulsion control system. Therefore, the propulsion
and flight control system may require simultaneous control.
The air data measurement requirements for hypersonic vehicles will provide unique
difficulties due to the rigorous flight envelope. Due to the extreme heating rates,
conventional intrusive probe instrumentation techniques are not applicable at hypersonic
velocities because the intrusive probe structure would heat up and burn or melt. However,
in principle, most of the air data parameters can be extracted from surface pressure
measurements. Also, the propulsion state can be extracted from inlet surface pressure
measurements. Surface pressure measurement techniques are nonintrusive as compared
with protruding probe techniques. Surface pressure measurement technique is also
thought to be more reliable than proposed optical techniques.
Surface pressure measurement technique has an inherent limitation which is a trade
off between the pressure transducer operation temperature and the sensor system
bandwidth. If the sensor system bandwidth requirement is high, then the pressure
transducer should be placed close to the high temperature surface. The bandwidth and
precision requirements on the sensor system will determine the pressure transducer thermal
and accuracy requirements.

10
1.2 OVERVIEW
Prior experience in hypersonic air data and propulsion sensing is reviewed for the
X-15, SR-71, and Shuttle Orbiter. Potential hypersonic flight envelopes, environmental
conditions and vehicle configurations are presented to define the context of the
measurement systems. The functional requirements for both flight control and propulsion
control systems are defined. These functional requirements are used to derive the air data
measurement specifications . The influence of air data parameters on both the flight control
and propulsion control system is described. A preliminary set of specifications for required
air data and propulsion parameters is developed. General air data measurement techniques
are discussed. Measurement techniques which provide the required parameters through
surface pressure measurements are described and the implications for pressure sensor
performance are discussed. Finally the applicability of current pressure sensor technology
is evaluated and factors such as active sensor cooling are considered.
10

11
2.0 HISTORY OF HYPERSONIC PRESSURE MEASUREMENT
In the process of analyzing the air data sensing requirements for single stage air
breathing hypersonic vehicle such as NASP, air data system of prior supersonic and
hypersonic vehicles were reviewed. The SR-71,the X-15, and the Space Shuttle Orbiter
have some analogous features to the single stage to orbit airbreathing hypersonic vehicle
even though their primary mission and flight envelopes are different. The axisymmetric.
inlet sensors of the SR-71, the ball nose air data sensor of X- 15, and the Shuttle from the
Air Data System (ADS) are considered as technical precursors to the air data and propulsion
instrumentation systems for future hypersonic vehicles.
2.1 X-15
The X-15 rocket propelled hypersonic research aircraft had typical missions of
powered boost from 40Kft to about 200Kft with a ballistic coast to a maximum height of
350Kft. Reentry was accomplished by high angle of attack flight to dissipate energy while
keeping the skin temperature within safe limits(12000 F). The hypersonic flight segment
typically lasted 10 to 15 minutes.
For flight Mach numbers less than 3, the X-15 used a conventional pitot static nose
boom with angle of attack and angle of side slip flow vanes as shown in Fig. 2.1.1. The
X-15 experienced air data sensing problems at high Mach numbers (M > 3) due to high
thermal load to the conventional vane-boom sensor. Also at high Mach numbers and at low
dynamic pressures, the operational limits of the nose boom sensor are governed by the
increase in vane position error due to a decrease in accuracy of the nose boom air flow
direction measurements. The thermal constrains to the air data system was solved by "Ball
Nose" air data sensor (Fig. 2.1.2). The sphere was housed in the end of the conic nose. It

Nose boom
P
Enlarged section ofpitot-static tube end
Fig 2.1.1
Static orifices
vane
Schematic drawing of the X-15 nose-boompitot-static tube with flow-direction vanes
taken from ref. 4
12
T .r____ __ _-- A --- 1-- I& .... __ t

i
Fig 2.1.2 Schematic drawing of the X-15 ball nose sensor
taken from ref. 3 and 4
13
Ball nose
.. !_2 __
p- STpivc
a - S'piv(
Diffeipressi
C··nrfnrra ~:,~, C·CA~U
-- -I

14
was rotated by a hydraulic actuator to face the streamwise direction by nulling the
differential pressure between vertical and lateral pressure sensor pairs. The alignment
angles of the sphere with respect to the aircraft reference axis indicated the angles of attack
and of side slip. As shown in Fig. 2.1.2, the rear portion of the sphere contained the
mechanical and electrical components. These components, along with the sphere, were
cooled by vaporized liquid nitrogen. In order to test the thermal load and thermal transient
on the ball nose sensor,a F-100 exhaust nozzle was placed in front of the X-15, and the
ball nose sensor was exposed to high temperature up to 12000 F by hot after burner flame.
The X-15 structure and associated components behind stagnation points were capable of
withstanding temperatures of approximately 12000 F. The static pressure sensor was flush
mounted on the side of the conic nose.
In Table 1, the achieved performance of the X-15 ball nose sensor system is
summarized.3 ,4,5 Altitude was measured by ground tracking radar, and supplemented with
Inertial Navigation System (INS) data. A 1% (1y) accuracy was reported. Dynamic
pressure was computed from the measurements of total pressure, static pressure, and Mach
number, obtained from the Ball nose sensors. An accuracy of 5 - 10% was reported.
Higher accuracy in dynamic pressure is reported at high Mach number where the
uncertainties in static pressure and Mach number do not contribute significantly. The
accuracy in angle of attack and side slip angle was ± 0.250 as measured by the Ball nose
system. Accuracy in angle of attack and side slip decreases as the dynamic pressure
decreases. An accuracy of 1% was reported in the Mach number measurement with the
pitot probe type sensor.
14

15
AIR DATA MEASUREMENT PERFORMANCE
X-15 BALL NOSE SENSOR
Range
Angle of Attack
Angle of Side Slide
Mach Number
Dynamic Pressure
Total Pressure
Static Pressure
-50 +260+260 +380
±200
0-7
q00
Poo
20 - 2500psf
20 - 3000psf
0 - 2100psf
+0.250
+0.250
1%
1.67% - 3.3%
0.33% - 0.67%
0 - 350kft +1% (INS)
Table 1
15
Performance
Altitude

16
2.1.1 SENSOR PROBLEMS ENCOUNTERED DURING X-15
OPERATION
The flow direction parameters (a•,3) were defined as the free stream flow direction
with respect to the aircraft reference axis. Static alignment of the ball nose sensor with
respect to the aircraft reference axis needed to be nulled out within order of magnitude
smaller than the angular resolution of the sensor. Since the sensor was heavily dependent
on moving mechanical parts such as the servo actuator, position sensor, and rotating
sphere, the ball nose sensor was more susceptible to component failures than other air data
systems. The servo with negative feedback often caused 4Hz and 12Hz limit cycle due to
it's rate limited servomechanism. At low dynamic pressures on the order of 40PSF and
less with high angle of attack of 260 and higher, the collar of the spherical sensor housing
caused flow interference, consequently a significant amount of error appeared in angle of
attack measurement. During subsonic operation, up wash effects on the sensor caused the
error in angle of attack and angle of side slip measurements. The fuselage static sensor is
susceptible to large position error and sensitive to variations in angle of attack for Mach
number greater than one; consequently, altitude and Mach number measurement was
difficult.
2.2 SHUTTLE AIR DATA SYSTEM
The flight envelope of Space Shuttle , which consists of variations in Mach number
between 0.3 and 27, angle of attack from -50 to 450, and peak stagnation temperature up to
20000 F is analogous to the reentry phase of proposed airbreathing hypersonic vehicles.
Three different types of air data system were used for the Space Shuttle. In the boost
phase, a conventional pitot tube was mounted on top of the external fuel tank. During the
16

17
reentry, the fuselage mounted pitot probe is deployed at Mach number less than 3,and used
for approach and landing. The Shuttle Entry Air Data System (SEADS) is designed for the
reentry phase of the flight and used once on the Columbia Space Shuttle Orbiter. The
SEADS was proposed as an air data system covering hypersonic flight regime. However
SEADS was capable of providing necessary air data parameters from 250 Kft to touch
down.14
The initial Space Shuttle air data system consisted of two conventional fuselage
mounted pitot differential probes shown in Fig 2.2.1.2 At Mach numbers lower than 3.5,
the probes are deployed from the side of the fuselage. The probes were prohibited to use at
higher Mach numbers due to high thermal load on the probe structure. The blunt body of
the Space Shuttle causes substantial amount of position error in the fuselage mounted pitot
probe and static pressure orifice when compared to the pitot-static boom system with the
probe located few fuselage diameters away from the nose. The fuselage mounted pitot tube
probes were calibrated by the supersonic wind tunnel tests and inflight tests to obtain the
empirical calibration coefficients to account for the position error and the pressure jump
during transonic flight.
The Shuttle Entry Air Data System (SEADS) is shown in Fig. 2.2.2.1 The SEADS
employed a cruciform array of 14 pressure transducers on the nose cap and 6 static orifices
are located aft of the nose cap. The SEADS is based on the flush orifice concept. The nose
of the Shuttle Orbiter functions as both pitot-static probe and flow directional sensor.
Instead of the rotating sphere of the X-15, fixed flush orifice arrays were mounted on the
forebody of the Shuttle as shown in Fig. 2.2.2. A computational technique supplemented
with wind tunnel testing was used to extract air data parameters from the pressure field
measurements. Extensive wind tunnel tests and inflight tests showed that the flush mounted
pressure sensor system can be used from subsonic speed to hypersonic speed by creating
17

SOR
PC CENTER PRESSURE (TOTAL), PTM
PL LOWER PRESSURE (a)PU UPPER PRESSURE (o)PM MEASURED STATIC PRESSUREPSM
NOTE: PROBES CANTED 10 DEG.NOSE DOWN RELATIVE TO FRL
The Space Shuttle fuselage mounted pitot-differential probes
taken from ref 2
18
Fig 2.2.1

SEADS Orifice Configuration
taken from ref. 1
19
Nose
Static
Fig 2.2.2

20
semiempirical flow model of the forebody and change the filter parameters as Mach number
varies.
The thermal loads on the SEADS pressure transducers were relatively low due to
the Space Shuttle thermal isolation tiles. The pressure transducers are buried deep inside
the fuselage and wrapped with the thermal insulators. Due to good thermal insulation, the
transducers operated near room temperature with less than 250F increase throughout the
reentry.15
Actual performance of the SEADS system from the Columbia Space Shuttle is
unavailable at this time. In Table 2, the predicted performance of the Shuttle air data
system is summarized. 1 The performance specification is based on the high speed Wind
tunnel data.1 Based on the predicted performance, the SEADS system is capable of
providing total pressure measurement with + 0.5% uncertainty. Also, the predicted static
pressure and Mach number measurement accuracy is within ±5% uncertainty. For
supersonic speed, the predicted dynamic pressure measurement accuracy is within ± 3.3%
uncertainty. The sensor system is capable of providing flow direction parameters, angle of
attack and side slip angle, with ± 0.250 uncertainty.
20

21
AIR DATA MEASUREMENT PERFORMANCE
SHUTTLE ORBITER
RequiredAccuracy
ActualPerformance(WT Tests)
Angle of Attack
Angle of Side Slide
Mach Number
Dynamic Pressure
Total Pressure
Static Pressure
Altitude
Vertical Velocity
Free Stream Velocity
a
M
qo
Pt
Poo
h
h
Voo
-10o+450
±60
0-3.8
90 - 375 psf
0.5 -2100 psf
0.5 - 1900 psf
1 Okft-1 O0kft100kft-Orbital
0 - 600ft/s
0 - 3387ft/s
+0.660
+0.660
+5%
+3.3%
+3.3%
+1.6%
±0.984ft/s+1.64ft/s
TABLE 2
21
+0.250
±0.250
5.2%
3.3%
0.5%
5%

22
2.3 SR-71
The SR-71 uses a conventional pitot-static nose boom air data system similar to the
X-15 nose boom sensor. The most interesting instrumentation requirement came from the
propulsion control system. The SR-71 employs active inlet control and uses surface
pressure measurement to estimate the normal shock location inside the engine inlet. The
engine inlet control system provide insight of the inlet pressure measurement accuracy and
bandwidth requirements. Both air data and propulsion control systems are discussed in
next section.
2.3.1 SR-71 AIR DATA SYSTEM
The SR-71 is a Mach 3+ reconnaissance aircraft which employs a high quality
conventional pitot-boom type air data system. Because of its relatively low Mach number
operation, a conventional pitot-static boom probe is mounted on the tip of the nose. The
probe is extended a few fuselage diameters away from the nose in order to reduce the
position error caused by the fuselage. In Table 3, the conventional pitot-static probe
performance, SR-71 is summarized. 7. In general, the system provided less accurate data
during the transonic region due to the large irregular pressure jumps. Mach number is
measured with an uncertainty of ±0.012 at supersonic cruise and -0.004 at subsonic
cruise. The SR-71 which cruises at the trim angle of attack of 50, has angle of attack and
side slip uncertainties of +0.250. Angular uncertainties double during transonic flight
phases. The dynamic pressure uncertainty of + 1.5 PSF at supersonic flight increased to
+6 PSF during the subsonic flight due to the fact that the dynamic pressure is an inferred
parameter which relies on the total pressure, static pressure, and Mach number
22

23
AIR DATA MEASUREMENT PERFORMANCE
SR71
Range Performance
Angle of Attack±0.250
•a Sub/Supersonic
Transonic
Angle of Side Slide
Mach Number
Dynamic Pressure
Altitude
Free Stream Velocity
M SupersonicSubsonic
qo SupersonicSubsonic
h Sub/SupersonicTransonic
Vo SupersonicSubsonic
TABLE 3
0- 3.5
0 - 80kft
0 - 3400ft/s
23
±0.50
±0.250
±0.012+0.004
±1.5psf+6psf
±1 51ft±220ft
±1 ft/s1l.7ft/s

24
measurements. The significance of the static and Mach number uncertainties increases at
low Mach numbers. The SR-71 has a maximum ceiling of approximately 80 Kft. and the
ADS can provide the altitude data within ±150 ft during supersonic and subsonic flight.
The error in altitude increases during the transonic region to ±220 ft due to the pressure
jump effect.
The high temperature air data sensor system is needed for the SR-71 due to it's hot
structure configuration. The air data sensors are required to withstand 900 deg F heat
loads. In order to minimize the thermal effects on the air data pressure transducers, the air
data pressure transducers are installed inside the thermally stabilized instrument case and
long pneumatic lines are used to connect the pitot-static nose boom and the transducers.
2.3.2 SR-71 PROPULSION CONTROL SYSTEM
Engine control on the SR-71 is important at supersonic speed. 6 The SR-71
employed a mixed-compression supersonic inlet to decelerate the inlet flow from
supersonic to subsonic without large pressure loss (i.e. engine efficiency loss). The inlet
section is shown in Fig. 2.3.1. At normal stable condition, supersonic flow is decelerated
as it goes through several weak oblique shocks between the translating center-body and
axisymmetric inlet. When the flow decelerated to near Mach 1, it goes through a normal
shock in just aft of the throat where the cross section area is minimum. An unstarted
condition occurs when the normal shock jumps to the throat area or forward of the throat
area the pressure then builds up inside the engine and creates a strong shock wave in front
of the inlet as shown in Fig. 2.3.3. The combustion goes out and results in unstart. Such
large drag on one of the two wing mounted engines caused the aircraft to go out of control.
24

Spike bleed exitlouvers (4 locations) rt struts (4)
Forward bypass exitlouvers (3 locations
bypass)ors (24)
5-Centerbody
Shock trap tubes (32)
'-Forward bypass doors (16)
bleed (shock trap)
Transla
Fig 2.3.1 Cutaway view of the SR-71 inlet
vuIIU
shock waves
Shock system associated with mixed-compression inlet andthe inlet pressure transducer location
25
Fig 2.3.2
I l,& 61.m,,M&

26
Nominal Operation
Beginning of Unstart
1--- inlet throatUnstarted Condition
Fig. 2.3.3
26
x >00.. 1=2I
r
I I

27
The SR-71 employed an active compression cone, flow dumping bypass door, and
inlet surface pressure sensors to control the shock position inside the axisymmetric inlet
shown in Fig. 2.3.1. A compression cone inside the inlet moves in the streamwise
direction to keep the first shock near the critical condition which is the condition where
oblique shock is attached at external circular cowl lip and the normal shock is aft the
throat,and maximize the mass flow rate. Flow dumping bypass doors are used for high
bandwidth control of the normal shock location. The SR-71 employed pressure sensors at
aft of the throat exit to determine the normal shock position (Fig. 2.3.2). A Linear
Quadratic Gaussian Optimal Regulator scheme is used to maintain a stable shock position in
the presence of random flow disturbance and sensor noise.
The sensor specifications for the inlet control consist of the nominal operating
pressure of 5400 PSF and about 1500' F with accuracy about 0.1%. During the
supersonic cruise phase, the throat exit static pressure was 5400 PSF and the flow
disturbance measurement was 54 PSF rms. The sensor therefore had to be temperature
compensated. The measurement noise (sensor noise) must be low in order to have high
open loop gain for good DC performance. Also phase lag and time delay of the sensor
orifice should be minimized and/or the phase information should be known in order to
stabilize the control loop.
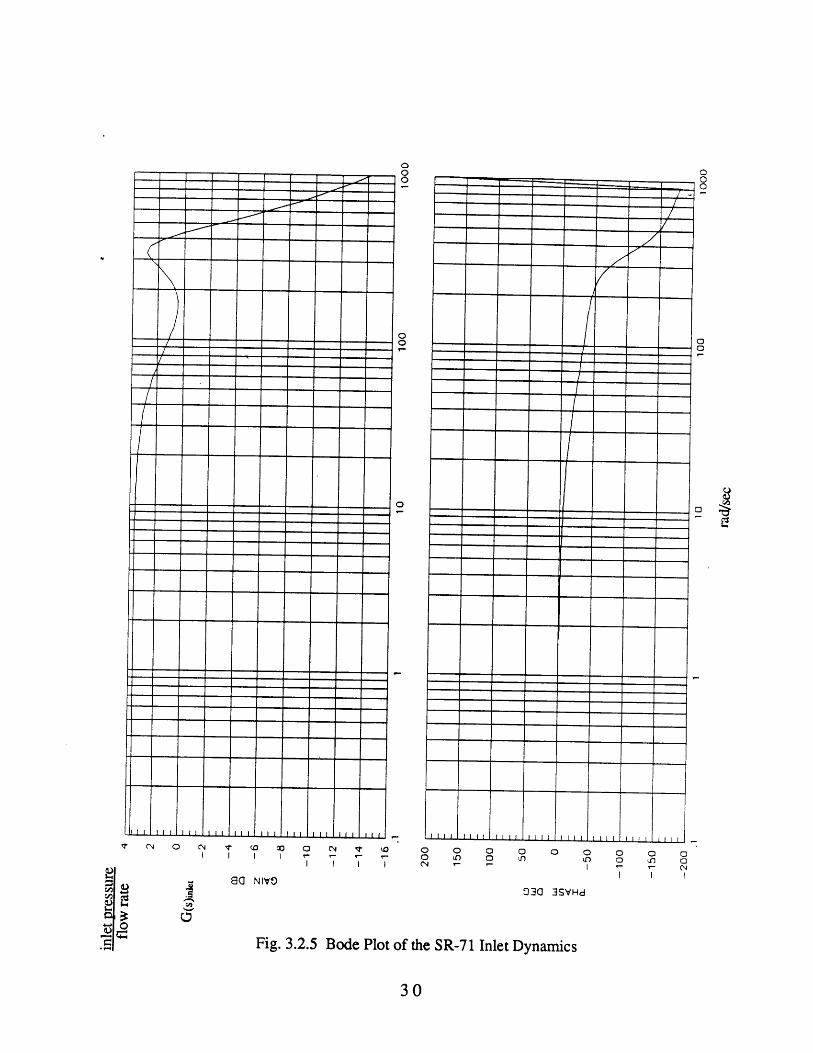
The SR-71 propulsion control system required a wide bandwidth pressure sensor
system( up to 500 Hz). 15 The pressure sensor bandwidth requirements are determined by
the inlet dynamics (G(s)inlet) and the bypass door control dynamics (G(s)bypass). The sensor
bandwidth should be much wider than the bandwidth of the controller and inlet dynamics.
The SR-71 propulsion control system block diagram is shown in Fig. 2.3.4. The bode
plot of the inlet dynamics is plotted in Fig. 2.3.5 from the data in reference 6. The inlet
dynamics are the response of throat exit static pressure with respect to the input of the
27

28
white noise
- -throat exit static pressureI
Fig. 2.3.4 SR-71 Inlet Control System
28

29
compressor face disturbance flow and the bypass door flow. The inlet dynamics have a
bandwidth of well over 80Hz. The bode plot of the bypass door dynamics (i.e. the
controller dynamics) is plotted in Fig. 2.3.6. The bypass door control dynamics are the
response of bypass door flow with respect to the bypass door command from the Kalman
filter and the compensator dynamics. The bandwidth of the controller was about 120Hz.
Usually the bandwidth of the control acutators(in this case it would be the bypass door
mechanism) is the limiting factor for the sensor bandwidth requirement, however, the SR-
71 bypass door bandwidth was about the same as the plant bandwidth. In a conservatively
rated control system, the sensor bandwidth should be 5 to 10 times the controller and plant
combined dynamics bandwidth; therefore the required sensor system bandwidth was about
500Hz.
29
I Ii
-1-
-1iiI I ~LI .LJ
~t IN C ~C~i1 0SI I I
! I
I I I IO Lf O LO
80 NIVO030 3SVHd
Fig. 3.2.5 Bode Plot of the SR-71 Inlet Dynamics
30
C
I I I
Ii
I I
-1
I
7
o ~n or r C\J
i ------- I I
--- t~-
1 ~
~ ' ' ' ' ' ' -LLI,LY
k
d4•·
r=t=I
=c~i
I I I I
C4
0o
f
B
11I I 11 I I I II III

I, 0 I1 0o • o IO 0
8 N 1
60 NIVOD
In 0 LO 0
(A
I I I"I III
O O O O O O O O O Oo 0 0 0 0 0 0 0 0 0CN " (0 a 0 (0 M
03 I SVHd030 3$'VHd
I II I I I
K
Fig. 3.2.6 Bode Plot of the SR-71 Bypass Door Dynamics
31
--~----7·--·
-LL -LL
I
F
!
I-I
I
I ýI I I I I II I I I I I I I I I I
Ct
I i
F

32
3.0 PROJECTED SENSOR ENVIRONMENT
In the process of defining the instrumentation requirements for hypersonic vehicles,
the following assumptions are made. The main flight phase of interest is assumed to be the
hypersonic cruise phase in the air-breathing engine corridor. The vehicle is assumed to
employ both the ramjet and scramjet during the cruise phase. The vehicle configurations
and the flight corridor determine the sensor environment.
The hypersonic vehicle configurations are discussed in next section based on
available information of potential NASP configurations. Also, the flight trajectory and
vehicle environment are discussed in order to define the environment in which the sensors
has to operate.
3.1 HYPERSONIC VEHICLE DESCRIPTION
Hypersonic cruising vehicles may be categorized in two different configurations,
low hypersonic Mach number (M < 6) cruising aircraft and transatmospheric vehicles.
Low hypersonic Mach number cruisers such as the "Orient Express", are proposed as a
high speed long range transport aircraft. By employing air breathing engines, which
eliminate the disadvantages of turbojet limitation and inefficiency of rocket, efficient high
speed flight would be obtained.
Another application would be the air breathing transatmospheric vehicle. There are
many proposed configurations of the transatmospheric vehicles such as the National
Aerospace Plane (NASP), Sanger, and HOTOL. The NASP(Fig. 3.1.1) is proposed as a
single stage, horizontal take off, airbreathing, transatmospheric, launch vehicle. The
Sanger is proposed as a two stage launch vehicle where a mother ship employs air
32

Fig 3.1.1 NASP
Fig 3.1.2 HOTOL
33

34
breathing engines to accelerate the second stage to a high Mach number then returns to
base. The second stage then uses rocket thrust to obtain orbital velocity. The
HOTOL(Fig. 3.1.2) is proposed as a single stage orbiter which uses special airbreathing
engines to accelerate up to Mach 5, then uses rocket engines to obtain orbital velocity.
The common elements of the above vehicles are that the hypersonic vehicles would
employ air breathing engines and fly at very high Mach numbers through atmosphere in
aircraft like configurations. The major instrumentation requirements would come from the
vehicle flight control system and the air-breathing propulsion control system.
3.2 POTENTIAL CONFIGURATIONS
A typical hypersonic cruise transatmospheric vehicle has several unique features
which result from it's rigorous functional requirements. The conceptual NASP vehicle
schematically shown in Fig. 3.2.1, which functions as both a reentry vehicle and
hypersonic cruiser, will have a highly swept and low aspect ratio wing which will be
integrated with the aircraft fuselage in a lifting body configuration. In the hypersonic flight
regime, drag is a function of frontal area, fuselage surface area, and thickness ratio square;
consequently, slender body configuration is required for efficient flight. The vehicle will
likely cruise with the airbreathing engines located under the fuselage. The slender forebody
functions as the inlet compressor and guides the flow into the airbreathing engine. Variable
inlet geometry and combustor height adjustment are highly desirable. Both ramjet and
scramjet configurations may be used. Much of the current design consideration is focused
on the thermal limitations which result from the high speed flight, and high speed flow
combustion constraints.
34

-
P. \ N Air Data Sensor Array
Fig 3.2.1 Potential Pressure Sensor Locations
35
I

36
Due to the thermal problems associated with the high Mach number flight, the
airbreathing hypersonic vehicles will likely employ non-intrusive air data sensors on the
forebody (Fig. 3.2.1). The tip of the vehicle nose is the most desirable location because
the flow direction parameters (a,p) can be measured more accurately since the errors in
flow direction, which are caused by fuselage disturbance, are minimum at the tip of the
nose. Also, total pressure measurement requires the sensor to be placed on the stagnation
point aft of the shock on the forebody. The measurement of propulsion parameters would
likely be done by the sensors located on and inside the airbreathing engine inlet as shown in
Fig. 3.2.1. For the ramjet operation, the normal shock location detection sensors would be
located aft of the throat area. For scramjet operation, the inlet shock geometry detection
sensors, inlet pressure sensors, and inlet temperature sensors would likely be placed inside
the inlet aft of the oblique shock.
3.3 FLIGHT ENVELOPE
A single stage to orbit vehicle will likely have two distinctly different flight phases,
ascent and reentry. The hypersonic vehicle will take off horizontally and accelerate to and
cruise at hypersonic velocities through the airbreathing corridor shown in Fig. 3.3.1. The
lower part of the airbreathing corridor shown in Fig. 3.3.1 is preferred for engine
efficiency however heat loads will increase at lower altitudes. In reentry, the hypersonic
vehicle will initiate deceleration at a high angle of attack in a manner similar to the shuttle
reentry trajectory shown in Fig. 3.3.1. This is followed by high altitude and terminal area
energy management maneuvers ending with a conventional runway landing. The
hypersonic cruise phases pose the most stringent requirements on the air data and
propulsion control systems due to the tight constraints on the flight and propulsion control
systems and the difficult measurement environment.
36

Mach Number25
NASP and Space Shuttle (altitude, Mach number) trajectory
37
0
0
0
000h*
101
le Entry
orridor
30
Fig 3.3.1
r)hA
10 1546 V

38
3.4 SENSOR ENVIRONMENT
As mentioned above, the desirable location for the air data sensors will be at the
stagnation region of the nose. The inlet flow sensors would likely be located on the cowl
lip region. These are likely to be the hottest region on the vehicle and the harsh
environment imposed on the surface will dictate the sensor environment.
Based on the airbreathing corridor, the hypersonic vehicle will experience dynamic
pressures of up to about 6000 PSF (3 atm) as shown in Fig. 3.4.1, however the vehicle
will likely be cruising at maximum dynamic pressure of 2000 to 4000 PSF due to structural
limitation. Stagnation temperature of up to 30000F are considered possible. The
stagnation temperature limit will be set by material thermal limitations. Also, high
integrated heat load is anticipated since the vehicle is expected to cruise hypersonic for time
periods of up to 2 hours.8
Due to the high temperatures, the stagnation regions will experience real gas effects
during most of the flight. 16 As indicated in Fig. 3.4.2, the high speed flow around the
vehicle goes through the excitational vibration and finally undergoes dissociation at M >
10. Any measurement of air data parameters based on ideal gas properties would therefore
have significant error due to real gas effect at M > 10. For example, in the hot stagnation
point, the specific heat of the real gas will be smaller than the ideal gas case. Those air data
parameters such as dynamic pressure which rely on assumed value of specific heat will
result in gross errors if the specific heat changes are not considered.
The peak external surface temperature and the integrated heat loads inside the
vehicle will dictate the sensor thermal requirements. The vehicle skin temperature is limited
38

0 10 20
Fig 3.4.1
Mach Number
Dynamic Pressure vs Mach number
39
8000
6000
4000
CLQ.
&M
o0)ECu0n 2000
30

10% 10% 90% 10%
0 5 10 15 20 25 30 35
Mach Number
Fig 3.4.2 Stagnation Point Energy Excitation Zones
40
300
000
A1*0
200
100
40
90% 10%

41
by the maximum temperature of the surface structural materials. Materials requirements
may require an active cooling to prevent thermal destruction of vehicle fuselage. The
integrated heat loads inside the vehicle will be dictated by the skin insulator materials and
the exposure time. If the vehicle uses thermal tiles on the surface similar to the Shuttle;
and long pneumatic tubes are used between the orifice and the transducers such as SEADS,
high temperature exposure would be restricted to the orifice opening and the pneumatic
lines. The thermal environment of the transducers would therefore be the vehicle internal
equilibrium temperature. On the other hand, if the vehicle has a hot structure configuration
(with or without surface cooling) and the required sensor systems are closely coupled to the
surface, the thermal loads on both the orifice and the transducer will be very high.
41

42
4.0 THE INSTRUMENTATION REQUIREMENTS IMPOSED BY
THE FLIGHT AND PROPULSION CONTROL SYSTEM
4.1 OVERVIEW
Air data measurements are needed by both the flight control system and the
propulsion control system. The air data measurement requirements can be defined by
analyzing the hypersonic vehicle flight and propulsion control requirements. The most
unusual requirements come from the fact that the propulsion control system must be closely
integrated with the flight control system because the airbreathing engines require a narrow
range of angle of attack and side slip during hypersonic cruise in order to optimize
propulsion efficiency. The air data system will function simultaneously as part of both the
flight and propulsion control systems. In the next section, the functional measurement
requirements for the flight control systems and the propulsion control systems are
described.
4.2 FLIGHT CONTROL SYSTEM
The air data parameters which are required by the Navigation, Guidance and
Control system, throughout the flight trajectory are:
1) Angle of Attack
2) Angle of Side Slip
3) Mach Number and Velocity
4) Altitude
5) Altitude Rate
6) Dynamic Pressure
42

43
The most stringent angle of attack measurement requirement comes from the
hypersonic cruise phase. Angle of attack hold and pitch control may be needed due to
stringent requirements from the propulsion control system which are described in next
section. Angle of attack feedback is highly desirable to influence the short period mode of
the vehicle. However implementation is extremely difficult because the control system
requires extremely high quality measurements of angle of attack and angle of attack rate.
In a similar manner, angle of sideslip is needed to control the vehicle in a trimmed
condition. Maintaining the vehicle in near zero side slip condition is also important because
of the engine considerations which are described in next section.
Altitude measurement, (normally pressure altitude) is also needed for Inertial
Navigation System (INS) stabilization. The INS is inherently unstable in altitude and
altitude correction by either pressure altimetry or radar altimetry is needed. Mach number
and altitude measurement is required to navigate the vehicle in desired air-breathing
trajectory described in section x. Deviation from the designed trajectory would result
engine unstart or excessive thermal or structural loads.
4.3 PROPULSION SYSTEM
The air data parameters and propulsion parameters are required to control the
airbreathing engines. The most interesting feature of the proposed hypersonic vehicle is the
scramjet operation.
The unknown flight regime occurs for flight Mach numbers between 6 and 25
where the scramjet propulsion system would operate. Scramjet operation through a wide
spectrum of Mach numbers suggest that active control of inlet and nozzle geometry and
43

44
combustor height is needed. The optimal engine configuration may involve shock
matching, inlet size, and compression ratio control which will dependent on the flight Mach
number. The feasibility of such active control is still unknown, however, following
scramjet analysis is based on the engine configuration with variable geometry control.
In order to estimate the air data and propulsion state measurement requirements,
important scramjet concepts are reviewed and the relationship between the vehicle attitude
and the scramjet performance is explained below.
4.3.1 SENSITIVITY OF SCRAMJET COMBUSTION TO
THERMODYNAMIC FLOW CONDITIONS
The scramjet is a very simple airbreathing engine configuration. High Mach
number flow is decelerated to slower supersonic speed and then heat is added to increase
enthalpy. The most important parameters are temperature, pressure, flow field, and mass
flow rate into the combustor. The measurement of these propulsion parameters are
required to control the scramjet. Variable geometry inlet and nozzle, variable combustor
height, etc,are needed to control and provide adequate combustor thermodynamic
condition.
According to recent investigation on the scramjet engine performance by Lewis
M.13, combustor inlet temperature must be low enough to add heat to the flow and increase
enthalpy. At sufficiently high temperature, added fuel will dissociate. The dissociation
will absorb energy and result in a net loss of heat from the flow. On the other hand,
combustor inlet temperature must be high enough to create spontaneous combustion. In the
Fig. 4.3.1, hydrogen combustion time is plotted against pressure and temperature. At
relatively low temperature of 900 to 10000K, secondary reactions within the hydrogen-air
44

Reaction time for the H2-air systemVersus temperature and pressure
-1.5
-2.0
Log 1 o(:,in secse.) -3.0
-3.5
-4.0
-4.5
looo K
200 K400 K'
800 K000 K
-1.0 -0.8 -0.6 -0.4 -0.2 0.0
Loglo(Pressure, in atm.)
Fig 4.3.1
0.2 0.4
Time for completion of hydrogen combustion in air
taken from ref. 13
45
I

46
system decrease combustion as pressure increases past cutoff value. Flame dislocation and
combustion time delay are computed to be negligible even at the extreme cases since
hydrogen is a such fast reacting gas. Therefore flame dislocation and combustion time
delay can be ignored in propulsion control.
Heat addition rate is more sensitive to combustor inlet pressure than temperature.
In general, reaction time decreases as pressure increases. Consequently, combustor inlet
pressure must be as high as structure can withstand to maximize combustion efficiency.
The inlet pressure should be high in order to take large amount of mass flow without high
drag penalty from a large inlet. However, at lower temperature, pressure must be kept
below the cutoff pressure where the secondary reactions start. Therefore it is important to
keep the pressure and temperature within narrow range. The inlet values must be measured
in order to control the combustion process.
The flow Mach number in the combustor is another important parameter. Inlet
efficiency (i.e. total pressure recovery) will increase if the inlet flow deceleration is low.
However, burning fuel at high Mach number results in higher total pressure penalty in the
combustor.13 Therefore a compromise must be made between inlet and combustor
condition for the optimal engine efficiency.
4.3.2 SENSITIVITY OF COMBUSTION TO VEHICLE ATTITUDE AND
TRAJECTORY
Along with the free stream conditions, the inlet shock geometry determines the
combustor thermodynamic condition. The shock geometry is directly related to the vehicle
attitude and flight trajectory as well as the engine inlet geometry which will be dictated by
the flight altitude and Mach number. If the vehicle deviates from the designed trajectory,
46

47
combustor temperature can reach the flow dissociation limit without compressing enough
air at upper limit of the air-breathing corridor. At the lower limit of the air-breathing
corridor structural and thermal limit loads will be encountered. Therefore altitude and
Mach number along with the inlet pressure field distribution will be needed for the inlet
geometry control.
Inlet shock attachment directly influences combustion efficiency. In the
supercritical condition shown in Fig. 4.3.3 the forebody shock is outside the cowl lip. The
effective mass capture area decreases and there is an increase in the total wave drag. In the
subcritical condition, the bow shock is swallowed by the inlet, reflecting shocks inside the
combustor will interfere with optimal combustion and may cause unstart. Therefore precise
angle of attack and/or pitch angle measurement is needed to match the shock at the critical
condition(Fig. 4.3.2) with the cowl lip. However, aerothermodynamic calculations of the
interaction between the inlet shock and cowl lip indicate that shock impingement at the
critical condition should be prevented because the heat transfer rate increases with shock
impingement by an order of magnitude (according to the reference 9, about 20 times).
Consequently the shock must be regulated so that the inlet stays just slightly in the
supercritical condition as close as possible to the critical condition.
Another issue arises from the thickness of the boundary layer on the forebody.
Due to the fuel dissociation in the boundary layer flow, that portion of mass flow in the hot
boundary layer can not be used for producing thrust. In other words, thickening of the hot
boundary layer results in decreasing thrust. Taken from an investigation of stratification in
scramjet inlet flow by Lewis M. 13, Fig. shows that as much as 50% of the inlet mass flow
will be in the extremely hot boundary layer at the high Mach number and high altitude
condition.
47

48
Fig. 4.3.2 Critical Operation
Fig. 4.3.3 Supercritical Operation
48

49
The boundary layer thickness is dictated by the vehicle attitude since the hypersonic
boundary layer on the lower forebody will increase as angle of attack decreases. Boundary
layer thickness is inversely proportional to forebody wedge angle and the angle of attack.
Consequently increase in angle of attack will result in higher thrust within nominal design
angle of attack range. Thus thrust and combustion processes can be modulated by vehicle
short period oscillation (i.e. change in angle of attack). Due to the location of the air-
breathing engine on the underside of the vehicle, pitching up moment would result as angle
of attack increases. The thrust induced pitching moment will tend to cause instability and
must be actively controlled.
The boundary layer thickness is also a function of altitude. As altitude increases,
density decreases and as a result the boundary layer thickness increases. The altitude effect
is quite large because kinematic viscosity increases nearly exponential in the atmosphere. 13
In Fig. 4.3.4, 10% of thrust is expected to decrease at Mach number 20 ,altitude of about
120Kft , and dynamic pressure of 1 atmospheres. 13
4.4 PROPULSION CONTROL SYSTEM
As described above, air data and inlet flow field parameter measurements are
needed by the propulsion control system. The air data sensing requirements for the
airbreathing hypersonic vehicle strongly depend on performance requirements of the
scramjet. Due to absence of a flow mixing compressor, upstream flow conditions and
vehicle motion will directly influence the combustion process. Beyond the guidance
requirement to put the vehicle into a desired trajectory, the flight control and the air data
systems must function as part of the propulsion control system.
49

Representative Transatmospheric TrajectoriesConstant Dynamic Pressure
120.
100.
80.
Alt.,in km. 60.
40.
.0.
0.
Percent of inlet flow occupiedby hot boundary layer
230%10o
50% Constant Q= 0.100 a:,.
Constant Q= 1.000 at=.
SConstant Q=10.000 a:.
5. 10. 15. 20. 25. 30. 35.Mach Number
Fig 4.3.4 Percent of inlet flow occupied by boundary layer at 10 mwall cooled to 20000K
taken from ref. 13
50

51
One possible way of controlling the shocks and flow qualities inside the scramjet
engine is to vary the inlet geometry as shown in Fig. 4.4.1. Since the shock angle is
proportional to the body incidence angle for small angles, the shock angle can be efficiently
controlled by the movable surfaces on the vehicle. By controlling the shock geometry of
the inlet and the combustor, the combustor pressure and temperature can be regulated.
Flow dumping bypass doors used in the SR-71 are not likely to be implemented, because
the hot hypersonic boundary layer flow would likely destroy the bypass door mechanism.
The implementation of a moving surface shock controller will be extremely difficult since it
would require large actuator power. The power spectral density of the scramjet inlet flow
disturbance is unknown, therefore the exact bandwidth requirement for the both sensor and
the actuator is not available. In the variable geometry control, main limitation would be the
actuator dynamics. The variable surfaces with hydraulic actuators would have maximum
bandwidth of 10 to 100Hz. For the further analysis, 100Hz was picked as the target
sensor bandwidth.
A general overview of a candidate scramjet propulsion control system is shown in
Fig. 4.4.2. Since upstream flow condition and vehicle motion directly influence the
desired inlet variables, upstream parameters are measured and the theoretical optimum
control law for the whole engine could be determined. The measured upstream flow
parameters and vehicle attitude information would therefore be fed into a central controller
which would regulate the inner loop controllers.
The inner control loops consist of inlet, combustor, and nozzle regulators. For the
inlet control, inlet geometry and cooling fluids would be controlled to provide an adequate
combustion environment as well as regulate mass flow rate and to prevent material failure
by active cooling. In addition, combustor information would feed back to the central
controller to readjust the inlet variables. Inlet temperature, pressure, and shape would be
51

52
varialbe inlet
geometryt
' inlet P; combustor '- nozzle
Combustor top view
zle
variable wedge angle
Fig. 4.4.1 Simplified Diagram of Vehicle Movable Surfaces
52
J7
I NOW

53
measured to predict inlet shock geometry, mass flow rate,and inlet flow field temperature
and pressure.
In the combustor, fuel flow, coolant flow, and combustor height would be
regulated based on the measured combustor temperature, pressure, and flow Mach number.
In the nozzle, geometry would be regulated to provide adequate flow expansion. The
combustor information would also be used to determine optimal nozzle shape.
In terms of outer loop of the control, the engine must provide good thrust command
following to stay in the desired trajectory while regulating inner loop variables to prevent
unstart. This predicted scramjet propulsion control system scheme suggests that the
engine control could become very complicated since the vehicle motion, flow disturbance,
and engine performance are highly coupled together. Consequently the air data system
must provide quality flow information in order to control the coupled flight control and
propulsion control systems. Also the air data system must be fault tolerant in order to be
used as a part of the flight and propulsion control systems.
53

w-jNN0z
0I--c,
0
I-w-JZ
z0
zoz
w Oi-
C/)omz
V
brd•
o
V
0
e(
'b* .

55
5.0 PRELIMINARY AIR DATA MEASUREMENT SPECIFICATIONS
A preliminary set of the air data measurement specifications is discussed in this
chapter. Table 4 summarizes the specifications for each parameter which will be discussed
briefly below.
5.1 ANGLE OF ATTACK
The flow direction parameters such as angle of attack and angle of side slip are
estimated to be critical parameters in scramjet performance. These parameters determine
the shock geometry, combustor flow temperature and pressure distribution. Consequently
the flow direction parameters will affect the scramjet engine performance. The angle of
attack (a) accuracy is dictated by engine efficiency and inlet shock position considerations.
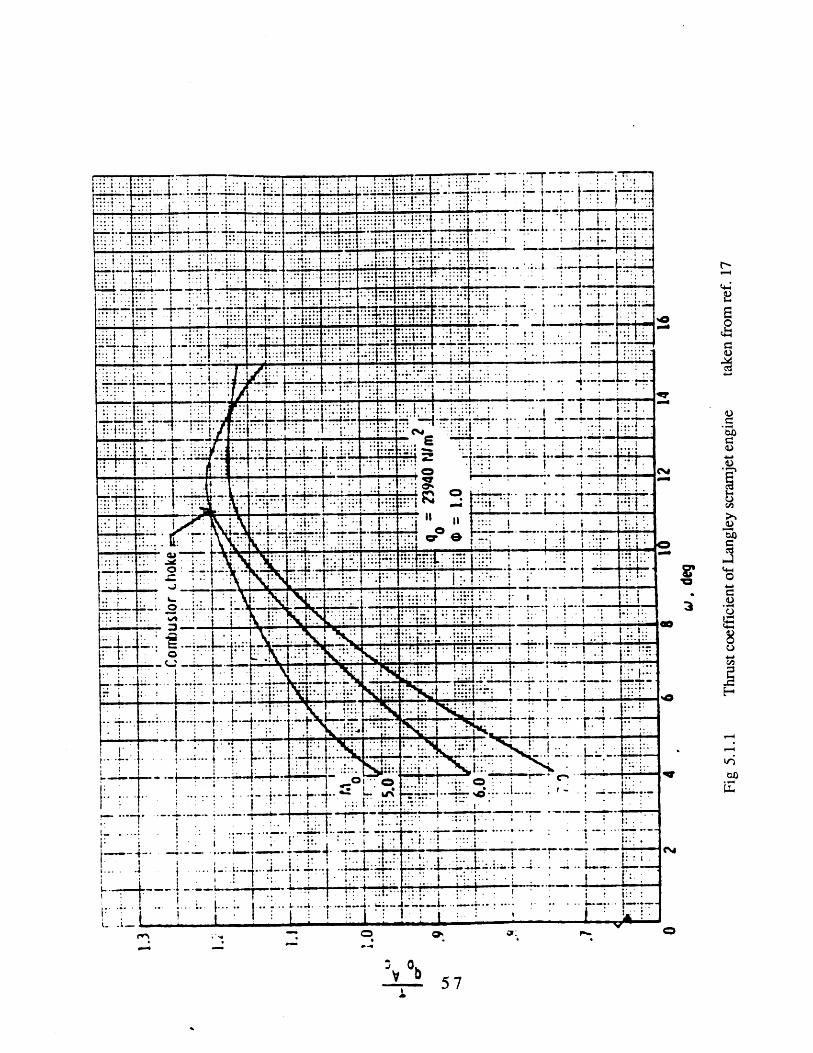
The thrust coefficient, which is the thrust normalized by the dynamic pressure and inlet
capture area, is a function of Mach number and angle of attack. Some information on the
scramjet performance based on NASA Langley tests are available. 17 In Fig. 5.1.1, the
thrust coefficient is plotted with respect to the sum of the forebody wedge angle and the
angle of attack. The thrust coefficient plot is available for Mach numbers of 5, 6, and 7.
The scramjet engine is observed to be most efficient near the combustor choke condition.
A 10 of change in angle of attack would result in about 5% thrust variation. When a
realistic thrust to weight ratio of 1 to 2 is considered, the 5% thrust variation can be
significant. For 10 control of angle of attack, a 0.10 accuracy in angle of attack
measurement is considered desirable.
55

56
AIR DATA MEASUREMENT SPECIFICATIONS
Range Accuracy
Angle of Attack
Angle of Side Slide
Mach Number
Dynamic Pressure
Total Pressure
Static Pressure
Altitude
Vertical Velocity
Total Temperature
Inlet Pressure
Inlet Temperature
M
q..
Pt
POO
h
h
TO
Pinlet
Tinlet
50 from shockimpingement
±70
0-25
200 - 4300psf
1000 - 4300psf
10 - 2100psf
0 - 150 K ft critical150 K ft -= orbital
0-1000 ft/s
1200 -30000 F
1000 -4300psf
1200 -3000oF
TABLE 4
56
0.10
0.10
5-10%
5-10%
0.3%
5%
5%
FTT:7F:7T TTh
z.'li-
-ii tFi
A ., :::..
:: 'I :' : , : . I :: :
.1
-4-.-,
T)··
-4- i
---· .(···..,.·· ·r ·
::~::`~r~···
· ~, ·
1···
i.iiii:ii
:::i.:~:::~1:::'~-~' t"'
.:::1::r:
~;I'""
i ii·LIYYi(
- *
...... ..4. .. 1** . .
t
. ...i ....i
::::.. . . '.. :" r. ....,I " i.... :'t . ...
j ' ' .... .. ; . ..
• • i' '[ t':it.-
"" ;' - [ • : ': ". ...... . .. ·
. .:- .. ... 2. - .. 1. '.·....- L •":" .• ..-i - -... t -i - : · -
[.-. . .t..
F7.1 7Vh--4-'..K- *i
'.
I . ! I · ·** 'o I ; o .
..... · t?.' ''-it:..
.. ~H.
7'7 ..•: ,.; • ; :I -$- i .4 -:. ..
( t· :~
..3 ~.:~2:
... -.. . ;..... .... '
... . .....
TF::: *I vA"7 . 1 .
. . :
!. 0"'" " 1:
• .:-.: .• .. : . . .. 0 .. , . " . ..
7 .7 . .7.
g· I 2· _________________________________
-w -
b 57
(L4
t
'''...,
I·rr(·· · ~
II· · · ·· ··
·
..,o... * ~-''-- I ."·.... : .: _ · _'•,--I
L•a
L: : ::1:
i.;: L::··'':1::::
A
p-q
".,;: :t::.: : ···,· I·· Ir··1 · · ' · · ' I·(~~1~--*·-- · '-·t''--: -J'·--c~
·r "?
IV
i · I~i i .,....i i .i:
/(.i·.( • -. t
V
-
• .-:I . ::. "..: ". - ' . :', :. ".'-h . - _I17 77... •.: . -.7• " ---II
III
--*:
• .• . --
i .. r: iii: , · -1·, ..··
· ·::1:··
I ::
• o
• . • , • II I • I
!
u

58
A similar estimatfe of the required angle of attack accuracy can also be derived from
the inlet shock attachment consideration. The combustion efficiency of airbreathing
engines such as ramjet or scramjet depend on the shock positions in front of and inside the
inlet. In order to optimize the engine efficiency, the compression shock must impinge on
the cowl lip. Consequently airbreathing engines need to operate near the critical operation.
For inlet shock control, over a 10 meter reference scale with 10 cm cowl lip thickness a
0.10 angle of attack accuracy is needed to prevent the shock detachment.
The maximum range of angle of attack during the hypersonic cruise would be no
more than 50 based on the Langley test results. 17 According to the thrust coefficient vs
angle of attack plot in Fig. 5.1.1, 50 decrease in angle of attack would result in 30%
reduction in thrust at Mach 7. The high sensitivity of scramjet engine with respect to the
angle of attack can be explained by illustrating the changes in the thermodynamic
parameters of the flow entering the combustor with respect to the changes in angle of
attack. For the 50 wedge angle and 50 expansion angle forebody as shown in Fig. 5.1.2,
the variation in inlet exit flow pressure and temperature with respect to the variation in angle
of attack are computed by the 1-dimensional oblique shock relations. The results are
plotted in Fig. 5.1.3 and Fig. 5.1.4. The inlet exit flow pressure and temperature changes
substantially as angle of attack changes. As angle of attack changed 50, both the flow
pressure and temperature changed by a factor of two. Regulation of angle of attack within
narrow operating range is critical.
5.2 SIDE SLIP ANGLE
The angle of side slip (03) accuracy requirements also result from inlet flow
considerations. Recent CFD investigations on scramjet performance indicates that lateral
58

---------- ------a
V
Fig. 5.1.2 5 degree wedge inlet model
59
59
S50 T
P

- T/Ta
0 1 2 3 4 5 6
angle of attack
Fig. 5.1.3
0 1 2 3 4 5 6
angle of attack
Fig. 5.1.4
60
60
-p/p-

61
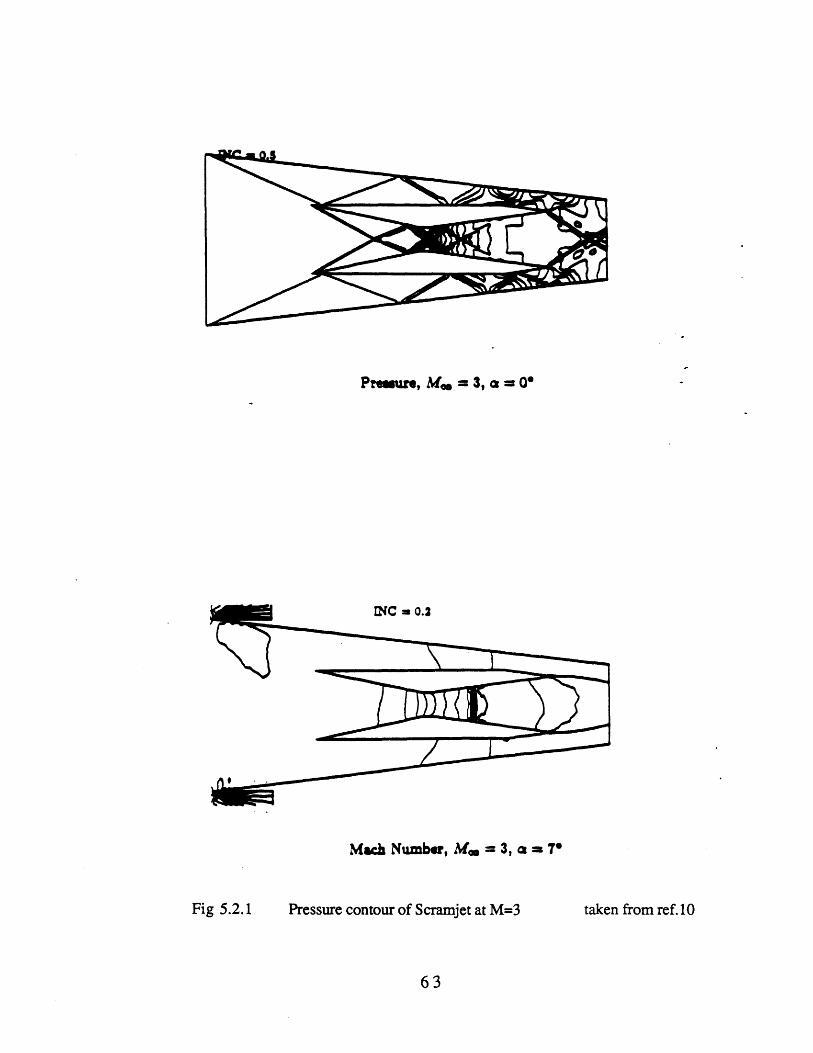
inlet flow direction is also an important factor in the propulsion system performance. 10
The scramjet flow direction sensitivity results were based on the NASA two strut design
without combustion. 10 An example of the solution of the Euler Equations for the engine is
shown in Fig. 5.2.1 at a Mach number of 3 for 00 and 70 yaw angles. In the yawed
condition, the pressure builds up in the inlet due to a strong bow shock and causes unstart.
For the unyawed case the total pressure loss in the mid channel is about 26%. The total
pressure loss increases to about 75% when unstart occurs. In Fig.5.2.2, yaw angles of 00
and 50 are compared at M = 5. The density contours suggest that the effect of asymmetry
is very large. At a yaw angle of 50, the shock induced by one of the side walls totally
disappears and a strong asymmetry or distortion of the flow occurs. Even though the flow
did not unstart the engine, the shock geometry, density and pressure distribution is altered.
The degree of combustor sensitivity with respect to the gas states and flow field inside the
combustor is difficult to determine due to lack of understanding in high speed combustion.
However from this comparison, it's clear that small changes in the flow direction can alter
the combustion state and move the engine off the optimal operating point. The specific
accuracy requirement on the side slip angle(f3) measurement is unknown due to lack of
information on the scramjet sensitivity with respect to the side slip angle. However, more
precise regulation of side slip would result in more efficient engine operation so a value
similar to the a value of 0.10 was indicated in Table 4.
5.3 MACH NUMBER
The ramjet would likely operate Mach number 2 to 6 and scramjet would take over
from Mach 6 to the combustion limit of between Mach 12 and 25. Consequently, the flight
Mach number measurement is not considered to be critical other than for guidance purpose.
An estimated accuracy of 5-10% for Mach number will be adequate for such purpose.
61

62
Even though the flight Mach number measurement is not critical, the Mach number
measurement is extremely difficult at M > 4. Mach number is usually obtained by the
Rayleigh pitot formula which is;41
q + YM (1 + y)2M - 1-1
S 2 4M2(Y
and the dynamic pressure relation can be written as
q= -M2p
For Mach number greater than 1 and y= 1.4, the above equations become
1 1 2.51[ 1 p121.84 7M 2
Therefore at high Mach numbers q/p approaches to 0.54. Due to very little variation of the
dynamic pressure and total pressure ratio, Mach number measurement become very
difficult.
5.4 DYNAMIC PRESSURE
Dynamic pressure measurement is required by the propulsion system to maintain
the inlet pressure between 1/2 to 2 atmospheres (1100 to 4400 psf). Also, aerodynamic
loads and thermal loads are related to the dynamic pressure. The estimated maximum
dynamic pressure is 2 atmospheres due to the structural limitations. Dynamic pressure is
typically inferred from measurements of total pressure, static pressure and Mach number.
If active control is implemented to regulate the inlet pressure, the dynamic pressure
measurement accuracy requirement would be similar to the case of the Shuttle or the X-15.
62
Pre•ure, M. = 3, a = 0*
Mach Number, Mw = 3, a = 7O
Pressure contour of Scramjet at M=3 taken from ref. 10
63
Fig 5.2.1

INC - 0.5
Density, M, = 5, a = 0'
Density, M.• = 5, a = 5"
Density contour of Scramjet at M=5 taken from ref. 10
64
Fig 5.2.2

65
The estimated accuracy requirement of 5% is proposed. At high Mach numbers, dynamic
pressure become primarily a function of stagnation pressure and Mach numbers. The
dynamic pressure equation become;4
1
y 4y 2(y- 1) -' Pty +'1 (y + 1)2 (Y+ )2M2 2
The dynamic pressure measurement accuracy will improve as Mach number increases since
errors in static pressure measurement do not contribute and Mach number contribution
decreases significantly. However, as the surface temperature increases, real gas effect
should be considered. The specific heat y will decrease as the gas temperature increases.
Correction of the specific heat for real gas effects may be needed.
5.5 STATIC PRESSURE AND ALTITUDE
The static pressure is one of the most difficult parameters to measure. Position
error, which results from imperfect static port location, contributes significantly to
uncertainty in the static pressure measurement. Altitude can be measured by either the radar
altimetry or by static pressure measurement. If pressure altimetry is used, then the
accuracy requirement on static pressure would be 0.3% of sea level pressure based on a 5%
altitude precision at 100,000 ft. If the static pressure measurement is only used for
calculating dynamic pressure a 5% uncertainty is thought to be acceptable.
5.6 INLET PRESSURE
To provide a good combusting environment at the combustor, the flow quality of
air in the inlet exit are needed. For the estimation of the combustor states, several inlet
65

66
pressure measurements are needed. The optimal range for the inlet pressure is between 0.5
to 2 atmospheres. Higher compression (i.e. increase in inlet pressure) means higher engine
performance, but structure may not withstand such high pressure and temperature. The
engine may be able to operate at 0.1 atmosphere but far less efficient than the optimal
range. The inlet pressure measurement accuracy specification can not be defined due to
lack of the scramjet engine control model. If the vehicle rely on the ramjet or dual
combustion scramjet during part of the flight, the inlet pressure measurement accuracy
requirement would be similar to the SR-71, which is the 0.1%.
5.7 INLET TEMPERATURE
Ideally inlet temperature should be near 12000 F where the combustor flow
temperature is hot enough to provide spontaneous combustion and cold enough to add
energy. The stagnation temperature which may be as high as 30000 F is needed to estimate
the combustor temperature. Actual specifications will depend on the engine performance
data which is unavailable at this time. Generally, higher precision will allow more efficient
fuel air mixture control and higher combustion efficiency.
5.8 SHOCK LOCATION
The angle of the oblique shock in front of the forebody and the oblique shock
geometry inside the combustor are desirable to measure. The initial oblique shock
determines the engine inlet efficiency and the oblique shock geometry inside the combustor
determine the pressure and temperature field inside the combustor. In principle, the shock
angle can be obtained by the inlet wedge surface pressure measurement with other air data
parameters such as Mach number, static pressure, and the free stream flow direction.
However, actual implementation is difficult, because, the Mach number measurement is
66

67
very difficult above M>4 and the static pressure measurement is difficult. The optical
techniques, which are described in next chapter, may be the better candidate for the shock
angle measurements.
67

68
6.0 AIR DATA SENSING TECHNIQUES
Air data sensor systems for hypersonic vehicles require non-intrusive reliable, high
bandwidth (in the order of 100Hz) performance. There are several non-intrusive air data
sensing concepts available. Most feasible concepts are pressure measurement techniques
and optical techniques. These concepts are briefly described below:
1) Surface Pressure Measurement Technique: The air data parameters such
as the flow direction parameters (a,j3), altitude, etc, have a direct relationship with the
vehicle surface pressure distributions. By having a either empirical and/or analytical
relationship of the vehicle surface pressure with respect to the air data parameters, the
pressure sensor system can be installed flush to the surface and avoid the intrusive pitot-
static probe. More detailed information is discussed in next section.
2) Ultra Violet (UV) densitometer: The UV densitometer concept was
proposed for the X-20A in the early 60's to measure the flow near the bow shock of the
entry vehicle. 15 The UV beam would be transmitted through the window located on top of
the vehicle. Due to the density variation of the flow, transmitted UV beam is scattered and
reflected back to the UV receiver located on the fuselage, behind the transmitter.
3) E-beam air data sensor: Similar to the UV densitometer, E-beam air data
sensor is based on scattered UV light detection. 15 An electron beam is produced by an
electron gun located inside the fuselage and the beam would be emitted to the atmosphere
through the fuselage window. The electron beam is scattered by the external flow and
excites the air and emit ultra violet light. Photo multiplier tube, which located down
stream, pick up the UV light scattering. The electron beam sweeps through the flow region
of interest and detect the external flow condition in various region
68

69
4) Laser Doppler Velocitimeter: The flow velocity can be measured by
detecting the Doppler frequency shift of laser light that has been scattered by particles inside
the flow. Usually two laser beams are emitted to the atmosphere through the window and
crossed to produce interference pattern. When the sub-particles in the external air flow
pass through the crossed beam region, light is scattered and Doppler shifted due to the
particle velocity. A photo-detector is used to detect the scattered light and extract the
particle velocity from the Doppler shift. The flow velocity can be inferred from the
assumption of the particle velocity is equal to the flow velocity.
5) Laser Holography: The laser holography can be used to detect the flow field
density variation. There are some cases (Langley Hypersonic Wind-Tunnel Tests) that the
laser holography technique is used on high speed wind-tunnel tests instead of the Schieren
method. The density variation in the flow field such as shock structures result in refractive
index changes of the coherent laser beam. Refractive index changes imposes phase shifts
on an optical wave that can be observed in the fringe variations of an interferogram. By
interpreting the fringe variations, the flow field description can be obtained.
All of the above techniques, in principle, can be used to measure the external flow
field without protruding probes. However several of these techniques are not readily
applicable for the hypersonic air data and propulsion state measurement sensors. Laser, E-
beam, and UV based sensors require very complicated optical and electrical equipments,
and they are far less reliable than pressure measurement concept. The optical techniques
are hard to implement redundantly and therefore provide fault tolerance in the system. The
optical techniques also require windows which would be difficult to place on the hot
fuselage. Weight, volume, and power consumption would likely be much greater than a
pressure sensor system with cooling. Therefore the surface pressure measurement
69

70
techniques is considered to be most viable technique for the hypersonic air data system if
the required accuracy can be achieved.
6.1 FOREBODY SURFACE PRESSURE MEASUREMENT
Many of the required air data parameters can be inferred from surface pressure
measurements around the forebody or nose of the vehicle in a manner similar to the Shuttle
Entry Air Data System (SEADS). Unlike a pitot boom sensor, a flush orifice concept uses
the fuselage (usually the forebody) as a pitot probe. Instead of eliminating the flow
disturbances caused by the fuselage, the flush pressure sensors measure the pressure
distribution of the forebody, then extract the fuselage contribution in order to obtain the air
data parameters. The surface pressure field on the forebody can be measured by an array
of the surface pressure sensors. By having a calibrated relationship between the pressure
field and the desired air data parameters, the air data parameters can be extracted from the
surface pressure field measurement. Some engine control parameters can be inferred from
the surface pressure measurement in and around the inlet. Total temperature and inlet
temperature would be measured separately.
The pressure measurement accuracy requirements can be obtained from the air data
measurement specifications from Chapter 5. If the SEADS like scheme is used, then the air
data system algorithm can be inverted to achieve the pressure sensor precision
requirements. For example, the flow direction parameters (ca,3) are related to the nose
surface pressure as;
Pe - Poo 2Cp= - = Cpmaxsin 2
qoo for M>> 1 (from modified Newtonian)
70

where the 0 is defined in Fig.6. 1.1. The pressure coefficient at the pressure orifice 1 and 2
are;
Cpl = Cpmax(1 - sin(O + a))
Cp2 = Cpmax(1 - sin(O - a))
then the difference ( Cpl - Cp2) become;
ACp = -Cpmaxsin(20)sin(2a)
The maximum sensitivity occurs at 0 = 450. By applying above equation with 0.10 angle
of attack, the pressure transducer has to have accuracy of 0.3% of the stagnation pressure.
Fig. 6.1.1
71

72
6.1.1 FLOW MODELING
The accuracy of air data parameter estimation depends on the pressure sensor
accuracy and the flow modeling accuracy. Computation of the functional relationship
between the surface pressure and the air data parameters based on the complete vehicle
model is very difficult. Moreover, providing air data parameters by such time consuming
computation in real time would not be practical. Therefore simple approximated flow
model is highly desirable.
The high velocity flow can be modeled by a modified Newtonian approximation of
hypersonic flow which predicts the pressure field of a blunt body extremely well at
relatively high Mach numbers. The advantage of modified Newtonian flow approach is in
simplicity. The pressure coefficients around the body are simply a function of the pressure
coefficient at the stagnation point and the body shape. The accuracy of the Newtonian
approximation is most accurate at High Mach number and decreases with Mach number.
In the subsonic region, the solution of the pressure field can be obtained by the
potential flow theory. The incompressible flow over spheroid can be calculated for the low
speed flow. However, for Mach numbers over 0.3, compressibility can not be neglected.
From high subsonic to supersonic flow, there are no simple mathematical approximations
which exist to reconcile the inaccurate Mach number region of modified Newtonian and
potential flow theory.
6.1.2 NUMERICAL TECHNIQUES
Estimation theory can be implemented to transform the pressure signals into air data
parameters while minimizing error variance estimate of the air data parameters in the
72

73
presence of noise. The digital filtering technique which was implemented on the SEADS is
extremely practical. 1. One of the advantages of such digital filtering is it's inherent
redundancy. Since there are multiple sensors (usually more sensors than air data
parameters) the pressure measurements can be made even when some sensors fail. The
primary disadvantage of this estimation technique was the relatively long processing time.
If the air data application requires high bandwidth, the sensor filter technique may not be
applicable.
6.2 PROPULSION STATE SENSING TECHNIQUES
In order to perform the difficult task of inlet control, the observability of the engine
state, or inlet combustor flow state is important. The static pressure after the shock can be
measured to detect the shock location and shock angle. Also the pressure measurement can
be used to estimate the total pressure recovery with the detected shock geometry. The
engine performance is directly related to the total pressure recovery.
Dynamic pressure measurement can be used by the scramjet to operate within the
suggested airbreathing engine boundaries. Again, pressure measurement is needed as part
of the control loop to regulate the variable inlet geometry. The shock position and angle
can be estimated from pressure measurement on an array around the inlet lip. Differential
pressure sensors can be mounted on the side of the inlet to detect inlet disturbances related
to side slip and to predict the combustor state. In addition, the compression can be
measured by placing the sensors on the underbody. Because of the control of shock
geometry within the inlet will involve high bandwidth actuation, the inlet pressure sensor
systems must therefore be high bandwidth and are required to be placed close to the
surface. In this case active cooling of the sensors would probably be needed. It is possible
73

74
that at high Mach numbers the active inlet control scheme can not be implemented due to
actuator weight and heating considerations. In that event, the shock geometry in a fixed
inlet could, in principle, be controlled by flying an extremely precise (0.10) angle of attack
and side slip profile.
74

75
7.0 PRESSURE MEASUREMENT TECHNIQUES
In this chapter, the pressure sensor implementation issue will be discussed. The
sensor system can be divided into the pressure orifice and transducer. Functional
requirements for each of the components are discussed based on the hypersonic application
constraints.
7.1 PRESSURE SENSING ORIFICE CONSIDERATIONS
The local surface pressure is defined as the normal force per unit area on the local
region of the surface; therefore, the most direct surface pressure measurement technique is
a method of mounting a transducer on the vehicle surface where the transducer diaphragm
is a part of the vehicle surface as shown in Fig 7.1.1. Such a technique is not readily
applicable in a hypersonic vehicle because the transducer would be exposed to high external
heat loads. Most transducers could not handle the temperatures up to 30000 F which are
expected during the hypersonic cruise. Also, the exposed sensors could be easily damaged
by erosion. Therefore, the transducers will be isolated by a pneumatic tube. Commonly a
hole is drilled normal to the surface and a circular pneumatic tube is installed to connect the
hole and the pressure transducer as shown in Fig. 7.1.2. However there are problems
associated with the pneumatic tube and transducer sensor system. The system has inherent
absolute measurement error due to the flow disturbance caused by the sharp changes in
surface boundary at the orifice. The sensor system is also bandwidth limited by the
pneumatic tube addition to the bandwidth limit of the transducer. These bandwidth
limitations are due to the pressure lag and acoustic resonance. More detail on the sources
of error of the sensor system are discussed in next section.
75

76
vehicle surface
diaphragm
transducer
Fig. 7.1.1
vehicle surface
externalpressure
Pa
instrumentchamber
pneumatic tube
IIII
rI
- orifice -
sducer
n
Fig 7.1.2
76
IIII
I
.
I
IIIIIIIIIIII

77
7.1.1 SOURCES OF ERROR
Pressure Lag: One of the bandwidth limiting factors in implementing a long
pneumatic tube between the vehicle surface orifice opening and a transducer is pressure lag
error. The pressure lag error is caused by the fact that the finite mass inside the tube has to
flow into and out of the tube with frictional resistance in order to equilibrate the pressure
difference. The finite time is required to equilibrate the pressure difference between the
vehicle surface and the transducer. The dynamics of the pressure lag is analogous to a low
pass filter. Steady state and low frequency fluctuation of the external pressure can
propagate to the transducer, but high frequency pressure transients will be attenuated. For
the simple cylindrical tubing with instrument chamber shown in Fig. 7.1.2, the pressure
lag time constant is defined as below. 18
128 gL Vtlag =irdPa
The pressure lag time constant is a function of the external pressure, tube diameter,
instrument chamber capacity, and tube length. The pressure lag will increase as the
temperature of gas, which displaces the pneumatic tube, increases. The temperature effect
is due to the air viscosity changes. In Fig. 7.1.3, the pressure lag time constant vs external
pressure is plotted for air temperature of 18000 F, and 0.125 inch tube diameter, and LC
(tube length, chamber capacity product) of 1 inch ^4. If the ambient pressure decreases
due to the increase in altitude then the pressure lag will increase. In Fig. 7.1.4, the
pressure lag time constant is plotted against both the tube length and the tube diameter for
air temperature of 18000 F, external pressure of 1000 PSF. In the Fig. 7.1.4, the
instrument chamber was assumed to be small. If the orifice tube length increases, then the
77
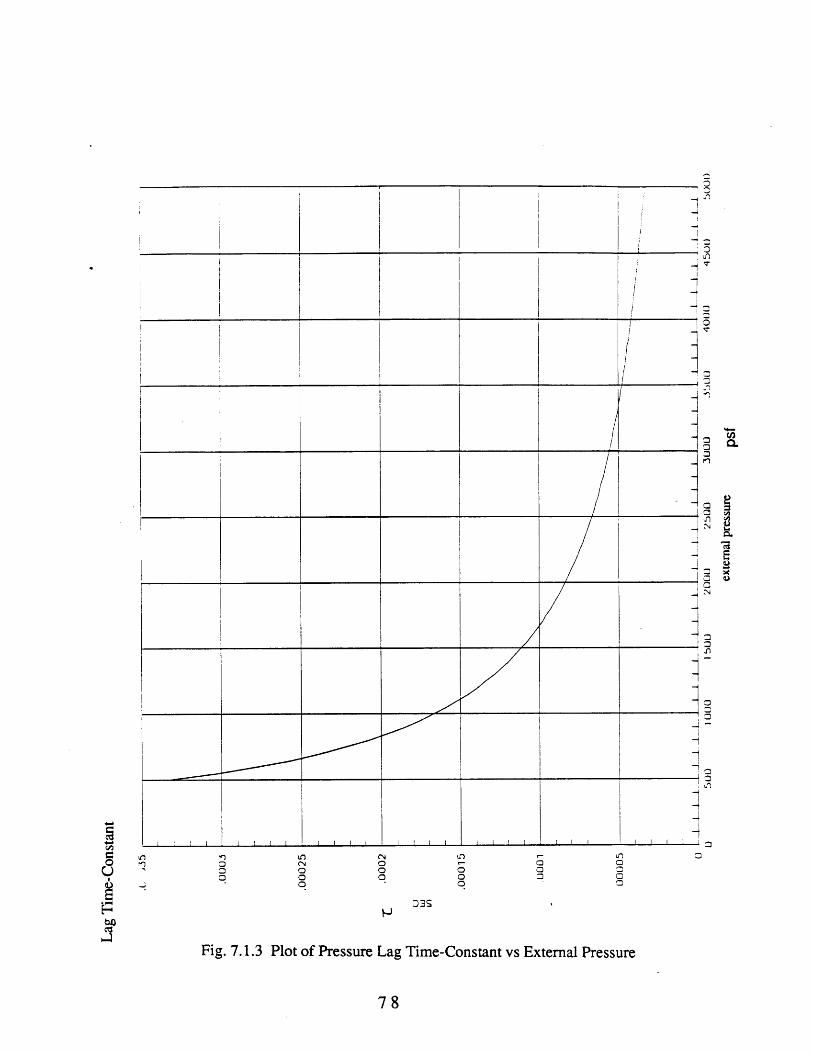
u
0 n p O N LO -0" Oc O O0 0 C DCD 0 c
Fig. 7.1.3 Plot of Pressure Lag Time-Constant vs External Pressure
78
1
~n
O
=1
6
0.
UU
a
C2
3

i
C C
Lag time constant
C C C C C
Fig. 7.1.4 Plot of Pressure Lag Time-Constant vs Tube Length and Diameter
79
79
Un0)
- 1-*

80
pressure lag increases. Also, if the tube diameter decreases, then the pressure lag
increases.
Acoustic Resonance: Whenever a transmission tube is used as shown in Fig.,
the resonance will occur when the frequency of the pressure signal is tuned to an acoustic
resonance of the system. The resonance will occur at the fundamental resonant frequency
and it's upper harmonics as shown in Fig. 7.1.5. The effective bandwidth of the orifice
system is therefore limited by the fundamental resonant frequency. The resonant frequency
must be far above the system bandwidth, otherwise the measurement error will result due
to large amplitude changes in the region of the resonant frequency. The orifice system can
be modeled as the Helmholtz resonator and the the resonant frequency is defined as;12
f c a
L 2 where a = 0.257id 2
The bandwidth of the orifice rapidly decreases as tube length increases. The
bandwidth decreases as the instrument chamber volume increases.
Orifice flow Error: Whenever surface pressure is measured with a sharp-
edged, circular, static pressure hole normal to the boundary of the air flow, an error in
absolute pressure measurement results due to the interaction between the flow and the
sharp edge of the orifice. Large errors can occur if the hole has irregular rounded edges or
any other surface distortions. Even if the orifice geometry is perfect, some residual error
exist due to sharp changes in surface boundary and the flow disturbance occurs at that
region. The error is a function of Reynold's number with respect to the hole diameter.20
The error increases as the Reynold's number increases (i.e. also hole diameter increases).
80
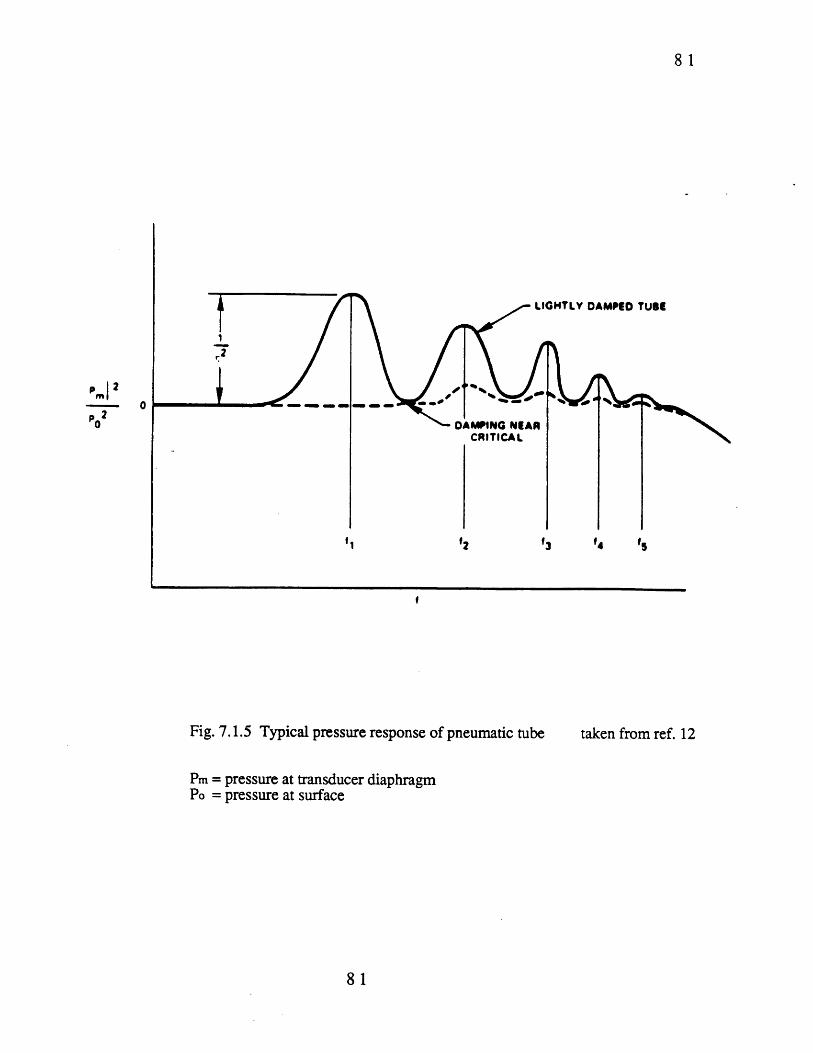
Fig. 7.1.5 Typical pressure response of pneumatic tube
PmPo
taken from ref. 12
= pressure at transducer diaphragm= pressure at surface
81
81
Po20

82
Temperature Induced Pressure Error: If the transducer is closely coupled to
the surface with relatively large orifice diameter, convection can occur inside the pneumatic
tube due to large temperature gradient between the transducer and the vehicle surface. The
convection inside the orifice will cause flow disturbance and results in pressure
measurement error.
Position Error: Position error is the static pressure measurement error which is
dependent on the position of the static pressure orifice. Normally the static pressure orifice
location is selected on the fuselage (usually on the side of the fuselage) so the static
pressure measurement error is stationary in the presence of attitude and Mach number
variations. Even though the best location is selected on the fuselage, a difference between
true static pressure and measured static pressure exists due to the fact that the fuselage
disturbs the flow. Position error can be calibrated by the empirically derived error
correction factor from wind tunnel or inflight tests.
82

83
8.0 SENSOR SYSTEM THERMAL CONSIDERATIONS
The sensor thermal problem is considered in this chapter. Thermal considerations
are critical for transducer selection and orifice design. The surface peak temperature will be
determined by the vehicle flight trajectory. The integrated heat load on the vehicle are
determined by the flight trajectory, cruise duration, and vehicle thermal insulation and/or
cooling technology. Once the flight trajectory and duration are determined, sensor thermal
designs can be evaluated. A heat transfer model of the orifice is constructed to aid in
evaluation of the transducer thermal requirements. The model is based on a simple
pneumatic tube and instrument chamber configuration as shown in Fig. 8.0.1.
In Fig. 8.0.1, the primary potential heat flow routes are shown. Heat can be
transferred through the vehicle surface, there by heating up the pneumatic tube and the
vehicle's internal air. Heat can be transferred to the transducer by three routes; through the
air column, through the pneumatic tube walls, or through the heated internal structure.
Radiative Heat Transfer: Thermal energy can be emitted by a heated body
through electro-magnetic radiation. If the heat-radiating body can be assumed to be an ideal
radiator (i.e. black body), then the thermal energy emission will be proportional to the
fourth power of the absolute temperature. The thermal exchange between two ideal
radiators can be described as;19
q = aA (T14 - T2
4)
where a is the Stefan-Boltzmann constant and T1 and T2 are the temperatures of two black
bodies. The radiative heat transfer from a hypersonic vehicle surface would be very large.
83

vehicle surface
Big Arrows Indicate the Heat Flow Direction
Fig. 8.0.1
TD
Rtube
Fig. 8.0.2 1-D Steady State Electrical Equivalent
84

85
Convective Heat Transfer: Convective heat transfer can occur inside the
pneumatic tube due to temperature difference between boundaries. If convection occurs,
the heat flow rate through the air core would be increased. Also, the pressure measurement
would be affected due to the existence of internal air flow. The Rayleigh number, which
determines the presence of natural convection, is a function of the temperature difference
between the boundaries and geometry. The Rayleigh number can be expressed as; 19
Ra = gi(AT) r3
vac
where AT = temperature difference
P = l/Tg = gravitational constantv = kinematic viscosity
If the Rayleigh's number is much less than one, convection can be ignored. Convective
heat transfer must be minimized for both thermal considerations and the accuracy of
pressure measurements.
Conductive Heat Transfer: If radiative and convective heat transfer is assumed
to be negligible, then most of the heat transfer between the vehicle surface and the
transducer would be due to conduction. For further simplification of the problem, a one-
dimensional, steady-state, electrical equivalent is drawn in Fig. 8.0.2. The heat flows from
the node at the vehicle surface temperature To to the node at the transducer diaphragm
temperature TD. The total heat flow between these two nodes determines the thermal load
of the transducer. The heat flow routes can be simplified into three different paths. Part of
the heat would flow through the pneumatic tube which is placed in between the surface and
the transducer. Part of the heat would flow through the air core inside the tube. Also,
some portion of the heat flow would transferred through the vehicle skin and heat up the
85

86
internal air and structure; and the soaked heat inside the vehicle would raise the transducer
temperature. The total heat flow of this sensor system can be described as;
To- TDq= IRj
where Rj are the thermal resistances. The air thermal resistance, Rair, is just a function of
the air temperature and the tube dimension. The thermal resistance of air is very high,
therefore the heat flow through the air core is relatively small. The thermal resistance of the
vehicle skin structure, Rstructure, is dependent on the vehicle configuration. If thermal
insulators and/or active cooling are installed on the vehicle, the heat flow through the
structure can be minimized. The thermal resistance of the pneumatic tube, Rtube, is a
design parameter. This resistance can be increased by selecting materials with low thermal
conductivity. Consequently, the transducer thermal requirement is dependent on the
vehicle configuration and the orifice materials. By installing thermal insulators and/or
active cooling of the sensor system as shown in Fig. 8.0.3, the maximum operating
temperature requirement of the pressure transducer can be lowered.
Once the vehicle configuration is determined, a more detailed thermal analysis can
be executed by numerical techniques. For the simple pneumatic tube and transducer
system, the governing conduction equation can be expressed as;19
82T 1 6T 82T 1 6T
8r2 +r + z a 8t'
and for the steady-state condition; 19
86

87
vehicle surface
Fig. 8.0.3 Thermal Insulation and Active Cooling
87
82T 16 T 82T
r2 r 8z .z
with the boundary conditions for the both end of the tube and the tube inner wall;
T(O,z) = f(z) air core temperature axial distribution
T(R,z) = g(z) tube inner wall temperature
T(r,Zo) = To(r) transducer radial temperature distribution
T(r,O) = Te(r) orifice opening radial temp. distribution
The conductive heat transfer between each end of the pneumatic tube also can be computed
in a similar way with different boundary conditions.
8.1 SENSOR INSTALLATION AND DESIGN REQUIREMENTS
The position of the pressure orifices should be in locations where the change in
surface pressure are large with respect to the changes in the air data parameters of interest.
For example, the flow direction parameters impose the highest surface pressure sensitivity
at 450 from the vehicle reference line. For large angle of attack range, the installation of
multiple sensors is desirable since the pressure sensitivity decreases as the angle between
the normal vector of the surface where the sensor is located and the velocity vector deviates
from 450. An additional installation issue involves alignment. The flush mounted pressure
orifice locations on the surface must match with the flow model pressure points. Precision
angular alignment with respect to the vehicle reference axis is needed. Angular
misalignment will result in flow direction error.
88

89
In the implementation of flush orifice pressure sensor techniques, the sensor
thermal limitations and sensor geometry should be considered. The vehicle surface and the
transducers should be thermally insulated to minimize indirect heat soak. Low thermal
conductivity materials should be selected for at least part of the pneumatic tube. Graphite
or ceramic are considered for high temperatures insulation, however these materials are
extremely brittle. In addition there are installation problems associated with the thermal
expansion ratio of the high temperature materials. If the surface structure is constructed
with high thermal expansion ratio materials, then the difference in thermal expansion of the
orifice and the structure will cause thermal stress problems. Also, bonding between the
orifice and the surface structure is extremely difficult due to high temperature at the surface.
Therefore it is desirable to construct the orifice and initial pneumatic tube as a part of the
surface structure with the same materials.
89

90
9.0 PRESSURE TRANSDUCER EVALUATION
9.1 PERFORMANCE REQUIREMENTS
Based on the forebody surface pressure measurement methodology and the
hypersonic air data parameter specifications presented in Section 5.4, the pressure
transducer performance requirements are presented in Table 5. The transducer
requirements are divided into 4 different categories based application.
The transducer specifications for the nose cap sensor array are an operating range of
1000 to 4300psf, a maximum orifice temperature of 30000 F, and an accuracy of 0.3% of
max. Based on SEADS like air data sensing technique, the argorithm for angle of attack
extraction is inverted to obtain the pressure sensor accuracy requirements based on the
angle of attack requirements. In order to resolve a 0.10 angle of attack accuracy, a 0.3%
precision pressure transducers are needed. The pressure transducer thermal requirements
are dependent on the bandwidth requirements and the orifice design. The bandwidth
requirement for the nose cap air data sensor system is estimated to be order of 1Hz. If the
angle of attack and angle of attack rate is needed to control the vehicle short period mode
for the propulsion system, then the bandwidth requirement would be order of magnitude
larger than the short period frequency.
The transducer requirements for the static pressure sensors are a pressure range of
10 to 2100psf, a maximum orifice temperature of 15000 F and an accuracy of 0.3% based
on the pressure altitude measurement requirement. The static pressure sensors are normally
placed on the side of the fuselage where the surface temperature would be much lower than
the stagnation region. Usually high bandwidth measurement is not required.
90

91
Pressure Transducer Requirements
TemperatureLocation Range
PressureRange
Accuracy(% Max)
Air Data System
Nose Cap Area
Static Pressure
0- 3000oF
0 -15000 F
1000 - 4300psf
10-2100psf
Propulsion Control System
Inlet Array
Inlet Differential
0 - 3000oF
0- 3000OF
200 - 4300psf
200-4300psf
Table 5
91
0.3%
0.3%
0.1%

92
The inlet pressure transducers which detect the inlet flow field will also require high
precision and high bandwidth. If such transducers are used inside the inlet control loop,
the transducer requirements would have an operating range of 200 psf to 4300 psf, a
maximum orifice temperature of 30000 F, and an accuracy of 0.1% of max. In addition,
bandwidth requirements of 100Hz to 500Hz may be needed for the inlet controller. Due to
the high bandwidth requirements, the inlet pressure transducers would likely be placed near
the surface, therefore the transducer itself must endure the 30000 F thermal loads.
The engine yaw detection sensor would utilize differential pressure sensors within
the inlet. The transducer requirements would be an operating range of 200 to 4300psf, a
maximum orifice temperature of 20000 F.
9.2 APPLICABILITY OF CURRENT TECHNOLOGY SENSORS
Based on the pressure transducer performance requirements of Section 9.1, the
applicability of current commercially available pressure transducers was reviewed. The
most stringent pressure transducer specification comes from the inlet sensor arrays. Since
the transducer must be placed very close to the high temperature surface, the transducer
must operate at near 3000 OF while providing 0.1% transducer accuracy. A partial list of
representative commercially available pressure transducers is presented in Table 6. Many
of the transducers are low pressure high precision piezo-resistive or strain gauge type and a
few high temperature, high pressure water cooled strain gauge transducers are also
included. The low pressure transducers typically have an operating range of 0 to 2200psf
with accuracies between 0.25 and 0.5%. Typical maximum operating temperatures are
2500 F and often the transducers are temperature compensated to only 1600 F. In general,
the accuracy of the transducer decreases with increased operating temperature.
92

93
Of those reviewed,there is only one transducer, with a built in active cooling
capability, which can meet the 30000 F temperature requirement of the engine inlet sensors.
However, this transducer has an accuracy of 1% and cannot meet the accuracy
requirements of 0.1% to 0.3%. There are several transducers which can meet the accuracy
requirements however their maximum operating temperatures are too low. None of the
current pressure transducers which were reviewed could meet both the thermal and
accuracy requirements. Therefore, active or passive cooling would be required to employ
existing technology high precision transducers.
93

Current Transducer Performance
Technique
Strain gauge(uncooled)
Strain gauge(water cooled)
Piezoresistive
Silicon onSapphire
Vibrating QuartzCrystal
Sputtered ThinFilm
DifferentialCapacitive
Hybrid Mechanical
P-Range (psi)
0-15
Accuracy (%)
0.25 - 1
0-1000
0 - 20
0-15
0 -20
0-15
0-15
0-15
0.2 - 0.5
0.1
0.02
0.1 - 0.5
0.08
0.021
Temp (OF)(max)
150-600
150-6000
150- 500
150 - 250
230
300-650
160
160
Case Vollume (in3)
0.884 -20.32
2.35 -9.4
0.003 -0.0909
1.57
4.03
1.57- 1.89
62.9
237.5
Table 6
94

95
10.0 CONCLUSION
The air data and inlet control measurement requirements for advanced hypersonic
vehicles such as the NASP were estimated based on anticipated trajectories and vehicle
configurations. Based on the available literature on prior hypersonic air data systems on
the X-15, SR-71 and the Shuttle Orbiter, surface pressure based measurement systems
such as the Shuttle Entry Air Data System (SEADS) appear to be the most promising
candidates for advanced hypersonic vehicles. A SEADS-like forebody pressure
distribution system for air data measurement combined with an inlet surface pressure array
for active inlet control is considered to be the most viable air data measurement
configuration. Due to the stringent requirements on the air data and inlet control
parameters, as well as the need to locate the surface pressure sensors in regions of extreme
thermal load resulted in rigorous pressure transducer requirements (0.1% accuracy at
30000 F orifice temperature). Existing technology high precision pressure transducers were
found to require active or passive cooling in a hypersonic air data system.
95

96
REFERENCES
Ref. 1 Pruett, D, Siemers, P., Heck, M., "An Innovative Air Data System for the
Space Shuttle Orbiter: Data Analysis Technique", AIAA Paper 81-24551981.
Ref. 2 Hillje, E., "The Orbiter Air Data System", AIAA Paper 1983.
Ref. 3 Wolowicz, C.and Gossett, T., "Operational and Performance Characteristicof the X-15 Spherical Hypersonic Flow Direction Sensor", NASA TND-
3070, August 1965.
Ref. 4 Webb, L.,"Characteristics and Use of X-15 Air Data Sensors", NASA TN
D-4597 Nov. 1967.
Ref. 5 Larson, T., Webb, L.,"Calibration and Comparisons of Pressure-Type
Airspeed System of the X-15 Airplane from Subsonic to High SupersonicSpeeds", NASA TN D-1724, Dec. 1962.
Ref. 6 Lehtinen, B., Zeller, J., Geyser, L., "Optimal Control of Supersonic Inletsto Minimize Unstarts", NASA TN D-6408 July 1971.
Ref. 7 YF-12 Experiments Symposium, Vol.1, NASA Conference Publication2054, Sept. 1978.
Ref. 8 Pegg, R.J., "National Aero-space Plane", NASA, Briefing to theCongressional Aeronautical Advisory Committee, March 1988.
Ref. 9 Personal communication with M. Martinez Sanchez, (MIT Aero & Astro)on March 1988.
Ref. 10 Shapiro, R., "An Adaptive Finite Element Solution Algorithm for the theEuler Equations", Ph.D. Thesis, MIT Dept. of Aero & Astro, May 1988.
Ref. 11 NASA Conference on Supersonic Missile Propulsion, March, 1952.
96

97
Ref. 12 Goldstein, Richard J., Fluid Mechanics Measurements, HemispherePublishing Corporation, 1983, pp. 61 - 97.
Ref. 13 Lewis, Mark J., "The Prediction of Inlet Flow Stratification and ItsInfluence on the Performance of Air-Breathing Hypersonic PropulsionSystem" , Ph.D. Thesis, MIT Dept. of Aero & Astro, June 1988.
Ref. 14 Personal Communication with P. Gibson, NASA Langley, May 1989
Ref. 15 Neumann, R.D., "Instrumentation Concepts for 'X'-Series Aircraft",AIAA Paper 88-4650-CP, Sept. 1988.
Ref. 16 Koppenwallner, G. "Hypersonic Aerothermodynamics", Von KarmannInstitute for Fluid Dynamics, Lecture Series 1984-01, Feb. 1984.
Ref. 17 Cassidy, Michael P., "An Optimization Process For the Scramjet Phase ofthe Ascent Trajectory of a Next Generation Space Shuttle",S.M. Thesis, MIT Dept. of Aero & Astro, Feb. 1986.
Ref. 18 Sizoo, David G., "The Effects of Dynamic Error Sources on the AltitudeHold Performance of Aircraft Tracking a Pressure Altitude"S.M. Thesis, MIT Dept. of Aero & Astro, Sept. 1986.
Ref. 19 Holman, J.P.,"Heat Transfer", McGraw-Hill Kogakusha LTD., FourthEdition, 1976.
Ref. 20 Franklin R.E.,Wallace J.M.,"Absolute Measurements of Static-Hole ErrorUsing Flush Transducers", J. Fluid Mech. 1970, vol. 42, part 1, pp. 33-48
97