ainsworth game technology (investment thesis)
TRANSCRIPT

Optimum Capital Management Pty LtdInvestment Thesis for
Ainsworth Game Technology
December 2014 Prepared by Heinrich Jacobs
Managing Director & Chief Investment Officer
w: optimum-capital.com.au e: [email protected]

DisclaimerOp#mum Capital Management Pty Ltd ABN 60 154 164 020 is the Trustee and Investment Manager of the Op#mum Australian Equi#es Value Fund (“the Fund”) ABN 38 923 100 447. The Trustee is a corporate authorised representa#ve (No. 467287) of Lanterne Strategic Investors Pty Ltd (ABN 49 098 472 587, AFSL 238198).
This presenta#on is not a recommenda#on to invest in the Fund and may not include all of the informa#on that a prospec#ve investor needs to make an investment decision. Op#mum Capital Management does not take into account the individual circumstances of any prospec#ve investor, nor does it give any advice whatsoever but to the extent that it does, it cons#tutes only general advice and not personal advice. Accordingly, prospec#ve investors should make their own independent enquiries and obtain professional legal, financial, tax and accoun#ng advice before making an investment decision.
Disclosure -‐ The author is a shareholder in Ainsworth Game Technology

Table of Contents
• Business Overview
• History of Ainsworth
• Valua#on
• Risks
• Conclusion

Business Overview

Ainsworth Game Technology (AGI)
ASX Code: AGI
Share Price: $2.10*
Market Cap: $750m
Enterprise Value: $695m
Founded in 1995, AGI has grown into one of Australia’s most dominant gaming machine operators
• $244m of sales in 2014 (+23% on prior year) • $89m EBITDA in 2014 (+20% on prior year) • $62m Net profit in 2014 (+19% on prior year) • $72m Net Cash posi#on with minimal debt
Unique Jurisdic@onal Licenses • AGI has 163 jurisdic#onal licenses globally and secured 31 new gaming licences in 2014 including Mississippi, Missouri, Arizona, and Alderney
Interna@onal Expansion • Interna#onal revenue of $100m (+37% on prior year) and strong growth in key market of the Americas. Interna#onal revenue now accounts for 41% of total company revenue.
*Share price at time of writing
ADrac@ve Yield & Return on Equity • Earnings yield between 8-‐9% • Dividend yield between 4-‐5% • Return on equity ~ 25%
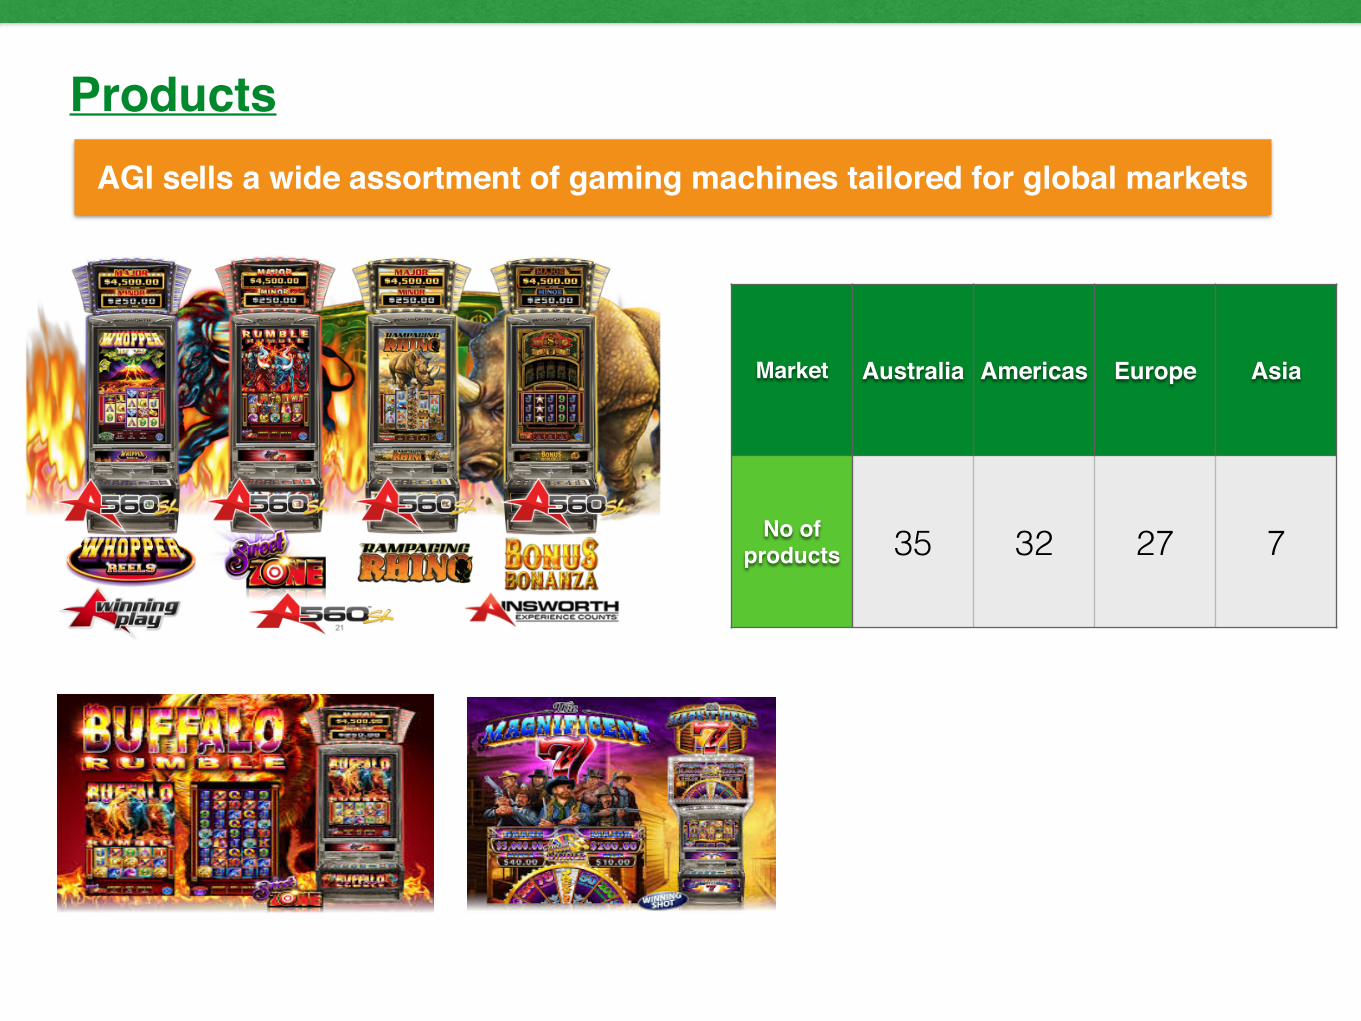
ProductsAGI sells a wide assortment of gaming machines tailored for global markets
Market Australia Americas Europe Asia
No of products 35 32 27 7

$58.5m
$31.9m
$1.0m
$4.1m
$143.3m
$5.3m
AGI is growing its International operations and is establishing a well-diversified business with strategic relationships being developed overseas
Diverse Footprint
Source: Ainsworth’s 2014 Financial Report
Revenue by geography

History of AGI

Five Year Share Price Performance
AGI was trading at approximately $4.45 per share in March 2014 but has since traded down primarily due to softer than expected earnings in FY14
$4.45
Recentprice:$2.25
Source: Yahoo Finance

Intrinsic Value RisingHas the share price decline been warranted? The Intrinsic Value (Blue Line) of the company has steadily been rising and the share price is trading below Intrinsic Value
*Rising Intrinsic Value
Current share price mostly driven by market shortsightedness
Mis-pricing opportunity
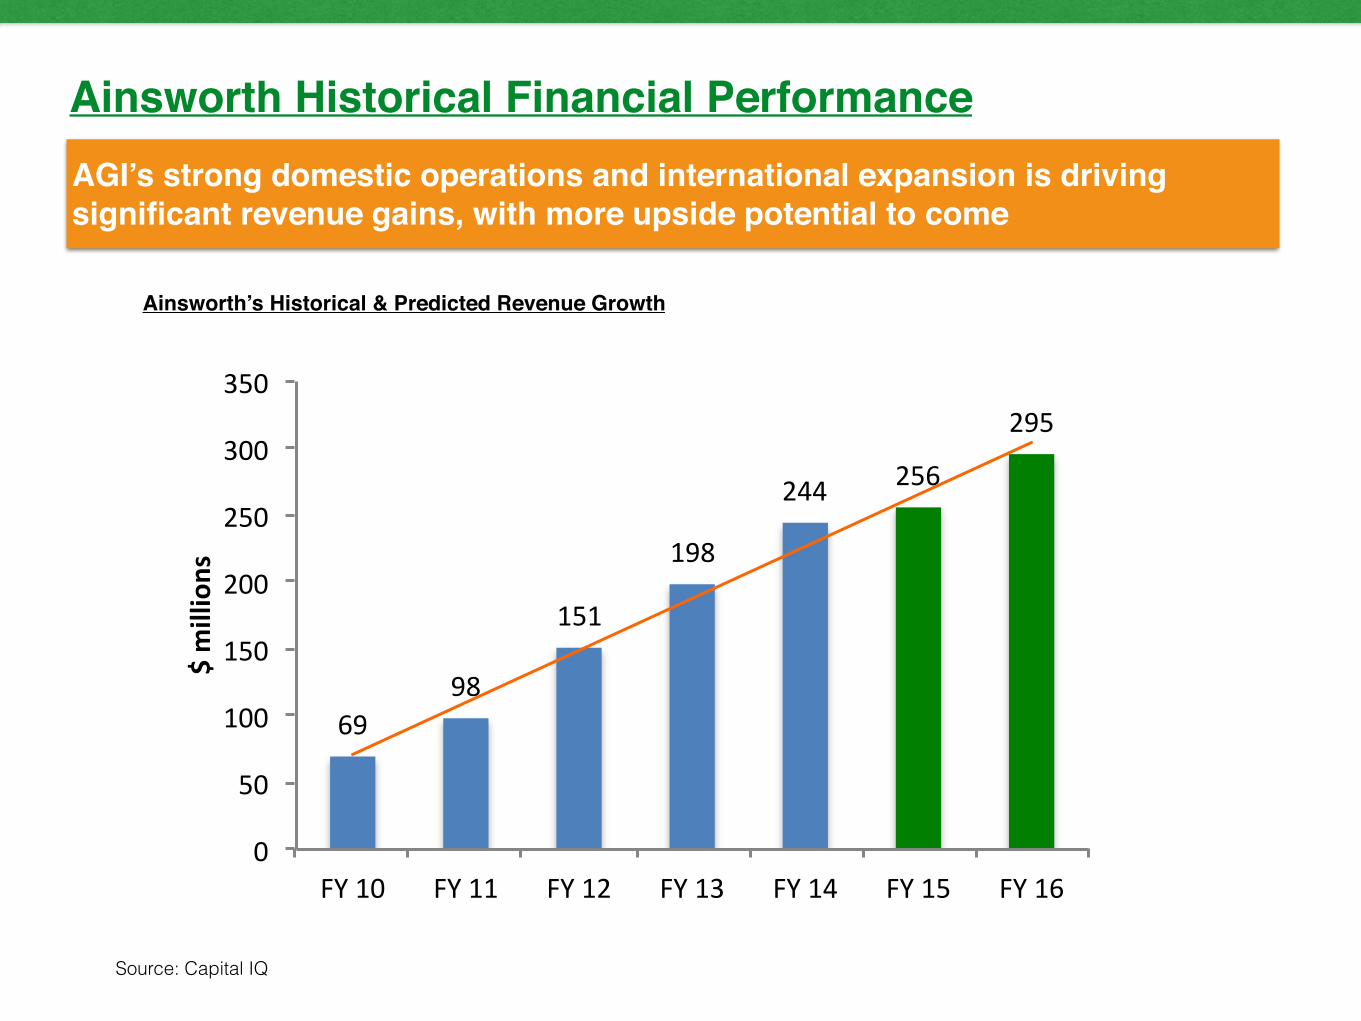
Ainsworth Historical Financial PerformanceAGI’s strong domestic operations and international expansion is driving significant revenue gains, with more upside potential to come
Source: Capital IQ
69#98#
151#
198#
244# 256#
295#
0#
50#
100#
150#
200#
250#
300#
350#
FY#10# FY#11# FY#12# FY#13# FY#14# FY#15# FY#16#
$"millions"
Ainsworth’s Historical & Predicted Revenue Growth

Ainsworth Historical Financial PerformanceManagement has a strong focus on operational excellence through product innovation, capital discipline and strong execution. As a result, the Company’s profitability has increased.
Source: Capital IQ
Ainsworth’s Historical EBITDA Performance
7"
26"
51"
67"
85"
0"
10"
20"
30"
40"
50"
60"
70"
80"
90"
100"
FY"10" FY"11" FY"12" FY"13" FY"14"
$"millions"
!(0.01)!!!
!0.08!!
!0.22!!
!0.16!!!0.19!! !0.2!!
!0.23!!
!(0.05)!!!
!0!!
!0.05!!
!0.1!!
!0.15!!
!0.2!!
!0.25!!
!0.3!!
FY!10! FY!11! FY!12! FY!13! FY!14! FY!15! FY!16!
cents&p
er&sh
are&
Ainsworth’s Historical & Predicted Earnings Per Share

High Returns on Capital
Source: Capital IQ
(15%)
(8%)
0%
8%
15%
23%
30%
2009 2010 2011 2012 2013 2014
22%21%22%
16%
4%-9%

Improving Margins
Source: Capital IQ
-17.5
0
17.5
35
52.5
70
2009 2010 2011 2012 2013 2014
EBITDA Margin % Gross Margin %
%

Valuation

Which would you rather own?
1. A 1 year Term Deposit at a 3.25% yield
2. A 5 year Term Deposit at a 4.00% yield
3. Shares in a quality company with an initial 9%, 8.6%, or even 8.2% earnings yield and growing over time

What’s the pay cheque?
Share Price Current Earnings Per Share (c) Earnings Yield (%)
$2.10 0.19 9.04
$2.20 0.19 8.63
$2.30 0.19 8.26
With the share price at current levels an attractive earnings and dividend yield is being offered to investors
Share Price Current Dividends Per Share (c) Dividend Yield (%)
$2.10 0.10 4.76
$2.20 0.10 4.54
$2.30 0.10 4.34

How does it compare?
On a comparable basis with rival Aristocrat, Ainsworth looks cheap on several fronts
Comparables Ainsworth Aristocrat
Market Cap ($m) 765 4,261
Enterprise Value (EV) 695 4,075
EBITDA ($m) 85 198.8
Multiple 8.17 20.5 x
Price/Earnings 11.2 x 23 x
Return on Equity (3yr Avg) 30.5 22.6

Value of AGI
Norm. Earnings - Maint. Capex 50.06WACC 9%
Cash & Equivalents 71.929Interest Bearing Debt 0.463Shares Outstanding 322
Total Equity 235Intangibles 4.701
Earnings Value Power (EVP) $1.95Tangible Book Value (TBV) 0.72
EVP + TBV $2.67Current Share Price $2.10
Margin of Safety +27.00%
• Combining the earnings power and tangible assets of AGI you have a company conservatively valued at $2.67 per share and trading at a 27% discount.
Our conservative NO growth valuation is based on the current free cash flow plus tangible book value of the company. Since future growth is excluded from the analysis, only maintenance capital expenditures are subtracted from after-tax EBIT and growth is ignored

Target ValuationBut what about growth? Ainsworth is a growing company so we should consider a reasonable multiple on EBITDA to arrive at our implied share price valuation
EV/EBITDA 11x 12x 13x 14x
EBITDA(m) 85 85 85 85
Implied Enterprise Value(m) 935 1,020 1,105 1,190
Cash(m) 72 72 72 72
Implied Equity Value(m) 1,007 1,092 1,177 1,262
Shares Outstanding(m) 322 322 322 322
Implied Share Price $3.12 $3.39 $3.65 $3.91
Valuation Multiples

Risks

What’s the Downside?
There are a number of bear points to consider as Ainsworth operates in a competitive and regulated industry, and across geographies
• External factors such as economic condi#ons and credit markets
• AGI’s main customers (casino’s & clubs) may experience a slow down and as a result purchase less of AGI’s products
• Consumer preferences may change and AGI’s gaming machines may lose popularity
• AGI’s growth in new Interna#onal markets may slow or the company may fail to obtain licensing and approval’s

Conclusion• At current price’s, AGI offers a very aDrac@ve equity and dividend yield that could grow over @me
-‐ AGI has a ~8-‐9% current earnings yield and ~4-‐5% dividend yield
• The current share price is not factoring in the earnings power of the company and the securi@es are mis-‐priced -‐ Net Cash of $72m on the balance sheet with minimal debt
• High quality business with good track record of opera@onal and financial performance
• Interna@onal expansion to deliver ongoing growth opportuni@es
• AGI has a high quality porRolio of gaming products in an industry with high barrier to entry
• The founder Leonard Ainsworth is a pioneer of the industry and holds a majority ownership stake in the company
Get In Contact With UsIf you would like to discuss this presenta#on or find out more informa#on about our Australian Equi#es Value Fund (applica@ons now open) please email us at info@op#mum-‐capital.com.au Thank you