aidsto determining fuelmodels for estimating fire behavior
TRANSCRIPT

A Rrblication of thellrfqrel WlltlflnCoordlnrUng Group
Sponsored DyLhited SdesDepfinent of Agriculfure
thited Sd€gDeparUnent of hteric
Netond Associdon of$ale Forssters
AidsFuelFor EstimatingFire BehaviorHal E. Anderson
to DeterminingModels
General TechnicalReport INT-122
Apri l 1982

THE AUTHOR
HAL E. ANDERSON has been project leader of the FuelScience Research Work Unit since 1966. He joined thestaff of Intermountain Station's Northern Forest FireLaboratory at Missoula, Mont., in 1961 . He served asproject leader of the fire physics project from 1962 to'1966. Prior to employment with the Forest Service, hewas with the General Electric Co. and worked on thermaland nuclear instrumentation from 1952 to 1961. His B.S.degree in physics was obtained at Central WashingtonUniversity in 1952.
RESEARCH SUMMARY
This report presents photographic examples, tabula-tions, and a similarity chart to assist f ire behavior off i-cers, fuel management specialists, and other field per-sonnel in selecting a fuel model appropriate for a specificfield situation. Proper selection of a fuel model is a criti-cal step in the mathematical modeling of fire behaviorand f i re danger rat ing. This guide wi l l faci l i tate the selec-tion of the proper fire behavior fuel model and will allowcomparison with fire danger rating fuel models.
The 13 fire behavior fuel models are presented in 4 fuelgroups: grasslands, shrublands, timber, and slash. Eachgroup comprises three or more fuel models; two or morephotographs illustrate field situations relevant to eachfuel model. The 13 fire behavior fuel models are cross-referenced to the 20 fuel models of the National FireDanger Rating System by means of a similarity chart.Fire behavior luel models and fire danger rating fuelmodels, along with the fire-carrying features of the modeland its physical characteristics, are described in detail.
CONTENTS
Page
l n t r o d u c t i o n . . . . . 1H o w F u e l M o d e l s a r e D e s c r i b e d . . . . . . . . . . . . . . 1F u e l M o d e l D e s c r i p t i o n s . . . . . . . 4
Grass GroupF i r e B e h a v i o r F u e l M o d e l 1 . . . . . . . . . . . . . . 4F i r e B e h a v i o r F u e l M o d e l 2 . . . . . . . . . . . . . . 5F i r e B e h a v i o r F u e l M o d e l 3 . . . . . . . . . . . . . . 6
Shrub GroupF i r e B e h a v i o r F u e l M o d e l 4 . . . . . . . . . . . . . . 7F i r e B e h a v i o r F u e l M o d e l 5 . . . . . . . . . . . . . . IF i r e B e h a v i o r F u e l M o d e l 6 . . . . . . . . . . . . . . IF i r e B e h a v i o r F u e l M o d e l 7 . . . . . . . . . . . . . 1 0
Timber GroupF i r e B e h a v i o r F u e l M o d e l I . . . . . . . . . . . . . 1 1F i r e B e h a v i o r F u e l M o d e l 9 . . . . . . . . . . . . . 1 2F i r e B e h a v i o r F u e l M o d e l 1 0 . . . . . . . . . . . . 1 3
Logging Slash GroupF i r e B e h a v i o r F u e l M o d e l ' 1 1 . . . . . . . . . . . . 1 4F i r e B e h a v i o r F u e l M o d e l 1 2 . . . . . . . . . . . . 1 5F i r e B e h a v i o r F u e l M o d e l ' 1 3 . . . . . . . . . . . . 1 6
Correlation of Fire Behavior Fuel Models andN F D R S F u e l M o d e l s . . . . . . . . 1 7
P u b l i c a t i o n s C i t e d . . . . . 1 9A p p e n d i x : E v o l u t i o n o f F u e l M o d e | s . . . . . . . . . . 2 0
l n t r o d u c t i o n . . . . . . . . . 2 0F u e l s D e f i n e d . . . . . . . . . . . . . . 2 0H o w F u e l s H a v e B e e n D e s c r i b e d . . . . . . . . . . 2 0
Addltional copies of this publication may be ordered from:
National Interagency Fire GenterAfiN: Supply
3833 S. Development AvenueBoise, ldaho 83705
Order NFES # 1574
United StatesDepartment ofAgricul ture
Forest Service
IntermountainForest and RangeExperiment StationOgden, UT 84401
General TechnicalReport INT-122-\
' Apri t 1982
Aids to DeterminingFuel ModelsFor EstimatingFire BehaviorHal E. Anderson
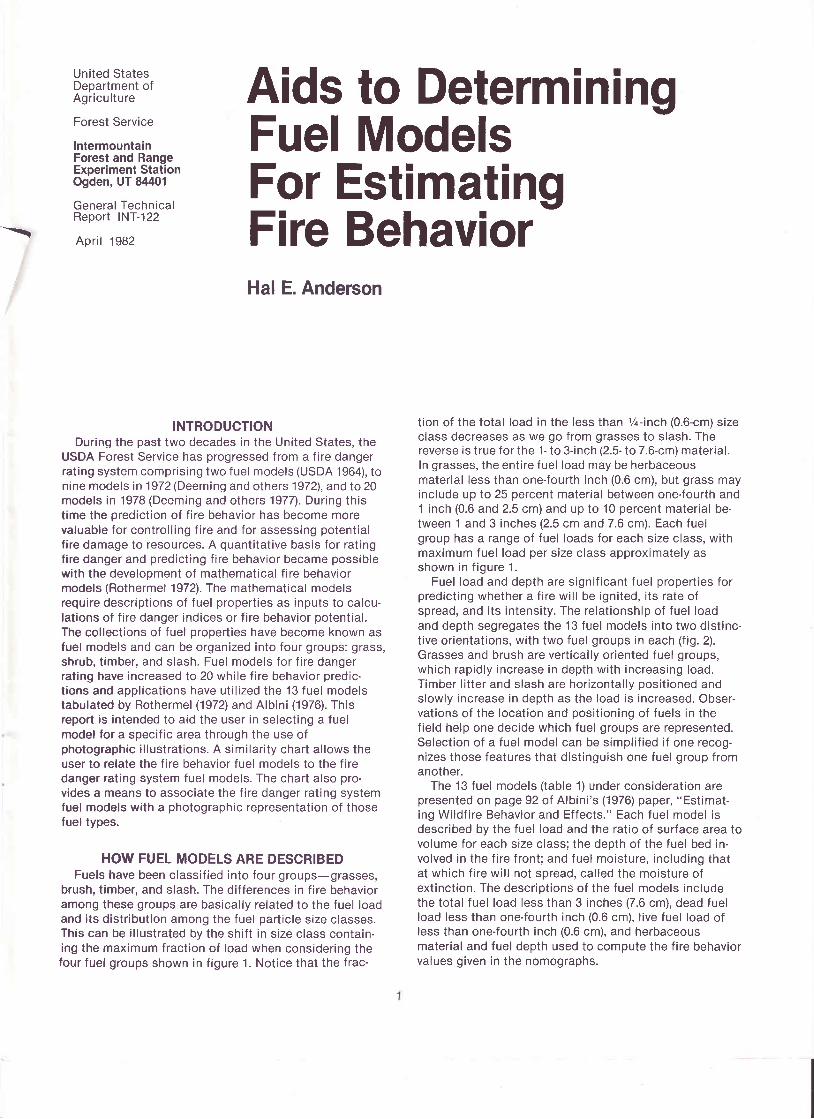
INTRODUCTIONDuring the past two decades in the United States, the
USDA Forest Service has progressed from a fire dangerrat ing system compr is ing two f uel models (USDA 1964), tonine models in 1972 (Deeming and others 1972), and to 20models in 1978 (Deeming and others 1977). Dur ing th istime the prediction of f ire behavior has become morevaluable for contro l l ing f i re and for assessing potent ia lf ire damage to resources. A quantitative basis for ratingfire danger and predicting f ire behavior became possiblewith the development of mathematical f ire behaviormodels (Rothermel 197 21. Ihe mathematical modelsrequire descriptions of fuel properties as inputs to calcu-lat ions of f i re danger indices or f i re behavior potent ia l .The collections of fuel properties have become known asfuel models and can be organized into four groups: grass,shrub, t imber, and s lash. Fuel models for f i re dangerrating have increased to 20 while f ire behavior predic-t ions and appl icat ions have ut i l ized the 13 f uel modelstabulated by Rothermel (19721and Albini (1976). Thisreport is intended to aid the user in selecting a fuelmodel for a specific area through the use ofphotographic i l lust rat ions. A s imi lar i ty char t a l lows theuser to relate the fire behavior fuel models to the f iredanger rating system fuel models. The chart also pro-vides a means to associate the fire danger rating systemfuel models with a photographic representation of thosefuel types.
HOW FUEL MODELS ARE DESCRIBEDFuels have been classified into four groups-grasses,
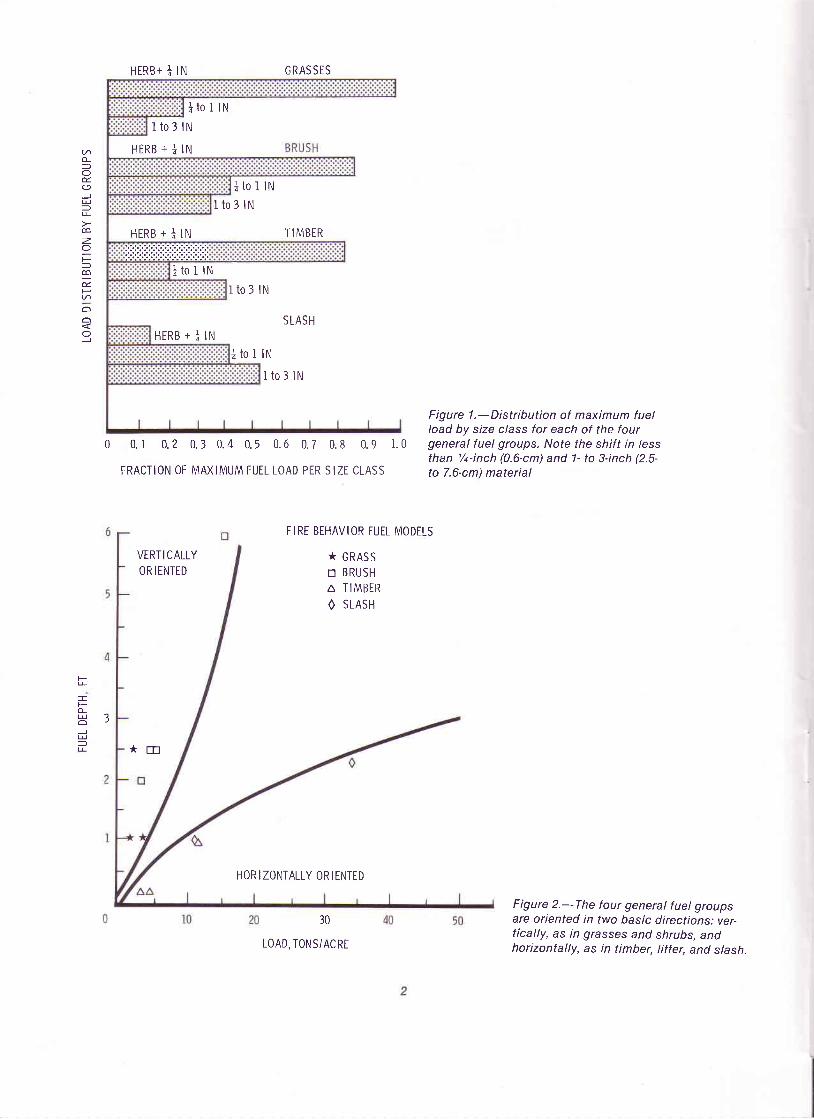
brush, t imber, and slash. The differences in fire behavioramong these groups are basically related to the fuel loadand i ts d is t r ibut ion among the fuel par t ic le s ize c lasses.This can be i l lustrated by the shift in size class contain-ing the maximum fract ion of load when consider ing thefour fuel groups shown in f igure 1. Not ice that the f rac-
t ion of the tota l load in the less than %-inch (0.6-cm) s izeclass decreases as we go from grasses to slash. Thereverse is t rue for the 1- to 3- inch (2.5- to 7.6-cm) mater ia l .In grasses, the entire fuel load may be herbaceousmaterial less than one-fourth inch (0.6 cm), but grass mayinclude up to 25 percent material between one-fourth and1 inch (0.6 and2.5 cm)and up to 10 percent mater ia l be-tween 1 and 3 inches (2.5 cm and 7.6 cm). Each fuelgroup has a range of fuel loads for each s ize c lass, wi thmaximum f uel load per s ize c lass approximately asshown in f igure 1.
Fuel load and depth are s igni f icant fuel propert ies forpredict ing whether a f i re wi l l be igni ted, i ts rate ofspread, and i ts in tensi ty . The re lat ionship of fuel loadand depth segregates the 13 fuel models in to two d is t inc-t ive or ientat ions, wi th two fuel groups in each ( f ig . 2) .Grasses and brush are ver t ica l ly or iented fuel groups,which rapid ly increase in depth wi th increasing load.Timber l i t ter and s lash are hor izonta l ly posi t ioned andslowly increase in depth as the load is increased. Obser-vat ions of the locat ion and posi t ion ing of fuels in thef ie ld help one decide which fuel groups are represented.Select ion of a fuel model can be s impl i f ied i f one recog-nizes those features that d is t inguish one fuel group f romanother.
The 13 fuel models ( table 1) under considerat ion arepresented on page 92 of Albini 's (1976) paper, "Estimat-
ing Wi ldf i re Behavior and Ef fects." Each fuel model isdescribed by the fuel load and the ratio of surface area tovolume for each s ize c lass; the depth of the f uel bed in-volved in the f i re f ront ; and fuel moisture, inc luding thatat which f i re wi l l not spread, ca l led the moisture ofext inct ion. The descr ipt ions of the fuel models inc ludethe total fuel load less than 3 inches (7.6 cm), dead f uelload less than one-fourth inch (0.6 cm), l ive fuel load ofless than one-fourth inch (0.6 cm), and herbaceousmaterial and f uel depth used to compute the f ire behaviorvalues g iven in the nomographs.
I
t )
=t
Ju
u
z
==aFt/)
oa
J
HERB+ | ;11
i t o l IN
I t o 3 lN
HERB + i 111
* t o I lN
t to 3 lN
HERB + + IN
] to I lN
I to 3 lN
HERB + ] 111
i t o I
0 0 . l 0 .2 0 .3 0 .4 0 .5
FRACTION OF MAXIMUM FUEL
0 . 6 0 . 7 0 . 8 0 . 9 1 . 0
LOAD PER SIZE CLASS
Figure 1.-Distribution of maximum f uelload by sZe c/ass for each of the fourgeneral f uel groups. Note the shift in lessthan l/q-inch (0.6-cm) and 1- to 3-inch 2.5-to 7.6-cm) material
G RAS SES
T IMBER
SLASH
I N
I t o 3 lN
u
Fo-U ?-Ju=L
VIRT I CALLYOR I ENTED
* E
FIRE BEHAVIOR FUEL MODELS
* GRASSn BRUSHA T I M B E R
O SLASH
HORIZONTALLY ORIENTED
30
LOAD, TONS/ACRE
Figure 2.-The four general f uel groupsare oriented in two basic directions: ver-tically, as in grasses and shrubs, andhorizontally, as in timber, litter, and slash.

Table 1.- Description of fuel models used in fire behavior as documented by Albini (1976)
Fuel model Typical fuel complexFuel loading
t hour 10 hours 100 hours Live Fuel bed depthMoisture of extinction
dead fuels
Tons/acre---- Feet
1 .01 .02.5
Percent
I
4
67
B9
1 0
' t1
1 21 3
0.742.003.01
5.011.001.501 . 1 3
0.001.00.00
0.00.50.00
0.00.50.00
5.012.00.00
0.00.00
2.00
0,00.00.00
Grass and grass-dominatedShort grass (1 foot)Timber (grass and understory)Tal l grass (2.5 feet)
Chaparral and shrub f ieldsChaparral (6 feet)Brush (2 feet)Dormant brush, hardwood slashSouthern rough
Timber l i t terC losed t imber l i t te rHardwood l i t terTimber ( l i t ter and understory)
SlashL igh t logg ing s lashMedium logg ing s lashHeavy logg ing s lash
20202540
302525
1.502.923.01
6.02.02.52.5
0.2.2
1 .0
1 .02.33.0
4.01 2.00.50 .00
2.50 2.001 .87 1.50
1.504.017.01
1.00.41
2.00
4.5114.0323.04
2.50. t c
5.01
5.5116.5328.05
1 21 525
1 52025
The cr i ter ia for choosing a fuel model inc ludes the factthat the f i re burns in the fuel s t ratum best condi t ioned tosupport the f i re . This means s i tuat ions wi l l occur whereone fuel model represents rate of spread most accuratelyand another best depicts f i re in tensi ty . In other s i tu-at ions, two fuel condi t ions may exis t , so the spread off i re across the area must be weighted by the f ract ion ofthe area occupied by each fuel . Fuel models are s implytools to help the user real is t ica l ly est imate f i re behavior .The user must mainta in a f lex ib le f rame of mind and anadapt ive method of operat ing to tota l ly ut i l ize these a ids.For th is reason, the f uel models are descr ibed in terms ofboth expected fire behavior and vegetation.
The Nat ional F i re Danger Rat ing System (NFDRS)depends upon an ordered set of weather records toestablish conditions of the day. These weather condi-t ions a long wi th the 1978 NFDRS fuel models are used to
represent the day-to-day and seasonal trends in firedanger. Modi f icat ions to the fuel models are possib le bychanges in l ive/dead ratios, moisture content, fuel loads,and drought in f luences by the large fuel ef fect on f i redanger. The '13 fuel models for f ire behavior estimationare for the severe oeriod of the f ire season when wildfirespose greater control problems and impact on land re-sources. F i re behavior predict ions must ut i l ize on-s i teobservations and short-term data extraoolated fromremote measurement s tat ions. The f ie ld use s i tuat iongenerally is one of stress and urgency. Therefore, theselect ion opt ions and modi f icat ions for f uel models arel imi ted to mainta in a reasonably s imple procedure to usewi th f i re behavior nomographs, moisture content adjust-ment char ts , and wind reduct ion procedures. The NFDRSfuel models are part of a computer data processingsystem that presently is not suited to real-time, in-the-f ie ld predict ion of f i re behavior .

FUEL MODEL DESCRIPTIONSGrass Group
Fire Behavior Fuel Model 1Fire spread is governed by the f ine, very porous, and
continuous herbaceous fuels that have cured or arenearly cured. Fires are surface f ires that move rapidlythrough the cured grass and associated material, Veryl i t t le shrub or t imber is present , general ly less than one-th i rd of the area.
Grasslands and savanna are represented along withstubble, grass- tundra, and grass-shrub combinat ions thatmet the above area constraint. Annual and oerennialgrasses are included in this fuel model. Refer to photo-graphs 1,2, and 3 for i l lust rat ions.
This fuel model corre lates to 1978 NFDRS fuel modelsA, L, and S.
Fuel model values for estimating fire behavior
Total fuel load, < 3-inchdead and live, tons/acre 0.74
Dead fuel load, %- inch,tons/acre .74
Live fuel load, fo l iage,tons/acre 0
Fuel bed depth, feet 1.0
Photo 1. Western annual grasses suchas cheatg rass, med u sah eadryegrass, and fescues.
Photo 2. Live oak savanna of the South-west on the Coronado NationalForest.
Photo 3: Open pine-grasslands on theLewis and Clark NationalForest
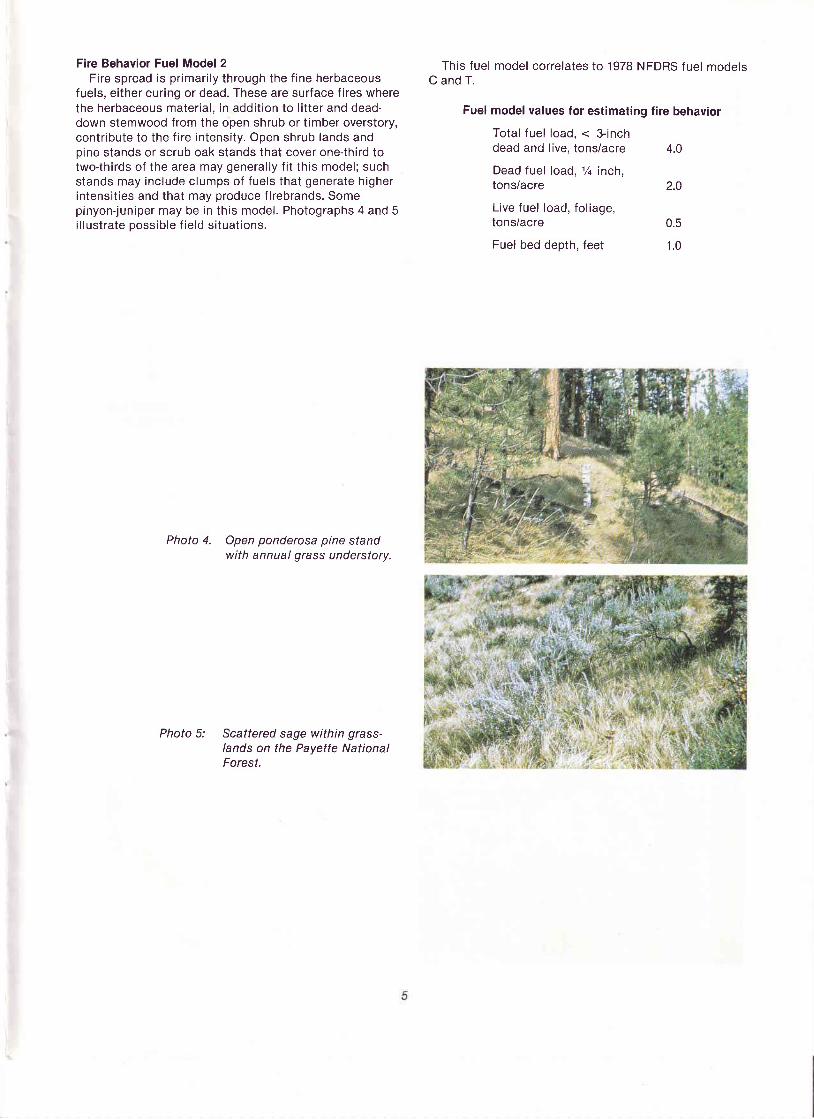
Fire Behavior Fuel Model 2Fi re spread is pr imar i ly through the f ine herbaceous
fuels, either curing or dead. These are surface f ires wherethe herbaceous mater ia l , in addi t ion to l i t ter and dead-down stemwood from the open shrub or t imber overstory,contr ibute to the f i re in tensi ty . Open shrub lands andoine stands or scrub oak stands that cover one- th i rd totwo-th i rds of the area may general ly f i t th is model ; suchstands may inc lude c lumps of fuels that generate h igherintensi t ies and that may produce f i rebrands. Somepinyon- juniper may be in th is model . Photographs 4 and 5i l lust rate possib le f ie ld s i tuat ions.
Photo 4. Open ponderosa pine standwith annual grass understory.
Photo 5: Scattered sage within grass-lands on the Pavette NationalForest.
This fuel model corre lates to 1978 NFDRS fuel modelsC and T.
Fuel model values for estimating fire behavior
Tota l fuel load, < 3- inchdead and live, tons/acre 4.0
Dead fuel load, % inch,tons/acre 2.0
Live fuel load, fo l iage,tons/acre 0.5
Fuel bed depth, feet 1.0

Fire Behavior Fuel Model 3Fi res in th is fuel are the most in tense of the grass
group and d isplay h igh rates of spread under the in f lu-ence of wind. Wind may dr ive f i re in to the upper heightsof the grass and across standing water . Stands are ta l l ,averaging about 3 feet (1 m), but considerable var iat ionmay occur . Approximately one- th i rd or more of the standis considered dead or cured and mainta ins the f i re . Wi ldor cultivated grains that have not been harvested can beconsidered s imi lar to ta l l pra i r ie and marshland grasses.Refer to photographs 6, 7, and 8 for examples of f uelsf i t t i ng t h i s mode l .
This fuel corre lates to 1978 NFDRS fuel model N.
Fuel model values for estimating fire behavior
Tota l fuel load, < 3- inchdead and live, tons/acre 3.0
Dead fuel load, %- inch,tons/acre 3.0
Live fuel load, fo l iagetons/acre 0
Fuel bed depth, feet 2.5
Fires in the grass group fuel models exhib i t some ofthe faster rates of spread under s imi lar weather condi-t ions. Wi th a windspeed of 5 mi /h (8 kmih) and a moisturecontent of 8 percent, representative rates of spread (ROS)are as follows:
Rate of spread Flame lengthModel Chainslhour Feet
1 7 8 42 3 5 63 104 12
As windspeed increases, model 1 wil l develop fasterrates of spread than model 3 due to fineness of the fuels,fuel load, and depth relations.
Photo 6. Fountaingrass in Hawaii; notethe dead component.
Photo 7. Meadow foxtail in Oregonprairie and meadowland.
Photo 8: Sawgrass "Prairie" and"strands" in the EvergladesNational Park, Fla.

Shrub GroupFire Behavior Fuel Model 4
Fire in tensi ty and fast -spreading f i res involve the fo l i -age and l ive and dead f ine woody mater ia l in the crownsof a near ly cont inuous secondary overstory. Stands ofmature shrubs, 6 or more feet ta l l , such as Cal i forn iamixed chaparra l , the h igh pocosin a long the east coast ,the p inebarrens of New Jersey, or the c losed jack p inestands of the nor th-centra l States are typ ical candidates.Besides f lammable fo l iage, dead woody mater ia l in thestands s igni f icant ly contr ibutes to the f i re in tensi ty .Height of s tands qual i fy ing for th is model depends onlocal condi t ions. A deep l i t ter layer may a lso hamper sup-pression ef for ts . Photographs 9, 10, 11, and 12 depictexamples f i t t ing th is fuel model .
This fuel model represents 1978 NFDRS fuel models Band O; f ire behavior estimates are more severe than ob-ta ined by models B or O.
Fuel model values for estimating l ire behavior
Tota l fuel load, < 3- inchdead and live, tonsiacre 13.0
Dead fuel load, 1/q-inch,
tons/acre 5.0
Live fuel load, fo l iage,tons/acre 5.0
Fuel bed depth, feet 6.0
Photo 10. Chaparral composed of man-zanita and chamise near thelnaja Fire Memorial, Calif .
Photo 11. Pocosin shrub f ield composedol species like fetterbush, gall-berry, and the bays.
Photo 12. High shrub southern roughwith quantity of dead limb-wood.
Photo 9. Mixed chaparral of southernCalifornia: note dead fuel com-ponent in branchwood.
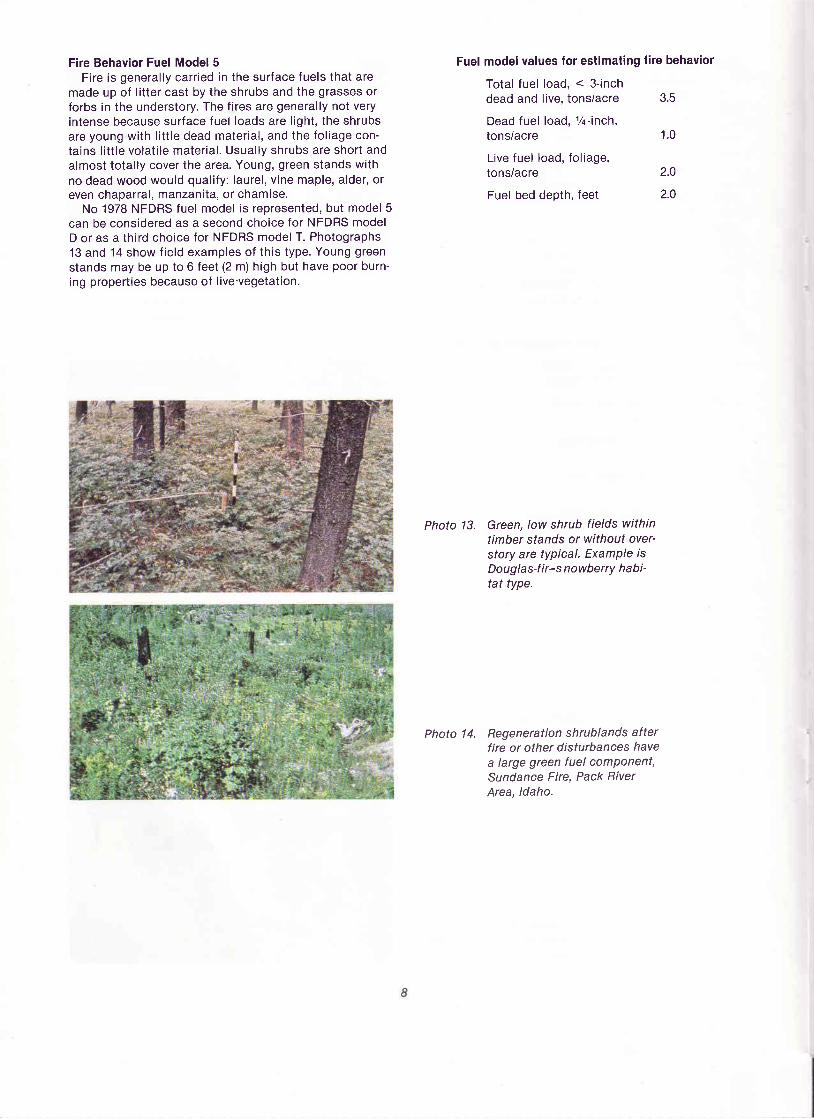
Fire Behavior Fuel Model 5Fi re is general ly carr ied in the sur face fuels that are
made up of l i tter cast by the shrubs and the grasses orforbs in the understory. The fires are generally not veryintense because sur face fuel loads are l ight , the shrubsare young wi th l i t t le dead mater ia l , and the fo l iage con-ta ins l i t t le vo lat i le mater ia l . Usual ly shrubs are shor t andalmost totally cover the area. Young, green stands withno dead wood would qual i fy : laure l , v ine maple, a lder , oreven chaparra l , manzani ta, or chamise.
No '1978 NFDRS fuel model is represented, but model 5can be considered as a second choice for NFDRS modelD or as a th i rd choice for NFDRS model T. Photographs13 and 14 show f ie ld examples of th is type. Young greenstands may be up to 6 feet (2 m) high but have poor burn-ing properties because of l ivevegetation.
Fuel model values for estimating fire behavior
Tota l fuel load, < 3- inchdead and live, tons/acre 3.5
Dead fuel load, %- inch,tons/acre 1.0
Live fuel load, fo l iage,tons/acre 2.0
Fuel bed depth, feet 2.0
Photo 13. Green. low shrub f ields withintimber sfands or without over'story are tYPical. ExamPle isDou g I a s-f i r- s n owberry h a b i -tat type.
Photo 14. Regeneration shrublands afterfire or other disturbances havea large green fuel comPonent,Sundance Fire, Pack RiverArea, ldaho.

Fire Behavior Fuel Model 6Fi res carry through the shrub layer where the fo l iage is
more f lammable than fuel model 5, but th is requi resmoderate winds, greater than 8 mi /h (13 km/h) at mid-f lame height . F i re wi l l drop to the ground at low windspeeds or at openings in the stand. The shrubs are o lder ,but not as ta l l as shrub types of model 4, nor do theyconta in as much fuel as model 4. A broad range of shrubcondi t ions is covered by th is model . Fuel s i tuat ions to beconsidered inc lude intermediate stands of chamise,chaparra l , oak brush, low pocosin, Alaskan spruce ta iga,and shrub tundra. Even hardwood s lash that has curedcan be considered. Pinyon- juniper shrublands may berepresented but may overpredict rate of spread except athigh winds, l ike 20 mi/h (32 km/h) at the 20-foot level.
The 1978 NFDRS fuel models F and Q are representedby th is fuel model . l t can be considered a second choicefor models T and D and a th i rd choice for model S. Photo-graphs 15, 16, 17, and 18 show s i tuat ions encompassedby th is fuel model .
Fuel model values for estimating fire behavior
Tota l fuel load, < 3- inchdead and live, tons/acre 6.0
Dead fuel load, %- inch,tons/acre 1.5
Live fuel load, fo l iage,tonsiacre 0
Fuel bed depth, feet 2.5
Photo 17. Low pocosin shrub field in thesouth.
Photo 18. Frost-killed GambelOakfoliage, less than 4 feet inheight, in Colorado.
Photo 15. Pi nyon-i u n i per w ith sagebrushnear Ely, Nev.; understorymainly sage with some g/'assintermixed.
Photo 16. Southern hardwood shrub withnine slash residues.
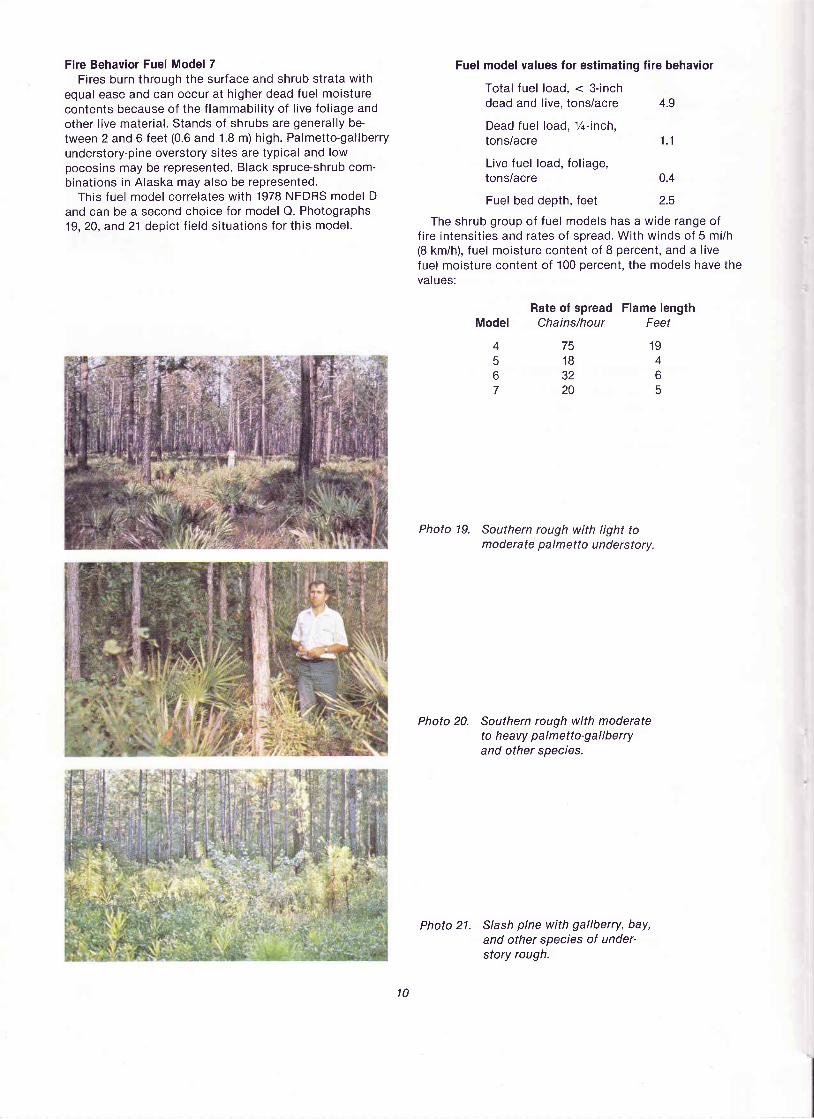
Fire Behavior Fuel Model 7Fi res burn through the sur face and shrub st rata wi th
equal ease and can occur at h igher dead fuel moisturecontents because of the f lammabi l i ty of l ive fo l iage andother l ive mater ia l . Stands of shrubs are general ly be-tween 2 and 6 feet (0.6 and 1.8 m) high. Palmetto-gallberryunderstory-pine overstory sites are typical and lowpocosins may be represented. Black spruce-shrub com-binat ions in Alaska may a lso be represented.
This fuel model corre lates wi th 1978 NFDRS model Dand can be a second choice for model Q. Photographs'19, 20, and 21 depict f ie ld s i tuat ions for th is model .
Fuel model values lor estimating l ire behavior
Tota l fuel load, < 3- inchdead and live, tons/acre 4.9
Dead fuel load, %- inch,tons/acre
Live fuel load, fo l iage,tons/acre 0.4
Fuel bed depth, feet 2.5
The shrub group of fuel models has a wide range off i re in tensi t ies and rates of spread. Wi th winds of 5 mi /h(8 kmih), f uel moisture content of 8 percent, and a l ivefuel moisture content of 100 percent , the models have thevalues:
Rate of spread Flame lengthChainslhour Feet
1 . 1
Model
46
67
751 83220
1 94o
5
Photo 19. Southern rough with Iight tomoderate palmetto understory.
Photo 20. Southern rough with moderateto heavy palmetto-gal lberryand other species.
Photo 21. Slash pine with gallberry, bay,and other sPecies of under-story rough.
10

Timber GroupFire Behavior Fuel Model 8
Slow-burning ground f i res wi th low f lame lengths aregeneral ly the case, a l though the f i re may encounter anoccasional "jackpot" or heavy fuel concentration thatcan f lare up. Only under severe weather condi t ions in-volv ing h igh temperatures, low humidi t ies, and h ighwinds do the fuels pose f i re hazards. Closed canopystands of short-needle conifers or hardwoods that haveleafed out support f i re in the compact l i t ter layer . Thislayer is main ly needles, leaves, and occasional ly twigsbecause l i t t le undergrowth is present in the stand. Repre-sentat ive coni fer types are whi te p ine, and lodgepolepine, spruce, f i r , and larch.
This modelcan be used for 1978 NFDRS fuel models Hand R. Photographs 22,23, and 24 i l lust rate the s i tu-at ions representat ive of th is fuel .
Photo 22. Surface litter fuels in westernhemlock stands of Oregonand Washington.
Photo 23. lJnderstory of inland Douglas-fir has little f uel here to addto dead'down litter load.
Photo 24. Closed stand of birch-aspenwith leaf Iitter compacted.
model values for estimating fire behavior
Total fuel load, < 3-inch,dead and live, tons/acre 5.0
Dead fuel load, %- inch,tons/acre 1.5
Live fuel load, fo l iage,tonsiacre 0
Fuel bed depth, feet O.2
Fuel
1 1
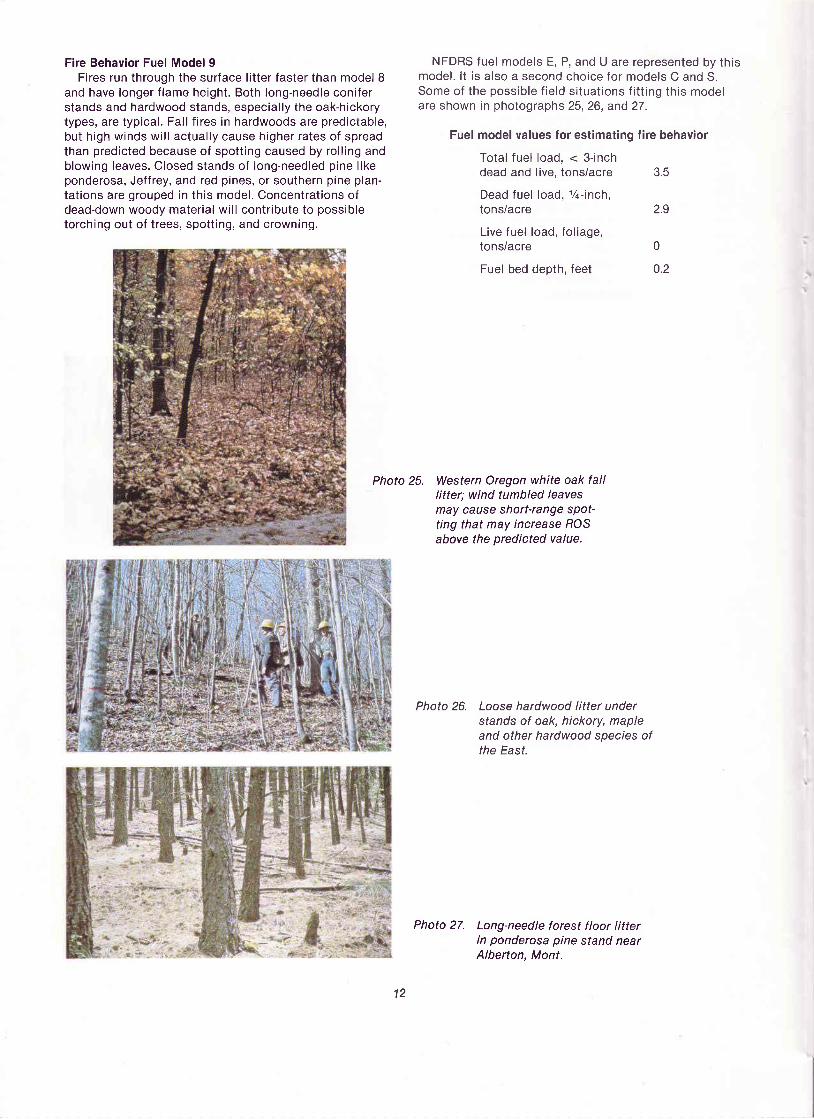
Fire Behavior Fuel Model9Fires run through the sur face l i t ter faster than model 8
and have longer f lame height . Both long-needle coni ferstands and hardwood stands, especia l ly the oak-h ickorytypes, are typ ical . Fal l f i res in hardwoods are predictable,but h igh winds wi l l actual ly cause h igher rates of spreadthan predicted because of spot t ing caused by ro l l ing andblowing leaves. Closed stands of long-needled p ine l ikeponderosa, Jeffrey, and red pines, or southern pine plan-tat ions are grouped in th is model . Concentrat ions ofdead-down woody mater ia l wi l l contr ibute to possib letorching out of t rees, spot t ing, and crowning.
NFDRS f uel models E, P, and U are represented by th ismodel . l t is a lso a second choice for models C and S.Some of the possib le f ie ld s i tuat ions f i t t ing th is modelare shown in photographs 25, 26, and 27.
Fuel model values for estimating fire behavior
Tota l fuel load, < 3- inchdead and live, tons/acre 3.5
Dead fuel load, %- inch,tonsiacre 2,9
Live fuel load, fo l iage,tonsiacre 0
Fuel bed depth, feet 0.2
Photo 25. Western Oregon white oak falllitter; wind tumbled leavesmay cause short-range sqot-ting that may increase r9OSabove the predicted value.
Photo 26. Loose hardwood litter undersfands of oak, hickory, mapleand other hardwood specles olthe East.
Photo 27. Long-needle forest f loor litterin ponderosa pine stand nearAlberton, Mont.
12

Fire Behavior Fuel Model 10The f i res burn in the sur face and ground fuels wi th
greater f i re in tensi ty than the other t imber l i t ter models.Dead-down fuels inc lude greater quant i t ies of 3- inch(7.6-cm) or larger l imbwood resul t ing f rom overmatur i ty ornatural events that create a large load of dead materialon the forest f loor . Crowning out , spot t ing, and torchingof ind iv idual t rees are more f requent in th is fuel s i tuat ion,leading to potent ia l f i re contro l d i f f icu l t ies. Any foresttype may be considered if heavy down material is pres-ent ; examples are insect- or d isease-r idden stands, wind-thrown stands, overmature s i tuat ions wi th deadfa l l , andaged l ight th inning or par t ia l -cut s lash.
The 1978 NFDRS fuel model G is represented and isdepicted in photographs 28,29, and 30.
Fuel model values for estimating fire behavior
Tota l fuel load, < 3- inchdead and live, tons/acre 12.O
Dead fuel load, %- inch,tons/acre 3.0
Live fuel load, fo l iage,tons/acre 2.0
Fuel bed depth, feet 1.0
Photo 28. Old-growth Douglas-f ir withheavy ground fuels.
Photo 29. Mixed conifer stand with dead-down woodv fuels.
Photo 30. Spruce habitat type wheresuccesslon or natural distur-bance can produce a heavydowned fuel load.
The f i re in tensi t ies and spread rates of these t imberl i t ter f uel models are indicated by the fo l lowing valueswhen the dead fuel moisture content is 8 percent , l ivefuel moisture is 100 percent , and the ef fect ive windspeedat midf lame height is 5 mi /h (8 km/h) :
Rate of spread Flame lengthModef Chains/hour Feet
8o
1 0
'1.6 1.07.5 2.67.9 4.8
Fires such as above in model 10 are at the upper l imitof control by direct at tack. More wind or dr ier condit ionscould lead to an escaped fire.
13
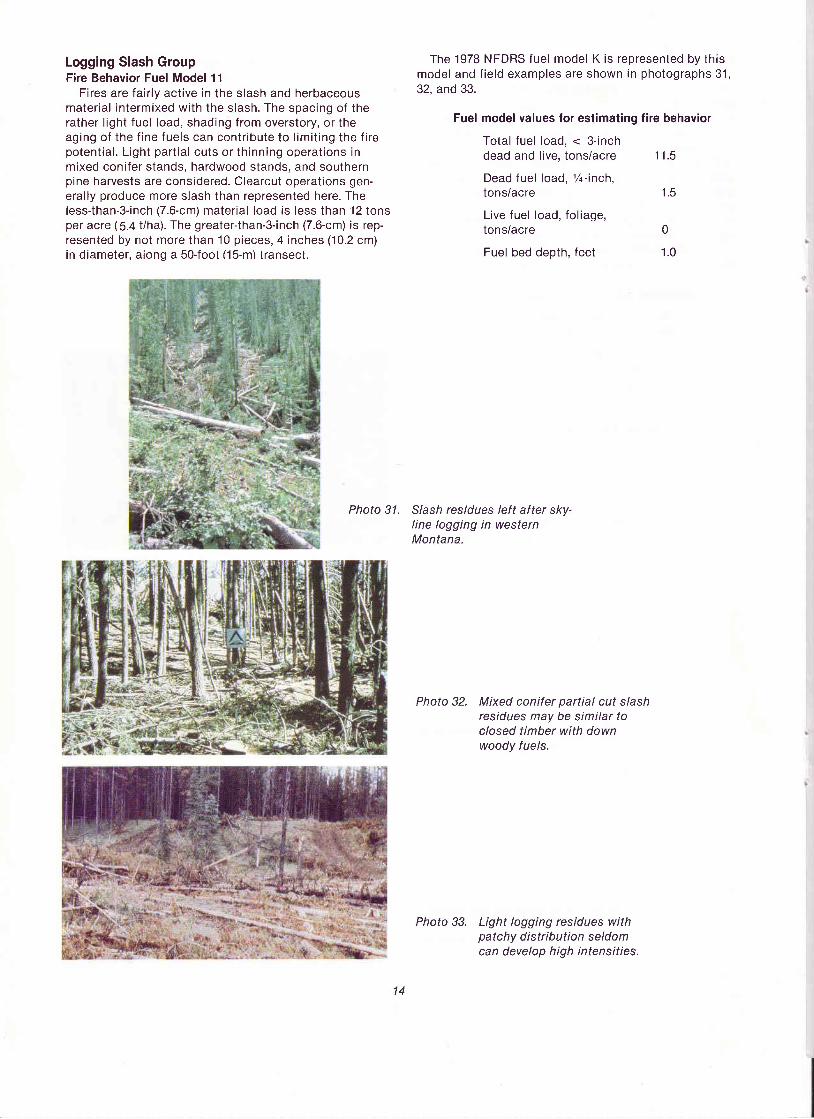
Logging Slash GroupFire Behavior Fuel Model 11
Fires are fa i r ly act ive in the s lash and herbaceousmater ia l in termixed wi th the s lash. The spacing of therather l ight fuel load, shading f rom overstory, or theaging of the f ine fuels can contr ibute to l imi t ing the f i repotent ia l . L ight par t ia l cuts or th inning operat ions inmixed coni fer s tands, hardwood stands, and southernpine harvests are considered. Clearcut operat ions gen-erally produce more slash than represented here. Theless- than-3- inch (7.6-cm) mater ia l load is less than 12 tonsper acre (S.+ Vna;. The greater-than-3-inch (7.6-cm) is rep-resented by not more than 10 p ieces, 4 inches (10.2 cm)in diameter, along a SO-foot (15-m) transect.
The 1978 NFDRS fuel model K is represented by th ismodel and f ie ld examples are shown in photographs 31,32, and 33.
Fuel model values for estimating f ire behavior
Tota l fuel load, < 3- inchdead and l ive, tons/acre 11.5
Dead fuel load, 1/q-inch,
tonsiacre
Live luel load, fo l iage,tons/acre 0
Fuel bed depth, feet 1.0
1 . 5
Photo 31 . Slash residues left after sky-line logging in westernMontana.
Photo 32. Mixed conifer partial cut slashresidues may be similar toclosed timber with downwoody fuels.
Photo 33. Light logging residues withpatchy distribution seldomcan develop high intensities.
14

Fire Behavior Fuel Model 12Rapid ly spreading f i res wi th h igh in tensi t ies capable of
generat ing f i rebrands can occur . When f i re s tar ts , i t isgeneral ly susta ined unt i l a f uel break or change in f uelsis encountered. The v isual impression is dominated byslash and much of i t is less than 3 inches (7.6 cm) indiameter . The f uels tota l less than 35 tons per acre(15.6 t /ha) and seem wel l d is t r ibuted. Heavi ly th innedconi fer s tands, c learcuts, and medium or heavy par t ia lcuts are represented. The mater ia l larger than 3 inches(7.6 cm) is represented by encounter ing 11 p ieces,6inches (15.2 cm) in d iameter , a long a SO-foot (15-m)transect.
Photo 34. Ponderosa pine clearcut eastof Cascade mountain range inOregon and Washington.
Photo 35. Cedar-hemlock partial cut innorthern ldaho, Region 1 ,USFS.
Photo 36. Lodgepole pine thinning slashon Lewis and Clark NationalForest. Red slash conditionrncreases classif ication f romlight to medium.
This model depicts 1978 NFDRS model J and mayoverrate slash areas when the needles have dropped andthe l imbwood has set t led. However, in areas where l imb-wood breakup and general weathering have started, thef i re potent ia l can increase. F ie ld s i tuat ions are presentedin photographs 34, 35, and 36.
Fuel model values for estimating fire behavior
Tota l fuel load, < 3- inchdead and live, tons/acre 34.6
Dead fuel load. %- inch,tons/acre 4.0
Live fuel load, fo l iage,tons/acre 0
Fuel bed depth. feet 2.3
15

Fire Behavior Fuel Model 13Fire is general ly carr ied across the area by a cont inu-
ous layer of s lash. Large quant i t ies of mater ia l largerthan 3 inches (7.6 cm) are present . F i res spread quick lythrough the f ine fuels and intensi ty bui lds up more s lowlyas the large fuels s tar t burn ing. Act ive f laming is sus-ta ined for long per iods and a wide var iety of f i rebrandscan be generated. These contr ibute to spot t ing problemsas the weather conditions become more severe. Clear-cuts and heavy par t ia l -cuts in mature and overmaturestands are deoicted where the s lash load is dominatedby the greater- than-3- inch (7.6-cm) d iameter mater ia l . Thetotal load may exceed 200 tons per acre (89.2 t/ha) butfuel less than 3 inches (7.6 cm) is general ly only 10 per-cent of the tota l load. Si tuat ions where the s lash st i l l has"red" needles at tached but the tota l load is l ighter , morel ike model 12,can be represented because of the ear l ierh igh in tensi ty and quicker area involvement .
The 1978 NFDRS fuel model I is represented and isi l lust rated in photographs 37 and 38. Areas most com-monly f i t t ing th is model are o ld-growth stands west ofthe Cascade and Sierra Nevada Mountains. More effi-c ient ut i l izat ion standards are decreasing the amount oflarge mater ia l le f t in the f ie ld.
Fuel model values for estimating fire behavior
Tota l fuel load, < 3- inchdead and live, tons/acre 58.1
Dead fuel load, %- inch,tons/acre 7.0
Live fuel load, fo l iage,tons/acre 0
Fuel bed depth, feet 3.0
For other s lash s i tuat ions:H a r d w o o d s l a s h . . . . . . M o d e l 6Heavy " red " s l ash . . . . Mode l 4Ove rg rown s lash . . . . . Mode l 10S o u t h e r n p i n e c l e a r c u t s l a s h . . . . . . . . M o d e l 1 2
The comparat ive rates of spread and f lame lengths forthe s lash models at 8 percent dead fuel moisture contentand a 5 mi /h (8 km/h) midf lame wind are:
Rate of spread Flame lengthModef Chains/hour Feet
1 112- t Q
6.01 e n
13 .5
3.58.0
10.5
Photo 37. Wesf coasf Douglas-f ir clear-cut, quantity of cull high.
Photo 38. High productivity of cedar-f irstand can result in largequantities of slash with highfire potential.
16

CORRELATION OF FIRE BEHAVIOR FUEL MODELSAND NFDRS FUEL MODELS
The fo l lowing sect ion, which corre lates fuel modelsused for f i re behavior wi th those used for f i re dangerrat ing, should help f i re behavior of f icers (FBO's) , re-searchers, or other concerned personnel understand there lat ionship of the two sets of fuel models. For in i t ia l f i rebehavior est imates, the fuel model used for f i re dangerrating can be cross referenced to a fire behavior fuelmodel su i table for the general area of in terest . l t a lsoprovides useful background about the character of eachfuel model so speci f ic se lect ions can be made wherevegetat ion var ies considerably. Combin ing th is in forma-t ion wi th the photographic representat ions of each of the13 fuel models presents the concept that a s ingle fuelmodel may represent several vegetative groups. lt is im-portant that one maintain an open, flexible impression olluel models so as to recognize those vegetative groupswith common fire-carrying characteristics.
The corre lat ion wi th the 1978 NFDRS fuel modelsal lows convers ion f rom f i re danger t rend measurementsto f ie ld-or iented predict ion of f i re behavior . The greatvar iety of fuel , weather , and s i te condi t ions that ex is t inthe f ie ld means the user of f uel models and f i re behaviorinterpretat ion methods must make observat ions andadjust h is predict ions accordingly . Cal ibrat ion of the f i rebehavior outputs for the selected fuel model can a l lowmore precise est imat ion of actual condi t ions. This hasbeen practiced in the field by instructors and trainees ofthe Fire Behavior Officer's (FBO) School, 5-590, and hasprovided a greater degree of f lex ib i l i ty in appl icat ion.
The fuel models shown in f igure 3 were a l ined accord-ing to the f uel layer contro l l ing the rate of f i re spread.Some second and th i rd choices are indicated for s i tu-ations where fire spread may be governed by two or morefuel layers, depending on d is t r ibut ion and moisture con-tent . From the four c l imates used in the 1978 NFDRS.
c l imate 3 was used, wi th the l ive herbaceous fuels 99.7percent cured and a wind of 20 miih (32 kmih) at the 20-foot (6.1-m) level . These condi t ions could be expected in anumber of FBO s i tuat ions. Combined wi th the f uel mois-tures for the less-than-3-inch (7.6-cm) material, these con-di t ions make i t possib le to re late the dynamic f uelmodels wi th in the 1978 NFDRS to the fuel models associ -ated wi th the f i re behavior nomographs. Al though theoutput va lues d i f fer s l ight ly , the rankings of the f uelmodels by rate of spread and f i re in tensi ty a l lowed corre-lat ion of the two sets of models. Note in f igure 3 thatboth sets of fuel models are separated in to the four gen-era l fuel groups. Some except ions are noted where morethan one fuel model should be considered because theolant communi t ies involved conta in fuel in more than onestratum. Most fuel types support sur face or ground f i res,but some grass or shrub s i tuat ions wi l l support crownf i res. Such s i tuat ions usual ly occur in f uels extending tothe ground and do not extend to the crown f i re that mayoccur in pole, sawt imber, or mature forests. Regenerat ionwhere the crown st i l l is wi th in 4 to 6 feet (1.221o 1.83 m)of the ground may exper ience crowning under severeweather condi t ions.
For a greater appreciat ion of fuel models and thei rfunct ion in f i re danger rat ing and f i re behavior predict ion,the reader should refer to the fo l lowing publ icat ions:
Rothermel , Richard C. 1972. "A mathemat ica l modelfor predict ing f i re spread in wi ld land fuels . "
Deeming, John E. , and others. 1977."The Nat ional F i re-Danger Rat ing System."
Deeming, John E. , and James K. Brown. 1975. "Fuel
models in the Nat ional F i re-Danger Rat ing System."Alb in i , Frank A. 1976. "Est imat ing wi ld f i re behavior and
effects."In addi t ion the approach to t ime s ince d is turbance is pre-sented in works such as Kessel l and Cat te l ino (1978) andsuggests advances that can be made wi th more data andsophist icat ion.
1 7

PHYSIGAT DESCRIPTION SIMITARITY CHART OF
1{FDRS AND FBO FUEt MODETSNFDRS MODELS REALINED TO FUELS CONTROLLING SPREAD UNDER SEVERE BURNING CONDITIONS
NFDRSFUEL MODELS
FIRT BEHAVIOR FUEL MODELS
I 2 3 4 5 6 7 8 9 t0 11 L2 t3
A W. ANNUALS
L W. PERENNIAL
S TUNDRA
C OPEN PINEW/GRASS
T SAGEBRUSHW/GRASS
N SAWGRASS
X
X
X 3rd 2nd
X 2nd
X 3rd Znd
X
B MATURE BRUSH(6FT)
O H I G H P O C O S I N
F INTER. BRUSH
Q ALASKA BLACKSPRUCE
D SOUTHERN ROUGH
X
X
2nd X
X 2nd
2nd X
H SRT- NDL CLSD.NORMAL DEAD
R HRWD. LITTER(SUMMER)
U W. LONG- NDLP I N E
P SOUTH, LONG- NDLP INE
E HRWD. LITTER(FALL)
G SRT- NDL CLSD.HEAVY DEAD
X
X
X
X
X
X
K LIGHT SLASH
J MED. SLASH
I HEAVY SLASH
X
X
X
GRASS SHRUB
Figure 3.-Similarity chart to aline physical descriptions of f iredanger rating f uel models with f ire behavior f uel models.
aa
EC.,
o=E-a.n
ELrJo=F
-a-r,
_latr
18
T IMBER SLASH

PUBLICATIONS CITEDAlbin i , Frank A.
.1976. Est imat ing wi ld f i re behavior and ef fects. USDAFor. Serv. Gen. Tech. Rep. INT-30, 92 p. Intermt. For.and Range Exp. Stn. , Ogden, Utah.
Barrows, J. S.1951. F i re behavior in nor thern Rocky Mounta in
forests. USDA For. Serv., North. Rocky Mt. For. andRange Exp. Stn. , Pap.29,123 p.
Bates, Carlos G.1923. The t ransect of a mounta in val ley. Ecology 4(1) :
54-62.Bevins, C. D.
1976. F i re model ing for natura l fuel s i tuat ions inGlacier Nat ional Park. ln Proc. , F i rs t Conf . on Sci .Res. in the Nat l . Parks [New Or leans, La. , Nov. 1976] .o . 2 3 .
Deeming, John E. , and James K. Brown.1975. Fuel models in the Nat ional F i re-Danger Rat ing
System. J. For. 73:347-350.Deeming, John E. , Robert E. Burgan, and Jack D. Cohen.
1977. The Nat ional F i re-Danger Rat ing System-1978.USDA For. Serv. Gen. Tech. Reo. INT-39.63 o.Intermt. For . and Range Exp. Stn. , Ogden, Utah.
Deeming, John E. , J . W. Lancaster , M. A. Fosberg, R. W.Furman, and M. J . Schroeder.
1972.The Nat ional F i re-Danger Rat ing System. USDAFor. Serv. Res. Pap. RM-184, 165 p. Rocky Mt. For.and Range Exp. Stn. , For t Col l ins, Colo.
Dubois, Coert .19 '14. Systemat ic f i re protect ion in the Cal i forn ia
forests.99 p. USDA For. Serv. , Washington, D.C.Fahnestock, George R.
1970. Two keys for appraising forest f ire fuels. USDAFor. Serv. Res. Pap. PNW-99,26 p. Pac. SouthwestFor . and Range Exp. Stn. , Berkeley, Cal i f .
Hornby, L. G.1935. Fuel type mapping in Region One. J . For .33(1) :
67-72.Hough, W. A. , and F. A. Alb in i .
1978. Predict ing f i re behavior in palmet to-gal lberry fuelcomplexes. USDA For. Serv. Res. Pap. SE-174,44 p.Southeast. For. Exp. Stn., Ashevil le, N.C.
Jemison. G. M.. and J. J . Keetch..1942. Rate of spread of f ire and its resistance to con-
t ro l in the fuel types in eastern mounta in forests.USDA For. Serv. , Appalachian For . Stn. , Tech.Note 52. Ashevil le, N.C.
Kessel l , S. R.1976. Wi ld land inventor ies and f i re model gradient
analys is in Glac ier Nat ional Park. ln Proc. Tal lT imbers Fi re Ecol . Conf . and Fi re and Land Manage.Symp. No. 14,1974. p. 115-162. Tal l T imber Res. Stn. ,Tal lahassee, F la.
Kessel l , S. R.1977. Gradient model ing: a new approach to f i re model-
ing and resource management. /n Ecosystem model-ing in theory and pract ice: an in t roduct ion wi th casehistor ies. p. 575-605. C.A.S. Hal l and J. Day, Jr . , eds.Wi ley & Sons, New York.
Kessel l , S. R. , P. J . Cat te l ino, and M. W. Pot ter .1977. A f i re behavior in format ion in tegrat ion system for
southern Cal i forn ia chaparra l . ln Proc. of the Sym-posium on the Envi ronmental Consequences of F i reand Fuel Management in Medi terranean Eco-systems. p.354-360. USDA For. Serv. Gen. Tech.Rep. WO-3. Washington, D.C.
Kessel l , Stephen R. , and Peter J . Cat te l ino.1978. Evaluat ion of a f i re behavior in format ion in tegra-
t ion system for southern Cal i forn ia chaparra l wi ld-lands. Envi ron. Manage. 2:135-159.
Kirchler, A. W.1967. Vegetat ion mapping.472 p. The Ronald Press
Co., New York.Phi lpot , C. W.
1977. Vegetat ion features as determinants of f i re f re-quency and intensi ty . ln Proc. of the Symposium onthe Envi ronmental Consequences of F i re and FuelManagement in Mediterranean Ecosystems. p. 12-16.USDA For. Serv. Gen. Tech. Rep. WO-3. Washington,D.C.
Rothermel , Richard C.1972. A mathemat ica l model for f i re spread oredict ions
in wi ld land f uels . USDA For. Serv. Res. Pao. INT-115.40 p. In termt. For . and Range Exp. Stn. , Ogden, Utah.
Rothermel , Richard C. , and Char les W. Phi lpot .1973. F i re in wi ld land management: predict ing changes
in chaparra l f lammabi l i ty . J . For . 71(10) :640-6a3.Show. S. B.. and E. l. Kotok.
1929. Cover type and f i re contro l in the Nat ional For-ests of nor thern Cal i forn ia. USDA For. Serv. Bul l .1495, 35 p. Washington, D.C.
Soarhawk. W. N.1925. The use of l iab i l i ty rat ings in p lanning forest f i re
protection. J. Agric. Res. 30(8):693-762.U.S. Department of Agriculture, Forest Service.
1964. Handbook on Nat ional F i re-Danger Rat ing Sys-tem. USDA For. Serv. Handb. FSH 5109.11. Washino-ton, D.C.
19

APPENDIX: EVOLUTION OF FUEL MODELSlntroduction
More than 64 years ago, foresters in the United Stateswere concerned about f ire danger and were attempting todevelop methods to assess the hazard (Dubois 1914). The" inf lammabi l i ty" of a s i tuat ion depended on four e le-ments: (1)amount of ground fuels ; (2) ease of ign i t ion;(3) dryness of the cover; and (4) slope. Three fuel typeswere considered: grass, brush, and t imber. In 1978, weare st i l l concerned about f i re danger and f i re behavior .Through the use of mathemat ica l f i re behavior models(Rothermel 1972) and f ire danger ratings (Deeming andothers 1977),we can evaluate how f i re danger changeswi th weather . fuels . and s lope. In addi t ion, the f i re be-havior of f icer on a f i re can est imate the f i re behavior forthe next burn ing per iod i f he can def ine the fuels (Alb in i1976). Dubois grouped fuels as grass, brush, and t imber,and these general groupings are st i l l used wi th the addi-t ion of s lash. Several fuel types or fuel models are recog-nized wi th in each group. For f i re danger rat ing, we havegone from two fuel models (USDA Forest Service 1964) tonine in 1972 (Deeming and others 1972) and 20 in 1978(Deeming and others '1977). Research ef for ts to ass is t thef i re behavior of f icer have ut i l ized the 13 fuel models tabu-lated by Rothermel (1972) and Albini (1976).
Fuels DelinedFuels are made up of the var ious components of vege-
tat ion, l ive and dead, that occur on a s i te . The type andquant i ty wi l l depend upon the soi l , c l imate, geographicfeatures, and the f i re h is tory of the s i te . To a large extent ,potent ia l evapotranspi rat ion and annual prec ip i ta t ioncombinat ions wi th a l t i tude and lat i tude changes can de-scribe the expected vegetation and have been used forvegetat ion maps (Ki ich ler 1967). Ar i adequate descr ipt ionof the fuels on a s i te requi res ident i fy ing the fuel com-ponents that may exis t . These components inc lude thel i t ter and duf f layers, the dead-down woody mater ia l ,grasses and forbs, shrubs, regenerat ion and t imber. Var i -ous combinat ions of these components def ine the majorfuel groups of grass, shrub, t imber and s lash. Certa infeatures of each fuel component or the lack of i t contr ib-utes to the descr ipt ion of the fuels in terms sui table todef ine a fuel model . For each fuel component cer ta incharacter is t ics must be quant i f ied and evaluated toselect a f uel model for est imat ing f i re behavior . The mostimoortant character is t ics for each component are:
1. Fuel loading by s ize c lasses2. Mean s ize and shape of each s ize c lass3. Compactness or bulk densi ty4. Hor izonta l cont inui ty5. Ver t ica l arrangement6. Moisture content7. Chemical content , ash, and volat i les.Each of the above character is t ics contr ibutes to one or
more f i re behavior propert ies. Fuel loading, s ize c lassdist r ibut ion of the load, and i ts arrangement (compact-ness or bulk densi ty) govern whether an igni t ion wi l lresul t in a susta in ing f i re . Hor izonta l cont inui ty in f lu-ences whether a f i re wi l l soread or not and how steadv
rate of spread wi l l be. Loading and i ts ver t ica l arrange-ment wi l l in f luence f lame s ize and the abi l i ty of a f i re to" torch out" the overstory. Wi th the proper hor izonta l con-t inu i ty in the overstory, the f i re may develop in to a crownf i re. Low fuel moisture content has a s igni f icant impactupon f i re behavior af fect ing igni t ion, spread, and inten-s i ty ; wi th h igh winds i t can lead to extreme f i re behavior .Certa in e lements of the fuel 's chemical content , such asvolat i le o i ls and waxes, a id f i re spread, even whenmoisture contents are h igh. Others, l ike mineral content ,may reduce intensi ty when moisture contents are low.High fuel loads in the f ine fuel s ize c lasses wi th low fuelmoisture contents and h igh volat i le o i l contents wi l l con-t r ibute to rapid rates of spread and h igh f i re l ine in tensi -t ies, making in i t ia l a t tack and suppression d i f f icu l t .
How Fuels Have Been DescribedIn the expression of f i re danger presented by Dubois
(1914), the f uel types of grass, brush, and t imber weredef ined, ut i l iz ing three causes-amount of fuel on theground, lack of moisture in the cover , and s lope-andtwo effects-ease of ignition and rate of f ire growth orspread. As Dubois pointed out, however, not enoughstudy had been made of rate of spread to effectivelydescr ibe d i f ferences among the fuel types. Sparhawk(1925) conducted an extensive study of f ire size as a func-t ion of e lapsed t ime f rom discovery to in i t ia l a t tack bybroad forest cover types. Twenty-one f ire regions for thewestern United States and the Lake States were def inedand up to seven forest types selected for each region.These forest types basically were grass, brush, t imber,and s lash descr ipt ions. The ranking of area growth ratesby type showed the highest growth rates occurred ingrasses and brush types, fo l lowed by s lash and opent imber s i tuat ions and concluding wi th low growth ratesin c losed t imber types. Sparhawk made the fo l lowingcomment regarding h is data:
Rat ing obta ined, therefore, wi l l represent averagesof fa i r ly broad appl icat ion, but may now show whatcan be expected on indiv idual uni ts . These factorscan be a l lowed for only when the f i re records andthe inventory of our forest resources inc lude infor-mat ion concerning them.
Show and Kotok (1929) repor ted on a pre l iminary studyof forest cover as re lated to f i re contro l . Study of the n inemajor cover types in nor thern Cal i forn ia showed def in i tedi f ferences between them regarding f i re danger, ign i t ionrisk, rate of spread, and type of f ire and several other f irecontro l subjects. They d id not at tempt to completeanalysis proposed by Sparhawk because the variabil ity ofindiv idual f i res was so great and the c lass i f icat ion oftype and hazard classes was so incomplete. However,thei r n ine cover types f i t a broader c lass i f icat ion of :
1. Woodlands and grasslands2. Chaoarral and brush fields3. Timber cover types:
a. western yel low pine and mixed coni ferb. Douglas- f i rc . sugar p ine- f i r and f i r .
20

These cover types and thei r c lass i f icat ion express thebroad groupings of grass-dominated, brush-dominated,and t imber-res idue-dominated fuel groups. T imber res i -dues can be e i ther natura l ly occurr ing dead woody oractivity-caused slash. In terms of f ire behavior, thesecover types could be characterized as follows:
Crown f ires (occur in secondary or primary overstory)-chaparra l and brush types.
Surface fires (occurs in surface l itter, dead-downwoody, and herbaceous mater ia l ) -woodlands andgrasslands; western yel low pine and mixed coni fer ;Douglas- f i r .
Ground f i res (occur in l i t ter , duf f , and subsurface or-ganic mater ia l ) -sugar p ine- f i r ; f i r type.
This work showed the complexi ty of establ ish ing hourcontrol needs and contributes to continued efforts todescr ibe types in terms o l f i re growth and contro l d i f f i -cu l ty .
Hornby (1935) developed a fuel classif ication systemthat formalized the description of rate of spread andresis tance to contro l in to c lasses of low, medium, h igh,and extreme. For the Northern Rocky Mounta ins, thestandard t imber types re lat ive ranking was s imi lar to thatof Show and Kotok as well as work in Colorado by Bates(1923) and described by Hornby (1935):
1. Brush-grass2. Ponderosa pine3. Larch- f i r4 . Douglas- f i r and lodgepole p ine5. Whi te p ine and lodgepole p ine6 . Suba lo ine f i r7 . Whi te f i r and spruce.
Classi f icat ion of these fuels was accompl ished by ut i l iz -ing 90 men experienced in f ire hazard. A total of 42 rat-ings were assigned to typ ical fuels in Region 1. Hornbynoted that a weakness of the system was the use ofestimates rather than extensive accurate measurements,but unt i l enough years of data had been col lected oncontr ibut ing in f luences, some procedures for rat ing fuelswere needed. Adaptations of Hornby's approach havebeen ut i l ized in the eastern Uni ted States (Jemison andKeetch 1942) and modified later in the West (Barrows''|951). Most Forest Service regions uti l ized some versionof the Hornby rat ing method but general ly ass igned rateof spread values unique to thei r area, thereby reducingcomparabi l i ty . This is i l lust rated by a sampl ing of thenumber of rat ings used by var ious regions and some ofthe variation that existed for rate of spread (ROS)classes' No. of RosRegion Year ratings (chains/hour)
Region 1Region 1Region 2Region 3Region 4EasternRegion 5Region 6
Region 8Region 9
19691974197219701972196619731972
19751970
2344
591 1481 51 71 6
examples
1 0
H ish (51 )High (25)High (25)
Hish (30)
High (25)
H i g h ( > 1 0 )
The var iat ion of ROS rat ing is due not so much to fuelsalone as to the combinat ion of f uels , c l imate, season,and local weather . These addi t ional factors in f luence thequant i ty of l ive f uel and the moisture content of the deadf uels . Other agencies such as the BLM have ut i l ized theapproach for each management area and have a set ofrat ings for s ix areas.
Fuels became a considerat ion in f i re danger rat ings inthe 1950's; in 1958 an ef for t was made to uni fy the e ightf i re danger rat ing systems into one nat ional system(Deeming and others 1972). Two fuel condi t ions wereconsidered- fuels shel tered under a t imber cover andfuels in an open, exposed s i te . A re lat ive spread indexwas developed and brought in to general use by 1965.Review of the approach and the expressed need for theigni t ion, r isk, and energy indexes resul ted in a researchef for t that y ie lded lhe 1972 Nat ional F i re Danger Rat ingSystem (NFDRS). Fuels could be considered in greaterdeta i l because a mathemat ica l f i re soread model hadbeen developed by Rothermel (1972). Nine specific de-scr ipt ions of fuel propert ies, ca l led fuel models, weredeveloped for the NFDRS (Deeming and Brown '1975).
Fahnestock (1970), in h is guide "Two keys for apprais ingforest f i re fuels , " was among the f i rs t to use the Rother-mel f ire spread model. The keys provide tools for recog-niz ing the d i f ferences in fuel types and ident i fy ing therelative fire hazard potential in terms of rate of spread orcrowning. To use the keys, one must descr ibe physicalfuel propert ies in Fahnestock 's terms: f ine, smal l ,medium for s ize c lasses and sparse, open, dense, f lu f fy ,or thatched for compactness or combinat ion of loadingand depth. By keying on the fuel propert ies of the s i te ,one of the 36 rate-of-spread ratings or one of the 24crowning-potent ia l rat ings can be selected.
Fahnestock in terpreted the s ize c lass descr ipt ions foreach fuel s t ratum according to the physical d imensionsand t imelags associated wi th the 1964 NFDRS. Timelagis the t ime necessary for a fuel s ize c lass to change 63percent of the total expected change. These same de-scriptions were used when fuel models were developedto represent broad vegetative types of grasslands, brush-f ie lds, t imbered land, and s lash. Wi th in each fuel model ,the load was d is t r ibuted by s ize or t imelag c lasses, cor-re lated wi th groupings of fo l iage and twigs, branchwood,and t ree or shrub mater ia l as fo l lows:
Size, diameterlnch
1 1/q
l/q lo 1
1 t o 3> 3
TimelagHours
11 0
1001,0001
lLarge fuels or layers slow to respond are recognized in the fuelmodels avai lable in the 1978 NFDRS
21

The initial fuel models were documented by Rothermel(1972) and these 13 models were reduced to 9 models forlhe 1972 NFDRS (Deeming and others 1972), The original9 fuel models, except for one, have been retained in the1978 NFDRS and supplemented by 11 others to accom-modate differences across the country. For fire behavioroff icer training, the 13 fuel models ini t ia l ly presented byRothermel (1972) and Albini (1976) are currently beingused. The 13 models encompass those of the 1972NFDRS and can be correlated to the 1978 NFDRSmodels. At the present time, the fuel models have thebroadest application, while other research is providingfuel models for specific applications (Kessell 1976, 1977;Bevins 1976; Kessell, Cattelino, and Potter 1977; Philpot1977; Hough and Albini 1978; Rothermel and Phi lpot1973).
22
a
I Anderson, Hal E.1982. Aids to determining fuel models for estimating fire behavior. USDA For.
Serv. Gen. Tech. Rep. INT-122, 22p. Intermt. For. and Range Exp. Stn., Ogden,Utah 84401.
Presents photographs of wildland vegetation appropriate for the 13 fuel modelsused in mathematical models of fire behavior. Fuel model descriptions include firebehavior associated with each fuel and its physical characteristics. A similaritychart cross-references the 13 fire behavior fuel models to the 20 fuel models used inthe National Fire Danger Rating System.
KEYWORDS; forest fuels, modeling, fire behavior

The Intermountain Station, headquartered in Ogden,Utah, is one of eight regional experiment stations chargedwith providing scientific knowledge to help resourcemanagers meet human needs and protect forest and rangeecosystems.
The "'Intermountain Station includes the States ofMontana, Idaho, Utah, Nevada, and western Wyoming.About 273 million acres, or 85 percent, of the land area in theStation territory are classified as forest and rangeland. Theselands include grasslands, deserts, shrublands, alpine areas,and well-stocked forests. They supply fiber for forest in-dustries; minerals for energy and industrial development; andwater for domestic and industrial consumption. They alsoprovide recreation opportunities for millions of visitors eachyear.
Field programs and research work units of the Stationare maintained in:
Boise, Idaho
Bozeman, Montana (in cooperation with MontanaState University)
Logan, Utah (in cooperation with Utah StateUniversity)
Missoula, Montana (in cooperation with theUniversity of Montana)
Moscow, Idaho (in cooperation with the Univer-sity of ldaho)
Provo, Utah (in cooperation with Brigham YoungUniversity)
Reno, Nevada (in cooperation with the Universityof Nevada)