aid statistics at a glance to africa - oecd africa - development aid … · statistics by region 2....
TRANSCRIPT

DEVELOPMENT AID AT A GLANCE
STATISTICS BY REGION
2. AFRICA
2015 edition

2
2.1. ODA TO AFRICA - SUMMARY
1 Egypt 5 506 10%
2 Ethiopia 3 826 7% 2012 2013 % change
3 Tanzania 3 430 6%
4 Kenya 3 236 6%
5 Democratic Republic of the Congo 2 572 5%
6 Nigeria 2 529 5%
7 Mozambique 2 314 4% Population (thousands) 1081 736 1109 118 2.5%
8 Morocco 1 966 4% Net ODA per capita (USD) 47.5 50.3 ―
9 Uganda 1 693 3%
10 South Sudan 1 447 3%
Other recipients 27 272 49%
Total 55 793 100%
1 United States 8 979 16%
2 IDA 6 072 11%
3 EU Institutions 5 973 11%
4 United Arab Emirates 4 761 9%
5 United Kingdom 3 922 7%
6 France 3 169 6%
7 Global Fund 2 523 5%
8 Germany 2 397 4%
9 African Development Bank 2 324 4%
10 Japan 2 092 4%
Other donors 13 581 24%
Total 55 793 100%
51 343 55 340 7.8%
ODA commitments
(2012 USD million)64 880 65 944 1.6%
2.1.5. Sectors in 2013 commitments
2.1.1. Top 10 ODA receipts by recipient
2.1.4. Top 10 ODA donors
USD million, net disbursements in 2013
USD million, net disbursements in 2013
ODA net disbursements
(2012 USD million)
2.1.3. Trends in ODA
2.1.4. ODA by income groupUSD million, 2013, net disbursements
42% 19% 11% 9% 9% 2% 7% 1%
0% 10% 20% 30% 40% 50% 60% 70% 80% 90% 100%
Social Economic Production Multisector General Programme Aid Debt Humanitarian Others
30 449
4 047
13 841
3 118
4 338
Least Developed Countries
Other Low Income
Lower Middle Income
Upper Middle Income
Unspecified

3
2.1.6. Net ODA receipts per person in 2013
in USD
11
17
26
49
50
63
0 10 20 30 40 50 60
Asia
America
Europe
Africa
Oceania
USD
223
All developing countries
2.1.7. Net ODA and population of aid recipient
countries by region in 2013
Net ODA
USD million
Population
million
Africa 55 793 1 109
Asia 44 330 3 923
America 10 216 609
Europe 7 363 152
Oceania 2 148 10
Aid unspecified by region 30 236 ---
All ODA recipients 150 086 5 803
2.1.8. Regional shares of total net ODA As a percentage of total ODA
0
5
10
15
20
25
30
35
40
45
19
90
19
92
1994
19
96
19
98
20
00
20
02
20
04
20
06
20
08
20
10
2012
Africa
Asia
America
Europe
Oceania
%

4
2.2. ODA TO AFRICA BY DONOR AND RECIPIENT
2.2.1. Top 10 DAC donor countries to Africa
USD million, net bilateral disbursements
a) Top 10 donors by amount b) Top 10 donors by share of aid to Africa
2011 2012 20133-year
average
% of DAC
countries2011 2012 2013
3-year
average
Africa as % of
each donor's aid
2011-2013
1 United States 9 502 9 127 8 979 9 203 30% 1 Portugal 408 343 247 332 89%
2 France 4 641 4 128 3 169 3 979 13% 2 Ireland 401 352 354 369 83%
3 United Kingdom 3 409 3 445 3 922 3 592 12% 3 Belgium 831 775 583 730 79%
4 Germany 2 575 2 784 2 397 2 585 8% 4 Iceland 10 10 15 12 76%
5 Japan 1 708 1 724 2 092 1 842 6% 5 Denmark 975 805 713 831 64%
6 Canada 1 545 1 850 1 519 1 638 5% 6 Netherlands 979 744 858 860 64%
7 Sweden 1 351 1 201 1 167 1 240 4% 7 Italy 830 112 138 360 62%
8 Norway 1 080 956 1 046 1 027 3% 8 France 4 641 4 128 3 169 3 979 60%
9 Netherlands 979 744 858 860 3% 9 Sweden 1 351 1 201 1 167 1 240 58%
10 Denmark 975 805 713 831 3% 10 United Kingdom 3 409 3 445 3 922 3 592 57%
Other DAC countries 4 952 3 724 3 500 4 059 13% Other DAC countries 18 883 18 573 18 196 18 551 40%
Total DAC countries 32 717 30 488 29 363 30 856 100% Total DAC countries 32 717 30 488 29 363 30 856 46%
2.2.2. DAC donor countries’ aid to Africa
USD billion, values shown for 2013, net bilateral disbursements
8.98
3.173.92
2.40
2.09 1.52
1.171.050.86 0.710.58
0.55 0.420.320.35 0.140.25 0.32 0.270.09 0.13 0.04 0.02 0.00 0.00 0.01 0.00 0.00
0
1
2
3
4
5
6
7
8
9
10
2011 2012 2013
.

5
2.2.3. ODA to Africa by DAC donor
USD million, 2012 prices and exchange rates, average annual net bilateral disbursements
2010-13 2010-13
1970-79 1980-89 1990-99 2000-09 2010-13% of DAC
countries
Africa as % of each
donor's aid
Australia 58 158 151 110 339 1% 10%
Austria 62 211 31 257 154 1% 38%
Belgium 636 617 378 732 834 3% 81%
Canada 648 881 755 1 089 1 654 5% 49%
Czech Republic - - 0 6 8 0% 14%
Denmark 235 465 636 798 817 3% 62%
Finland 46 203 179 192 316 1% 55%
France 2 875 3 929 4 749 4 103 3 921 13% 61%
Germany 1 244 2 099 1 982 2 209 2 353 8% 35%
Greece - - 2 21 15 0% 17%
Iceland - - 2 8 11 0% 74%
Ireland 4 26 81 332 364 1% 83%
Italy 172 1 555 1 088 698 348 1% 60%
Japan 392 1 200 1 563 1 668 2 002 7% 33%
Korea - 0 15 48 212 1% 22%
Luxembourg - - 43 119 119 0% 53%
Netherlands 358 970 968 1 408 960 3% 65%
New Zealand 3 2 6 16 10 0% 3%
Norway 274 744 990 1 038 1 035 3% 45%
Poland 14 1 0 15 13 0% 14%
Portugal - 18 265 242 309 1% 86%
Slovak Republic - - - 10 3 0% 28%
Slovenia - - - 0 1 0% 7%
Spain - 27 360 593 650 2% 44%
Sweden 398 750 729 906 1 144 4% 57%
Switzerland 101 350 394 394 490 2% 39%
United Kingdom 782 912 968 2 621 3 512 12% 57%
United States 1 573 3 698 3 585 5 277 8 924 29% 45%
Total DAC countries 9 877 18 814 19 921 24 910 30 517 100% 46%
EU Institutions 1 426 2 389 3 265 4 270 5 993 --- 42%
2.2.4. ODA to Africa by largest bilateral donors since 1970 USD billion, 2013 prices and exchange rates, 3-year average net bilateral disbursements
0
1
2
3
4
5
6
7
8
9
10
1970
1975
1980
1985
1990
1995
2000
2005
2010
United States
France
United Kingdom
Germany
Japan

6
2.2.5. Top 10 multilateral donors to Africa USD million, net disbursements
2011 2012 20133-year
average
% of all
multilaterals
1 EU Institutions 6 037 7 141 5 973 6 384 33%
2 IDA 4 739 4 712 6 072 5 174 26%
3 Global Fund 1 534 2 173 2 523 2 077 11%
4 AfDF (African Dev.Fund) 2 147 1 788 2 180 2 038 10%
5 IMF (Concessional Trust Funds) 1 057 837 512 802 4%
6 GAVI 517 596 860 658 3%
7 UNICEF 484 407 472 454 2%
8 Arab Fund (AFESD) 285 293 271 283 1%
9 IFAD 173 287 280 246 1%
10 UNDP 221 224 217 220 1%
Other multilaterals 1 187 1 264 1 234 1 228 6%
Total multilaterals 18 381 19 721 20 595 19 566 100%
2.2.6. ODA to Africa by largest multilateral donors since 1970
USD billion, 2013 prices and exchange rates, 3-year average net disbursements
0
1
2
3
4
5
6
7
1970
1975
1980
1985
1990
1995
2000
2005
2010
EU Institutions
IDA
AfDB
UNDP
WFP

7
2.2.7. Top 10 ODA recipients in Africa USD million, receipts from all donors, net ODA receipts
2011 2012 20133-year
average
% of all
recipients
1 Democratic Republic of the Congo 5 534 2 859 2 572 3 655 7%
2 Ethiopia 3 539 3 261 3 826 3 542 7%
3 Tanzania 2 446 2 832 3 430 2 903 5%
4 Kenya 2 482 2 654 3 236 2 791 5%
5 Egypt 414 1 807 5 506 2 576 5%
6 Mozambique 2 085 2 097 2 314 2 165 4%
7 Nigeria 1 769 1 916 2 529 2 071 4%
8 Côte d'Ivoire 1 436 2 636 1 262 1 778 3%
9 Ghana 1 810 1 808 1 331 1 650 3%
10 Uganda 1 578 1 655 1 693 1 642 3%
Other recipients 28 634 27 819 28 093 28 182 53%
Total ODA recipients 51 728 51 343 55 793 52 955 100%
2.2.8. Top 10 ODA recipients in Africa with their share of net debt relief grants
USD billion, net ODA receipts
0
1
2
3
4
5
6
2011 2012 2013 Net debt relief grants

8
2.2.9. ODA to Africa by recipient country
USD million, 2012 prices and exchange rates, net ODA receipts
2010-13 1970-79 1980-89 1990-99 2000-09 2010-13 2011 2012 2013
Share(%)
Algeria 0.4 605 384 431 336 181 180 144 202
Angola 0.5 50 231 538 517 242 192 242 286
Benin 1.2 167 267 371 475 634 673 511 648
Botswana 0.2 176 271 164 149 115 120 74 107
Burkina Faso 2.1 322 518 606 816 1 058 959 1 159 1 021
Burundi 1.1 168 361 286 394 567 555 523 542
Cabo Verde 0.5 39 161 173 172 262 236 246 237
Cameroon 1.2 444 522 761 1 005 616 587 596 729
Central African Republic 0.5 151 301 227 147 235 259 227 186
Chad 0.9 248 314 342 377 454 447 479 390
Comoros 0.1 69 105 60 38 67 49 69 80
Congo 0.9 178 224 284 331 464 247 139 148
Côte d'Ivoire 3.0 356 466 1 212 672 1 531 1 379 2 636 1 241
Democratic Republic of the Congo 7.0 792 1 020 421 2 217 3 587 5 381 2 859 2 554
Djibouti 0.3 120 192 163 115 143 137 147 151
Egypt 4.0 5 226 3 211 4 400 1 502 2 065 384 1 807 5 467
Equatorial Guinea 0.1 9 55 60 32 32 23 14 5
Eritrea 0.2 5 7 148 288 127 126 134 83
Ethiopia 6.9 387 1 133 1 329 2 373 3 559 3 484 3 261 3 827
Gabon 0.2 146 174 148 47 84 69 73 88
Gambia 0.2 48 155 96 91 126 131 139 111
Ghana 3.2 316 644 905 1 282 1 666 1 772 1 808 1 331
Guinea 0.6 81 349 514 295 316 198 340 506
Guinea-Bissau 0.2 63 172 175 120 106 114 79 103
Kenya 4.9 564 1 225 1 012 1 016 2 507 2 437 2 654 3 252
Lesotho 0.5 107 228 157 104 280 260 283 315
Liberia 1.6 90 205 162 374 827 744 571 531
Libya 0.4 33 43 7 20 215 638 87 126
Madagascar 0.9 297 575 609 814 449 429 379 502
Malawi 2.0 249 445 687 722 1 036 786 1 175 1 122
Mali 2.3 361 748 635 810 1 186 1 249 1 001 1 369
Mauritania 0.7 366 460 339 363 362 366 408 289
Mauritius 0.3 81 108 63 52 155 175 178 142
Mayotte 0.3 10 55 136 305 151 - - -
Morocco 2.8 924 1 539 1 178 954 1 447 1 387 1 480 1 916
Mozambique 4.1 130 905 1 622 1 887 2 107 2 025 2 097 2 293
Namibia 0.5 0 23 243 215 268 285 265 255
Niger 1.5 393 579 461 544 764 627 902 764
Nigeria 4.0 330 160 320 2 705 2 081 1 749 1 916 2 515
Rwanda 2.1 262 433 616 658 1 065 1 235 879 1 075
Saint Helena 0.2 14 35 23 31 112 84 168 138
Sao Tome and Principe 0.1 8 34 71 45 54 69 49 51
Senegal 2.0 475 990 857 880 1 008 1 026 1 080 973
Seychelles 0.1 46 47 29 26 35 21 36 25
Sierra Leone 0.9 70 176 212 451 447 414 443 448
Somalia 1.7 455 997 499 381 894 1 071 999 988
South Africa 2.3 - - 427 857 1 190 1 370 1 067 1 261
South Sudan 2.0 - - - - 1 028 1 093 1 578 1 443
Sudan 2.6 763 1 868 629 1 500 1 337 1 068 975 1 164
Swaziland 0.2 70 76 66 47 105 123 88 114
Tanzania 5.7 833 1 700 1 532 2 263 2 937 2 398 2 832 3 438
Togo 0.7 177 278 224 157 348 518 241 222
Tunisia 1.5 709 531 338 421 777 865 1 017 675
Uganda 3.2 143 492 1 028 1 505 1 668 1 546 1 655 1 683
Zambia 2.0 314 769 1 188 1 235 1 016 1 017 958 1 140
Zimbabwe 1.6 16 544 634 396 818 701 1 001 803
North of Sahara, regional 0.6 20 31 52 164 290 424 219 195
South of Sahara, regional 4.9 621 867 853 1 709 2 552 2 488 2 988 2 216
Africa, regional 3.6 238 738 802 1 123 1 851 1 938 1 970 1 855
Africa total 100 19 333 29 138 31 520 38 525 51 606 50 330 51 343 55 340
Annual amountsAnnual averages

9
2.2.10. Trends in aid to largest African recipients since 1970
USD billion, 2012 prices and exchange rates, 3-year average net ODA receipts
0.0
1.0
2.0
3.0
4.0
197
0
197
5
198
0
1985
199
0
199
5
200
0
200
5
201
0
Kenya
0.01.02.03.04.05.06.07.08.09.0
10.0
197
0
197
5
198
0
198
5
1990
199
5
200
0
200
5
201
0
Egypt
0.0
1.0
2.0
3.0
4.0
197
0
197
5
198
0
198
5
199
0
199
5
200
0
200
5
201
0Tanzania
0.0
1.0
2.0
3.0
4.0
5.0
197
0
197
5
198
0
198
5
199
0
199
5
200
0
200
5
201
0
Democratic Republic of the Congo
0.0
1.0
2.0
3.0
4.0
197
0
197
5
198
0
198
5
199
0
199
5
200
0
200
5
201
0
Ethiopia
0.0
1.0
2.0
3.0
4.0
197
0
197
5
198
0
198
5
199
0
199
5
200
0
200
5
201
0
Sudan
0.0
1.0
2.0
3.0
4.0
197
0
197
5
198
0
1985
199
0
199
5
200
0
200
5
201
0
Morocco
0.0
1.0
2.0
3.0
4.0
197
0
197
5
198
0
198
5
199
0
199
5
200
0
200
5
2010
Mozambique

10
2.3. ODA TO AFRICA BY SECTOR
2.3.1. ODA to Africa by sector since 1996
As a percentage of total ODA to Africa, 3-year average commitments
0
5
10
15
20
25
30
35
40
45
1996
1997
1998
1999
2000
2001
2002
2003
2004
2005
2006
2007
2008
2009
2010
2011
2012
SOCIAL
ECONOMIC
PRODUCTION
HUMANITARIAN
MULTISECTOR
GENERALPROGRAMME AID
DEBT
OTHERS
%
2.3.2. ODA to 5 largest recipients in Africa by sector in 2013 As a percentage of total ODA committed for each country
36
49
42
15
40
39
13
16
17
14
8
11
16
7
9
4
6
10
21
6
11
9
5
39
1
2
1
6
1
11
10
21
1
1
3
0% 20% 40% 60% 80% 100%
Tanzania
Kenya
Ethiopia
Egypt
Democratic Republic of theCongo
SOCIAL ECONOMIC PRODUCTION
MULTISECTOR GENERAL PROGRAMME AID DEBT
HUMANITARIAN OTHERS
Democratic Republic of the Congo

11
2.3.3. ODA to Africa by donor and sector in 2013
Au
str
alia
Au
str
ia
Be
lgiu
m
Ca
na
da
Cze
ch R
epu
blic
De
nm
ark
Fin
land
Fra
nce
Ge
rma
ny
Gre
ece
Ice
land
Ire
land
Ita
ly
Ja
pa
n
Ko
rea
Luxe
mb
ou
rg
SOCIAL 33.1 42.6 46.3 42.2 62.6 43.6 38.9 30.8 46.1 86.8 63.2 52.5 63.7 37.5 57.3 54.7
Education 0.1 6.8 11.3 7.6 30.2 0.9 13.2 17.2 9.8 85.1 19.8 9.2 20.0 7.3 20.2 25.8
of which: Basic
education - 0.0 0.2 2.9 0.2 0.7 1.8 1.0 1.3 - 17.4 1.8 4.4 0.8 4.3 4.5
Health 0.1 9.2 14.6 23.1 7.8 2.4 2.0 1.0 3.2 1.7 16.6 19.6 18.7 7.8 12.2 12.9
of which: Basic health 0.0 0.2 8.4 21.2 7.2 1.9 0.6 0.6 2.0 - 16.6 9.2 6.4 6.9 1.4 6.6
Population and
reproductive health 7.3 0.1 1.3 2.2 2.8 0.1 0.2 2.3 3.1 - - 3.9 4.8 0.9 3.6 1.1
Water supply and
sanitation 17.1 12.1 4.9 1.7 11.5 13.5 1.1 5.0 15.7 - 6.4 1.6 3.3 17.4 9.9 5.7
Government and civil
society 7.7 10.1 10.0 6.8 6.4 26.6 19.2 2.2 12.1 - 2.2 11.6 8.7 3.0 10.9 6.1
Other social infrastr.
and services 0.9 4.4 4.2 0.7 3.9 0.0 3.2 3.2 2.2 - 18.1 6.5 8.3 1.2 0.4 3.0
ECONOMIC 0.1 24.2 5.6 5.3 - 39.4 13.7 27.6 22.0 - 8.4 0.7 2.7 23.7 32.8 5.9
Transport,
communications - 9.1 1.2 1.6 - 2.2 0.7 13.3 1.3 - - 0.1 1.5 21.0 32.1 0.2
Energy - 13.9 3.4 0.4 - 6.7 12.7 13.2 9.0 - 7.1 0.0 1.1 2.2 0.5 3.0
Banking, business
and other services 0.1 1.3 1.1 3.4 - 30.4 0.3 1.1 11.8 - 1.3 0.6 0.2 0.5 0.2 2.7
PRODUCTION 12.3 12.9 19.3 23.0 13.9 6.6 16.5 2.3 9.5 - 26.6 11.4 15.9 10.5 7.0 9.2
Agriculture, forestry
and fishing 9.6 10.9 17.8 17.4 13.7 4.8 9.6 1.9 7.5 - 26.6 11.2 14.5 6.3 5.5 9.1
Industry, mining and
construction 2.7 2.0 0.6 4.0 - 1.7 2.9 0.3 1.3 - - 0.2 1.5 3.8 0.9 0.1
Trade and tourism - - 0.9 1.5 0.2 0.1 4.0 0.0 0.7 - - 0.0 0.0 0.3 0.7 -
MULTISECTOR 35.3 9.1 8.3 4.7 0.1 0.4 1.9 16.5 12.2 13.2 0.5 3.5 5.3 1.9 1.8 4.5
GENERAL
PROGRAMME AID 6.6 3.4 - 3.5 - - 2.8 6.0 1.8 - - 12.7 5.0 7.0 - 1.1
DEBT - 4.9 1.6 - - - - 10.5 3.2 - - - - 8.2 - -
HUMANITARIAN 12.6 2.8 17.0 14.4 12.5 6.4 18.6 0.5 4.9 - 1.3 13.8 4.6 10.9 0.7 14.5
OTHERS - 0.1 1.9 6.9 11.0 3.6 7.6 5.9 0.2 - - 5.4 2.7 0.4 0.3 10.0
TOTAL 100 100 100 100 100 100 100 100 100 100 100 100 100 100 100 100
Food aid (emergency
and develop. aid) 9.5 2.2 9.2 9.2 - 0.0 4.2 0.6 1.5 - 0.3 7.1 1.3 6.3 - 3.1
As a percentage of total bilateral commitments

12
Ne
the
rla
nd
s
Ne
w Z
ea
land
No
rway
Po
land
Po
rtu
ga
l
Slo
vak R
epu
blic
Slo
ven
ia
Sp
ain
Sw
ede
n
Sw
itze
rlan
d
Un
ite
d K
ingd
om
Un
ite
d S
tate
s
To
tal
DA
C c
ou
ntr
ies
EU
in
stitu
tio
ns
Wo
rld
Ba
nk (
IDA
)
To
tal
mu
ltil
ate
rals
SOCIAL 48.7 35.6 42.1 7.8 45.4 61.7 90.1 22.4 49.8 34.8 53.6 63.3 47.9 31.6 43.9 43.4
Education 0.1 20.4 9.7 3.3 12.8 22.4 6.4 4.7 1.4 9.3 8.0 3.2 8.0 2.9 6.2 3.9
of which: Basic
education 0.0 - 2.3 0.1 0.0 3.1 - 0.6 0.0 3.9 3.7 2.9 2.0 0.5 1.5 0.7
Health 12.3 - 5.7 1.1 6.1 13.6 71.0 8.2 4.0 3.4 13.0 8.4 7.5 3.2 4.5 12.1
of which: Basic health 6.8 - 3.6 0.4 0.7 0.6 - 1.7 3.5 1.7 9.8 8.1 5.8 2.1 3.1 10.9
Population and
reproductive health 4.7 - 3.0 - 0.3 - - 1.2 4.7 1.9 13.3 38.2 13.2 0.3 0.2 6.1
Water supply and
sanitation 17.1 6.3 0.1 0.3 0.1 0.3 - 1.5 1.8 10.8 5.0 4.6 7.6 5.9 8.3 6.8
Government and civil
society 12.9 8.9 21.0 2.3 1.8 15.4 6.4 5.0 34.0 8.4 10.2 8.3 9.5 15.3 14.1 10.0
Other social infrastr.
and services 1.6 - 2.6 0.8 24.3 10.0 6.4 1.7 3.9 1.0 4.0 0.6 2.1 4.1 10.7 4.6
ECONOMIC 13.2 12.0 21.3 0.3 8.0 1.6 - 0.2 3.2 8.6 10.2 6.5 14.9 25.7 27.9 24.2
Transport,
communications 0.3 - 0.0 - 0.1 - - 0.1 0.1 3.5 3.5 0.7 5.2 13.2 12.4 12.8
Energy 4.0 1.2 16.1 0.0 7.8 1.6 - 0.1 2.6 0.0 4.6 3.4 5.8 10.2 10.2 8.9
Banking, business
and other services 8.8 10.8 5.2 0.3 0.1 - - 0.0 0.6 5.1 2.1 2.5 3.9 2.2 5.3 2.4
PRODUCTION 18.2 43.3 19.8 0.2 0.2 32.2 - 7.2 5.2 13.4 9.1 6.0 9.0 13.6 19.6 12.7
Agriculture, forestry
and fishing 15.5 43.3 17.4 0.2 0.2 32.2 - 7.0 3.6 10.8 3.8 4.7 6.9 8.9 14.9 9.4
Industry, mining and
construction 0.0 - 1.9 - 0.0 - - 0.1 0.3 0.9 3.1 0.2 1.3 2.4 3.5 2.3
Trade and tourism 2.7 - 0.4 - 0.0 - - 0.1 1.4 1.7 2.2 1.1 0.9 2.3 1.2 1.1
MULTISECTOR 16.3 3.8 2.9 0.2 1.0 2.2 6.4 0.9 11.3 15.1 5.4 3.1 7.5 7.5 6.0 7.5
GENERAL
PROGRAMME AID 1.6 - 4.5 - 44.8 - - 1.3 12.8 10.2 1.6 1.1 3.8 11.9 0.3 7.3
DEBT - - - - - - - 62.4 - - 0.2 1.9 3.9 - 0.0 0.5
HUMANITARIAN 2.0 1.9 9.2 0.8 0.0 2.2 3.5 1.0 15.5 11.2 17.0 17.7 10.7 9.6 2.3 4.3
OTHERS 0.0 3.4 0.2 90.8 0.6 - - 4.7 2.1 6.6 2.9 0.4 2.2 0.1 - 0.1
TOTAL 100 100 100 100 100 100 100 100 100 100 100 100 100 100 100 100
Food aid (emergency
and develop. aid) 1.6 1.9 1.7 0.7 0.0 - 3.2 1.8 0.7 3.6 4.6 5.5 3.8 4.6 0.3 1.7
Percentage of
multilateral finance As a percentage of total bilateral commitments

13
2.3.4. Analysis of social sector ODA to Africa by donor
As a percentage of total sector-allocable commitments for each donor in 2013
0
10
20
30
40
50
60
70
80
90
100
Education Health Population Programmes Water Supply & Sanitation Government & Civil Society Other Social%
2.3.5. Analysis of social sector ODA to Africa since 1996 As a percentage of total sector-allocable ODA, 3-year average commitments
0
5
10
15
20
25
1996
1997
1998
1999
2000
2001
2002
2003
2004
2005
2006
2007
2008
2009
2010
2011
2012
PopulationProgrammes
Government & CivilSociety
Health
Education
Water Supply &Sanitation
Other Social
%

14
2.3.6. Analysis of economic and production sector ODA to Africa by donor
As a percentage of total sector-allocable commitments for each donor in 2013
0
10
20
30
40
50
60
70
80
90
100
Transport / Communications Energy Banking / Business Services Agriculture / Forestry / Fishing Industry / Mining / Construction Trade / Tourism
%
2.3.7. Analysis of economic and production sector ODA to Africa since 1996 As a percentage of total sector-allocable ODA, 3-year average commitments
0
5
10
15
20
25
1996
1997
1998
1999
2000
2001
2002
2003
2004
2005
2006
2007
2008
2009
2010
2011
2012
Transport /Communications
Energy
Agriculture / Forestry /Fishing
Banking / Businessservices
Industry / Mining /Construction
Trade / Tourism
%%

15
2.3.8. ODA to Africa by sector and recipient in 2013
USD million, commitments
SOCIAL ECONOMIC PRODUCTIONMULTI-
SECTOR
GEN.PROG.
AIDDEBT
HUMANI-
TARIANOTHERS TOTAL
Algeria 204 7 310 5 - - 28 20 575
Angola 285 5 61 29 10 - 9 47 446
Benin 382 84 34 97 34 1 1 13 645
Botswana 98 2 2 8 - 0 0 0 111
Burkina Faso 477 311 138 41 126 1 31 16 1 141
Burundi 262 174 97 17 33 0 25 3 612
Cabo Verde 274 38 3 21 59 0 0 5 400
Cameroon 461 166 82 54 8 81 8 9 869
Central African Republic 83 7 0 18 3 0 129 1 242
Chad 158 21 35 35 12 1 172 9 442
Comoros 44 49 1 7 15 5 0 4 125
Congo 66 18 3 5 3 21 3 2 121
Côte d'Ivoire 419 80 96 45 197 693 43 9 1 583
Democratic Republic of the Congo 882 305 196 129 25 141 449 57 2 184
Djibouti 124 75 19 17 27 0 62 9 332
Egypt 1 122 1 274 569 1 568 3 000 63 21 12 7 629
Equatorial Guinea 6 4 0 1 - 0 0 3 13
Eritrea 14 0 6 3 0 - 9 4 35
Ethiopia 1 320 503 515 300 154 1 324 21 3 138
Gabon 36 0 2 16 - 3 0 2 60
Gambia 64 51 7 11 11 0 0 2 146
Ghana 792 157 103 121 18 9 4 6 1 211
Guinea 311 164 36 37 28 176 10 26 788
Guinea-Bissau 55 2 15 6 2 11 1 1 92
Kenya 1 465 392 334 167 263 1 322 31 2 975
Lesotho 129 16 10 15 23 0 3 3 199
Liberia 233 362 71 22 49 1 55 2 794
Libya 154 15 5 1 - - 9 3 187
Madagascar 204 169 103 39 10 43 18 5 592
Malawi 705 364 192 40 69 9 76 13 1 468
Mali 1 096 154 308 86 443 3 333 33 2 456
Mauritania 289 211 74 27 39 6 35 15 697
Mauritius 24 149 19 3 69 - 1 2 267
Morocco 1 254 961 337 232 124 - 3 16 2 927
Mozambique 1 356 675 336 130 189 34 28 18 2 766
Namibia 210 20 22 77 - - 5 3 337
Niger 428 145 70 79 168 0 161 18 1 071
Nigeria 1 927 378 305 191 6 - 12 20 2 838
Rwanda 733 325 132 171 3 1 37 9 1 411
Saint Helena 29 20 1 0 - - - 1 52
Sao Tome and Principe 29 10 2 10 4 0 0 1 55
Senegal 549 93 265 144 134 1 33 19 1 239
Seychelles 40 - 4 9 - - 0 0 53
Sierra Leone 228 230 25 16 46 29 29 4 607
Somalia 348 74 31 32 6 0 336 15 840
South Africa 1 011 309 41 459 3 - 6 10 1 840
South Sudan 900 153 133 53 113 - 581 4 1 936
Sudan 323 292 158 26 4 0 465 18 1 286
Swaziland 73 0 5 2 - - 1 0 81
Tanzania 1 226 1 307 257 123 360 73 25 19 3 390
Togo 129 87 13 40 31 0 1 3 305
Tunisia 465 612 120 96 149 - 5 15 1 463
Uganda 1 038 258 239 286 1 - 64 7 1 894
Zambia 1 160 127 120 23 - - 10 9 1 449
Zimbabwe 331 12 44 26 9 - 91 5 519
North of Sahara, regional 80 25 7 75 7 - 50 2 245
South of Sahara, regional 1 151 369 792 423 21 - 473 78 3 308
Africa, regional 651 550 397 229 79 - 34 57 1 997
Africa total 27 908 12 365 7 302 5 943 6 186 1 409 4 629 743 66 485

16
Education 2.3.9. Total ODA to education
USD billion, 2012 prices and exchange rates, commitments with 3 year moving averages (dotted lines)
2.3.10. Top 10 recipients 2013commitments,
USD millionEgypt Morocco Ethiopia Nigeria Uganda Senegal Algeria
Mozambi
queTunisia Rwanda Others
Total
France 13 157 5 3 0 66 123 1 72 4 316 762
IDA - - 130 150 - 20 - - - - 165 465
Germany 45 27 7 9 2 1 2 42 26 21 217 399
United Arab Emirates 370 - - - - - - - - - - 370
United States 14 6 20 3 12 11 - 4 - 14 205 288
EU Institutions - 133 - - - - - - 13 - 97 243
Japan 7 93 5 2 3 5 0 12 1 3 82 214
United Kingdom 6 2 21 7 11 1 2 1 2 10 117 181
AfDF (African Dev.Fund) - - - - 102 32 - - - - 46 180
Norway 0 - 20 - 36 0 0 2 - - 87 146
Other donors 13 24 75 31 25 35 3 58 2 64 435 764
Total 469 442 284 206 190 171 130 120 116 116 1 765 4 011
2010 2011 2012 2013
Australia 183 1 - 0
Austria 10 7 11 10
Belgium 59 100 72 70
Canada 174 93 150 106
Czech Republic - 1 2 2
Denmark 21 35 38 6
Finland 27 49 13 38
France 1 242 792 758 762
Germany 407 402 482 399
Greece 14 10 8 2
Iceland - 1 1 3
Ireland 47 44 31 32
Italy 31 30 22 32
Japan 174 220 257 214
Korea 94 52 30 118
Luxembourg 23 20 27 32
Netherlands 106 48 37 1
New Zealand 3 2 1 2
Norway 63 62 65 146
Poland - - - 1
Portugal 46 35 34 34
Slovak Republic - - - 1
Slovenia 0 0 0 0
Spain 146 64 41 18
Sweden 13 3 3 14
Switzerland 17 32 39 80
United Kingdom 111 193 278 181
United States 359 268 360 288
DAC countries 3 370 2 564 2 762 2 592
EU Institutions 149 199 254 243
Related Millenium Development Goals
"Achieve universal primary education (Goal 2)"
"Ensure that, by 2015, children everywhere, boys and girls alike, will be
able to complete a full course of primary schooling"
(Target 3)
USD million
To
p 1
0 d
on
ors
2013
2.3.11. ODA to education by subsector 2013
USD million, commitments
2.3.12. ODA commitments to education
0
2
4
6
8
2000 2001 2002 2003 2004 2005 2006 2007 2008 2009 2010 2011 2012 2013
Bilateral ODA
Multilateral ODA
1 361
827
520
1 302
Education policytraining / research
Basic education
Secondary education
Post-secondaryeducation

17
Health
2.3.13. Total ODA to health USD billion, 2012 prices and exchange rates, commitments with 3 year moving averages (dotted lines)
2.3.14. Top 10 recipients 2013commitments,
USD million Nigeria Tanzania
South
Africa Kenya Ethiopia
Mozambi
que Zambia Uganda Malawi Rwanda Others Total
United States 401 400 481 478 271 345 267 389 144 90 955 4 220
Global Fund 449 273 315 36 108 90 189 - 58 171 1 122 2 810
GAVI 149 48 - 40 108 28 18 31 18 22 414 876
United Kingdom 29 4 6 186 17 9 29 30 67 2 215 595
Canada 33 19 0 2 20 17 1 4 6 - 249 351
IDA - 8 - 41 100 37 - - - - 163 349
EU Institutions - - - - 54 5 32 - - 40 168 299
Germany 43 31 25 9 3 0 1 2 37 1 105 258
Japan 6 5 1 13 12 3 28 30 3 0 151 253
Netherlands - - - - 10 7 - - - 18 143 178
Other donors 44 52 13 35 70 78 38 65 73 43 967 1 476
Total 1 154 841 841 839 773 621 604 550 406 386 4 652 11 665
2010 2011 2012 2013
Australia 6 15 40 23
Austria 7 6 5 13
Belgium 144 119 64 99
Canada 217 848 374 351
Czech Republic - 1 0 1
Denmark 33 110 158 15
Finland 11 5 10 6
France 187 86 101 143
Germany 159 173 190 258
Greece 1 0 - 0
Iceland - 1 2 3
Ireland 84 81 70 83
Italy 58 56 32 38
Japan 181 125 195 253
Korea 45 17 103 93
Luxembourg 16 17 17 18
Netherlands 54 27 331 178
New Zealand 1 1 0 -
Norway 83 58 123 130
Poland - - - 1
Portugal 12 17 14 17
Slovak Republic - - - 0
Slovenia 0 0 1 1
Spain 106 62 39 36
Sweden 114 76 169 89
Switzerland 58 30 64 45
United Kingdom 175 184 333 595
United States 4 087 4 458 3 326 4 220
DAC countries 5 839 6 574 5 762 6 708
EU Institutions 381 227 513 299
"Combat HIV/AIDS, malaria and other diseases" (Goal 6)
To
p 1
0 d
on
ors
20
13
USD million, commitments
2.3.16. ODA commitments to health2.3.15. ODA to health by subsector 2013
USD million
"Improve maternal health" (Goal 5)
Related Millenium Development Goals
"Reduce child mortality" (Goal 4)
0
2
4
6
8
2000 2001 2002 2003 2004 2005 2006 2007 2008 2009 2010 2011 2012 2013
Bilateral ODA
Multilateral ODA
963
4 791
5 910
Health, general
Basic health
Population policiesincl. HIV/AIDScontrol
18
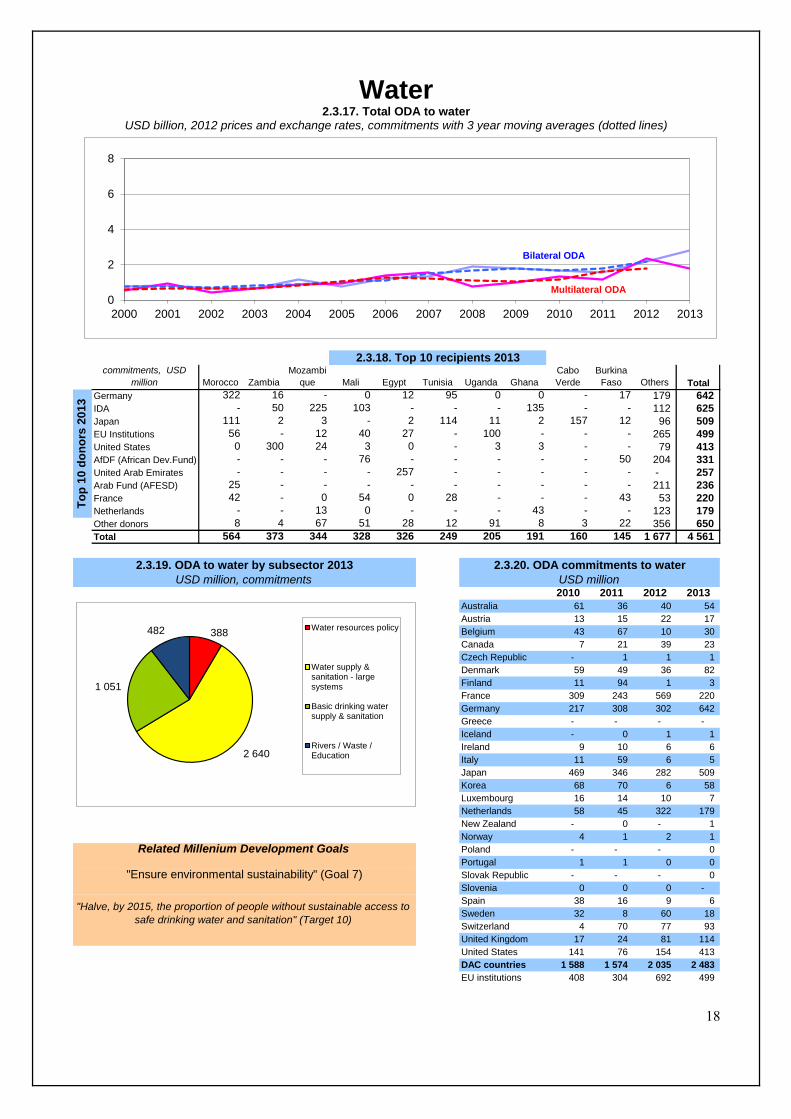
Water
2.3.17. Total ODA to water USD billion, 2012 prices and exchange rates, commitments with 3 year moving averages (dotted lines)
2.3.18. Top 10 recipients 2013commitments, USD
million Morocco Zambia
Mozambi
que Mali Egypt Tunisia Uganda Ghana
Cabo
Verde
Burkina
Faso Others Total
Germany 322 16 - 0 12 95 0 0 - 17 179 642
IDA - 50 225 103 - - - 135 - - 112 625
Japan 111 2 3 - 2 114 11 2 157 12 96 509
EU Institutions 56 - 12 40 27 - 100 - - - 265 499
United States 0 300 24 3 0 - 3 3 - - 79 413
AfDF (African Dev.Fund) - - - 76 - - - - - 50 204 331
United Arab Emirates - - - - 257 - - - - - - 257
Arab Fund (AFESD) 25 - - - - - - - - - 211 236
France 42 - 0 54 0 28 - - - 43 53 220
Netherlands - - 13 0 - - - 43 - - 123 179
Other donors 8 4 67 51 28 12 91 8 3 22 356 650
Total 564 373 344 328 326 249 205 191 160 145 1 677 4 561
2010 2011 2012 2013
Australia 61 36 40 54
Austria 13 15 22 17
Belgium 43 67 10 30
Canada 7 21 39 23
Czech Republic - 1 1 1
Denmark 59 49 36 82
Finland 11 94 1 3
France 309 243 569 220
Germany 217 308 302 642
Greece - - - -
Iceland - 0 1 1
Ireland 9 10 6 6
Italy 11 59 6 5
Japan 469 346 282 509
Korea 68 70 6 58
Luxembourg 16 14 10 7
Netherlands 58 45 322 179
New Zealand - 0 - 1
Norway 4 1 2 1
Poland - - - 0
Portugal 1 1 0 0
Slovak Republic - - - 0
Slovenia 0 0 0 -
Spain 38 16 9 6
Sweden 32 8 60 18
Switzerland 4 70 77 93
United Kingdom 17 24 81 114
United States 141 76 154 413
DAC countries 1 588 1 574 2 035 2 483
EU institutions 408 304 692 499
2.3.19. ODA to water by subsector 2013
USD million, commitments
2.3.20. ODA commitments to water
USD million
"Halve, by 2015, the proportion of people without sustainable access to
safe drinking water and sanitation" (Target 10)
To
p 1
0 d
on
ors
20
13
Related Millenium Development Goals
"Ensure environmental sustainability" (Goal 7)
0
2
4
6
8
2000 2001 2002 2003 2004 2005 2006 2007 2008 2009 2010 2011 2012 2013
Bilateral ODA
Multilateral ODA
388
2 640
1 051
482 Water resources policy
Water supply &sanitation - largesystems
Basic drinking watersupply & sanitation
Rivers / Waste /Education